I. Abouelfettouh, T. Sanchez, K. Kawabe, M. Todd, R. Short
Ibrahim kicked off the locking attempts this morning after an initial alignment. It sounds like one lockloss was during PREP_ASC due to SRM alignment running away (before the "human servo" was implemented), and another was simply due to cleaning activities near HAM1/2. More details in his shift summary.
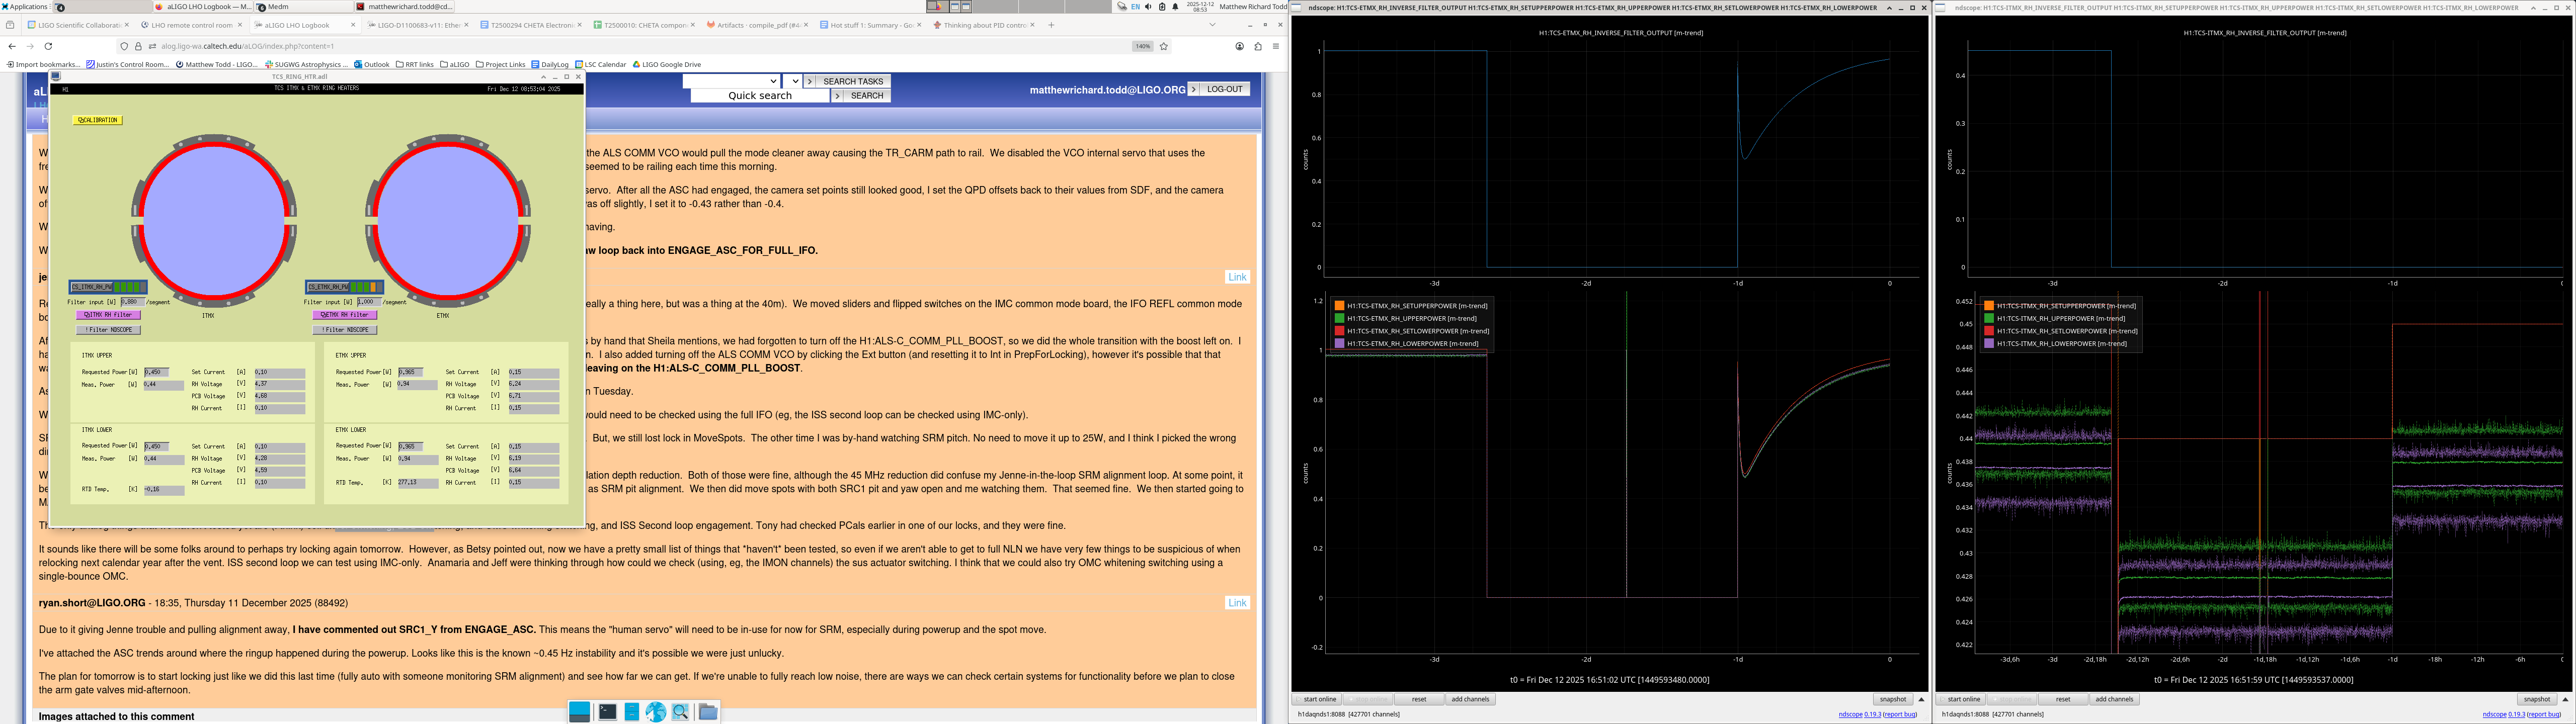
Matt set the X-arm ring heaters back to their nominal settings after having used inverse filters yesterday; see alog88494.
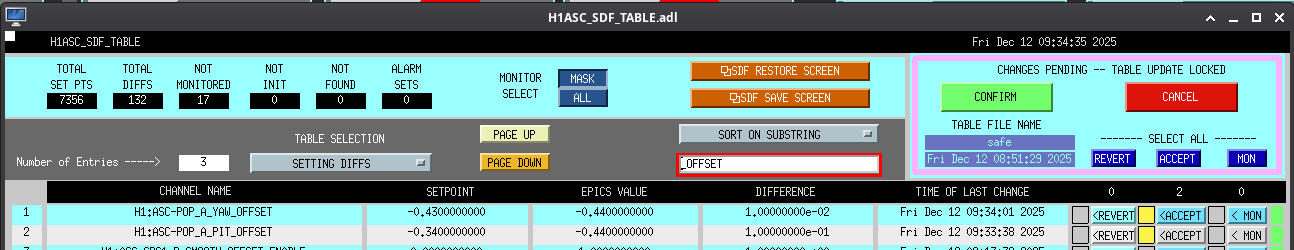
While relocking, we noticed that PRC1_P seemed to be pulling alignment in the wrong direction after engaging DRMI ASC, so I turned it off and aligned PRM by-hand. During ENGAGE_ASC, I noticed ADS PIT3 was taking a long time to converge, so after all ASC and soft loops had finished, I checked the POP_A offsets, and they indeed needed updating. Pitch was a bit different, so this explains why PRC1_P was misbehaving. I've accepted these in SDF, see screenshot. During this whole relocking stretch, Ibrahim had been keeping SRM well aligned as SRC1 ASC is still disabled, but that proved too difficult during MOVE_SPOTS and we lost lock.
On the next attempt, we were able to get all the way to 25W automatically (with Ibrahim again acting as the human SRC1 servo). Instead trying to keep up with the spot move, we jumped to LOWNOISE_COIL_DRIVERS, where I watched the coil driver states successfully change for all optics (PRM, PR2, SRM, SR2, BS, ETMY, ETMX, ITMY, and ITMX). Then, we were able to simply return ISC_LOCK to auto and request LOWNOISE_ESD_ETMX, which exercised the lownoise ESD transitions for both ETMs. This worked without issue. We then planned to test OMC whitening, so we jumped to the OMC_WHITENING state where Tony and Ibrahim began damping violin modes, which were very rung up. Before the violins were able to damp low enough to turn on OMC whitening, we decided rather than waiting, we should try the REFL B transition done in LASER_NOISE_SUPPRESSION first. We turned off violin damping, I commented out the step of engaging the ISS secondloop in LASER_NOISE_SUPPRESSION (we would test this later, but couldn't at this point since we only has 25W of input power), and jumped down to LASER_NOISE_SUPPRESSION. The state ran without issue until the very end when the IMC REFL servo fast gain is stepped up as the IMC REFL input gains are stepped down, which is the last step of the state and only there to potentially survive earthquakes better, and caused a lockloss.
The final locking attempt of the day began the same as the one before, with 25W being achieved automatically, jumping to LOWNOISE_COIL_DRIVERS, going through the lownoise ESD states, and jumping up to OMC_WHITENING. Contrary to before, we waited here while damping violins until the OMC whitening was turned on. I'd argue Guardian turned this on a bit prematurely as the OMC DCPDs immediately saturated, but the IFO did not lose lock. Violin modes damped quickly and soon the saturation warnings subsided. Our plan after confirming the OMC whitening was working was to try LASER_NOISE_SUPPRESSION again, but after talking through it and looking at Guardian code with Keita, we decided we should use some different gain settings to compensate for the fact we were again only at 25W. We eventually decided on the figure of 8 dB more gain was needed on the input to the IMC and LSC REFL common mode boards, which Guardian adjusts during this state. I started going through the steps of LASER_NOISE_SUPPRESSION by-hand, but raising the IMC REFL servo IN1 gain to 17 dB instead of 9 dB and the LSC REFL servo IN1 and IN2 gains to 14 db instead of 6 dB. I didn't get all the way to 14 dB for LSC REFL as we started hearing test mass saturation warnings, so I stopped at 10 dB instead. The last step of the state is to lower each of the IMC REFL input gains as you increase the IMC REFL fast gain, but on the fourth iteration of the step, we lost lock. It's possible the fast gain should have been scaled also due to the lower input power, but at least this was confirmed to be the problem step as it's the same place we lost lock on the previous attempt.
After this last lockloss, we tested functionality of the ISS secondloop by ensuring PRM was misaligned, raising the input power to 62W, and using the IMC_LOCK Guardian to close the secondloop. This worked without issue and everything was returned to normal.
Even though we were not able to fully recover H1 to low noise today, overall we believe we have confirmed the functionality of the main systems in question following the power outage last week and various CDS/Beckhoff changes this week. Arm gate valves are now closed in preparation for the HAM1 vent on Monday, and we plan to see H1 again in its full glory roughly mid-February 2026.