jeffrey.kissel@LIGO.ORG - posted 16:42, Thursday 11 December 2025 - last comment - 17:20, Thursday 11 December 2025(88486)
Allegedly Stuck SRM M3 UL Low-pass Binary IO Switch
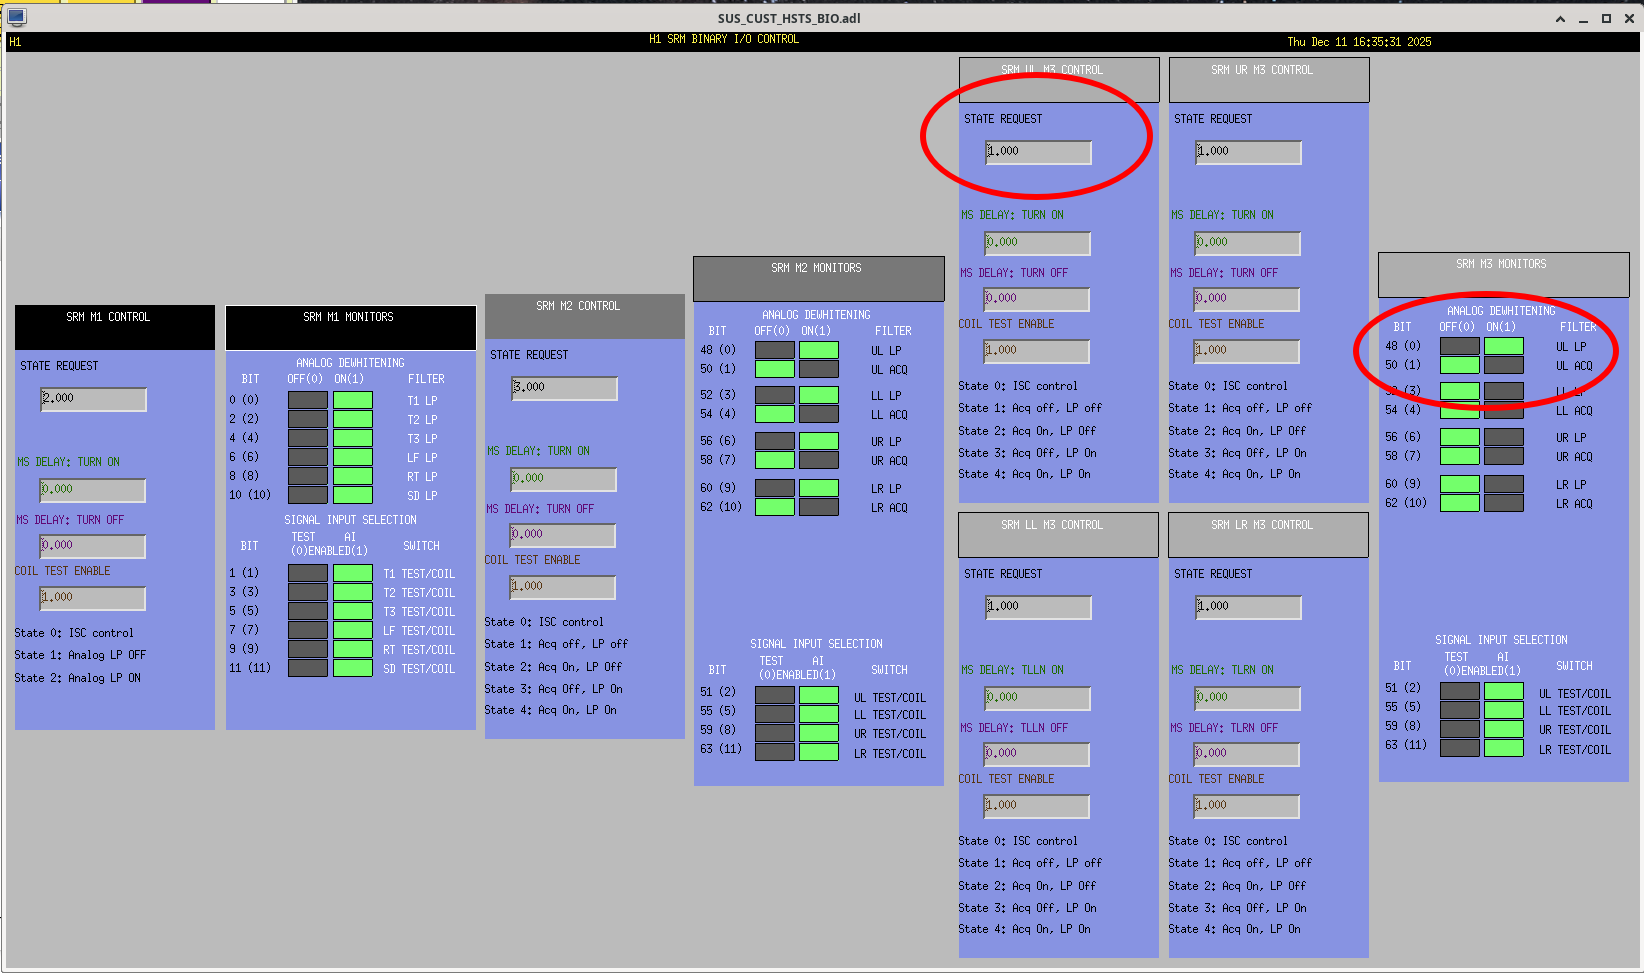
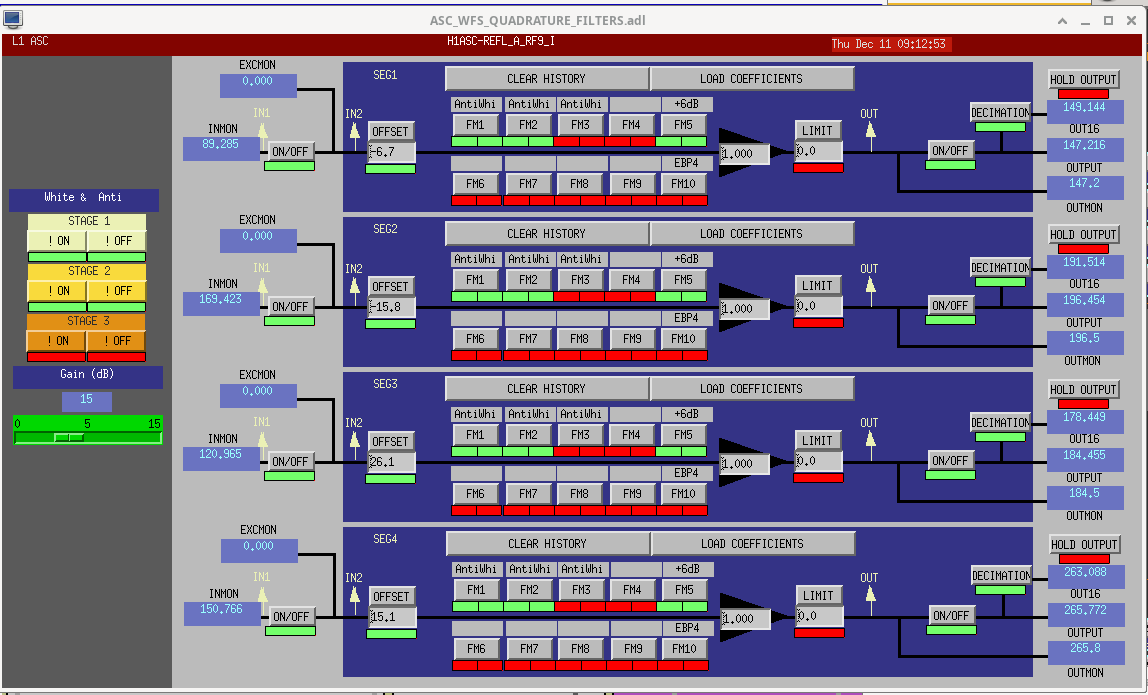
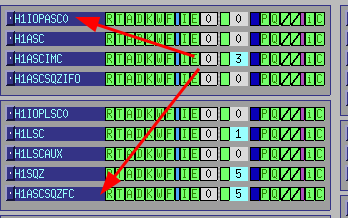
J. Kissel, J. Driggers, A. Effler

Trying to figure out why SRC1 loop, which is the fast AS_A_RF72 loop that drives controls SRM is being finicky, I pulled open the H1 SUS SRM coil driver binary IO state request screen (see attached) and found that the UL low pass (LP) bit on the M3 stage stage is allegedly stuck -- it doesn't change when I go from state 1 (LP OFF, ACQ OFF), to state 3 (LP ON, ACQ OFF). The rest of the coils on the M3 stage change when receiving the same request.

I say "allegedly" because it can be either the actual switch is stuck (the BO chassis) or the readback has failed / is stuck (the BI chassis).

To be investigated...
Images attached to this report
Comments related to this report
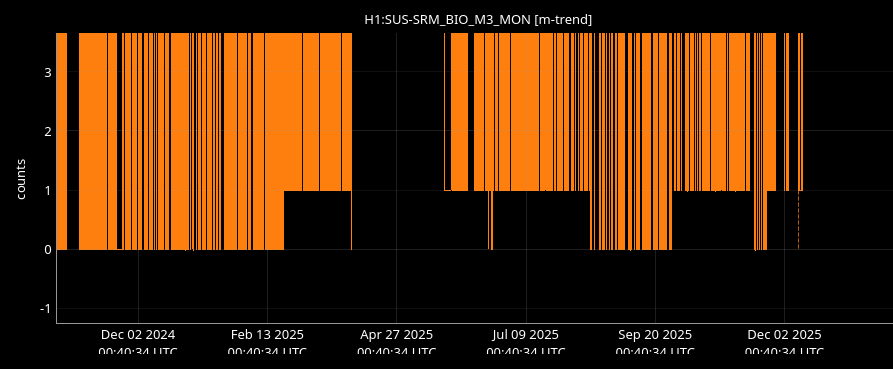
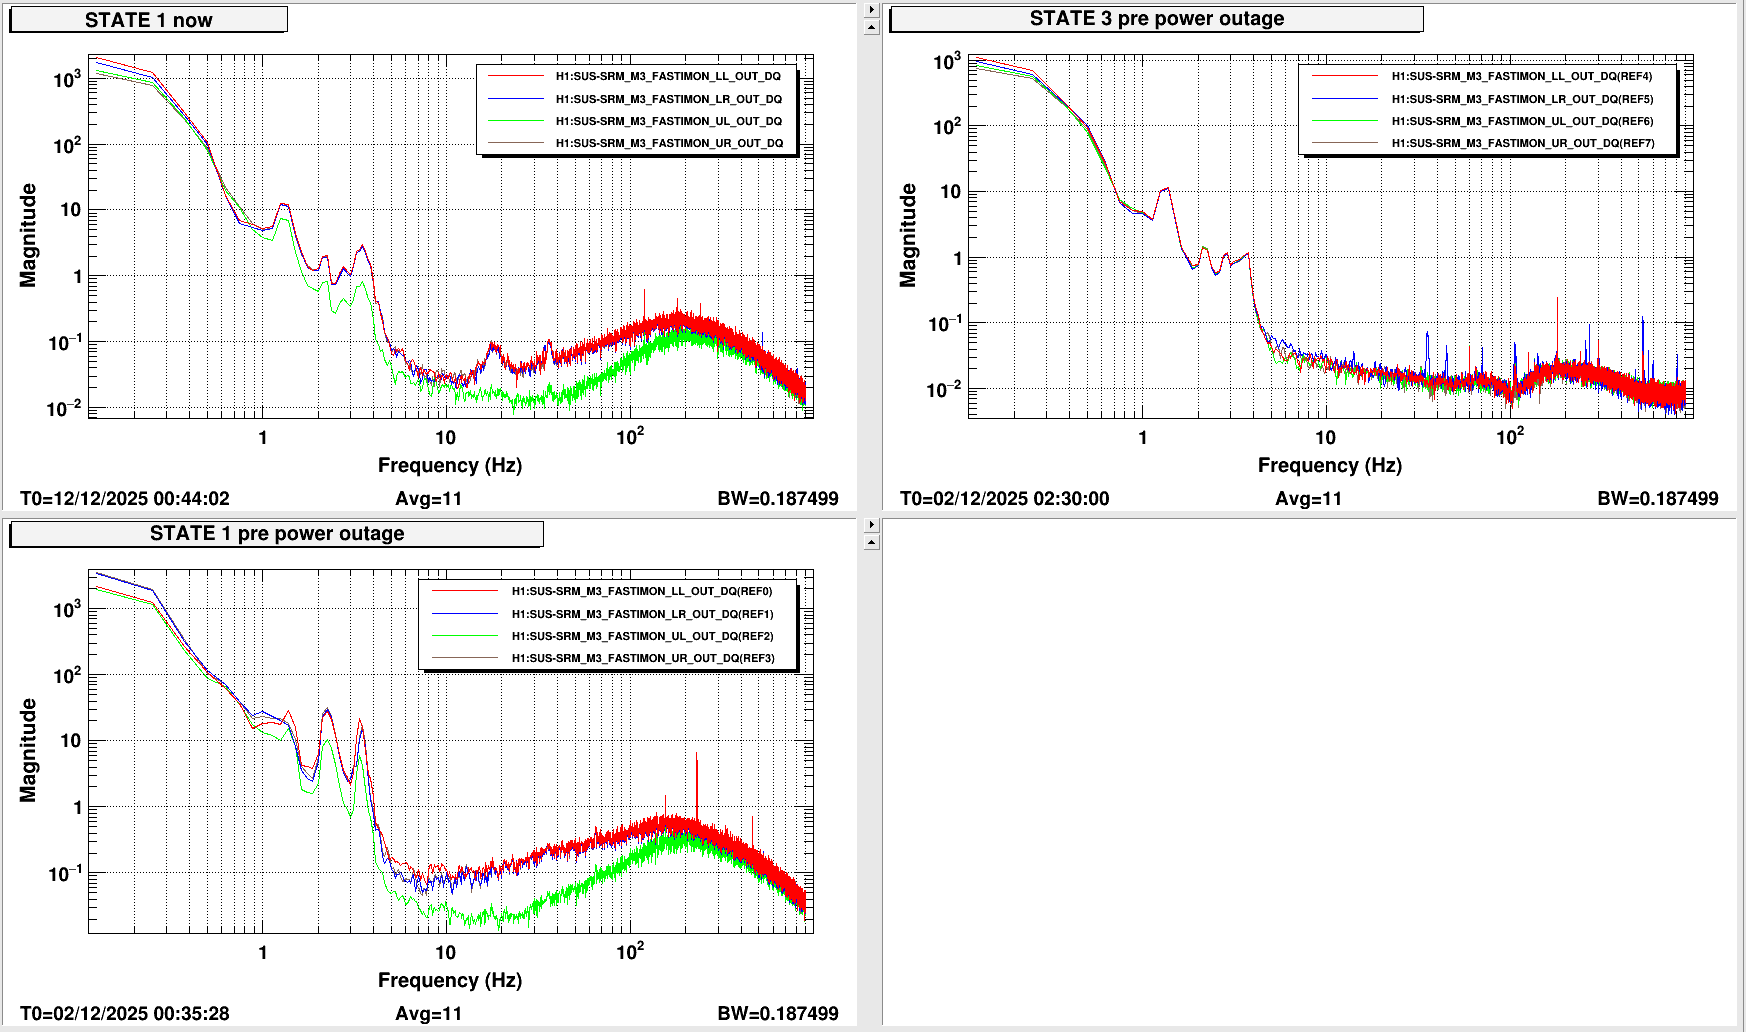
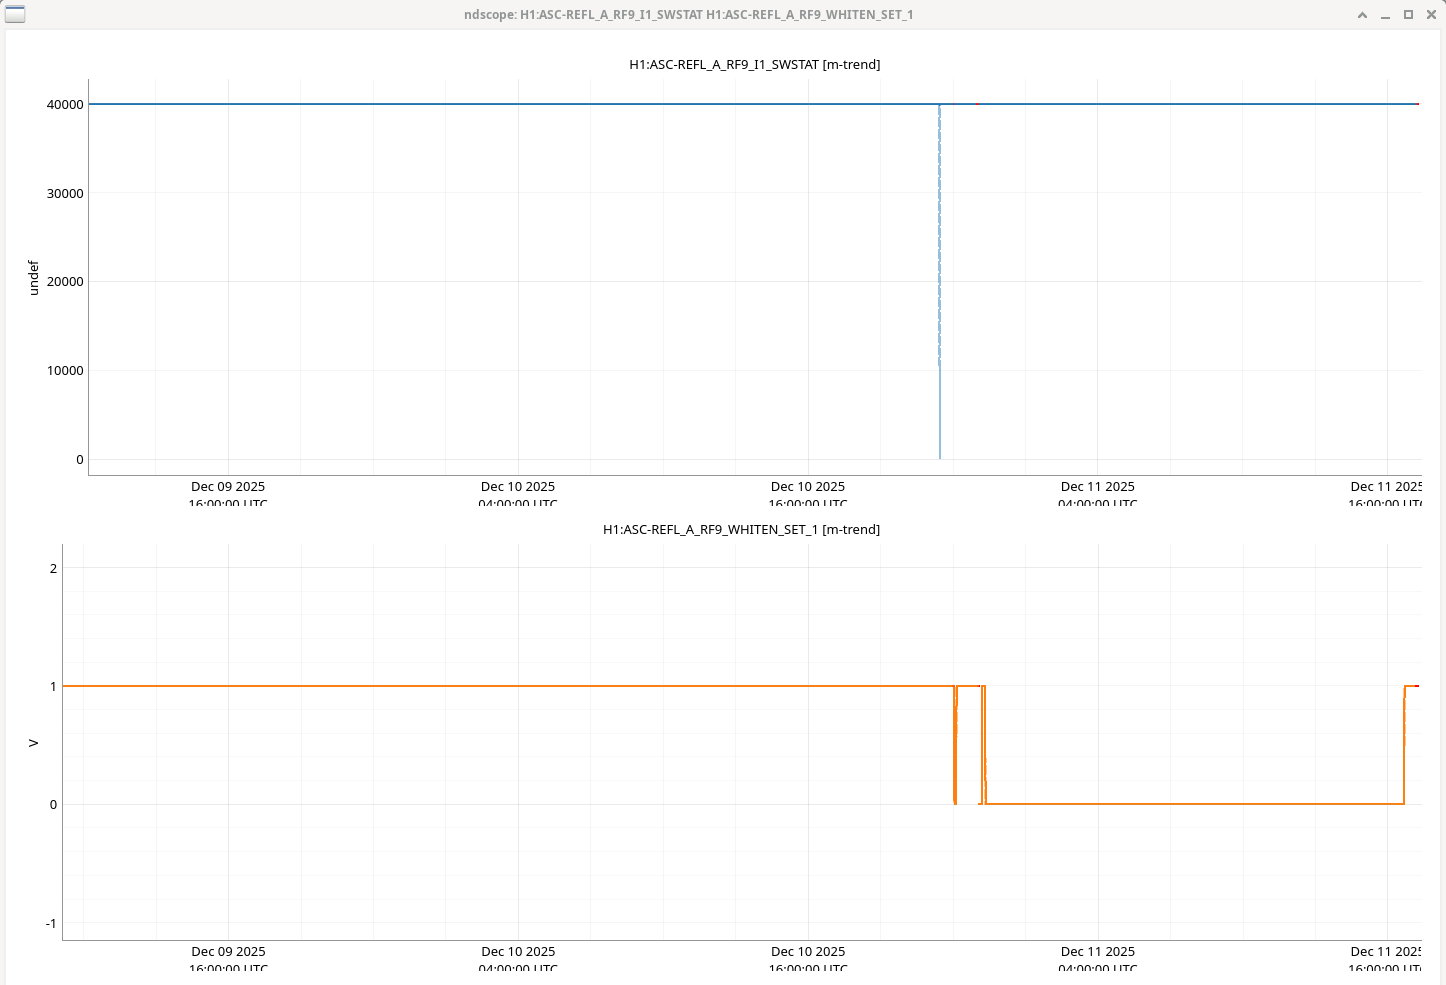
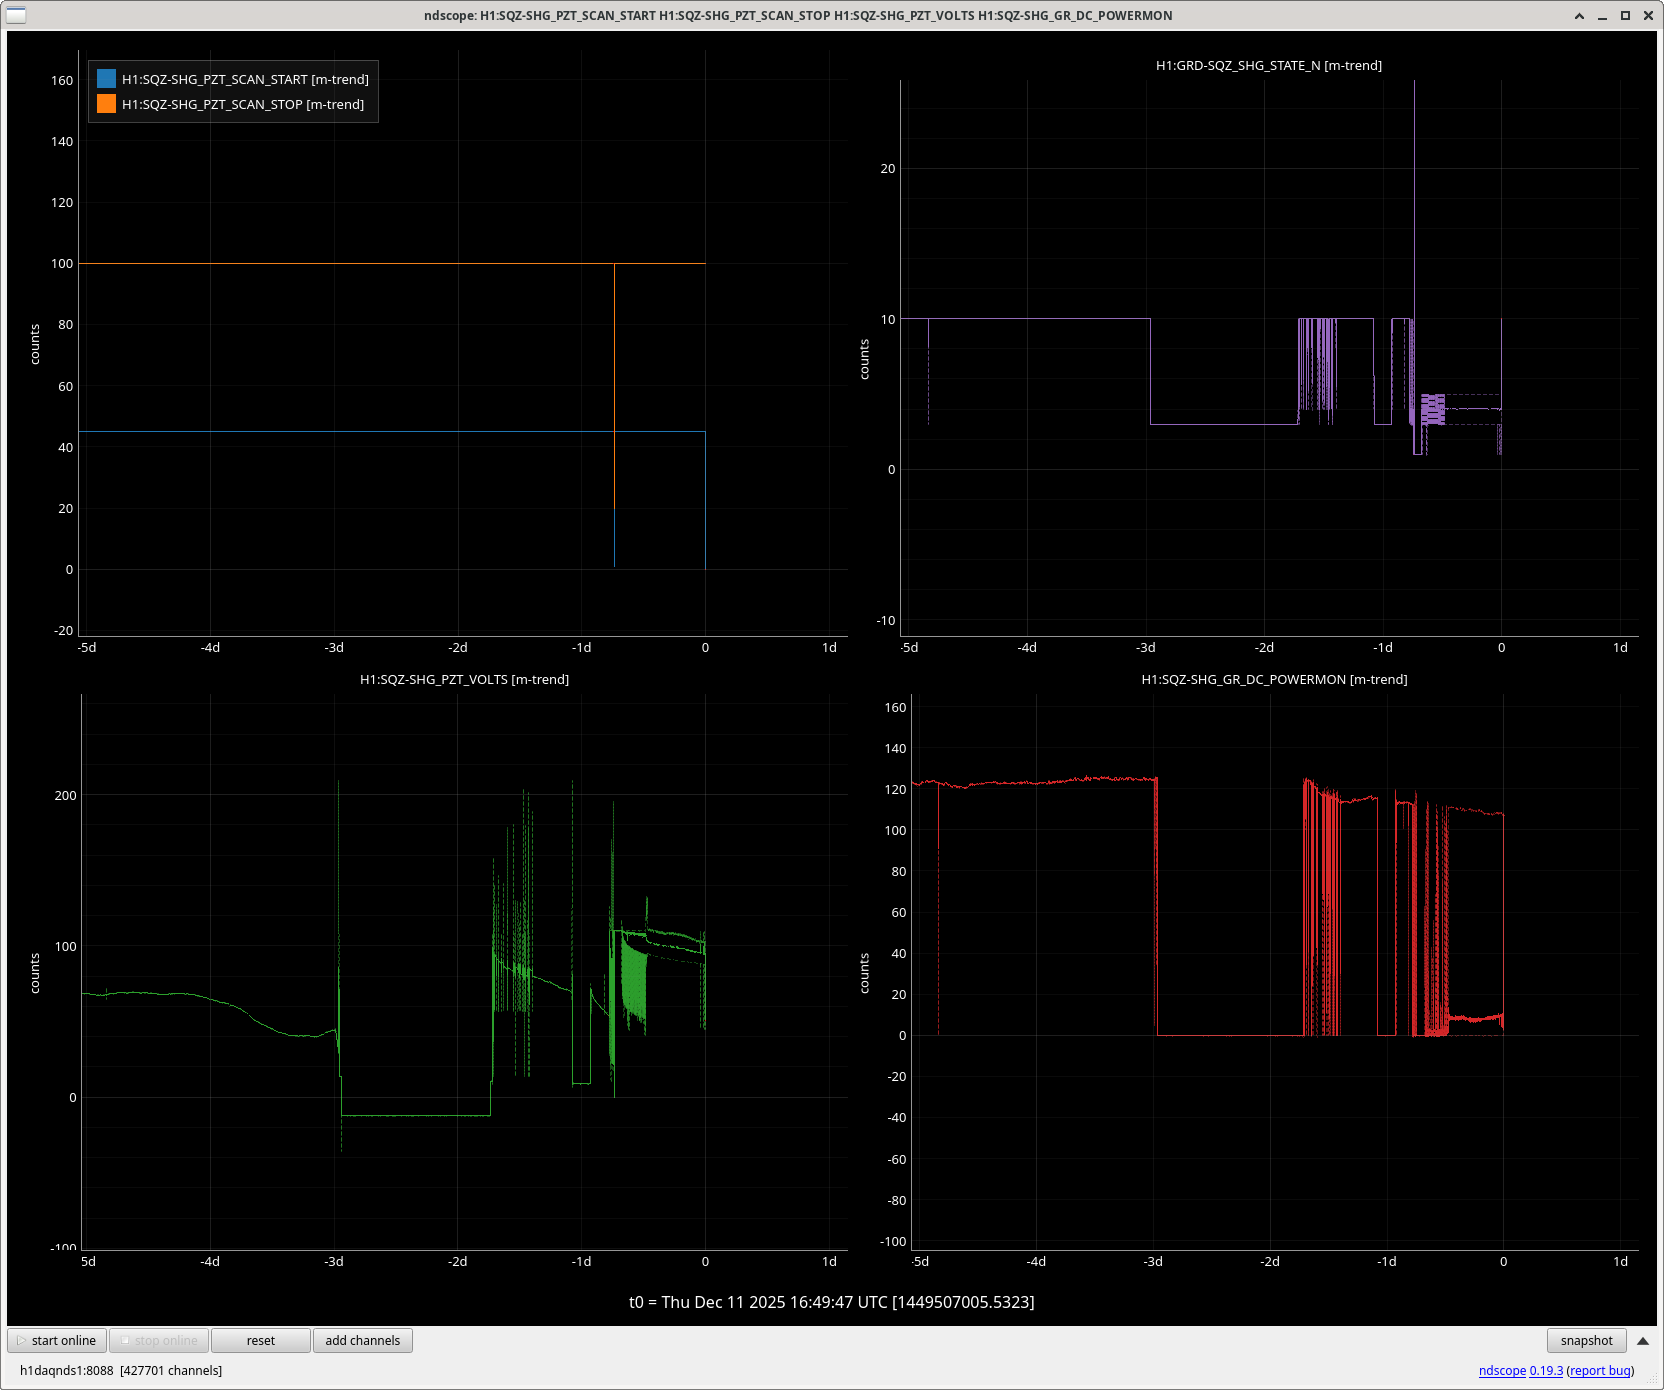
Seems this bit has been stuck on and off since Feb 21 (for state 1 of M3 0 is good and 1 is bad in the attached ndscope). Also attached I put the spectra of the FASTIMONs which are after the analog switches. The state 1 spectra look the same as before, and the state 3 spectra looked the same anyway, so more likely that the readback has gone bad.
I further checked that PRM/PR2/BS/ITMX/ITMY do the correct BIO switching from high noise to low noise, according to their readbacks. I have not double checked the spectra.
Images attached to this comment


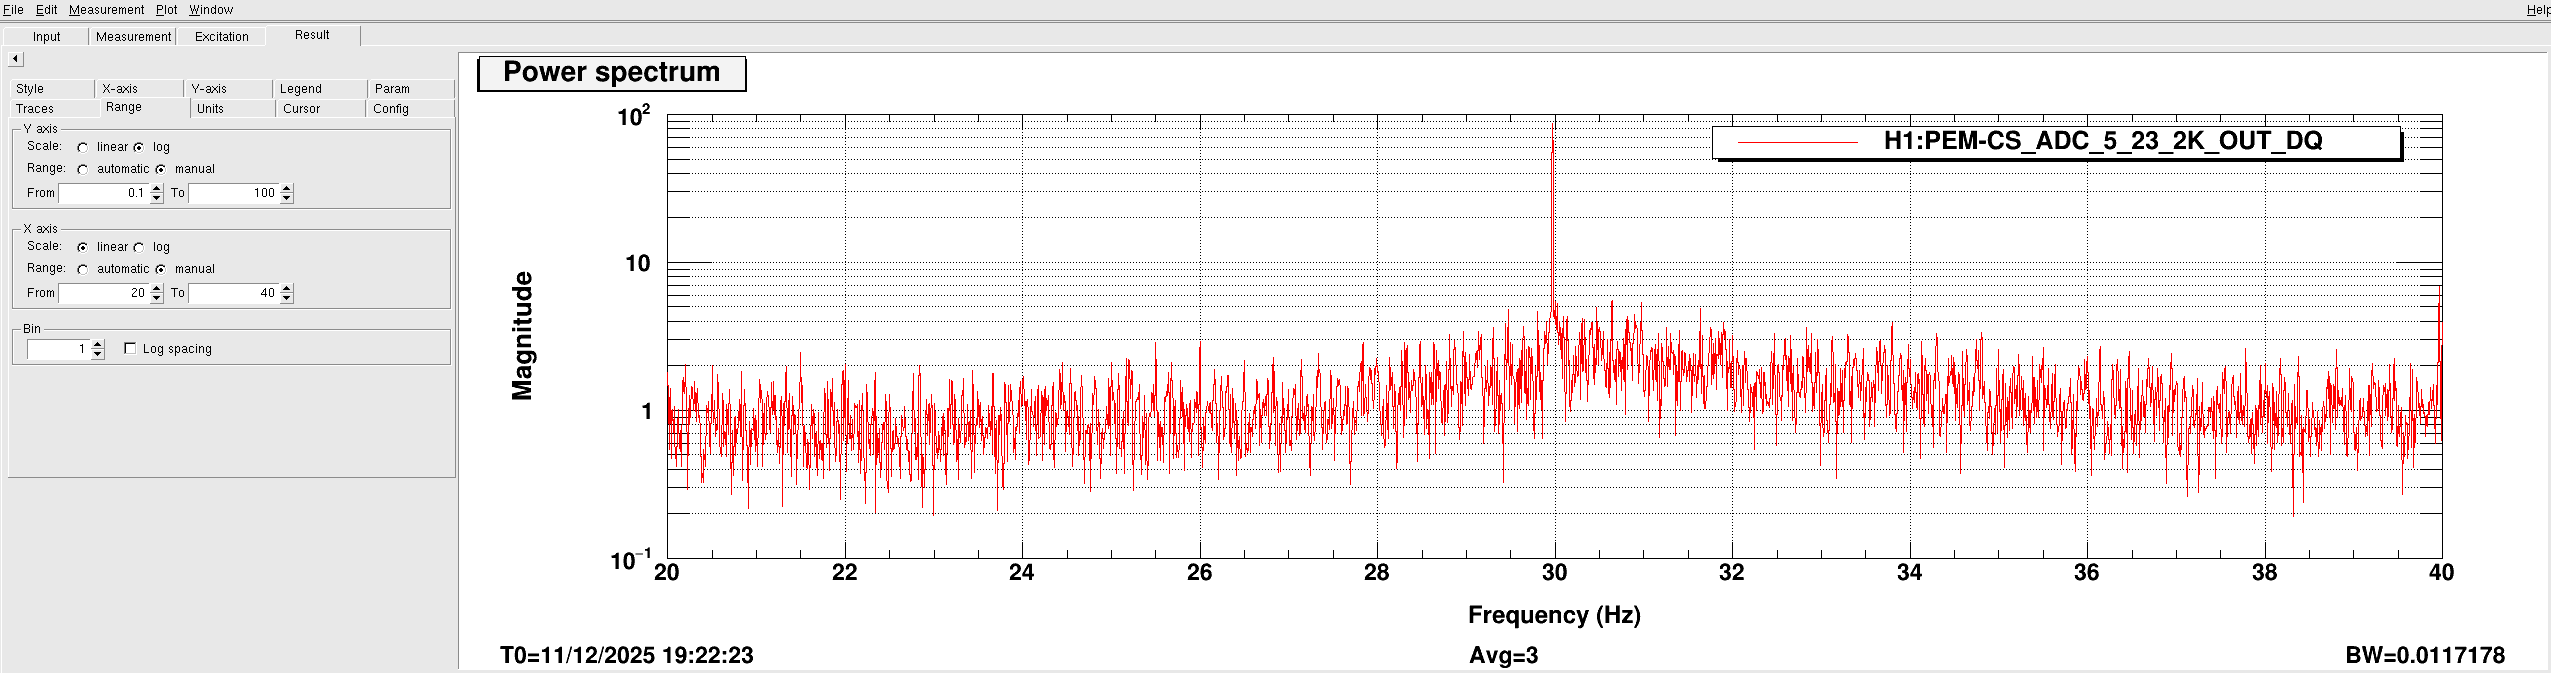
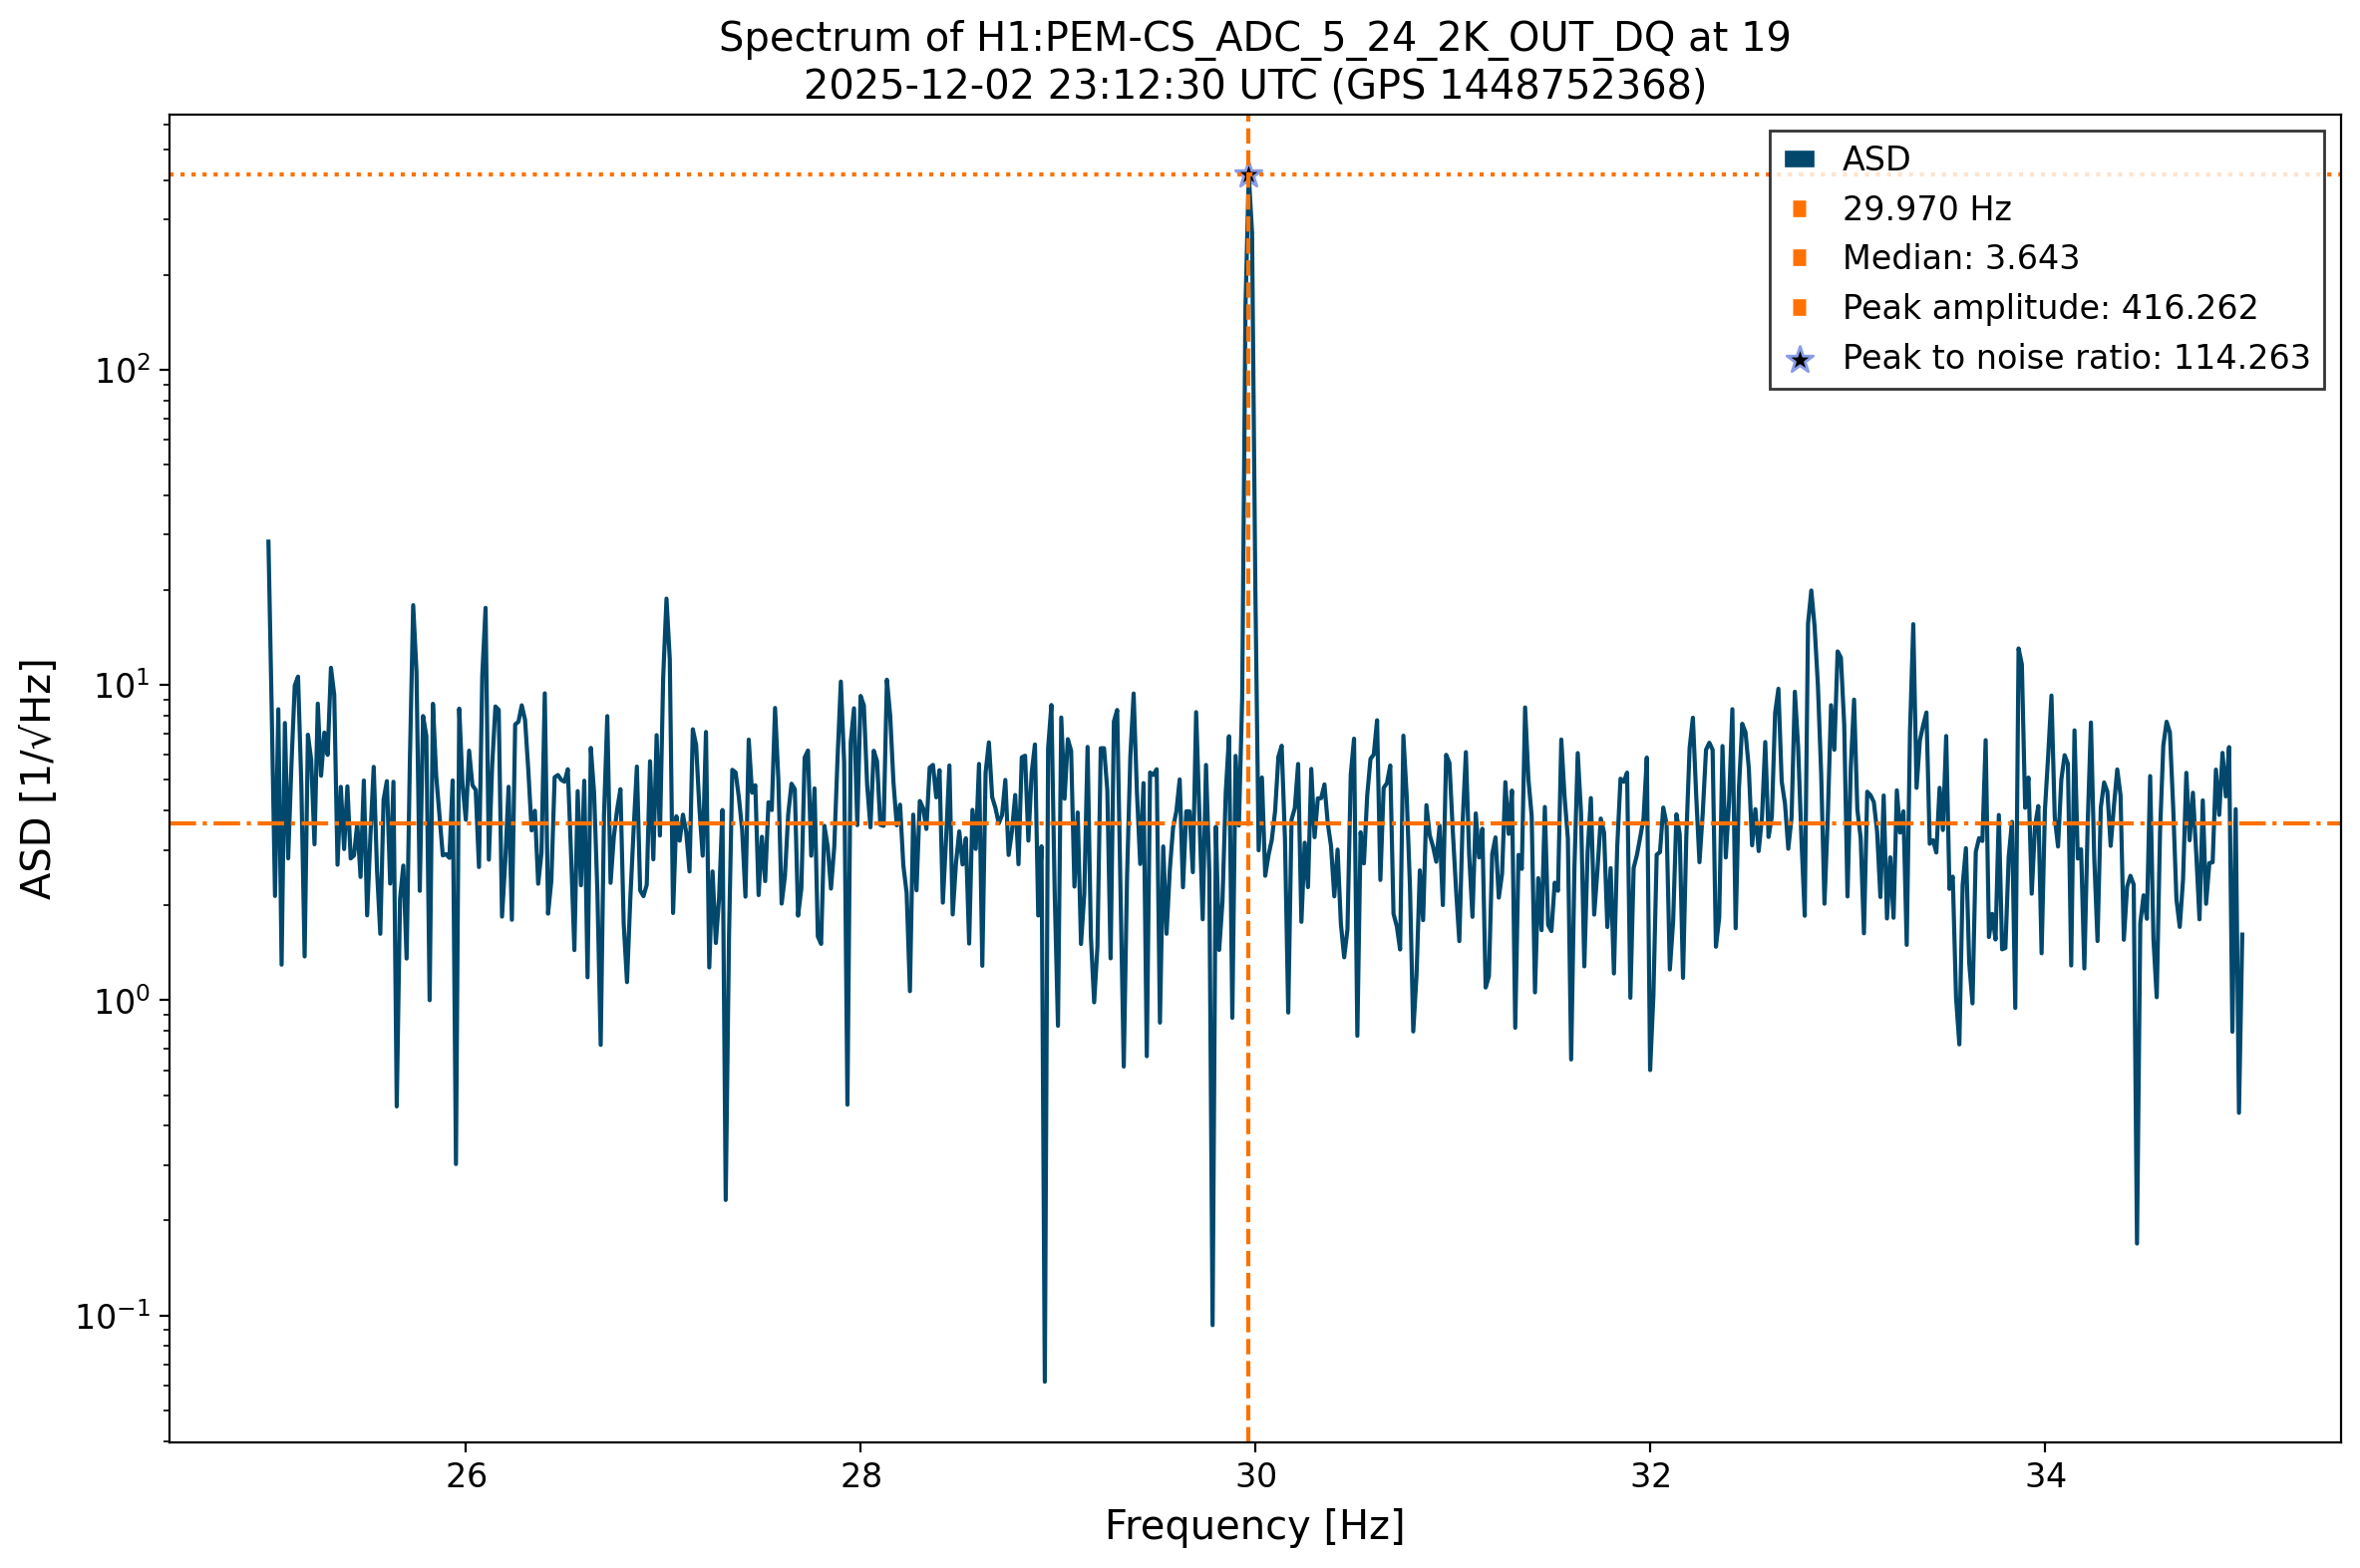 That is, we compute the ASD using 60s FT and check the amplitude of the ASD at the frequency of the first harmonic of the largest of the near-30 Hz combs, the fundamental at 29.9695 Hz. Then, we compute the median of the +- 5 surrounding Hz and save the ASD value at 29.9695 Hz "peak amplitude" and the ratio of the peak against the median to have a sort of "SNR" or "Peak to Noise ratio".
Note that we also check the permanent magnetometer channels. However, in order to compare them to the rest, we multiplied the ASD of the magnetometers that Robert gave us times a hundred so that all of them had units of Tesla.
After saving the data for all the positions, we have produced the following two plots. The first one shows the peak to noise ratio of all positions we have checked around the LVEA and the electronics room:
That is, we compute the ASD using 60s FT and check the amplitude of the ASD at the frequency of the first harmonic of the largest of the near-30 Hz combs, the fundamental at 29.9695 Hz. Then, we compute the median of the +- 5 surrounding Hz and save the ASD value at 29.9695 Hz "peak amplitude" and the ratio of the peak against the median to have a sort of "SNR" or "Peak to Noise ratio".
Note that we also check the permanent magnetometer channels. However, in order to compare them to the rest, we multiplied the ASD of the magnetometers that Robert gave us times a hundred so that all of them had units of Tesla.
After saving the data for all the positions, we have produced the following two plots. The first one shows the peak to noise ratio of all positions we have checked around the LVEA and the electronics room:
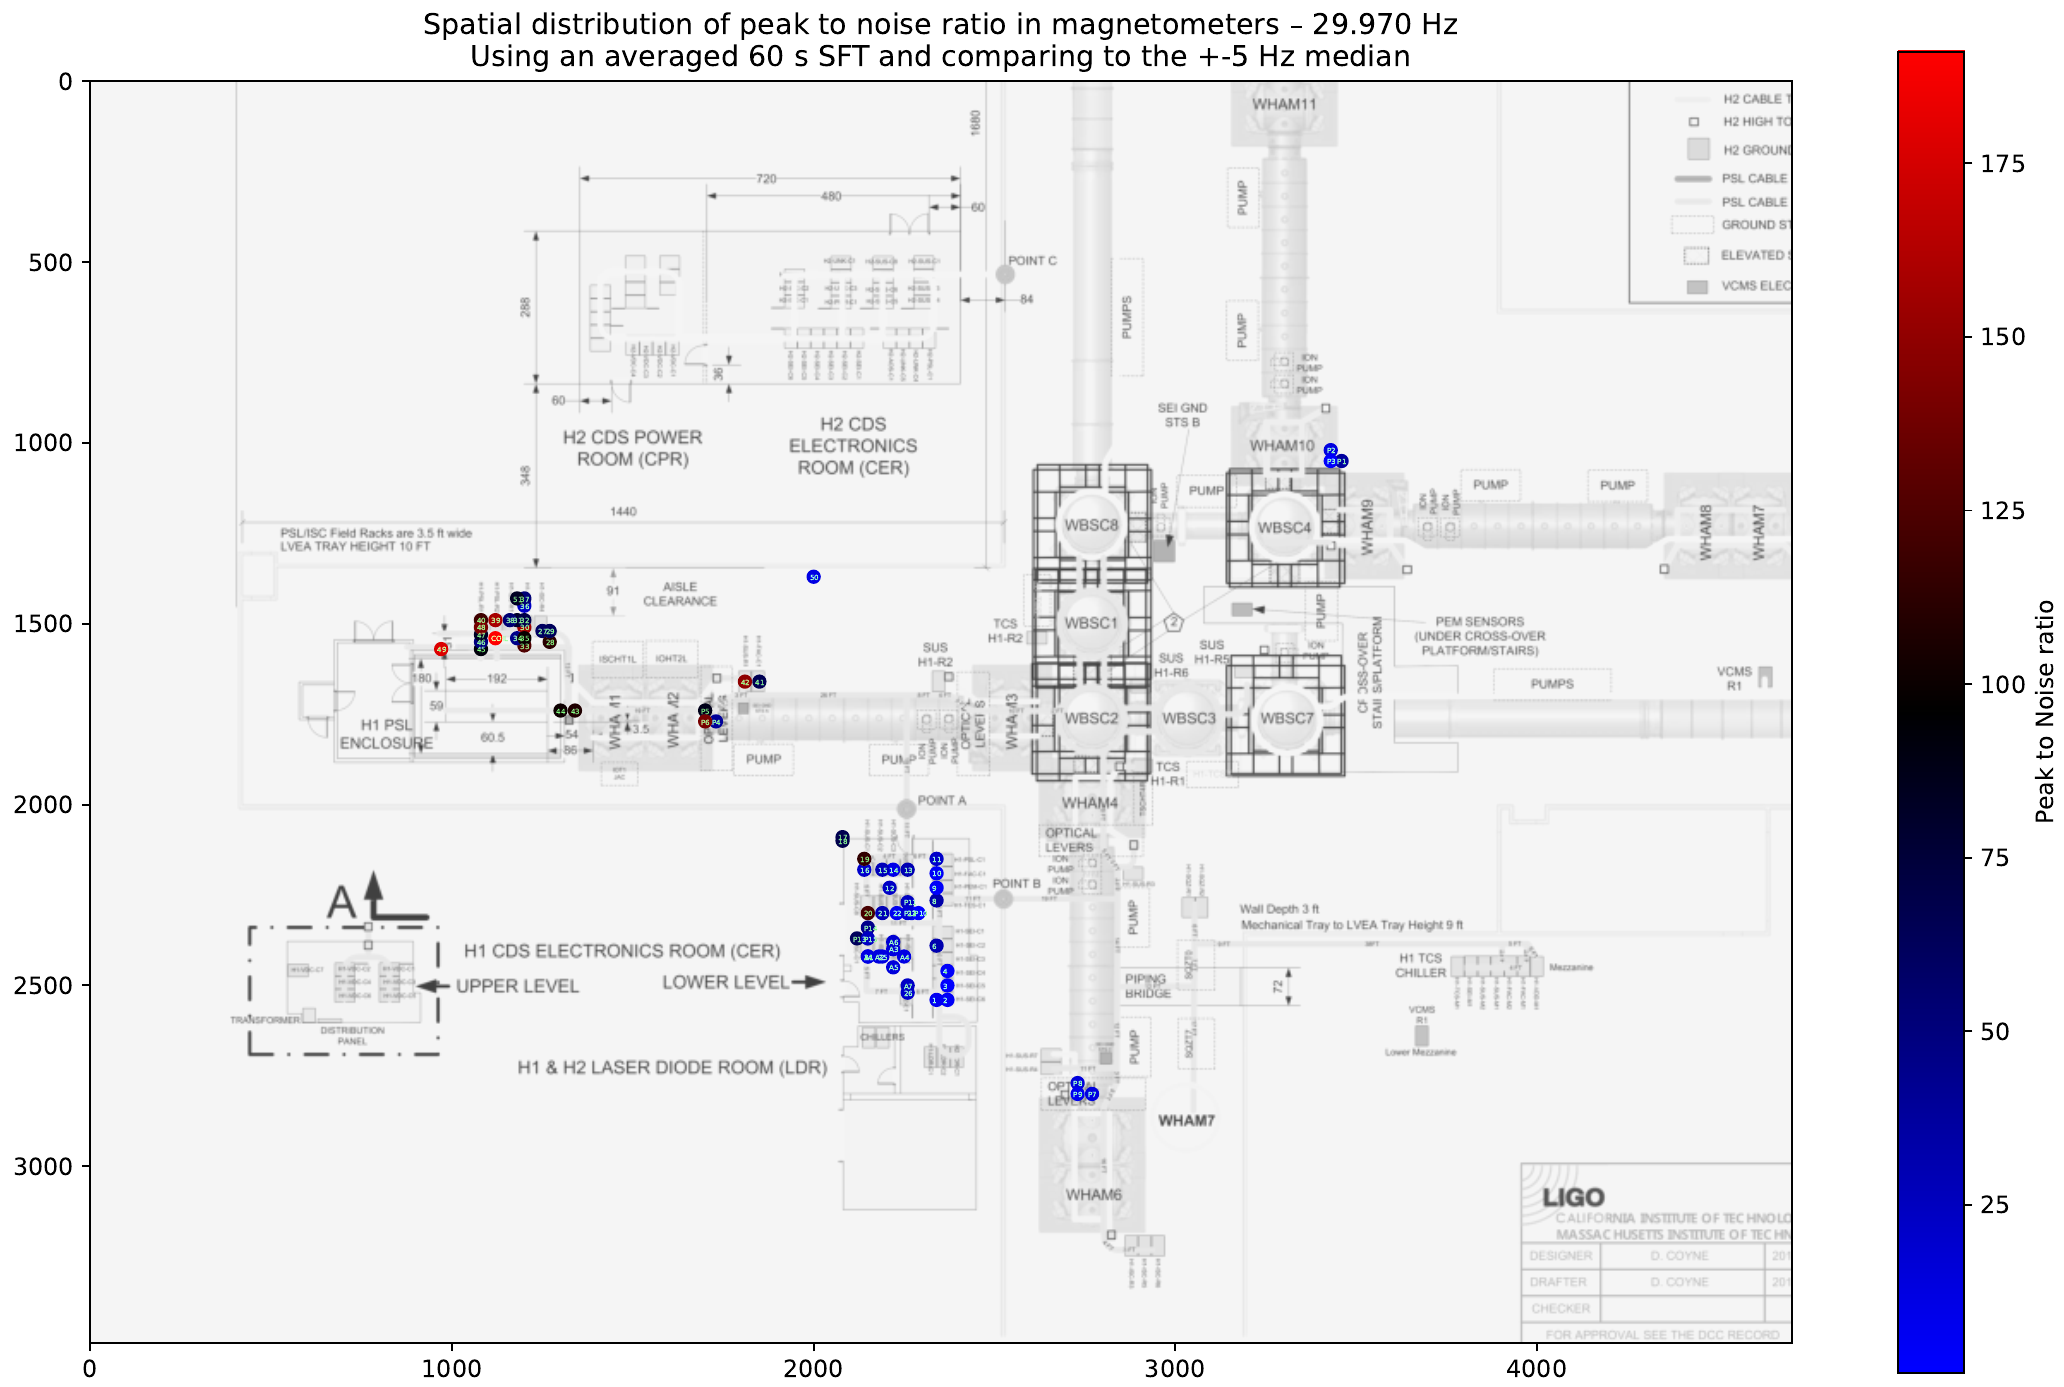 Where the X and Y axis are simply the image pixels. The color scale indicates the peak to noise ratio of the magnetometer in each position. The background LVEA has been taken from
 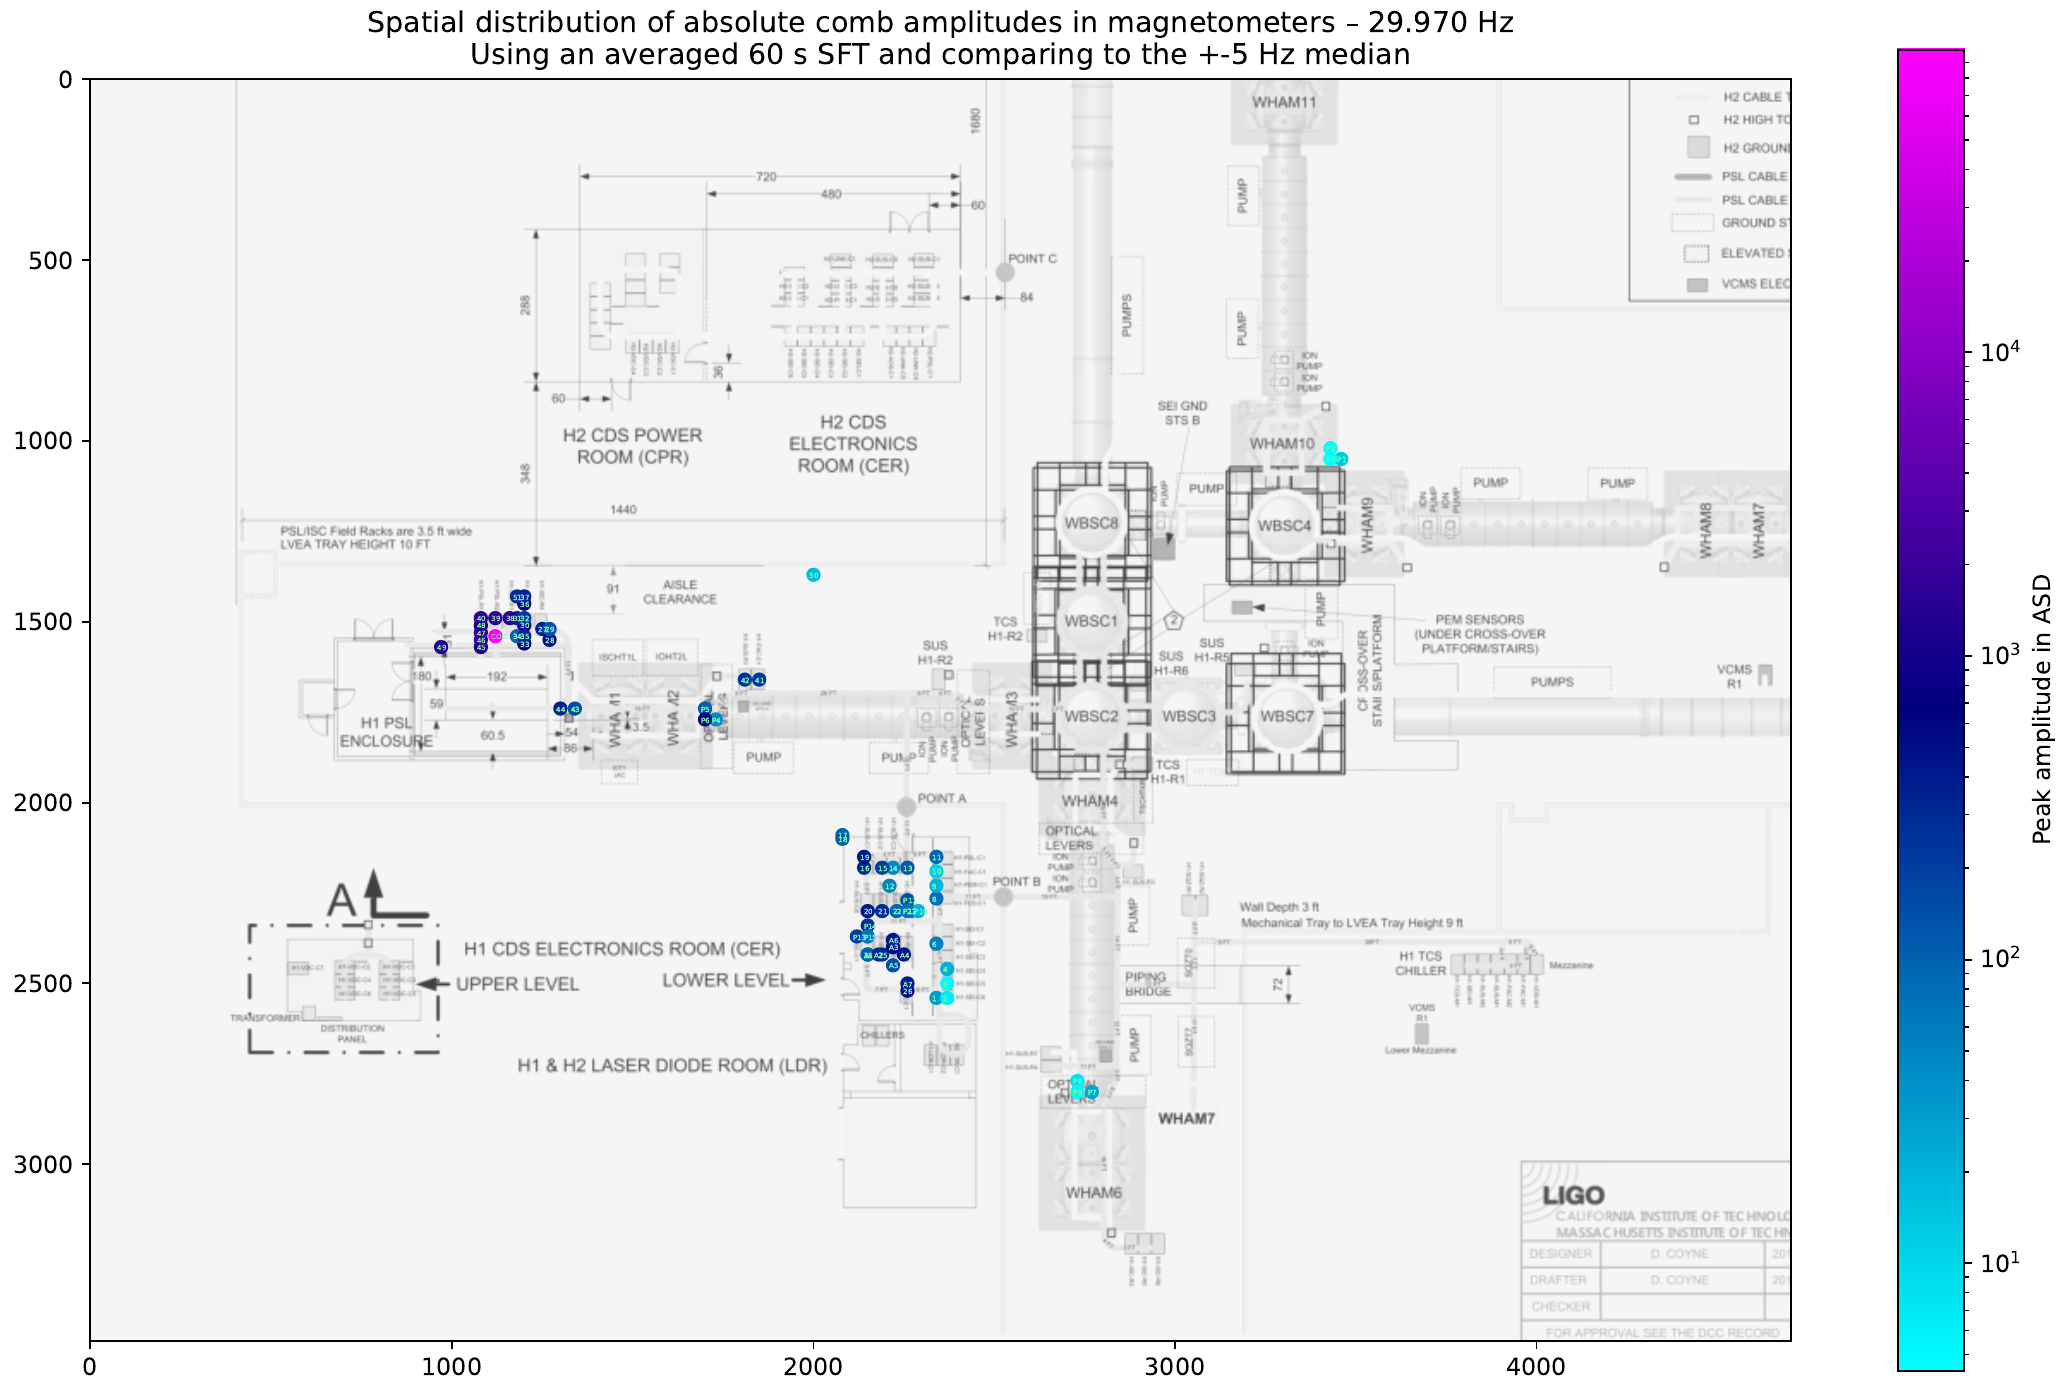 Note that in this figure, the color scale is logarithmic. It can be seen how, looking at the peak amplitudes, there is one particular position in the H1-PSL-R2 rack whose amplitude is around 2 orders of magnitude larger than the other positions. Note that this position also had the largest peak to noise ratio.
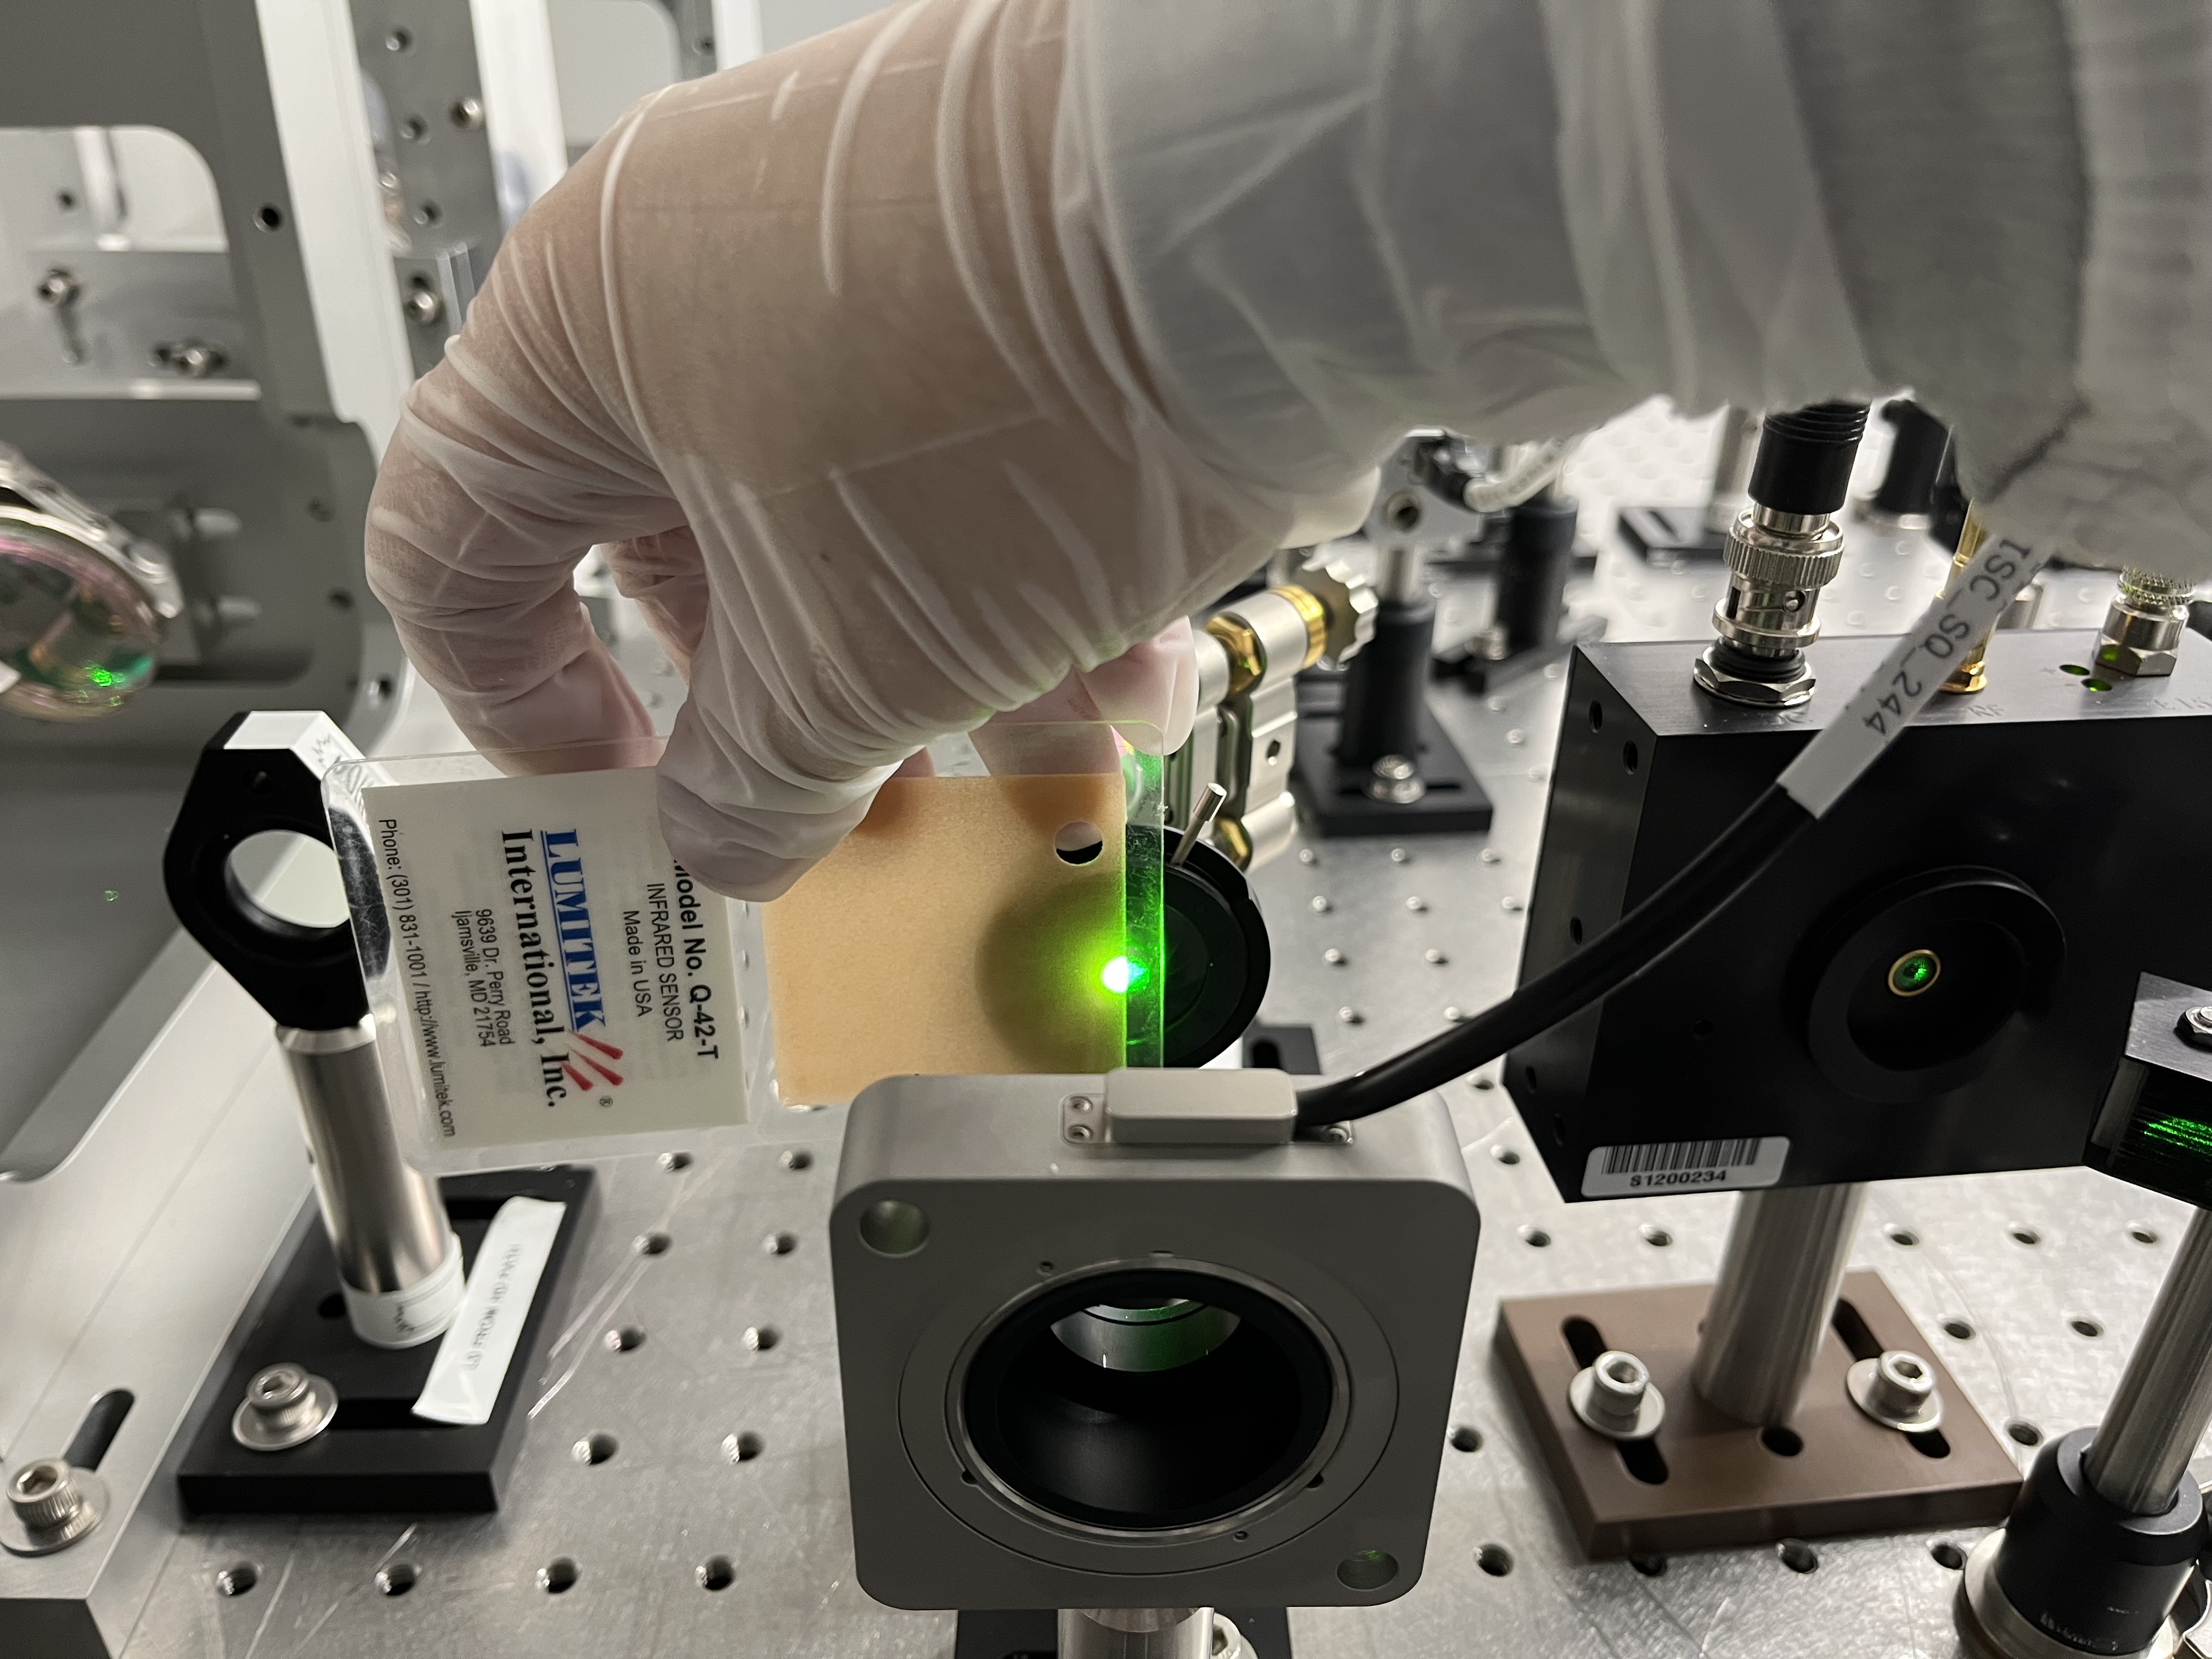
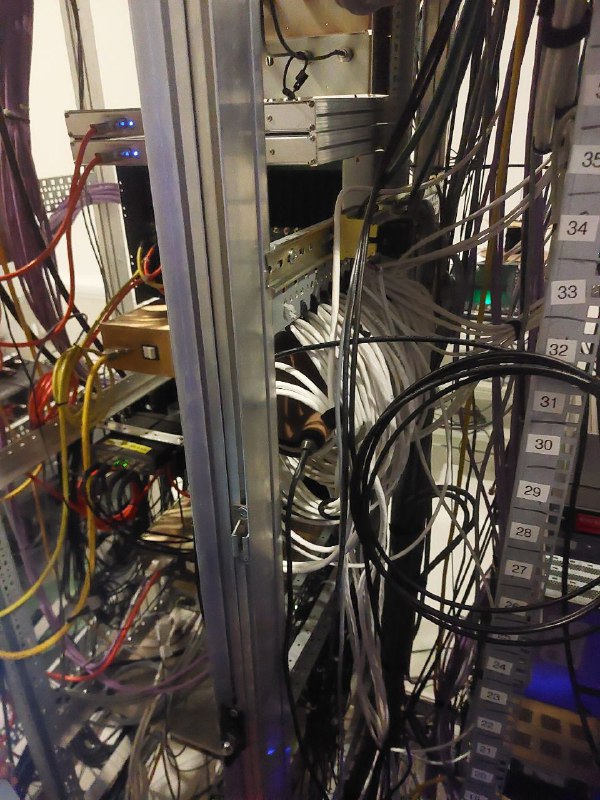
This position, that we have tagged as "Coil", is putting the magnetometer into a coil of white cables behind the H1-PSL-R2 rack, as shown in this image:
Note that in this figure, the color scale is logarithmic. It can be seen how, looking at the peak amplitudes, there is one particular position in the H1-PSL-R2 rack whose amplitude is around 2 orders of magnitude larger than the other positions. Note that this position also had the largest peak to noise ratio.
This position, that we have tagged as "Coil", is putting the magnetometer into a coil of white cables behind the H1-PSL-R2 rack, as shown in this image:
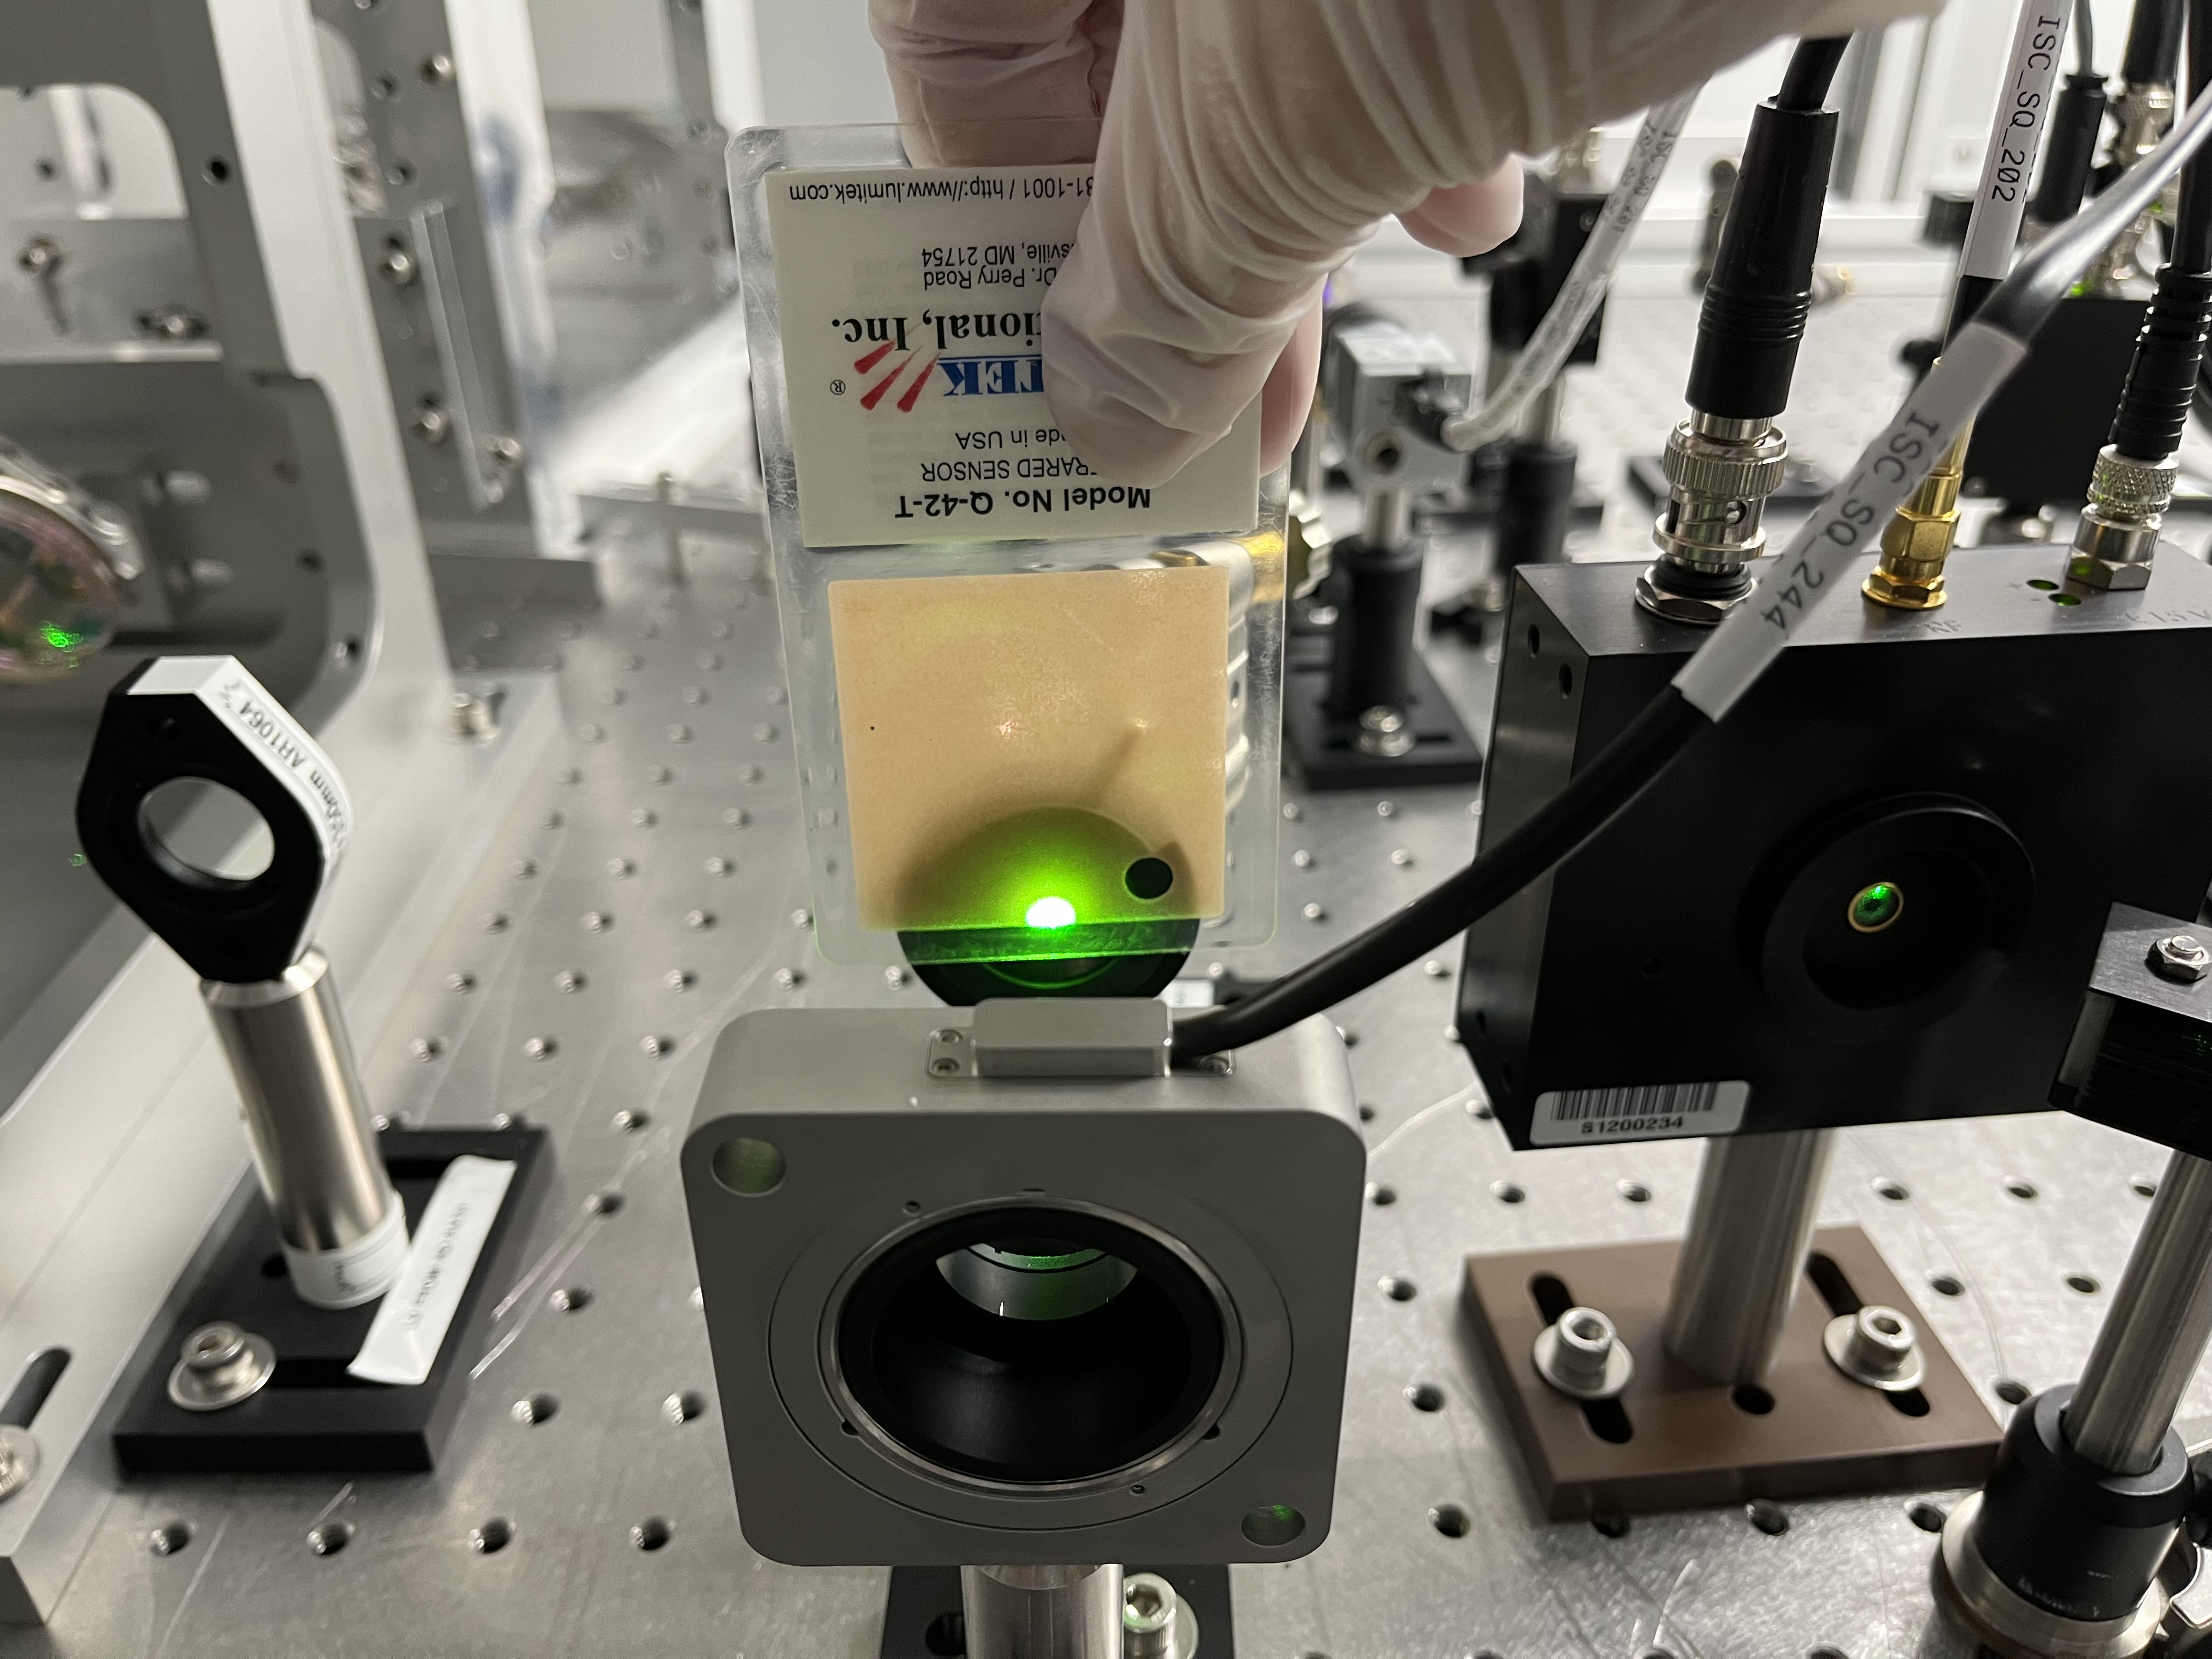
 The reason that led us to put the magnetometer there is that we also found the peak amplitude to be around 1 order of magnitude larger than on any other magnetometer on top of one set of white cables that go from inside the room towards the rack and up towards we are not sure where:
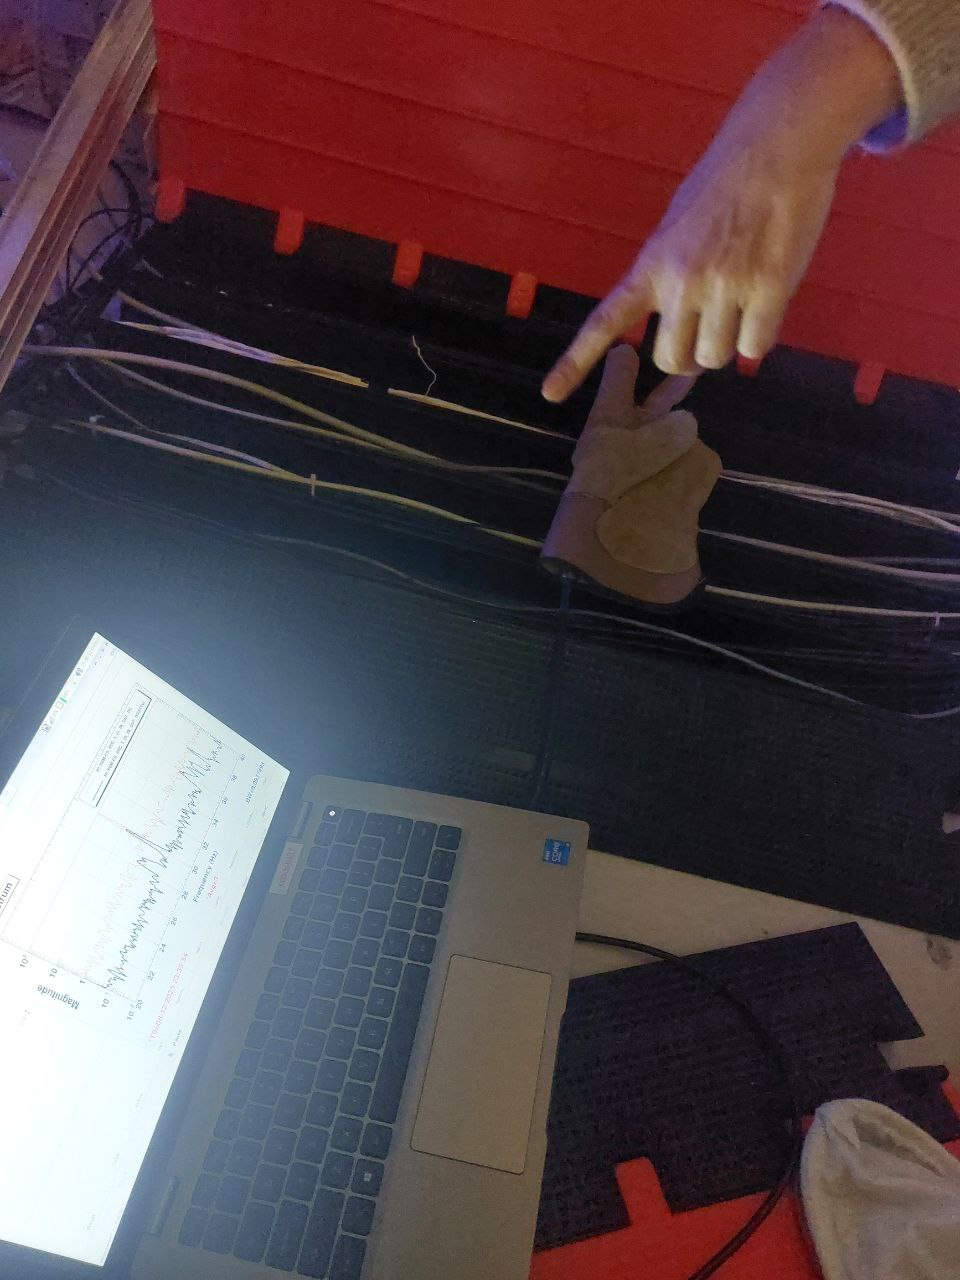 This image shows the magnetometer on top of the cables on the ground behind the H1-PSL-R2 rack, the white ones on the top of the image appear to show the peak at its highest. It could be that the peak is louder in the coil because there being so many cables in a coil distribution will generate a stronger magnetic field.
This is the actual status of the hunt. These white cables might indicate that the source of these combs is the different interlocking system in L1 and H1, which has a chassis in the H1-PSL-R2 rack. However, we still need to track down exactly these white cables and try turning things on and off based on what we find in order to see if the combs dissapear.
This image shows the magnetometer on top of the cables on the ground behind the H1-PSL-R2 rack, the white ones on the top of the image appear to show the peak at its highest. It could be that the peak is louder in the coil because there being so many cables in a coil distribution will generate a stronger magnetic field.
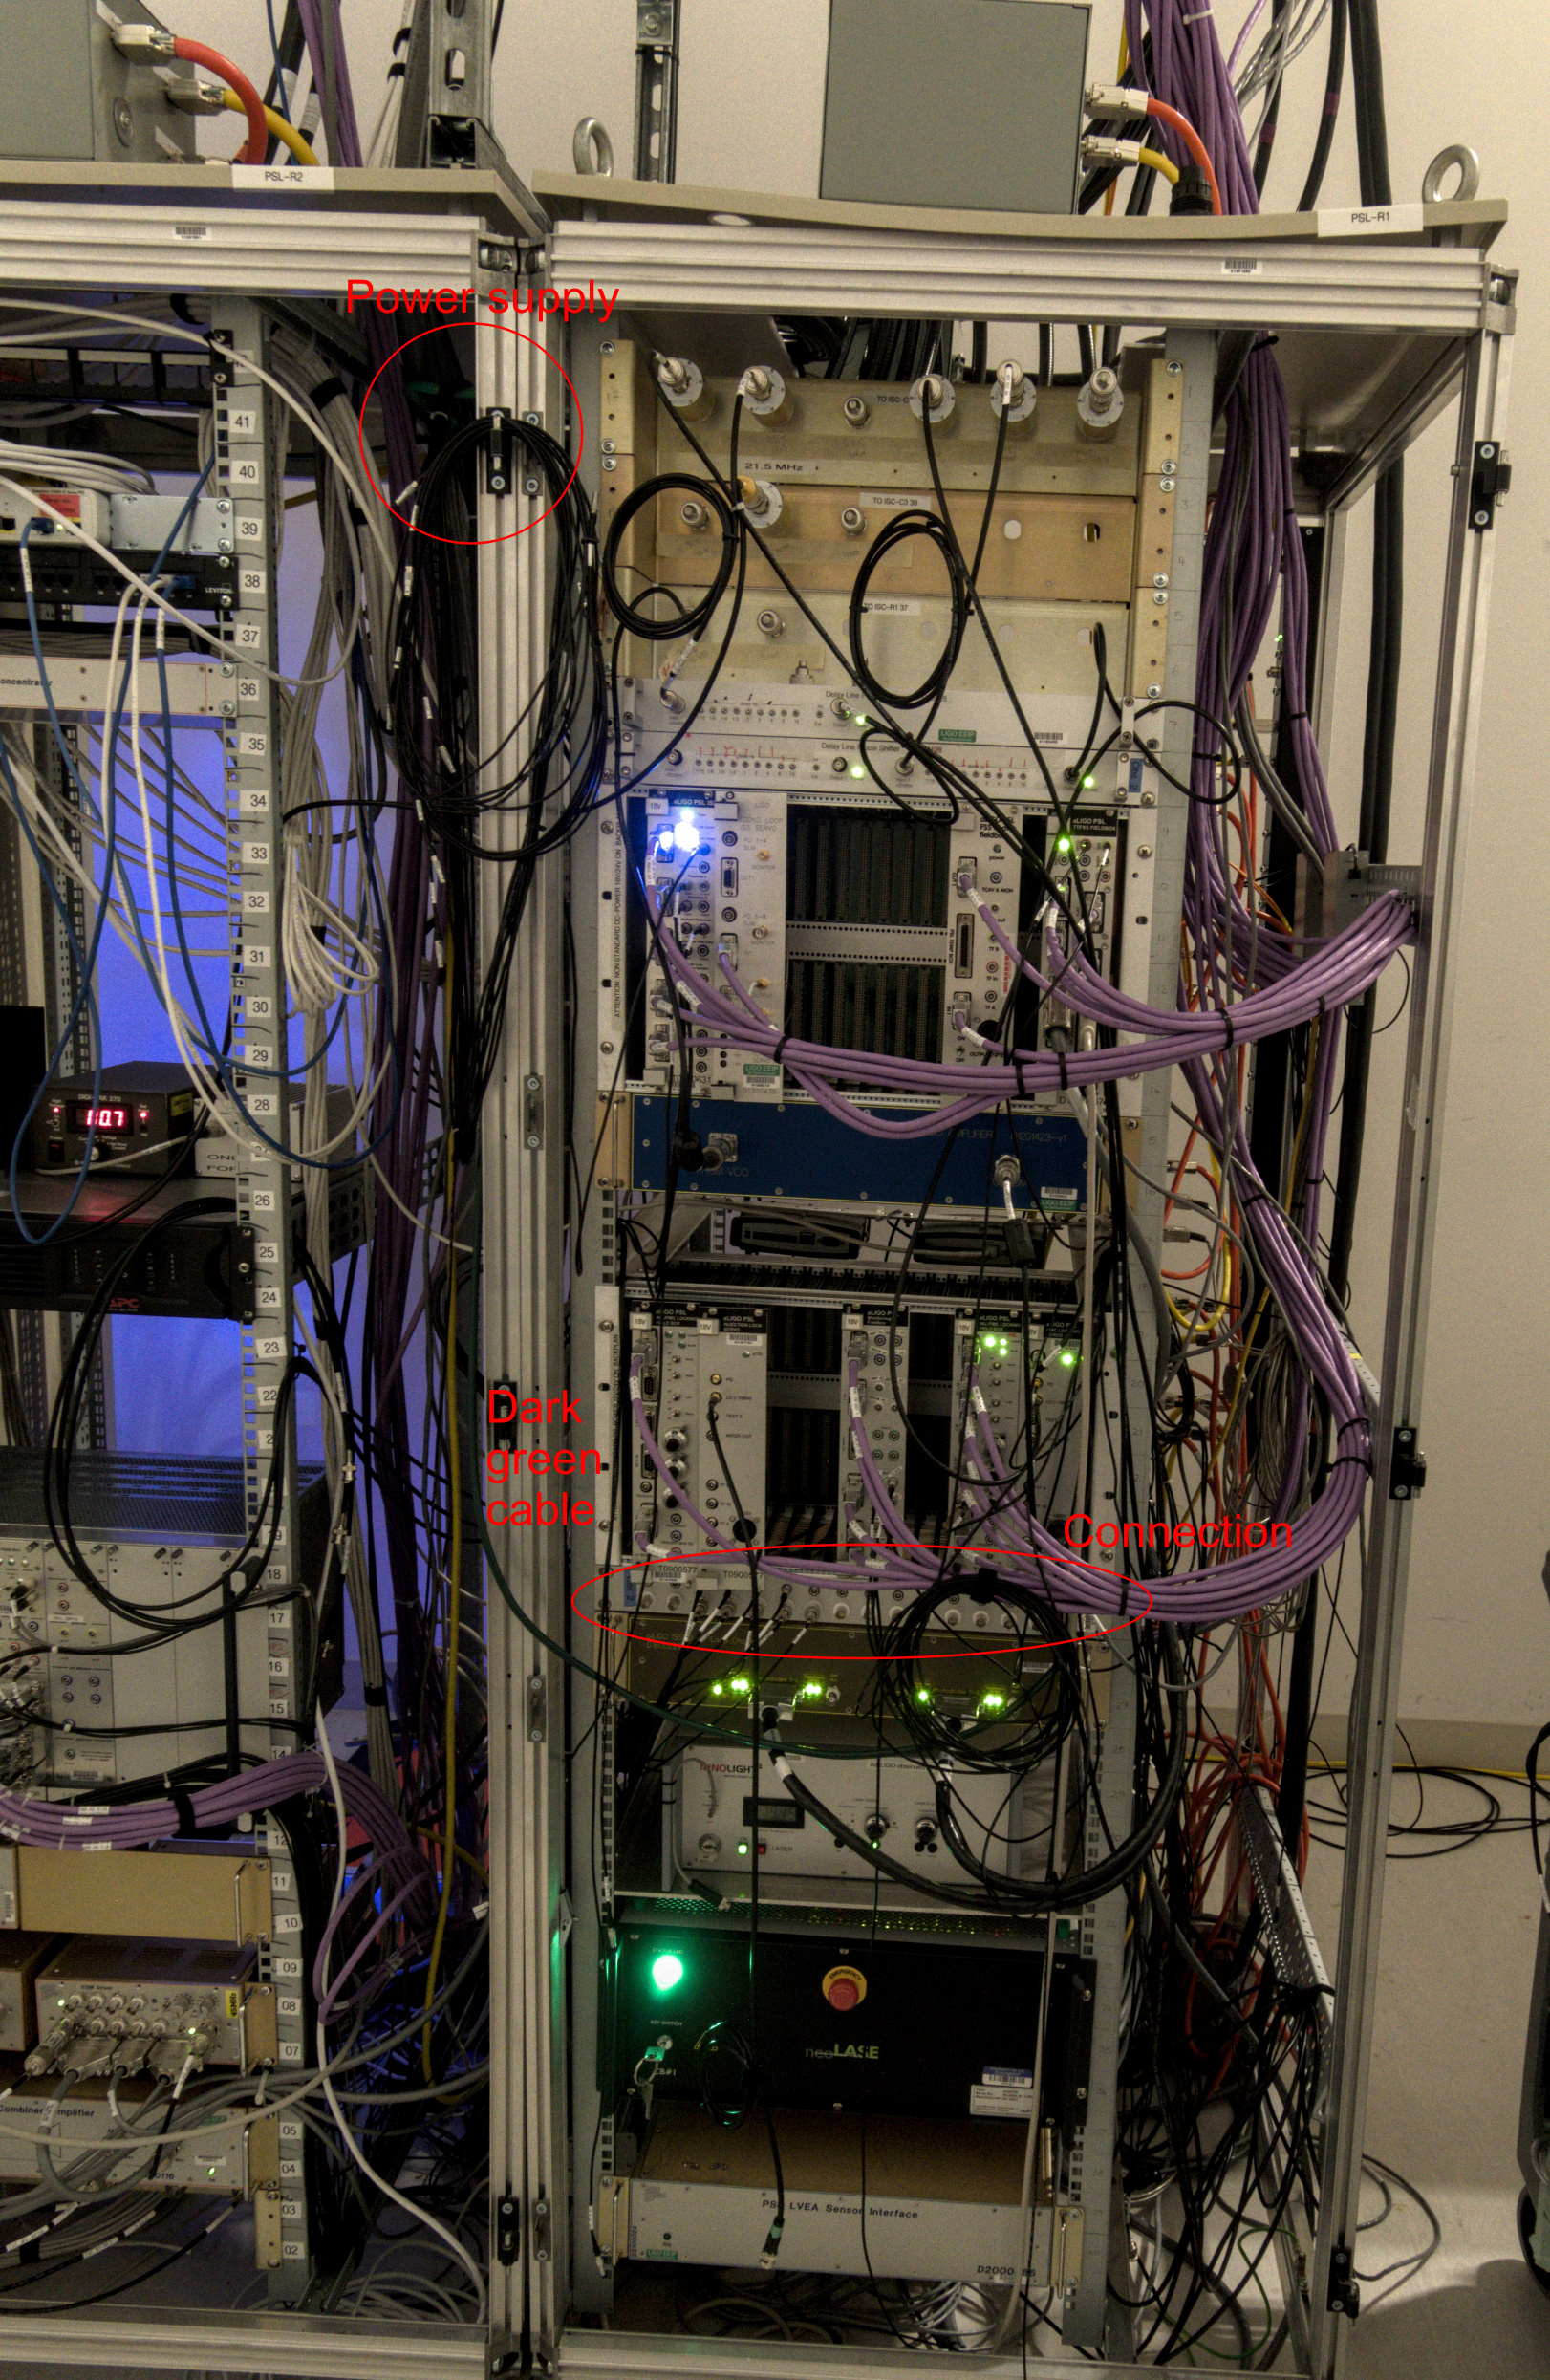
This is the actual status of the hunt. These white cables might indicate that the source of these combs is the different interlocking system in L1 and H1, which has a chassis in the H1-PSL-R2 rack. However, we still need to track down exactly these white cables and try turning things on and off based on what we find in order to see if the combs dissapear.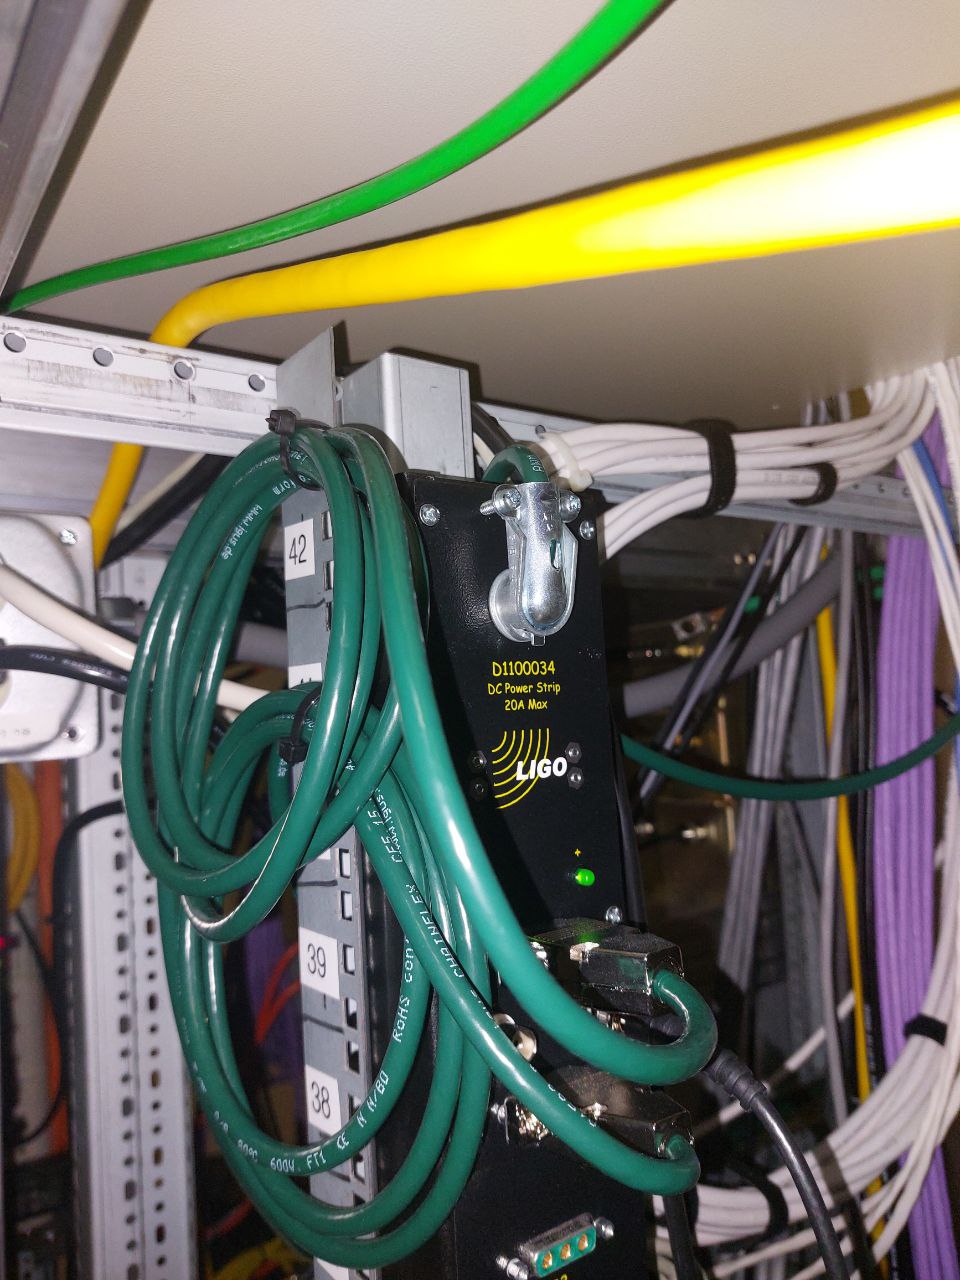 So it may be that these lines may be transmitted elsewhere through this power supply.
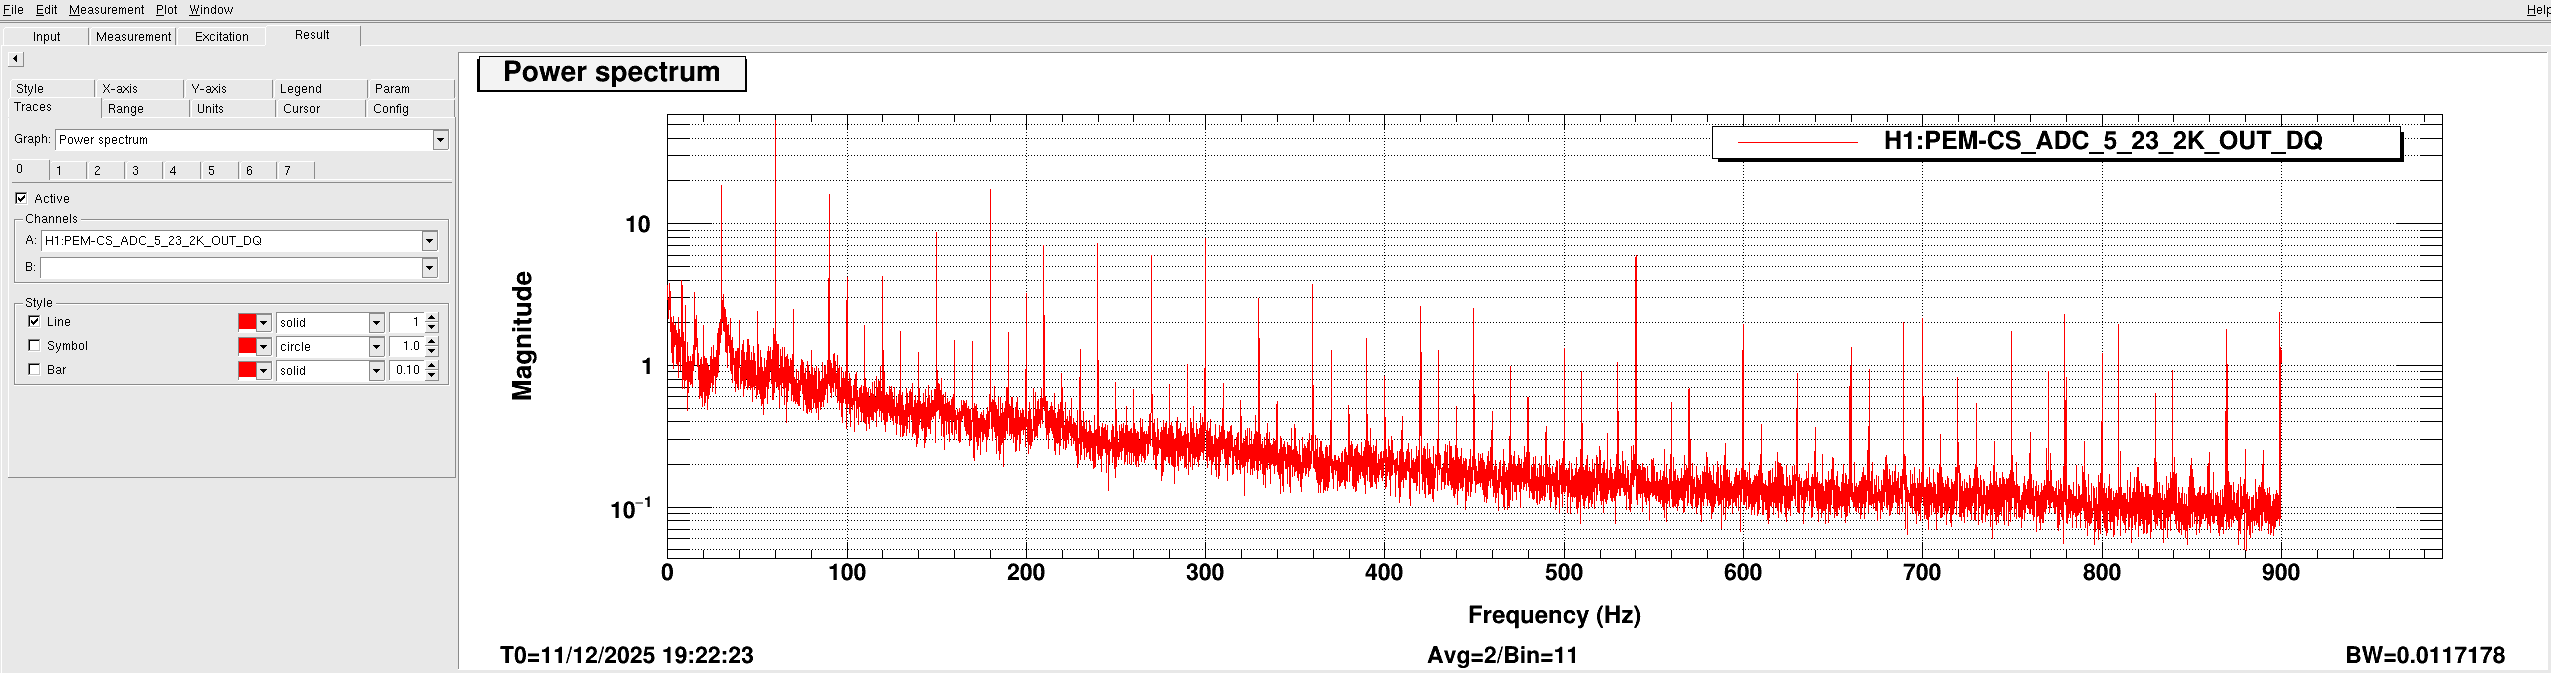
We connected a voltage divider and connected it to the same channel we were using for the magnetometer (H1:PEM-CS_ADC_5_23_2K_OUT_DQ):
So it may be that these lines may be transmitted elsewhere through this power supply.
We connected a voltage divider and connected it to the same channel we were using for the magnetometer (H1:PEM-CS_ADC_5_23_2K_OUT_DQ):
 Out of this power supply, two dark green cables come out, the first one goes to the H1-PSL-R1 rack:
 However, the comb did not appear as strong when we put the magnetometer besides the chassis where the cable leads.
On the other hand, the comb does appear strong if we follow the other dark green cable, that goes to this object
However, the comb did not appear as strong when we put the magnetometer besides the chassis where the cable leads.
On the other hand, the comb does appear strong if we follow the other dark green cable, that goes to this object
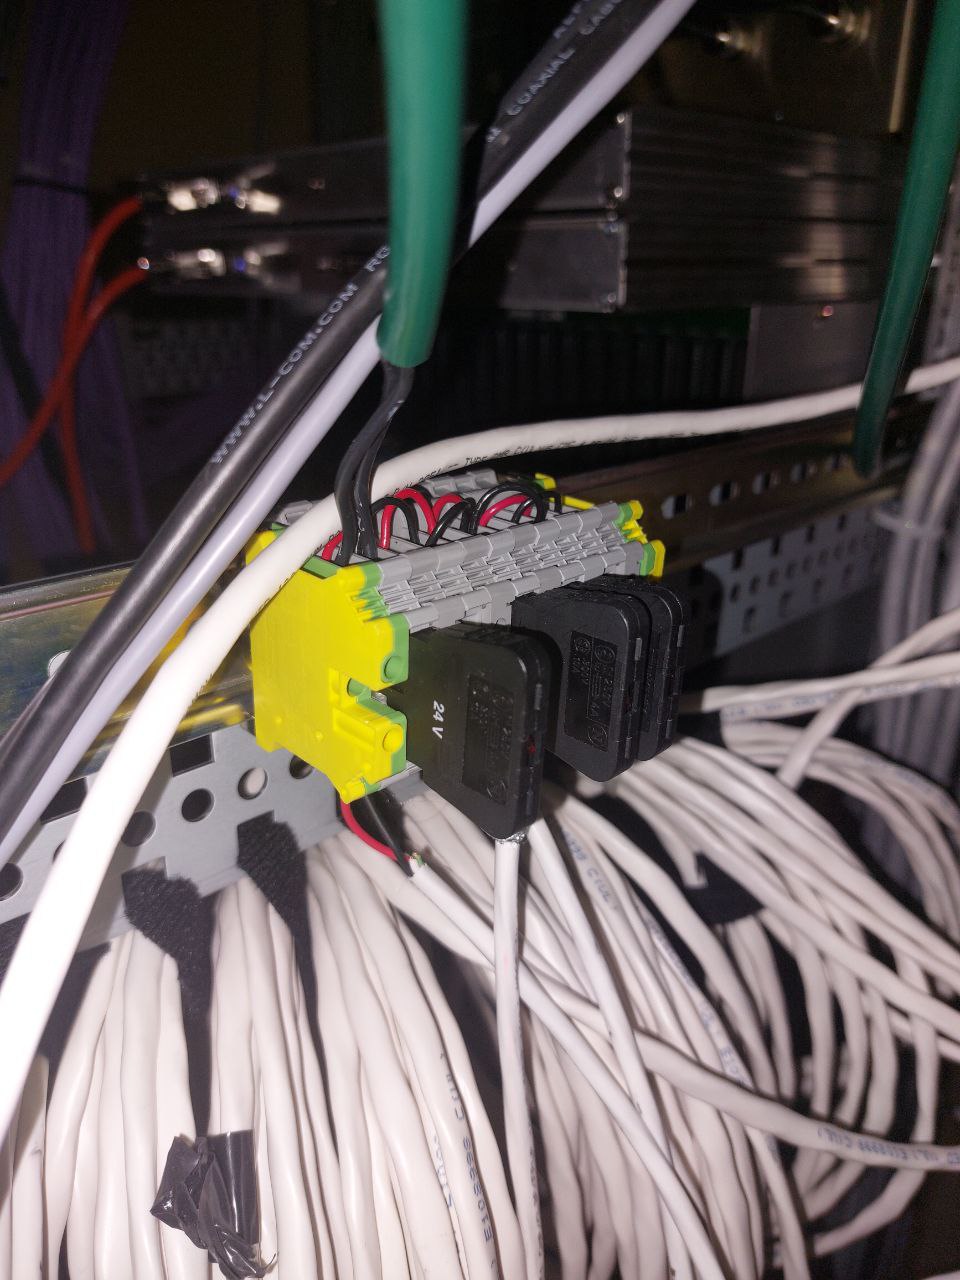 Which Jason told us it may be related to the interlock system.
Following the white cables that go from this object, it would appear that they go into the coil, where we saw that the comb was very strong.
We think it would be interesting to see what here can be turned off and see if the comb does disappear.
Which Jason told us it may be related to the interlock system.
Following the white cables that go from this object, it would appear that they go into the coil, where we saw that the comb was very strong.
We think it would be interesting to see what here can be turned off and see if the comb does disappear.