WP12901. Daniel, Jeff, Oli, Fil, Marc, Jonathan, EJ, Tony, Dave:
Summary:
Yesterday I replaced h1iscex's 18bit-DAC with a 20bit-DAC as part of the project to eliminate all 18bit-DACs from production. There is currently no indication that the 20bit-DAC is driving the AI chassis with any voltage, investigation is ongoing.
Details:
The 18/20 bit DACs use the same interface card, so for the upgrade I was able to pull the IO Chassis out half way with cables still attached to access the PCIe bus. I removed the old 18bit-DAC and replaced it with on of the 20bit-DACs from h1susex upgrade
| old 18bit-DAC (removed) | 110425-03 |
| new 20bit-DAC (installed) | 190219-10 |
I do not know if the 20bit-DAC from h1susex was the one driving the PI or the one which had been idle since the LIGO-DAC went in mid 2024.
The original interface card and ribbon cable were reused. No field cabling was disconnected, no AI chassis were powered down.
Upgrade was done between 12:00 and 13:00 Tue 02dec2025.
Later that afternoon Tony found that the PCAL readbacks were not responsive. Tony and I went to EX around 17:00 to verify the 20bit-DAC was installed and connected correctly, it was.
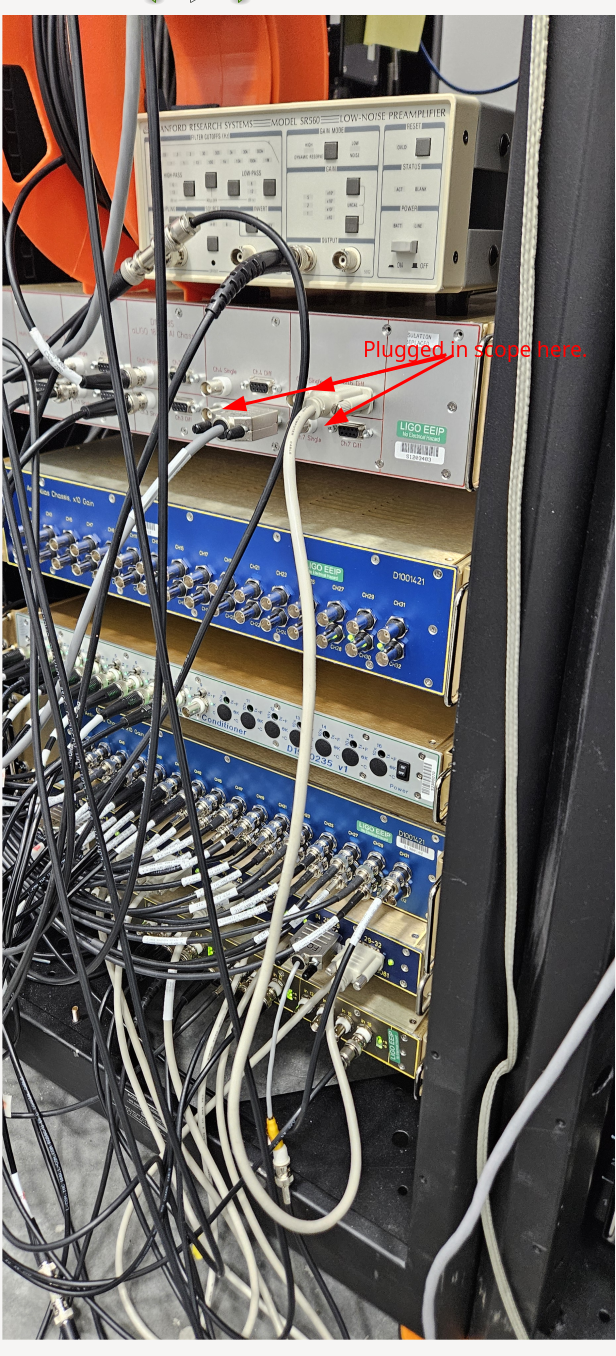
This DAC has a special AI Chassis, D1101785 "aLIGO 18 Bit AI Chassis" which has handy BNC pickoffs for all 8 channels. We put a scope on the two channels being driven by h1calex (6,7) and could see no signal.
Also the last channel on the AI is loop-backed to the first ADC AA chassis with a DB9 cable, and the IOP is configured by SDF to drive the duotone from DAC0-chan7 back to ADC0-chan30. No signal is seen there either since the upgrade.

DCC docs for "18bit AI Chassis"
D1101785 [front section]
D1200316 [whole chassis]
The "AI WD" green LED on the rear panel is ON when the serial cable from the DAC Interface cable is connected and OFF when the cable is disconnected, suggesting the DAC is driving the WD line correctly at least.
Model changes:
h1iopiscex (Dave) updated to new DAC configuration
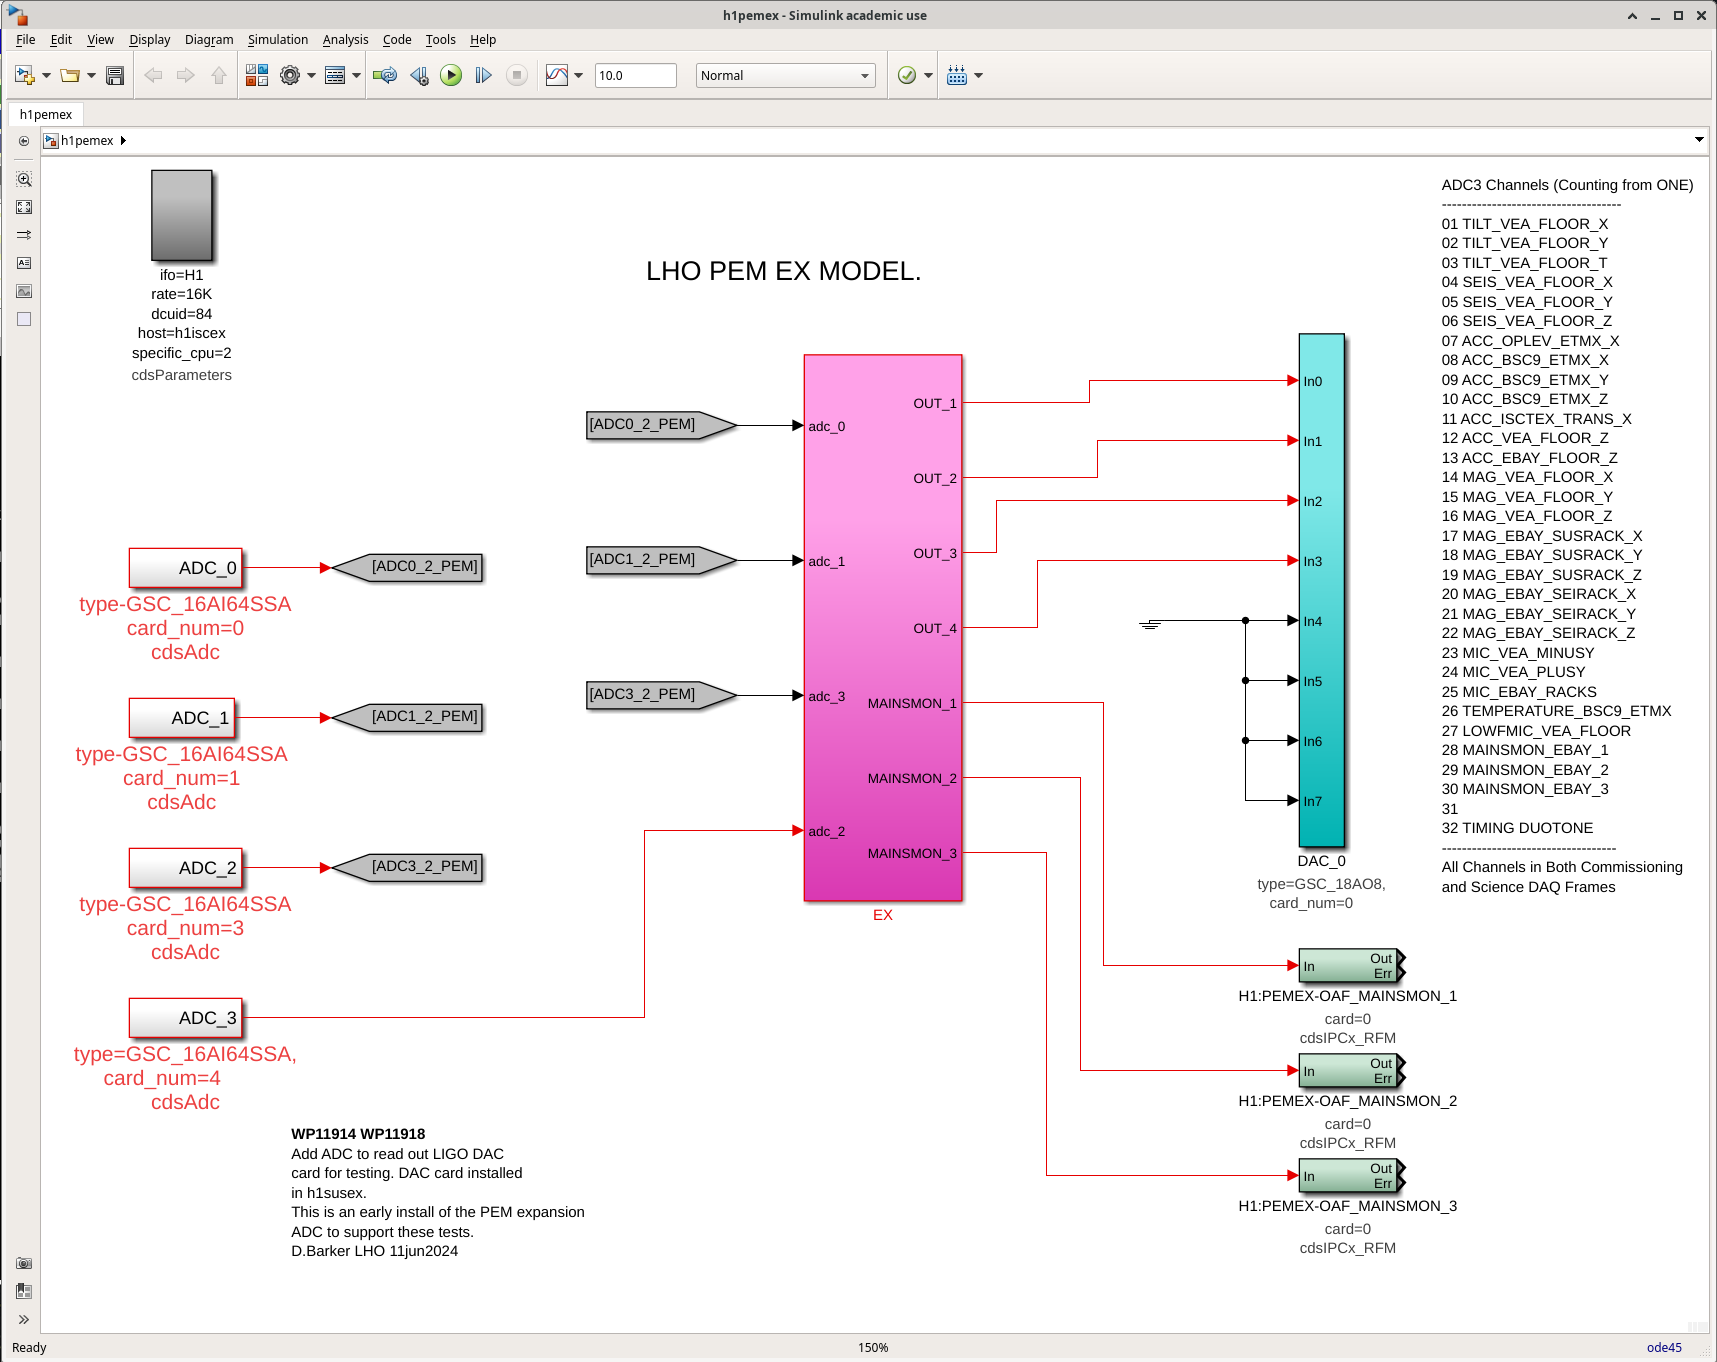
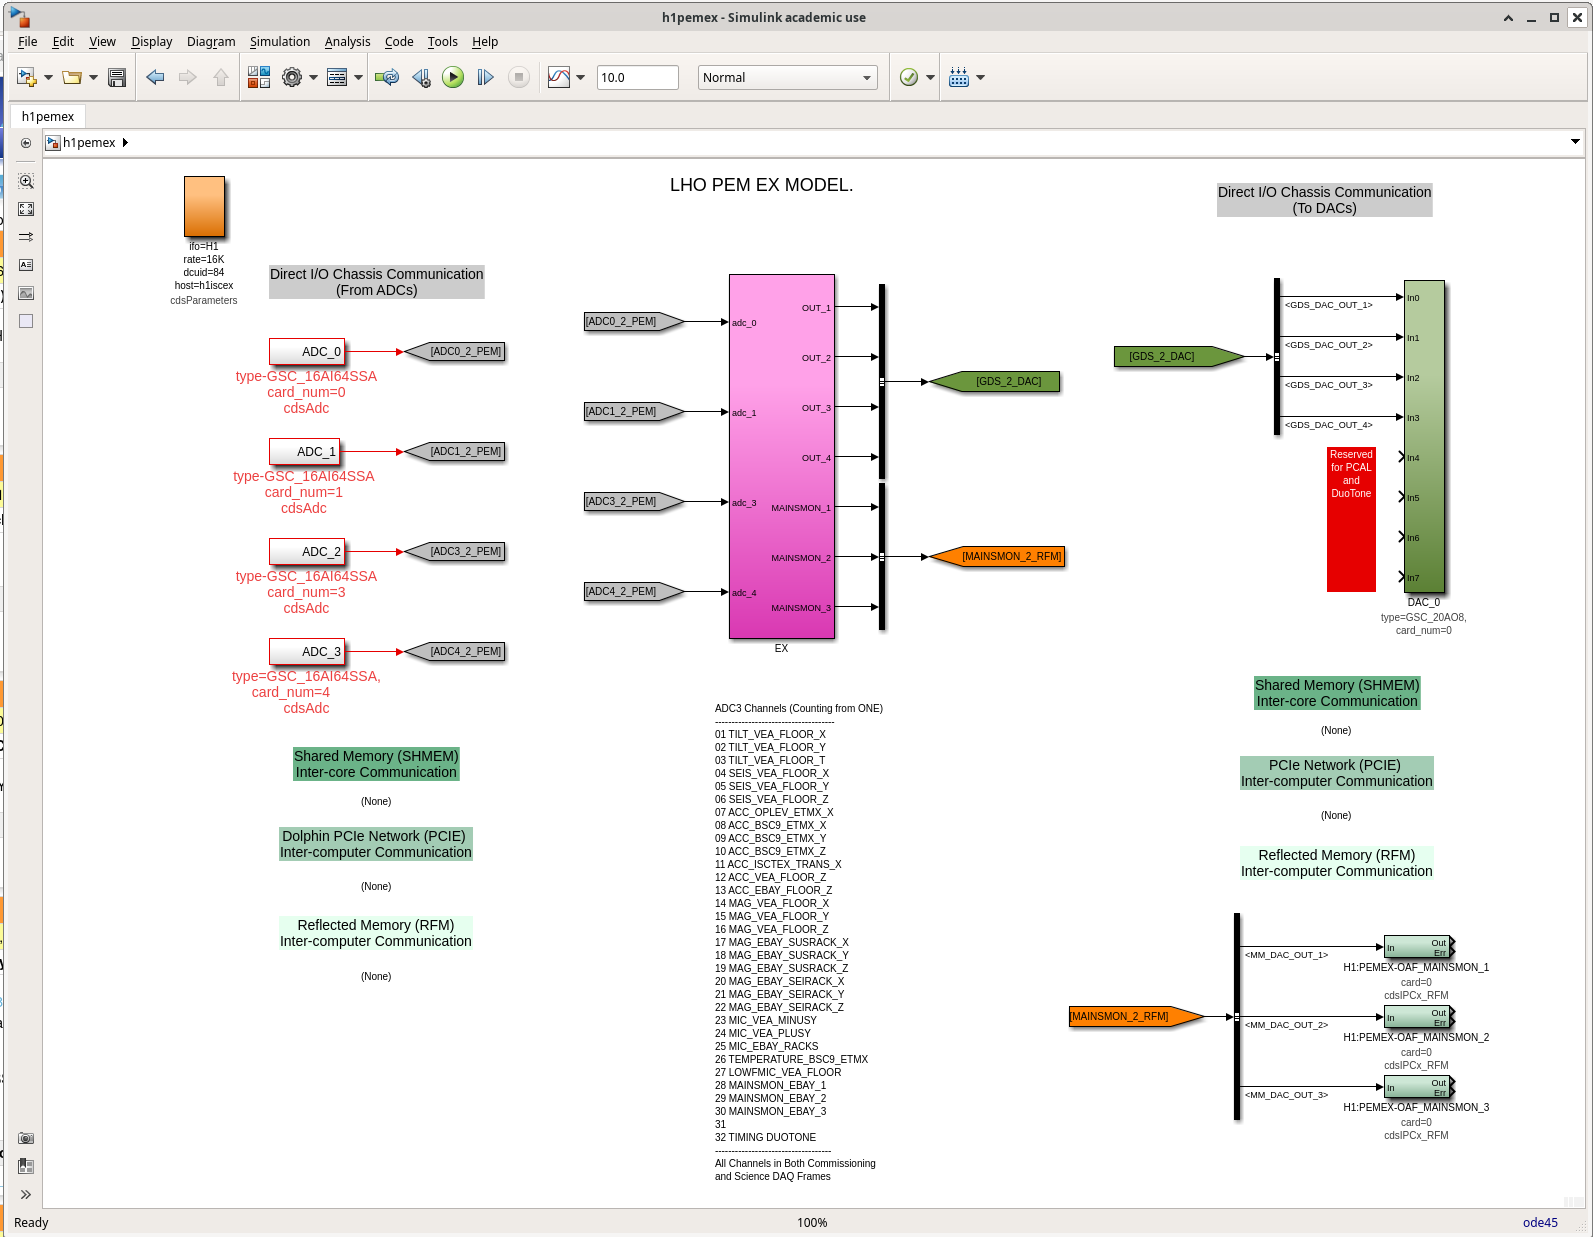
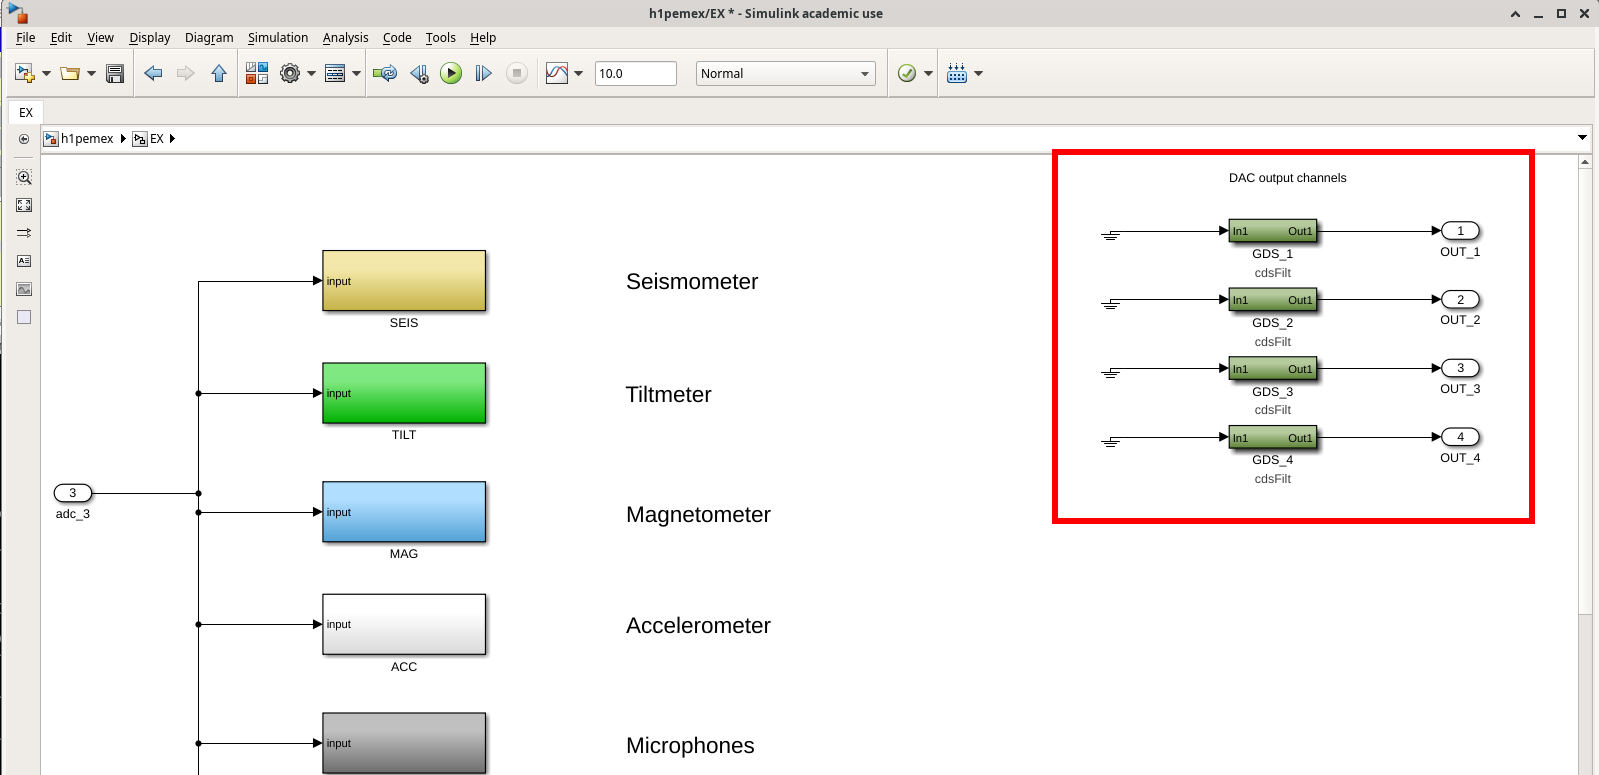
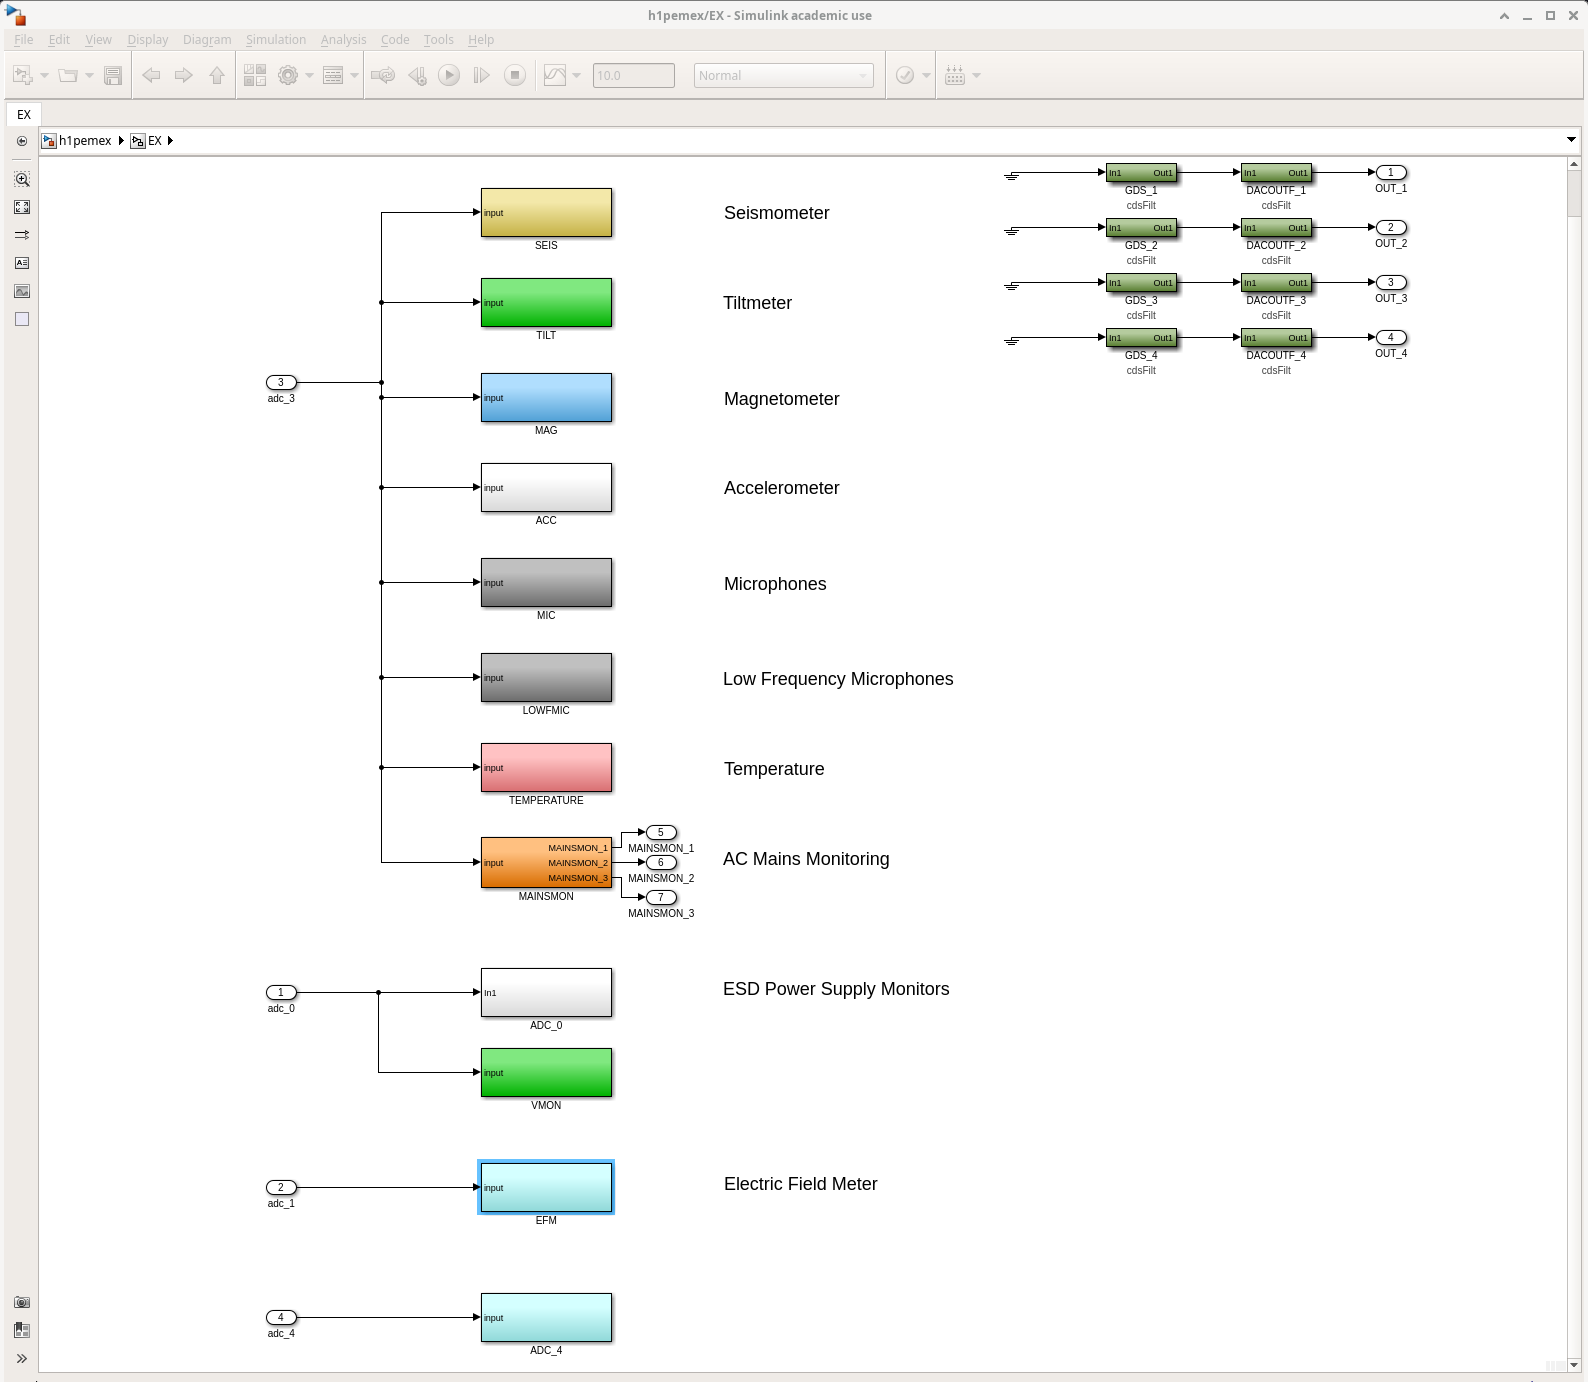
h1calex, h1pemex (Jeff, Oli) updated to new DAC configuration
All models on this front end, including h1iscex and h1alsex, were built and installed with RCG-5.5.2
Tagging CAL and PEM because this is "their" DAC.

We've done the typically thing with a DAC upgrade:
    - the DC calibration of the DAC has changed from (roughly) 20 / 2^18 [Vpp_differential / ct] to (roughly) 20 / 2^20 [Vpp_differential / ct]
    - Such that upstream control systems "don't have to be retuned" we apply a digital factor of (exactly) 4.0x to all output signals for each DAC channel

As such, for example,  the calibration of the PCAL actuation / excitation chain is likely now slightly different, and should be remeasured.