The sqz angle scan ran overnight. It did no squeezing and an NLG measurement at the start but those times are not included in the log of times for some reason, I will have to find the times manually.
It looks like the alignment degraded overnight. The script runs AS42 WFS while it moves the psams, but that must not have worked well enough. I'm running scan_alignment: results here, angle scan following here.
It looks like the squeezing angle servo based on the 322 Hz ADF was on while we were in frequency independent squeezing, this will not work well so I've added it SQZ_MANAGER to turn that off when it misaligns the filter cavity.
Ran scan alignment a second time, as well as scan sqz angle, set guardian to FDS, turned off ADF servo and started Kevin's script at 6:55, it should finish around 8:30.
Edited to add: I think the first two scans here are good data, so FDS nominal psams and FIS ZM4 at 4, ZM5 at -0.4. This should also have teh nlg measurement for Kevin's script that I'll have to go find the times for by hand.
log of times :
starting angle scan for FREQ_DEP_SQZ with zm4 psams at 6.2, zm5 psams at -0.4184.8 : 1447823586.0
174.8 : 1447823826.0
164.8 : 1447824067.0
154.8 : 1447824306.0
144.8 : 1447824547.0
134.8 : 1447824787.0
124.8 : 1447825027.0
114.8 : 1447825267.0
104.8 : 1447825507.0
94.8 : 1447825747.0
94.8 : 1447825987.0
74.8 : 1447826227.0
54.8 : 1447826467.0
34.8 : 1447826707.0
14.8 : 1447826948.0
0.0 : 1447827187.0
-30.0 : 1447827428.0
-60.0 : 1447827668.0
-90.0 : 1447827908.0
-120.0 : 1447828148.0
-150.0 : 1447828388.0
starting angle scan for FREQ_INDEP_SQZ with zm4 psams at 4.0, zm5 psams at -0.4182.1 : 1447829109.0
172.1 : 1447829349.0
162.1 : 1447829589.0
152.1 : 1447829829.0
142.1 : 1447830069.0
132.1 : 1447830309.0
122.1 : 1447830549.0
112.1 : 1447830789.0
102.1 : 1447831029.0
92.1 : 1447831269.0
92.1 : 1447831510.0
72.1 : 1447831749.0
52.1 : 1447831990.0
32.1 : 1447832229.0
12.1 : 1447832470.0
0.0 : 1447832710.0
-30.0 : 1447832950.0
-60.0 : 1447833190.0
-90.0 : 1447833430.0
-120.0 : 1447833670.0
-150.0 : 1447833910.0
starting angle scan for FREQ_INDEP_SQZ with zm4 psams at 6.2, zm5 psams at -4.5175.0 : 1447835290.0
165.0 : 1447835530.0
155.0 : 1447835770.0
145.0 : 1447836010.0
135.0 : 1447836250.0
125.0 : 1447836490.0
115.0 : 1447836730.0
105.0 : 1447836970.0
95.0 : 1447837210.0
85.0 : 1447837450.0
84.9 : 1447837690.0
64.9 : 1447837930.0
44.9 : 1447838171.0
24.9 : 1447838410.0
4.9 : 1447838651.0
0.0 : 1447838891.0
-30.0 : 1447839131.0
-60.0 : 1447839371.0
-90.0 : 1447839611.0
-120.0 : 1447839851.0
-150.0 : 1447840092.0
starting angle scan for FREQ_INDEP_SQZ with zm4 psams at 6.2, zm5 psams at -5.3173.6 : 1447840601.0
163.6 : 1447840841.0
153.6 : 1447841081.0
143.6 : 1447841321.0
133.6 : 1447841561.0
123.6 : 1447841801.0
113.6 : 1447842041.0
103.6 : 1447842281.0
93.6 : 1447842521.0
83.6 : 1447842761.0
83.6 : 1447843001.0
63.6 : 1447843242.0
43.6 : 1447843481.0
23.6 : 1447843722.0
3.6 : 1447843962.0
0.0 : 1447844202.0
-30.0 : 1447844442.0
-60.0 : 1447844682.0
-90.0 : 1447844922.0
-120.0 : 1447845162.0
-150.0 : 1447845402.0
starting angle scan for FREQ_INDEP_SQZ with zm4 psams at 6.2, zm5 psams at -0.4183.6 : 1447846542.0
173.6 : 1447846782.0
163.6 : 1447847022.0
153.6 : 1447847263.0
143.6 : 1447847502.0
133.6 : 1447847743.0
123.6 : 1447847983.0
113.6 : 1447848223.0
103.6 : 1447848463.0
93.6 : 1447848703.0
93.6 : 1447848943.0
73.6 : 1447849183.0
53.6 : 1447849423.0
33.6 : 1447849663.0
13.6 : 1447849904.0
0.0 : 1447850143.0
-30.0 : 1447850384.0
-60.0 : 1447850624.0
-90.0 : 1447850864.0
-120.0 : 1447851104.0
-150.0 : 1447851344.0
Got one more scan with good alignment for ZM5 psams at -4.5. There was a no sqz time when the nlg was measured a few minutes before this, but times aren't recorded in the log so I'll have to go find the times later.
starting angle scan for FIS with zm4 psams at 6.2, zm5 psams at -4.5169.4 : 1447867479.0
159.4 : 1447867659.0
149.4 : 1447867839.0
139.4 : 1447868019.0
129.4 : 1447868199.0
119.4 : 1447868379.0
109.4 : 1447868559.0
99.4 : 1447868739.0
89.4 : 1447868919.0
79.4 : 1447869099.0
79.4 : 1447869279.0
59.4 : 1447869459.0
39.4 : 1447869640.0
19.4 : 1447869819.0
0.0 : 1447870000.0
-30.0 : 1447870180.0
-60.0 : 1447870360.0
-90.0 : 1447870540.0
-120.0 : 1447870720.0
-150.0 : 1447870900.0


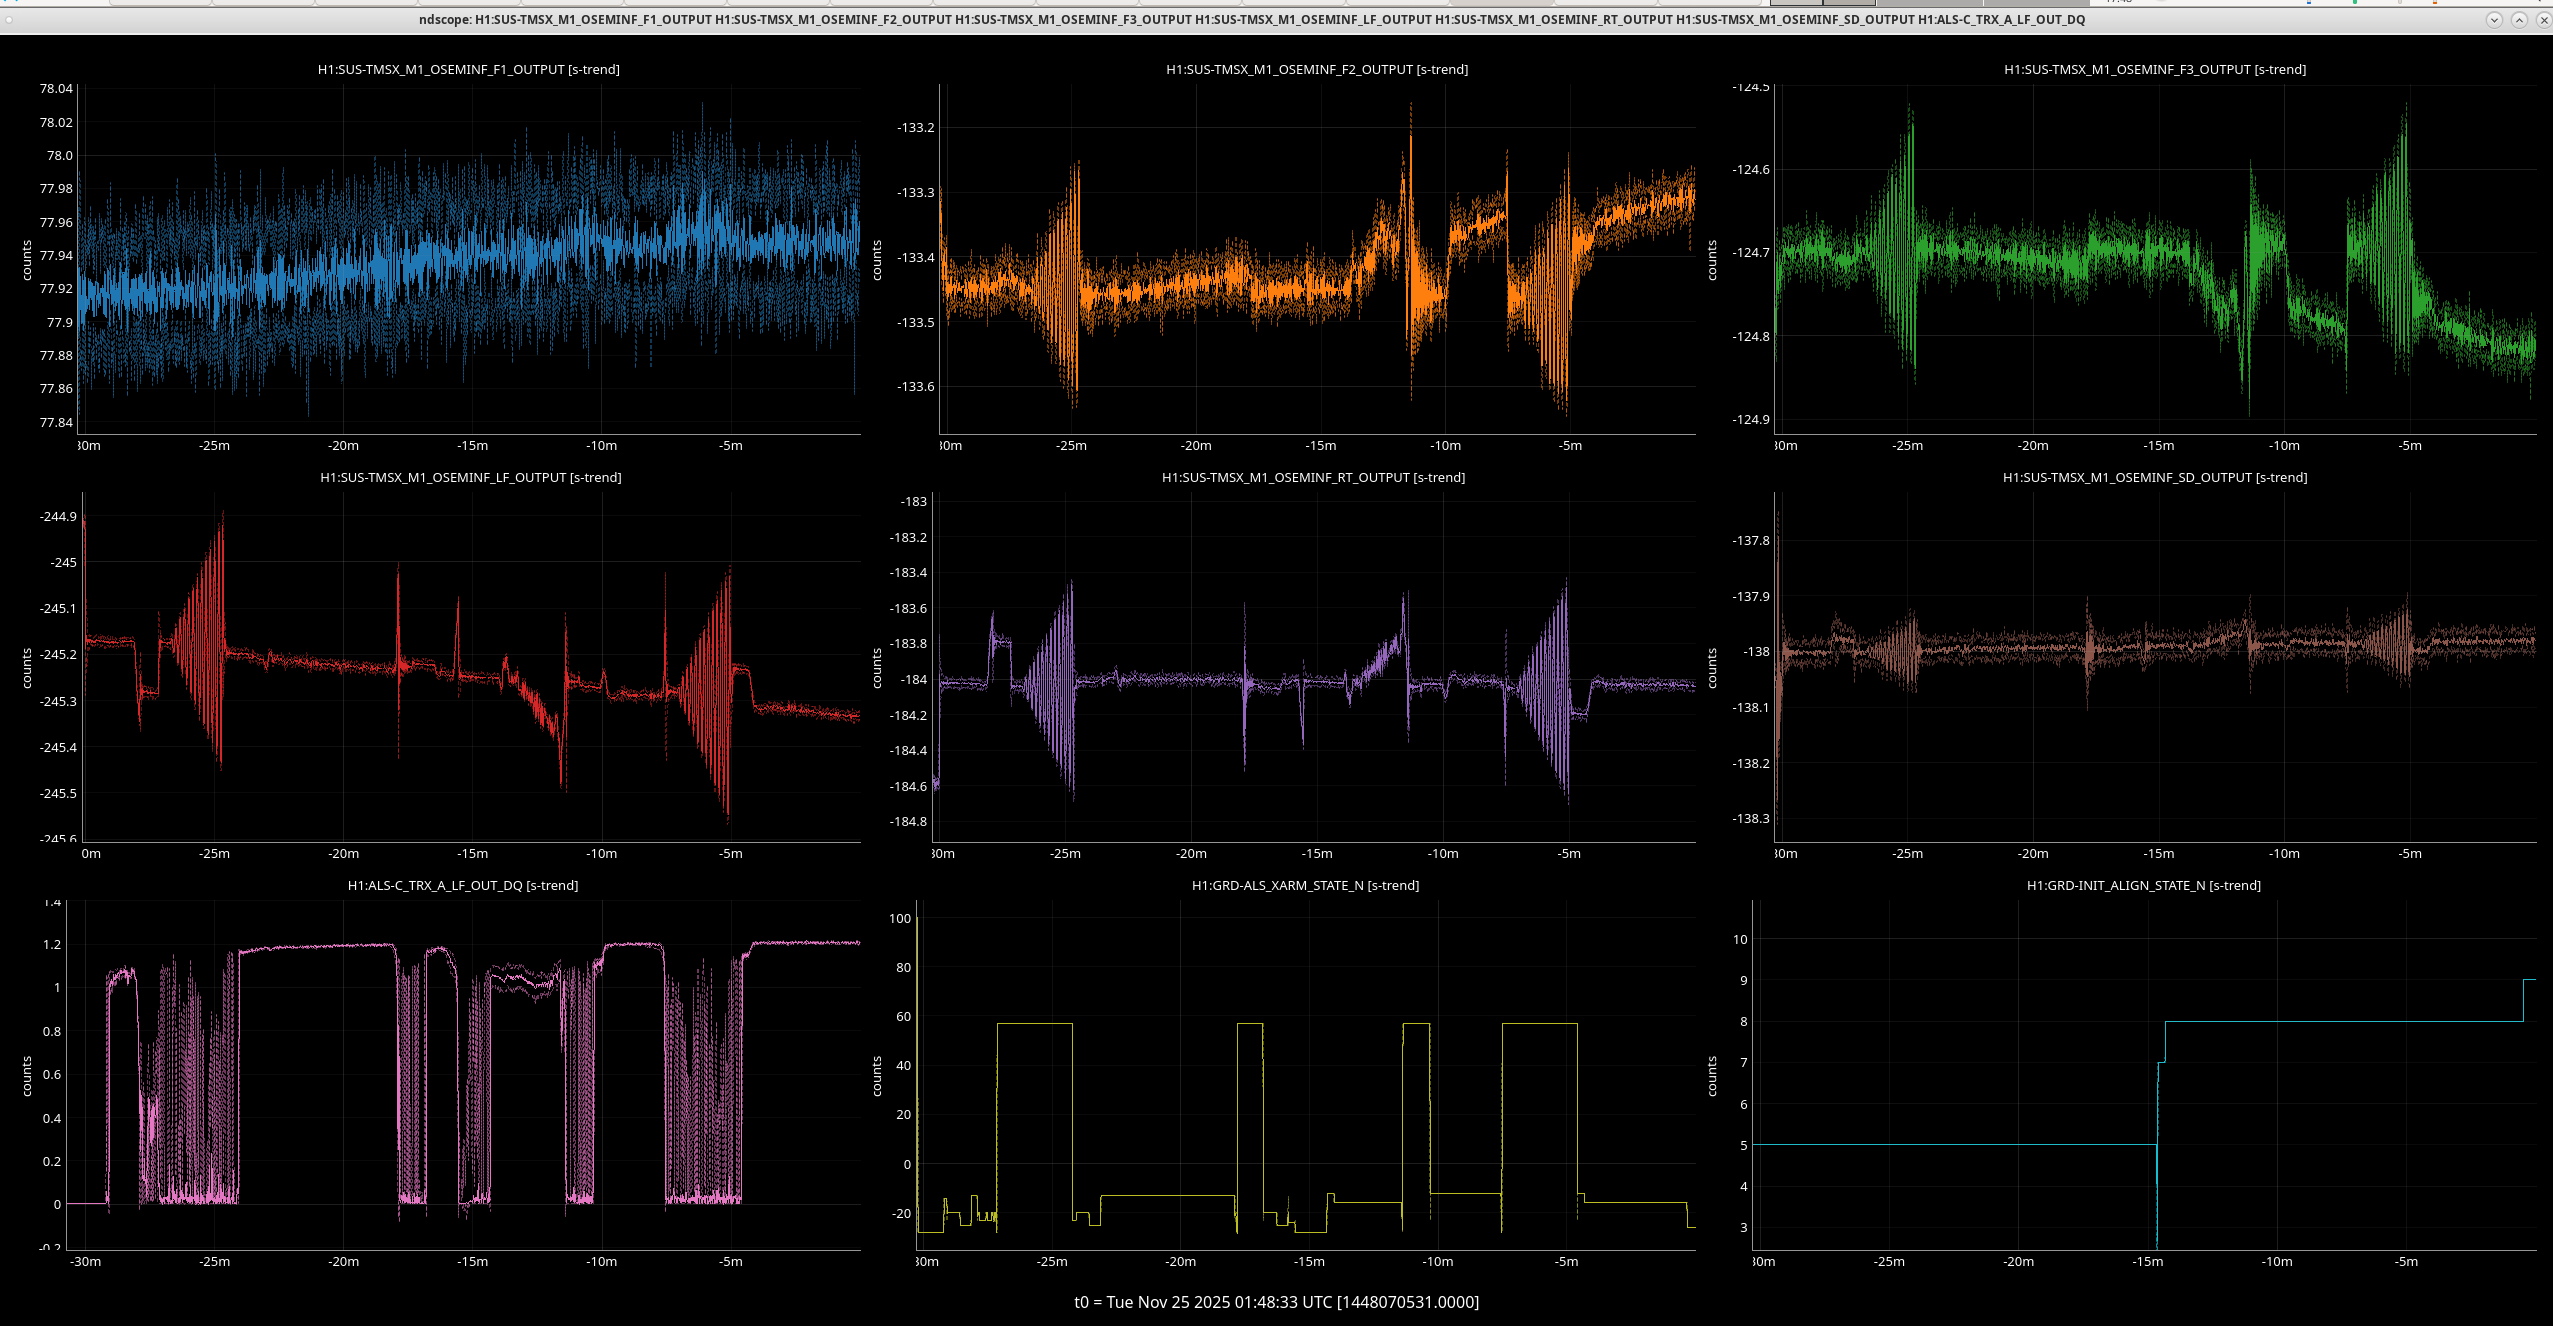
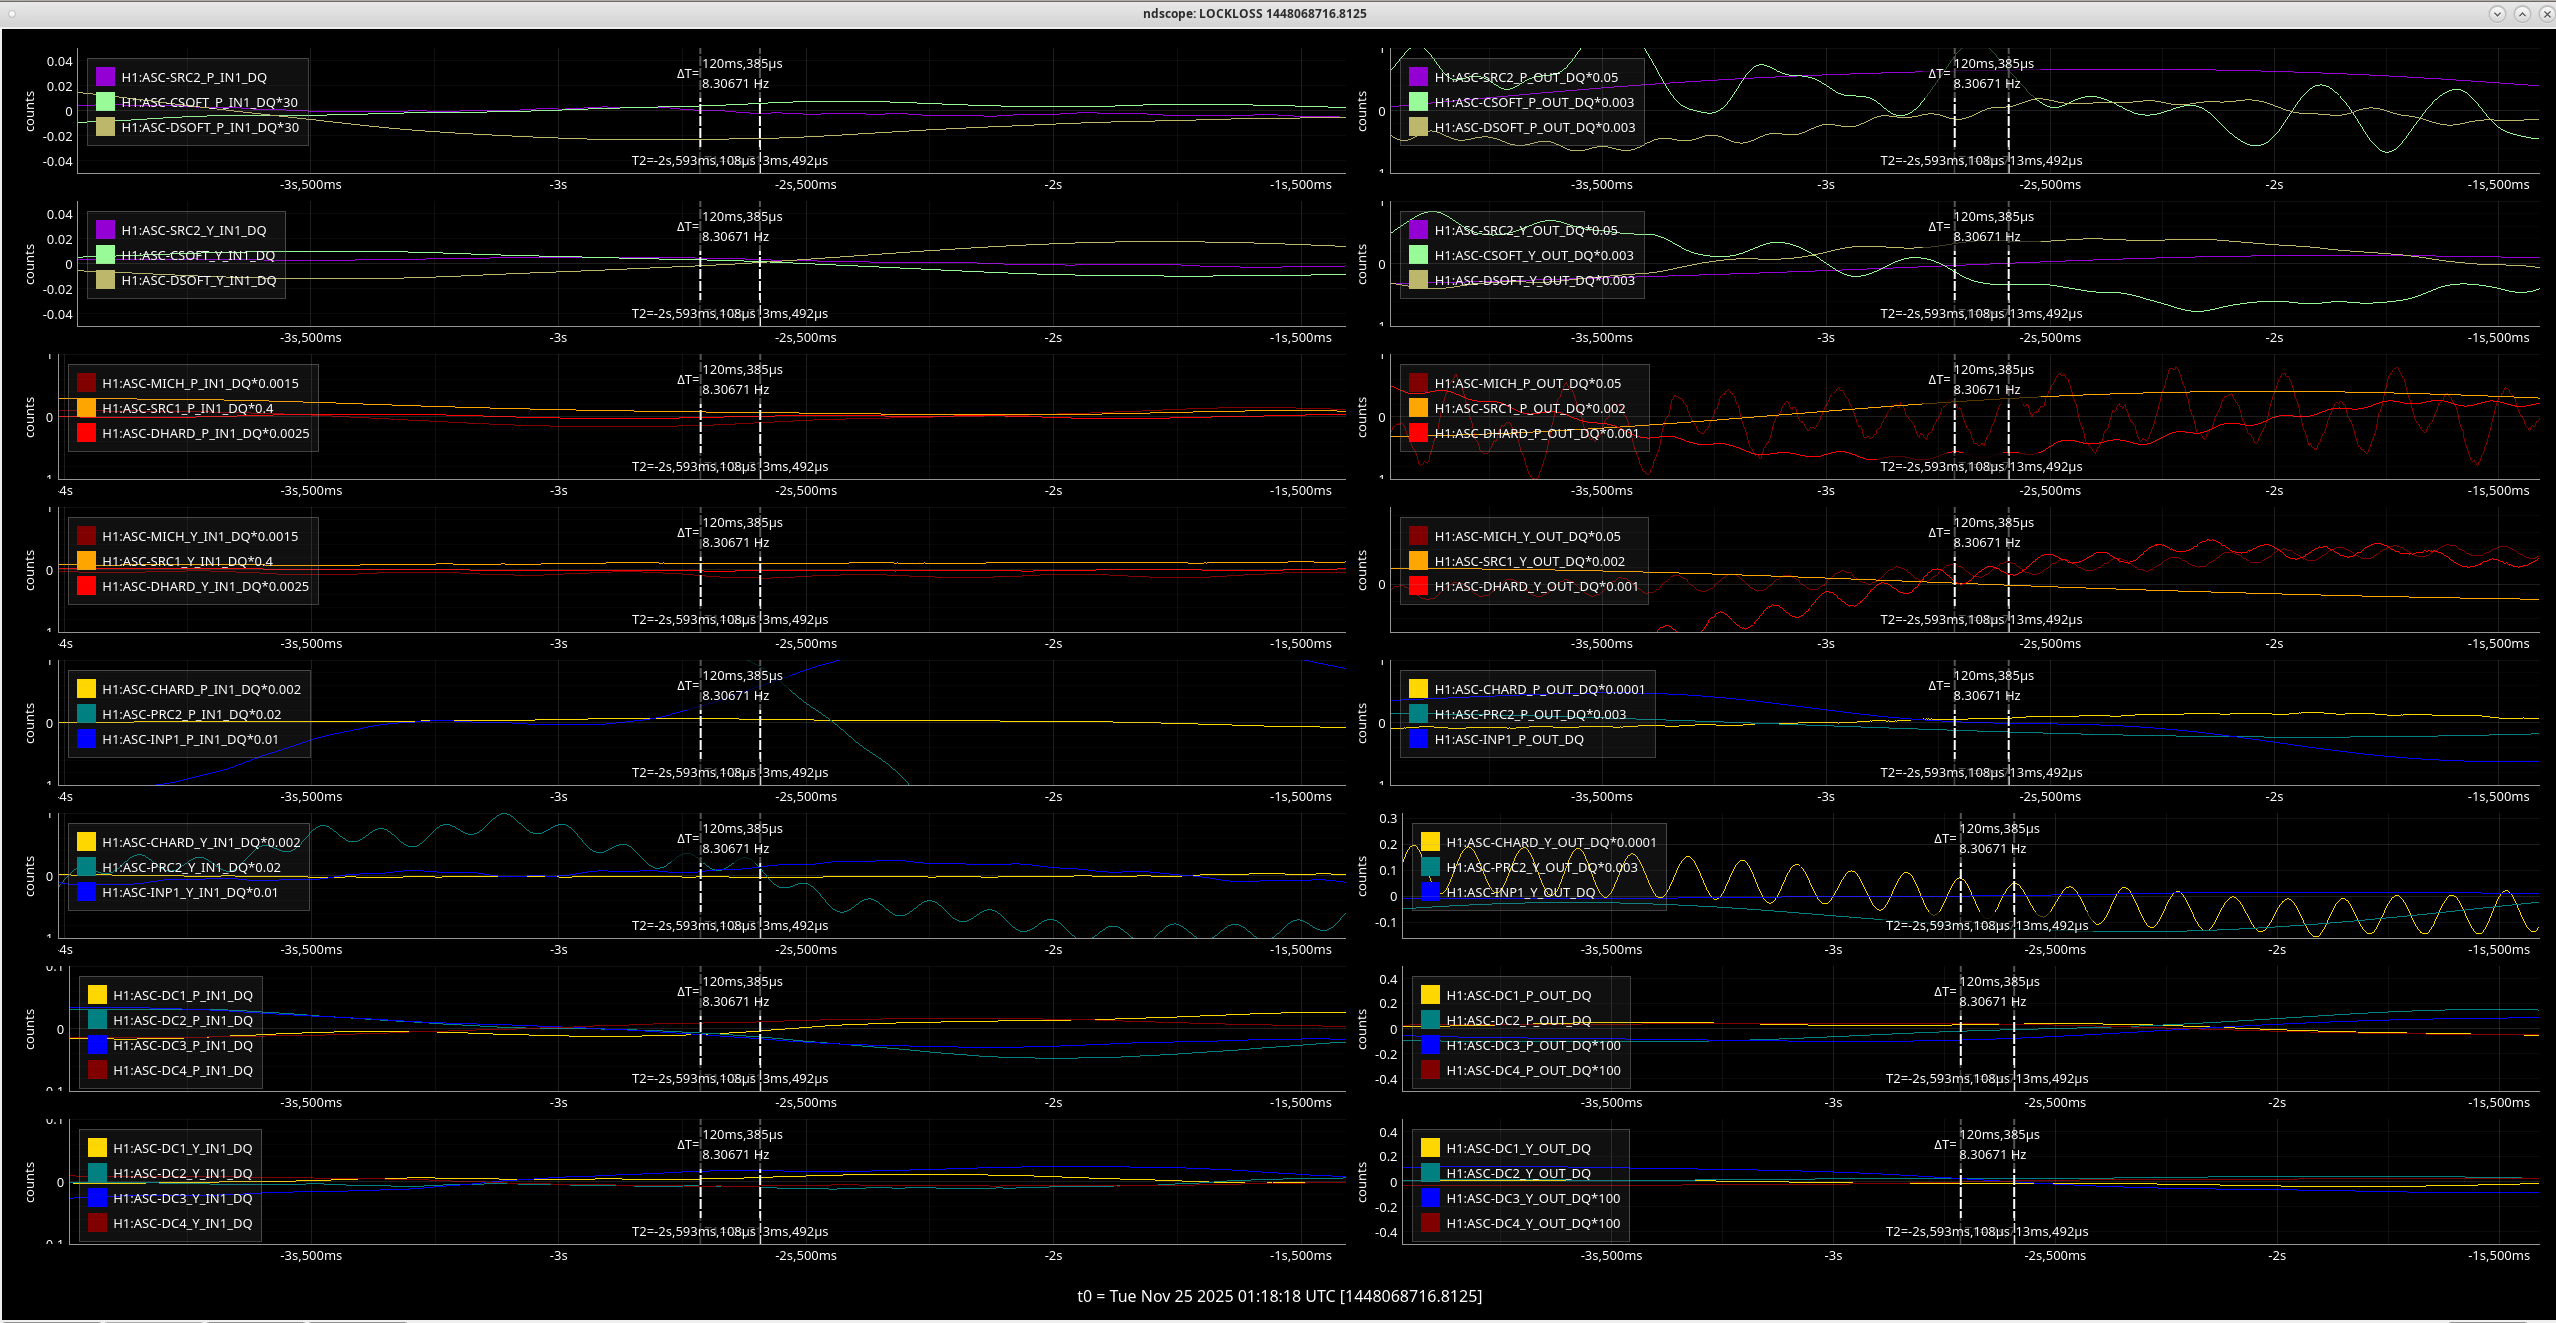
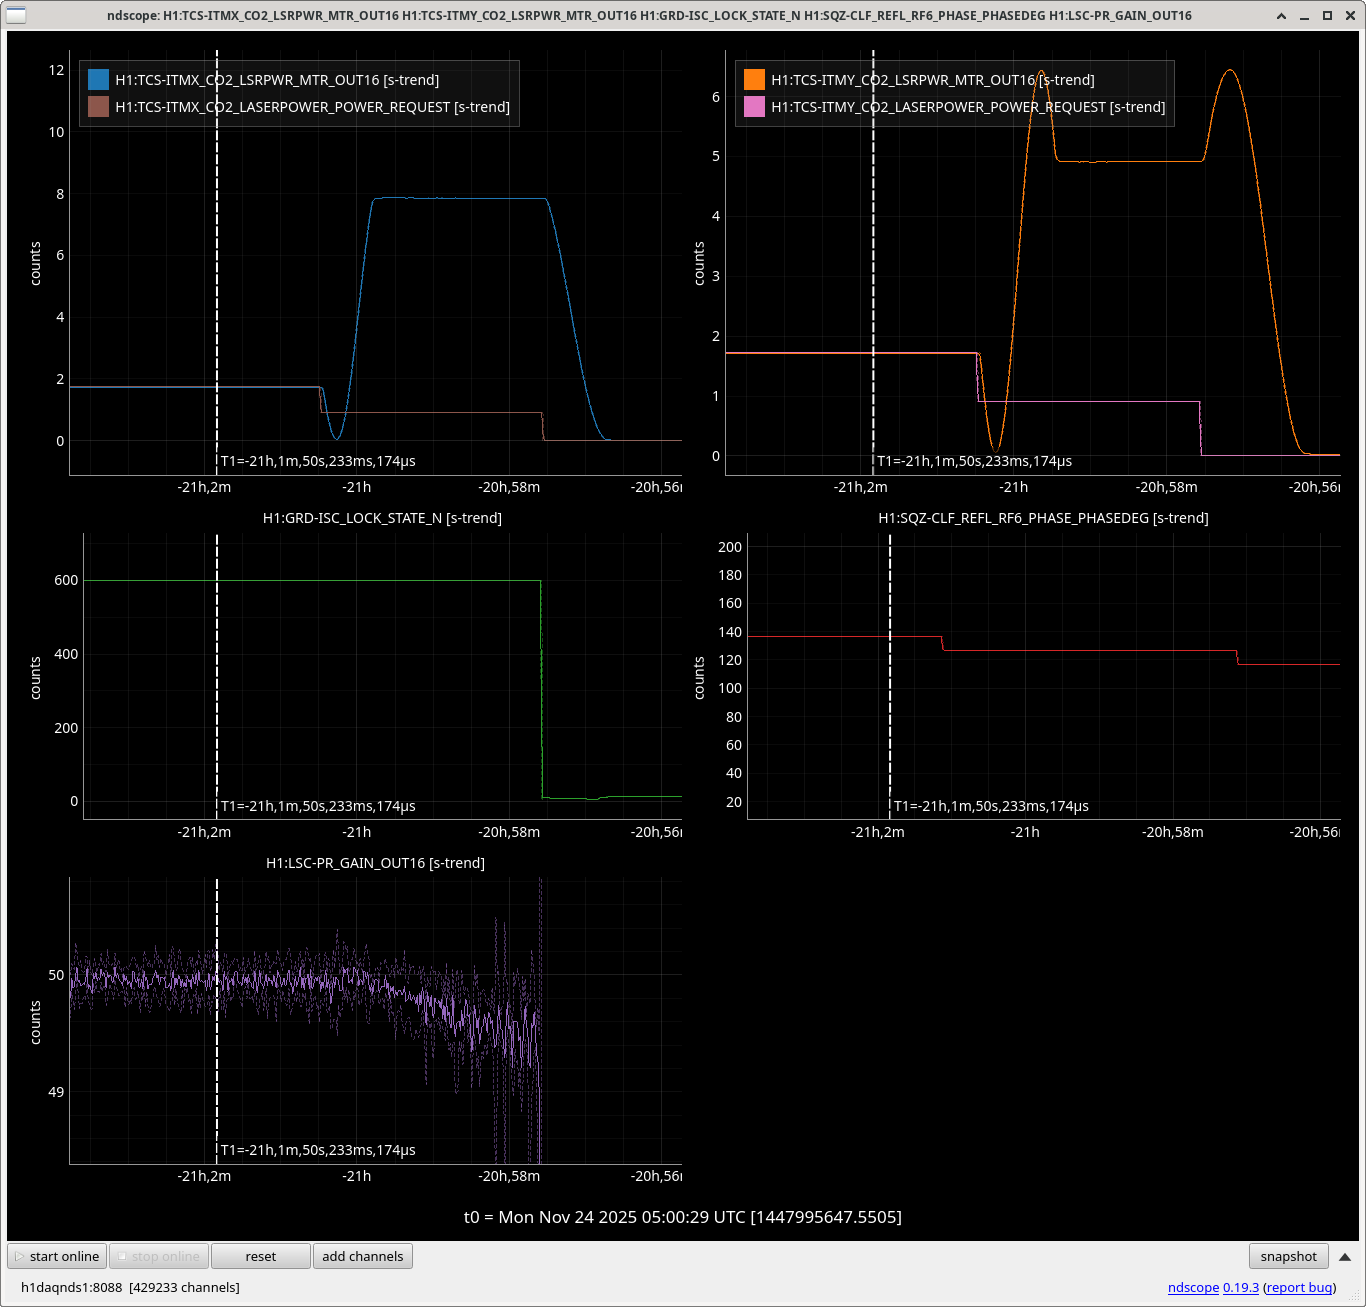
Lost lock at 15:58 UTC, assuming due to people out in the LVEA near BSC1/2.