Elenna, Jeff, Oli
After Elenna updated the DHARD phasing (87063), the ETMY roll mode started ringing up. The previous settings we had on it were +30 deg and G = 40. We started testing out different settings to try and damp it, and along the way we changed a few other things.
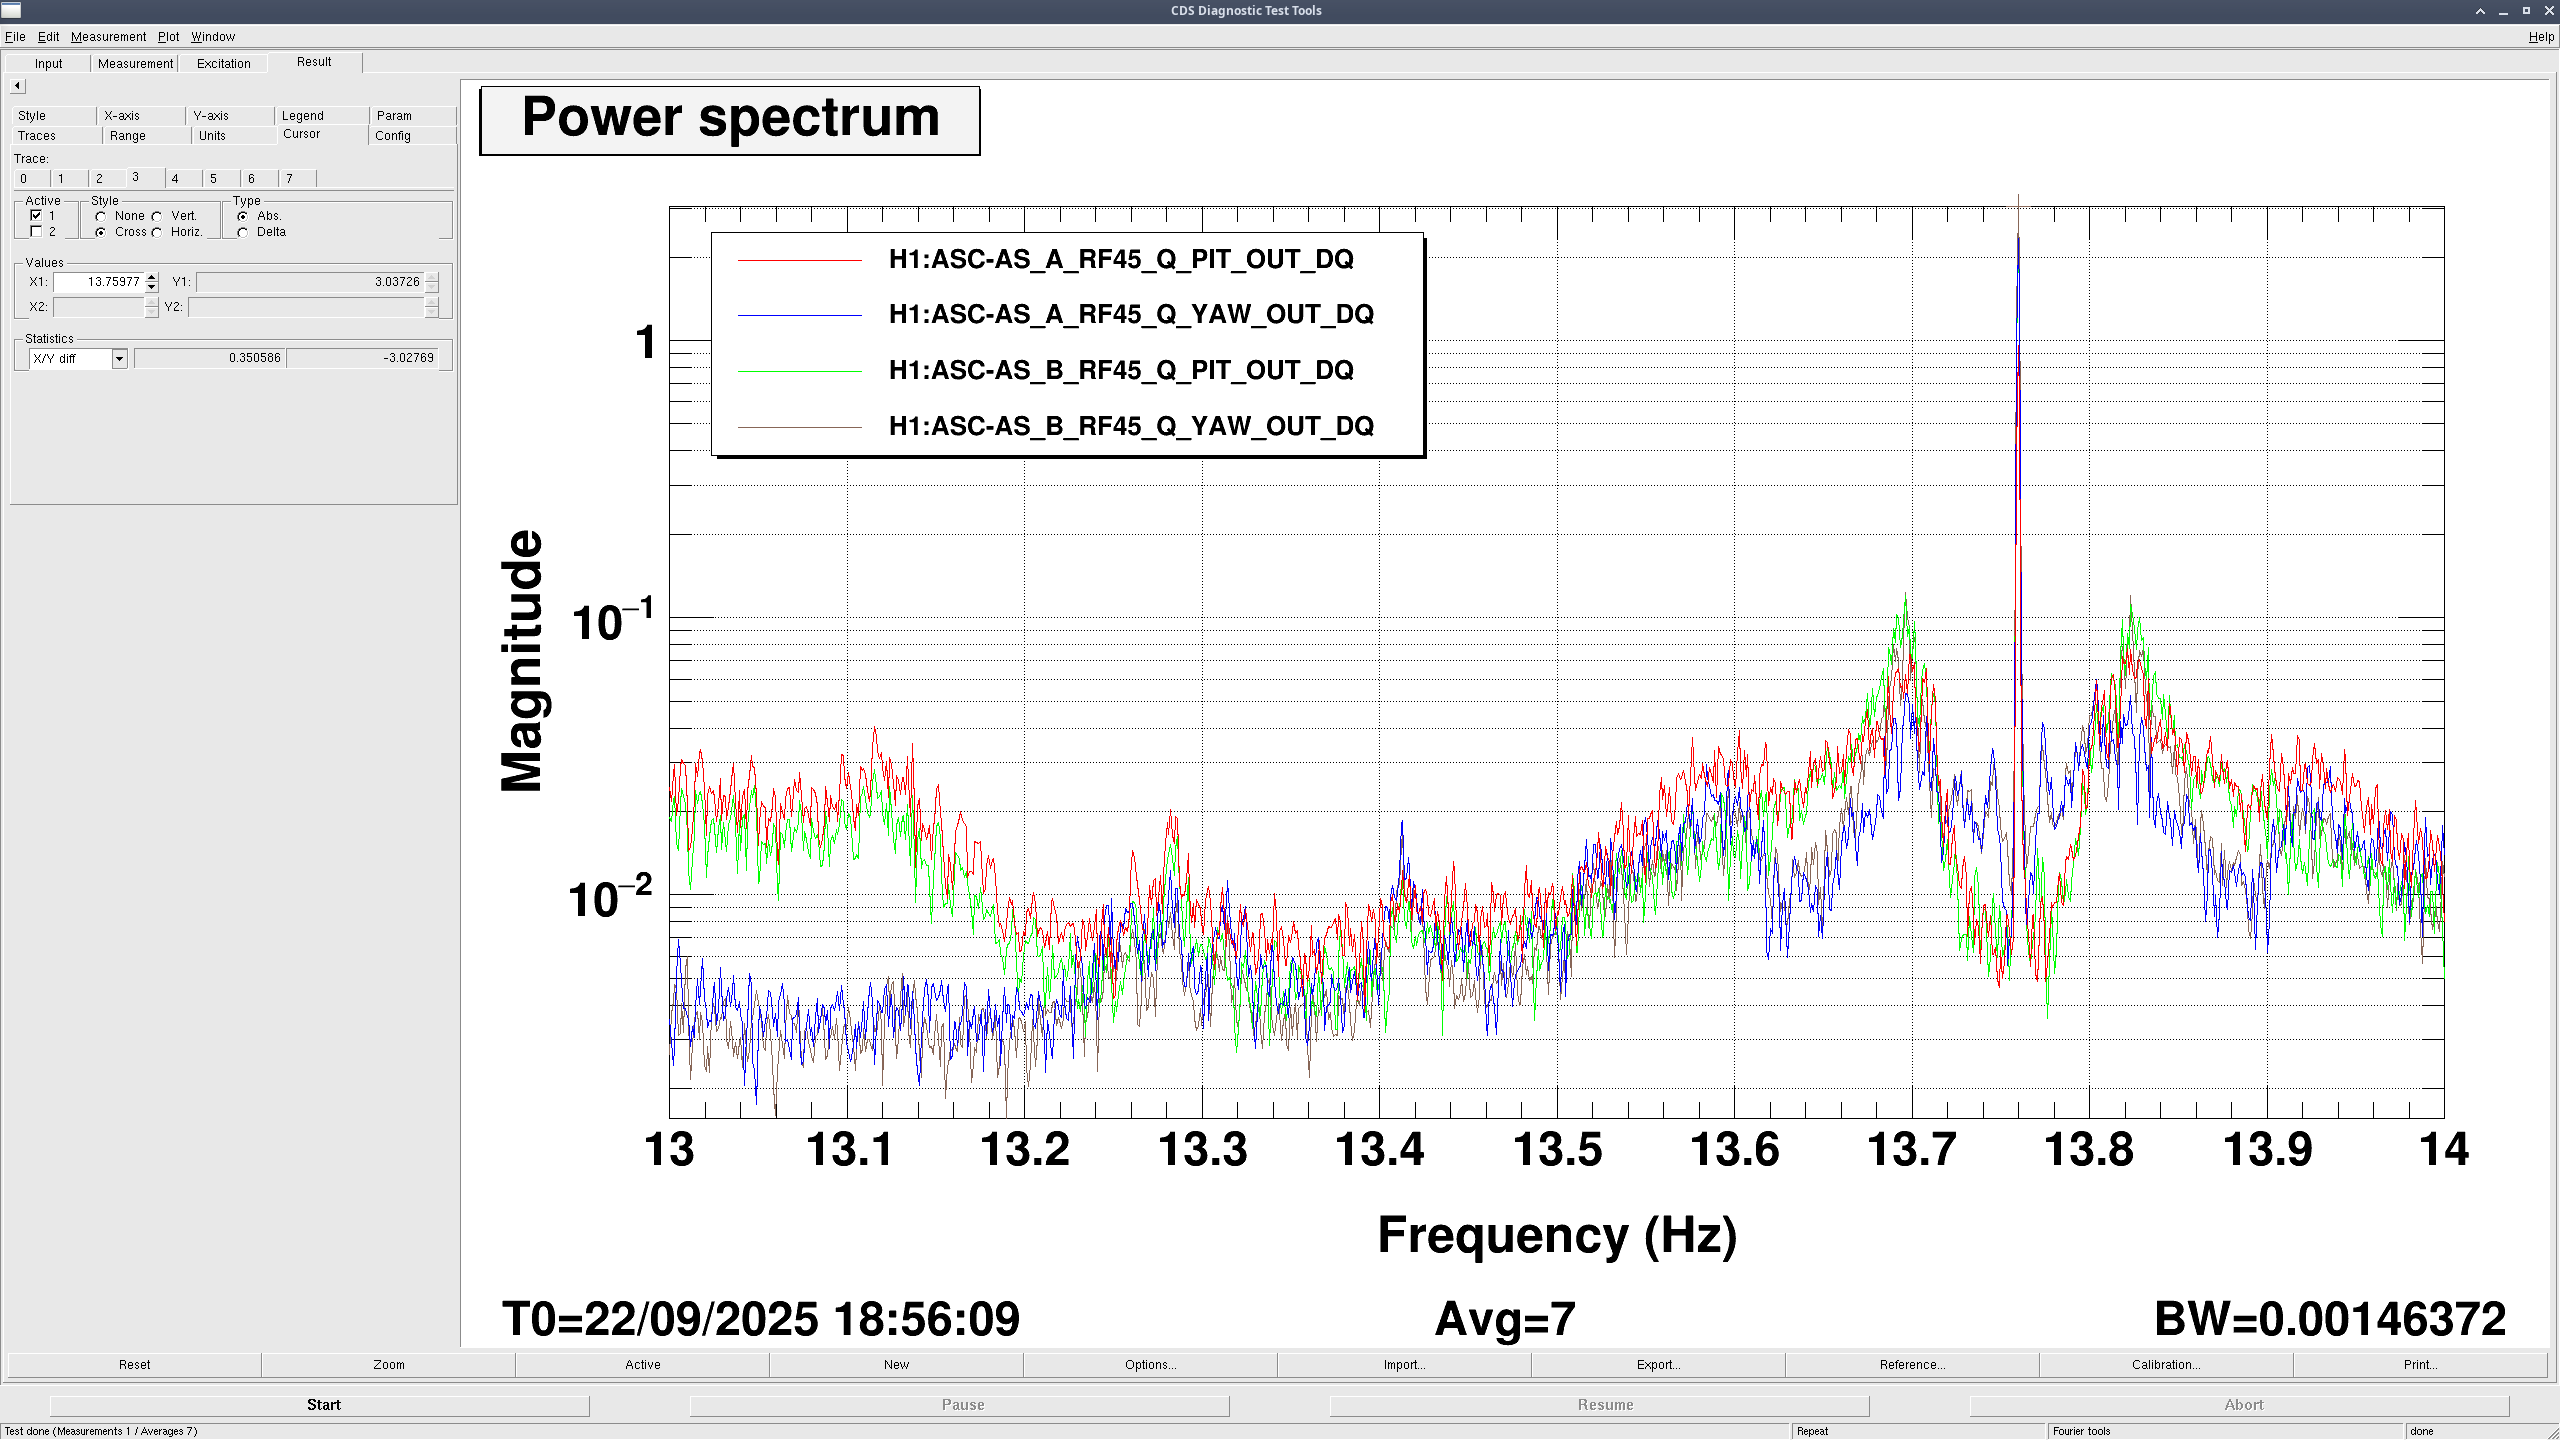
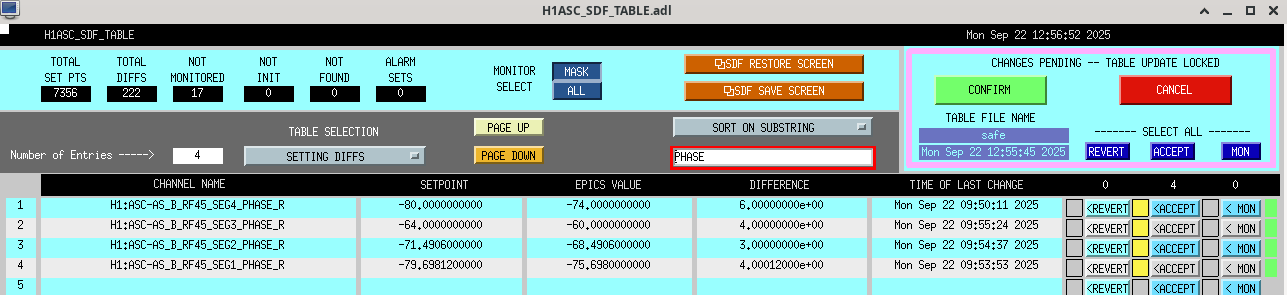
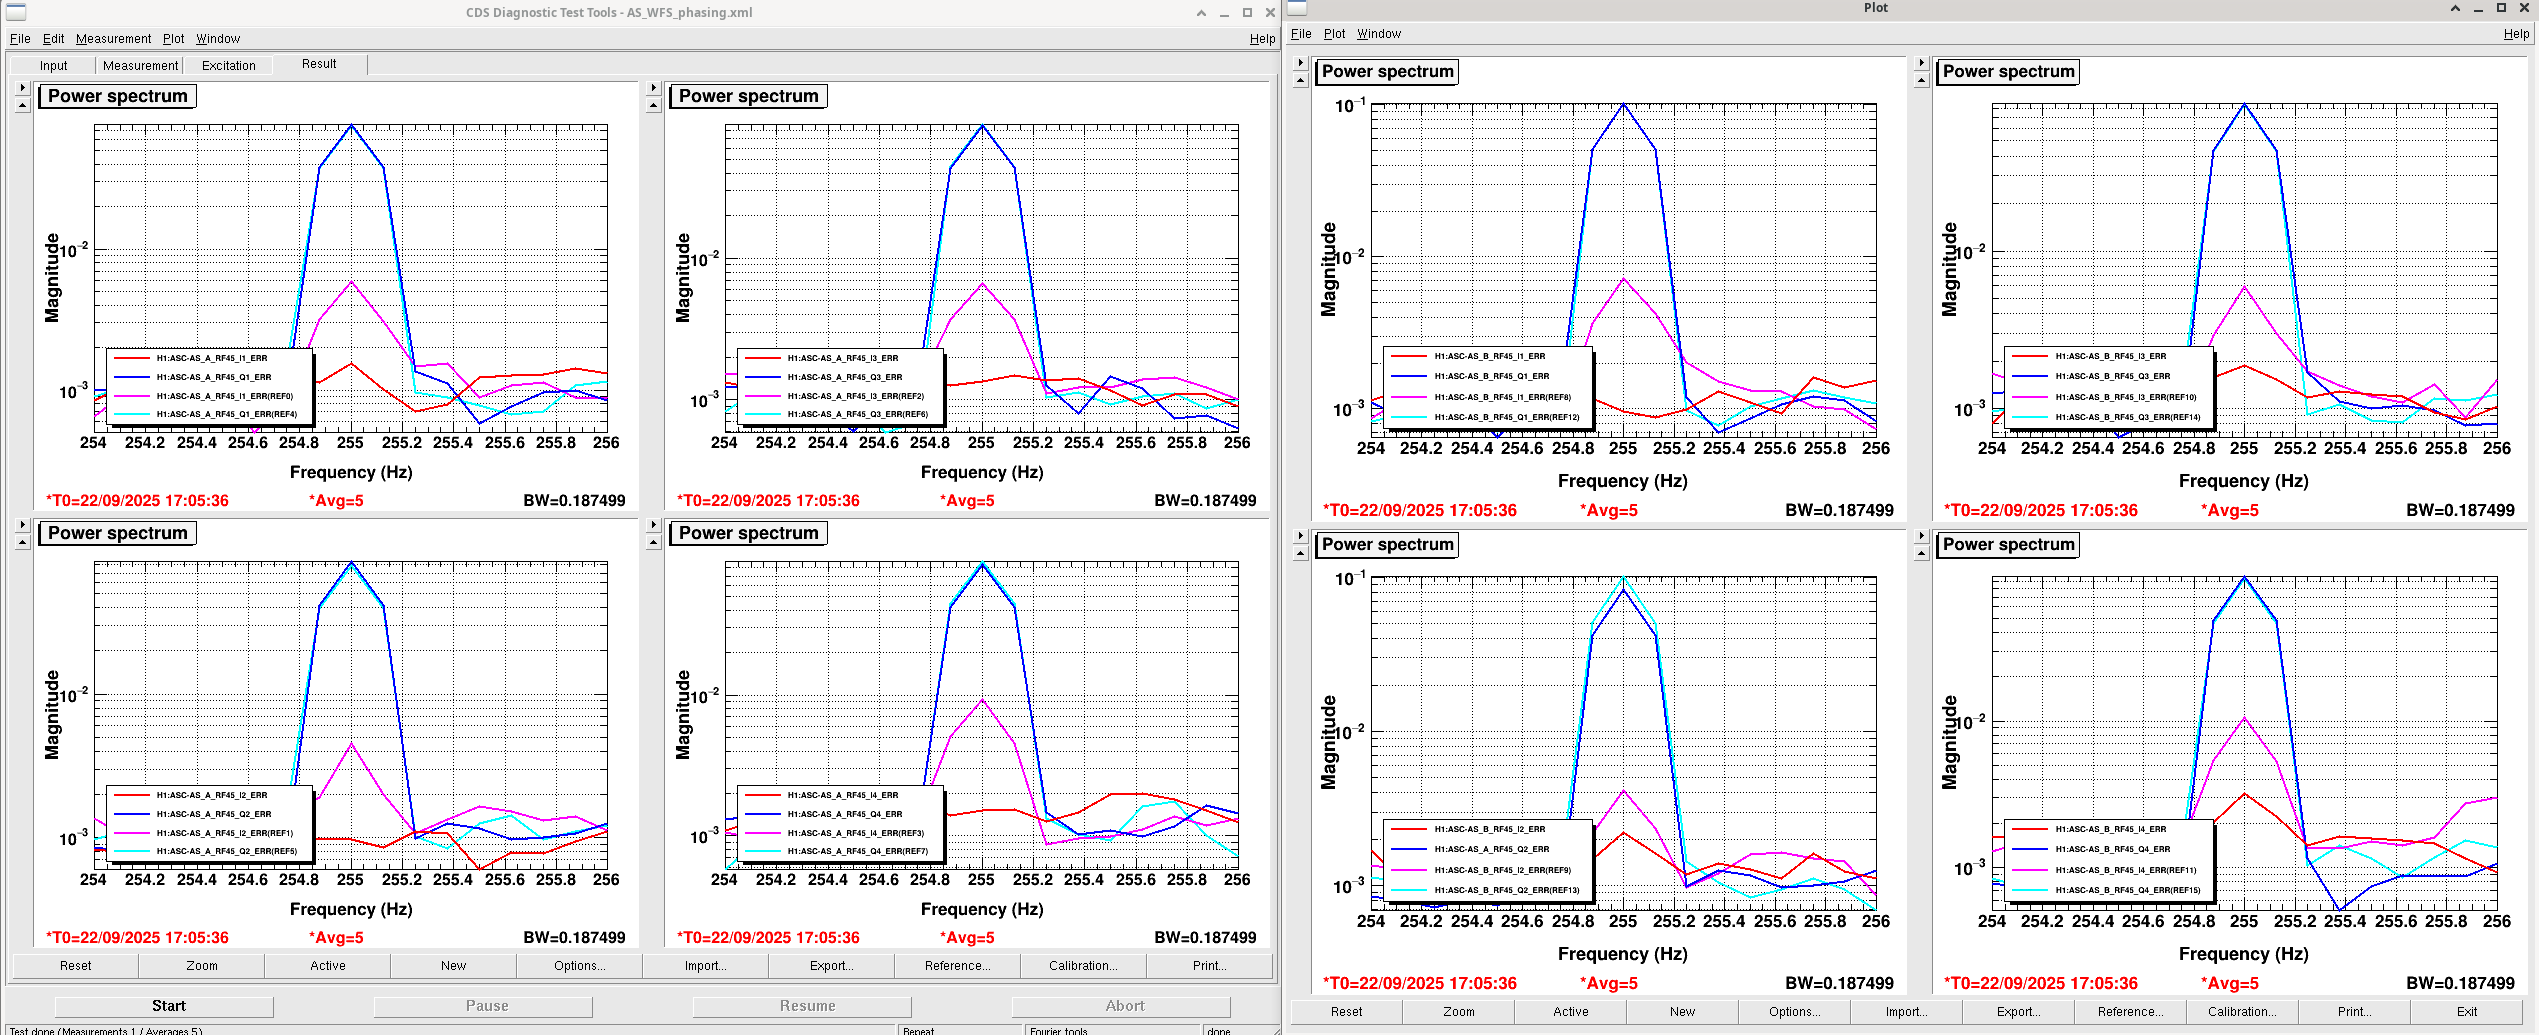
First, we plotted ASC-AS_{A,B}_RF45_Q_{PIT,YAW} and found that AS 45Q WFS B YAW sees this roll mode better than WFS A YAW, which is what we had it on before, so we swapped to using that sensor in the AS WFS selector on the bounce and roll monitor screen and that has been accepted into sdf.
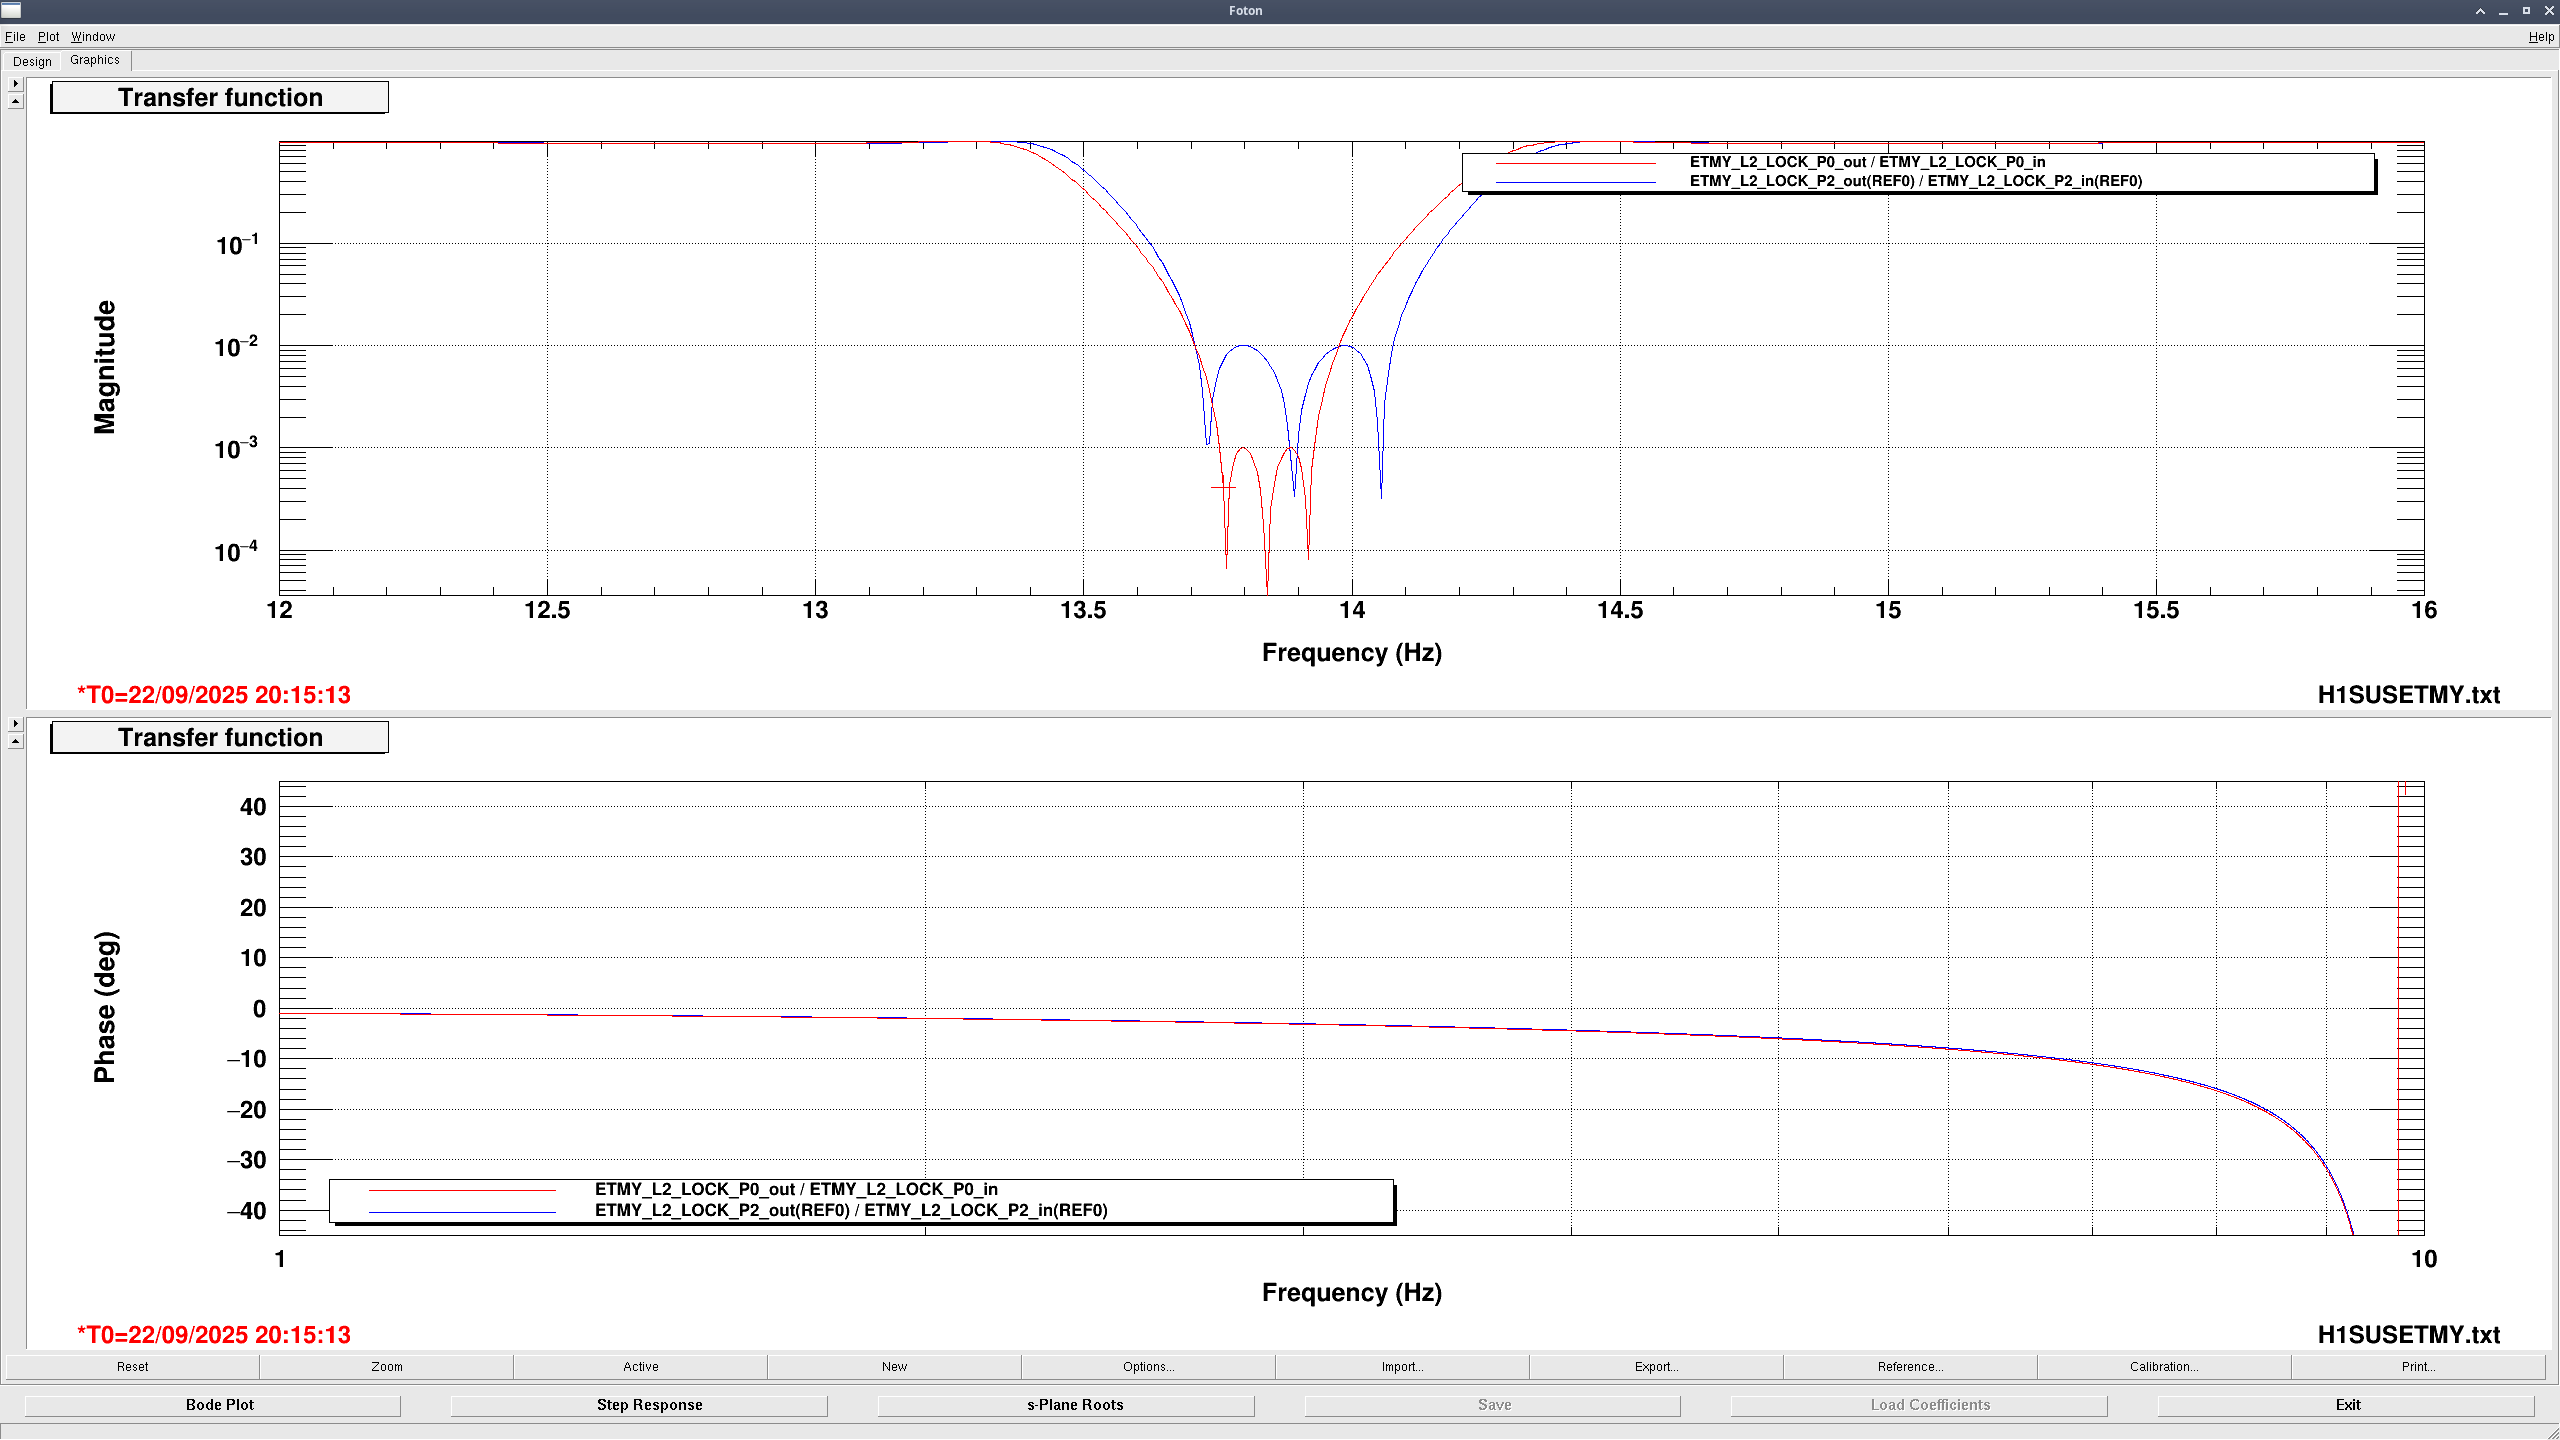
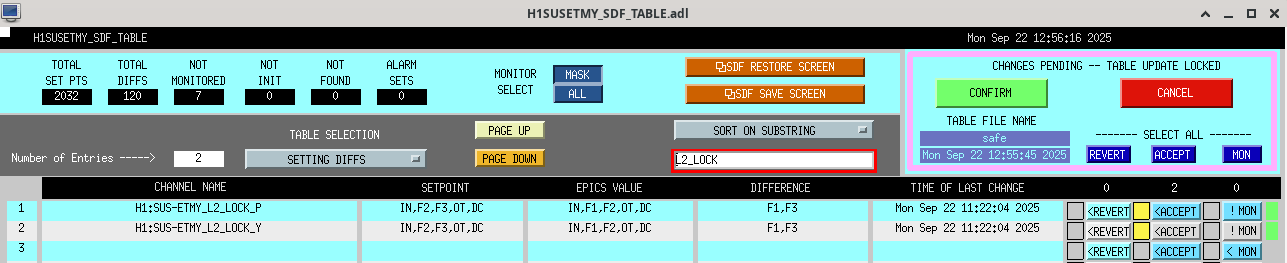
Then, we saw that the current Bounce & Roll filter in ETMY_L2_LOCK_{P,Y}, EvanBR (FM3), wasn't notching out the ISC control signal as much as we would like, so Elenna and Jeff created a new filter, OliBR (FM1), that filters out more of the control noise to a magnitude better than EvanBR. Here's the magnitude and phase difference between the two - where blue is EvanBR and red is OliBR. The cursor on the magnitude plot is at the frequency that this mode is at, 13.75977 Hz. Note that the phase plot shows different x limits on the frequency, as we wanted to show that we don't lose a lot of phase margin between the old and new filters. We loaded this new filter in for ETMY L2 LOCK P and Y, and swapped over to using this filter module instead of FM3. These changes have been accepted in sdf.
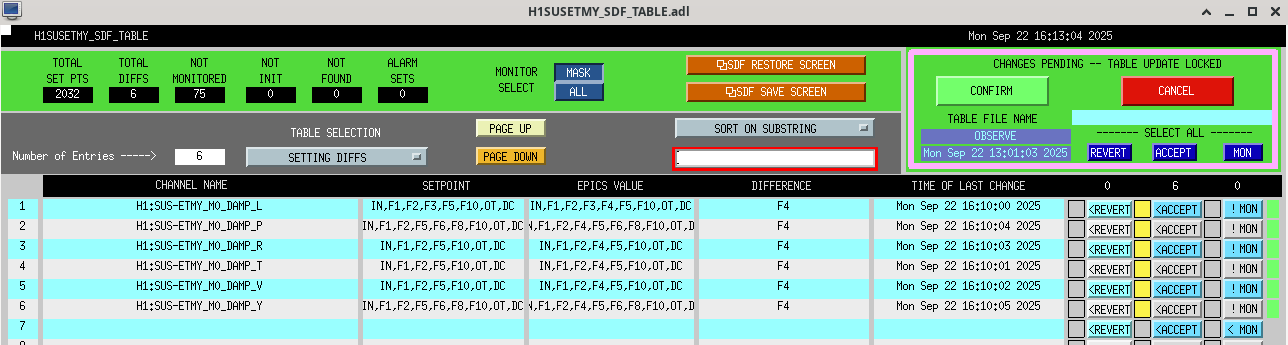
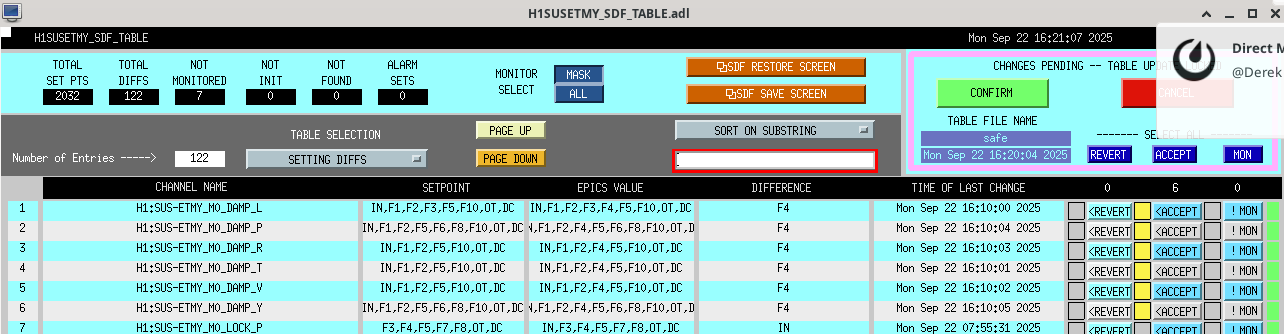
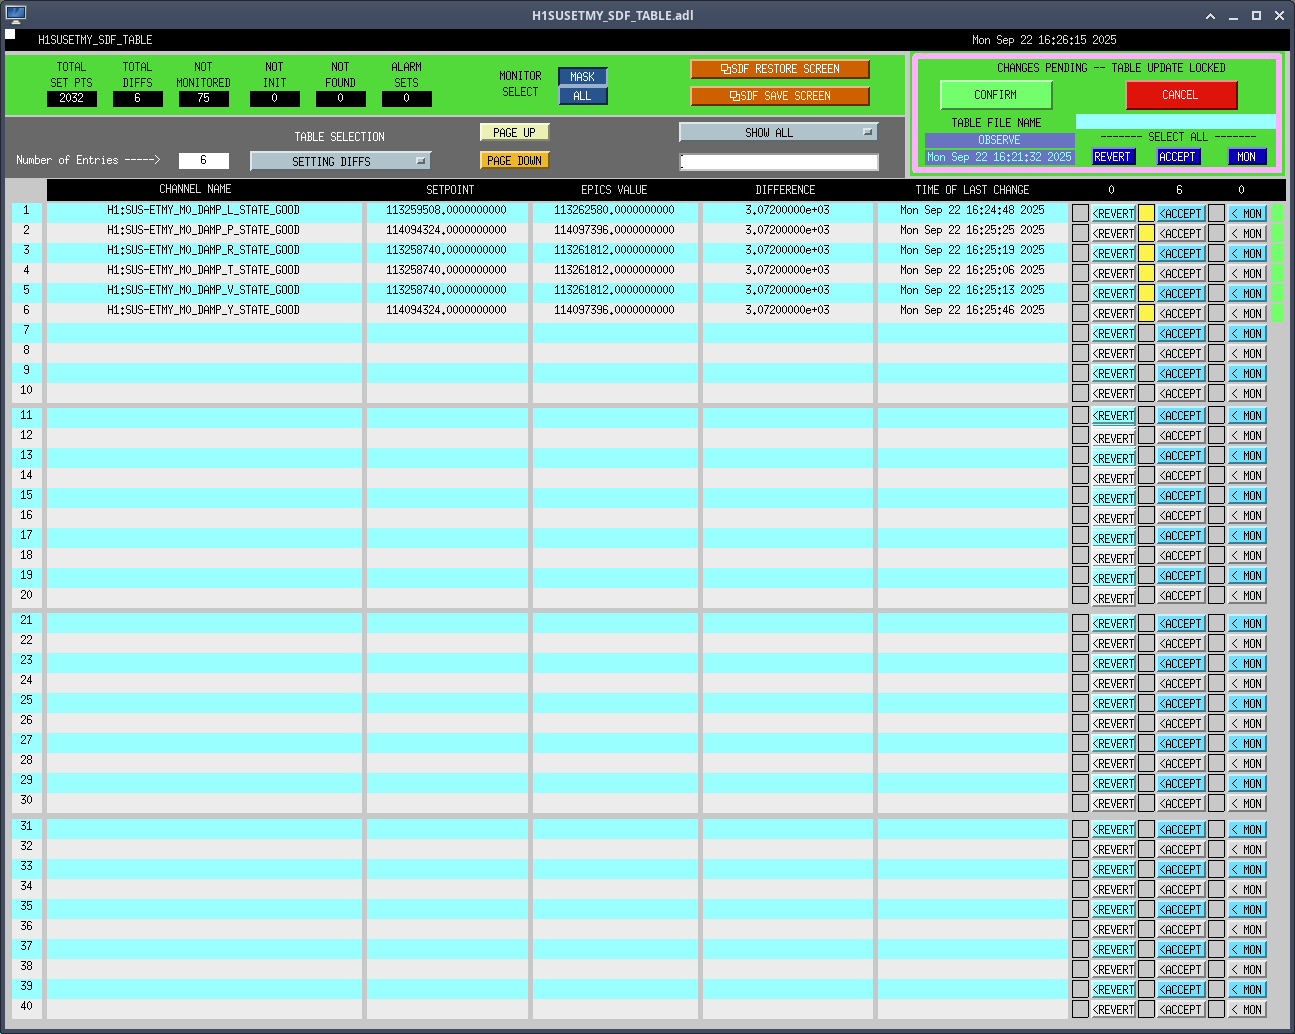
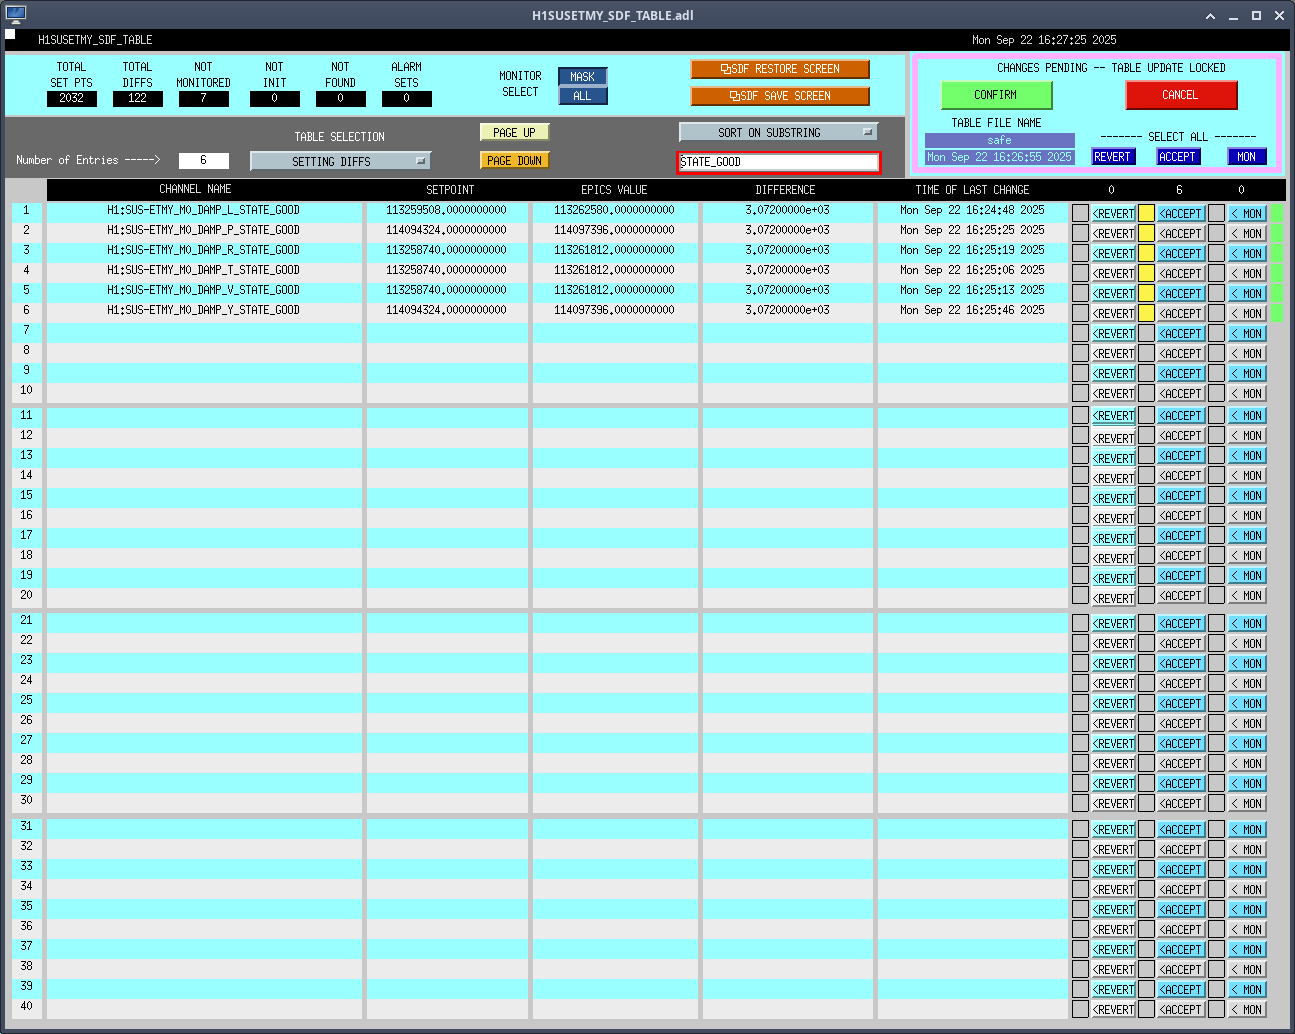
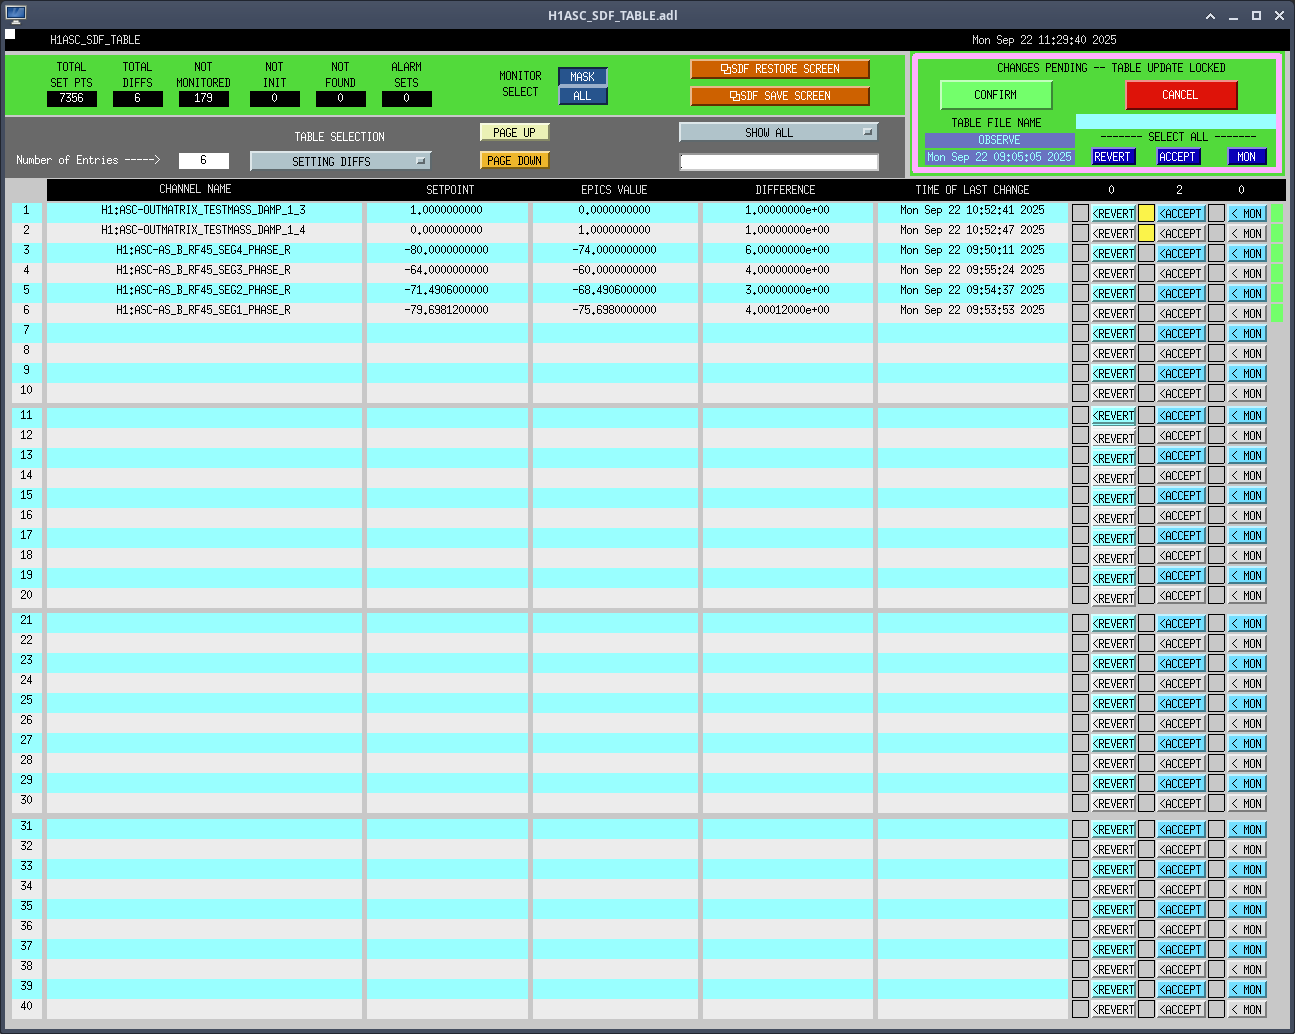
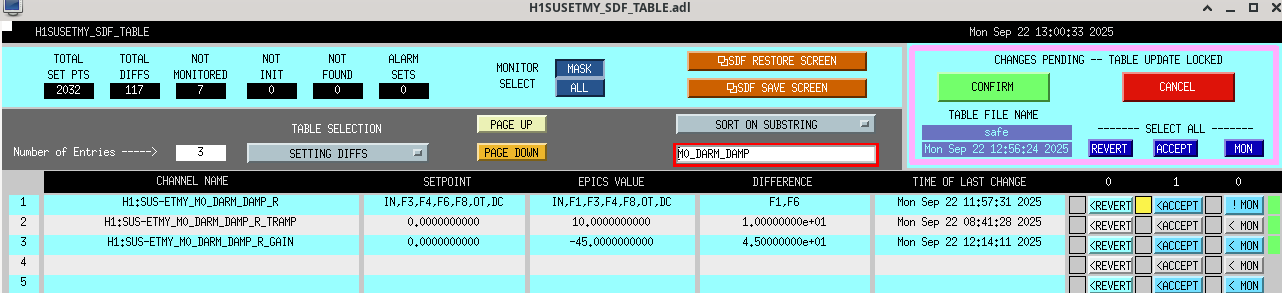
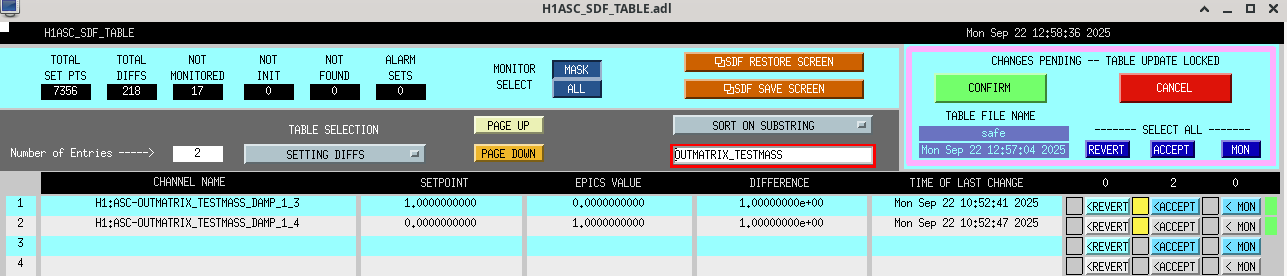
Finally, after lots of testing and installing this new filter, we were able to find damping settings that are working to damp ETMY. The new settings we found that worked to damp ETMY (slowly) is +60 deg, G = -45. We have been able to bump up the gain to G = -100 for a few minutes at a time to get a lot of damping for ETMY, although it also rings up ETMX a bit every time, so we are going between G = -45 and G = -100 to minimize that. We also unmonitored in OBSERVING ETMY_M0_DARM_DAMP_R and ETMY_M0_DARM_DAMP_R_GAIN in order to continue being able to work on damping while in Observing.