Jennie W, Sheila,
I took a long time to post this as have been working on other things...
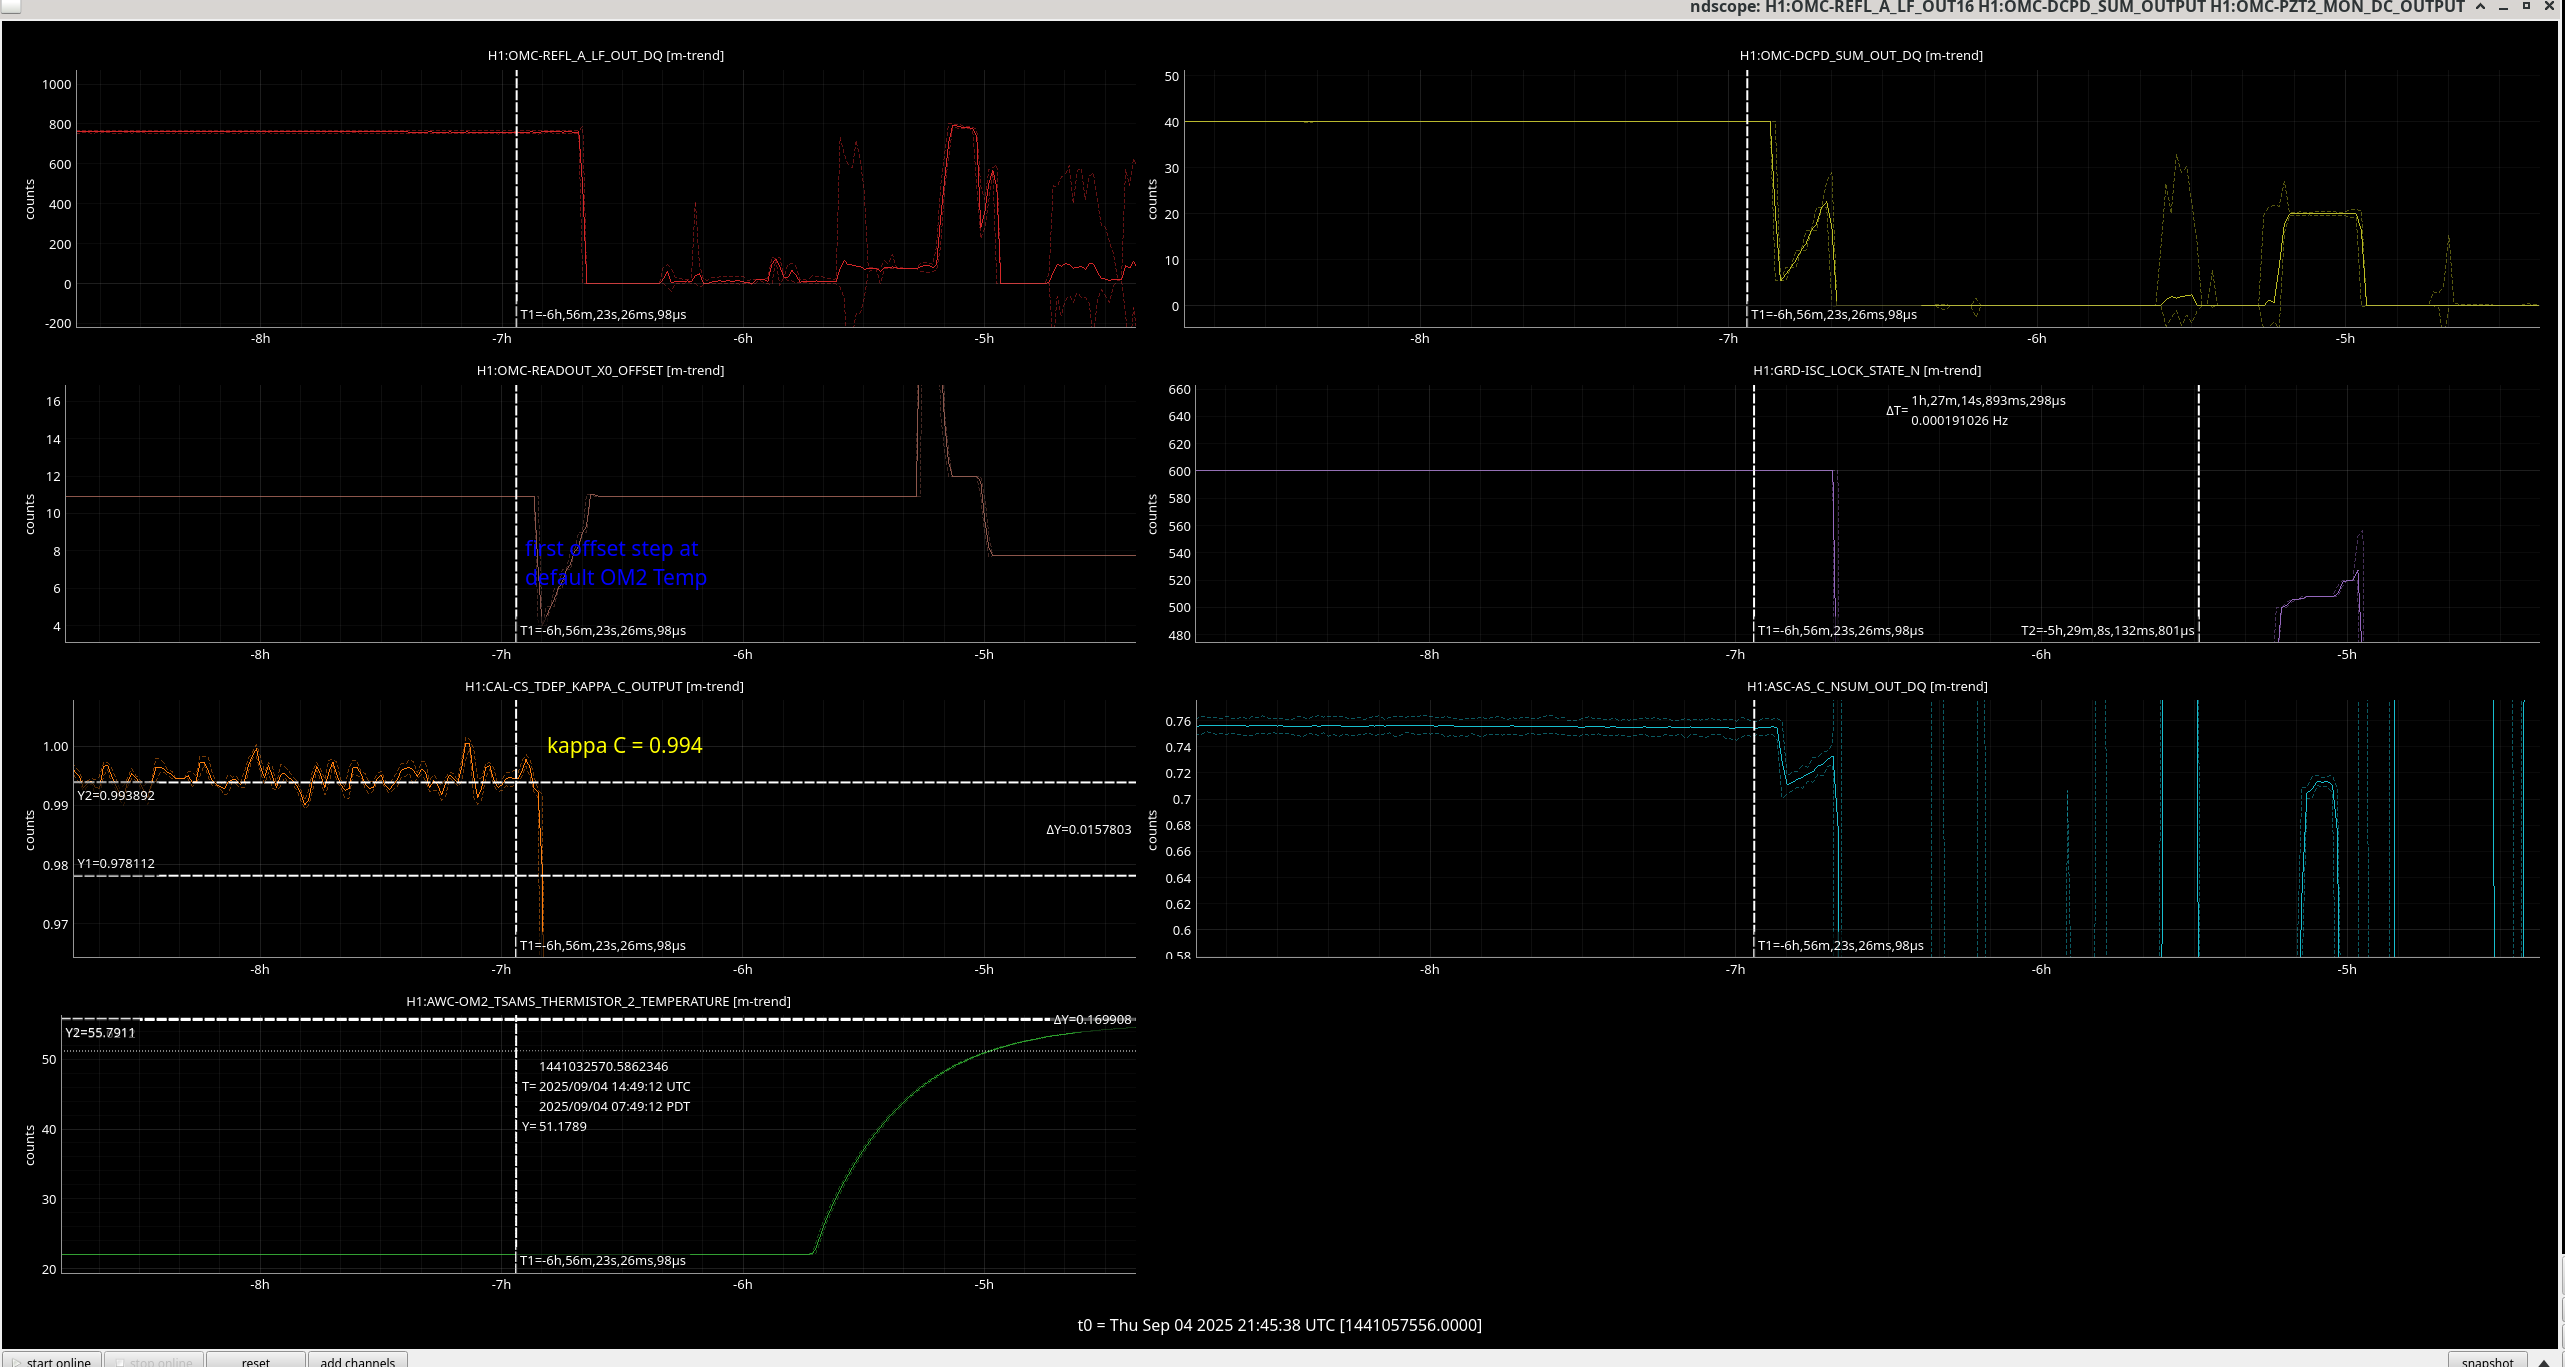
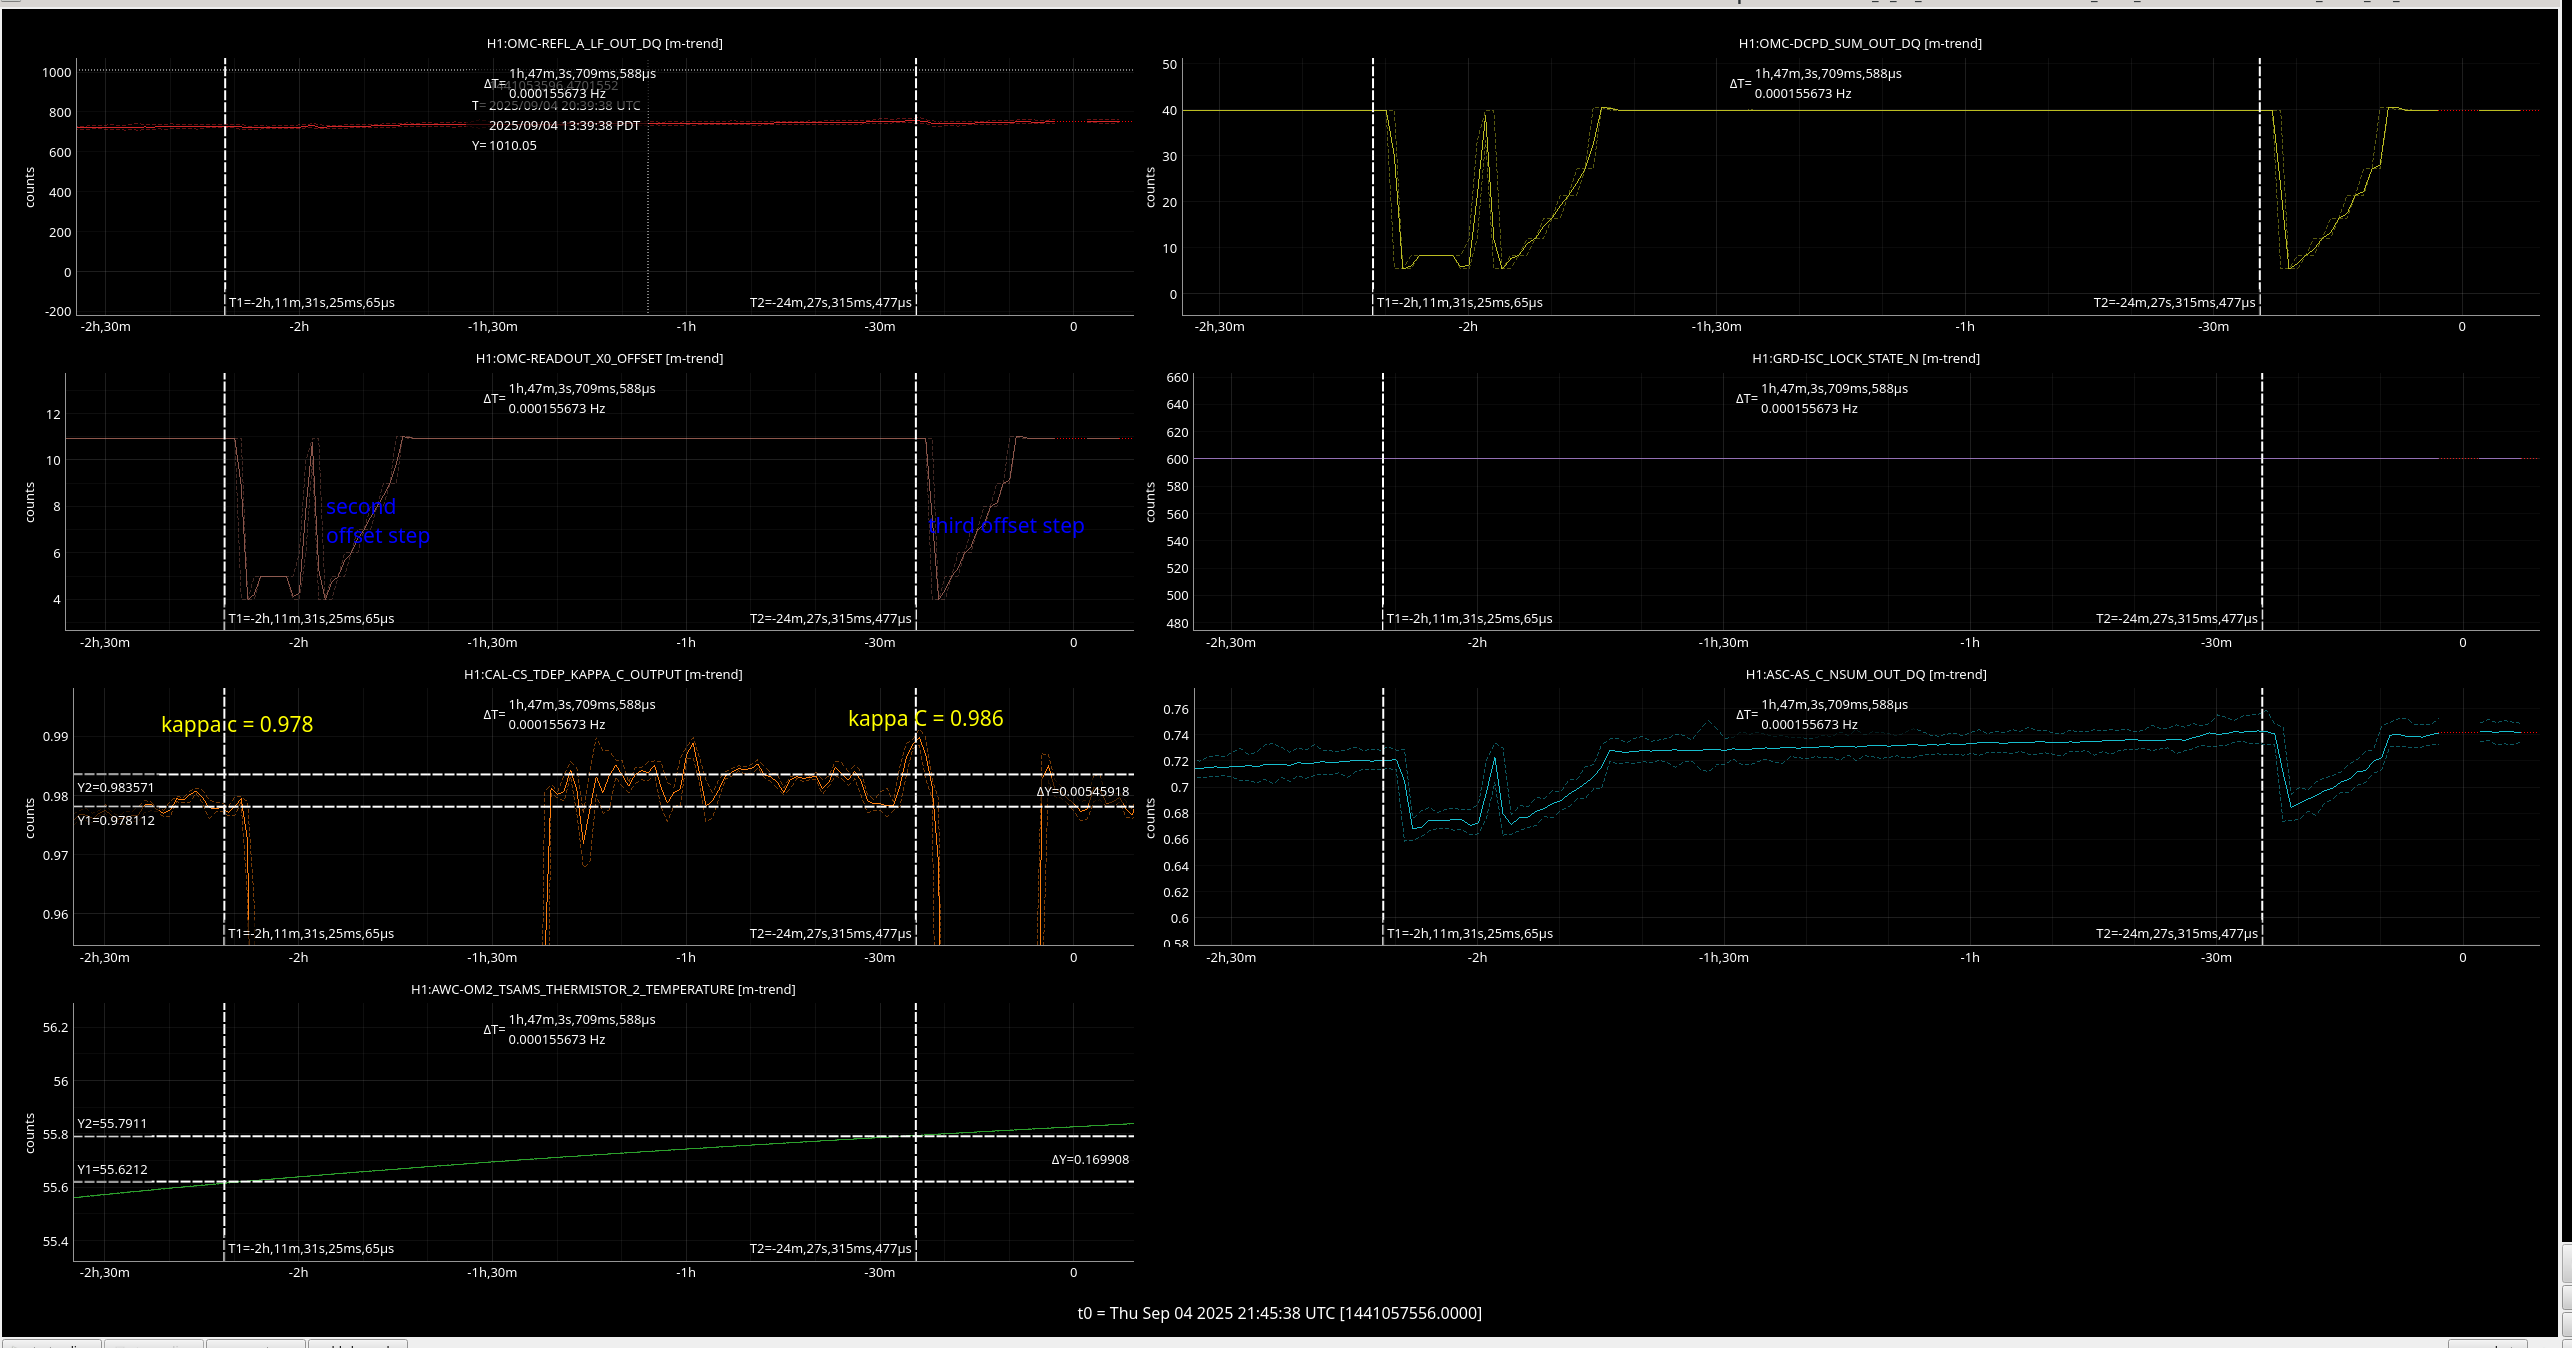
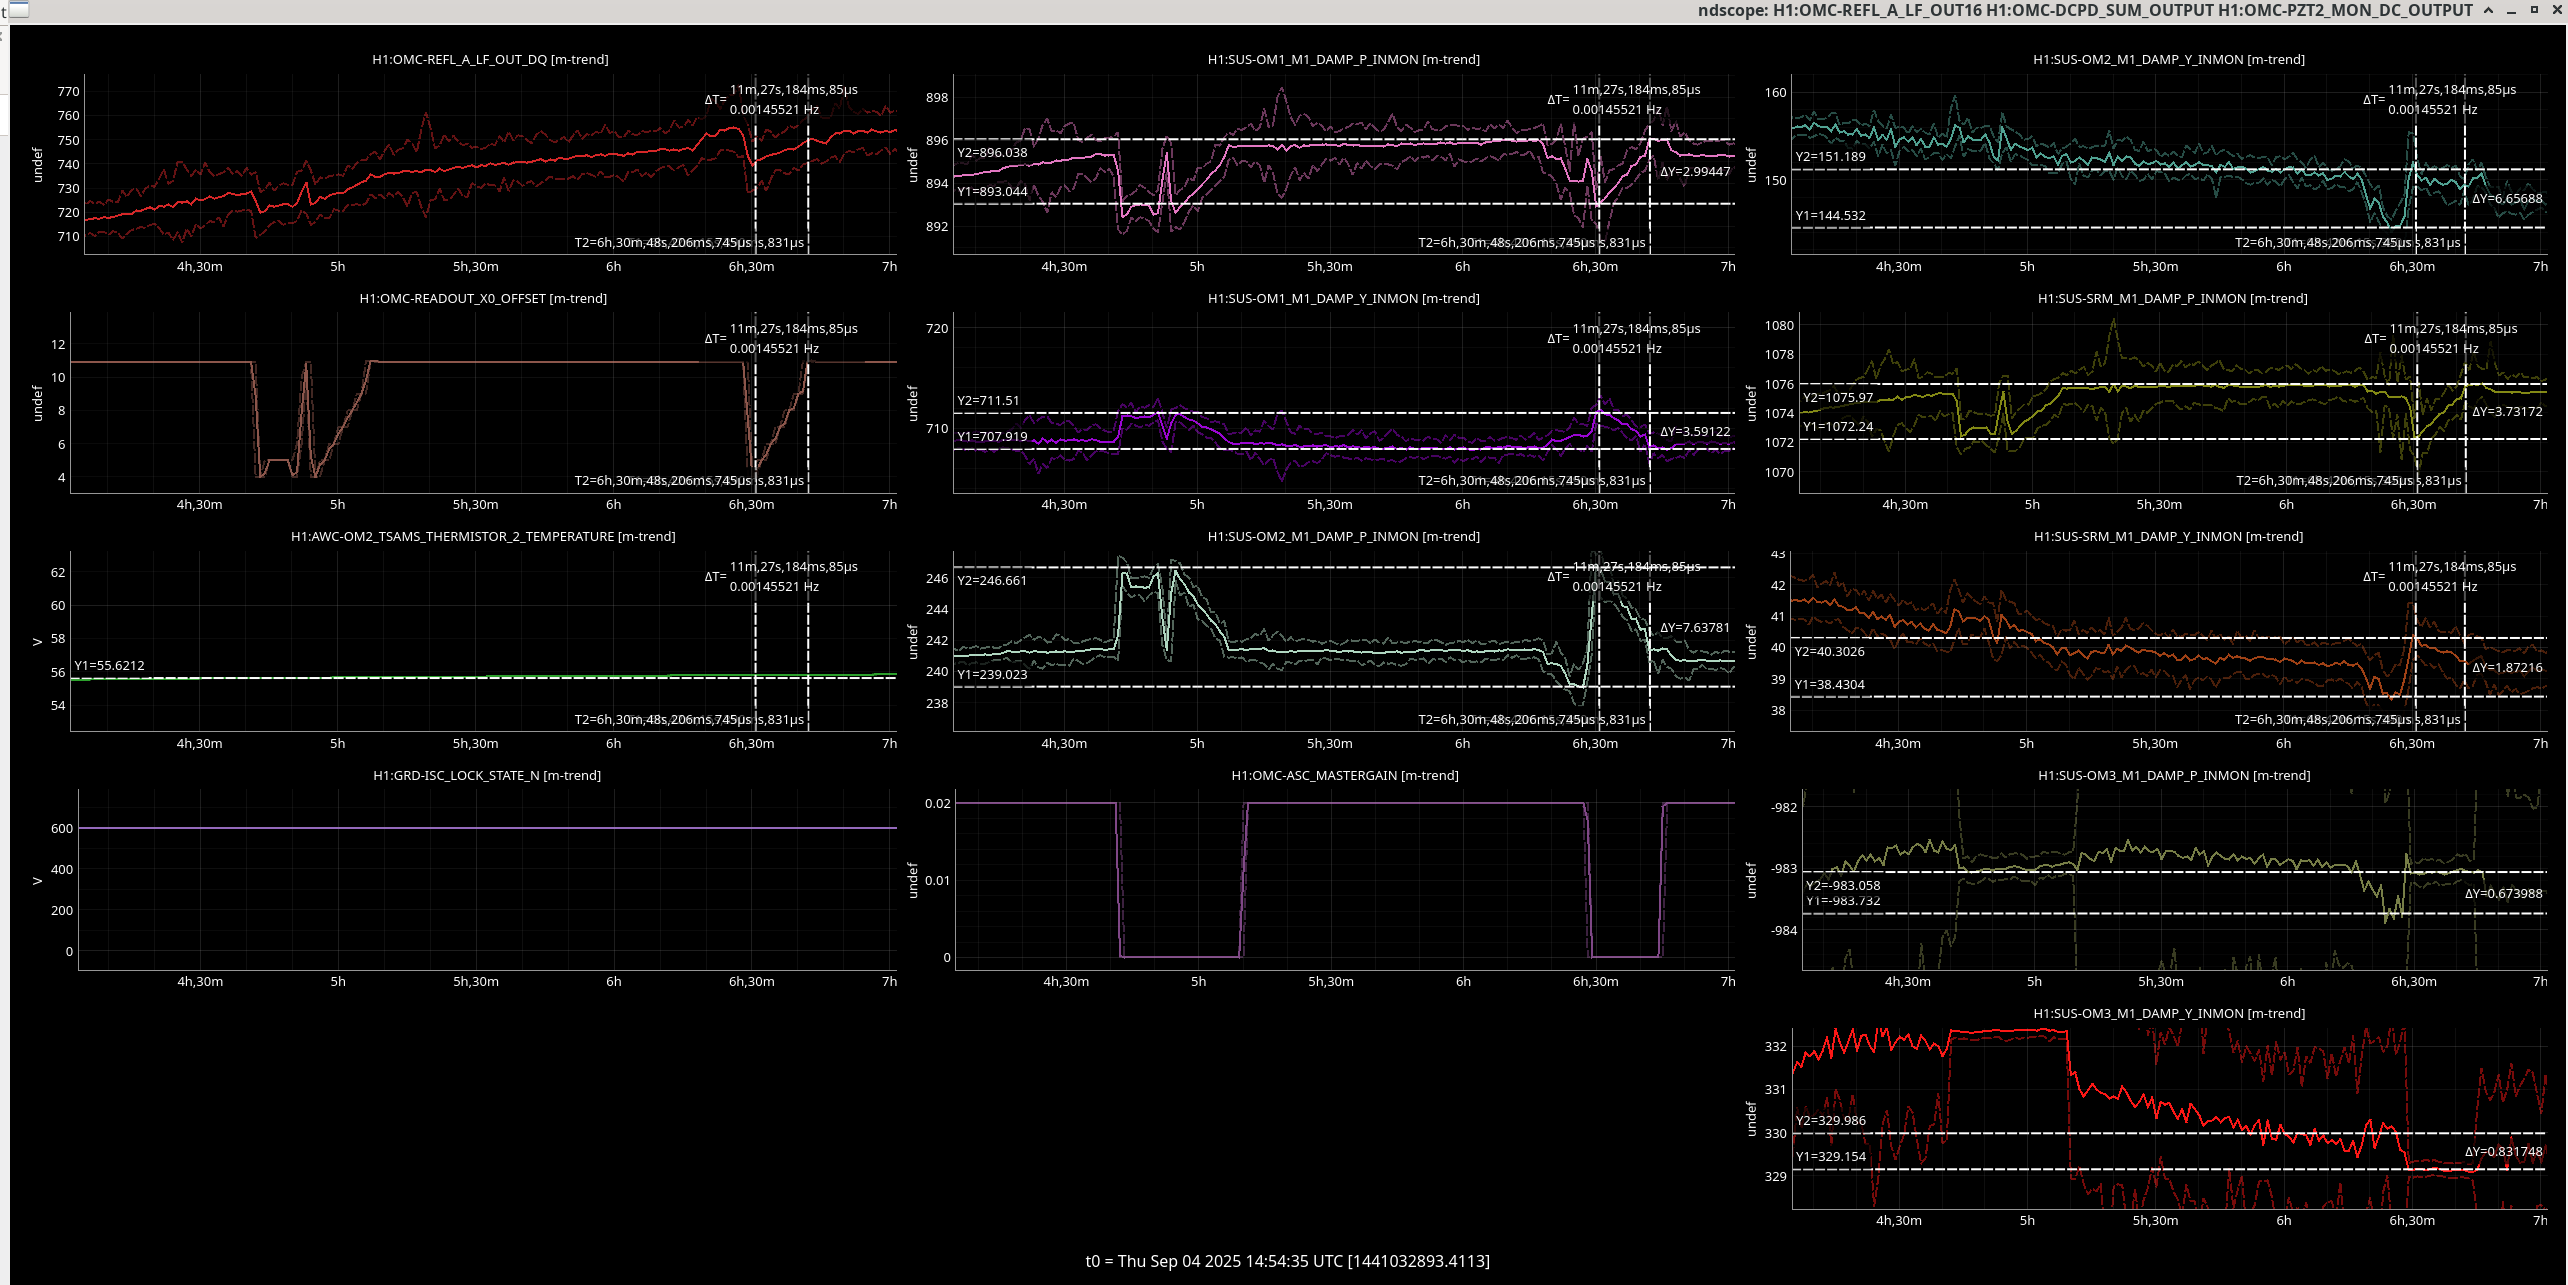
We carried out a test (see LHO alog #86785) to look at the effect of DARM offset stepping on the power at OMC-DCPD_SUMS and OMC-REFL (transmitted through and reflected from the OMC). We did this with the heater on OM2 off as is nominal.
We then meant to redo these measurements once we heated up OM2 to change the mode-matching of the IFO to the OMC.
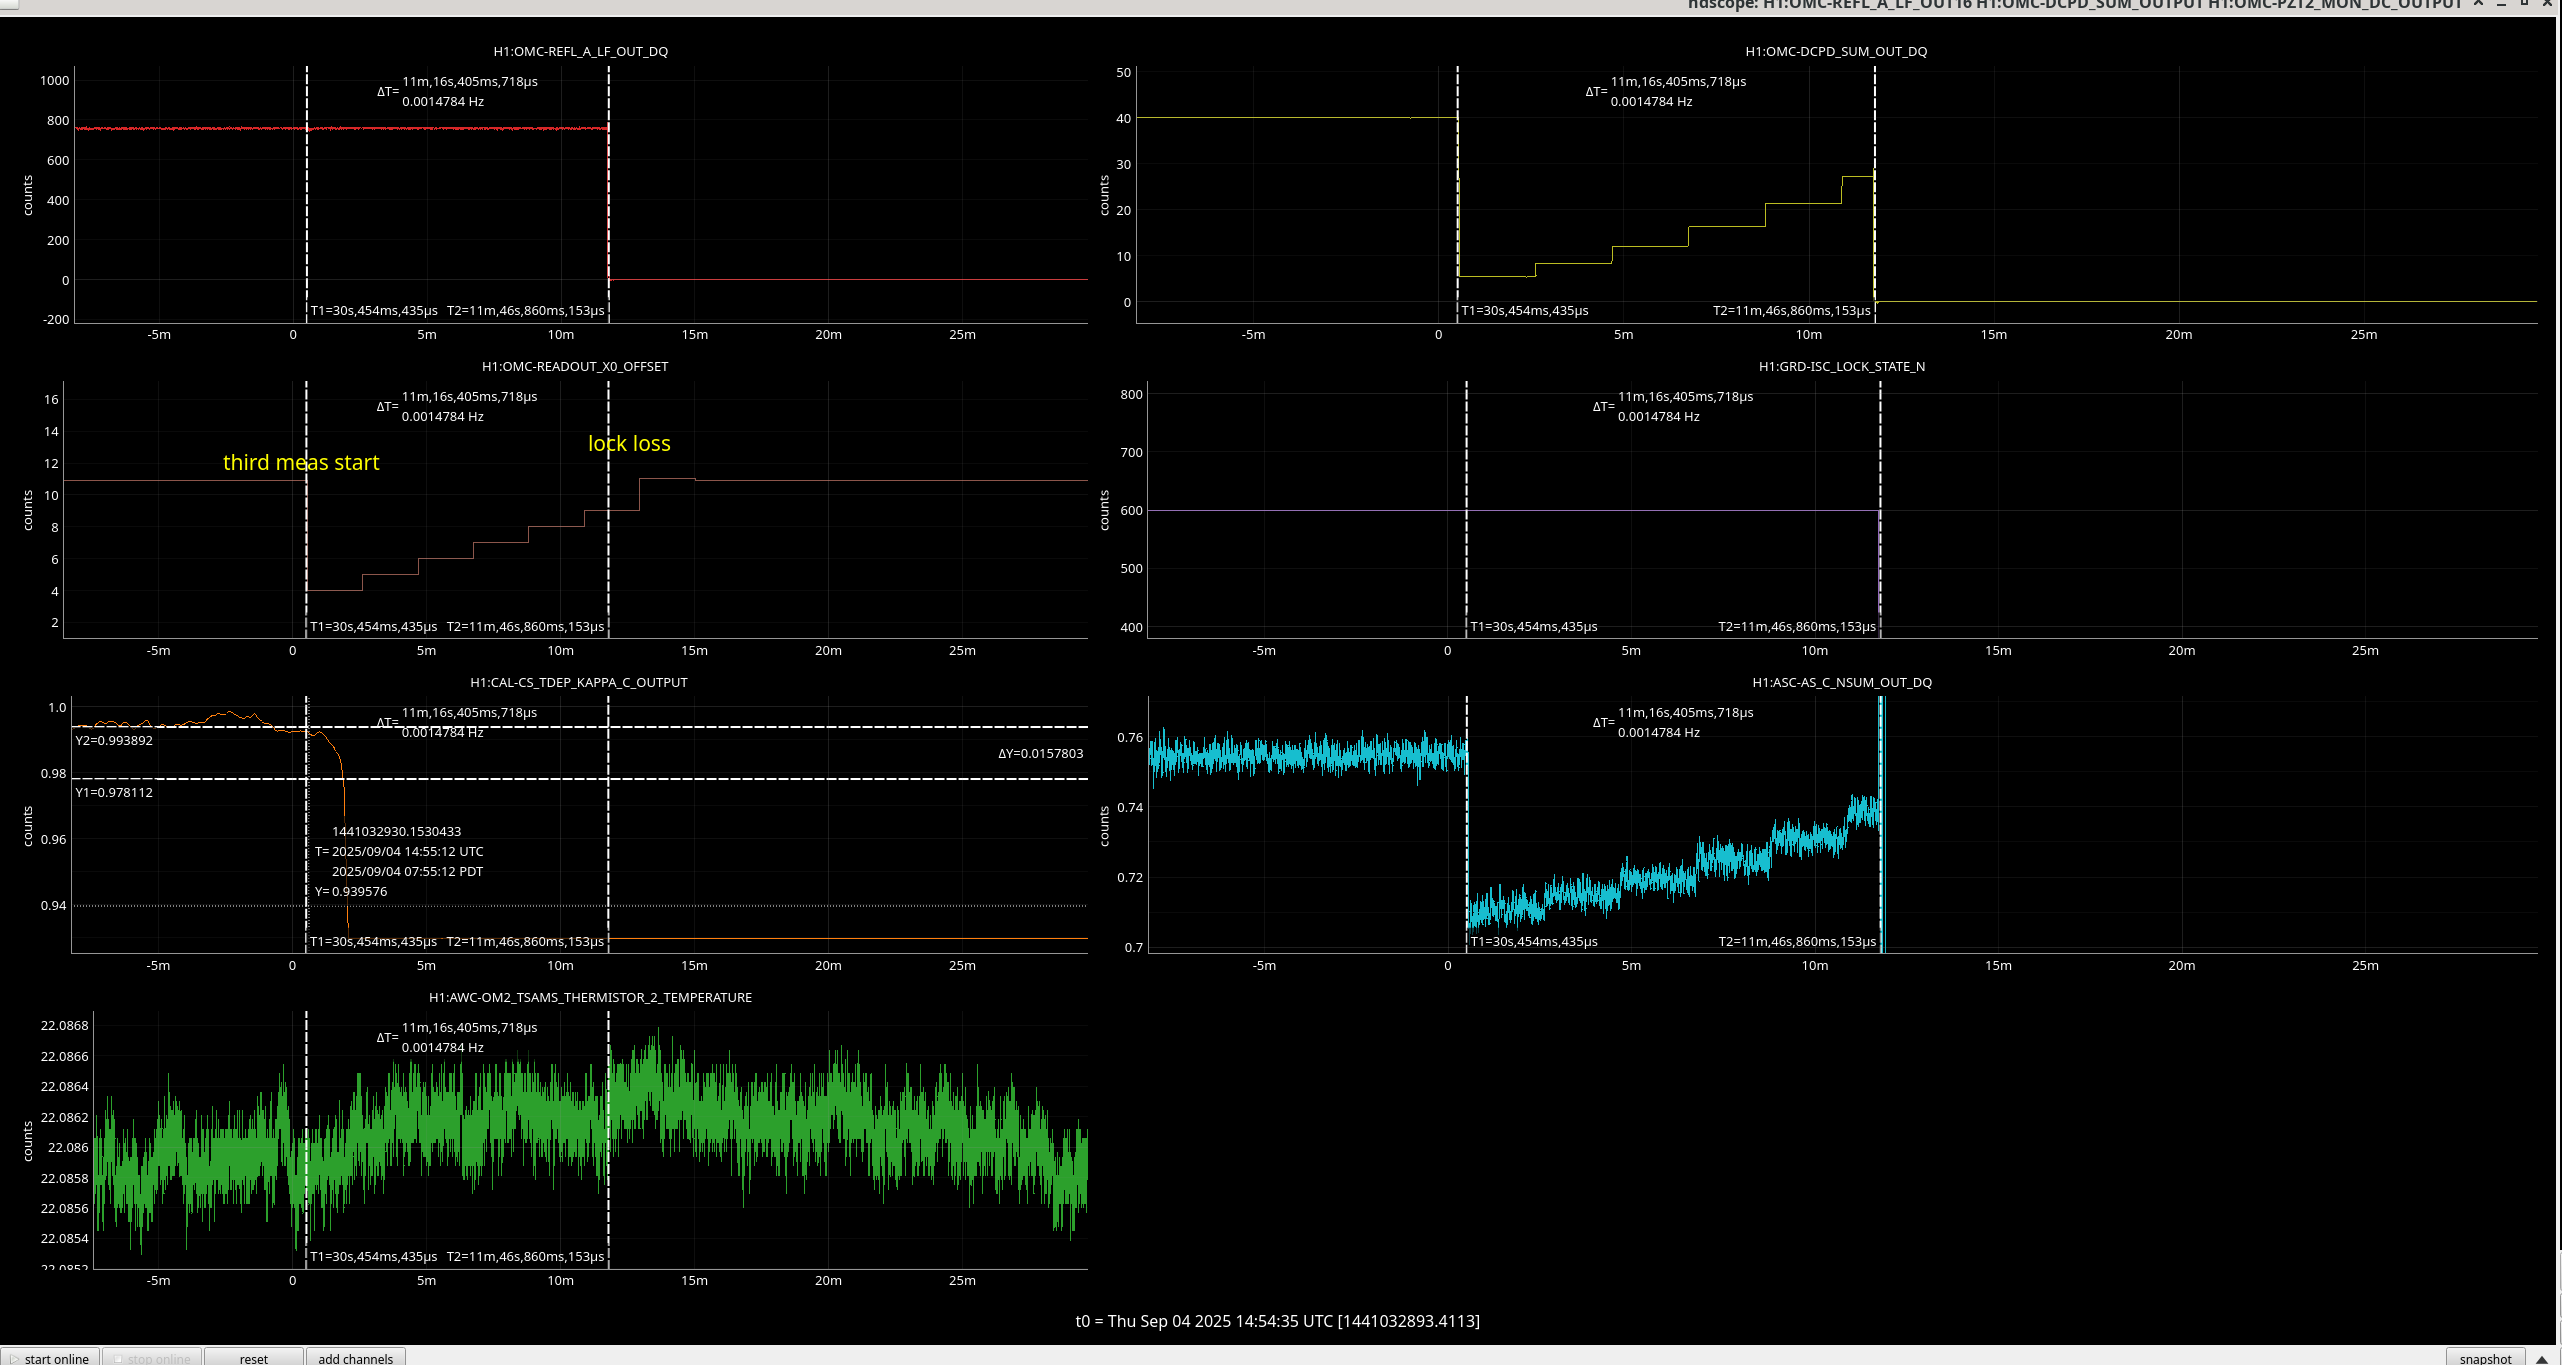
Unbfortunately we lost lock at about 15:06 UTC while Corey was taking out first measurement before heating up the OM2.
The meausrement is shown in this image, I have mislabelled it as 'third measurement' but it was the first. The optical gain is shown just before this measurment to be 0.994.
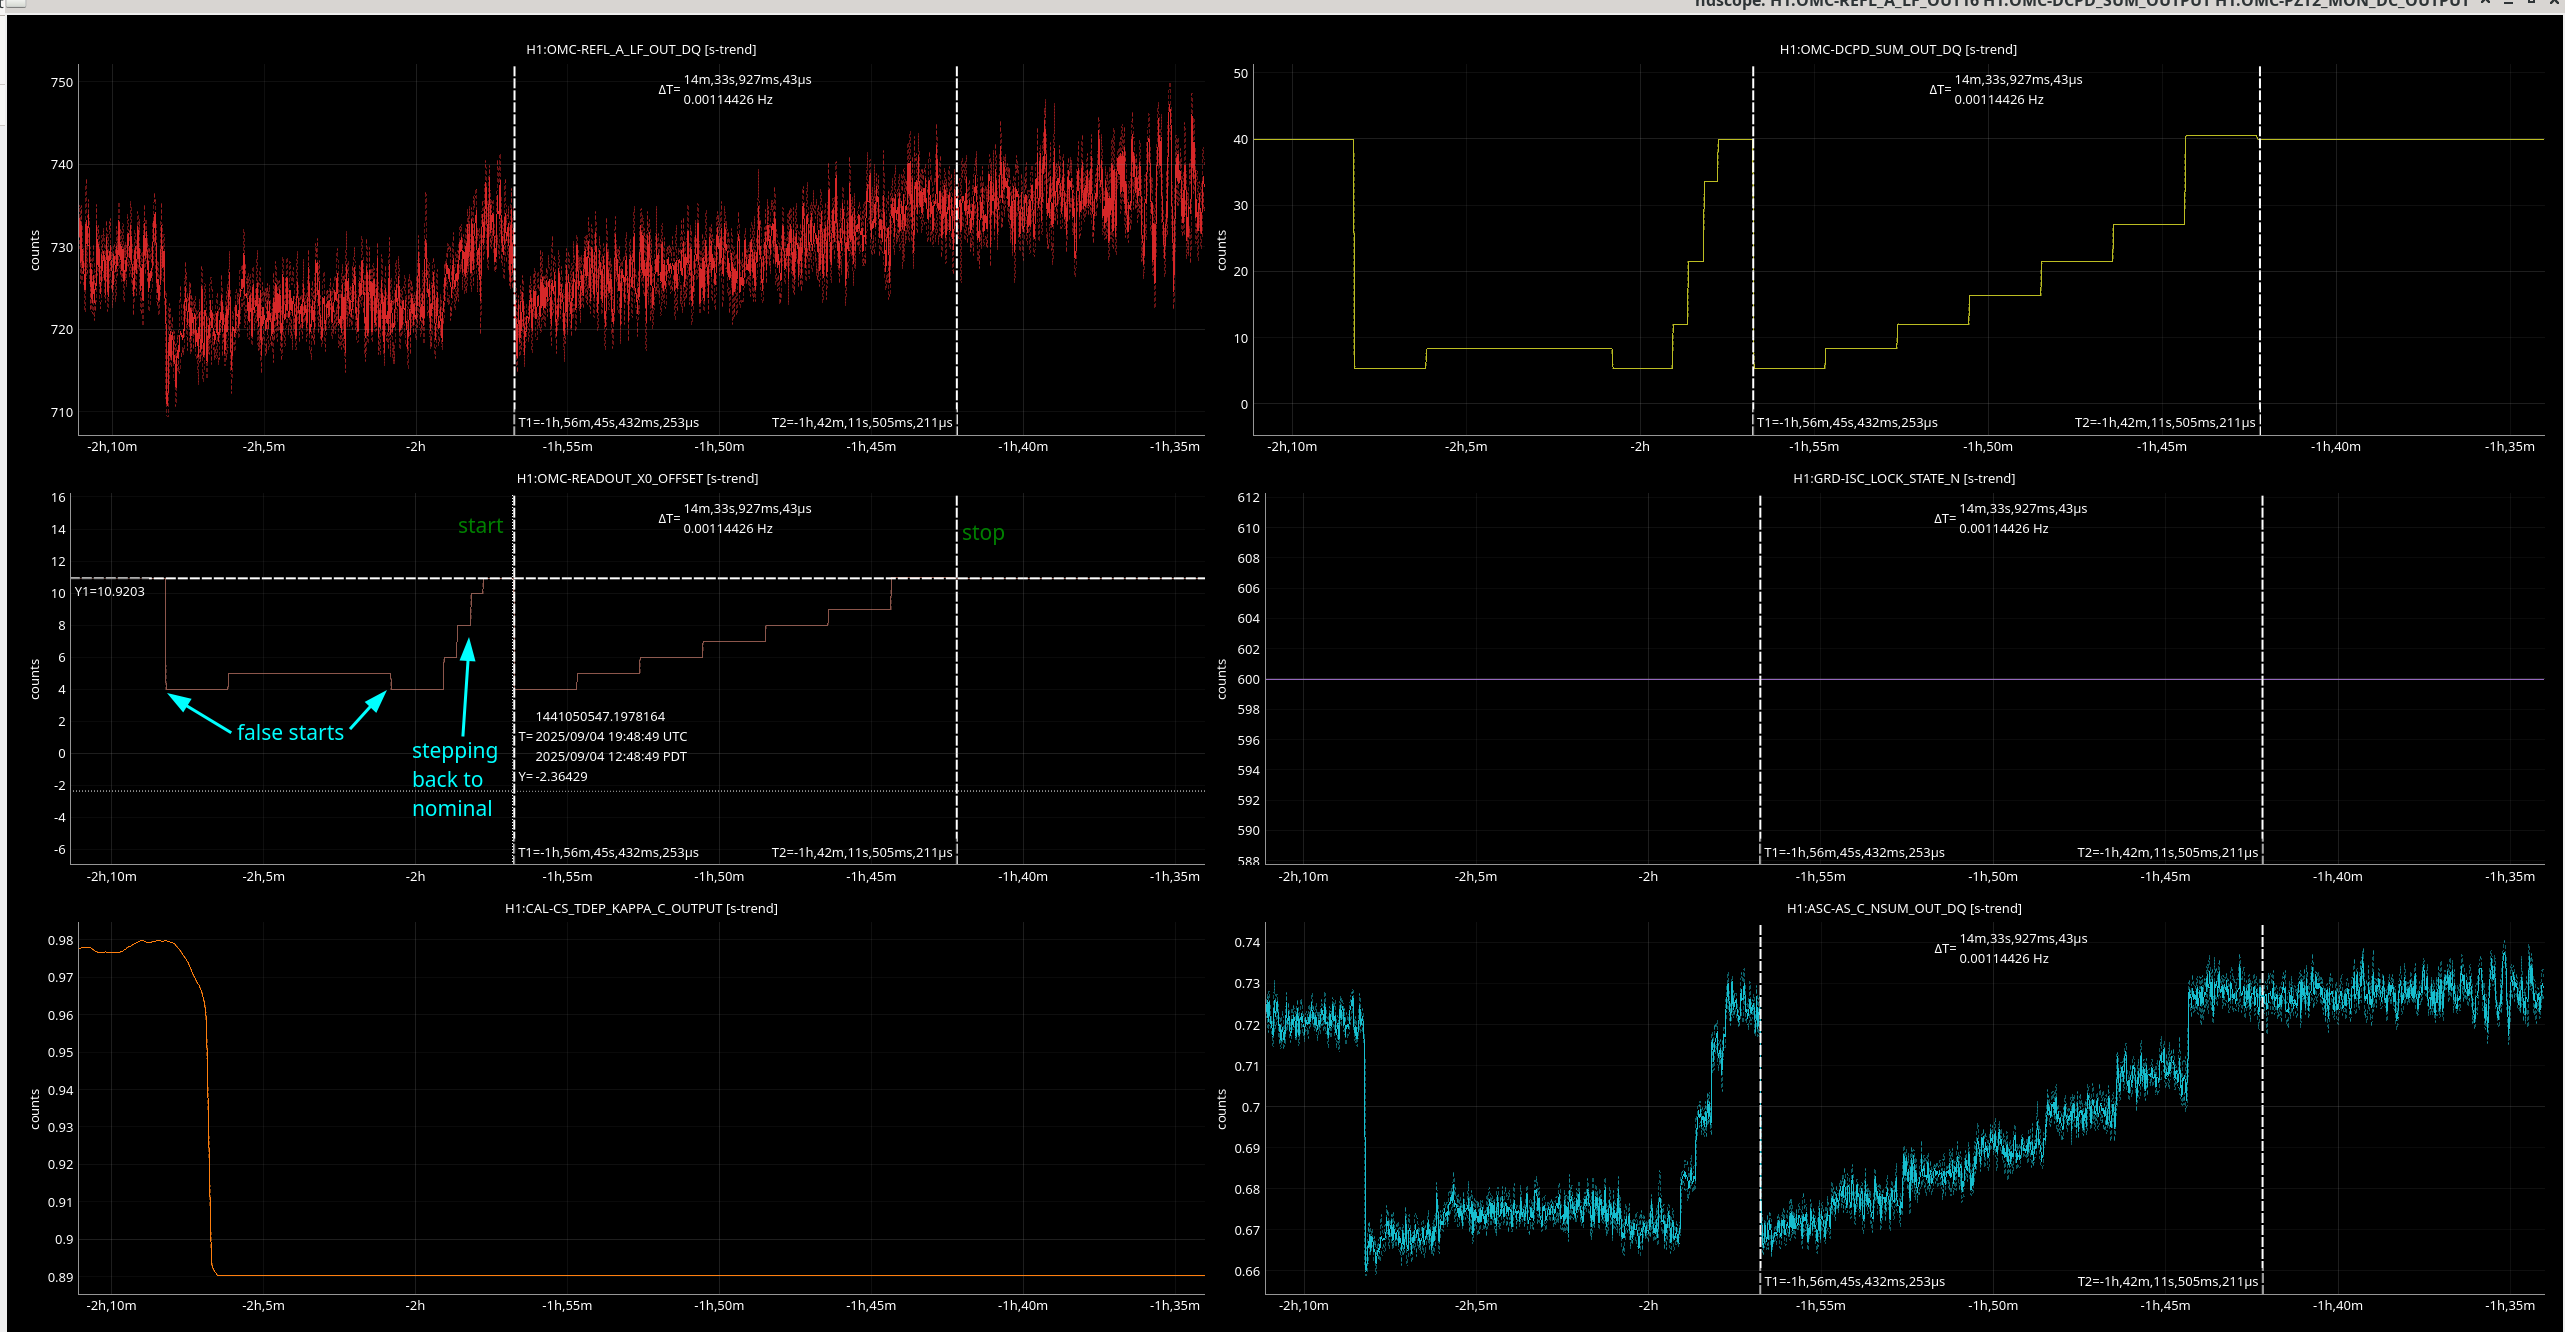
Then we waited as long as we could under out initial parameters of being finished cooling the OM2 again by 1:45pm.
We took another measurement at 1 hr 25 mins into lock after two false starts where I forgot to turn off the ASC. The optical gain was measured right before we started the measurements to be 0.978 but was still thermalising.
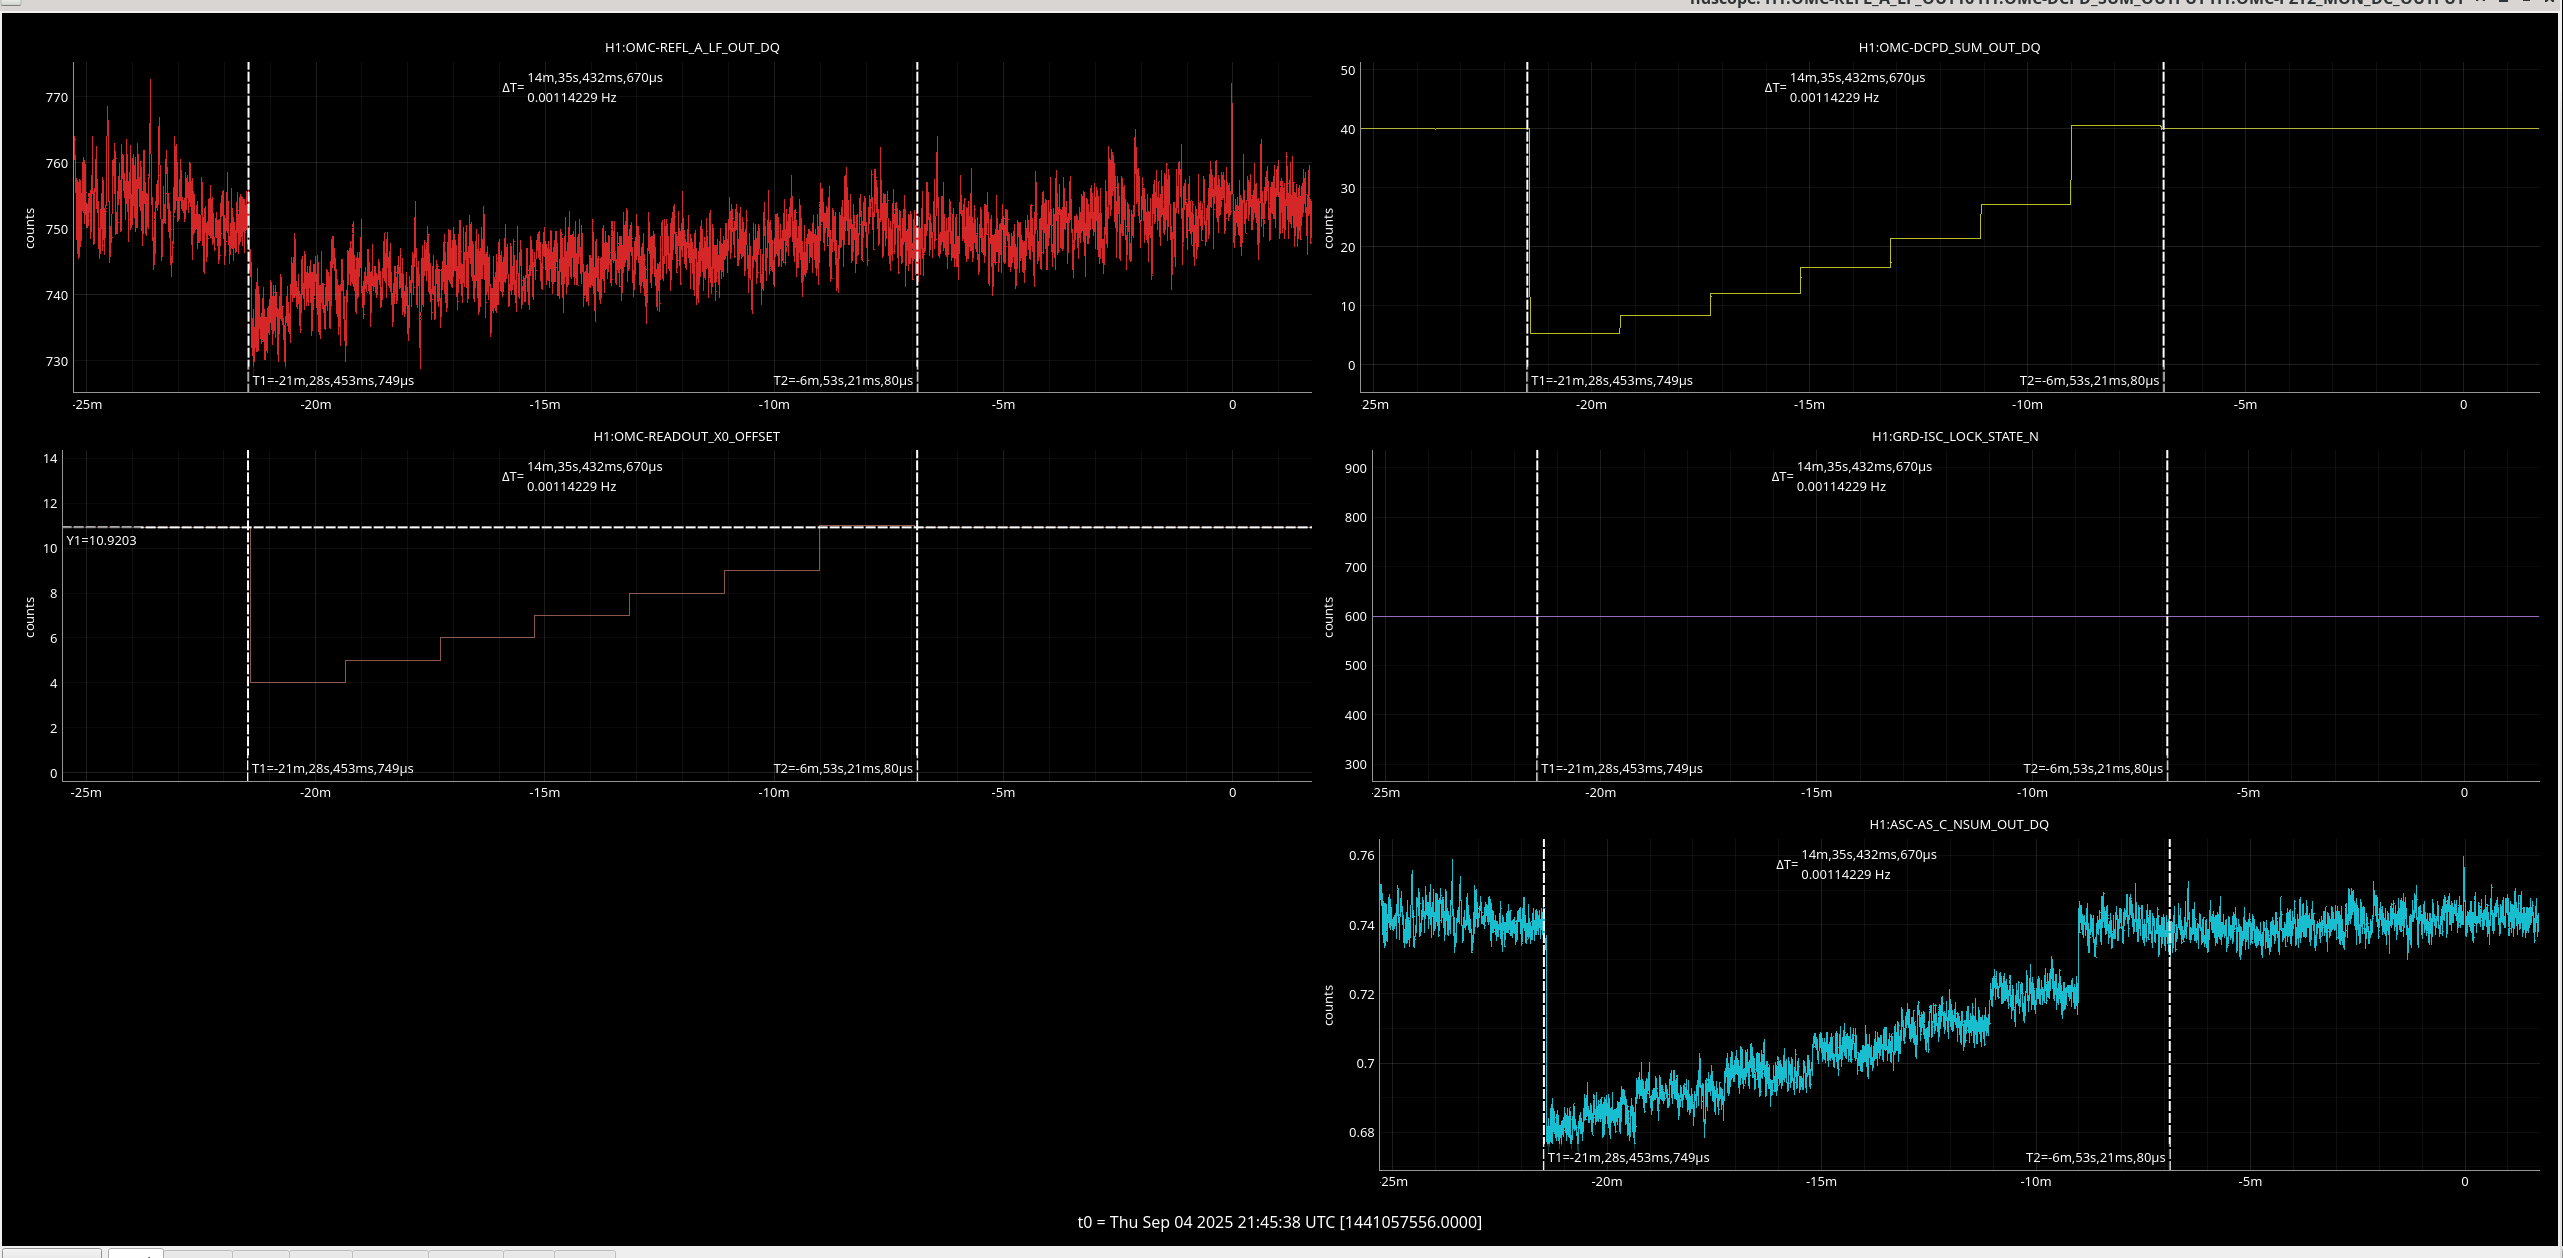
And then we took a third 2 hrs 59 minutes into lock, the IFO should be thermalised but the temperature of OM2 was still trending upwards a bit. Optical gain was 0.986.
We can use the slope of the power at the antisymmetric port (P_AS) vs. the power at the DCPDs (P_DCPD) as the DARM offset changes to estimate the throughput of carrier through the OMC which allows us one estimate of the loss.
The plots of this throughput are here for the cold state (minus the points taken after we lost lock), here for the partially thermalised state, and here for the thermalised state.
I am also in the middle of using the plot of P_AS varying with power at the OMC reflected port (P_REFL) to get a better estimate of the mode-mis match between the interferometer and the OMC.