Now that many of us are opening MEDM windows from home on single display machines, some MEDMs appear off-screen because their origin coordinates have large values (normally in the X direction). If you are lucky, a sliver of the window edge is presented and you can grab and move the window into your display region.
I have written a python program which recursively drills down to all MEDM adl files linked from the SITEMAP.adl. Here is the current situation
| 5,723 | number of adl files linked to SITEMAP.adl whose origin coords were checked |
| 637 | files which could not be opened ** |
| 230 | number of adl files with origin coords out-of-bounds, of which: |
| 223 | are in svn and have no current modifications |
| 7 | are either not in svn or have mods |
I'm assuming a standard full-HD display resolution of 1920x1080 (1080i)
** Of the 637 files which are linked to SITEMAP but I was unable to open, 329 had macro expansions in their path which would require macro tracking to be added to my program. The other 308 did not exist, which presumably means stale related-display links in some MEDM files.
The next step is to resolve the 7 files with svn problems, and then auto-correct the origins for the 230 out-of-bounds files and commit these to svn.
Cheryl, Stuart, Arnaud, Rahul
EDIT: (04/09/2020): I have re-run these (ETMY/ITMY) analysis after Arnaud suggested that I offset the Damping ON/OFF gps time by few mins and let things stabilize. The results from yesterday looked like damping ON/OFF measurements were taken with a transient in the signal.
Attached below are the amplitude spectral density for the Top mass OSEMs for the ETMY and ITMY suspensions. The plot compares the state when the damping was OFF (for an hour) and then ON. For comparison, I am also attaching the results from 2013-14 for ETMYand ITMY.
The noise floor for both ETMY and ITMY above 10 Hz is of the order of ~5e-11 m/rtHz (for the LTV dofs) and ~e-10 m/rtHz (for RPY dofs). There are no resonant peaks observed above 10Hz for the M0 stage osems. The resonant peaks are lower when the damping is ON.
However on comparing the 2020 results with that of 2013-14 (posted by J. Kissel alog 13184), I see that the noise floor in 2013 drops off by several orders of magnitude after 50Hz. I don't see this drop in my results taken today (maybe Jeff or Stuart/Arnaud can comment on this).
The spectrum were taken using a Matlab file stored at the following location,
/ligo/svncommon/SusSVN/sus/trunk/QUAD/Common/MatlabTools/plotquad_spectra.m
The matlab script used over here had few issues which was resolved swiftly by Stuart and Arnaud (from LLO). 24 out of 39 channels worked fine and the rest had some issues in the .m file (which is now fixed according to Stuart's email later in the evening).
Comments from J. Kissel: These OSEM spectra scripts are grabbing data from the frames (nds1 probably). In 2013 we were only storing the top-mass OSEMs at some ridiculously low sampling frequency — probably 128 Hz. As such, the Nyquist frequency was around ~50 Hz. Near Nyquist, the data aquisition system always applies a very aggressive digital down sampling / anti-aliasing filter. The filter is computed from the *ratio* between the rate at which the front-end model runs (in the SUS’s case this is 16 kHz) and the requested rate that the data is stored (in the this case 128 Hz). Thus, the data is filtered with the 128x filter show in the figure on page 3 of <https://dcc.ligo.org/LIGO-T1600059>.
Since then, we’ve up’d the rate by 2, to 256Hz, which means the Nyquist is *just* off the edge of your plot which goes to 100 Hz. And thus you don’t see the influence of the 64x filter.
WP8594 Remove Jeff Jones from the alarms system
I reconfigured the alarm system and restarted it at 10:48 PDT
The packing on pump1 has gotten to a state that it is leaking fairly bad. The shaft is quite lose and does not spin smoothly anymore. It will need to be replaced.
Bubba shut off the electrical for this pump and isolated it from the water system.
He has already identified the spare for this and will work at getting the system fixed when it can be done safely.
This is one of two pumps that are redundant so it does not leave us in a state that without water coverage in the event of a fire.
I have the control panel locked out and water valves closed too. Pump 2 is fully functional.
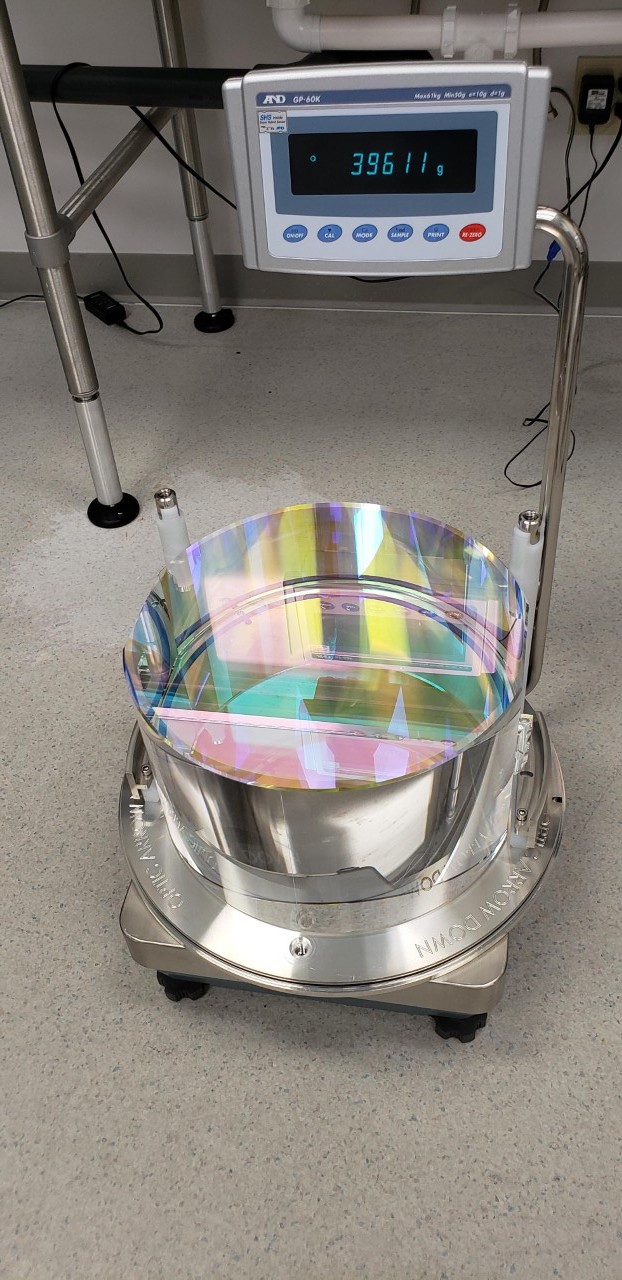
For the record, the new ITMY optic (ITM01) was weighed after the ears were bonded and comes in at: 39,611g
Richard has requested that the current fire pump running alarms be bypassed for the next hour.
Bypass will expire:
Thu Apr 9 10:19:17 PDT 2020
For channel(s):
H0:FMC-CS_FIRE_PUMP_1
H0:FMC-CS_FIRE_PUMP_2
To get a better check for quad hysteresis after the idaho EQ, I have started a script which will move the quads slowly in pitch for the next 50 minutes, (starting around 3:20 UTC April). The attached python code can be copied and pasted into a guardian prompt to duplicate this measurement.
Result: The hysteresis seen in the quad top masses is rather similar from the Idaho EQ to the hysteresis we saw after the Montana EQ in 2017.
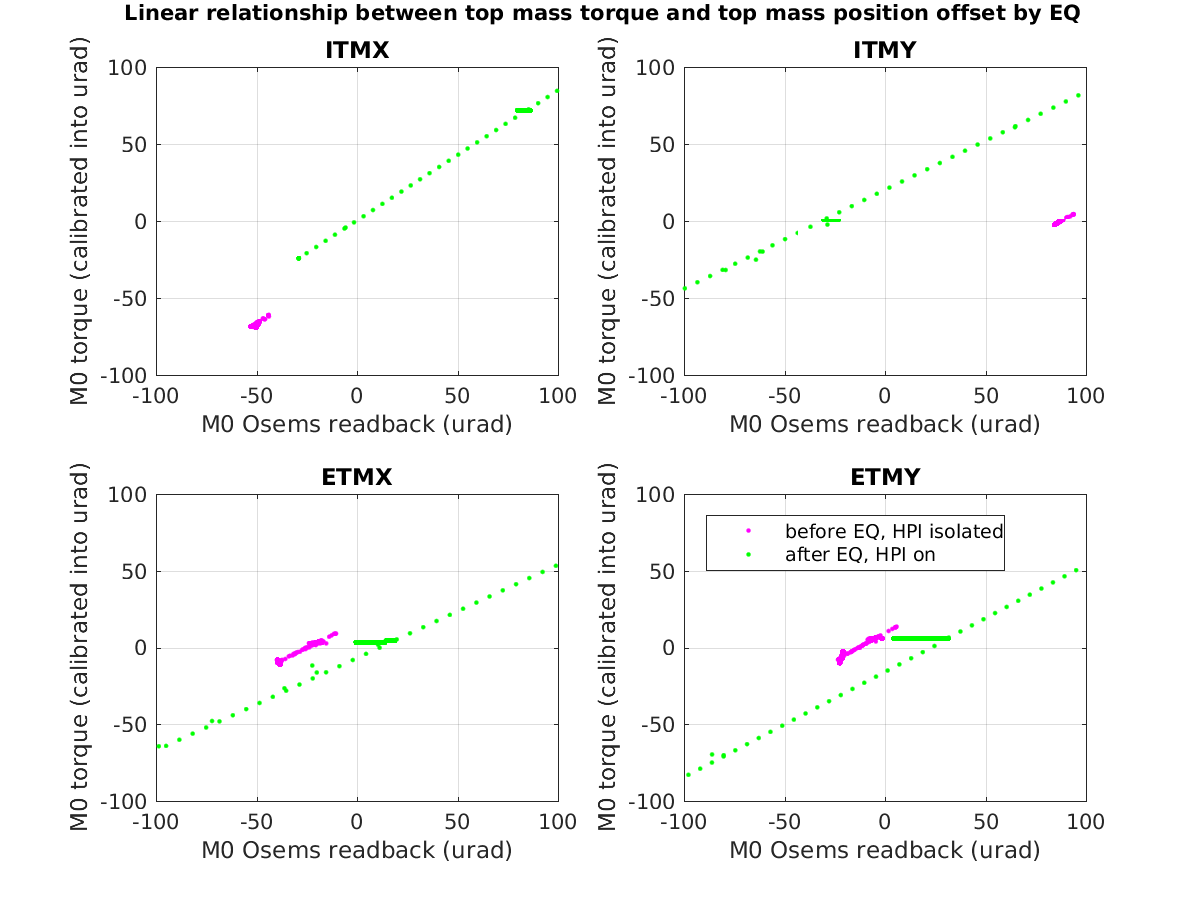
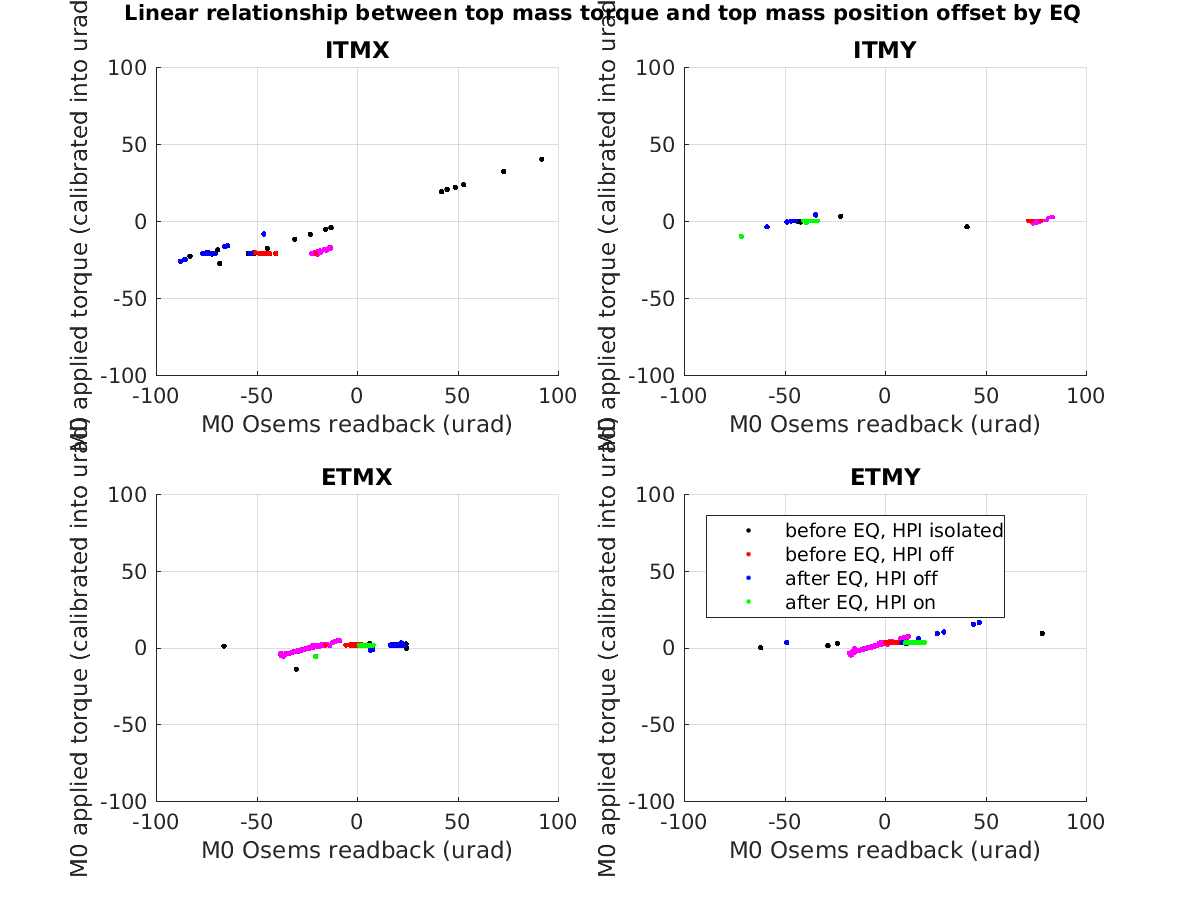
The first attachment is similar to the time series in 55880 but includes at the far left the time this morning when I slowly ramped the opticaliang offset around. To make the second plot easier to read, I am only including 2 sets of data, with HEPI position loops on before and after the EQ. I also fixed a factor of 2 which was missing in both 55880 and in the original version of this script for the Montana EQ 37799. (I had correctly calibrated the torqu applied by F1 into urad of displacement that it creates, but this is a little confusing because this is only half of the pitch drive, I've multiplied by 1 so that the slope of these lines should now be 1).
The shifts listed in this table are just eyeballed, I didn't do any fitting, and the Montana ones I mulitplied by 2 from the original plots to account for the factor of 2 calibration difference.
| approx offset from Idaho EQ | Montana EQ | |
| ITMX | ~20urad | ~ 20 urad |
| ITMY | ~80 urad | ~ 40 urad |
| ETMX | ~ 20 urad | ~ 50 urad |
| ETMY | ~ 30 urad | ~50 urad |
Jonathan, Dave:
we put the nomachine_ioc on opslogin0 under systemd control yesterday. If this process were to die, systemd will restart it.
I noticed my code has a bug and the display and counters were incorrect this morning. This looks like a run-time error as sessions are created, removed or moved within the table. I restarted the process which resynced the data.
Wed 08 Apr 2020 00:02:04 UTC
Tue 07 Apr 2020 17:02:04 PDT
No timing error, no dmesg log entry, slight elevation of IOP processing time but not remarkable. I cleared the state-word this morning.
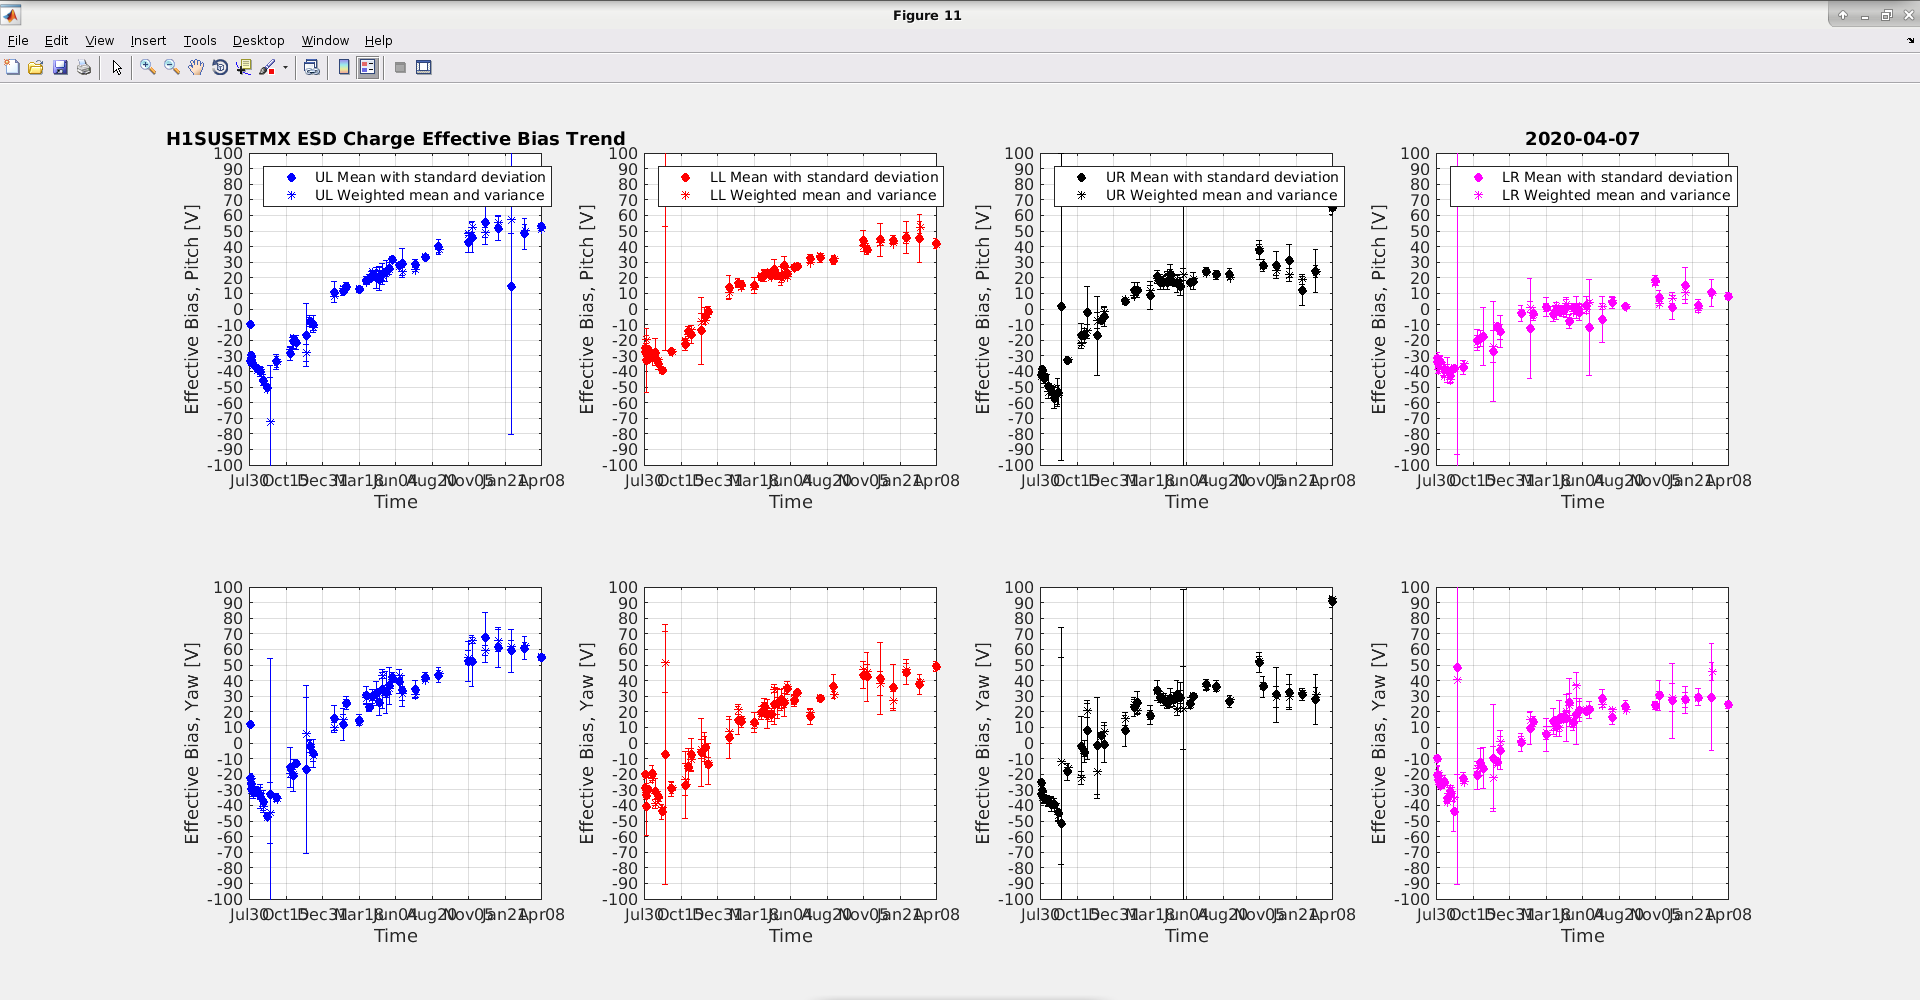
OPLEV charge measurement was performed on ETMX (after Fil switched on the HV at the X-end) this afternoon. The attached plot shows a big spike in the third quadrant for the Pitch: bias voltage is around 65V (up from 25V from last month's measurement). Similarly the third quadrant for the Yaw is at 90V (was at 30V in March).
The other quadrants don't show any increase in the charge accumulation.
I am attaching the ETMX charge measurement results from 2017 taken by J. Kissel after the July 6th 2017 EQ (alog 38401), for comparison. Looking at the trend lines, there doesnt seems to be a significant rise except for the 1st (Yaw) and the 3rd (Pitch) quadrant: bias voltage for them is around 40-50V (which is an increase by 20-30V). The effective bias voltage for other quadrants is below 40V: for Pitch and Yaw.
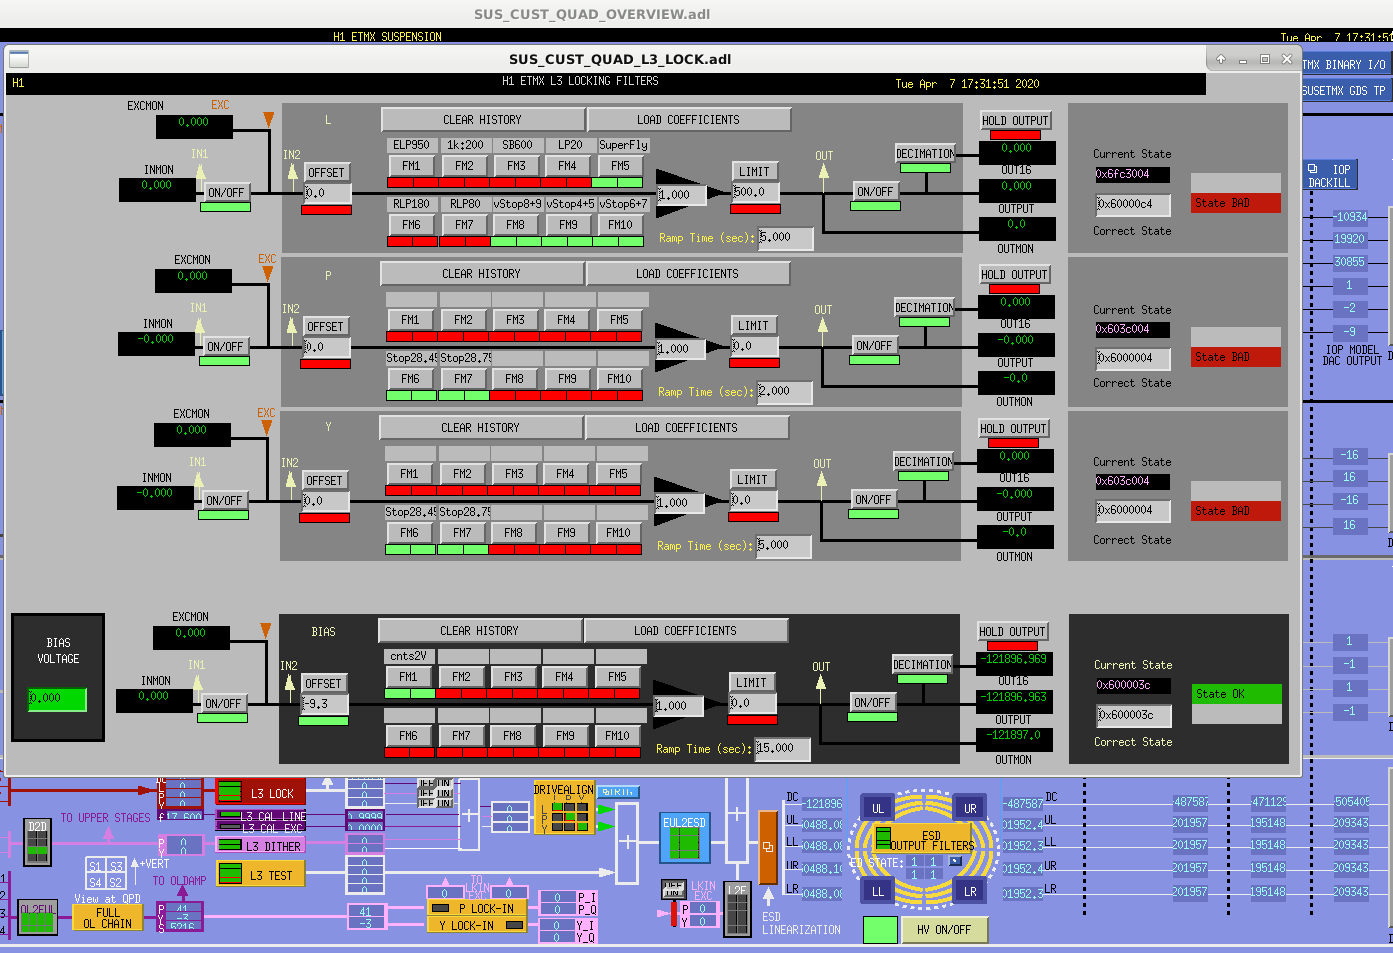
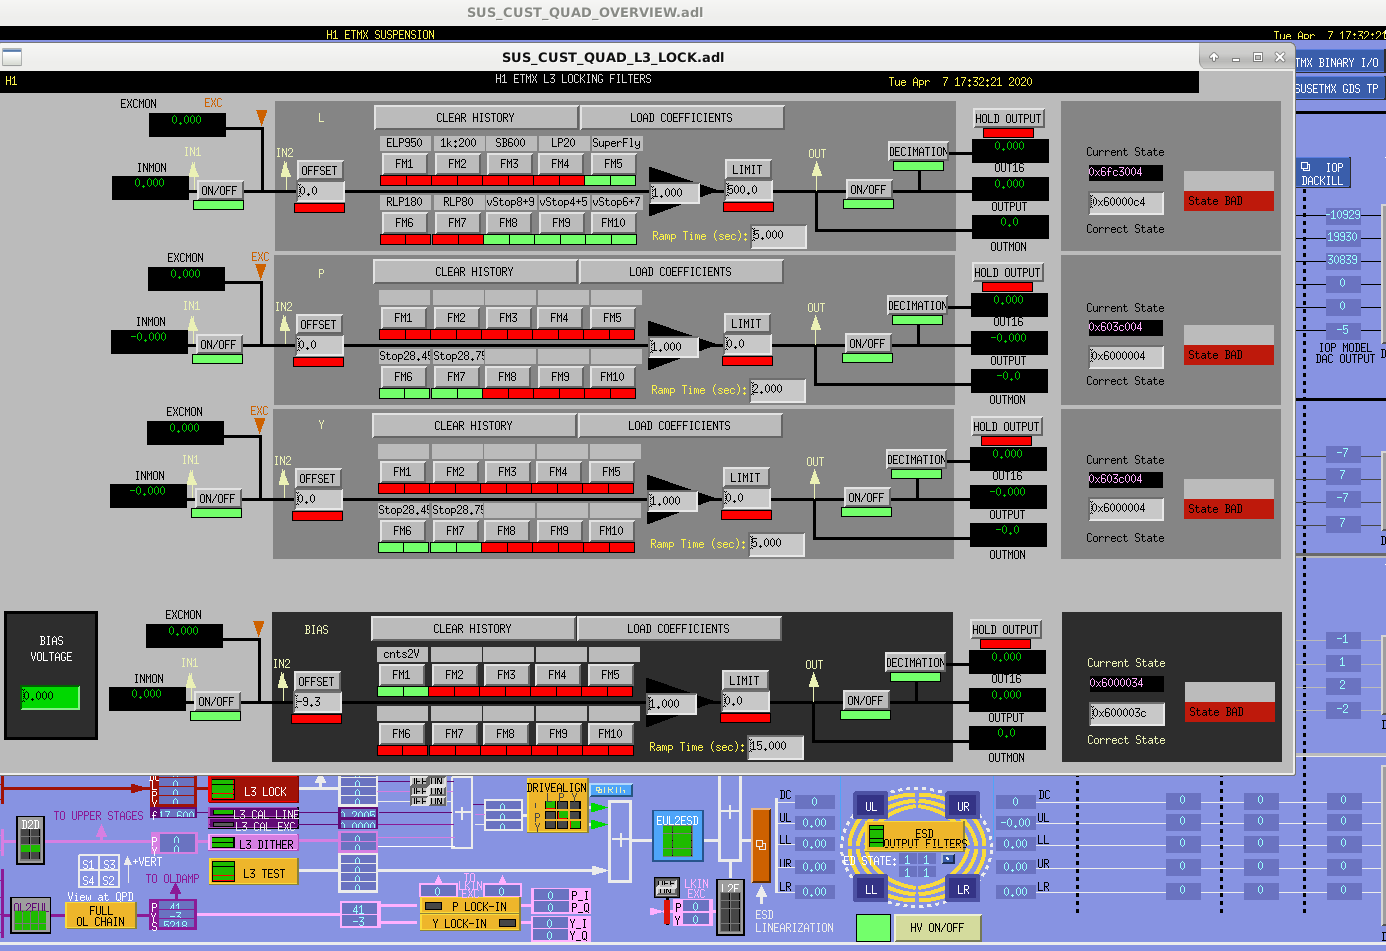
I turned off the -9.3 offset for ETMX H1:SUS-ETMX_L3_LOCK_BIAS_OFFSET, which was sending large numbers through the L3 stage, even though the ESD is off. The change is visible in SDF, and is a manual change that will need to be reverted, so remains as a change in SDF.
WP 8591
Issues with LSB access sytem required onsite work. Control panel was power cycled. Carlos was able to log in and check system was back online.
Took opportunity to power on the low and high voltage for the ESD SUS at EX. Measurements to be made by Rahul require the HV voltage.
F. Clara, R. McCarthy, C. Perez
ESD HV supplies are off again.
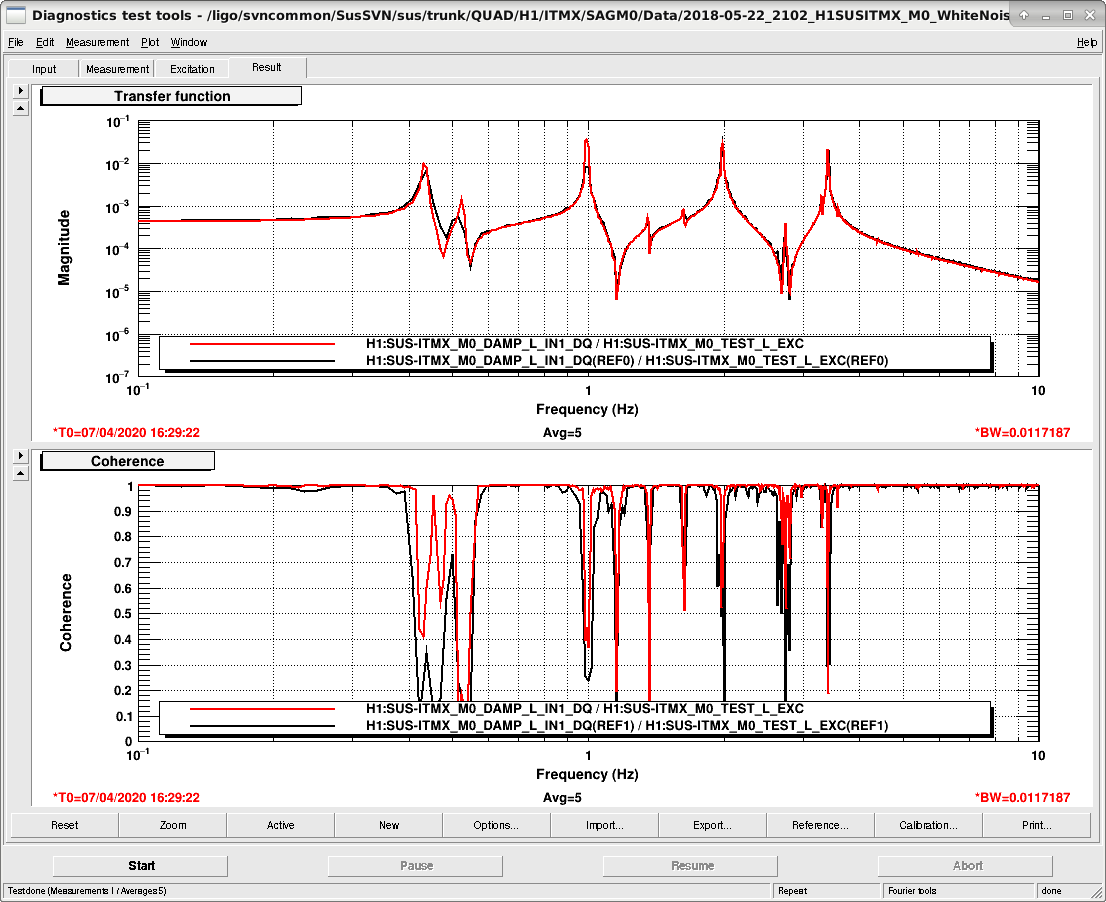
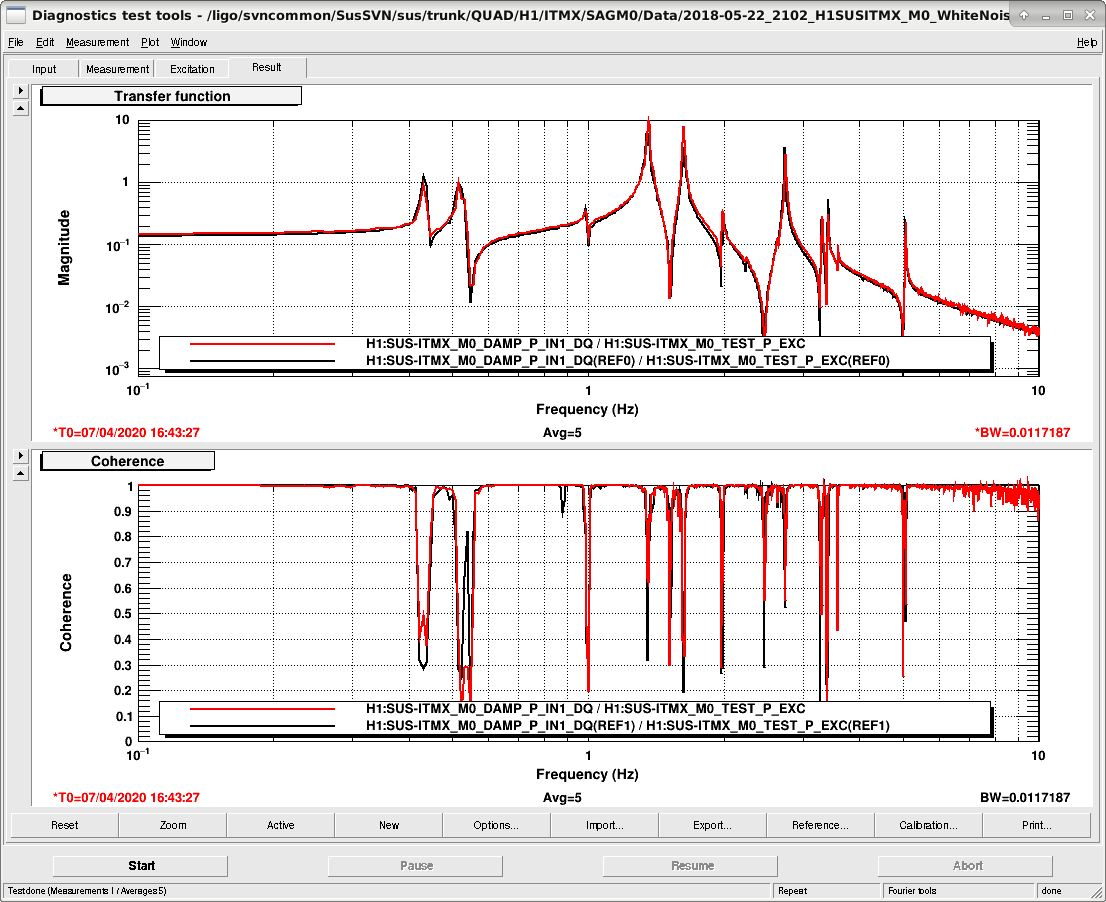
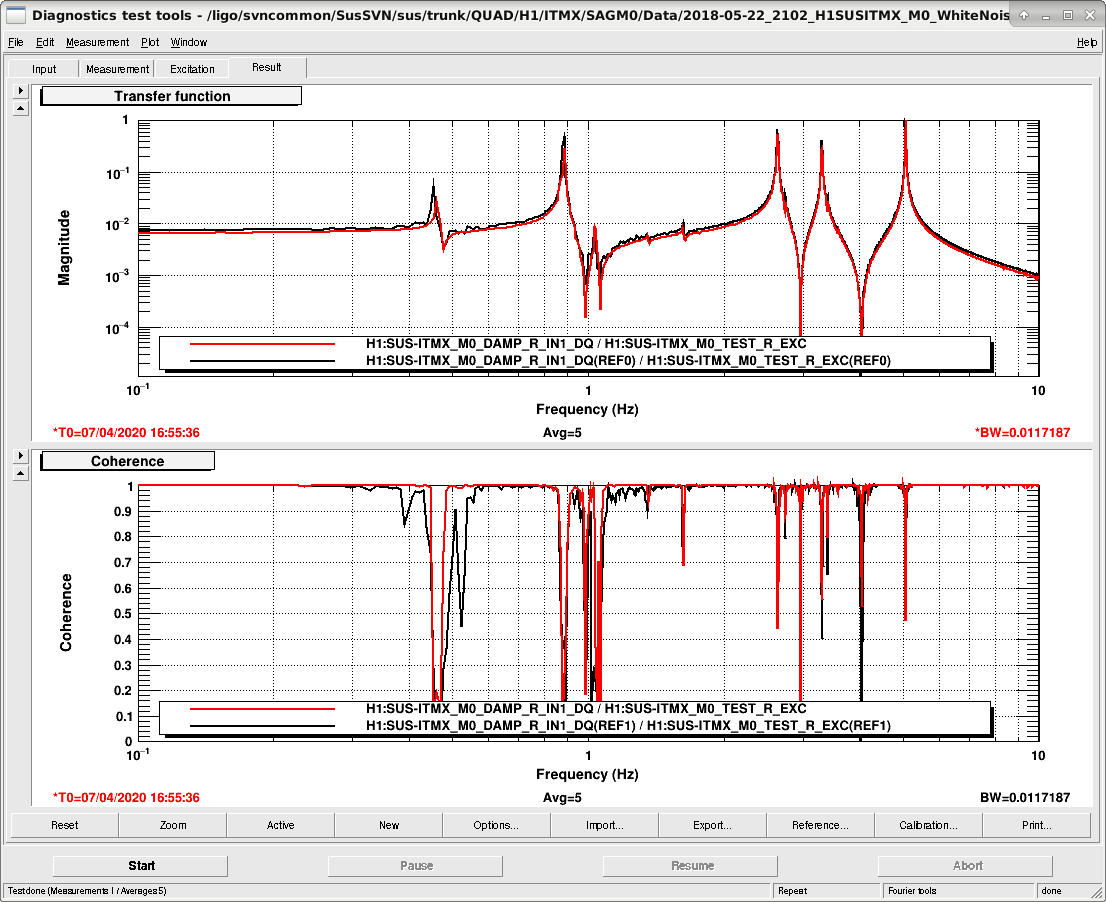
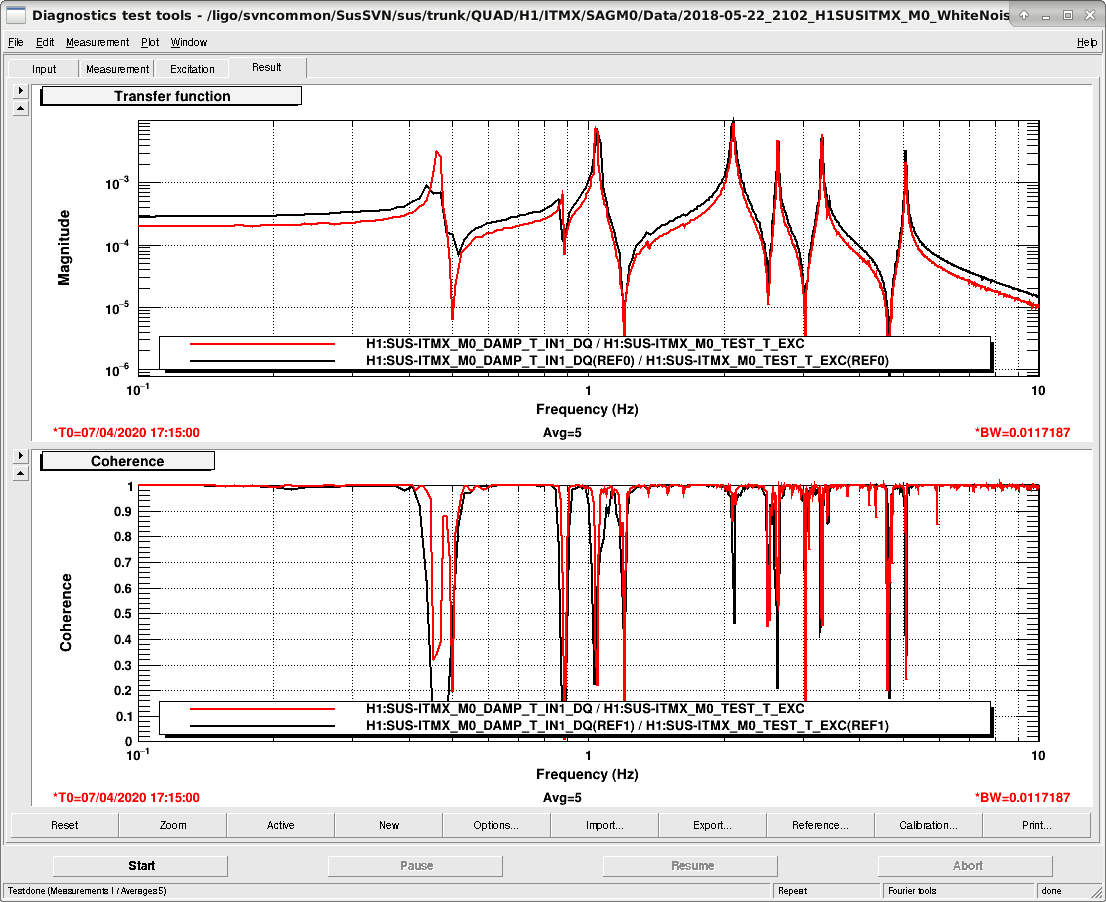
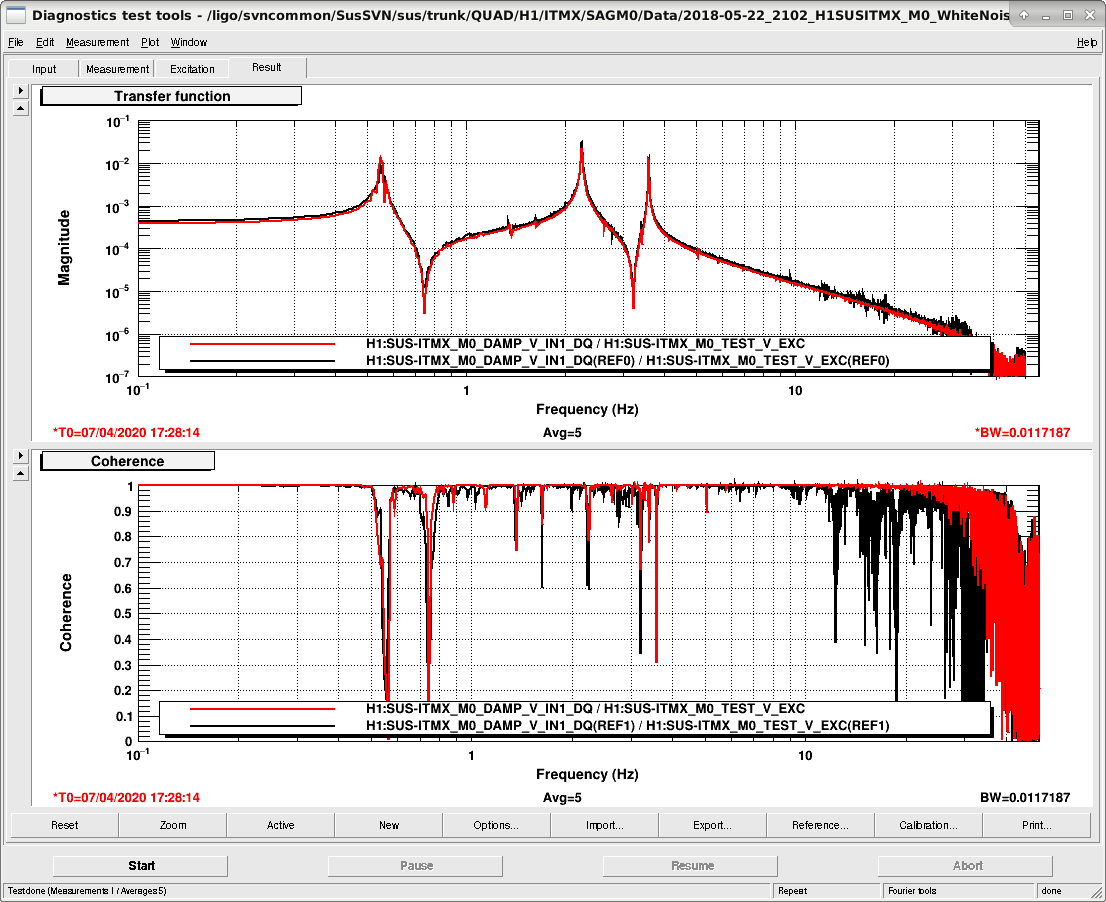
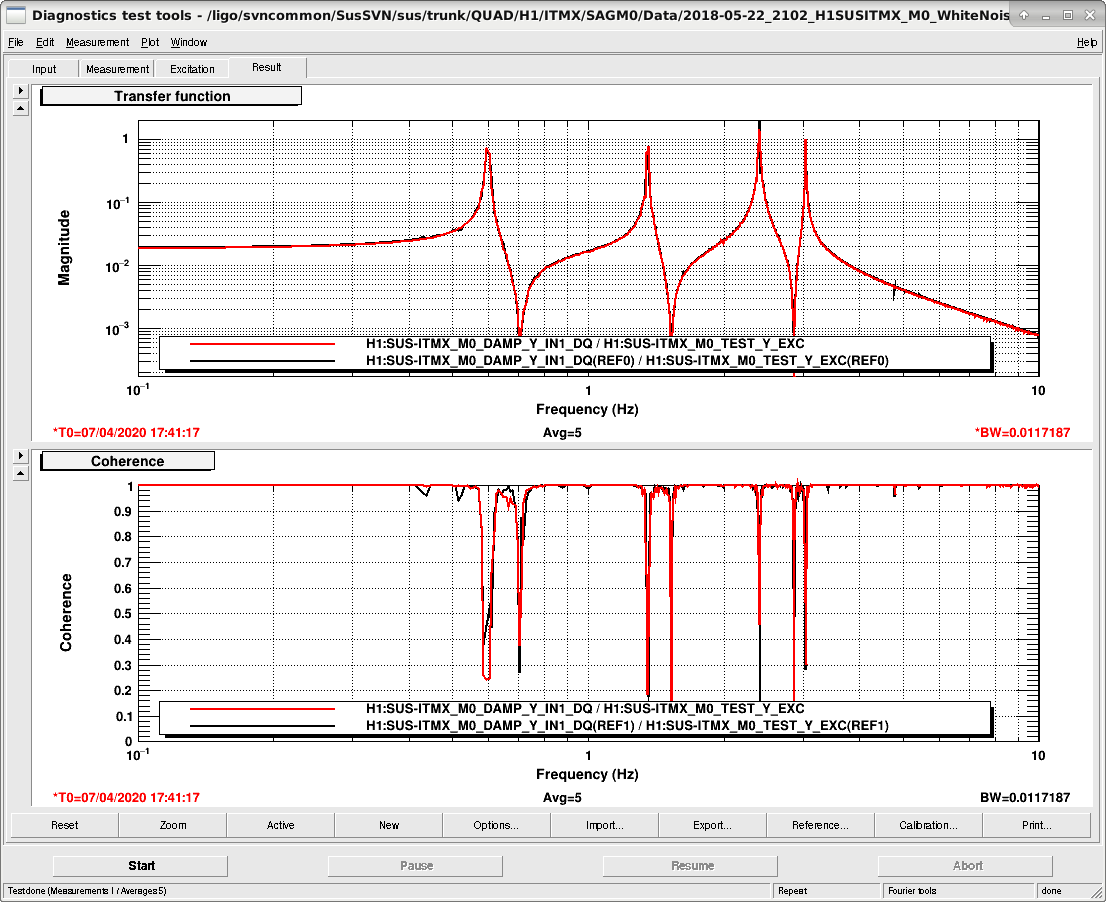
Transfer function measurements for ITMX, with all 6 dof shows that it is free of any rubbing and is healthy. Please find the screenshot attached below. The templates have been stored at the following location,
/ligo/svncommon/SusSVN/sus/trunk/QUAD/H1/ITMX/SAGM0/Data
2020-04-07_1800_H1SUSITMX_M0_WhiteNoise_L_0p01to50Hz.xml
2020-04-07_1800_H1SUSITMX_M0_WhiteNoise_P_0p01to50Hz.xml
2020-04-06_1800_H1SUSITMX_M0_WhiteNoise_R_0p01to50Hz.xml
2020-04-07_1800_H1SUSITMX_M0_WhiteNoise_T_0p01to50Hz.xml
2020-04-07_1800_H1SUSITMX_M0_WhiteNoise_V_0p01to50Hz.xml
2020-04-07_1800_H1SUSITMX_M0_WhiteNoise_Y_0p01to50Hz.xml
Changed file name from
2020-04-06_1800_H1SUSITMX_M0_WhiteNoise_R_0p01to50Hz.xml
to
2020-04-07_1800_H1SUSITMX_M0_WhiteNoise_R_0p01to50Hz.xml
such that it matches the rest of the file name group.
Summary: We do seem to have hysterisis in at least some of our suspentions after the Idaho EQ, similar to Montana, although we could get better data by moving the suspensions around more.
Here are some plots to follow up on the Idaho EQ, in addition to what has been posted in 55867, the initial report in 55838 and suspension TF checks posted in 55875 and 55869 and checks that suspensions are free in 55857.
These plots are made starting with the same script I used in 2017 to check for hysteresis on the quads, 37799 and comments, and a follow up in 37972.
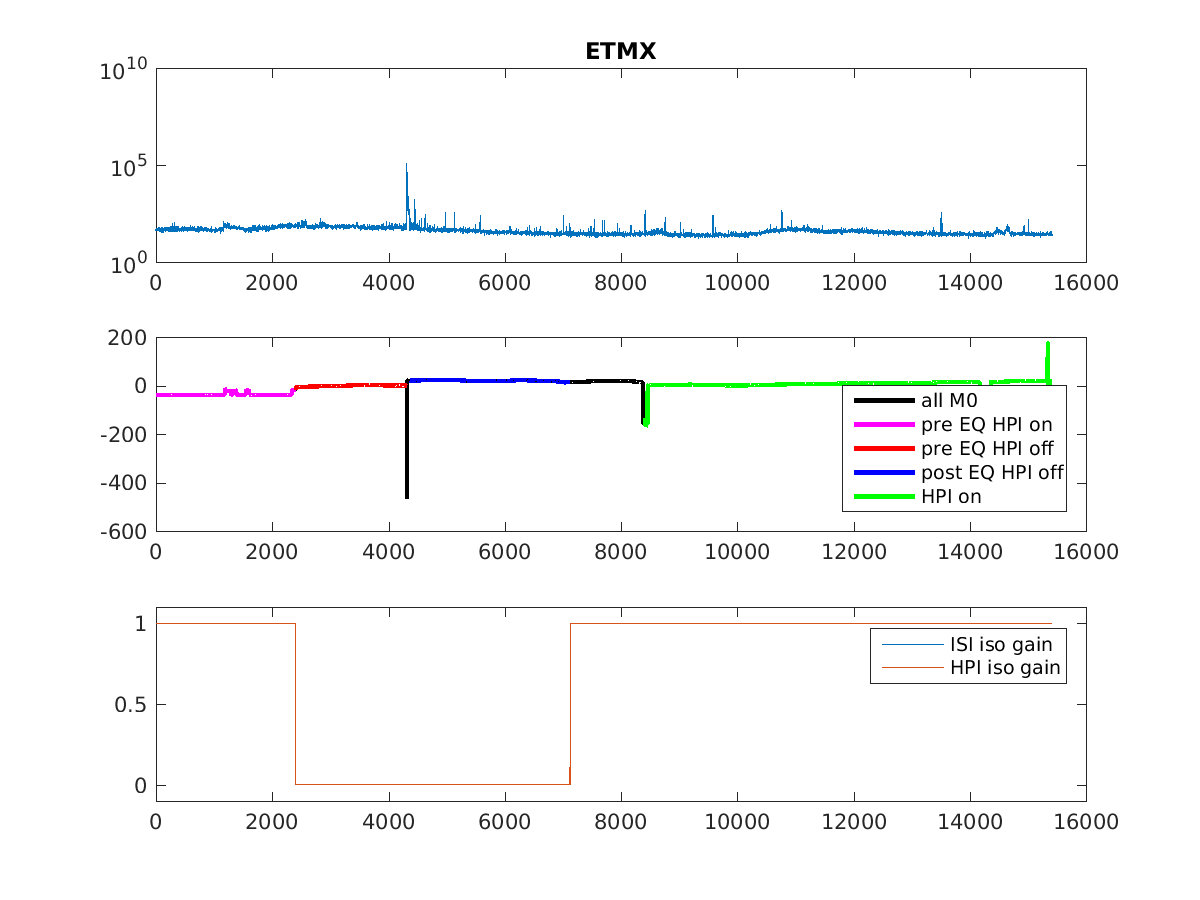
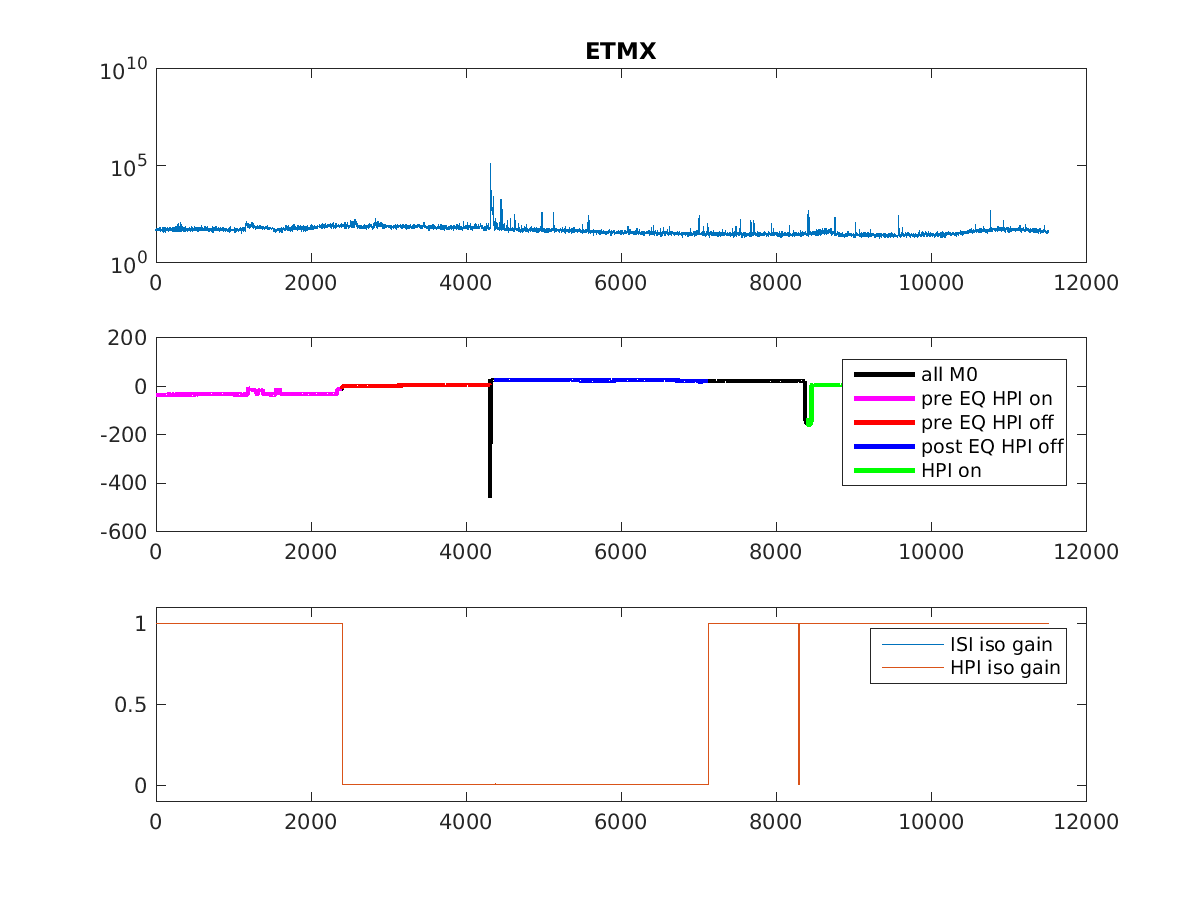
The first attachment is a time series just meant to help make it easier to understand the second plot. I've taken several days of minute trends around the time of the EQ, removed the means of the top mass pitch osem read backs, and the drive applied to the top match pitch. The torque I've scaled so that it is in units of urad displacement that we would expect for this drive. The time line is a little more complicated than the Montana quake, because we transitioned the observatory to phase 3 (for COVID) and set the HEPIs to offline. In the first attachment the full data is in black but data which is used in the second plot is color coded to illustrate the different time periods, HPI isolate before the EQ, HEPI off before and after the EQ, and HPI isolated after the EQ.
The second plot isn't as nice of an illustration of the hysteresis as they were in 2017, in part because we haven't exercised the alignment sliders as much in the aftermath of this EQ (we haven't tried to relock the IFO). Based on these plots if we had to prioritize quads for more diagnostics or TMDS, ITMY looks the worst, followed by ITMX and ETMX.
It is interesting that ETMY has the least evidence for hysteresis, since that is the suspension that was probably rubbing while HPI was offline 55848
Chandra R., is my "buddy" and I am keeping her abrest of my comings and goings. Mostly I'll be tinkering with the new HEPTA pump installation in the Mechanical Room. I plan on staying until 4ish and will make a log entry when I leave.
Today, I terminated the panel-end wiring for the SEAL PURGE SOLENOID VALVE, SEAL PURGE FLOW SWITCH and PUMP TEMPERATURE SWITCH for the VERTEX+YBM HEPTA pump. What should have taken 1 hr. ended up taking much of the day as I had to hunt down an intermittent connection burried deep in the control panel that revealed itself during testing - "ugh!" With the solenoid valve now working (supplies seal purge flow to rear the shaft seals), I was able to verify that the resulting increase in flow demand did not starve-out the lesser flow supplying the front-end shaft seal purge which branches from the supply prior to the solenoid valve - good! This pump still has a pre-production HEPTA INTAKE ADAPTER FLANGE that will likely get replaced even though it is working (specially because it is working! - its a Kyle thing). Left to do is to hook up the bottled N2 and to terminate the panel-end wires for the "air-to-open, spring-to-close" gate valve at the HEPTA intake and then to do full testing via the Turbo Control Panel.
At Cheryl V.'s request, I muted the Team Speak microphone in the control room. At Richard M.'s request, I de-energized the (blue-faced, unlabeled) 18VDC and +/- 430VDC ESD power supplies at EX.
Neither of the two NORCO drivers had phoned me this morning to notify me of their on-site presence. Luckily, Scott L. noticed the first driver and opened the gate. I had to, then, stare out of the window for 30 minutes in anticipation of the 2nd truck.
1708 hrs. local -> Leaving site now.
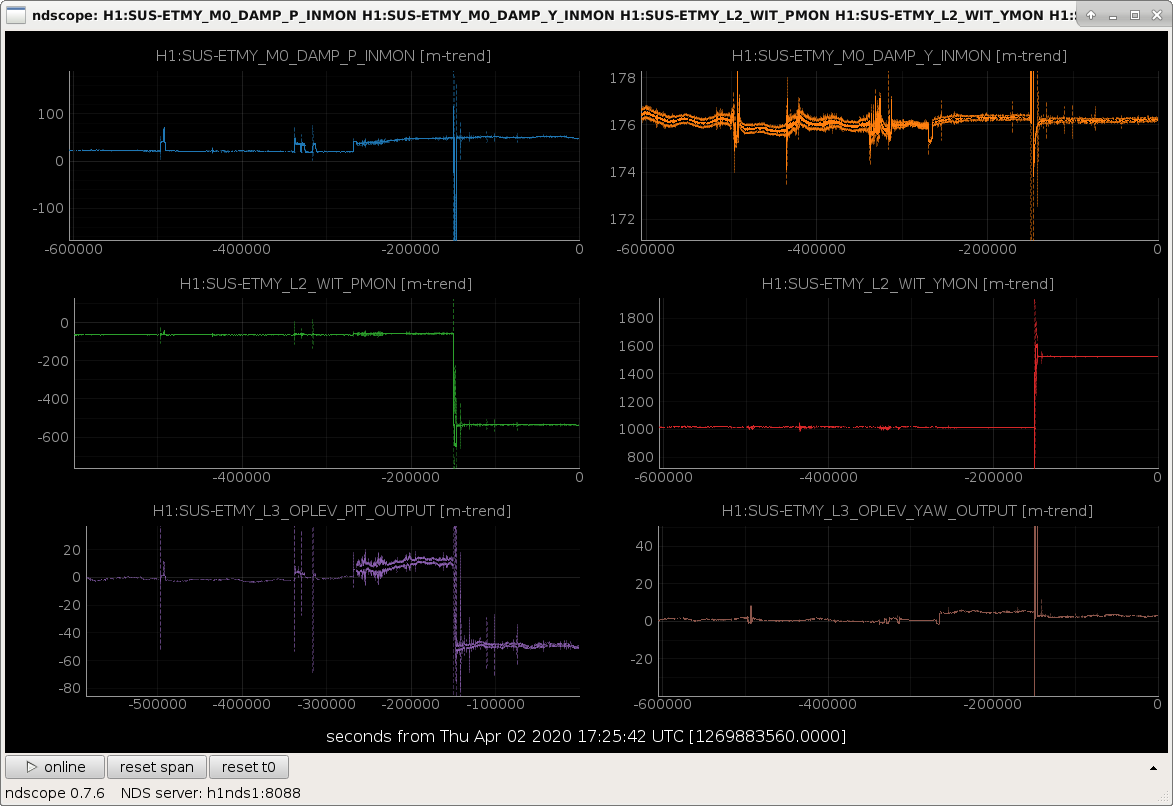
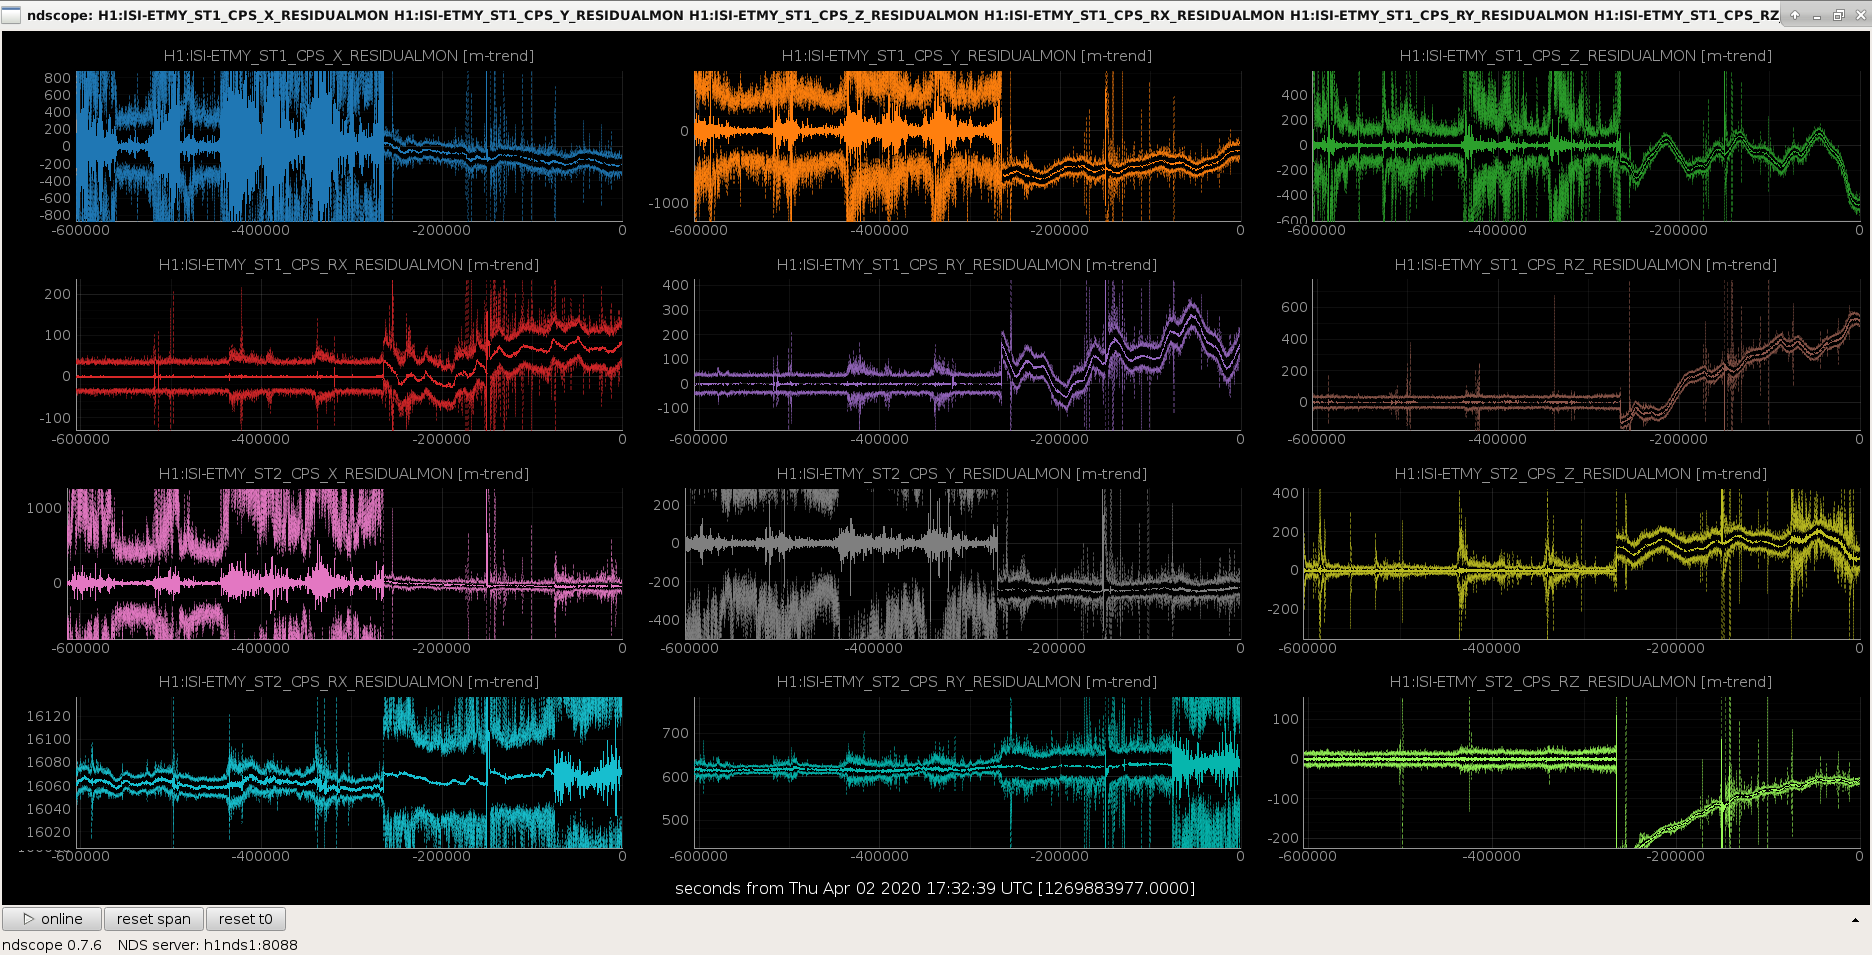
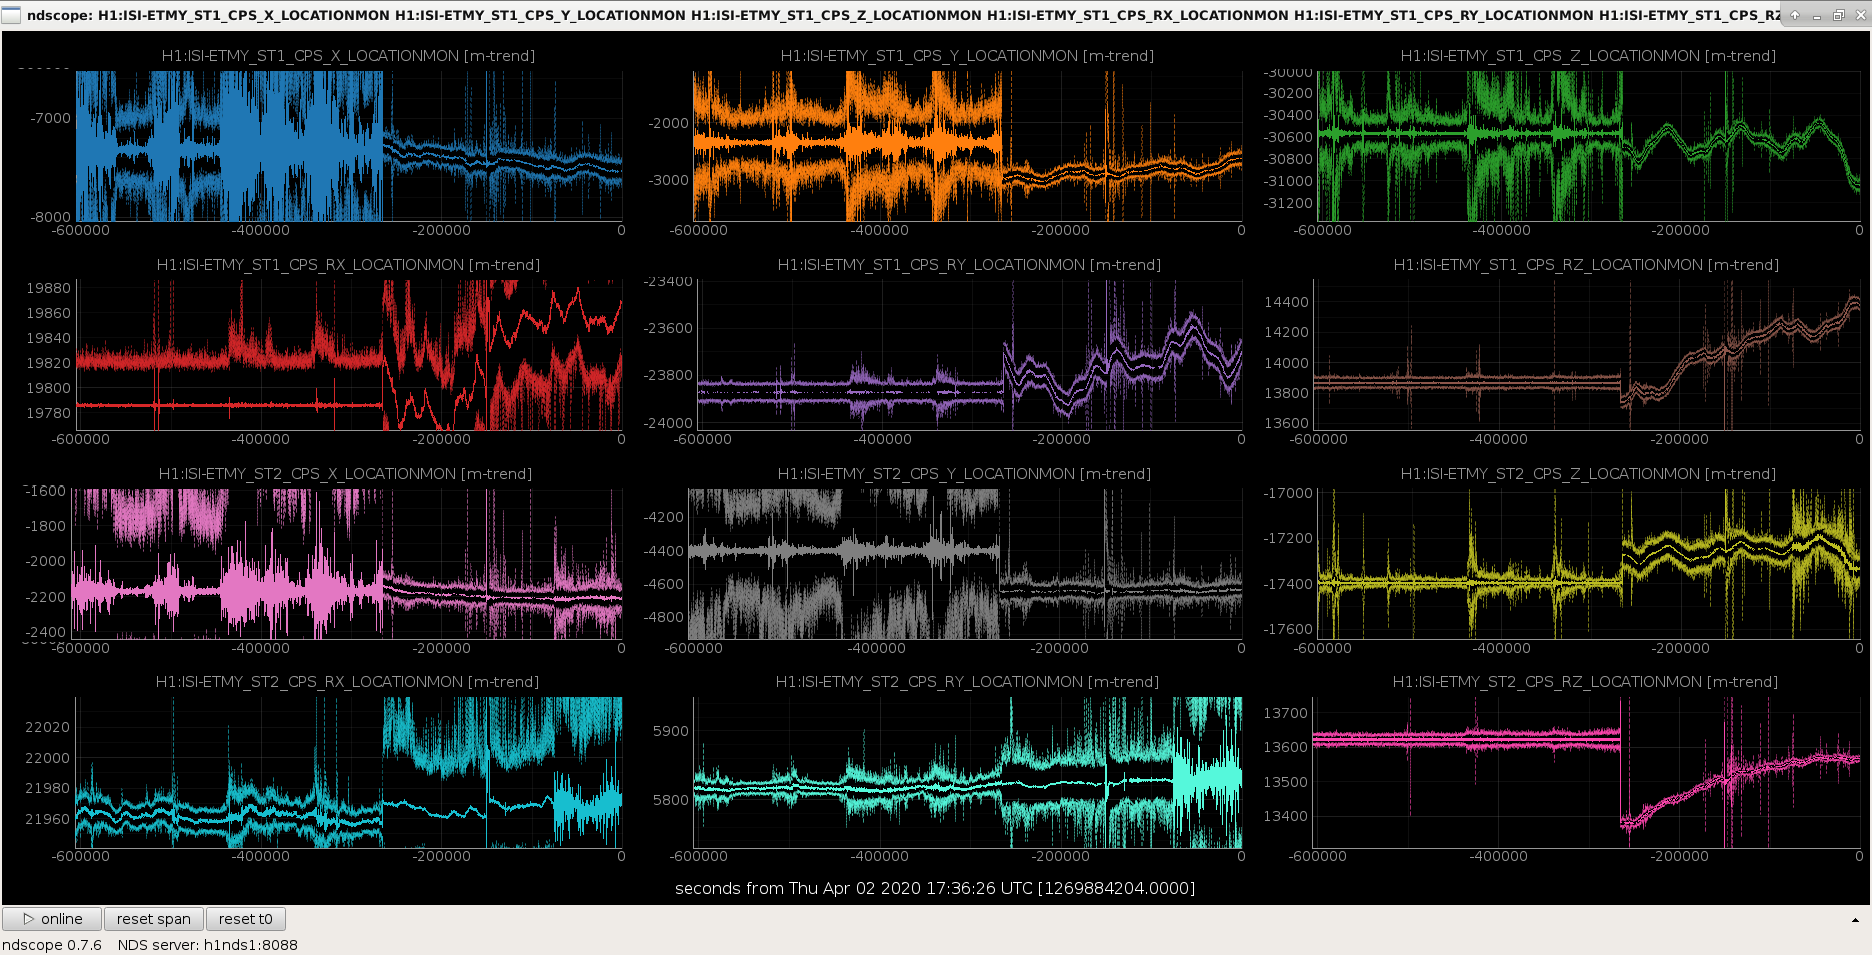
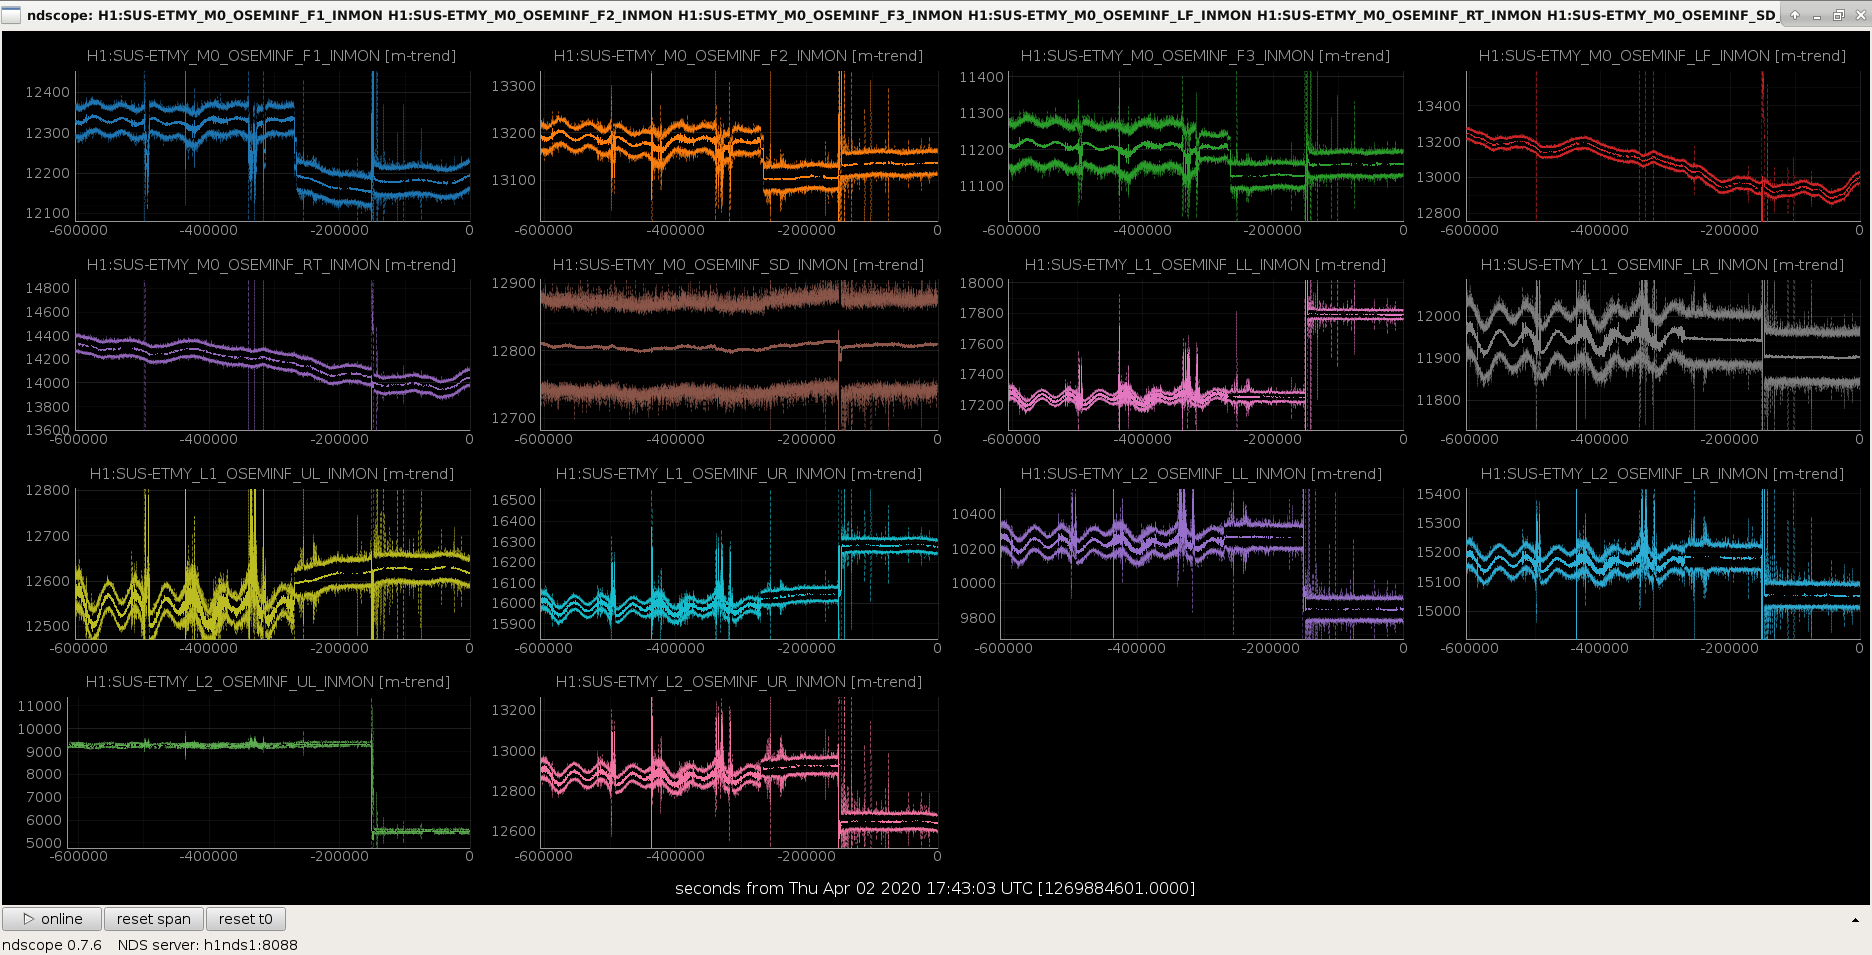
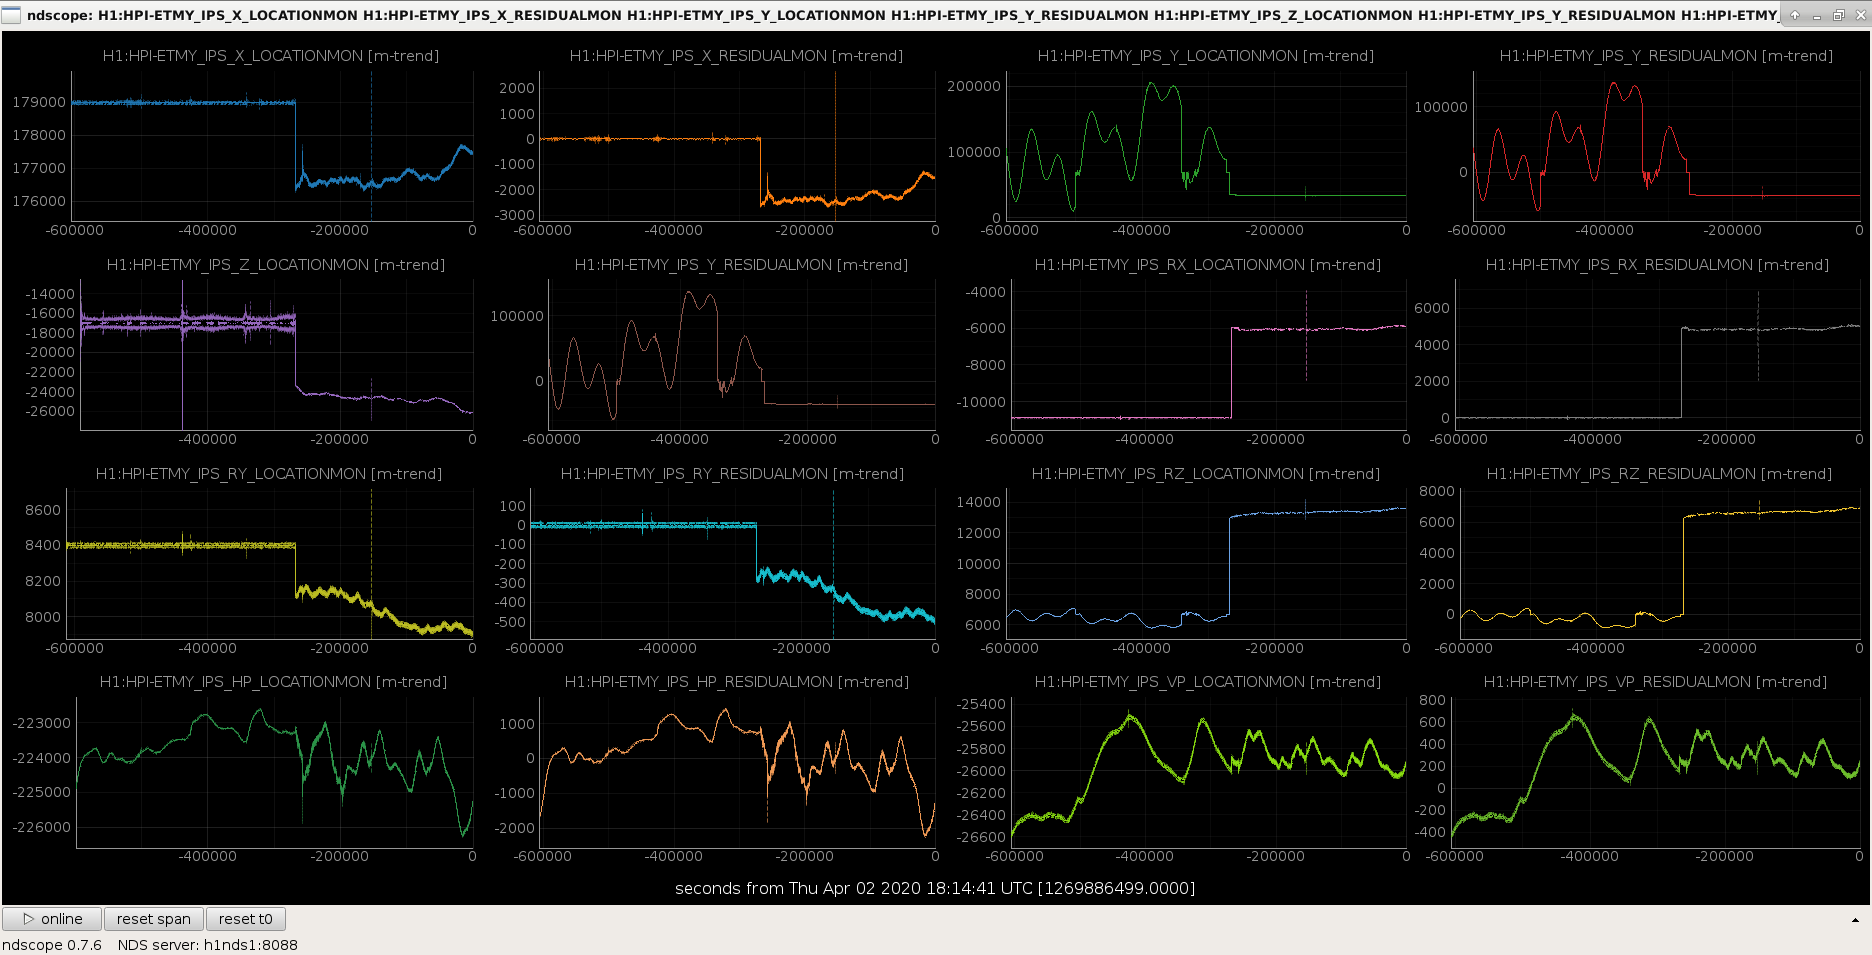
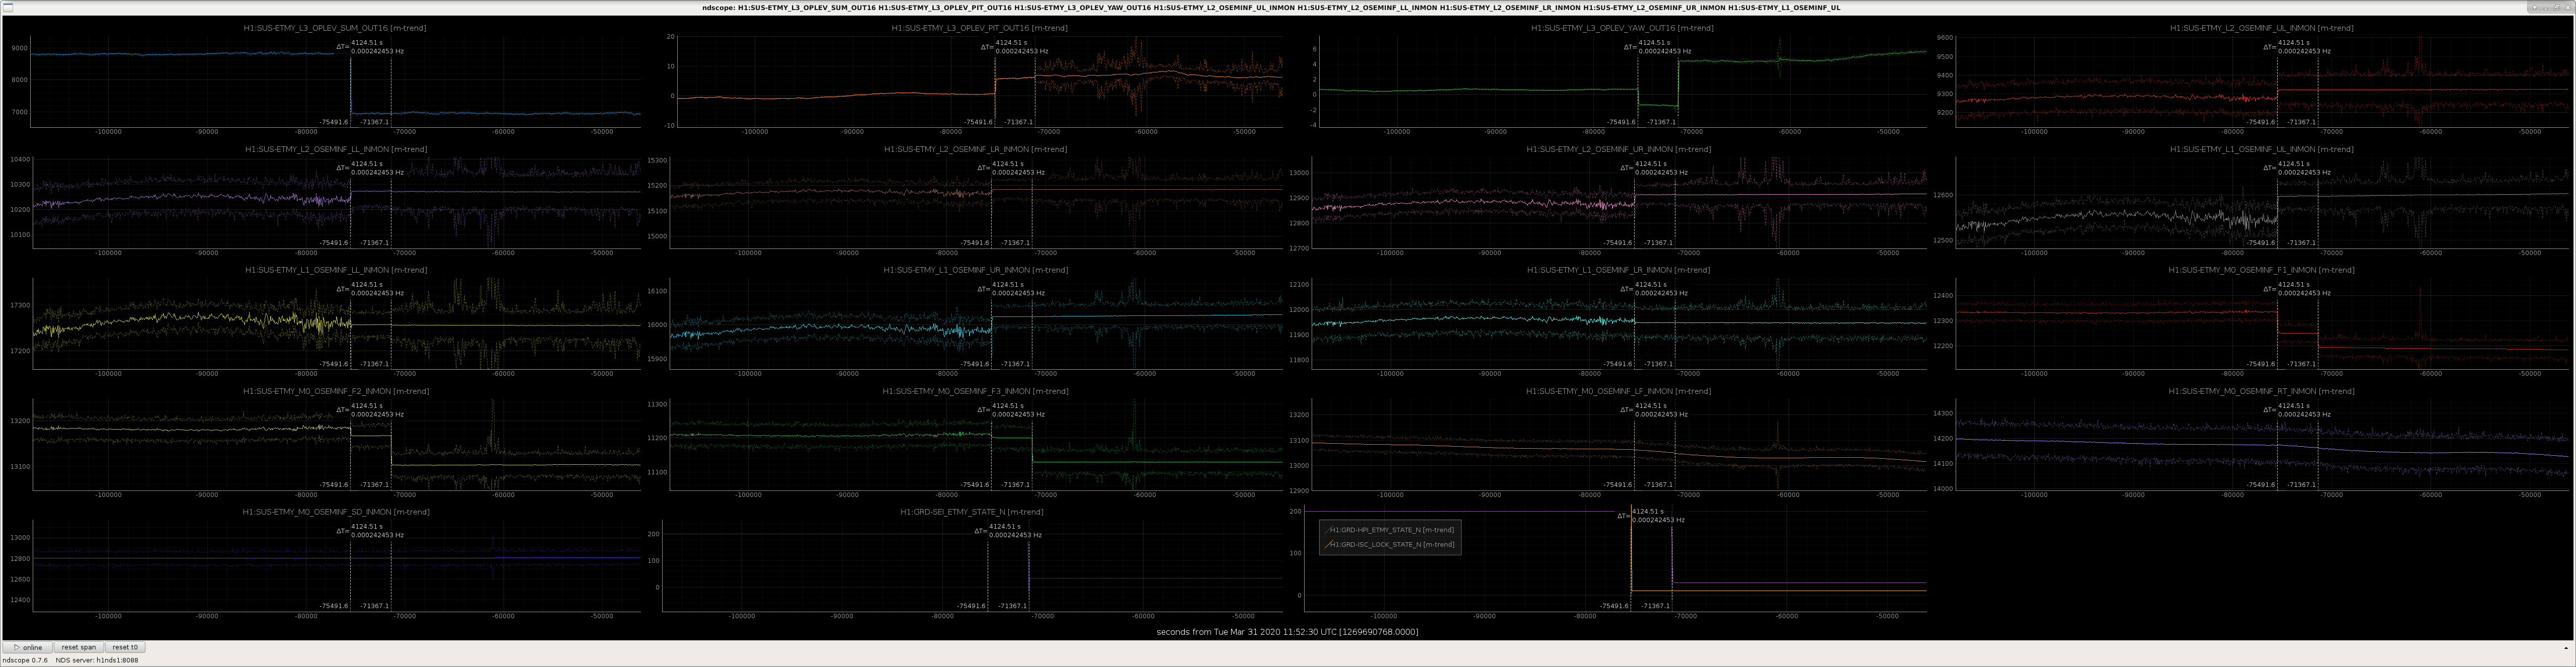
Attached are plots of ETMY OSEMS, pitch and yaw, ISI ST1 and ST2 location monitors and their residuals, and HEPI location monitors and their residuals. In all plots, the first change (if present) is due to disengaging HEPI, and the second change (if present) is due to the Idaho M6.4 earthquake.
Plot 4 shows that ETMY L2 signals become very steady after the HEPI change, and shift after the EQ, and remain in the changed position, and remain very steady, which I believe suggests that L2 is touching.
Plots attached are in the order I created them, while looking into why the ETMY optical lever in pitch is now sitting at -50.
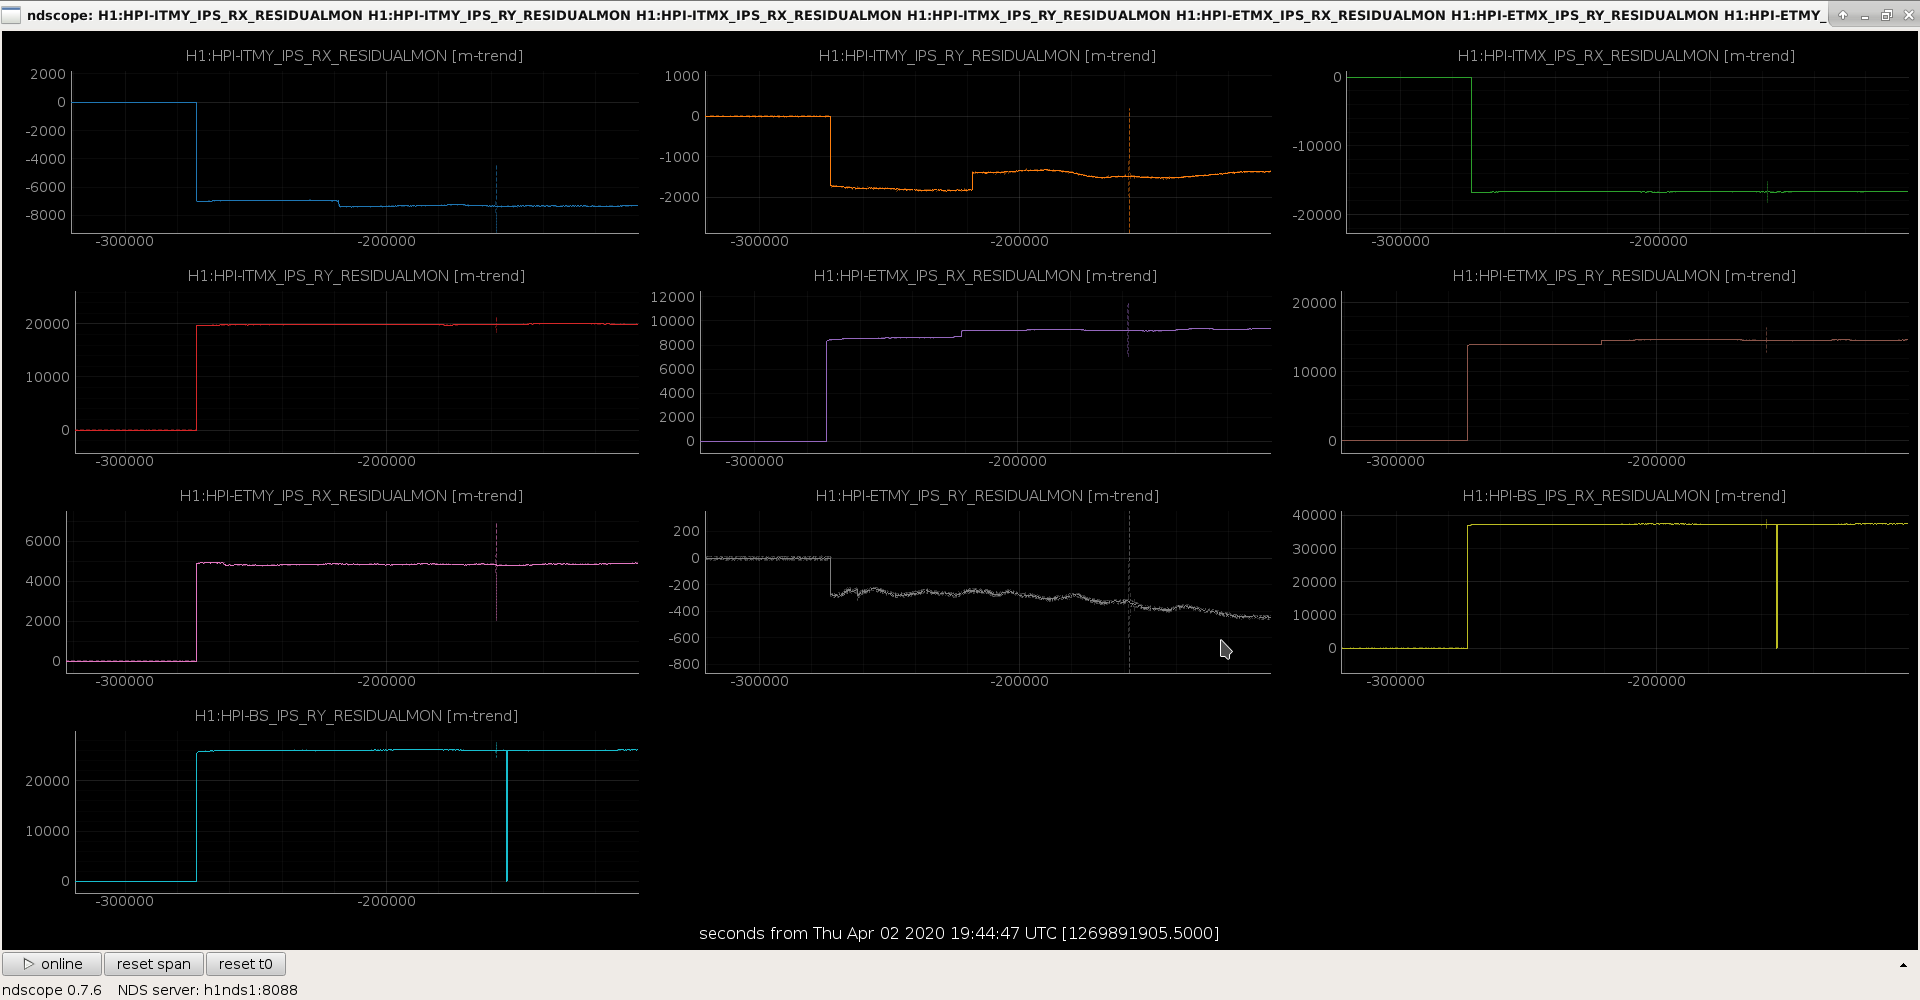
Attaching the RX/RY residualmons for all the BSC HEPIs over a similar window. The biggest shifts are about 40 urad, on the BS, most are less than 20 though. The ETMY shift is relatively small, about 7 urad in RX, more or less pitch for that SUS. Do we have any idea of how much pitch is allowed by the given the clearance in the eq stops?
Upon further zooming in, it looks like this effect is due to the IFO being unlocked (the first t-cursor in the attached plot), and not the HEPI state being changed (second t-cursor in the attached plot).
I suspect that much of the effect of the L2 OSEMS looking more 'staionary' is that we're no longer actuating the optic with angular control once we unlock. I do also note that in the pitch oplev, we see that there is a shift when the IFO is unlocked, but not any real shift when the HEPI is taken offline (yaw sees a shift for both), but the motion as seen by the oplev is higher, becasue the seismic platform just isn't as isolated.
Rahul is in process of taking TFs to confirm that even with the HEPI in READY we're not rubbing. He'll post those in a separate alog.
Thank you, Arnaud, for suggesting we have another look at this.