TITLE: 02/29 Eve Shift: 00:00-08:00 UTC (16:00-00:00 PST), all times posted in UTC
STATE of H1: Observing at 117Mpc
OUTGOING OPERATOR: Patrick
CURRENT ENVIRONMENT:
SEI_CONF state: WINDY
Wind: 20mph Gusts, 17mph 5min avg
Primary useism: 0.03 μm/s
Secondary useism: 0.27 μm/s
QUICK SUMMARY: Locked 1h30
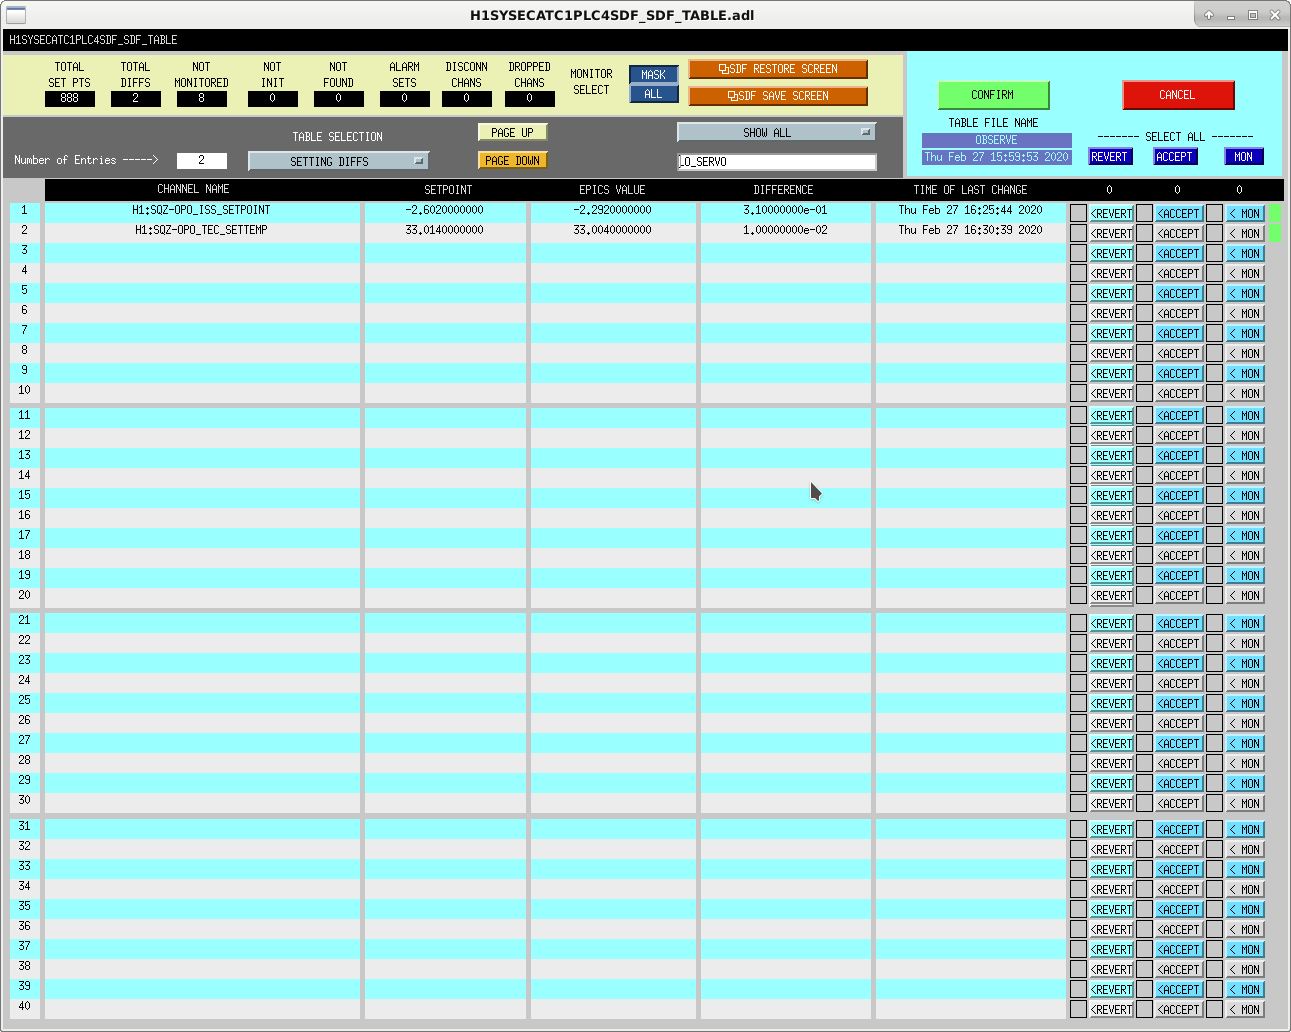
TITLE: 02/28 Day Shift: 16:00-00:00 UTC (08:00-16:00 PST), all times posted in UTC STATE of H1: Observing at 119Mpc INCOMING OPERATOR: Camilla SHIFT SUMMARY: Lost lock twice from observing. No obvious causes. No other issues. LOG: 17:03 UTC Niko to optics lab 17:14 UTC Lock loss from observing 17:17 UTC Lock loss from LOCKING_ALS 17:33 UTC Lock loss from ACQUIRE_DRMI_1F 17:41 UTC Lock loss from ENGAGE_DRMI_ASC 17:53 UTC Clicked 'revert changes' on OPS_OWL_SELECTION 18:01 UTC Lock loss from DARM_TO_DC_READOUT 18:21 UTC Lock loss from PREP_DC_READOUT_TRANSITION 19:09 UTC Observing. No SDF differences. 19:15 UTC Vanessa to mid X to clean 20:40 UTC Lock loss from observing 21:05 UTC Lock loss from MOVE_SPOTS 21:26 UTC Lock loss from ENGAGE_SOFT_LOOPS Scott to mid X 21:37 UTC Lock loss from ACQUIRE_PRMI 21:50 UTC Scott back 22:01 UTC Lock loss from DAMP_BOUNCE 22:41 UTC Observing. No SDF differences.
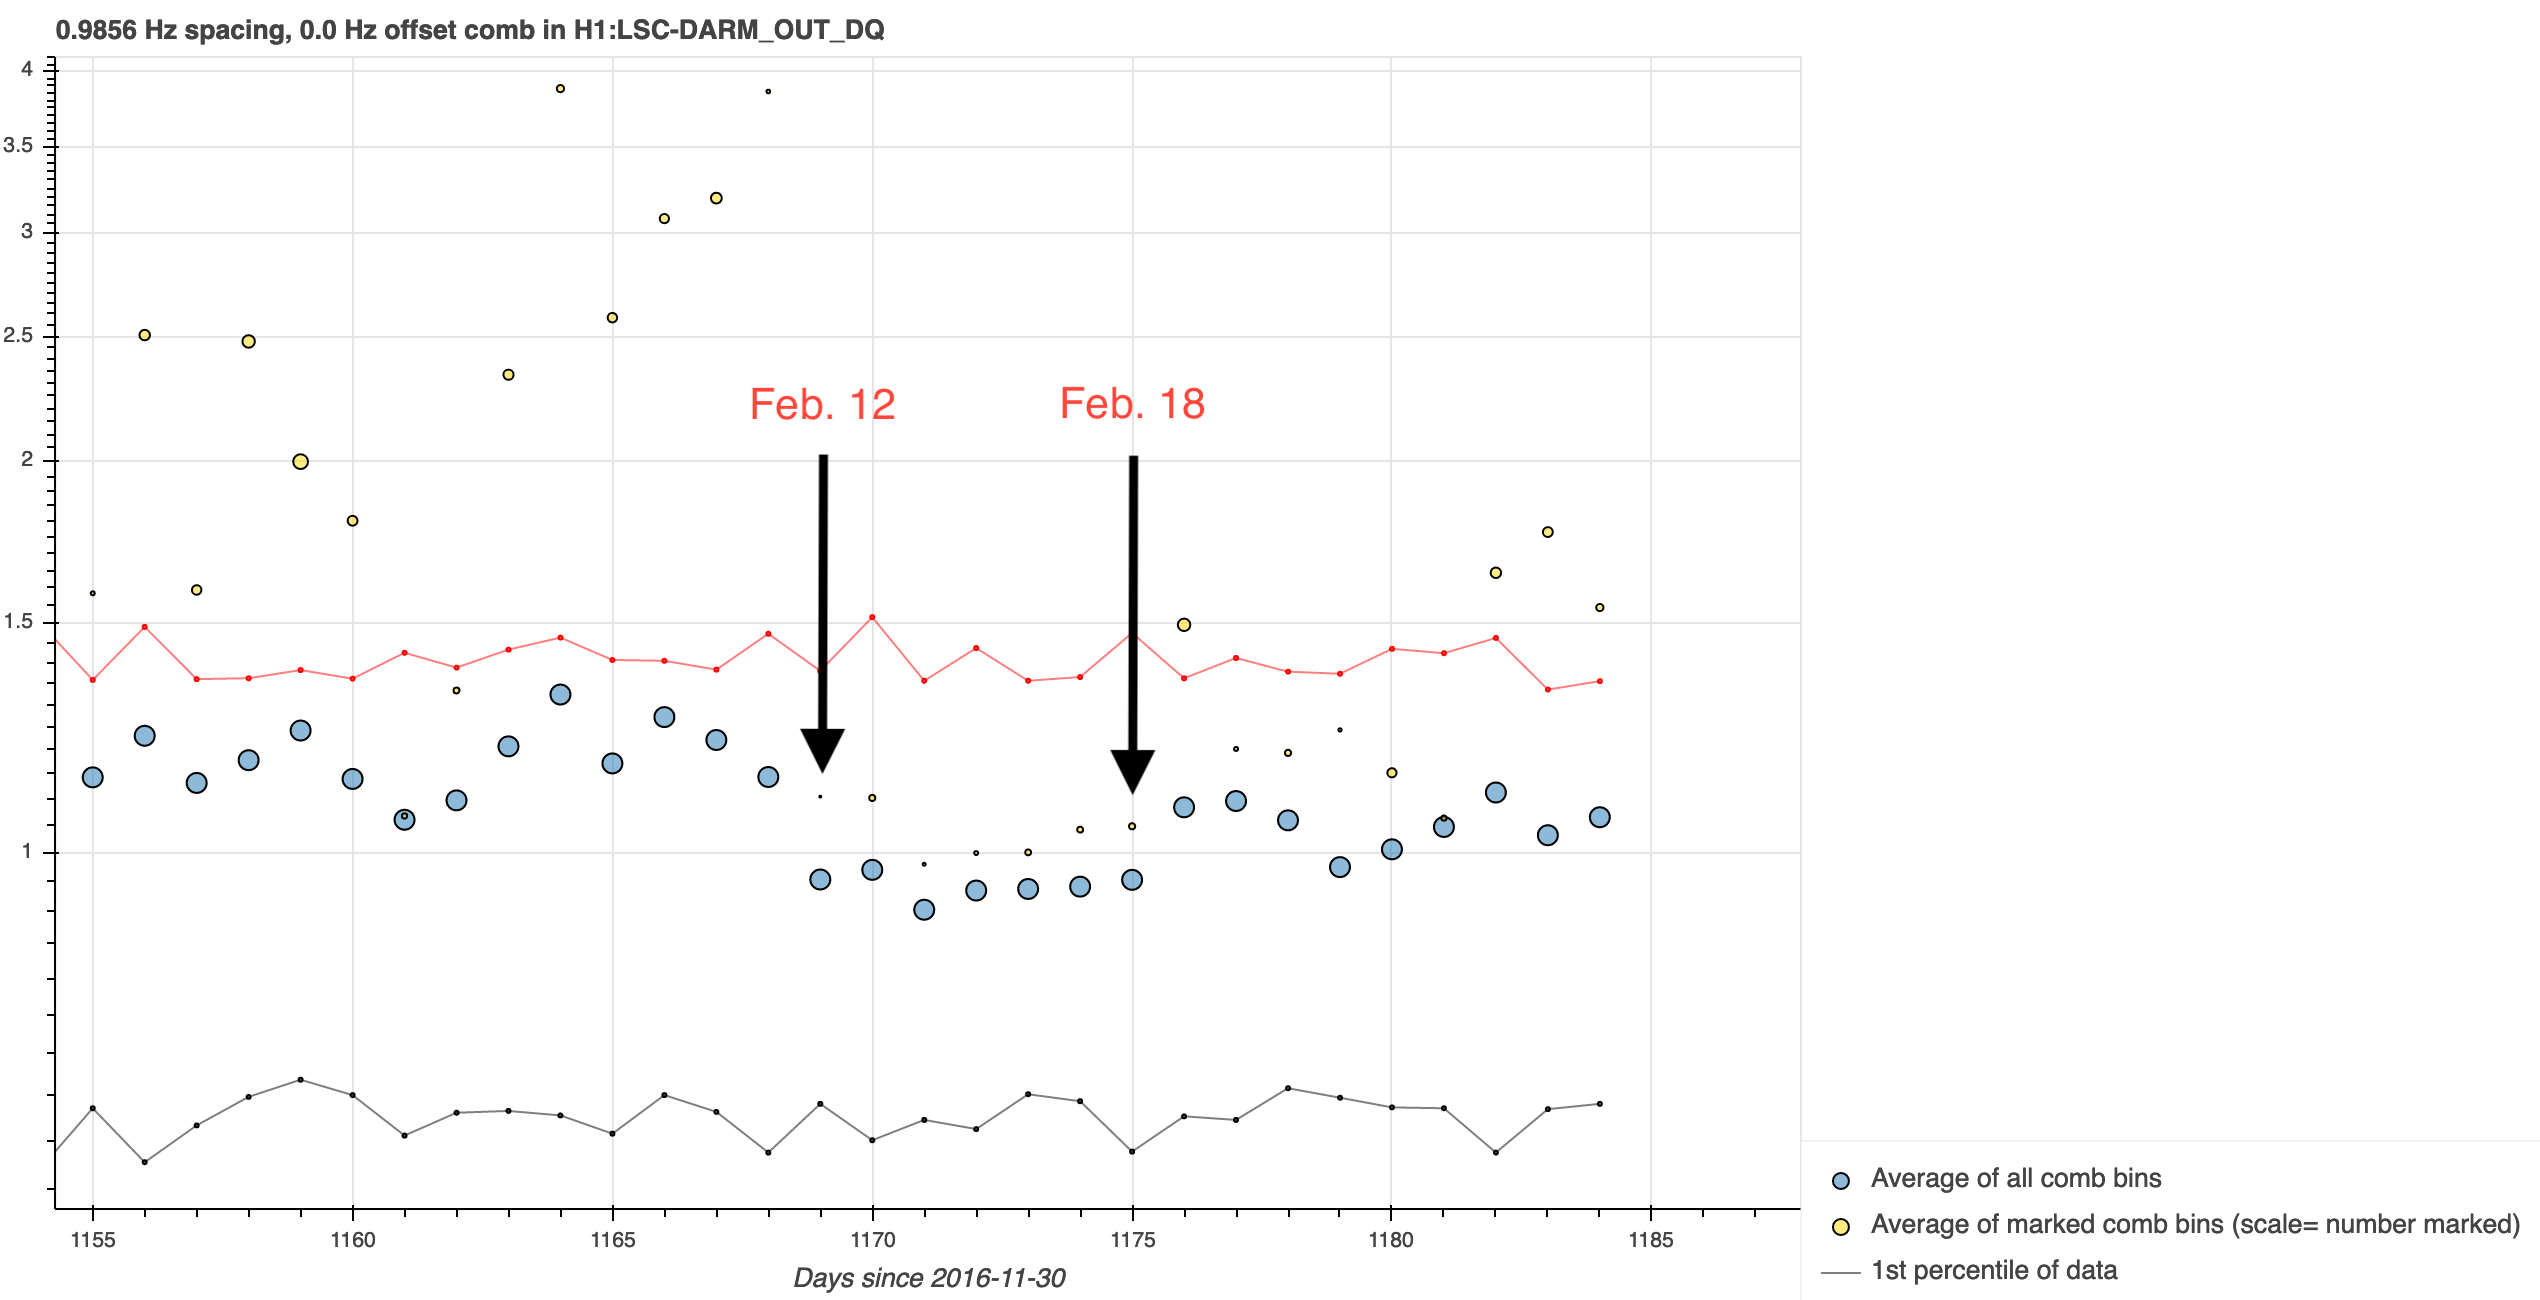
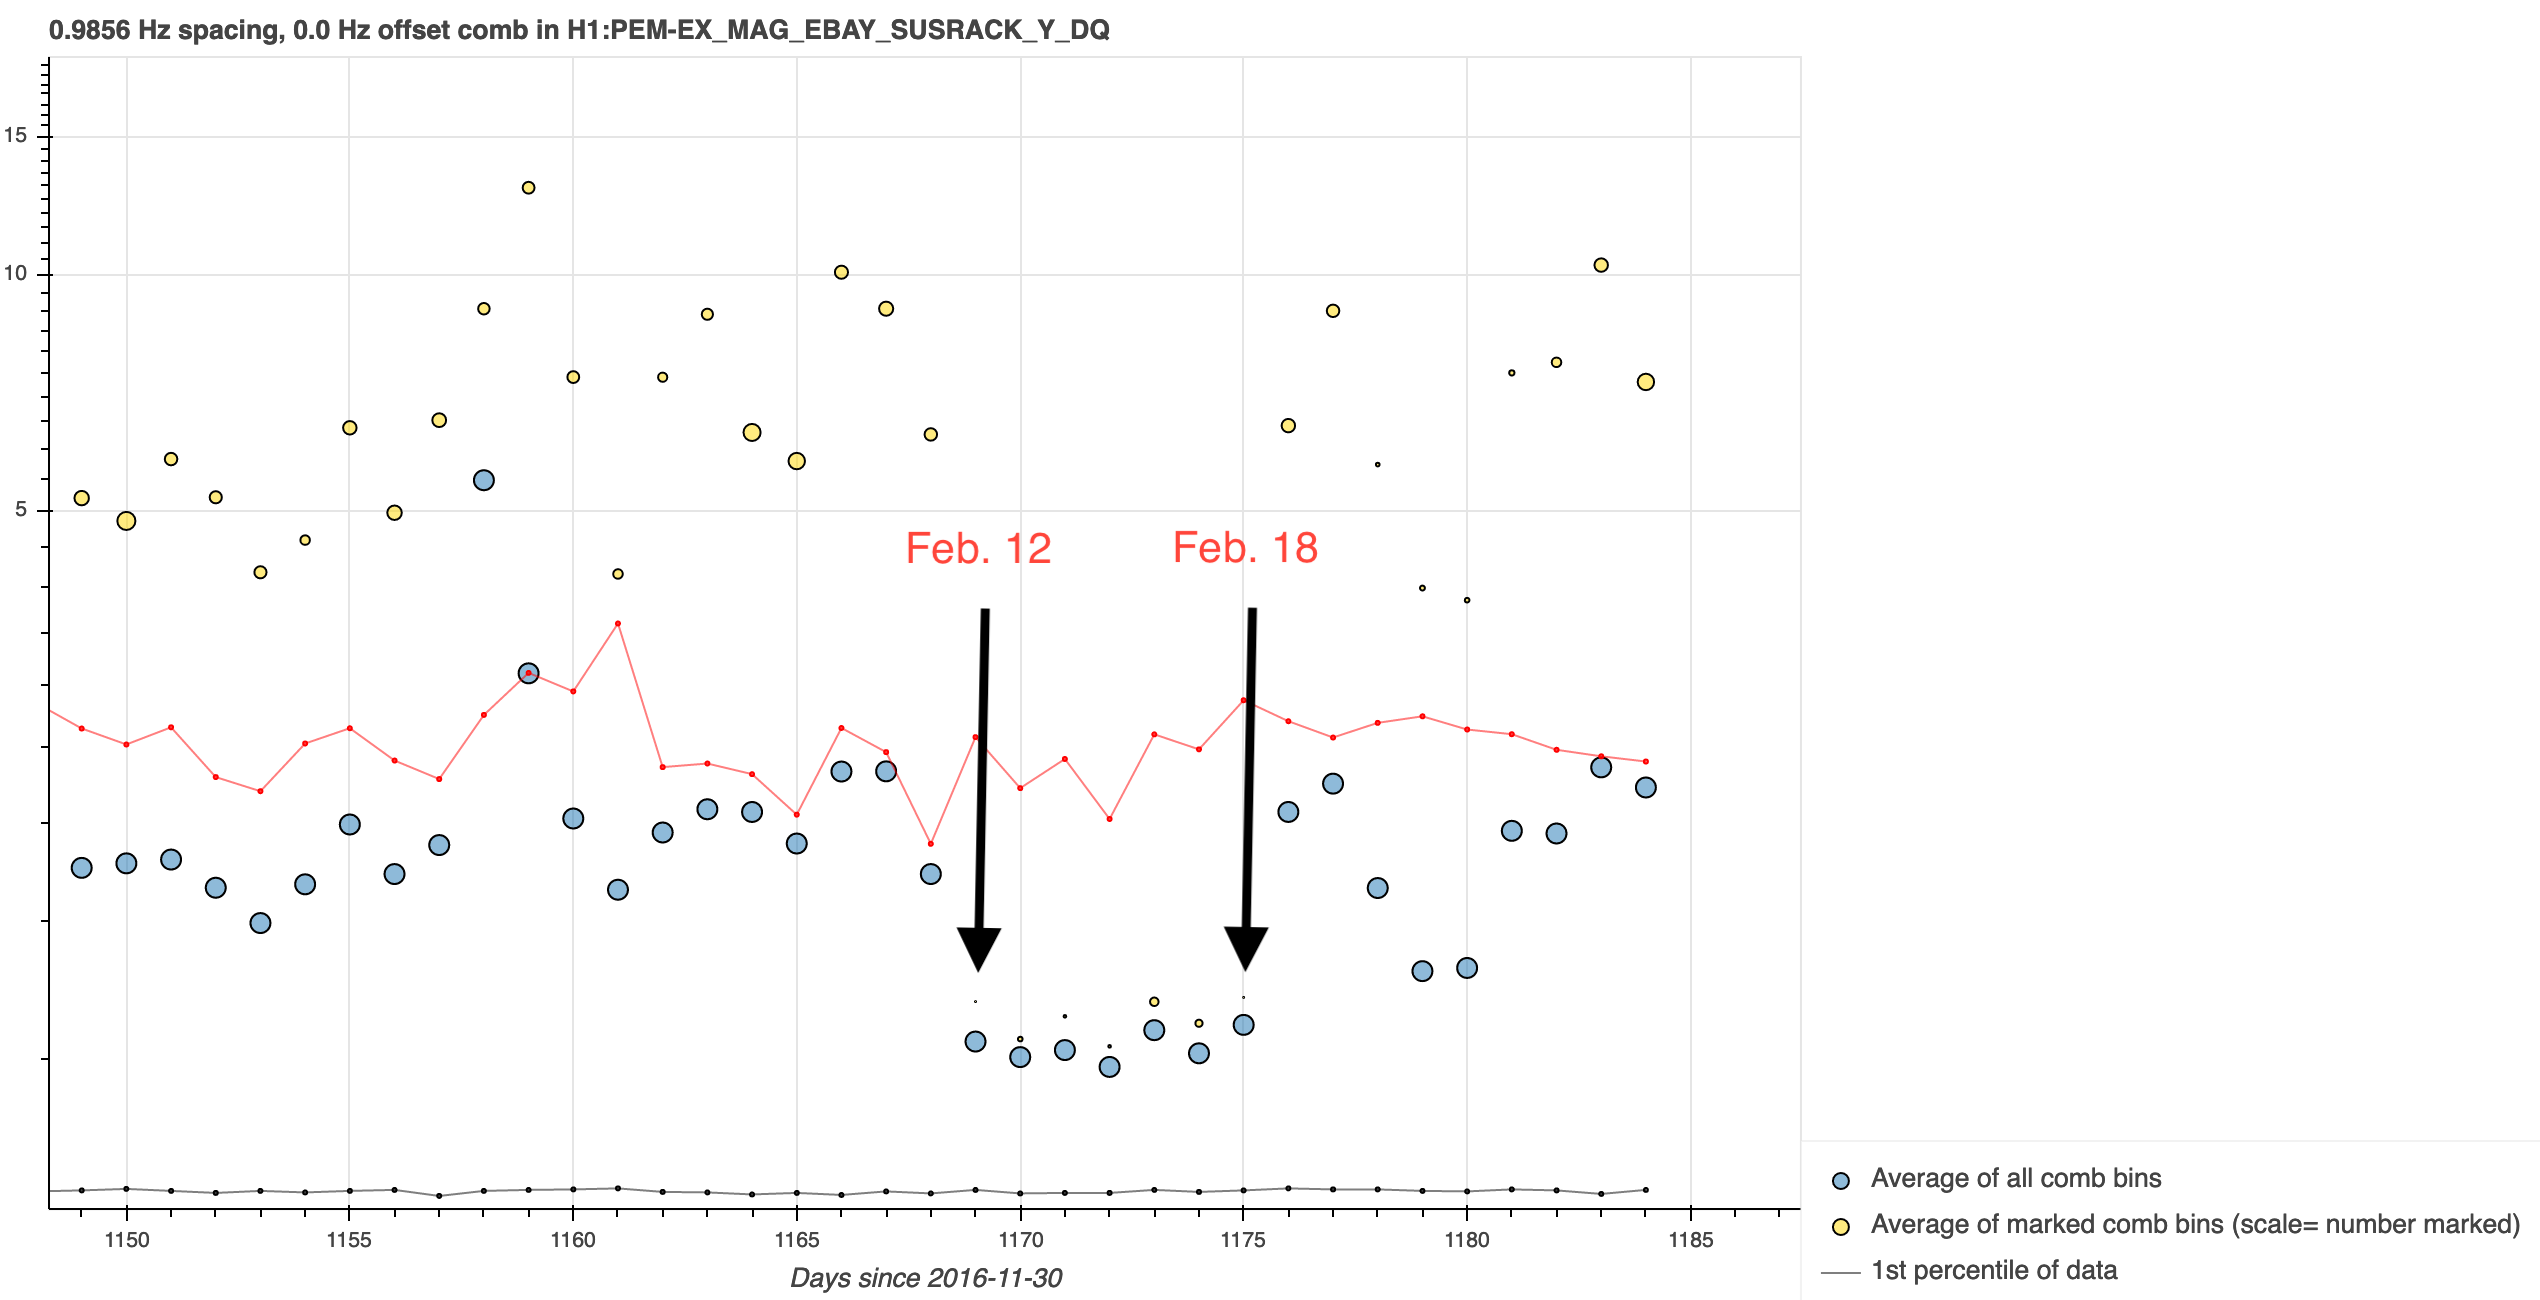
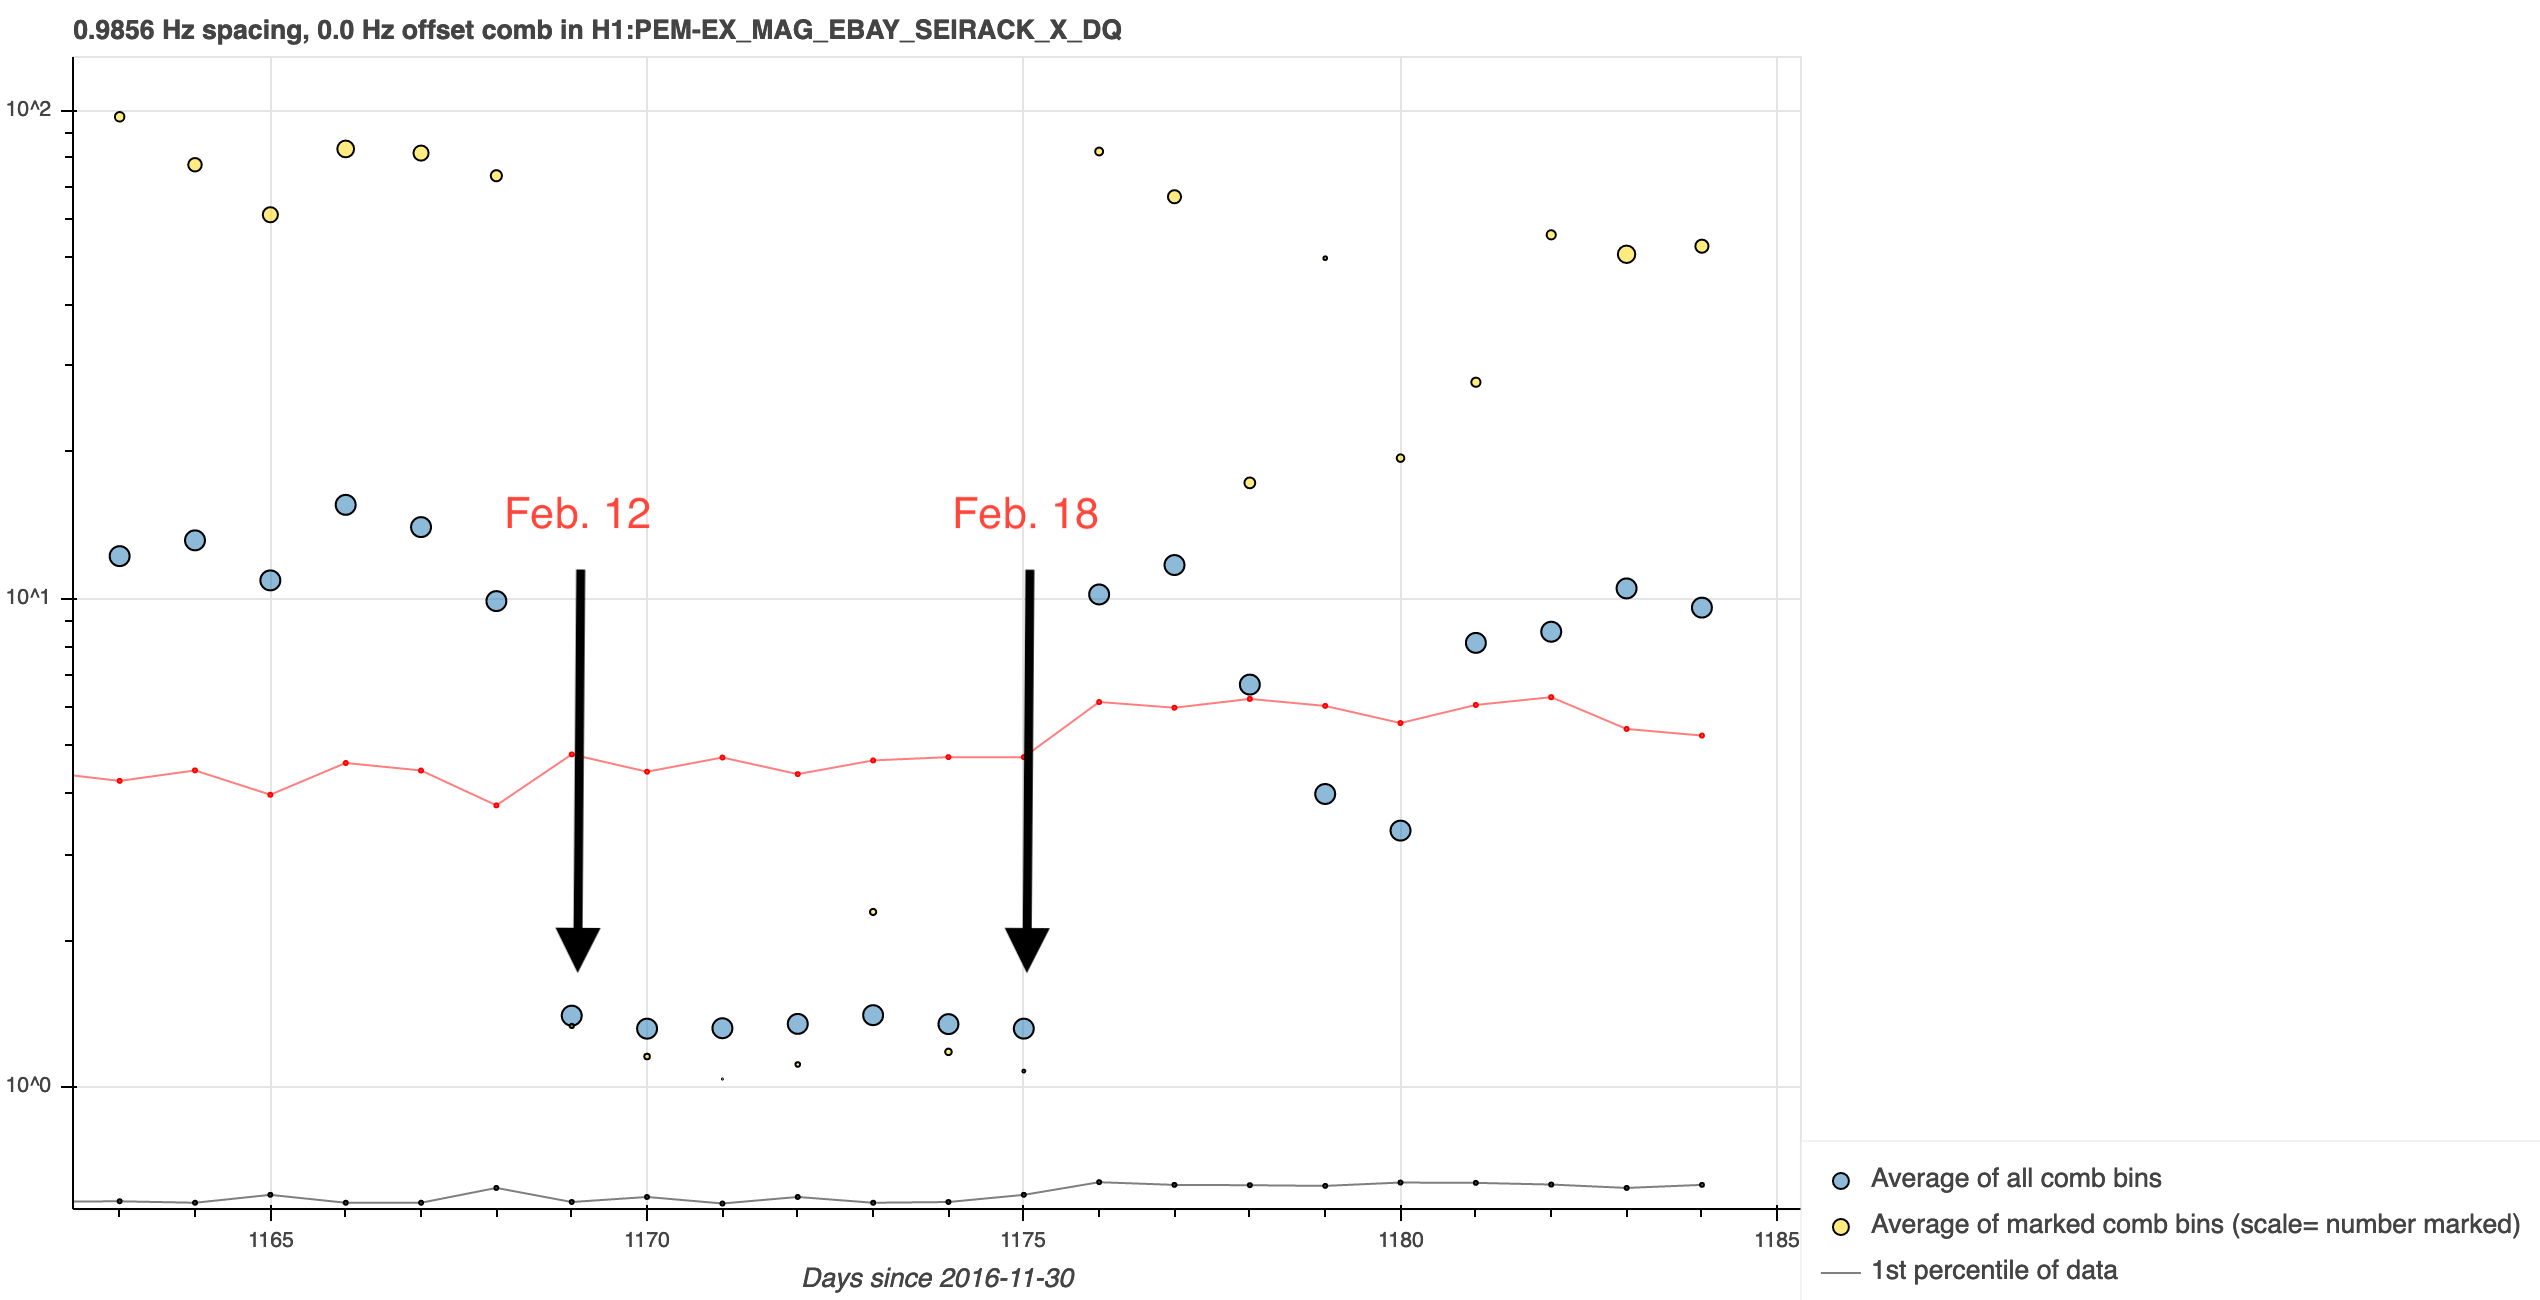
There had been some recent activity to see if any electronics configuration changes at EX might have an impact on spectral lines in long coherence spectra of h(t). I've gathered up some tentative evidence that changes implemented from Feb. 12 - 18 had a positive impact on h(t). It appears that whatever changed that period was reverted. I don't know what was done that particular week, the CDS folks like Richard and Fil will have better knowledge than me, but here's what I find: Figure 1: Ratio of 1 week of averaged 1800 s SFT data (week 46, Feb. 11-17) over the whole O3 cumulative averaged SFT data. What sticks out to me (and is not seen any other week of O3) is the comb of lines that drop below the ratio of 1.0, marked by the red ellipse. The comb spacing is 0.9856 Hz. (link to the data) Figure 2: From the comb tracking summary page, a zoom in on the 0.9856 Hz comb that is being tracked in the H1:LSC-DARM_OUT_DQ channel. Here, both yellow and blue data points drop noticibly on Feb. 12 and remain fairly low until Feb. 18. After Feb. 18, there seems to be more variation, although it is still a little lower than before Figure 3: The same comb tracking page also tracks a few auxiliary channels. Here is H1:PEM-EX_MAG_EBAY_SUSRACK_Y_DQ showing the strongest decrease. I wanted to be sure it's not just coupling from the SUS channels feeding back so I look further away on a magnetometer placed in the SEI rack in the next figure Figure 4: Here is the H1:PEM-EX_MAG_EBAY_SEIRACK_X_DQ channel showing the biggest decrease, larger than in the SUSRACK, nearly an order of magnitude smaller. Unfortunately, the week 47 ratio plot shows that the improvement did not stick around. I'm not sure if that's because some configuration was reverted. In summary, the evidence is partial that whatever was done at EX for the electronics configuration did seem to have some partial benefit. Perhaps this work will yield a better and permanent fix in the future.
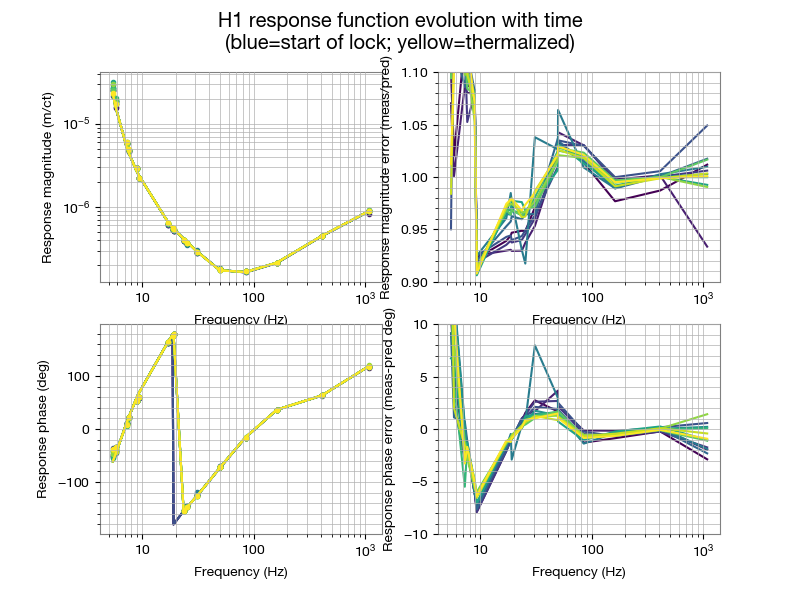
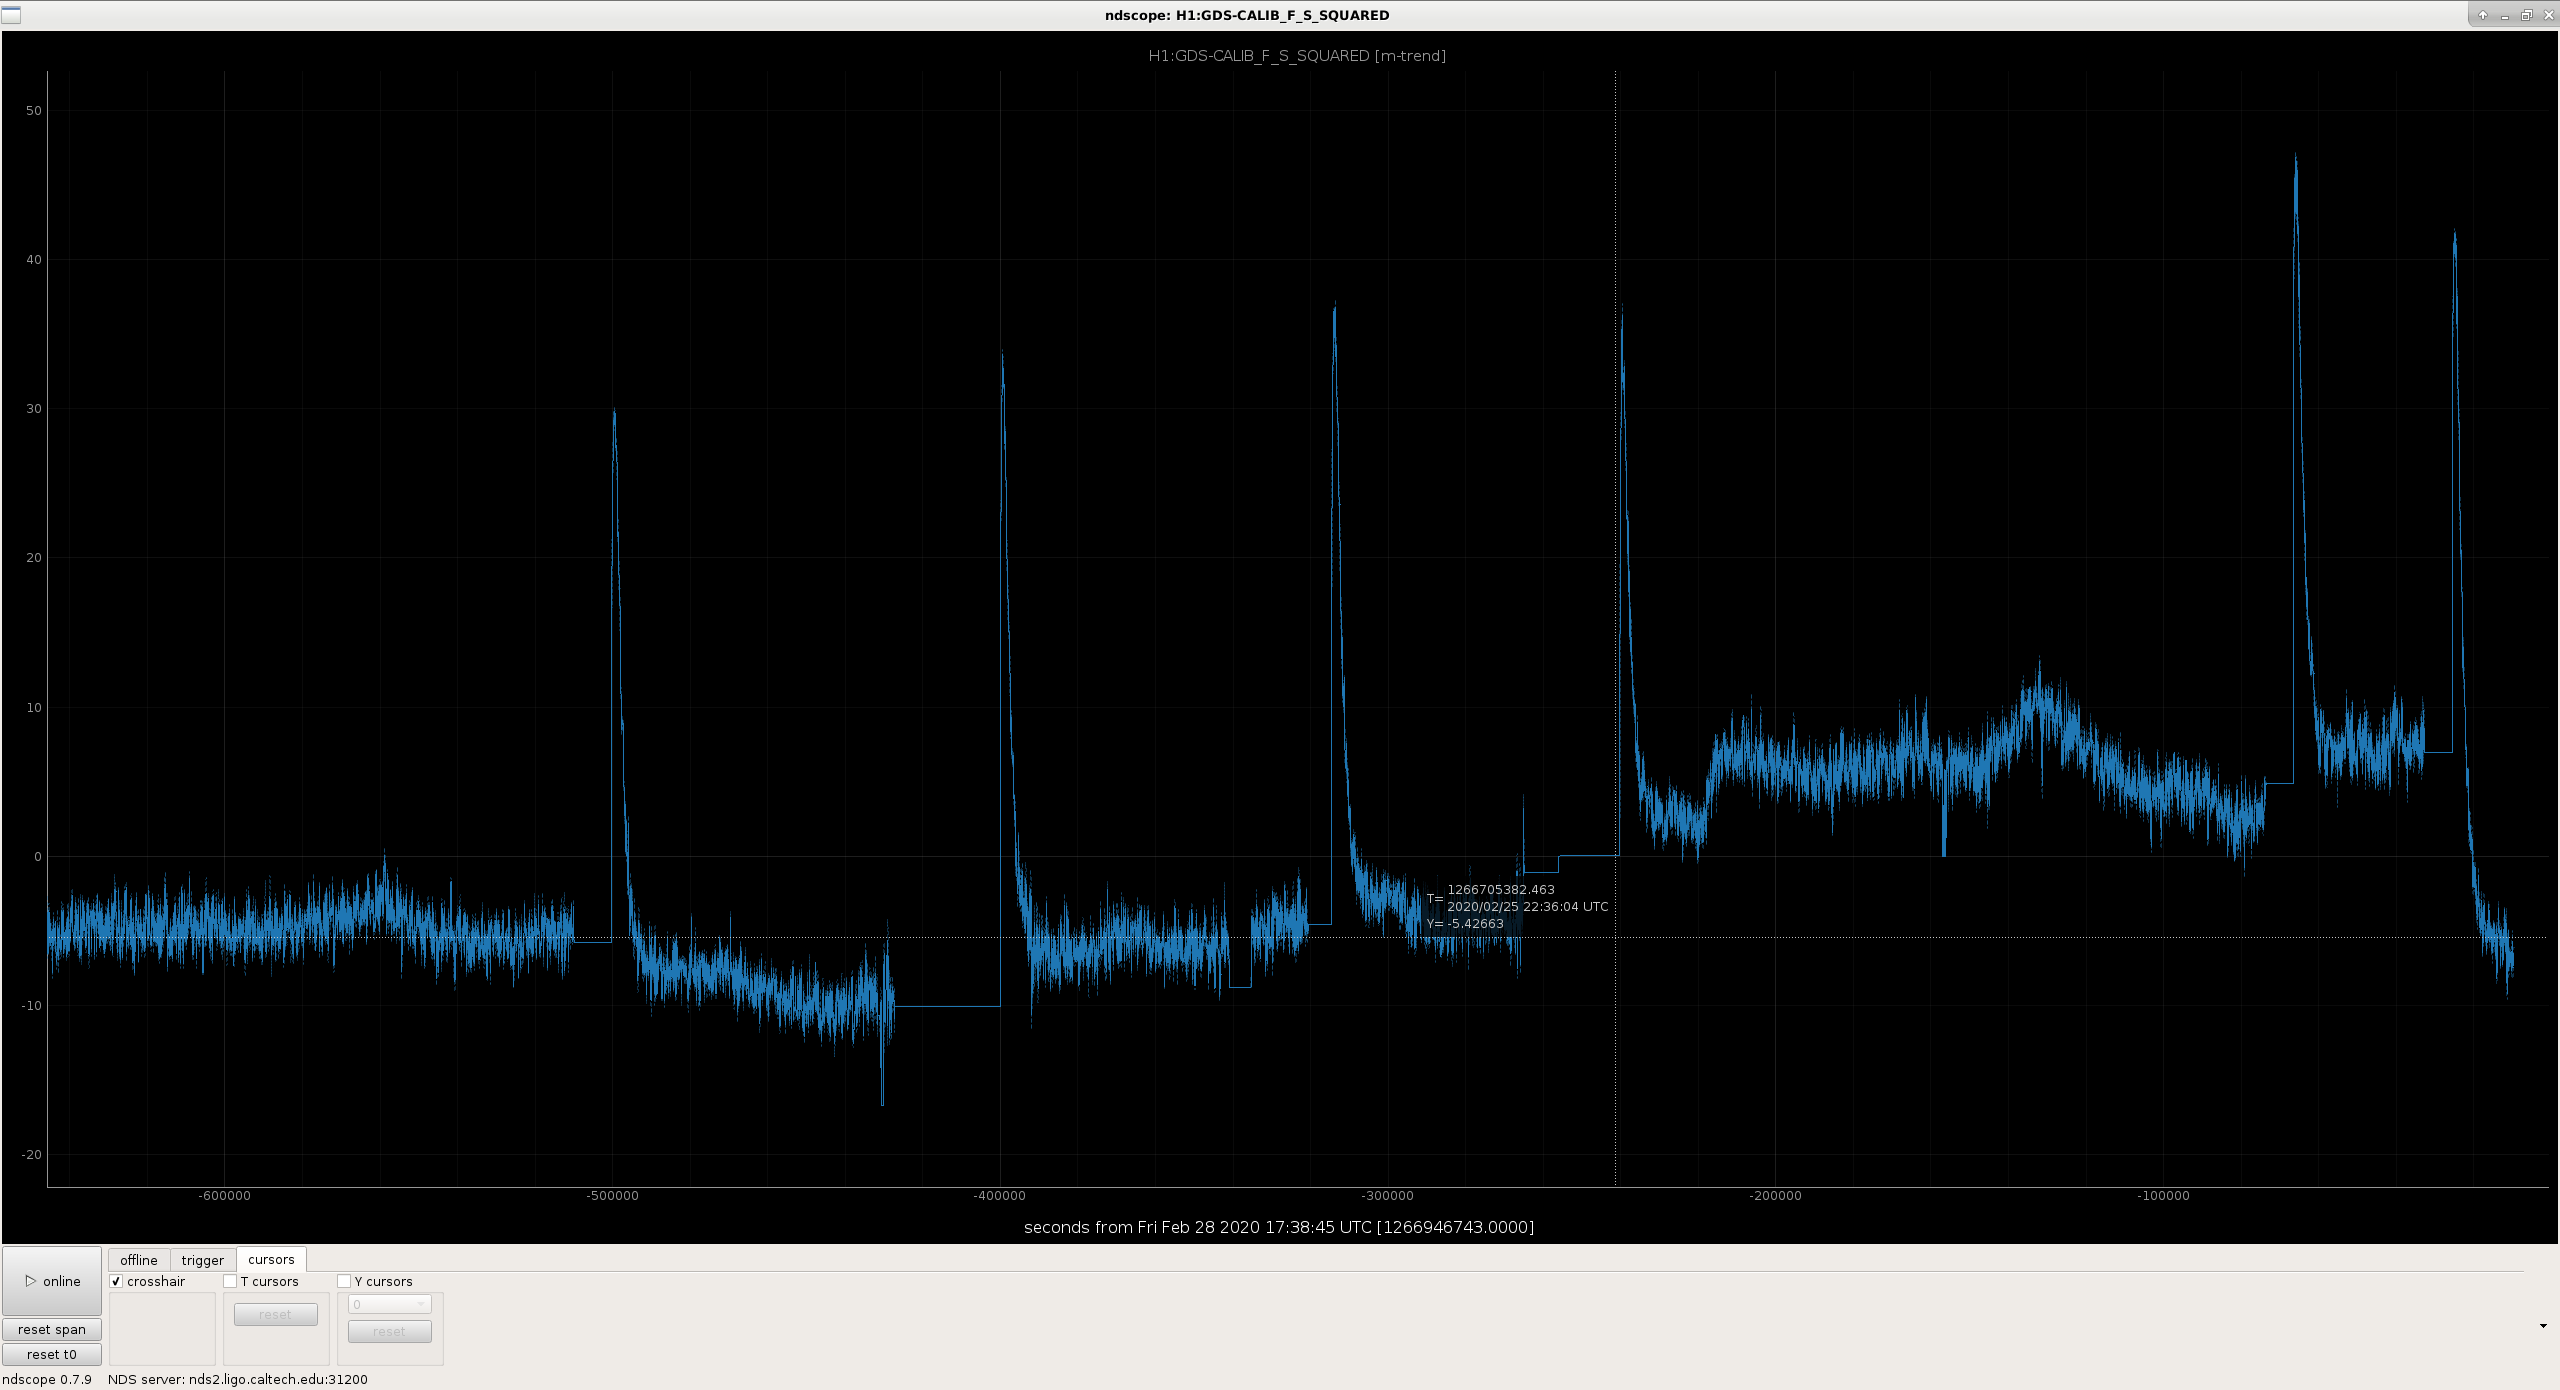
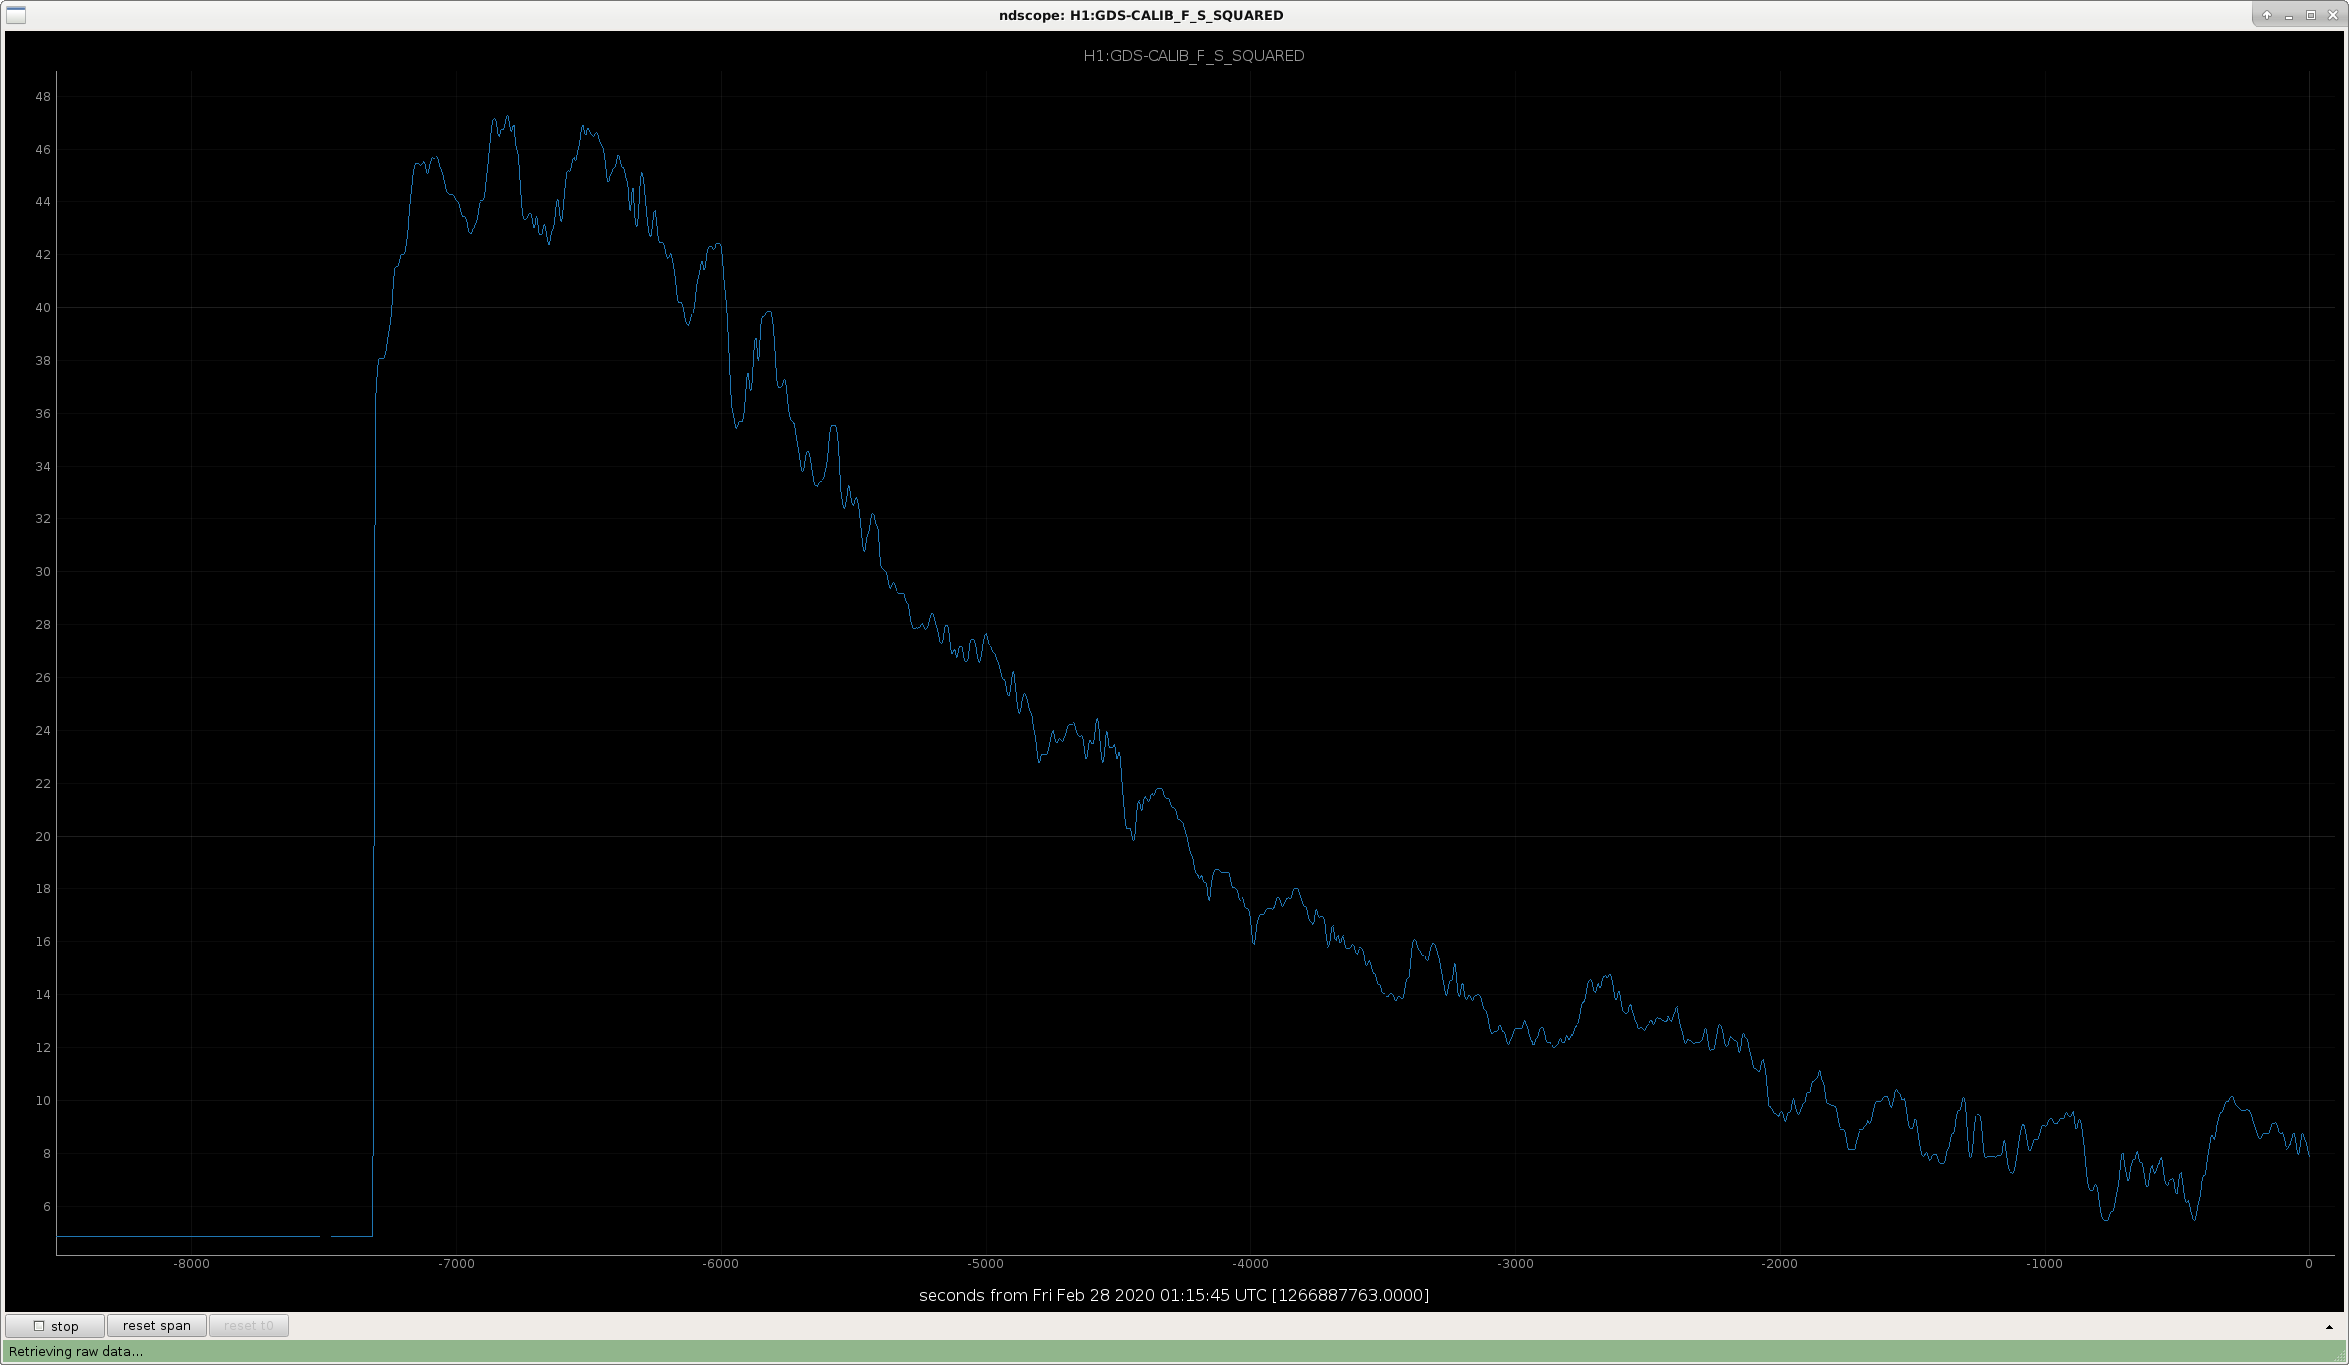
Jeff/Corey/Patrick ran the comb of injections yesterday (see LHO aLOG 55338) similar to what was done previously (see LHO aLOG 53951). This was to follow up and confirm the results we had obtained previously where we observed a significant systematic effect around 20-30 Hz at the very beginning of lock stretches that would be outside of our nominal uncertainty budget (see LHO aLOG 55182). Jeff and I anticipated getting another complete measurement done yesterday, but due to some mix-up, we don't have the data from the H1:LSC-DARM1_EXC_DQ channel, meaning we have no measurement of the live, real-time loop suppression at our injection frequencies in order for us to compute the sensing function. :( Fortunately, we were able to compute live, real-time response function measurements to compare with modelled values. This is still quite informative and yields a consistent picture as before for the current interferometer configuration: at the beginning of the thermalization, the sensing function is a detuned anti-spring, eventually settling into a thermalized state of pro-spring with very close to zero Hz detuning. (NB: commissioning efforts may change this behaviour in the future.) I used data from Feb 27 2020 23:14:00 UTC to Feb 28 2020 01:16:00 UTC. The script to run the analysis lives in the calibration SVN here: ^/trunk/Runs/O3/H1/Scripts/FullIFOSensingTFs/process_sensing_20200227_darm_comb.py Here, we do not attach as many figures as LHO aLOG 55182 because our sensing function data is meaningless (it's all zeros). Attached are the following figures: Figure 1: Response function at intervals of 10 minutes to show the evolution as a function of time (BLUE is the start of the lock, YELLOW is the thermalized IFO state) Figure 2: Response function at intervals of 10 minutes to show the evolution as a function of time if one also applies the f_s value as computed by GDS, assuming a Q value of 20 (BLUE is the start of the lock, YELLOW is the thermalized IFO state) Our only handle on the thermalization effect is the 17.1 Hz Pcal line where a model assumes a detuned spring for the sensing function and a value for f_s is computed from the line measurement. This is written by the GDS calibration pipeline to H1_HOFT_C00 frames in the channel H1:GDS-CALIB_F_S_SQUARED. A positive f_s^2 value indicates an anti-spring, and a negative value indicates pro-spring. Empirically, applying this correction for these two experiments seems to provide some benefit, but we have not normally been applying this correction since there are also indications that applying it all the time makes things worse (see LHO aLOG 51916). So, again, bottom line is that there is a ~7% systematic error around 20-30 Hz at the very start of lock stretches (nominal low noise), resulting in a larger systematic error than the budget for a thermalized H1 interferometer state. The hourly budget computed is not wholly adequate for H1 thermalization behavior early in lock stretches.
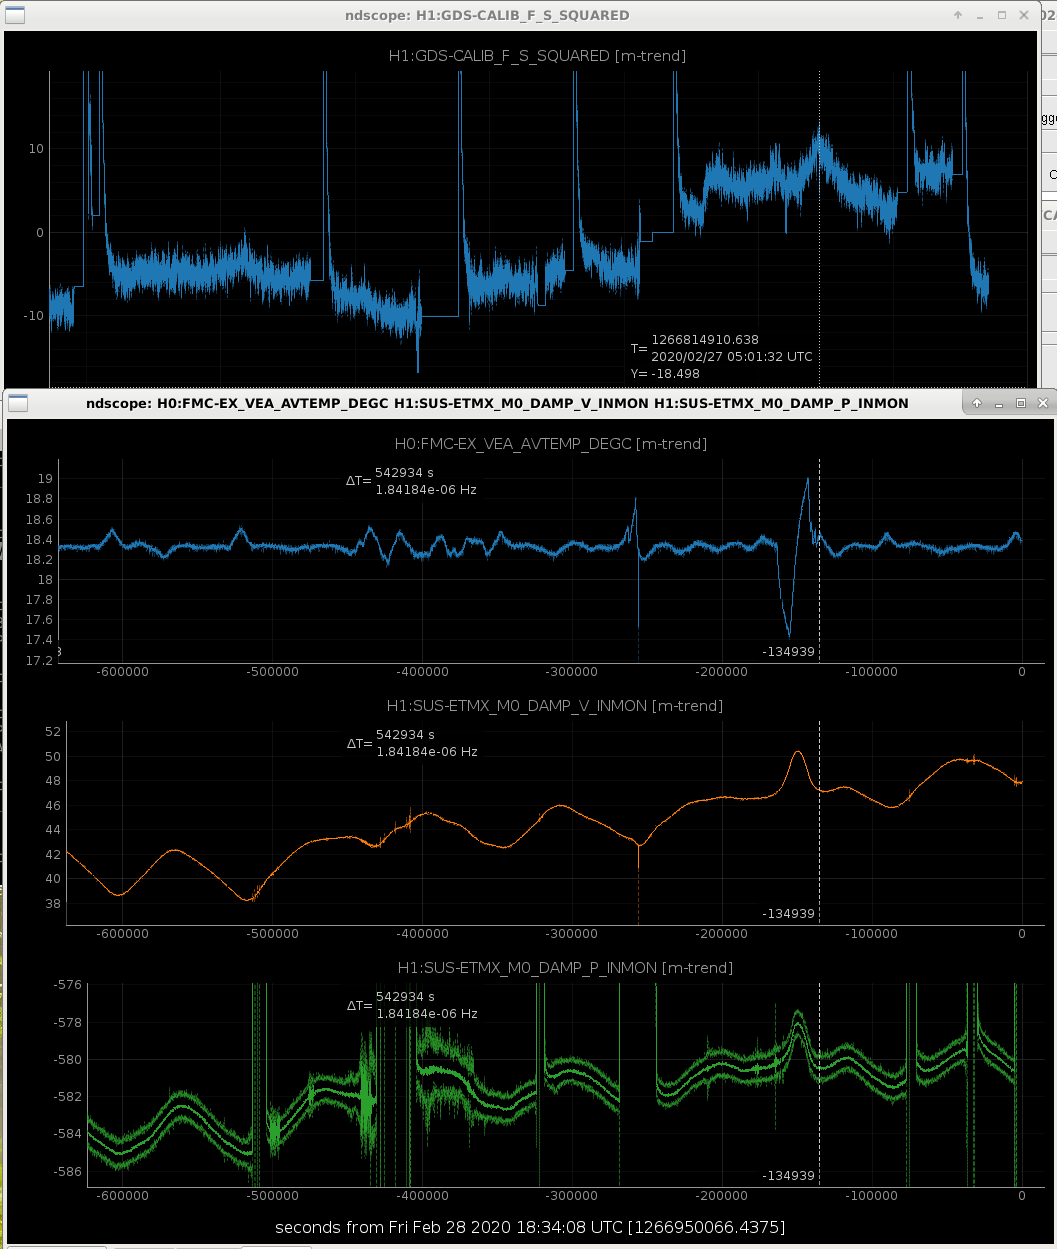
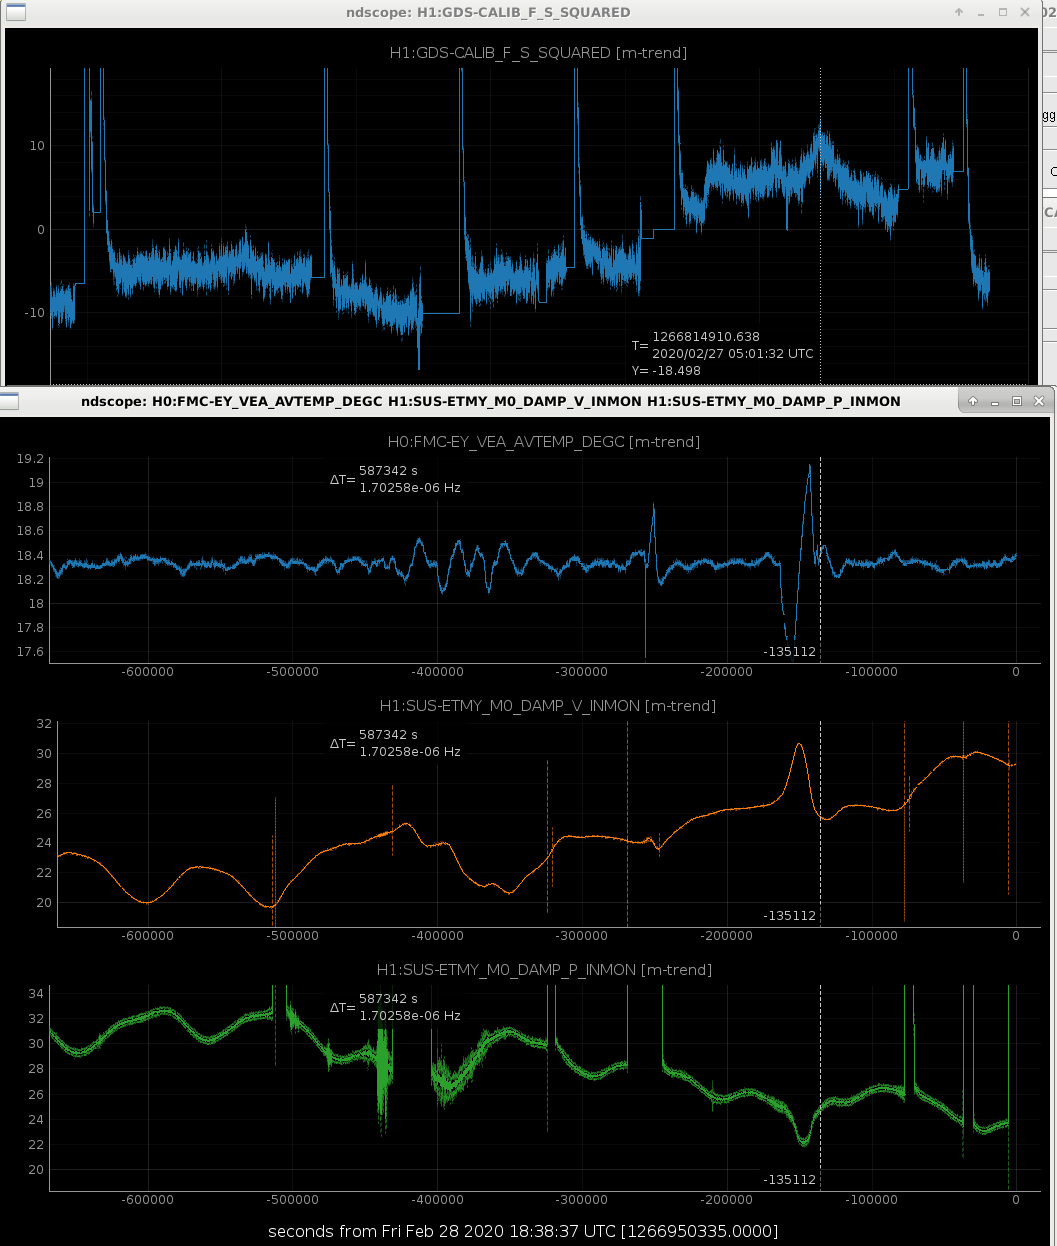
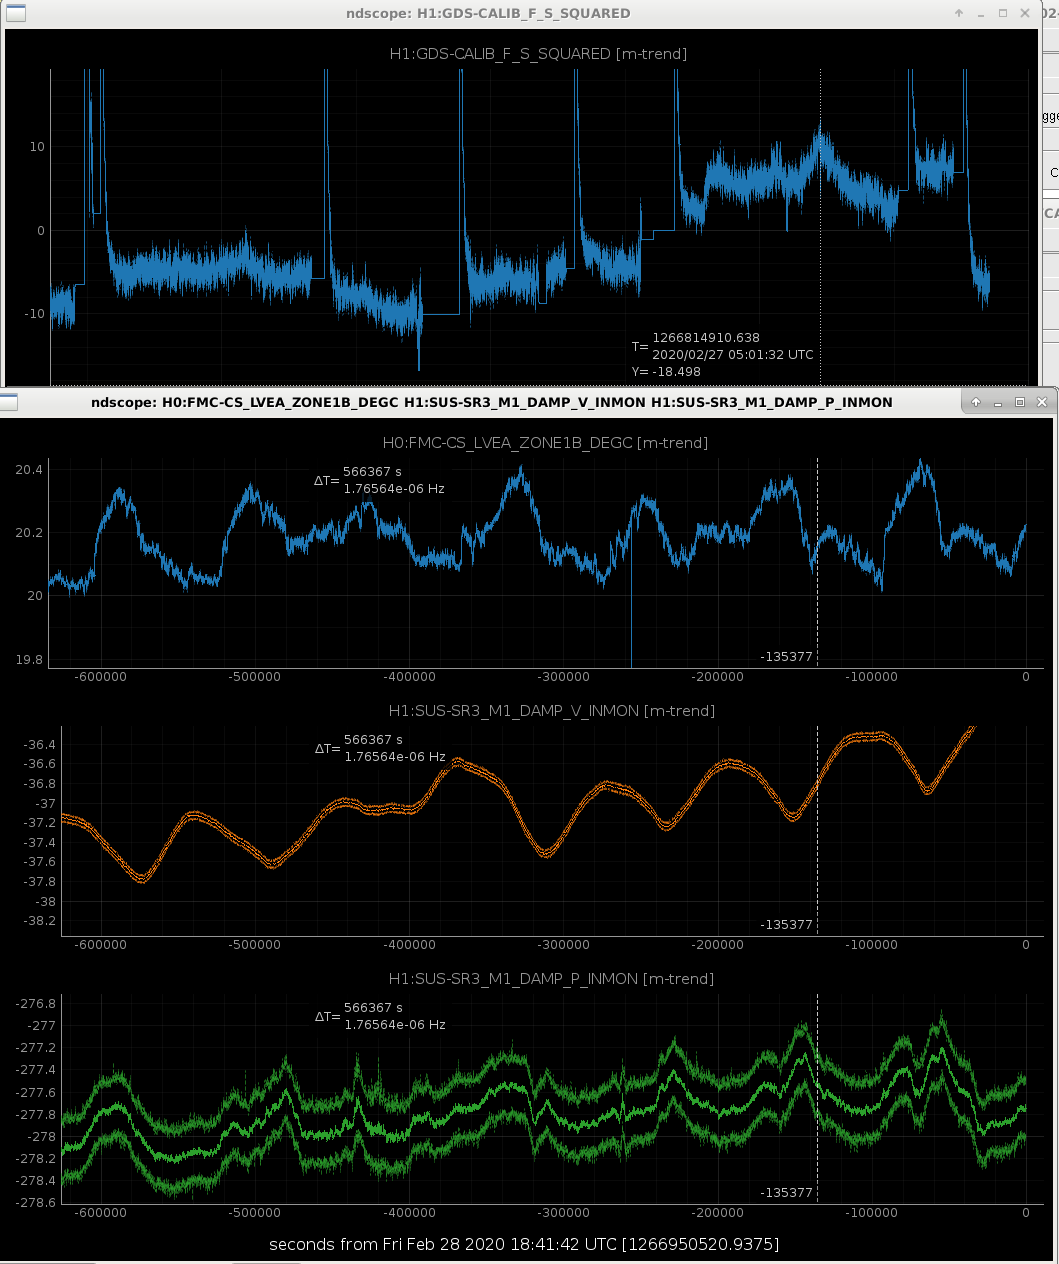
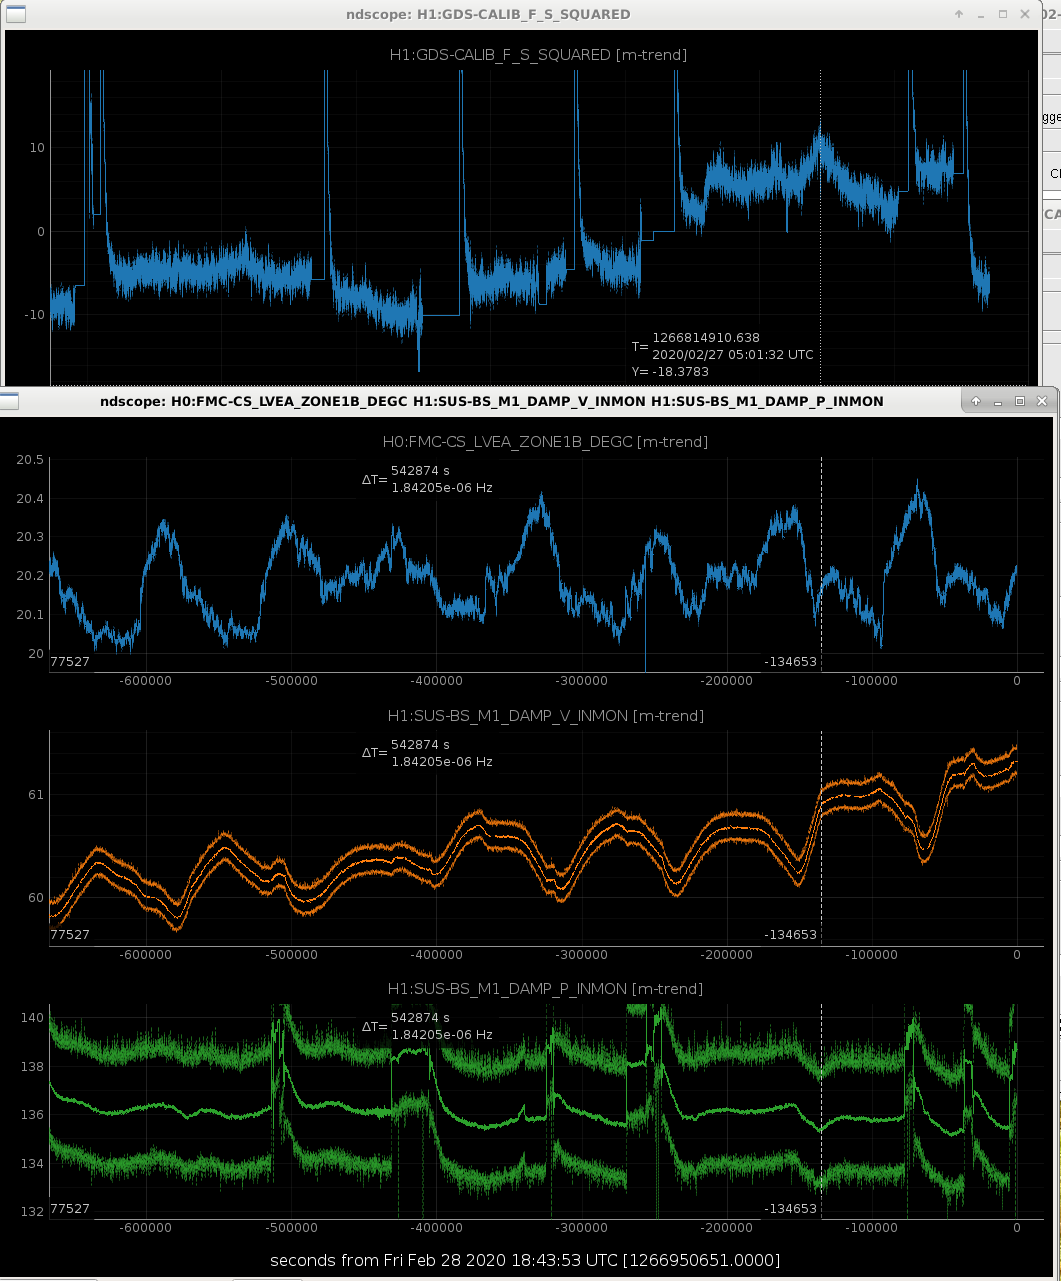
J. Kissel The other day, we had an inadvertent temperature impulse test at the end stations (see LHO aLOG 55325), and while trending our measure of the drift of the low-frequency sensing function "f_s^2," i.e. H1:GDS-CALIB_F_S_SQUARED for other reasons, I thought -- "Huh -- I wonder if the wiggle here in f_s^2 was related to the wiggles there in VEA temperatures?" As such, I did a crude correlation analysis lining up ~1 weeks worth of trends between H1:GDS-CALIB_F_S_SQUARED and (for each station) - The room temperature, as measured by facilities channels (H0:FMC-EX_VEA_AVTEMP_DEGC, H0:FMC-EY_VEA_AVTEMP_DEGC, H0:FMC-CS_LVEA_ZONE1B_DEGC) - The core optic vertical position (our most expensive thermometers; H1:SUS-ETMX_M0_DAMP_V_INMON, H1:SUS-ETMY_M0_DAMP_V_INMON, H1:SUS-BS_M1_DAMP_V_INMON, H1:SUS-SR3_M1_DAMP_V_INMON) - The core optic pitch position (which *should* correspond to a temperature change due to any vertical-to-pitch coupling; H1:SUS-ETMX_M0_DAMP_P_INMON, H1:SUS-ETMY_M0_DAMP_P_INMON, H1:SUS-BS_M1_DAMP_P_INMON, H1:SUS-SR3_M1_DAMP_P_INMON) Attached are screenshots of the results in the following order: ETMX, ETMY, SR3, and BS. While the ETM vertical and pitch positions are *definitely* correlated to the temperature excursion (with the usual delay attributed to the "low-pass filter" that the vacuum system provides), I'm not convinced that either are correlated to the ~few Hz^2 drift seen in f_s^2. In fact, my eyes are most drawn to what coincidences I see in the drift of the Beam Splitter's pitch position and f_s^2. Would @DetChar be willing to sign someone up to run a LASSO-like analysis using f_s^2 as their witness, and using core-optic vertical and/or alignment positions as potentially correlated motivators for change? That would be awesome. I'm also open to an analysis on other likely candidates (a more careful study of the above temperature channels, expanding the list of optics to include IM4, PRM, PR2, PR3, ITMX, ITMY, SR2, SRM, OM1, and OM2, TCS Laser Power, SR3 disc heater power, and any other channels you think might be good metrics to track things that might be causing mode matching drifts between the arm cavities and the signal recycling cavity.)
J. Kissel The following are the amendments to the instructions I'd left operators to turn on (and off) a comb of new calibration lines if/when we get the chance to measure the detector's sensing function during a thermalization process. Original measurement is in LHO aLOG 53951, and failed / incomplete / errant instructions are in LHO aLOG 55297. During yesterday's attempt (LHO aLOG 55338), my instructions I'd coached folks through had led to a bit of confusion, and the DTT template I pointed to didn't exist -- which resulted in a last minute panic find of a template that didn't have excitations turned on. Blast! Not all is lost though, and we can still salvage some of the measurement. Evan will be posting the results in a bit. Here're the updated instructions: We only need this measurement "once more," (ha!) so please check in with me and/or Keita to see if (a) tonight / today is a good day for this measurement, or (b) we've already taken the measurement. (1) Wait until the ISC_LOCK guardian has acquired past MAXIMUM_POWER - Don't *pause* at MAXIMUM_POWER, please, let the IFO continue to nominal low noise, but start steps (2) and (3) in the ~15 minutes it takes to get from MAXIMUM_POWER to NOMINAL_LOW_NOISE. - It's not *imperative* when exactly you start the following *exact* when MAXIMUM_POWER finishes, but I haven't tested the robustness of the IFO against these lines at earlier stages (specifically -- between ENGAGE_SOFT_LOOPS and POWER_10W may not be able to tolerate these lines, but thus far that's anecdotal evidence). - It *is* imperative that you at least get steps 2 and 3 below done *before* we enter NOMINAL_LOW_NOISE. (2) From a terminal and run the script to turn on all the the new *PCAL* calibration lines, ~$ cd /ligo/svncommon/CalSVN/aligocalibration/trunk/Runs/O3/H1/Scripts/CALCS_FE ~$ python3.5 setup_sensingfunction_callinecombs.py (3) From a terminal, open up the DTT template for the DARM calibration lines, and run it. ~$ cd /ligo/svncommon/CalSVN/aligocalibration/trunk/Runs/O3/H1/Measurements/CALCS_FE ~$ diaggui 2019-12-17_H1DARMEXC_SpringMonitoring.xml hit "START" (4) From a terminal, open up an ndscope trend of the detuned SRC, optical spring frequency (squared; aka "f_s^2"); this is your metric for "doneness" of the measurement. ~$ kinit albert.einstein@LIGO.ORG [enter your LIGO.ORG password] ~$ NDSSERVER=nds2.ligo.caltech.edu ndscope H1:GDS-CALIB_F_S_SQUARED -w [-7200,0]& - you'll have to wait *very* patiently, for these 2 hours of live 16 Hz data to populate, but, don't worry, you've got time. - you need to define the NDSSERVER for this ndscope call because "GDS" channels are not available to nds0 or nds1. (5) Watch and wait as the ISC_LOCK guardian reaches NOMINAL_LOW_NOISE, and then wait there for about 2 hours, until the detuned optical spring frequency levels out around -10 Hz^2 ***. *** "-10 Hz^2" is the number I thought would be typical, but apparently the thermalized value is drifting all over the place (my guess is due to static alignment differences, but I have no quantitative proof). I advise hitting "stop", and scrolling back in time to find the last few starts of NOMINAL_LOW_NOISE stretches and see what the thermalized value has been for the past few days. *That* will be your number for doneness. (6) While you're waiting, trend the PCALX high frequency roaming line frequency, ~$ ndscope H1:CAL-PCALX_PCALOSC1_OSC_FREQ -w [-7200,0]& and find out what it has been during the last, most recent few NOMINAL_LOW_NOISE / OBSERVATION_READY segments. Store that number; we'll call it PCALXHFLINEFREQ for use below. - here, you must *not* define the NDSSERVER (and /or open a new terminal), because (apparently) these EPICs channels are *not* available on nds2. Go figure. (7) Record the UTC times (and GPS times, if you're nice) of (a) when we hit NOMINAL_LOW_NOISE and (b) when you deem that ~2 hours is up and you begin to turn off the measurement. Grab a screenshot of the trend of f_s^2 as well. (8) Go through the "turn off" instructions below, and complete them. Once complete, you may return to OBSERVATION_READY, if so desired. (9) Write an independent aLOG (with CAL as its primary task, and OpsInfo tagged) that you've completed this measurement, and shoot an email to Jeff Kissel and Evan Goetz to let them know you've completed the measurement Here's how to "turn off" and/or revert to *actual* NOMINAL_LOW_NOISE: (1) Hit "Abort" on the above DTT template. (2) Go to the CALEX and CALEY SDF screens and REVERT all differences. REVERT. REVERT. DO NOT ACCEPT. (3) Set the high frequency PCALX line back to it's most recent roaming line frequency, caput H1:CAL-PCALX_PCALOSC1_OSC_FREQ PCALXHFLINEFREQ (4) Make sure the PCAL systems are behaving nominally. (a) Check the PCAL MEDM overview screens, under sitemap > Xarm "CAL" or Yarm "CAL" > PCALX or PCALY. You should see a squiggly hash of noise with amplitude somewhere in between -1 and -7 Volts on the "OFS PD" channel (H1:CAL-PCALX_OFS_PD_OUTMON) strip chart that begins populating as you open up. (b) On that same screen, make sure the "error monitor" (H1:CAL-PCALX_OFS_ERR_OUTMON) is showing small numbers, oscillating around 0.0. Something like +/- 0.03 or less. (c) Make sure the "normal" PCAL lines are present on the live "aLIGO DARM" amplitude spectral density plot on the control room front wall, top middle. You should see PCALY lines at 17.1, 410.3, 1083.7, and 1153.2 Hz. You should see PCALX lines at 1153.1 Hz, and at the PCALXHFLINEFREQ frequency you just entered in step (3). >> If some or none of the checks in (4)(a) through (c) pass, you can try "opening and closing" the OFS loop -- i.e. toggle "Off" then "On" the "Loop Enable" switch, H1:CAL-PCALX_OPTICALFOLLOWERSERVOENABLE. If that doesn't work (i.e. it doesn't restore the PCAL system in such a way that it *then* passes the (4)(a) through (c) checks), call in a calibration expert. Thank you!
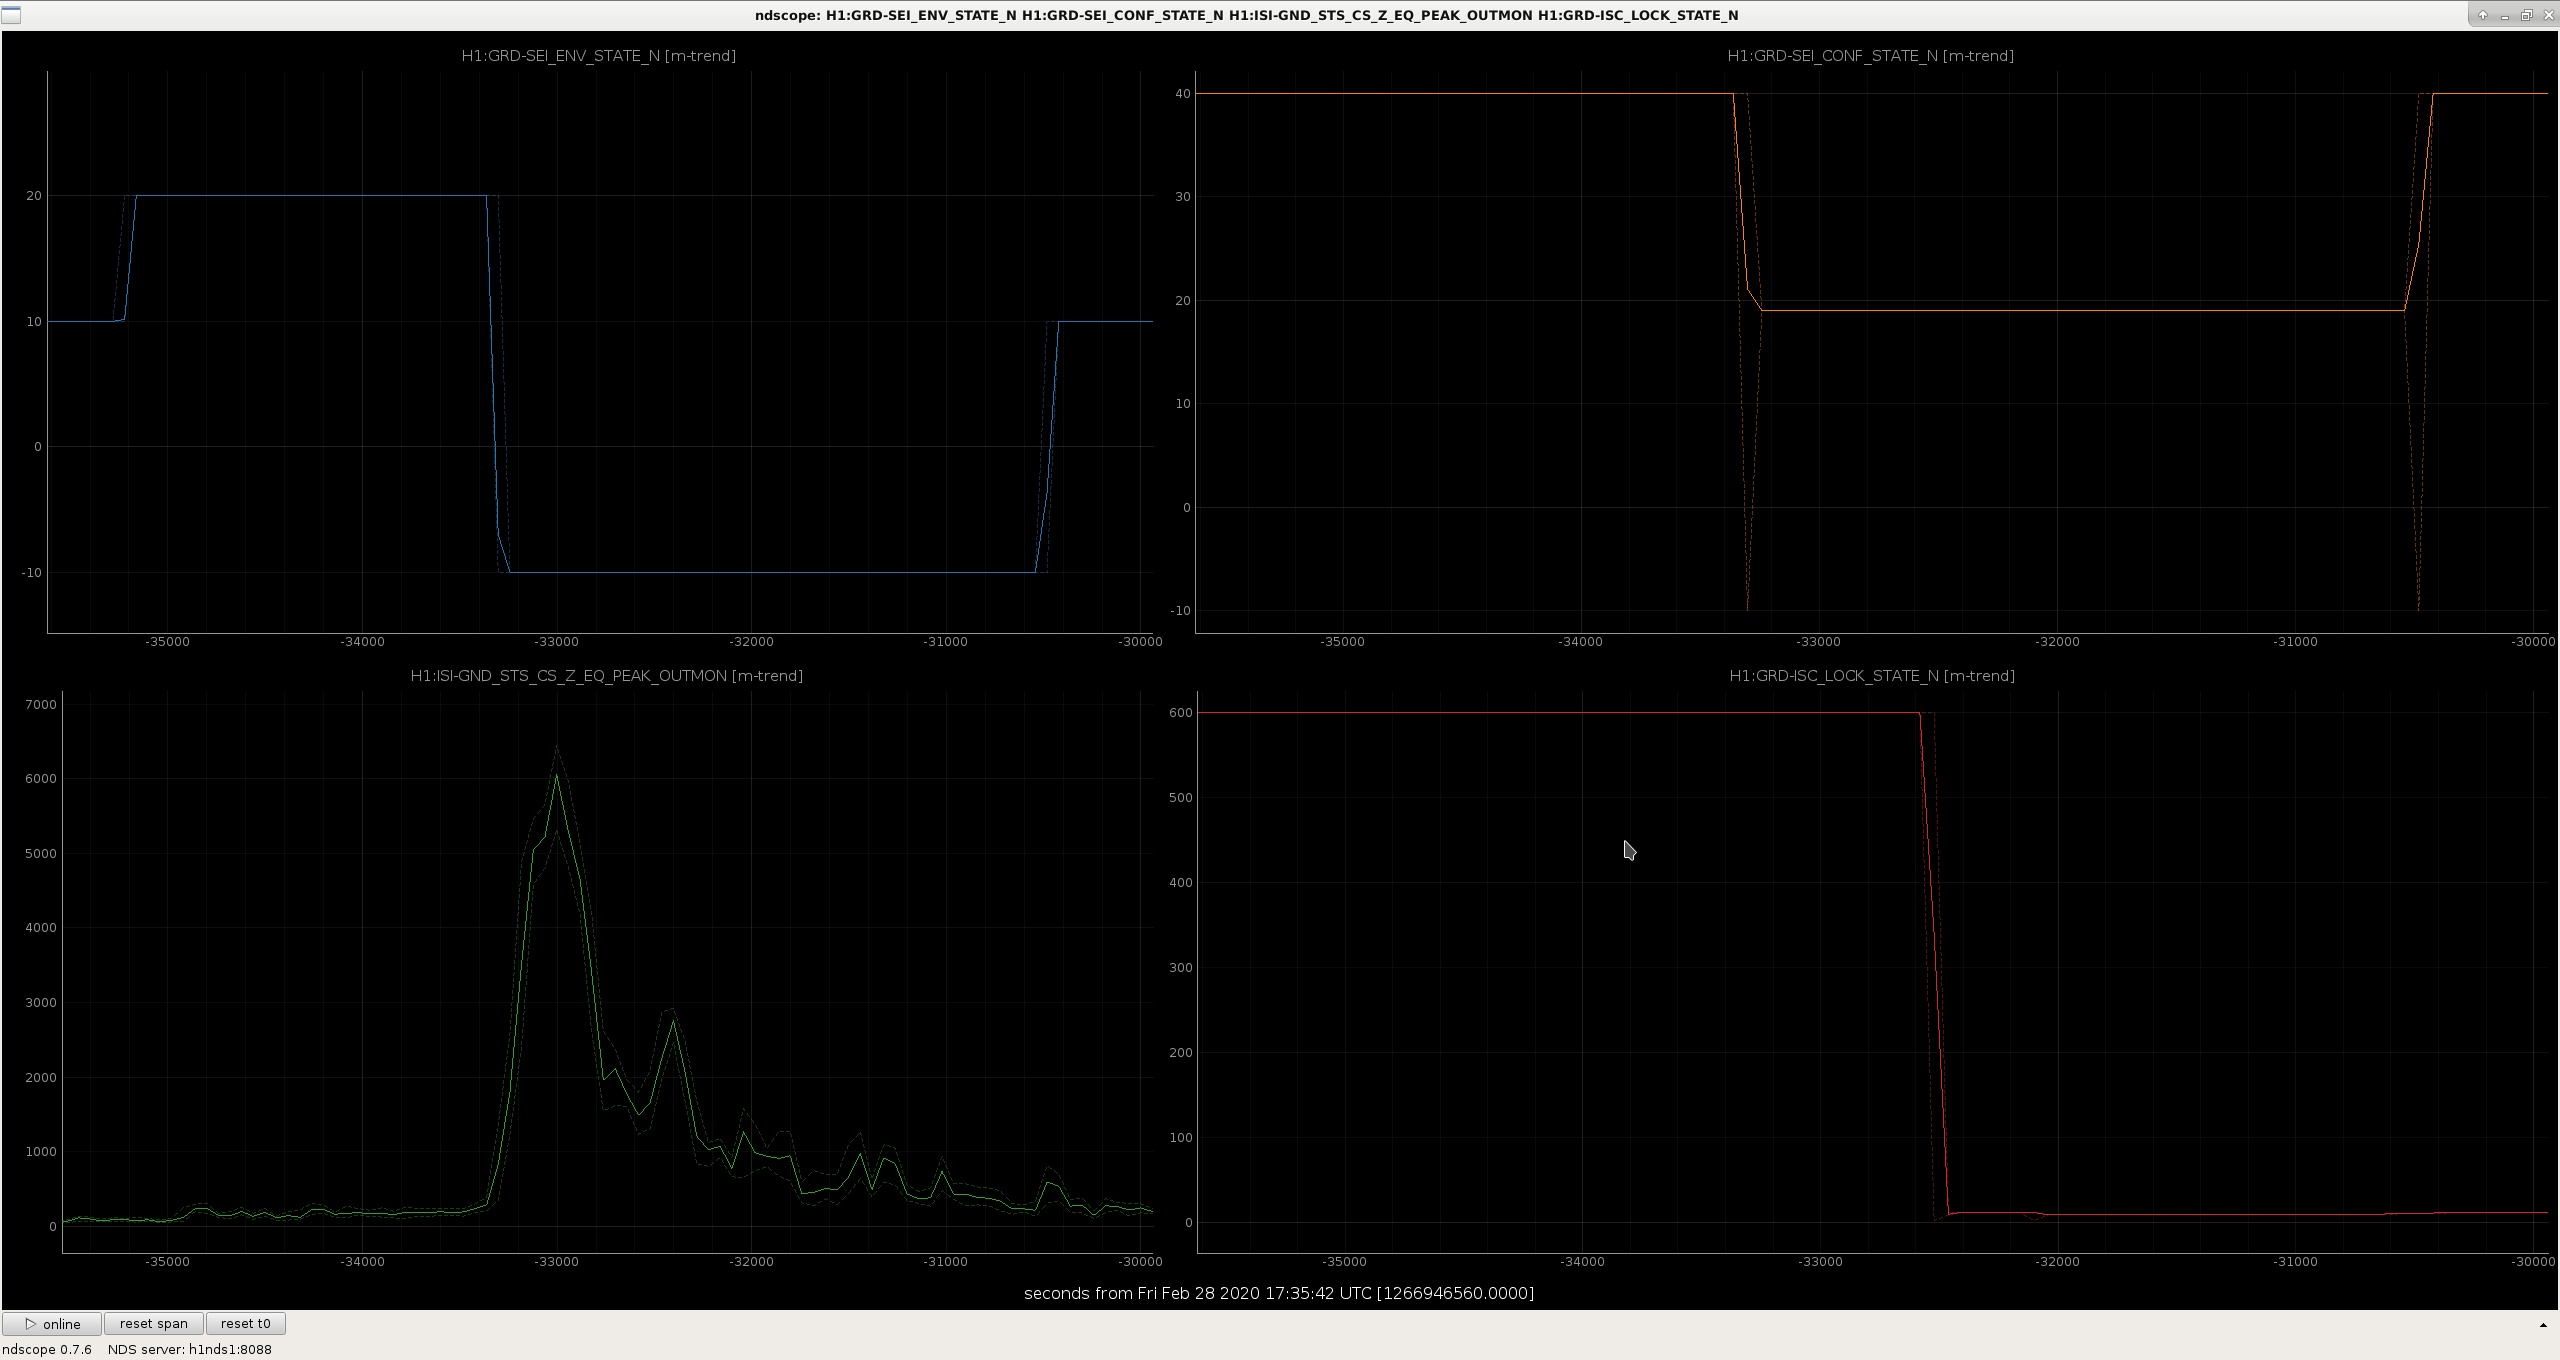
The earthquake we had last night was a very successful test of the SEI_ENV automated earthquake response. Attached trend gives the sequence of events. SEI_ENV state is the top left, SEI_CONF is top right, eq band ground is bottom left, ISC_LOCK state is bottom right.
Look like seismon/SEI_ENV got the notification just before the P/S wave arrival (where top left goes from 10 to 20), but that wasn't big enough to be a problem.
SEI_ENV switched SEI_CONF to the earthquake mode as the R waves started rolling in and the IFO actually stayed locked through the peak (at -33000 seconds), we didn't lose lock until ~400 seconds after, maybe from an aftershock? At least it wasn't from the peak or the SEI_CONF transition.
The time to transition back to nominal also seems pretty reasonable. This was a pretty good size earthquake, we probably haven't ridden out anything bigger to this point.
There are still edge cases to be thought about: the test for the SEI_CONF transitions are kind of tricked by very high winds and microseism. Down the road we may have to consider pausing SEI_ENV during big windstorms, to avoid spurious transitions. Still, great success.
SEI_ENV also worked great this evening! Switching us to EQ mode and back, keeping lock.
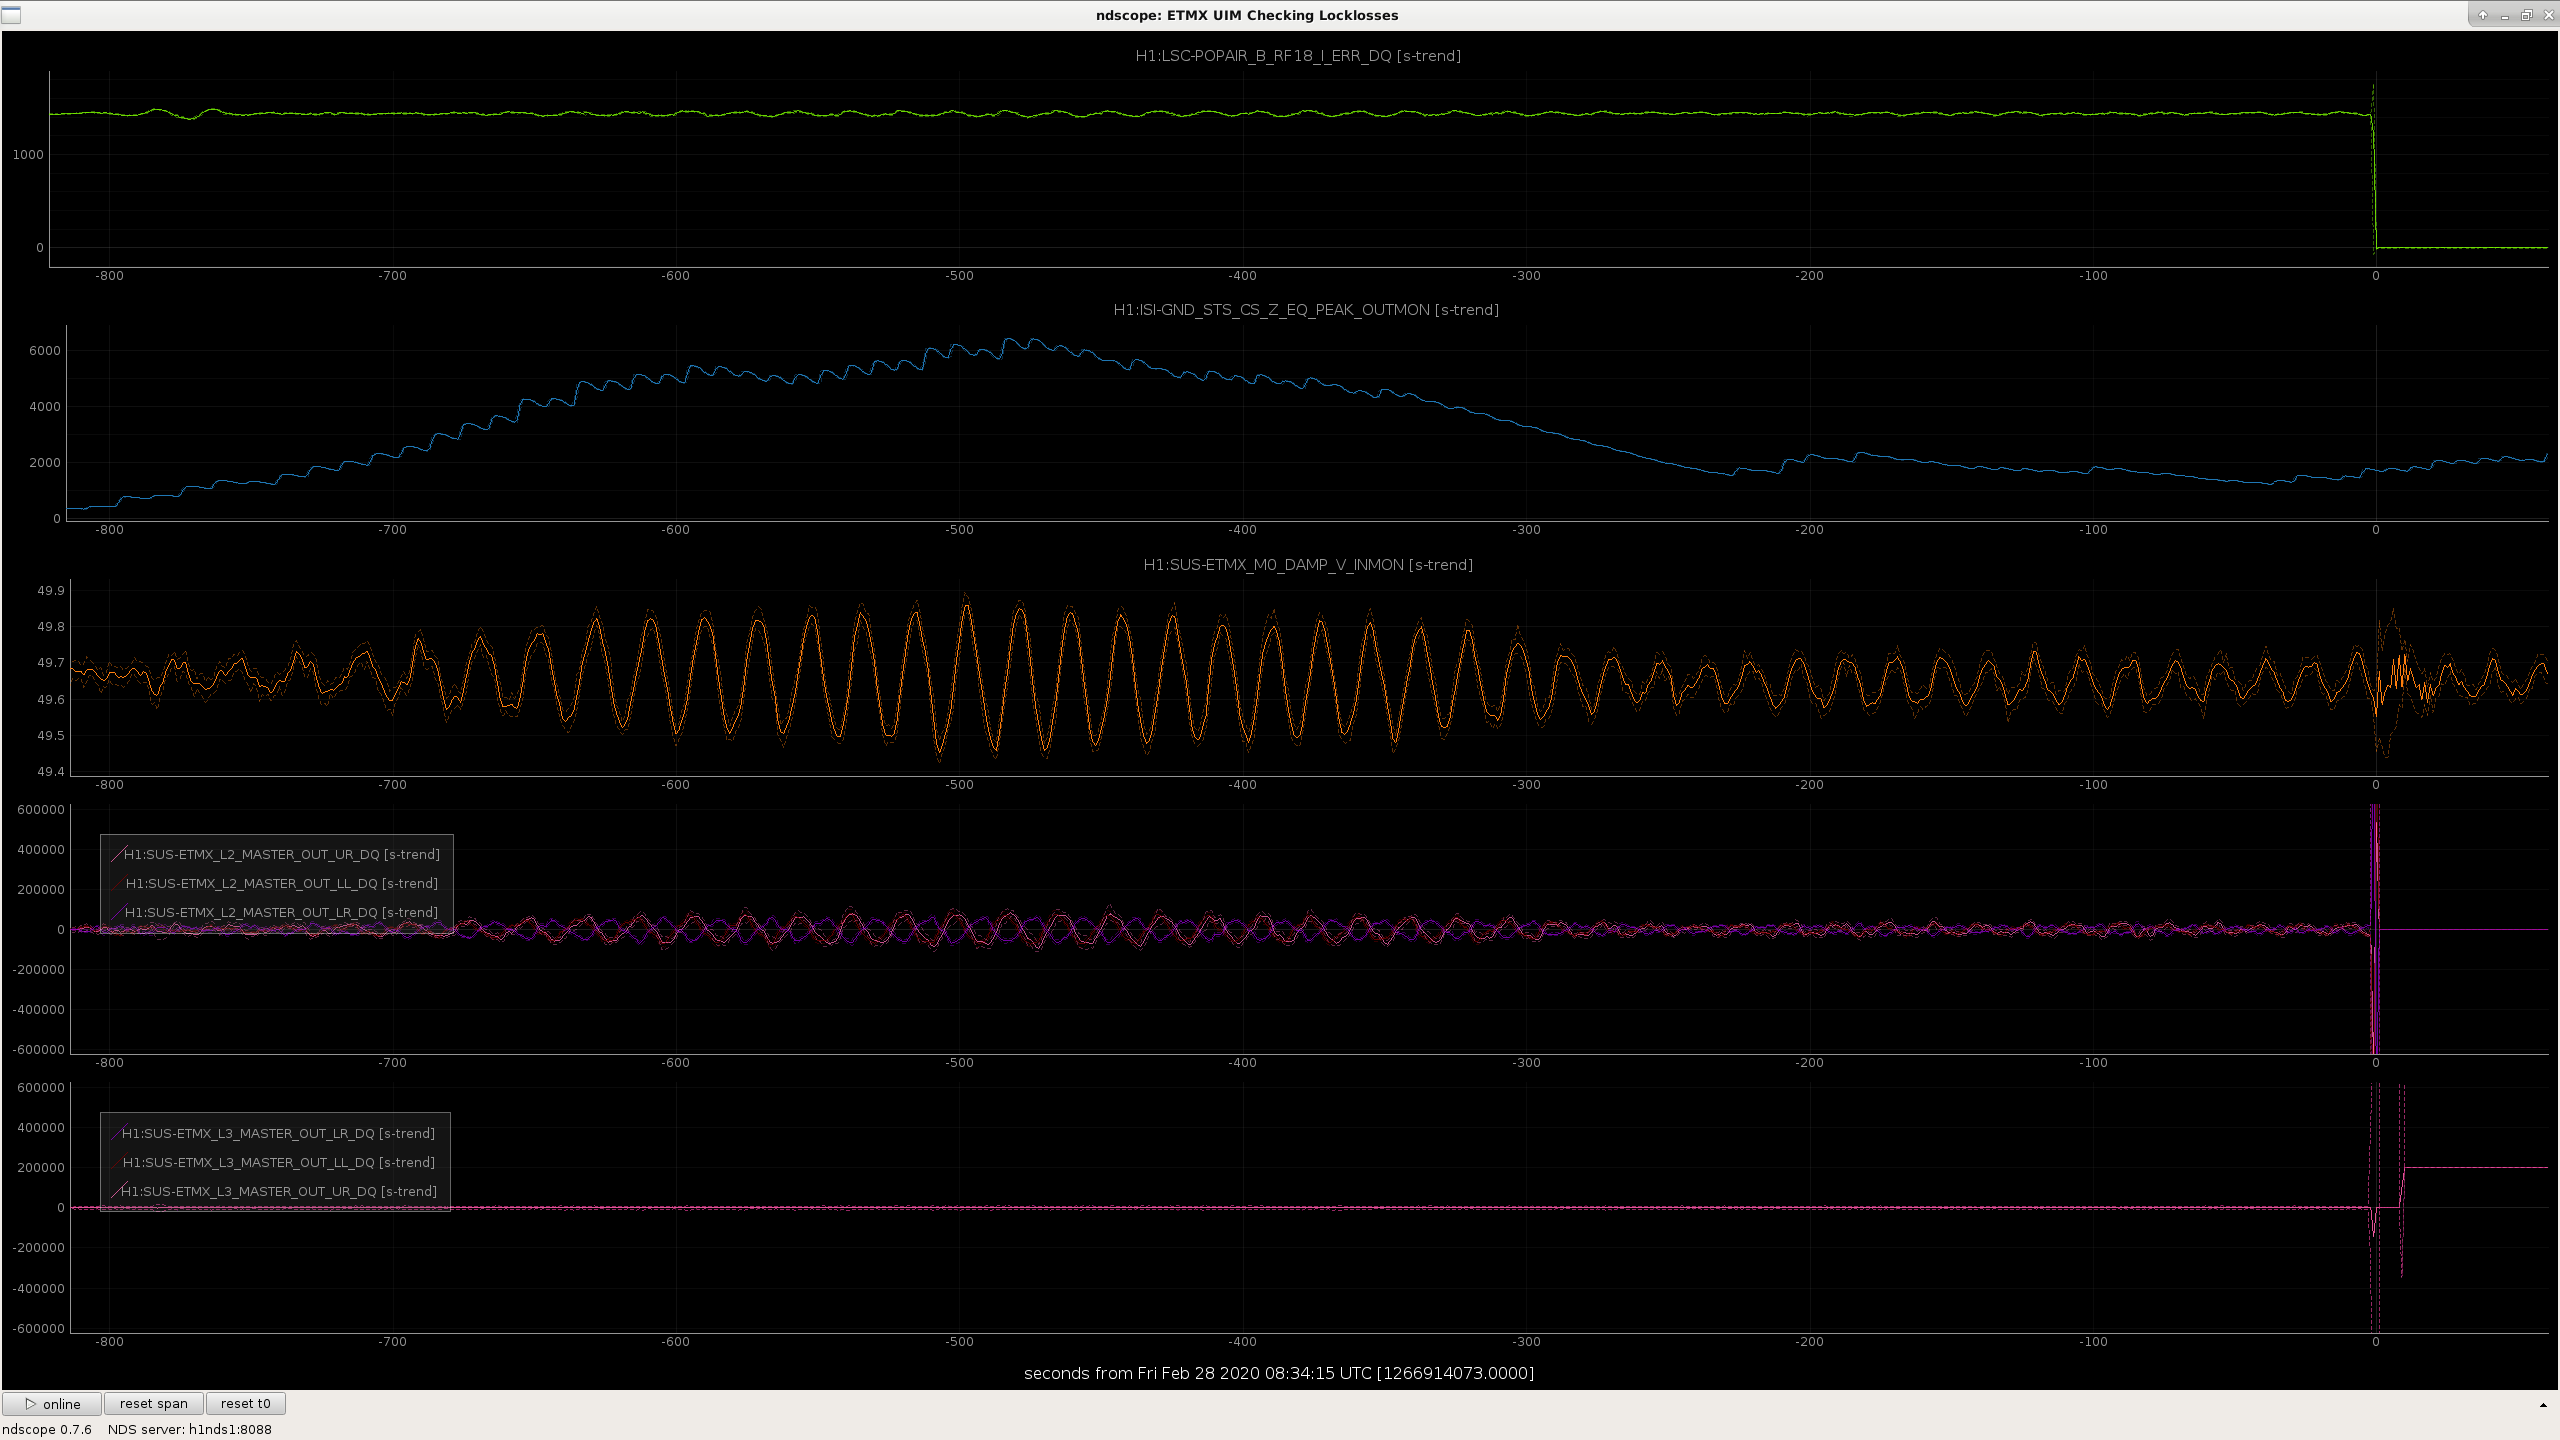
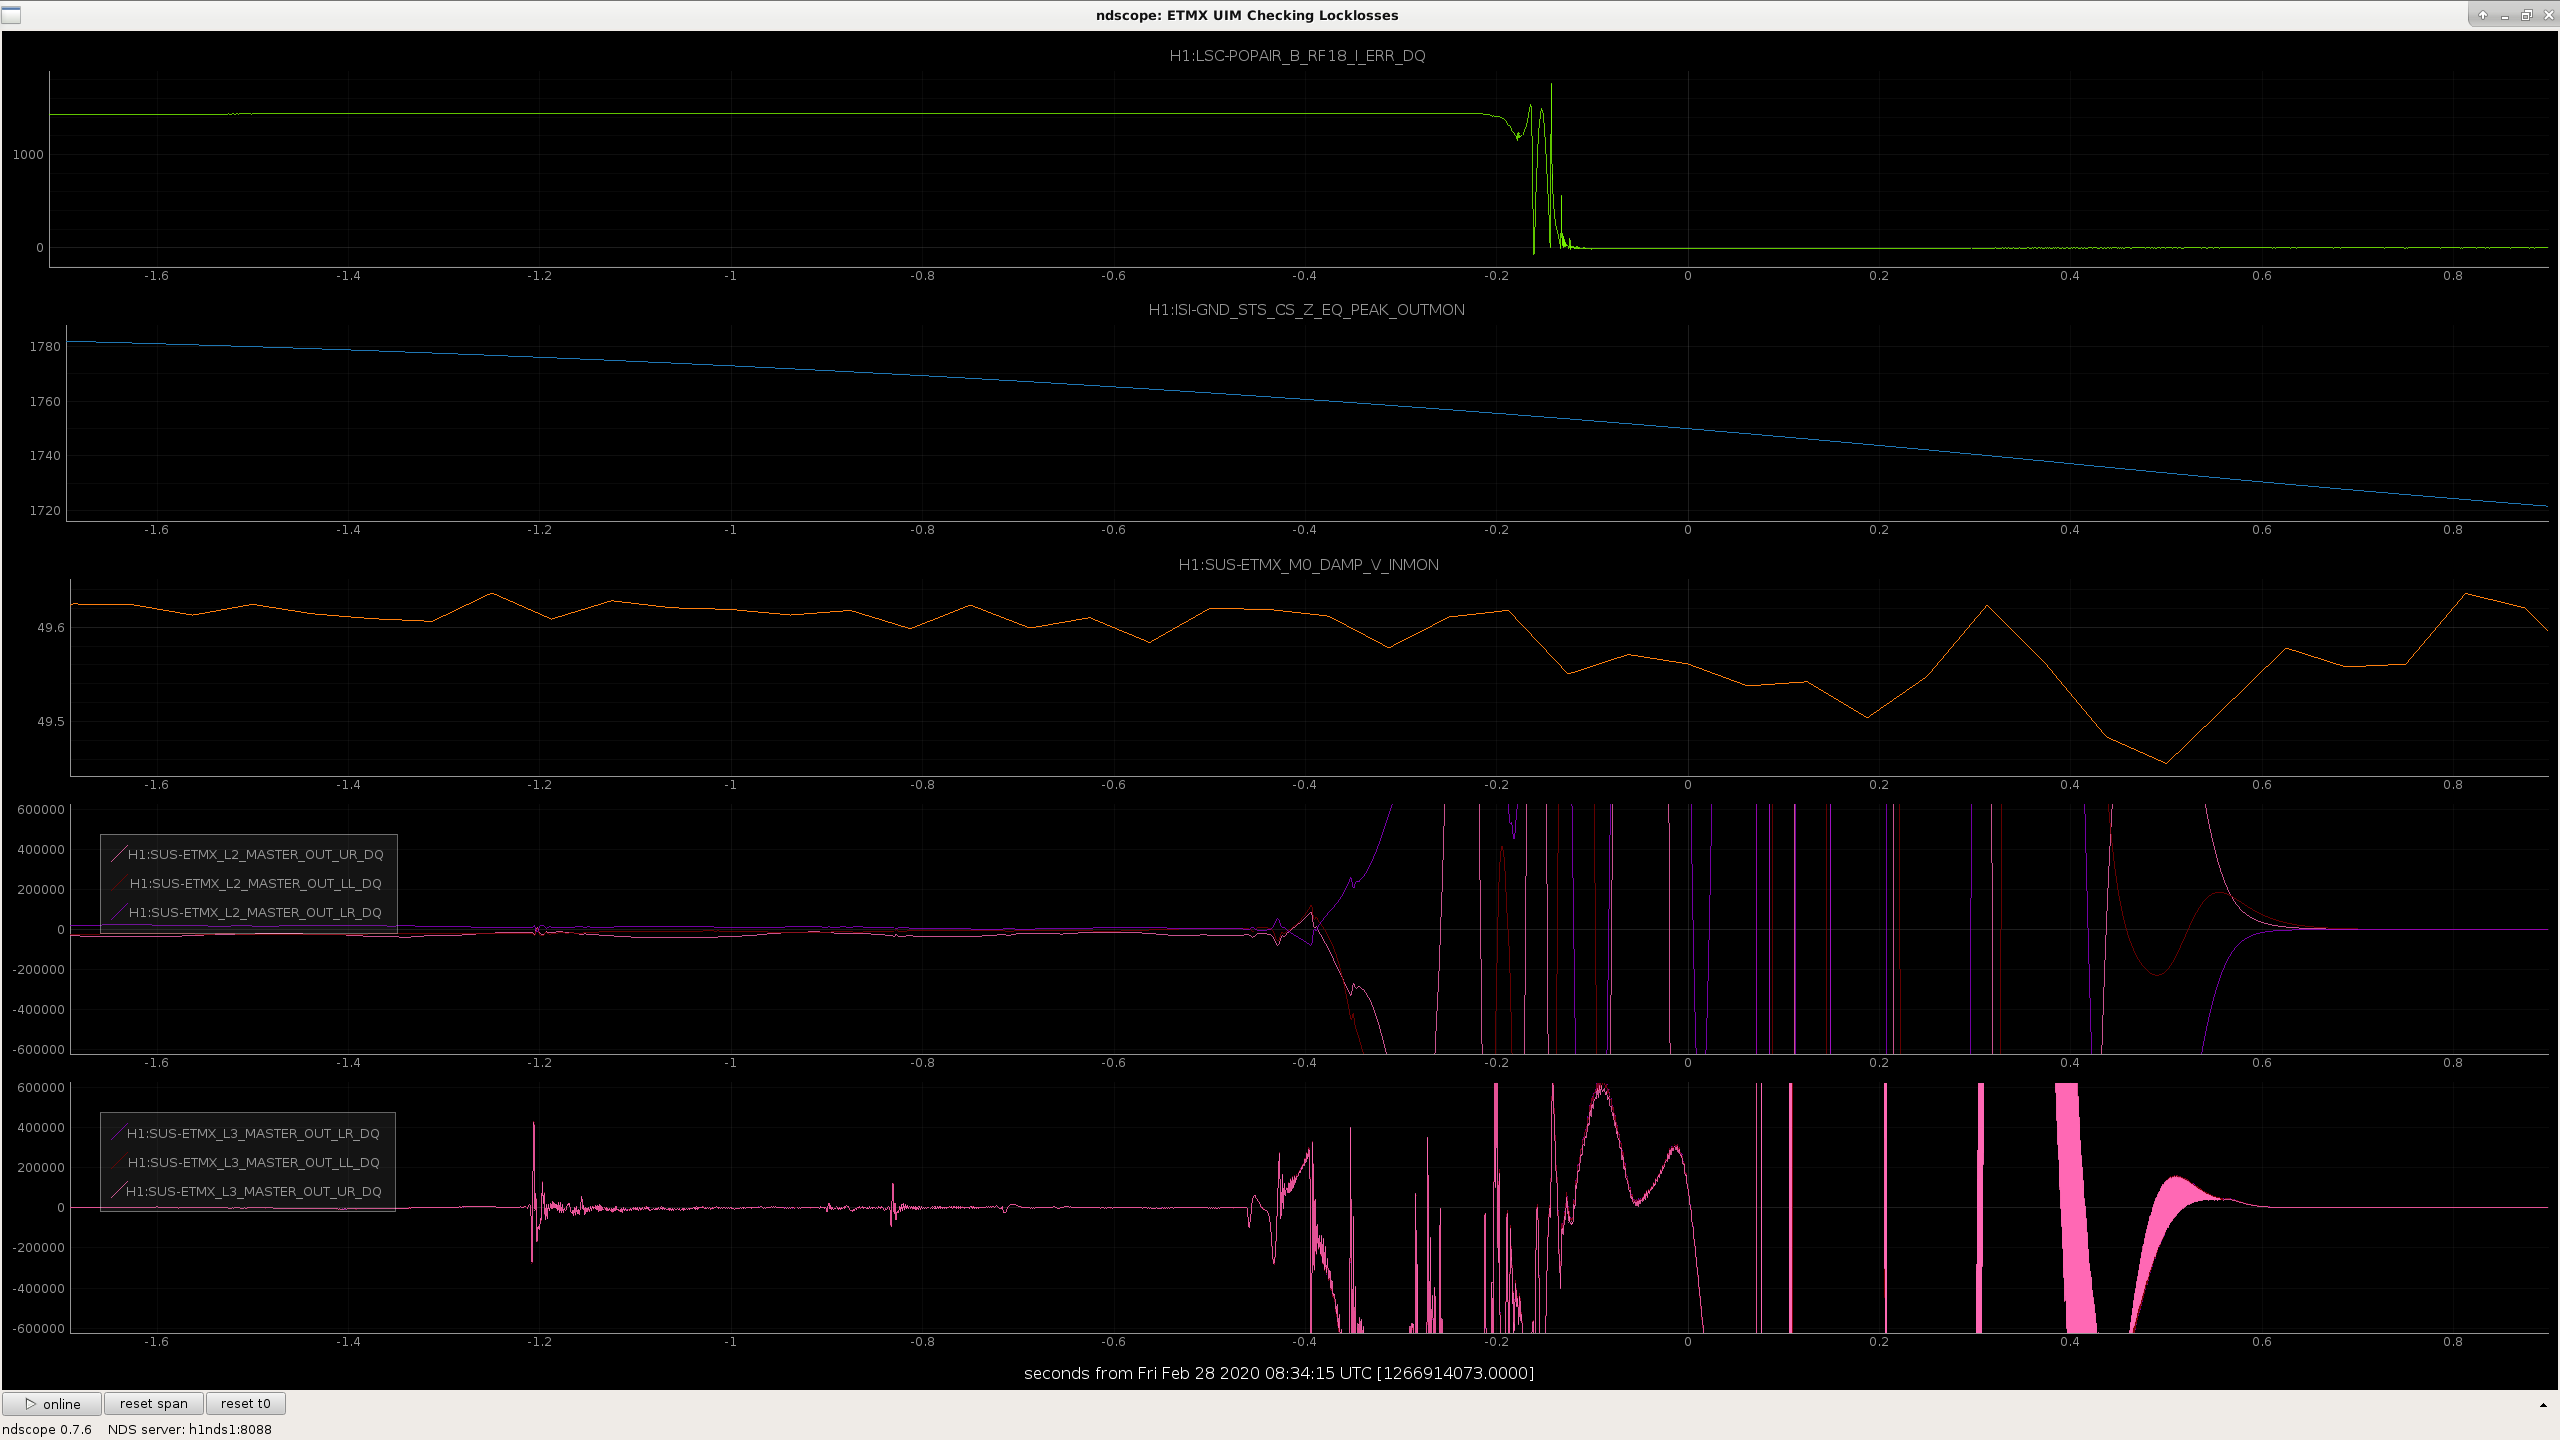
The 2020-02-28 08:34:15 UTC lockloss does seem strange though that we survived the massive 6000 peakmon peak and lost lock 8 minutes after plot here. Have you seen that before? There is also one of those quick (100-500Hz) DARM spikes 1s before the lockloss as you can see in the bottom of this zoomed plot.
TITLE: 02/28 Day Shift: 16:00-00:00 UTC (08:00-16:00 PST), all times posted in UTC
STATE of H1: Observing at 118Mpc
OUTGOING OPERATOR: TJ
CURRENT ENVIRONMENT:
SEI_CONF state: WINDY
Wind: 5mph Gusts, 3mph 5min avg
Primary useism: 0.02 μm/s
Secondary useism: 0.30 μm/s
QUICK SUMMARY: No issues.
Looks like the earthquake knocked us out, even though SEI_ENV had transitioned us to EARTH_QUAKE mode at 0820UTC. After a lockloss from LOCKING_ARMS_GREEN, the FSS wouldn't lock for 15 minutes (alerted). I then tried to do the normal toggling of the autolocker trick, but it ultimately ended up fixing itself without me.
I'm currently letting Guardian continue on its own.
Observing 1033 UTC
TITLE: 02/28 Eve Shift: 00:00-08:00 UTC (16:00-00:00 PST), all times posted in UTC
STATE of H1: Calibration
INCOMING OPERATOR: TJ
SHIFT SUMMARY:
Beginning of shift was focused on stabilizing the Squeezer and finishing off a calibration measurement. After that we went to Observing. End of the shift had an alert for an incoming EQ.
LOG:
(Gray, Kissel, Thomas)
Patrick started this measurement at the end of his shift and I completed the measurement. Below is a summary:
[Sheila, Keita, TJ, Jenne]
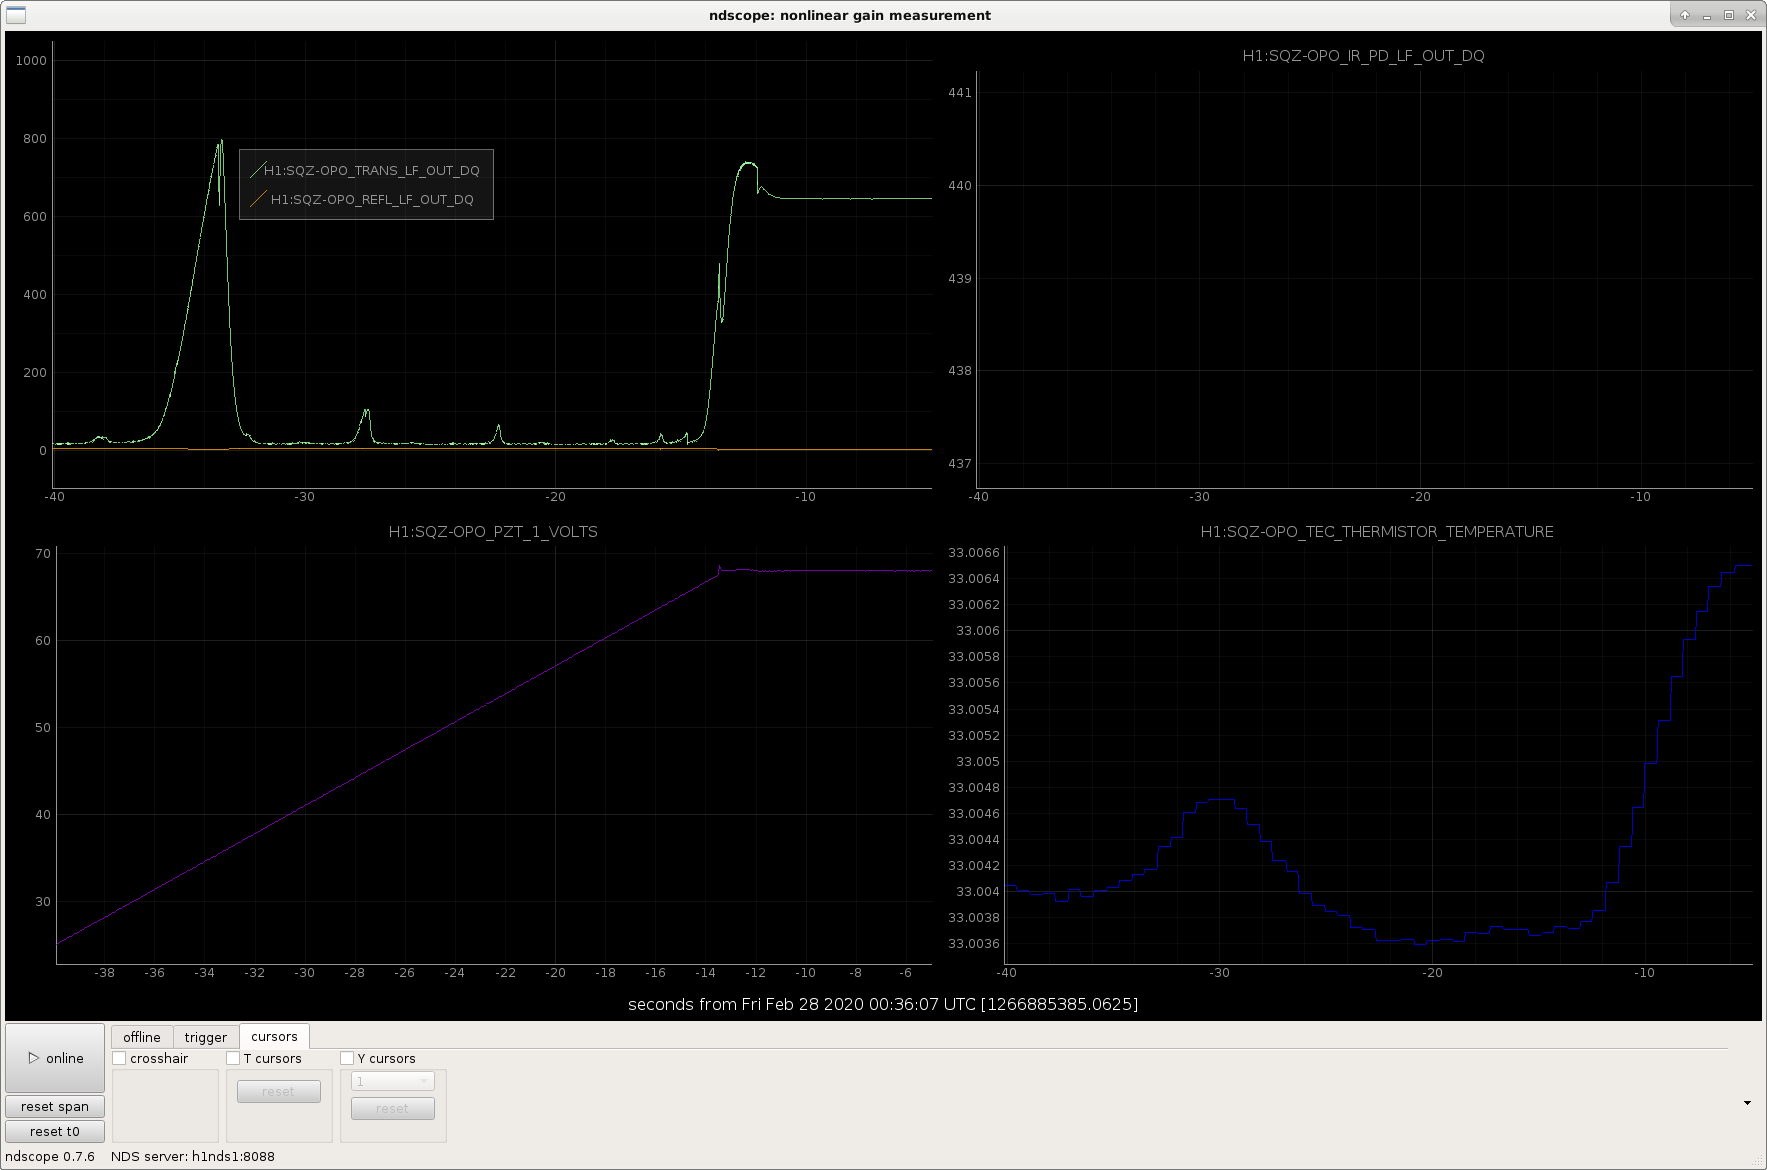
As we were finishing relocking, the squeezer manager wasn't happy, because the SQZ_LO_LR guardian wasn't getting to its nominal state and returning True because the standard deviation of H1:SQZ-OMC_TRANS_RF3_DEMOD_RFMON was too high. In the end, we've lowered the green power slightly, and the squeezer is back, and we're ready to go to Observing after the current calibration measurement is complete. On the one hand, we apologize for the glitches that this will have caused in the calibration data (although hopefully they are short enough to not be troublesome), but on the other hand we were out of observing anyway, so we didn't actually lose observing time due to this squeezer issue.
Also, when relocking the OPO Sheila noted that it looks like OPO didn't lock at the top of the peak, so Sheila is going to look at how this compares to the last time we moved the crystal to determine if we should find a new spot on the crystal during the long Tuesday maintenance. The second attached screenshot shows in the top left corner that the OPO Trans isn't at the peak after it is locked.
If the squeezer is not working sometime over night or over the weekend, and cycling the squeezer guardian doesn't fix the problem, you can try lowering the green power further so that we can get back to Observing with some squeezing, rather than having to Observe with no squeezing at all. We hope that this will not be necessary.
TITLE: 02/28 Eve Shift: 00:00-08:00 UTC (16:00-00:00 PST), all times posted in UTC
STATE of H1: Calibration
OUTGOING OPERATOR: Patrick
CURRENT ENVIRONMENT:
SEI_CONF state: WINDY
Wind: 11mph Gusts, 9mph 5min avg
Primary useism: 0.03 μm/s
Secondary useism: 0.35 μm/s
QUICK SUMMARY:
Currently in the middle of an approved Calibration measurements (about 90min left in it).
TITLE: 02/27 Day Shift: 16:00-00:00 UTC (08:00-16:00 PST), all times posted in UTC STATE of H1: Calibration INCOMING OPERATOR: Corey SHIFT SUMMARY: We are about half an hour into the approximately two hour calibration measurement. Jenne, Sheila and Keita are diagnosing the squeezer. LOG: 16:03 UTC Tyler starting tumbleweed processing on X1 17:20 UTC Karen to mid Y 17:30 UTC Niko and Dripta to optics lab 17:58 UTC Karen leaving mid Y 18:28 UTC Rick, Camilla, and Jason to optics lab 19:02 UTC Jason back 19:43 UTC Tyler done 20:06 UTC Jeff J. to optics lab 21:08 UTC Scott to end X chiller yard to clear tumbleweeds 21:13 UTC Lock loss 21:19 UTC Scott driving forklift to VPW 21:23 UTC SEI_CONF changed from TEST_SWARM to WINDY 21:32 UTC Chandra to LVEA 21:37 UTC Kyle to LVEA to drop off parts 21:45 UTC Lock loss from PREP_DC_READOUT_TRANSITION 21:47 UTC Scott done moving forklift. Scott to end Y chiller yard to clear tumbleweeds. 21:50 UTC Lock loss from ACQUIRE_DRMI_1F 21:54 UTC Chandra and Kyle back from LVEA. Lights are off. 21:57 UTC Cheryl loading violin monitor filters 22:00 UTC Cheryl done 22:09 UTC Lock loss from POWER_10W 22:29 UTC Lock loss from POWER_10W 22:45 UTC Scott leaving end Y 23:10:53 UTC Reached INJECT_SQUEEZING. Squeezer oscillating. Sheila, Jemne, Keita investigating. Started calibration measurement (alog 55297) PCALXHFLINEFREQ 4001.3
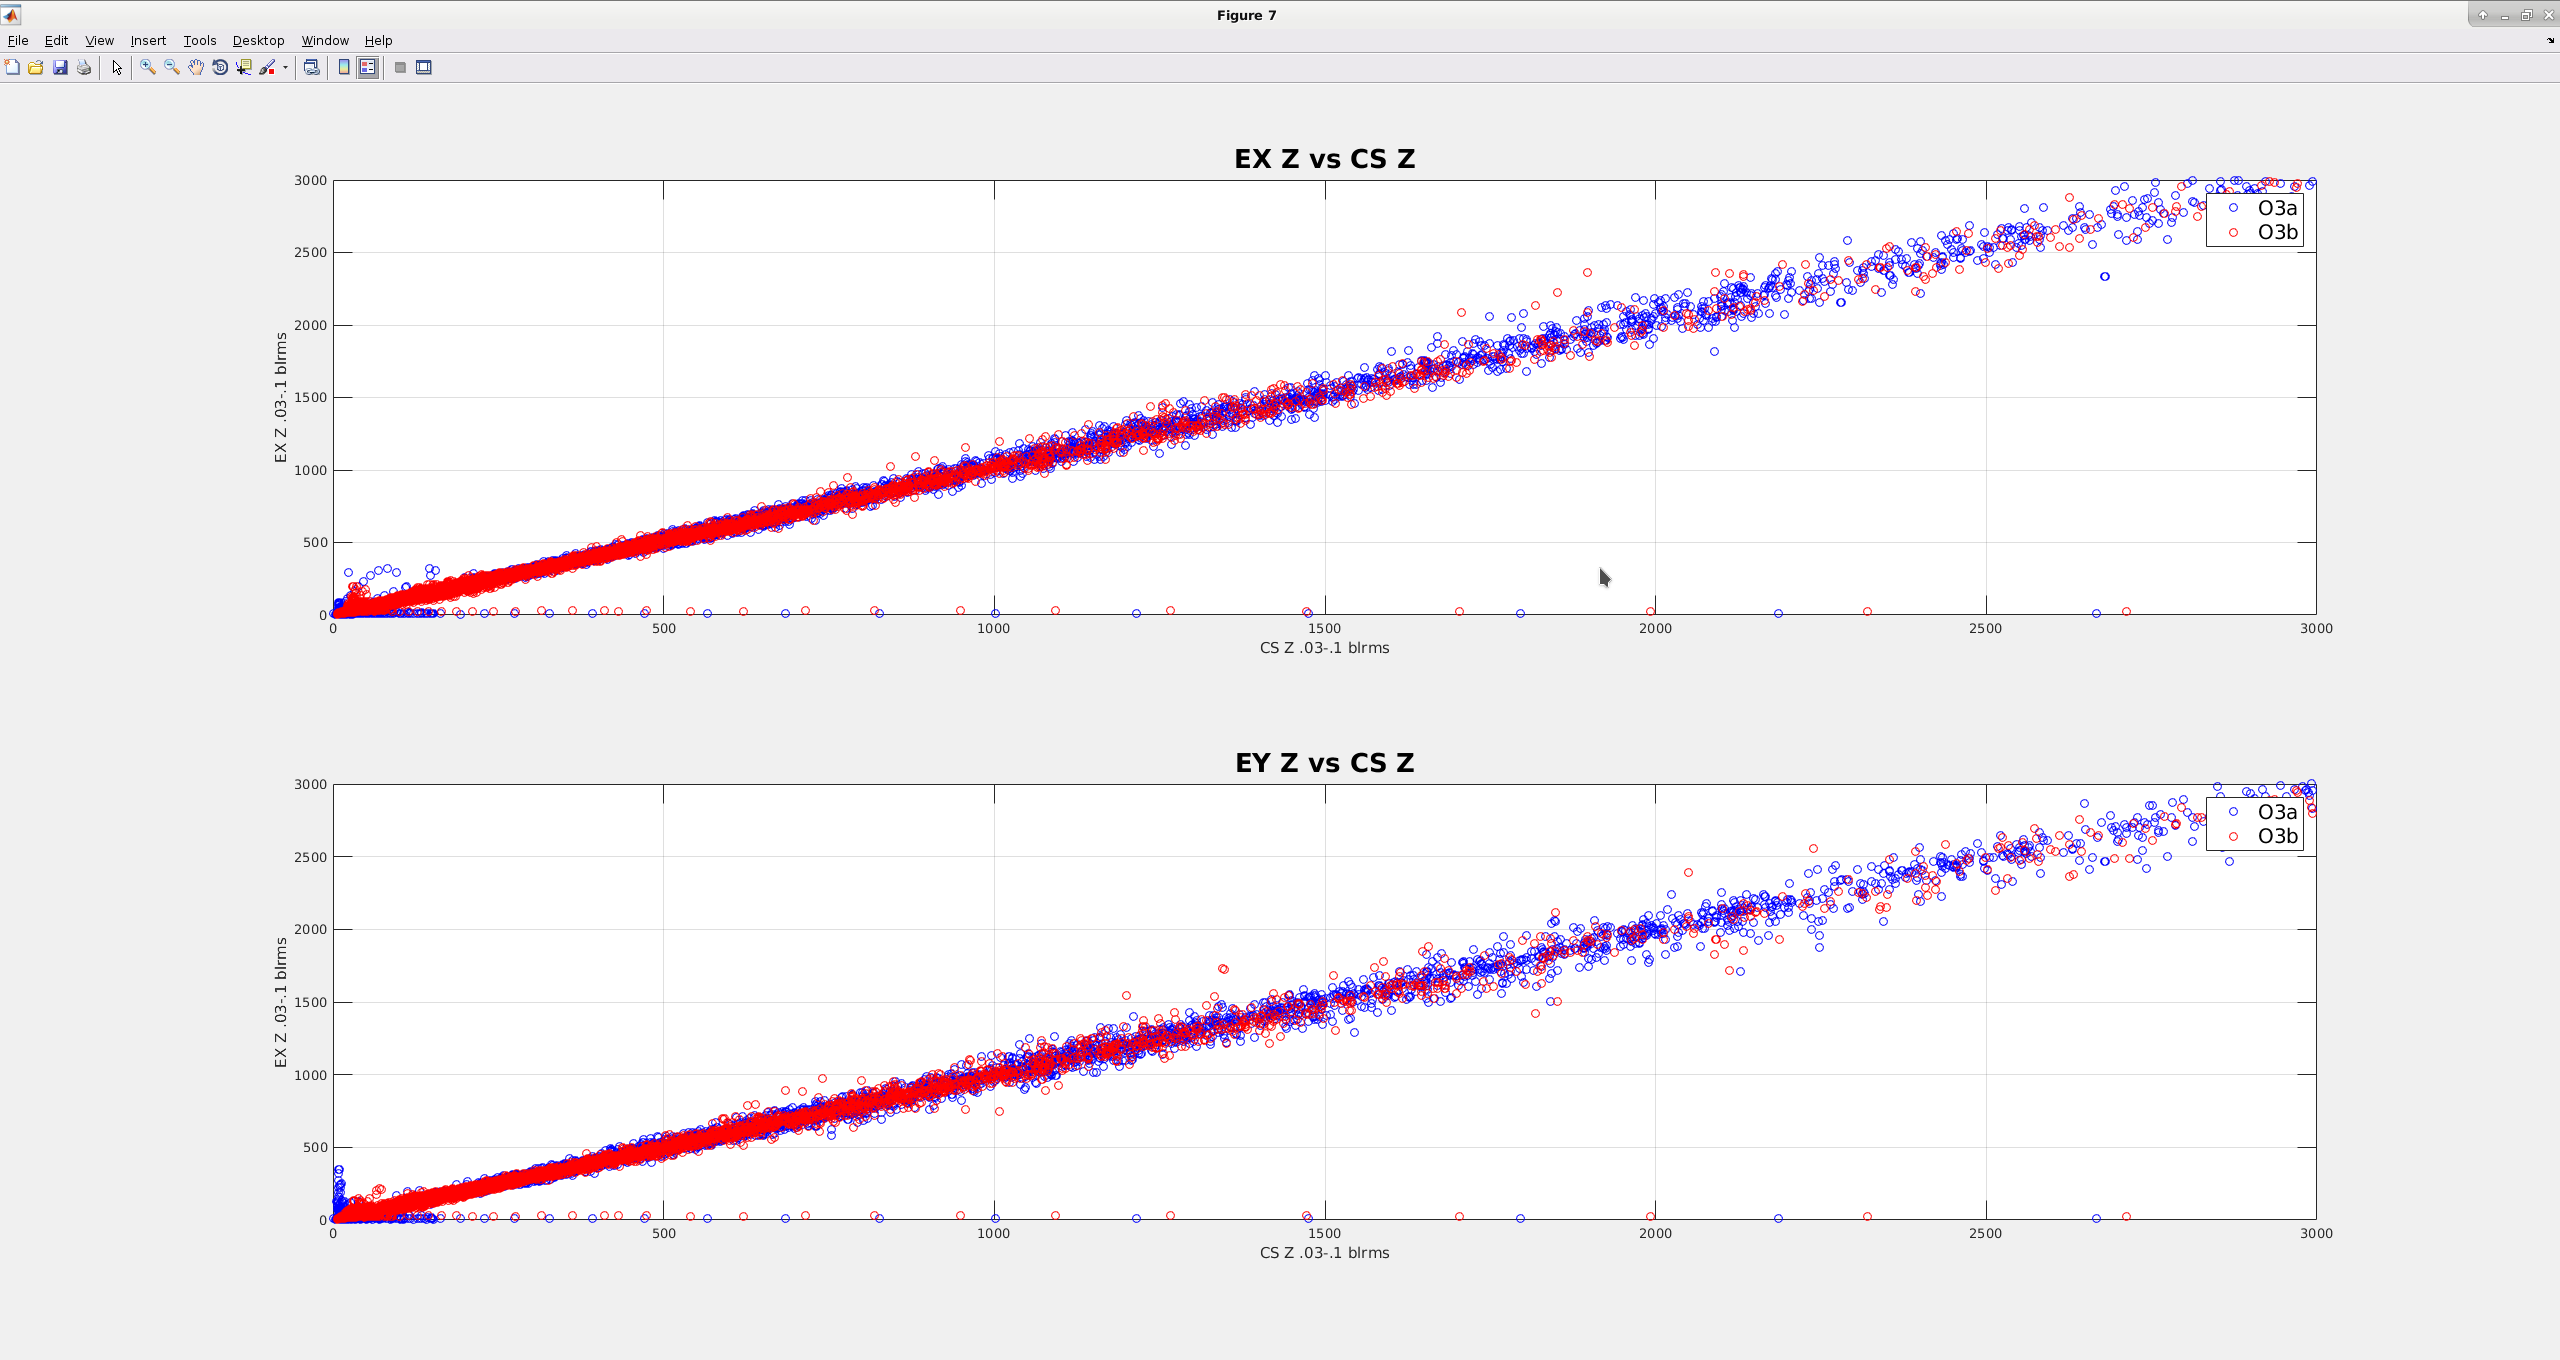
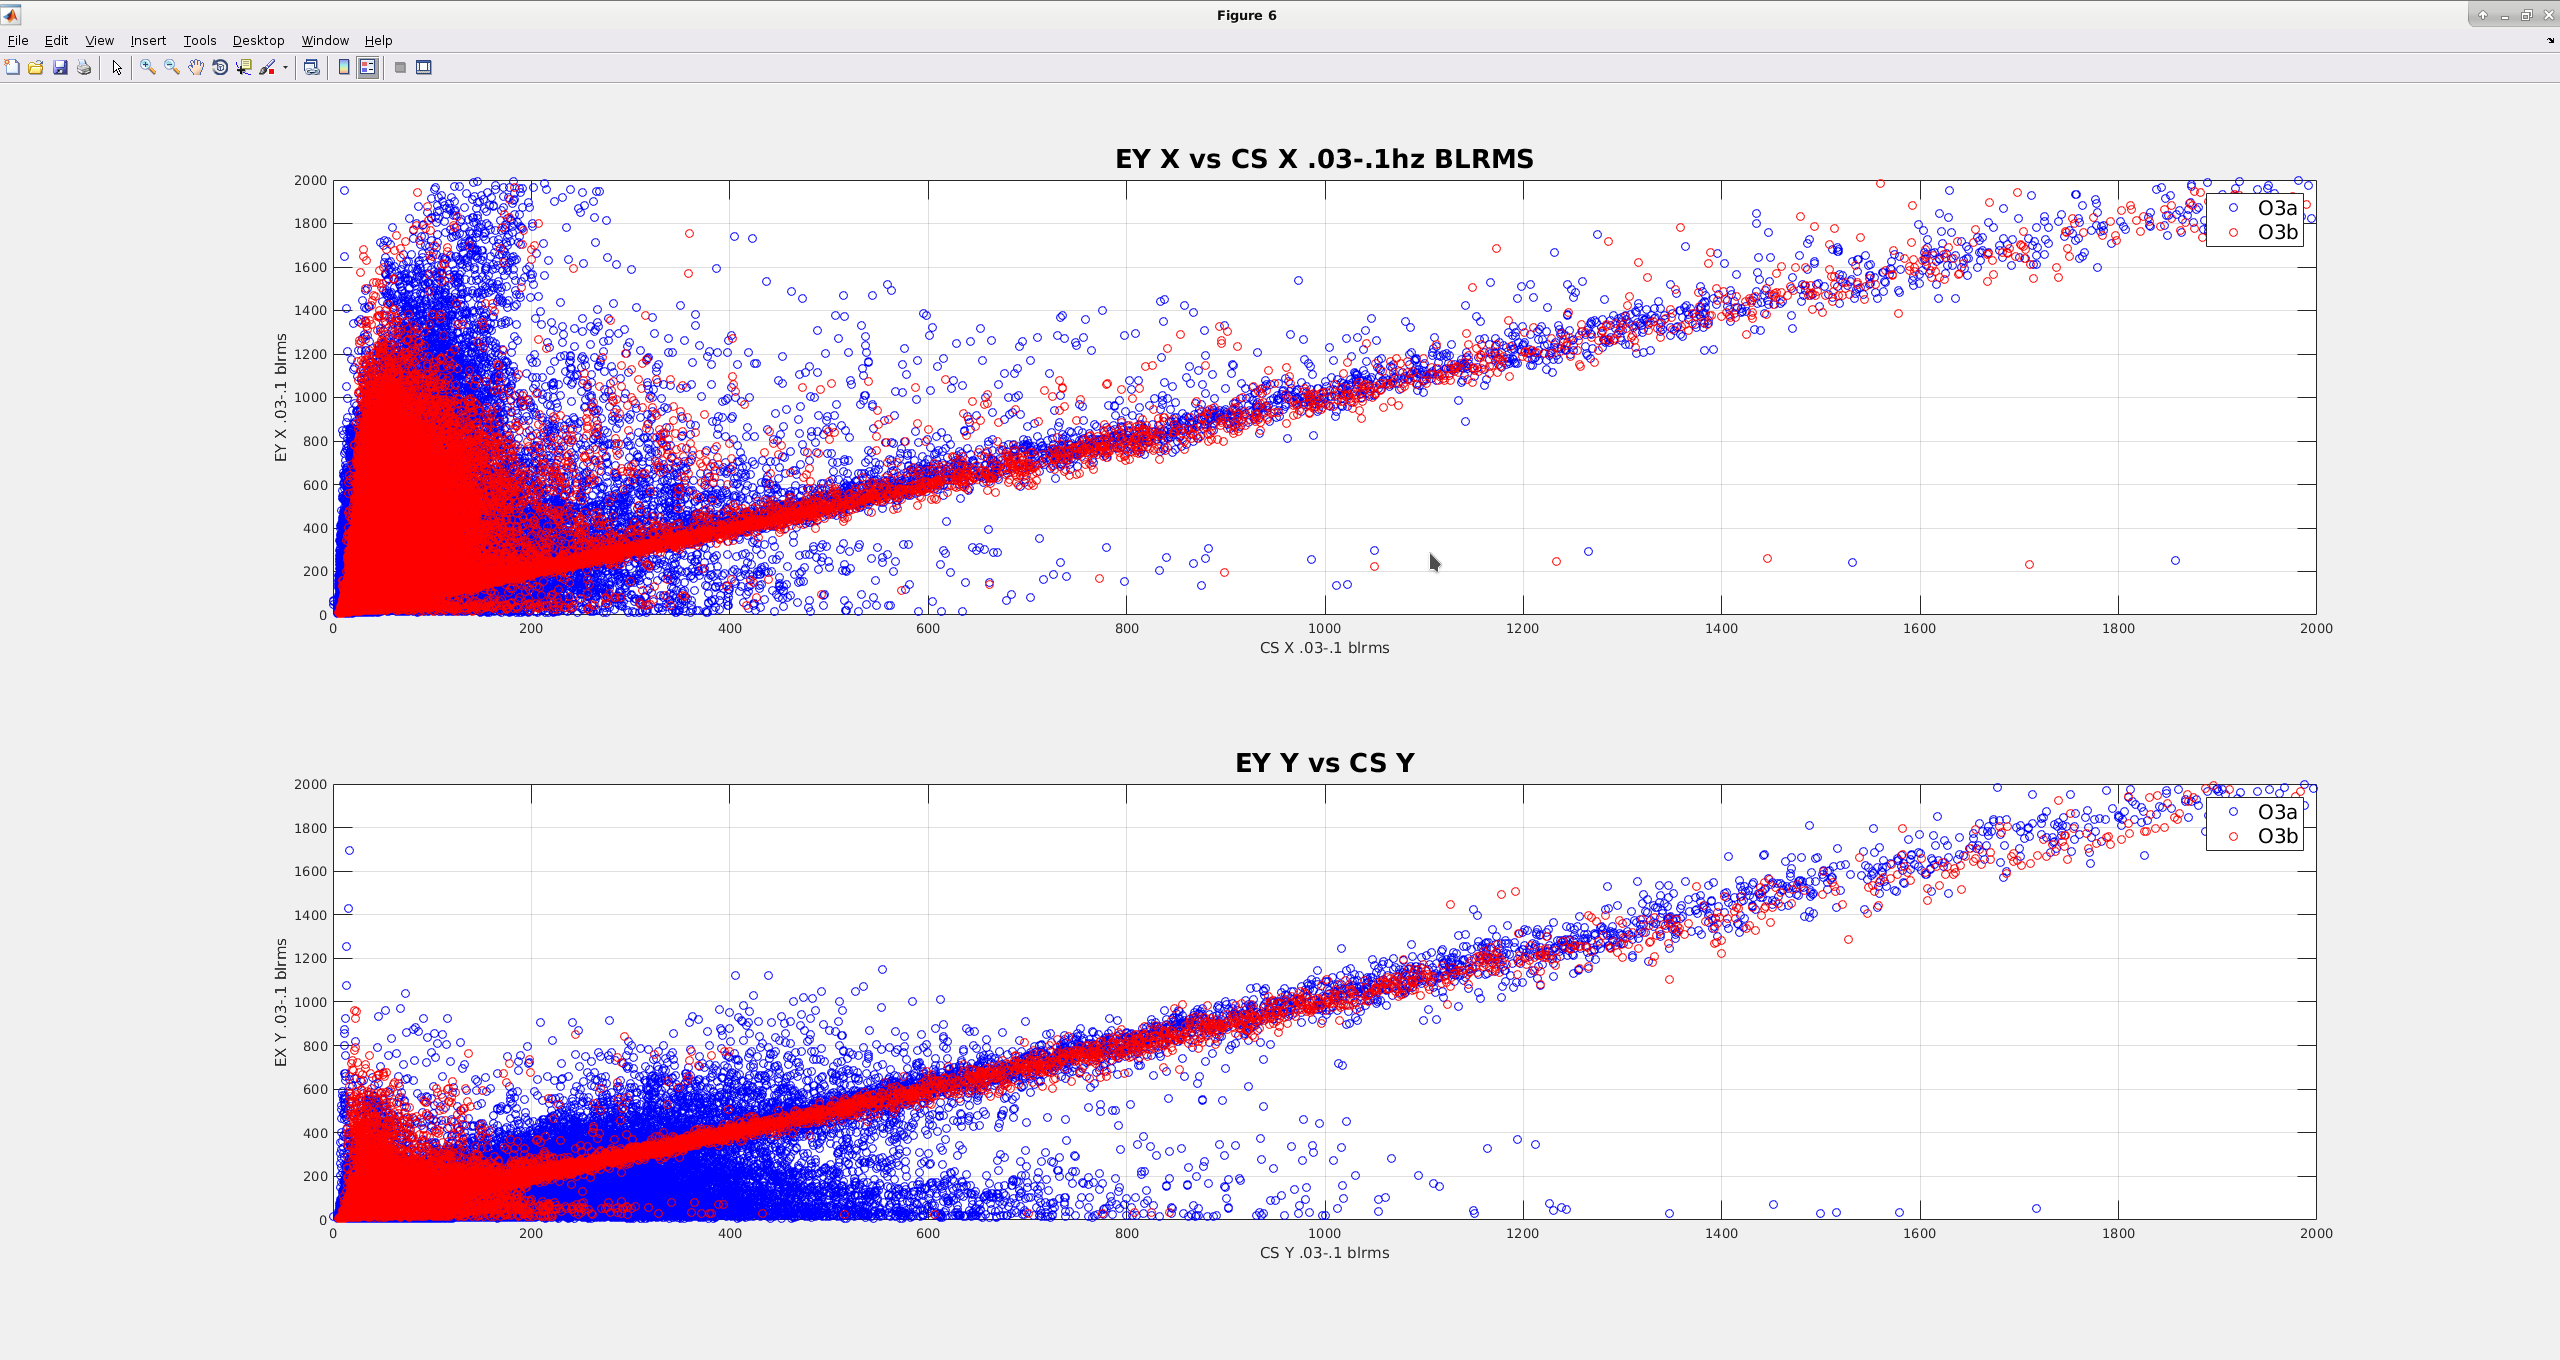
I've been staring at some data to see if the wind fences have had a measureable effect on building tilts at the end stations. I'm still working on this, but I have a couple interesting plots, that I think show that the low frequency motion is more correlated now after the wind fence went up, than before. Attached plots are kind of like scatter plots for the .03-.1hz blrms motion for the ITMY and ETMY seismometers, i.e. each point represents the corner station blrms motion on the X axis and the end station motion on Y axis. If each station were moving the exact same at the moment, all of the points would lie on a one-to-one line.
First plot compares the ITMY Z, ETMX Z and ETMY Z ground STS .03-.1hz blrms. The blue points are for O3a, before the fences went up, red is O3b, after the fence went up. Most of the data falls on a line of slope 1,suggesting the motion is related for this dof. Not suprising, because most of the motion in this direction at these frequencies has wavelengths many times the size of the site, so ends and corner are mostly moving together. Wind is more local, but doesn't show up in Z as strongly.
Second plot compares the X&Y for ITMY and ETMY ground STS. Again, blue points are O3a, red is O3b. Since the fence went up, the X&Y blrms now lie more on the 1 to 1 slope than they did before October. I would expect that if wind were still the strongest effect on the low frequency motion, the red lines would have stayed more "blobbish" in the lower right of the plot, for lower velocities. This is especially noticeable in the Y dof, which makes sense, given the orientation of the fence at EY. The fence will do a good job blocking winds coming from IFO +Y, and not at all for winds coming along X. Keep in mind the winds in the past 2 months have been much worse than during the entire O3a part of the run. It would instructive to run this on a similarly windy time prior to O3.
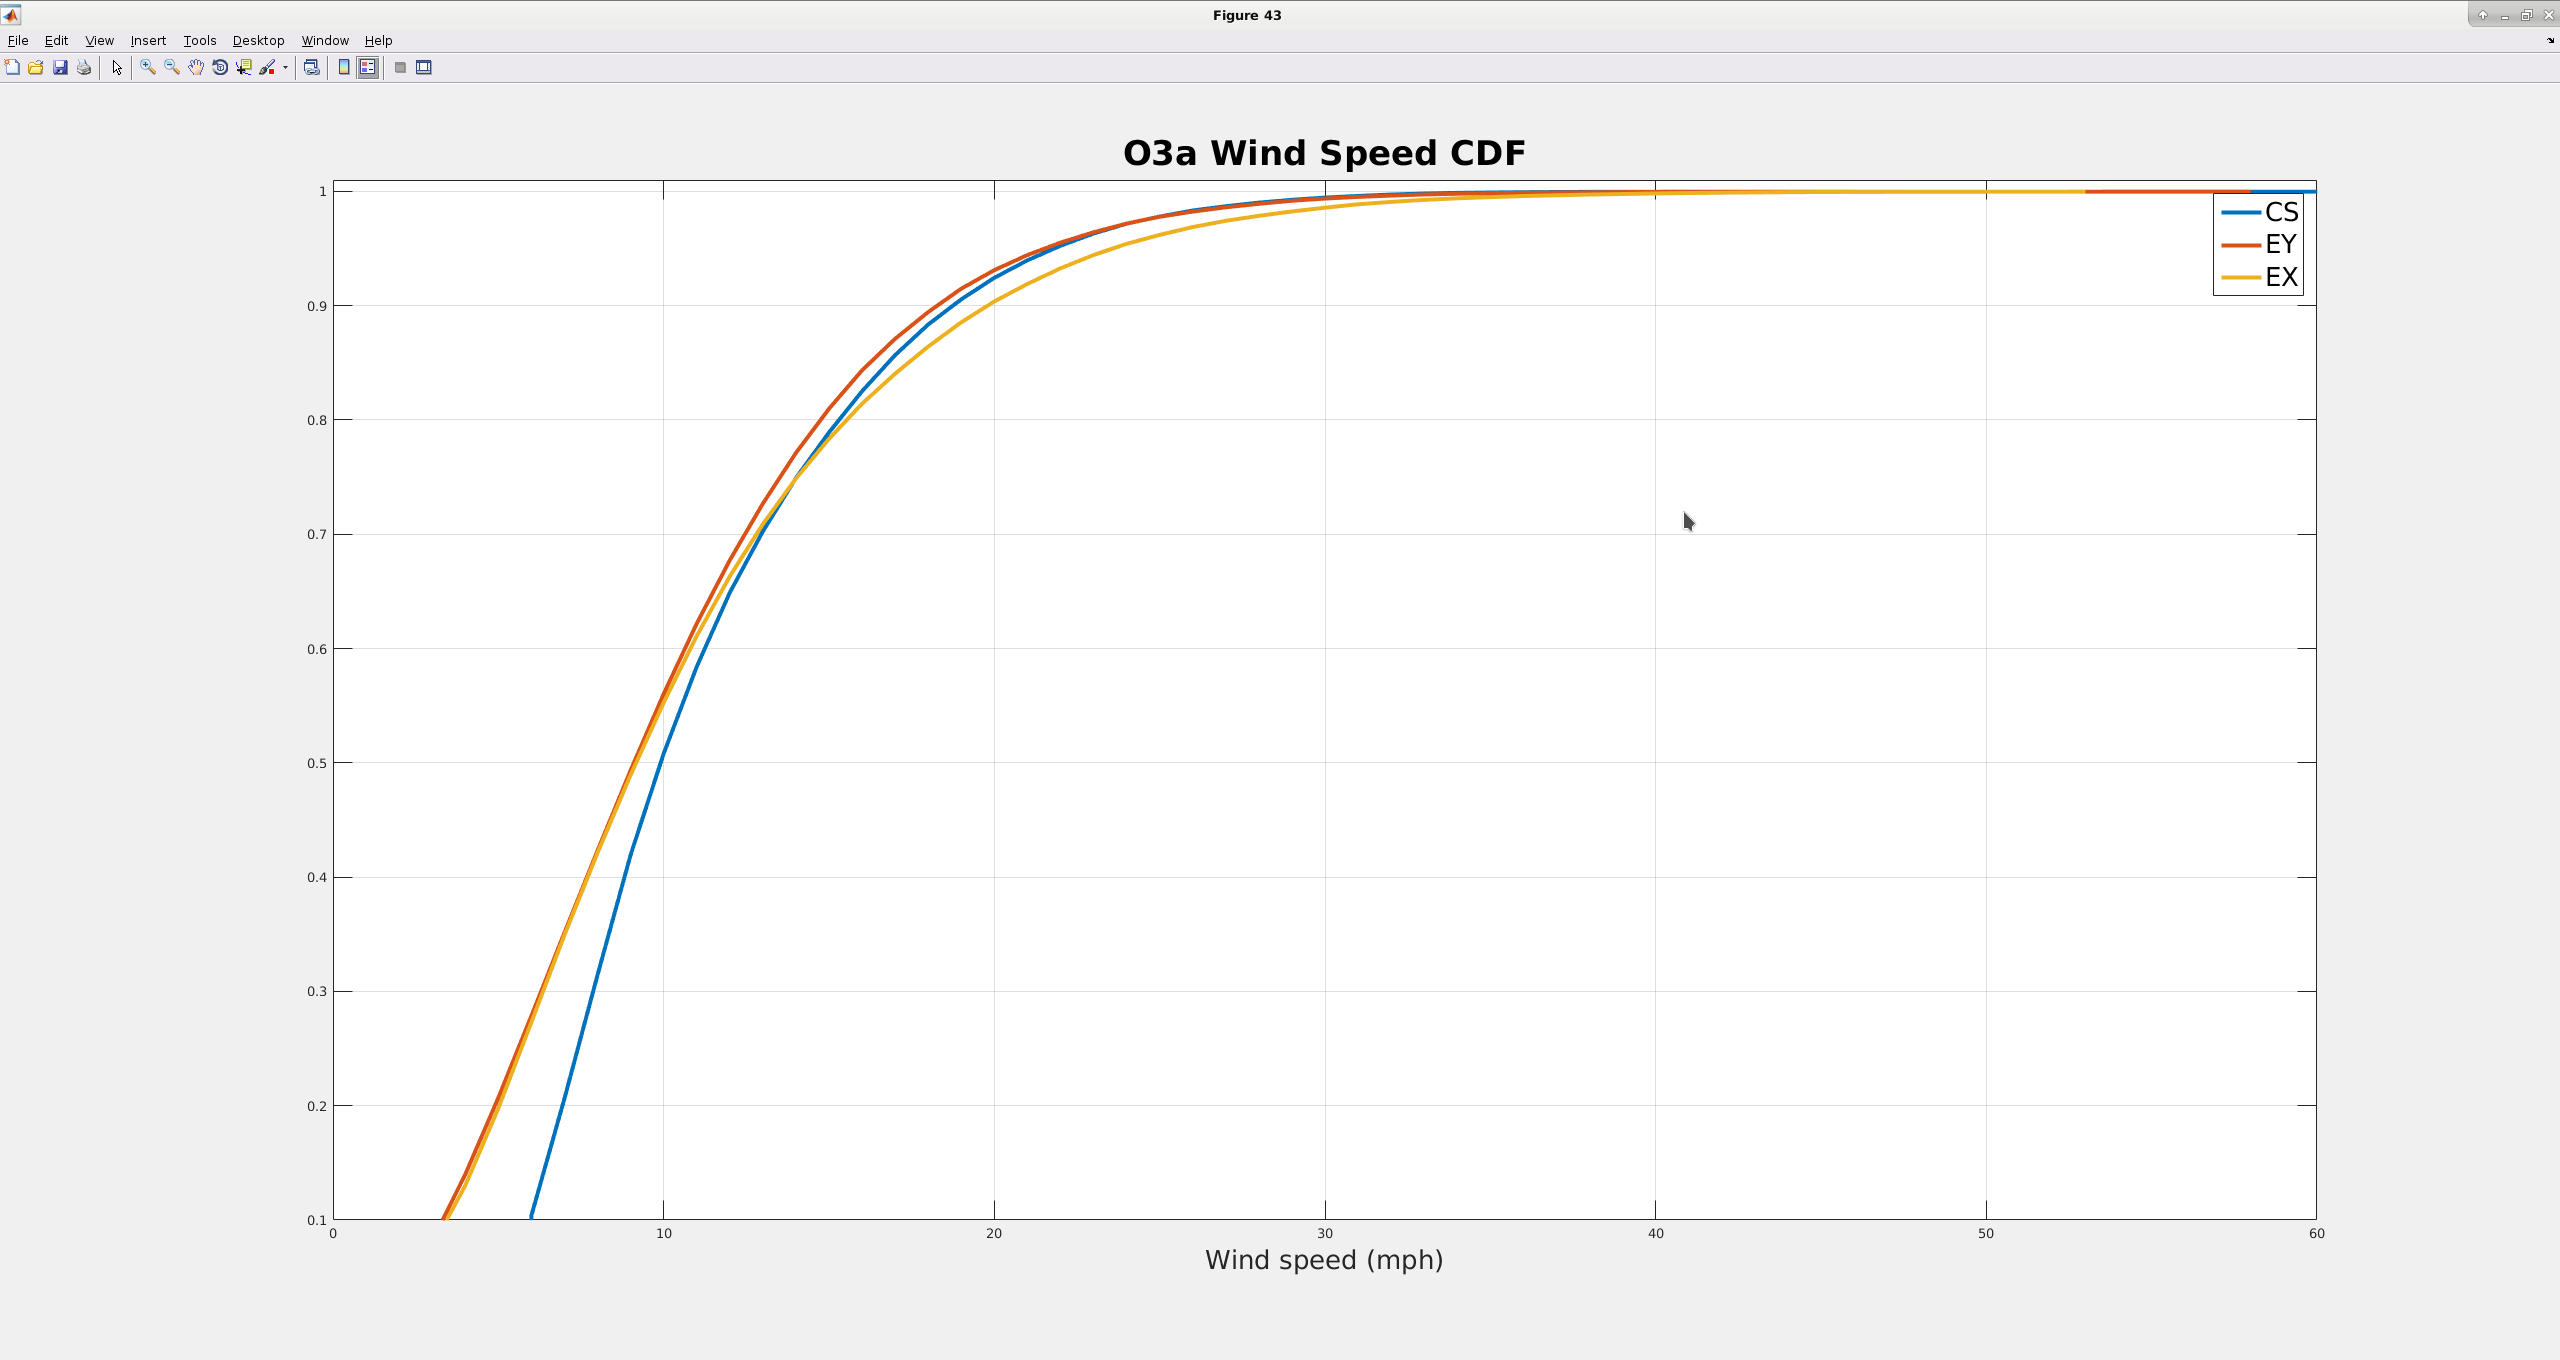
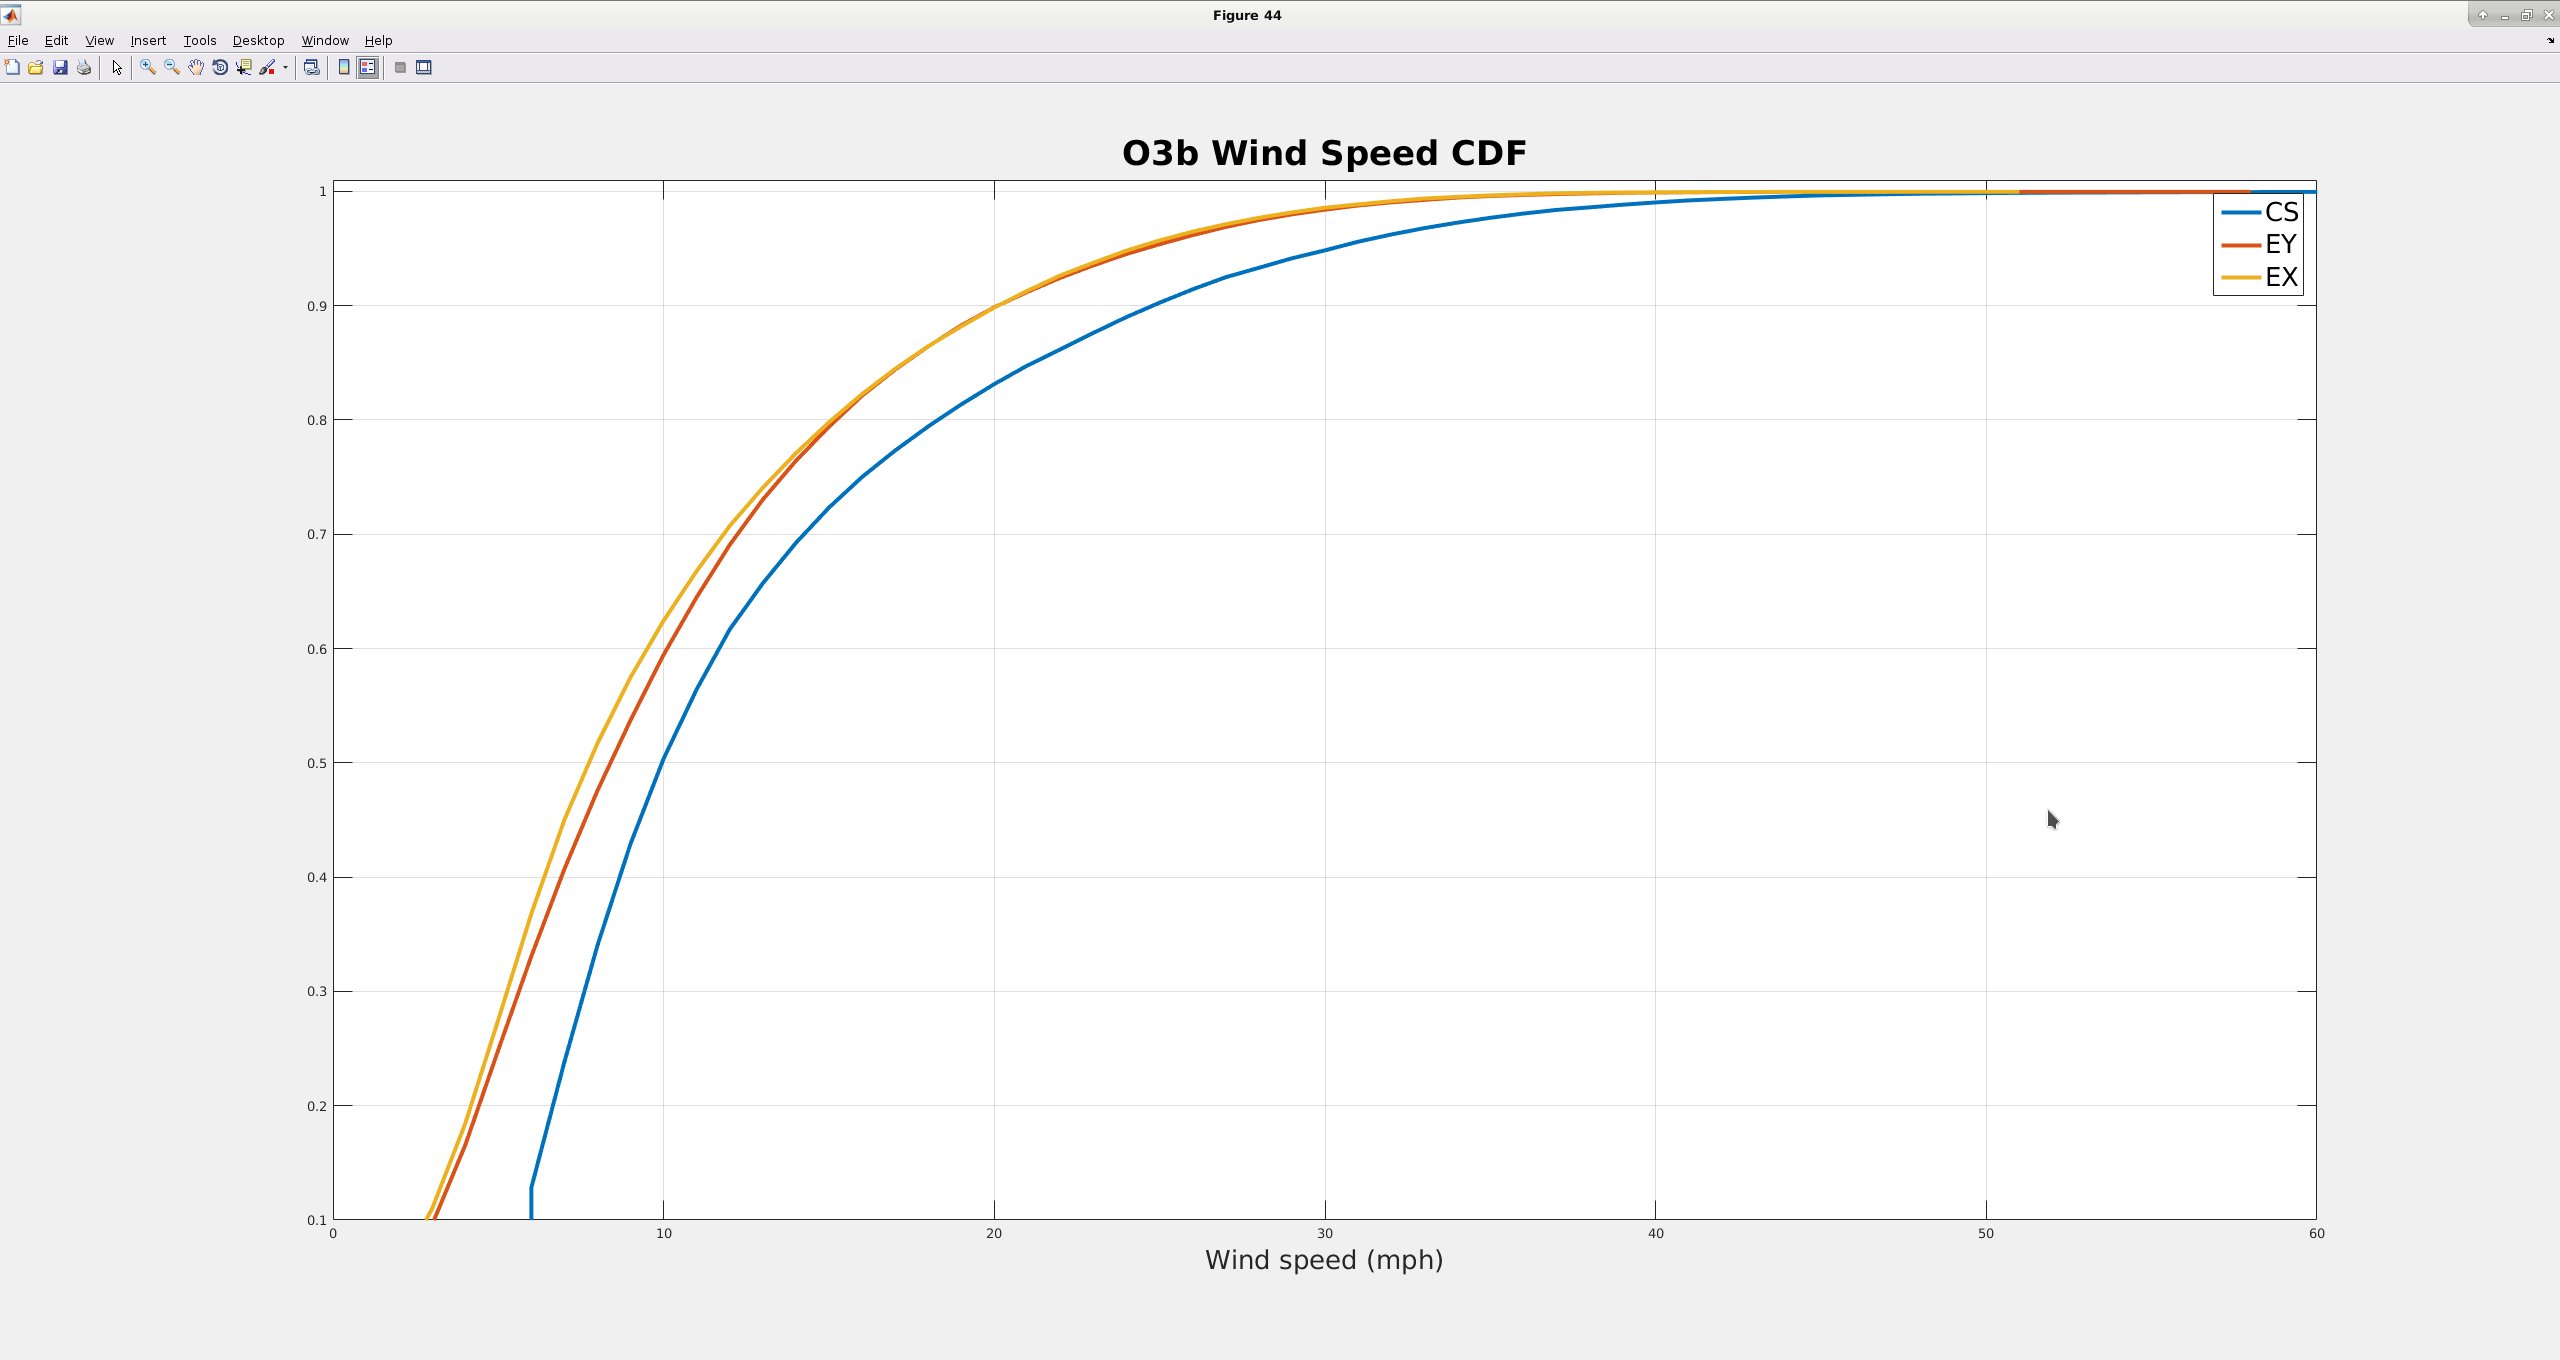
I'm attaching plots comparing the cumulative distributions of the winds for the 2 end stations and the corner. For these distributions, I had to look at times when the corner station was above 5mph. I think this makes sense, because higher winds will tend to be more sustained. The distributions tended to be kind of dominated by the lower winds, making it hard to tell the difference between the distributions above ~95%.
For O3a (first image), the distributions for the 3 buildings are pretty similar, especially above ~10 mph. The 50% level is about 10mph for the corner, maybe 9mph for the ends. The 90% level is just shy of 20mph for all 3 buildings
For O3b (second image), there is more of a consistent difference between distributions for the ends and the corner. And the distributions are toward lower wind speeds for the ends, again suggesting that the wind fences are having the impact on wind speeds at the buildings that we want. Again, the corner 50% level is about 10 mph, the ends are maybe 8 mph. The 90% level for the corner is now about 25 mph ( an increase of 5mph, reflecting the rather windy winter we've been having), while the ends are still right at 20 mph.
TITLE: 02/26 Eve Shift: 00:00-08:00 UTC (16:00-00:00 PST), all times posted in UTC
STATE of H1: Observing at 119Mpc
INCOMING OPERATOR: TJ
SHIFT SUMMARY:
H1's been locked the entire shift with a range hovering around 119Mpc. There is an earthquake inbound squarely in the "Earthquake" region with R-Wave due to arrive around 8:25utc (1:25amPT). We have a now have the new SEI_ENV guardian node active and ready to manage SEI_CONF in case it needs to transion to the EARTHQUAKE state.
The GWIstat tool (and my Chirp phone app) saw H1 drop out of OBSERVING three times at the beginning of the shift for a few seconds (I chatted to Greg M about this. (so this is why the Observing time and Lock time look different.)
LOG:
The CHIRP app gets its detector status information from gwistat, so it makes sense that it would show the same status drop-out.
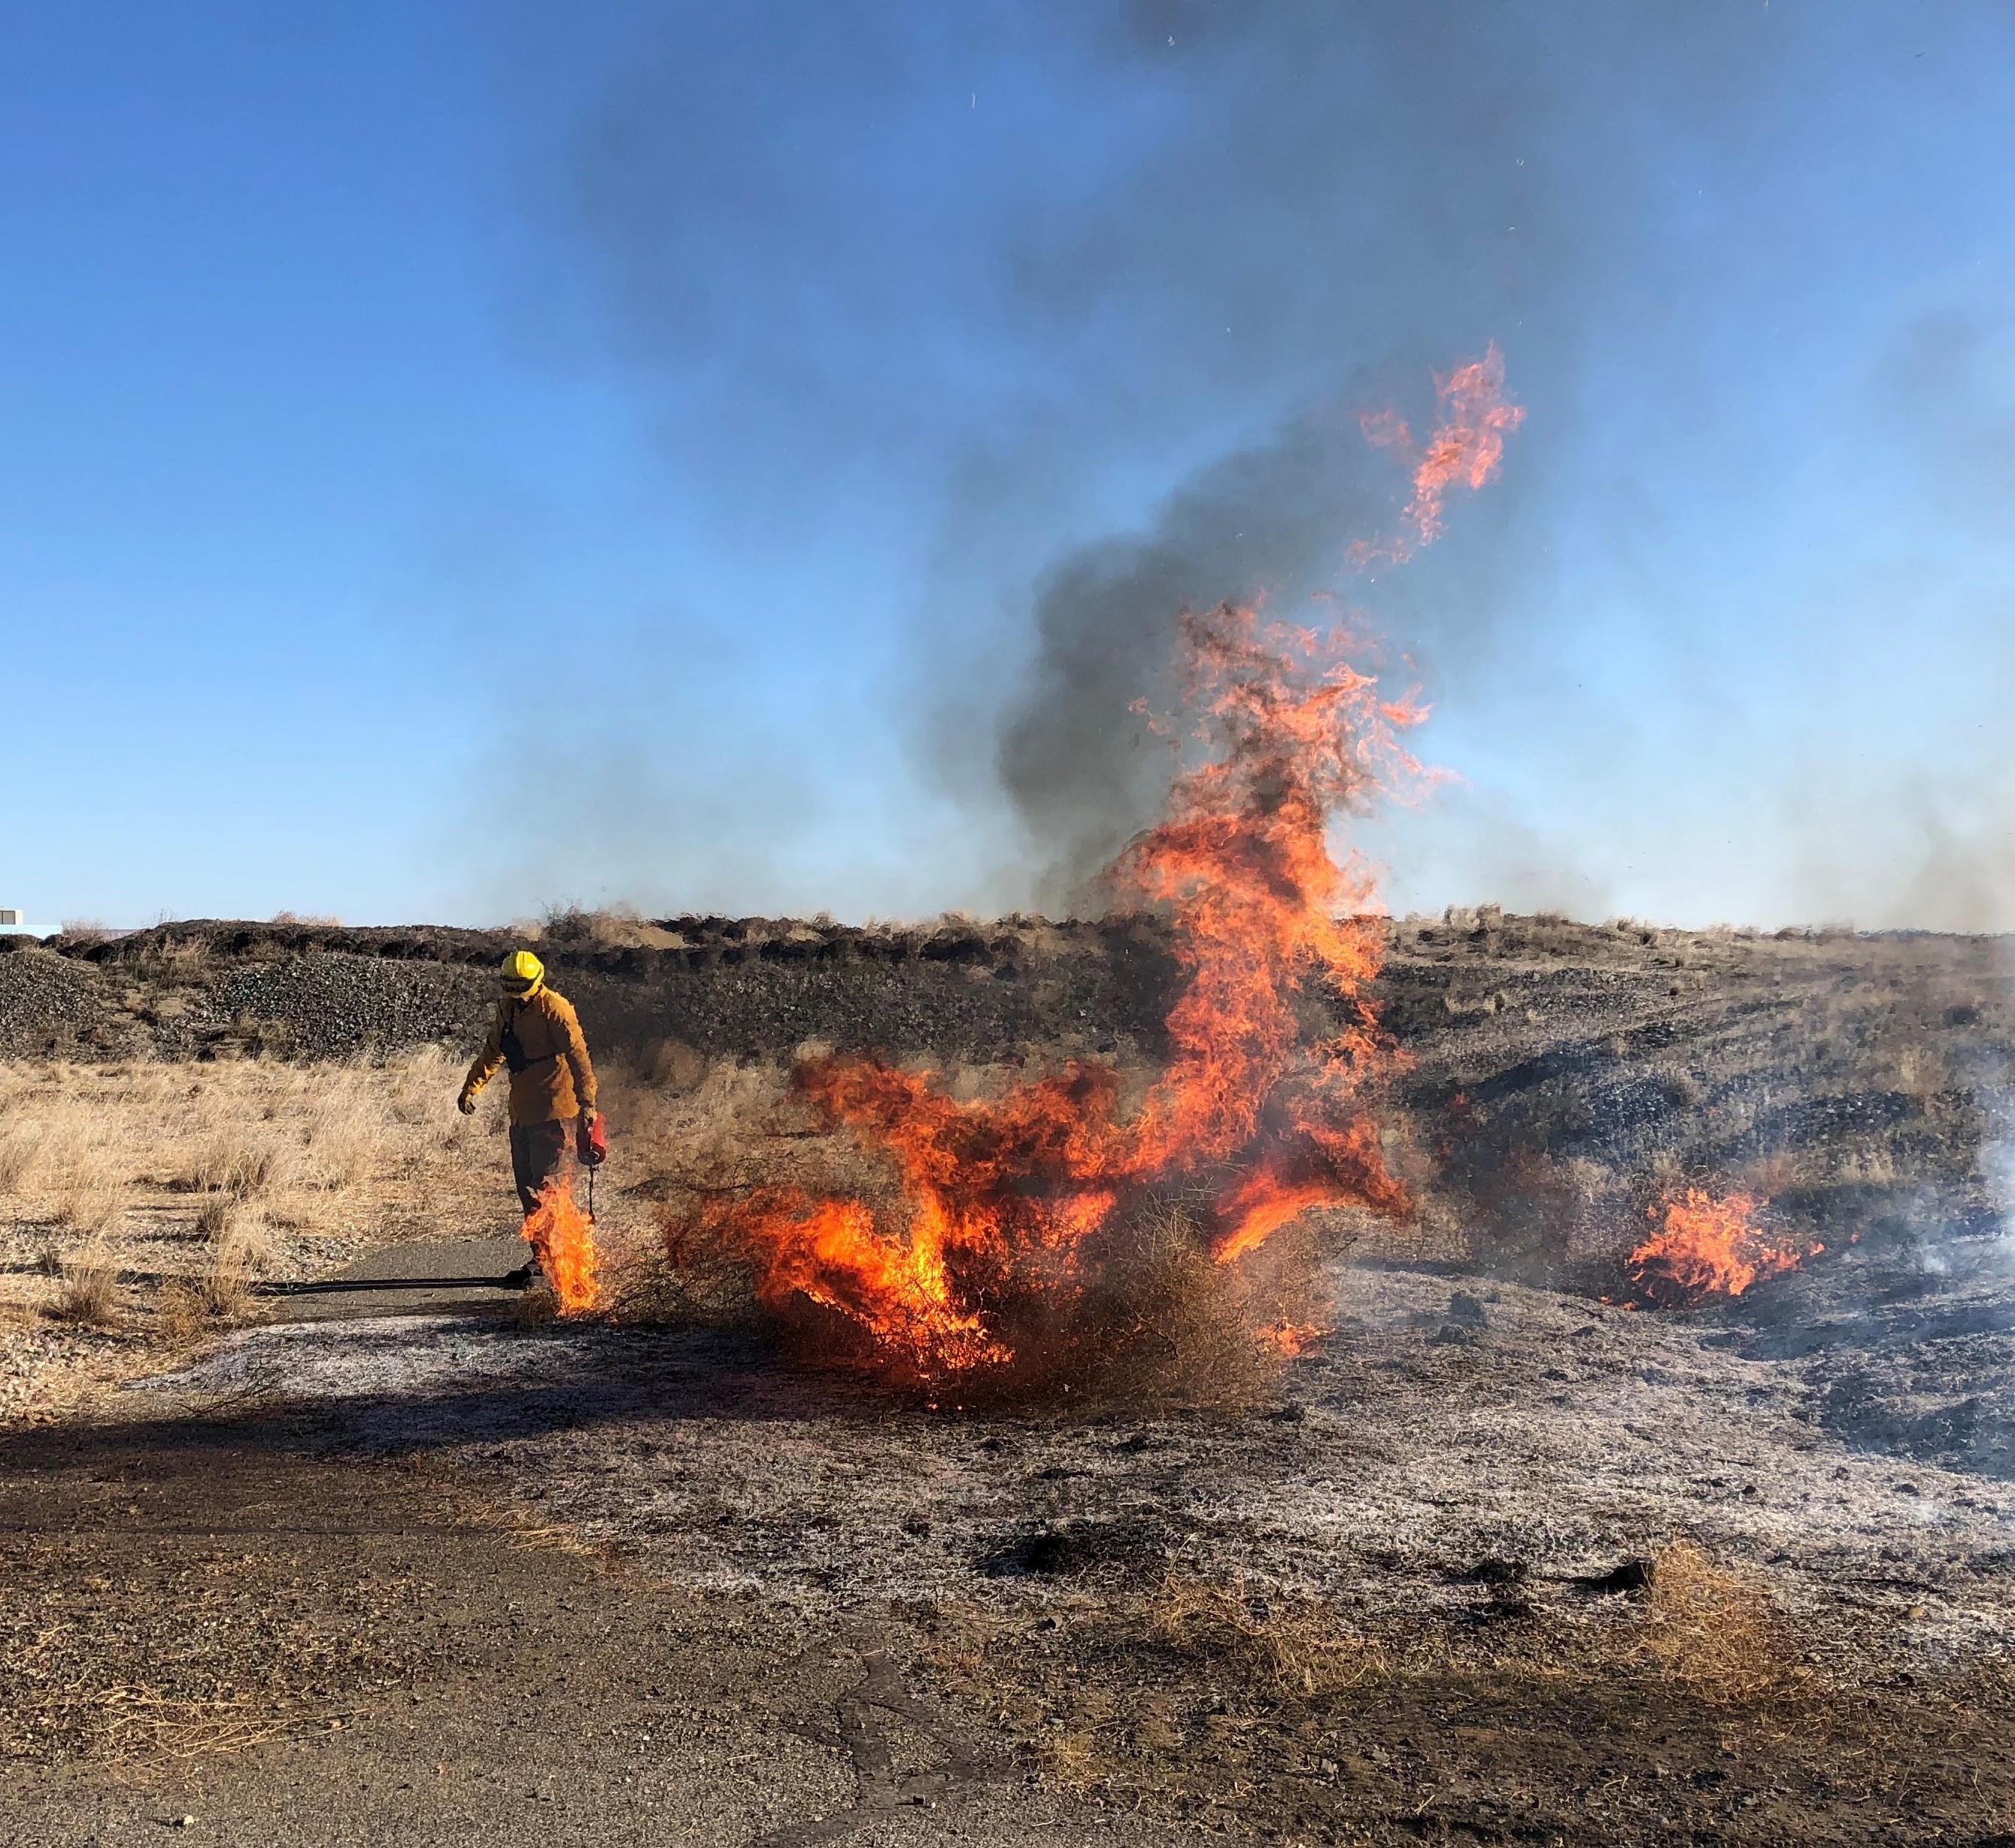
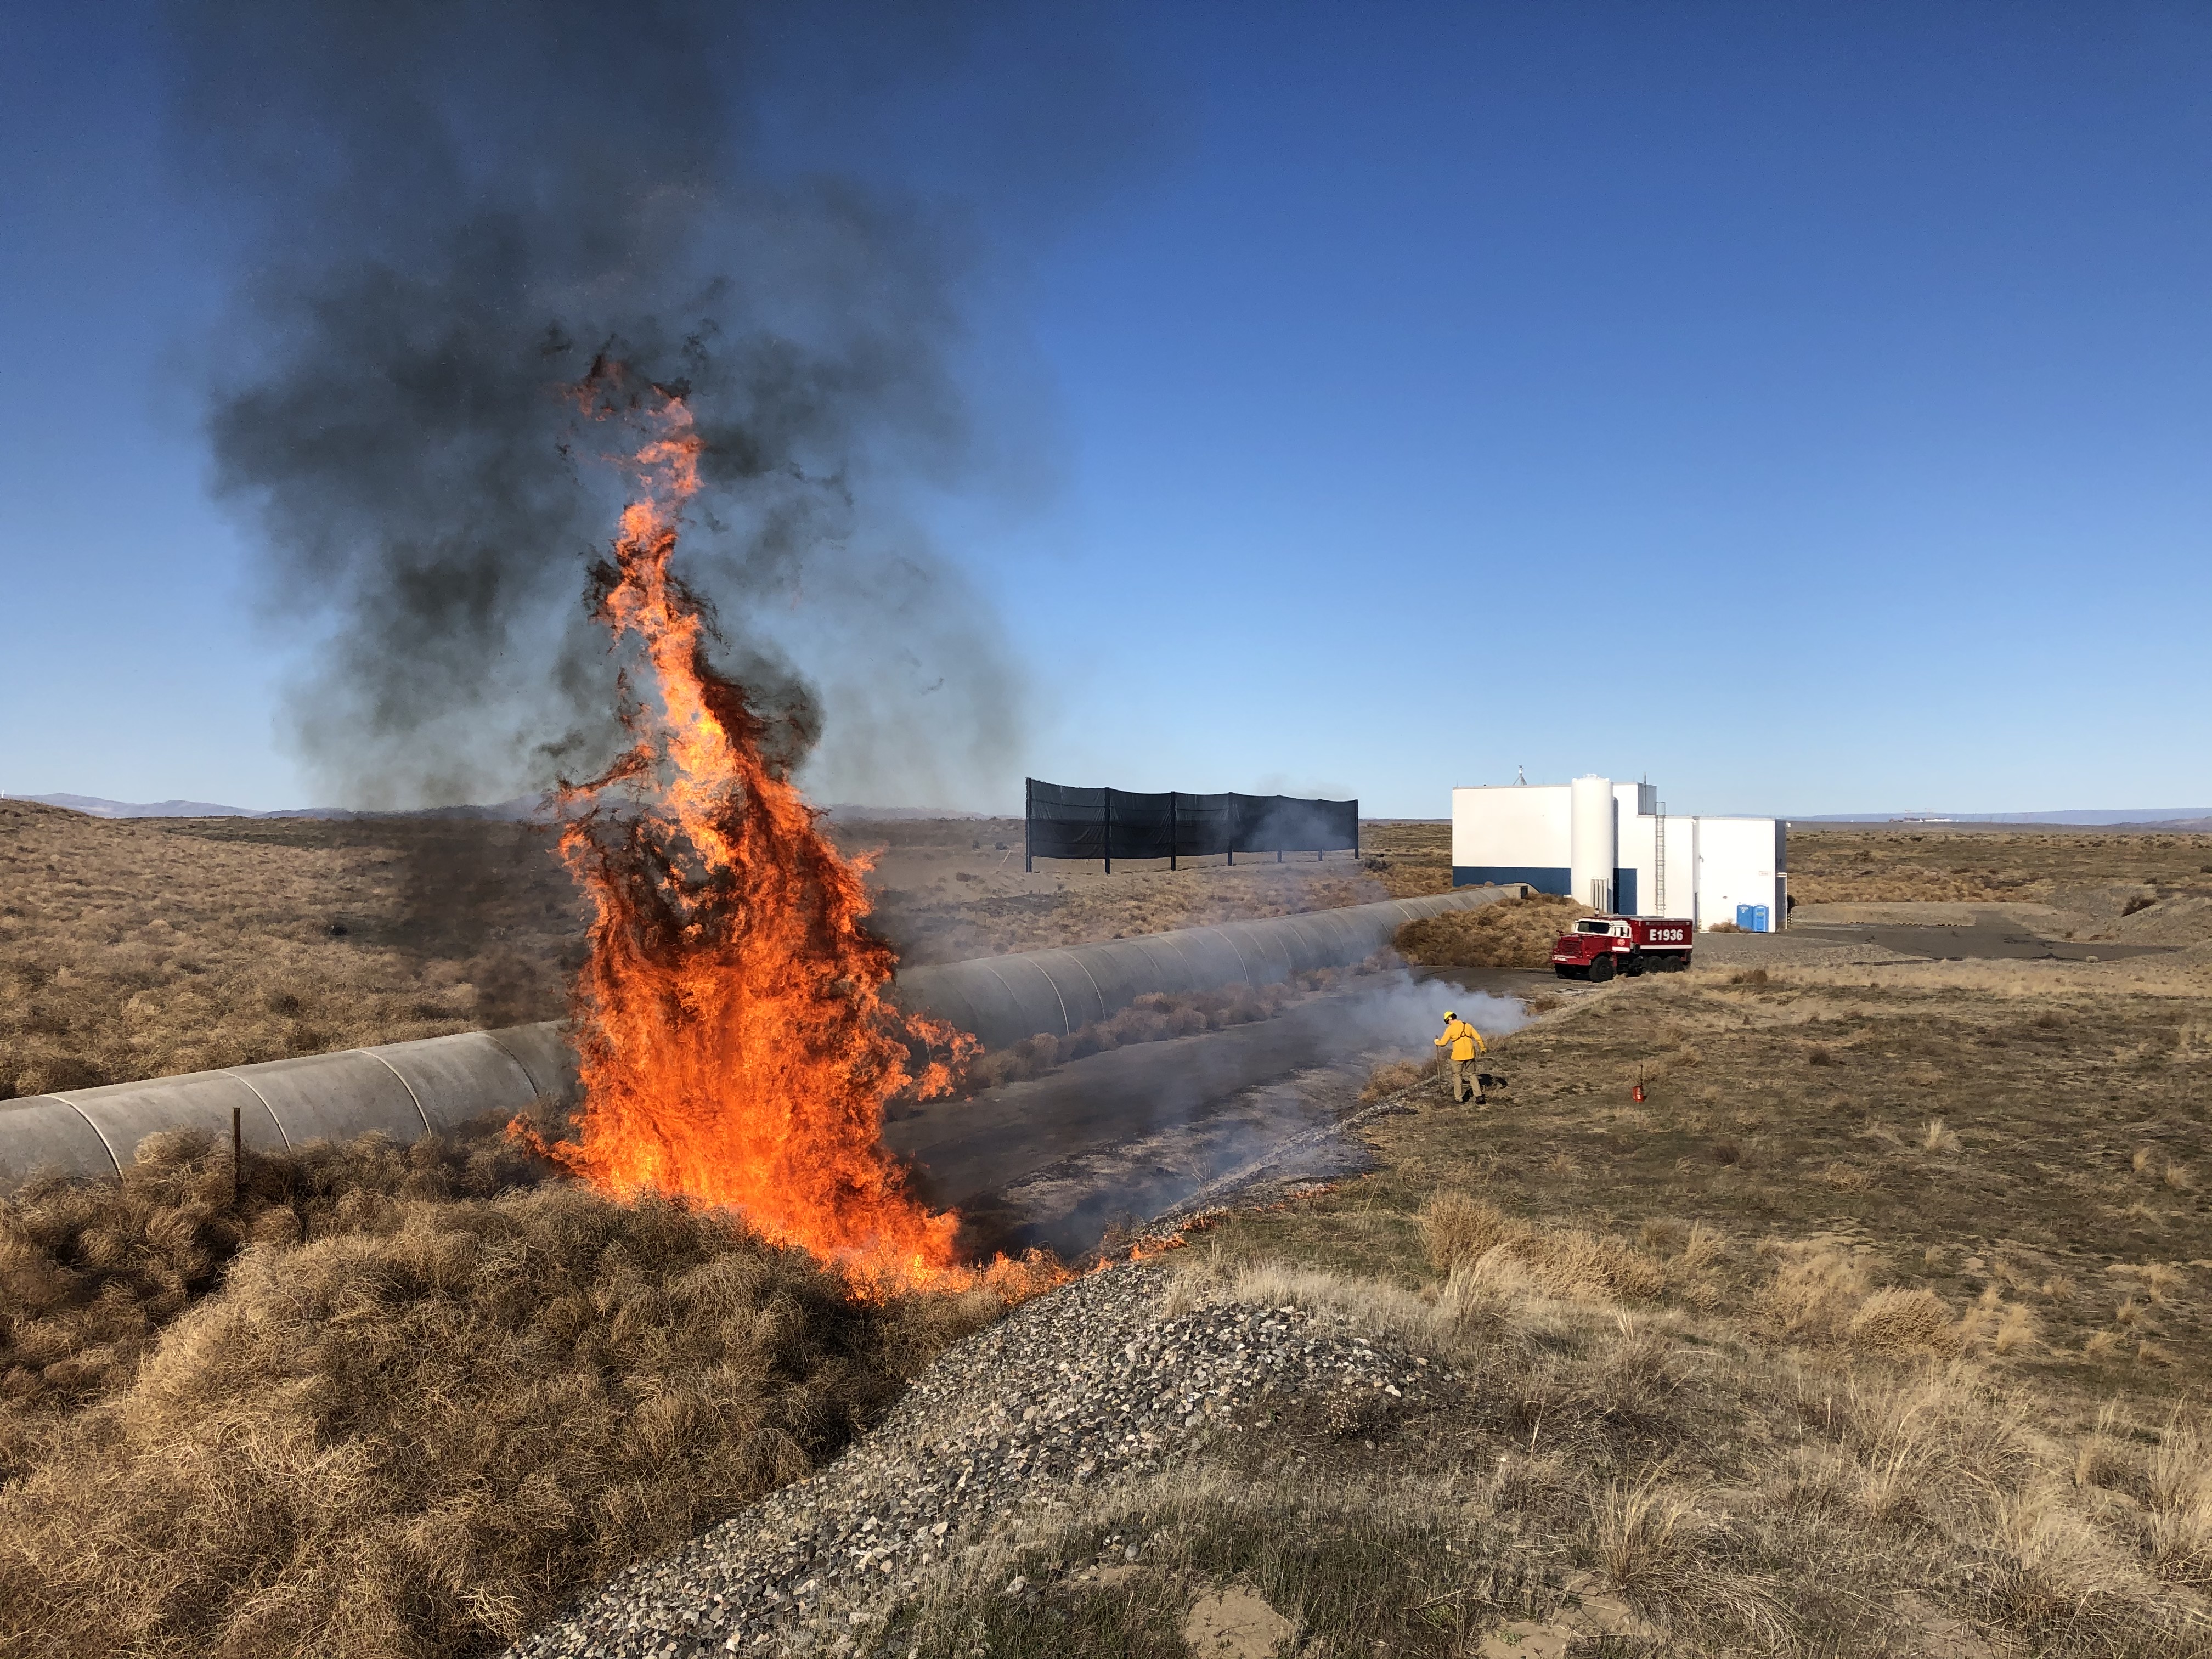
Bubba arranged for the Hanford Fire Department to begin a controlled burn this morning, starting at EX so that they would be well away from the end station as Tuesday maintenance activities draw to a close. We are grateful that this hazard is being removed, and for the expert care they are showing in the process.
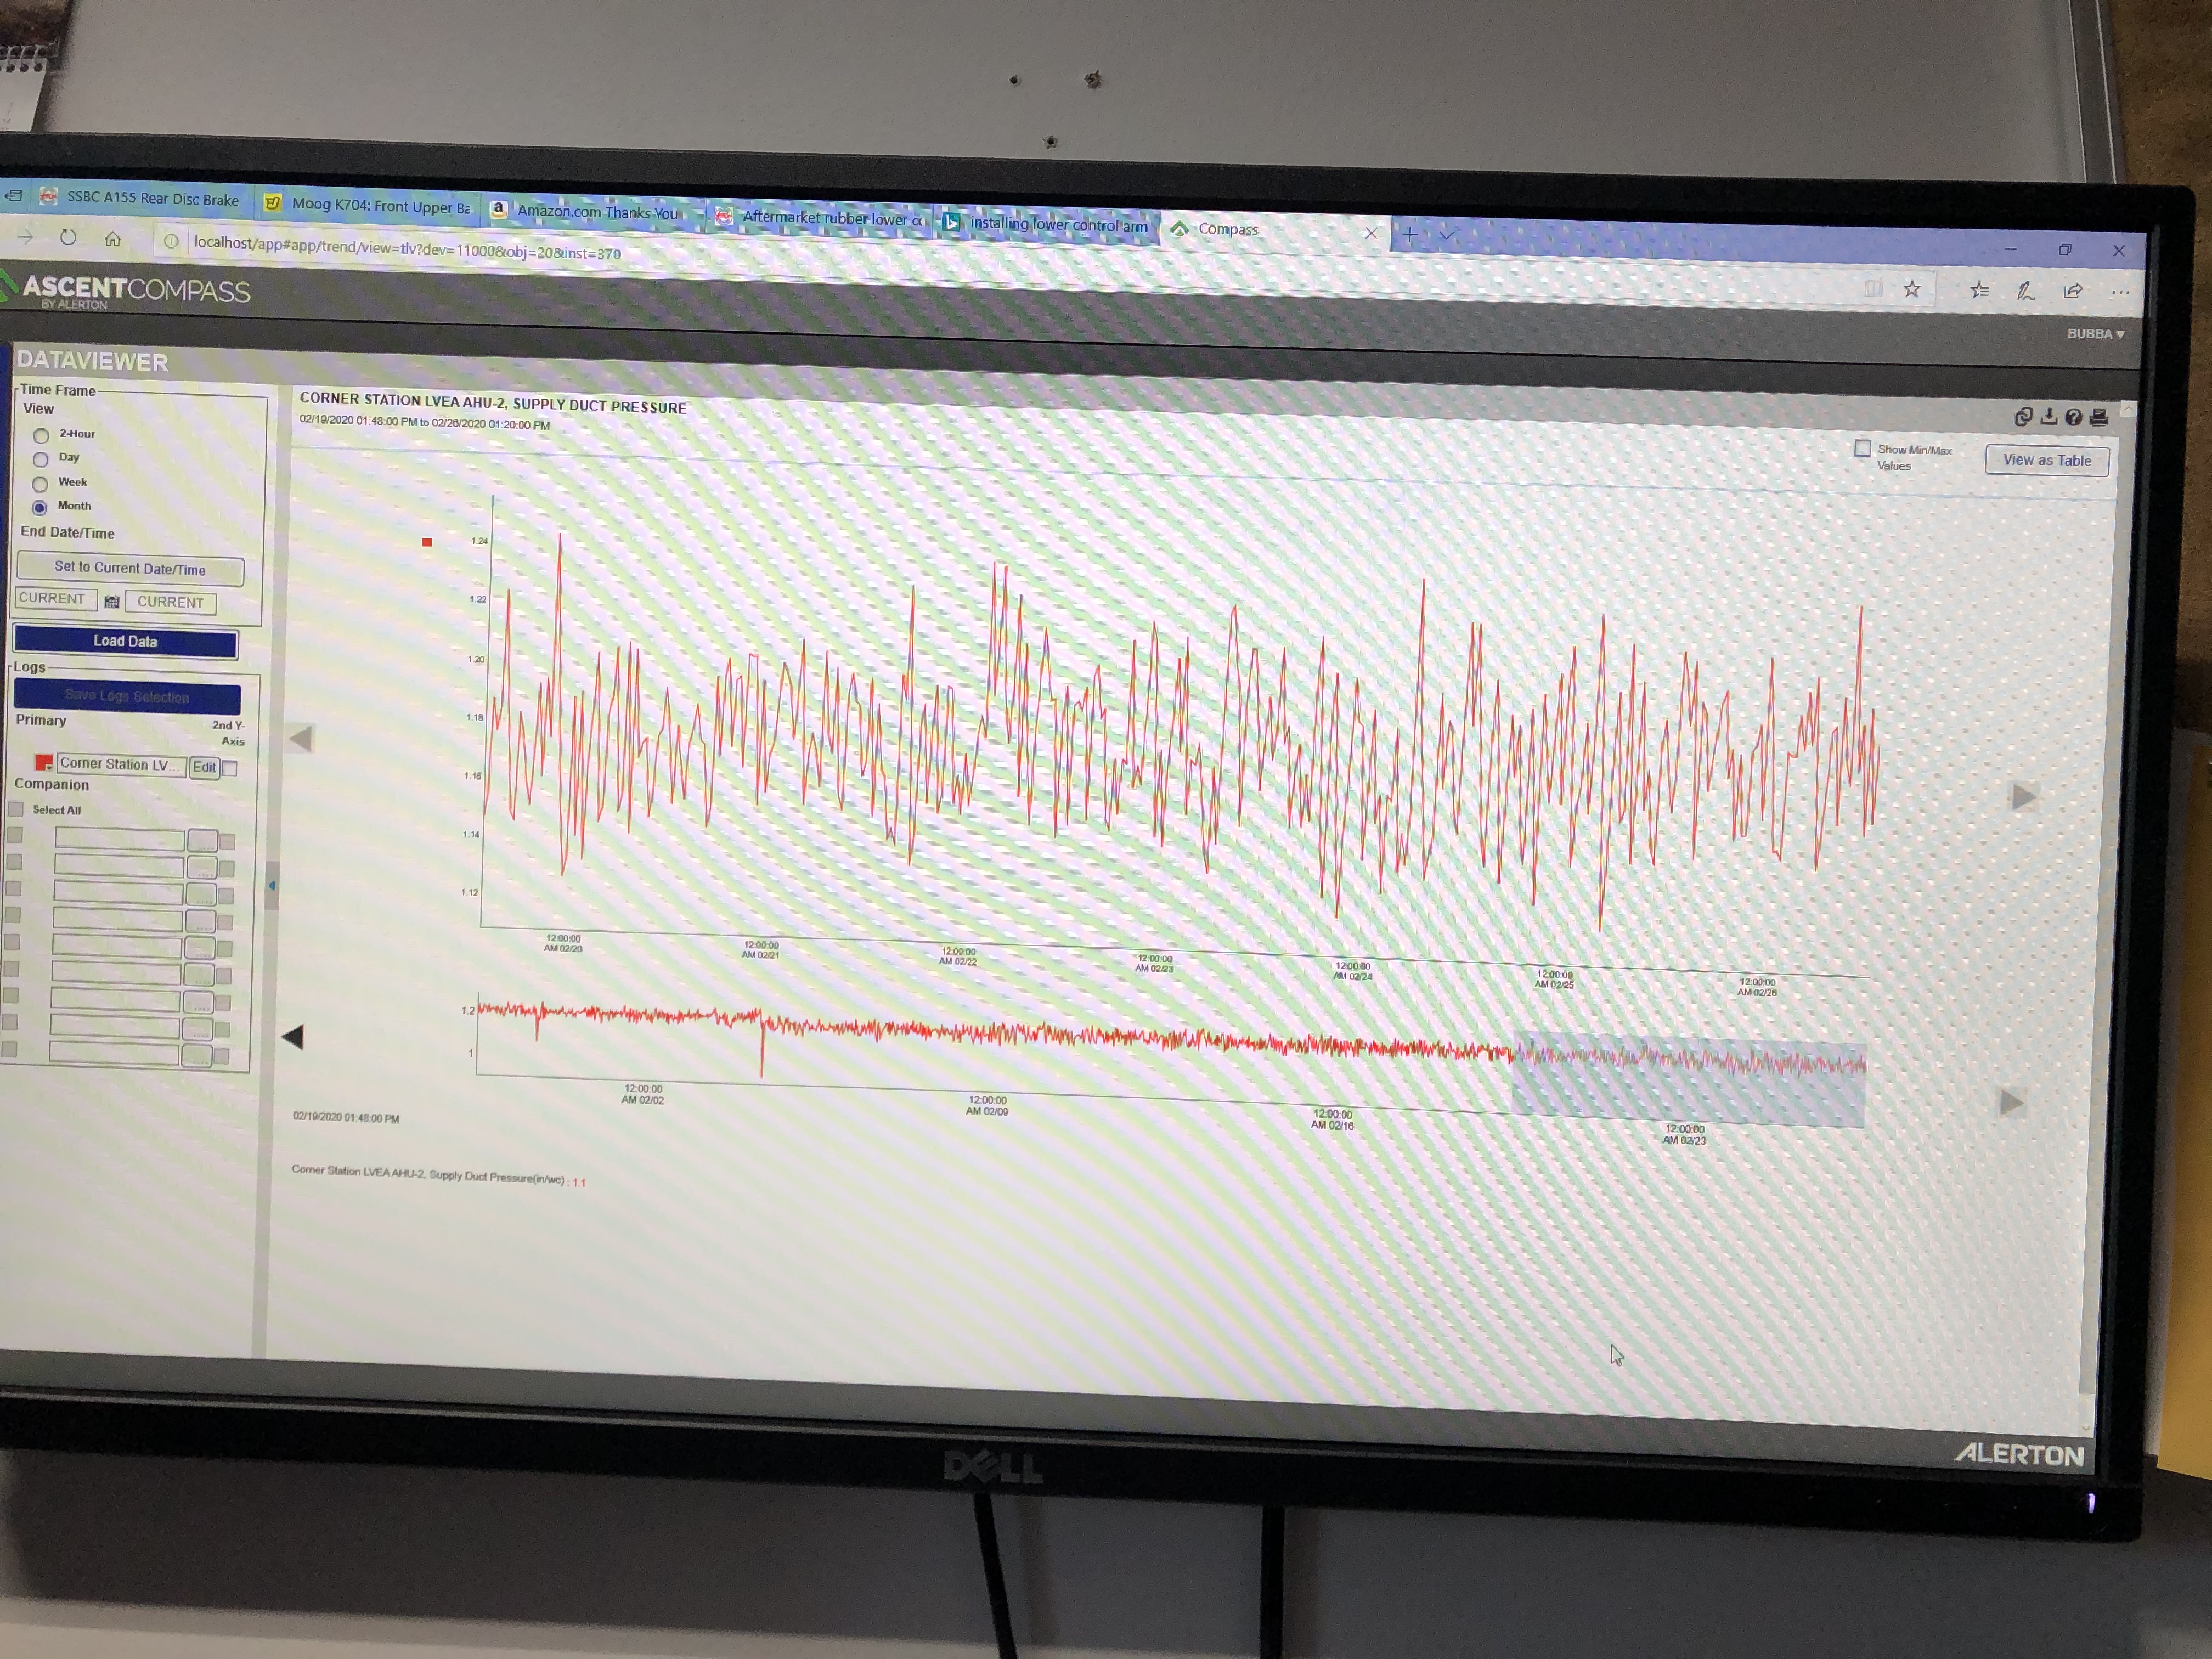
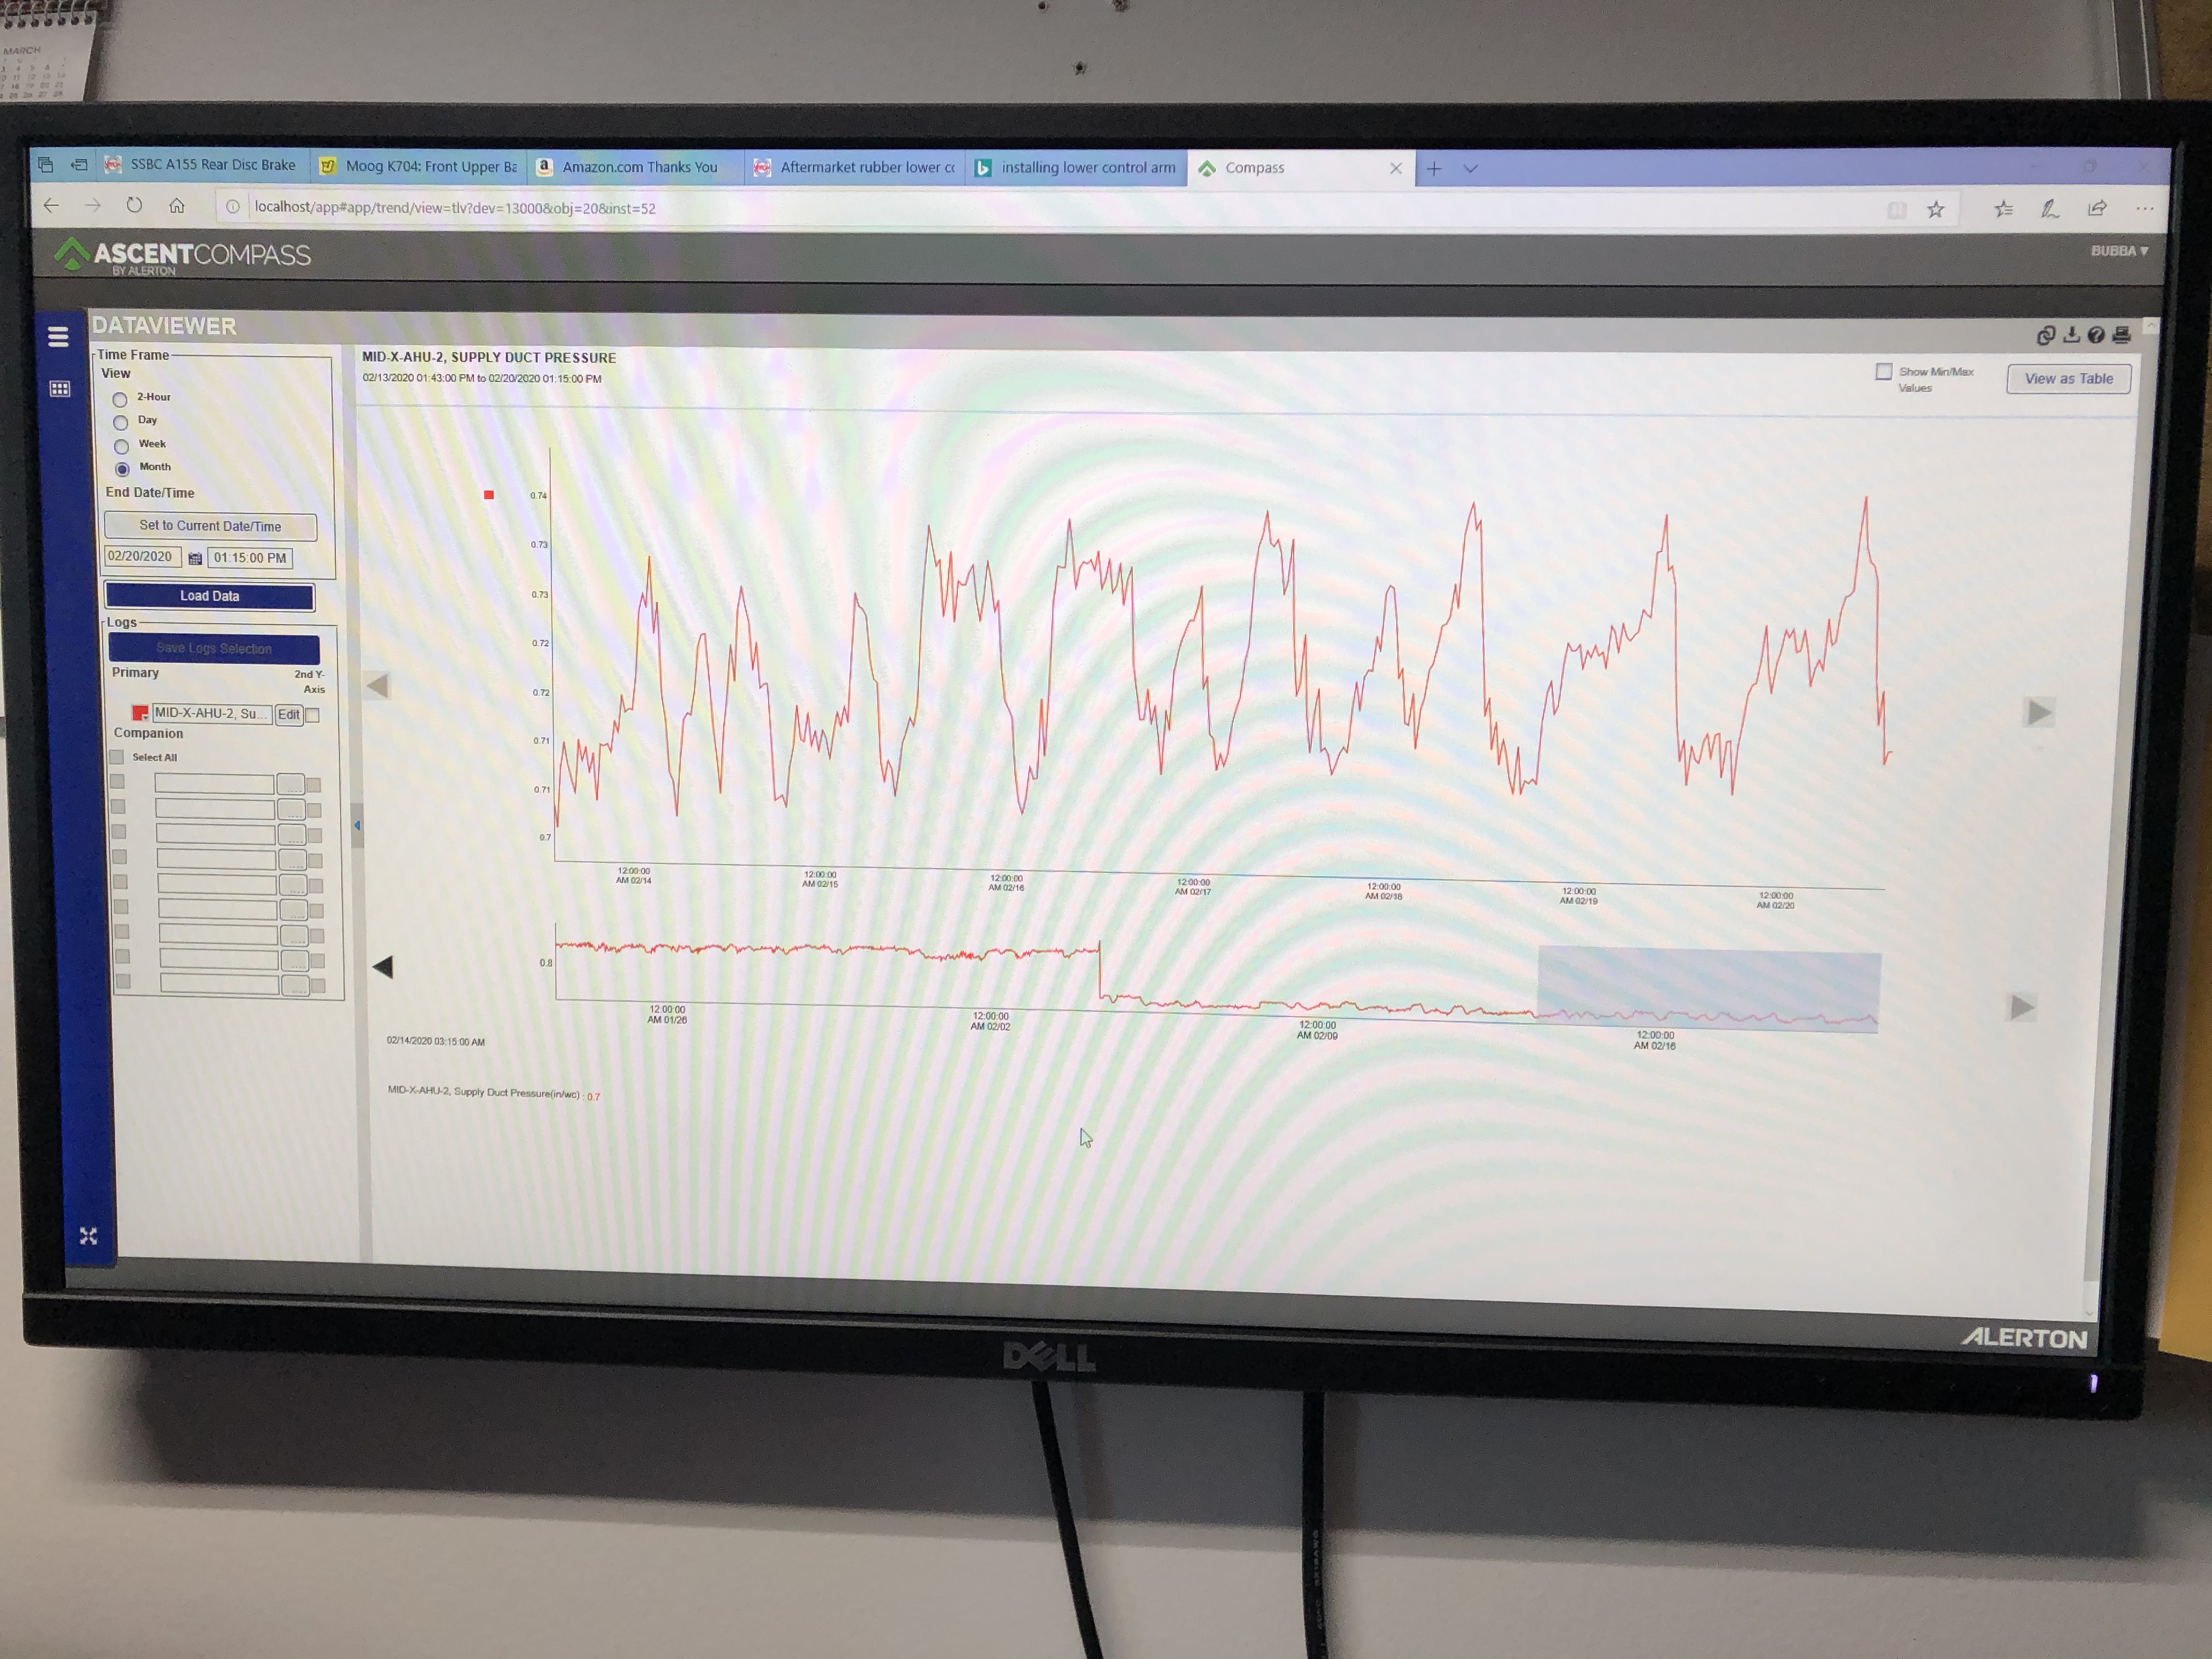
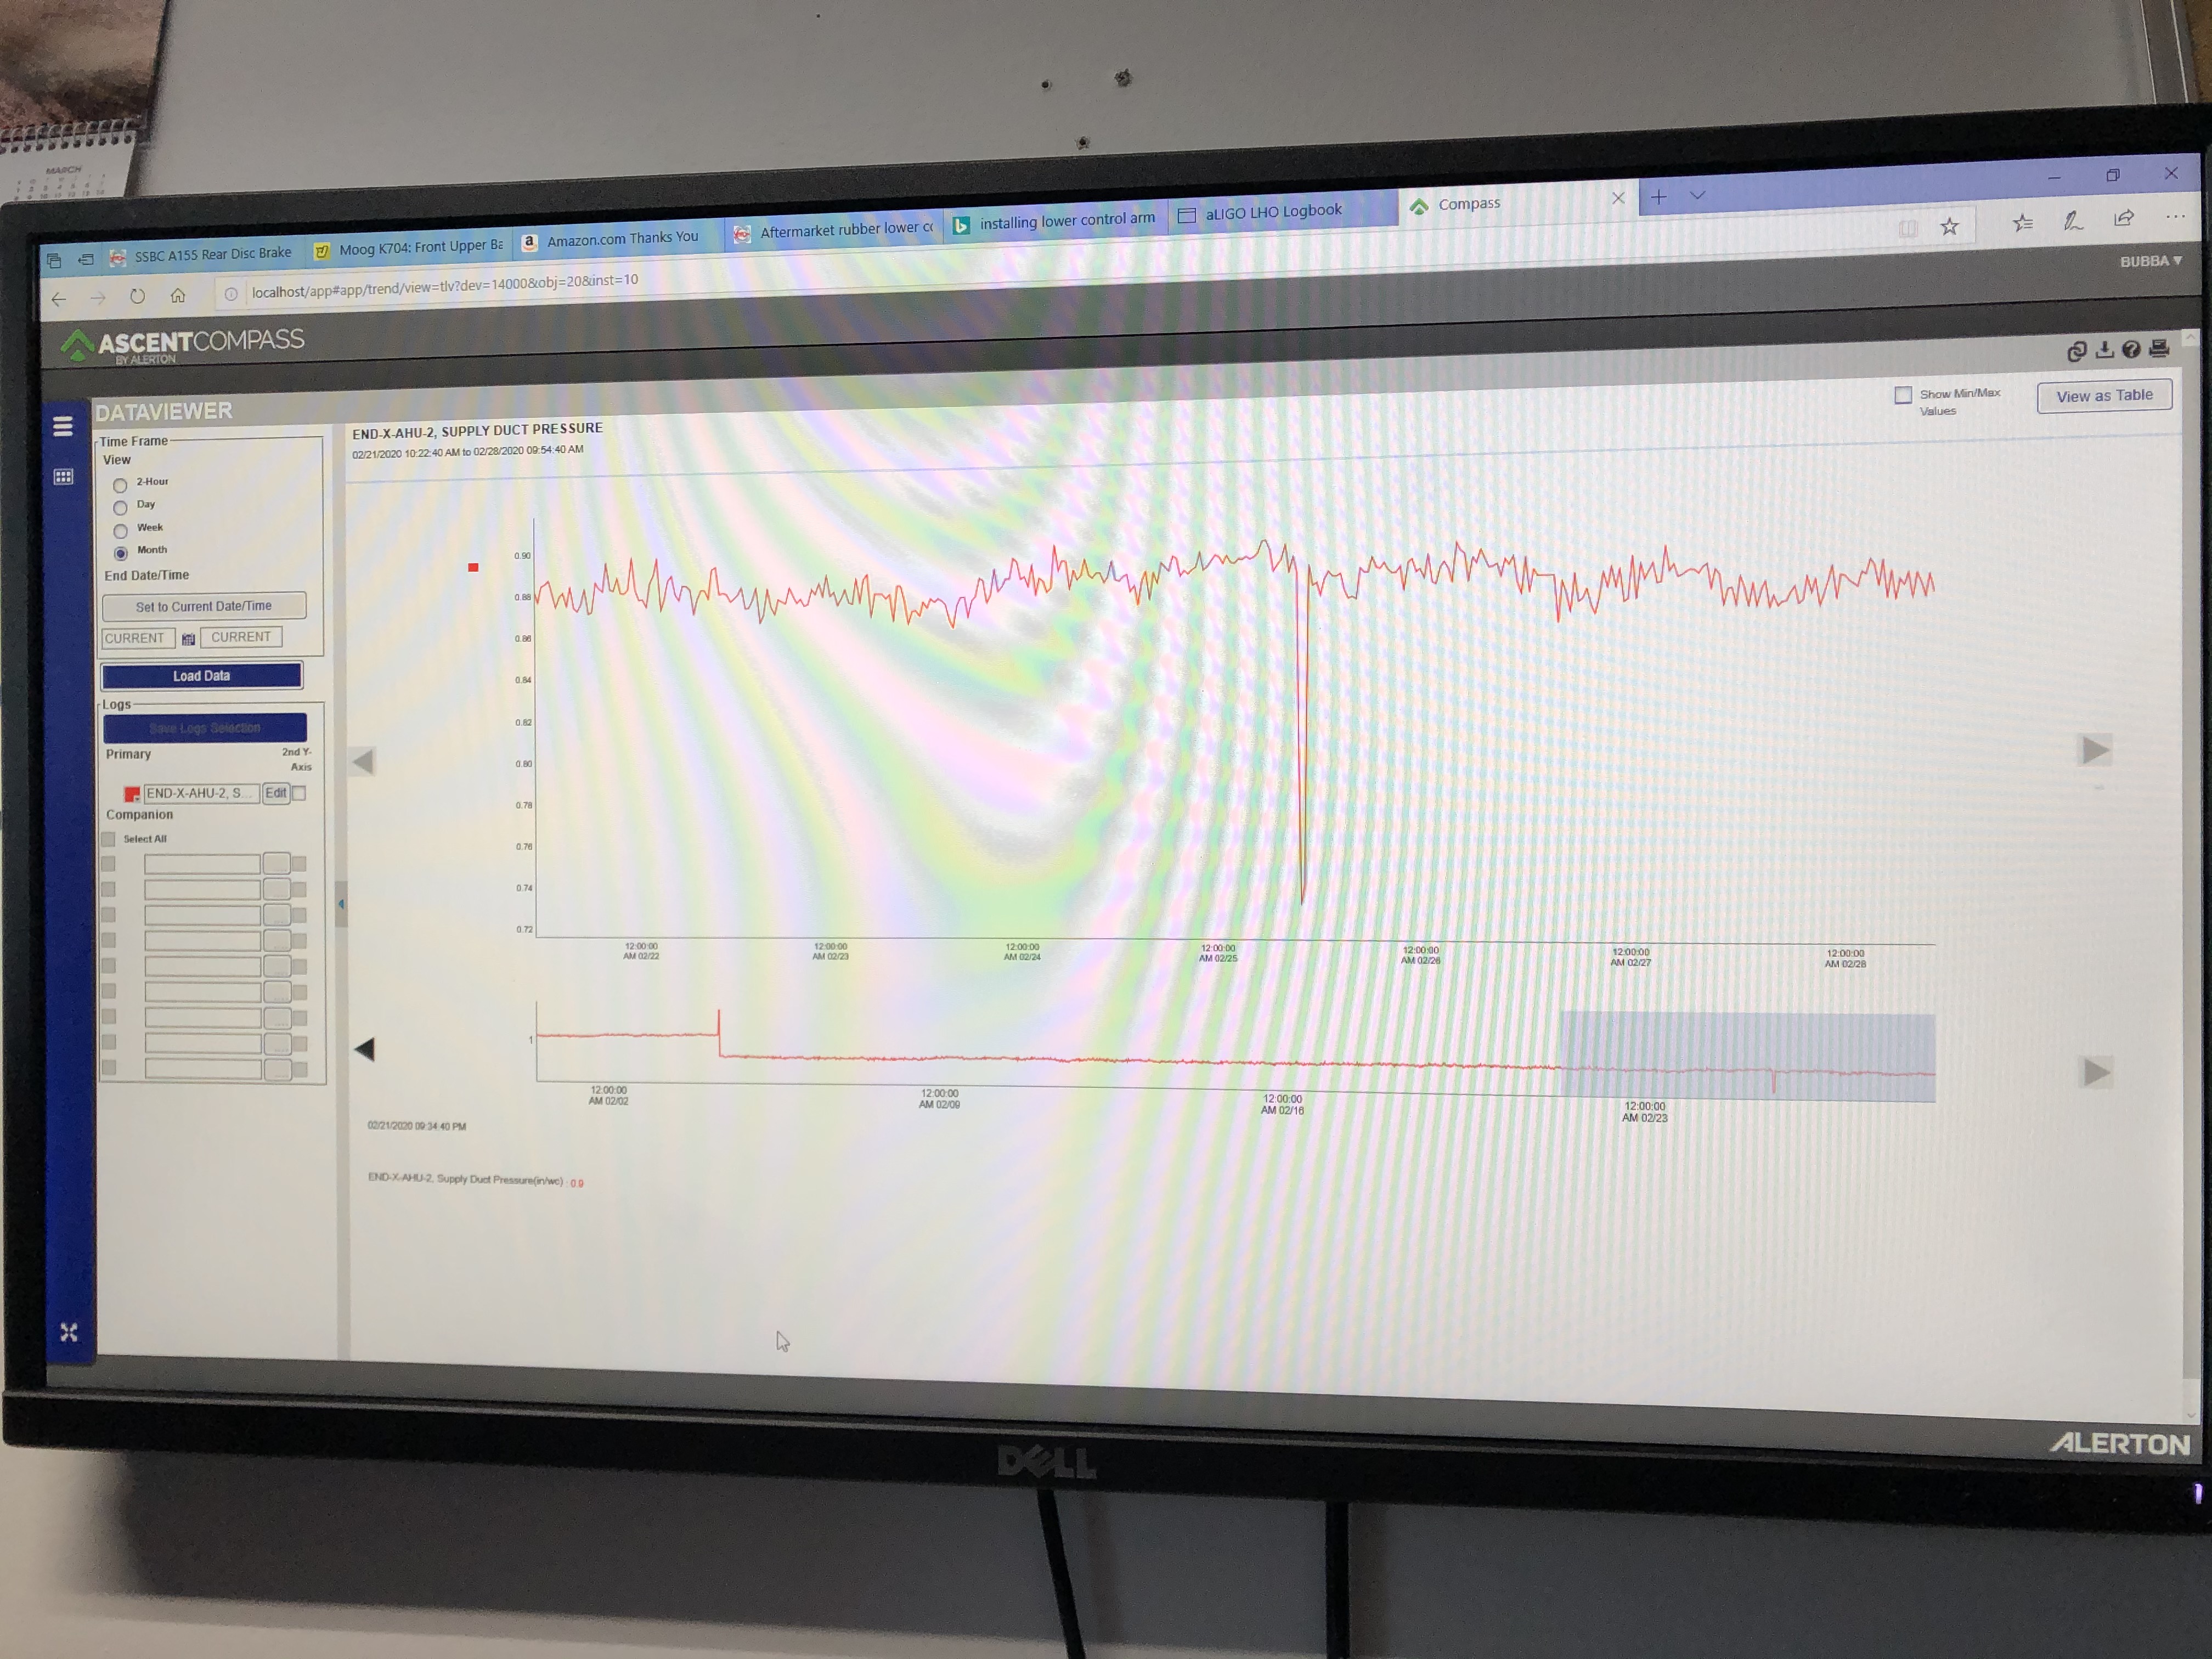
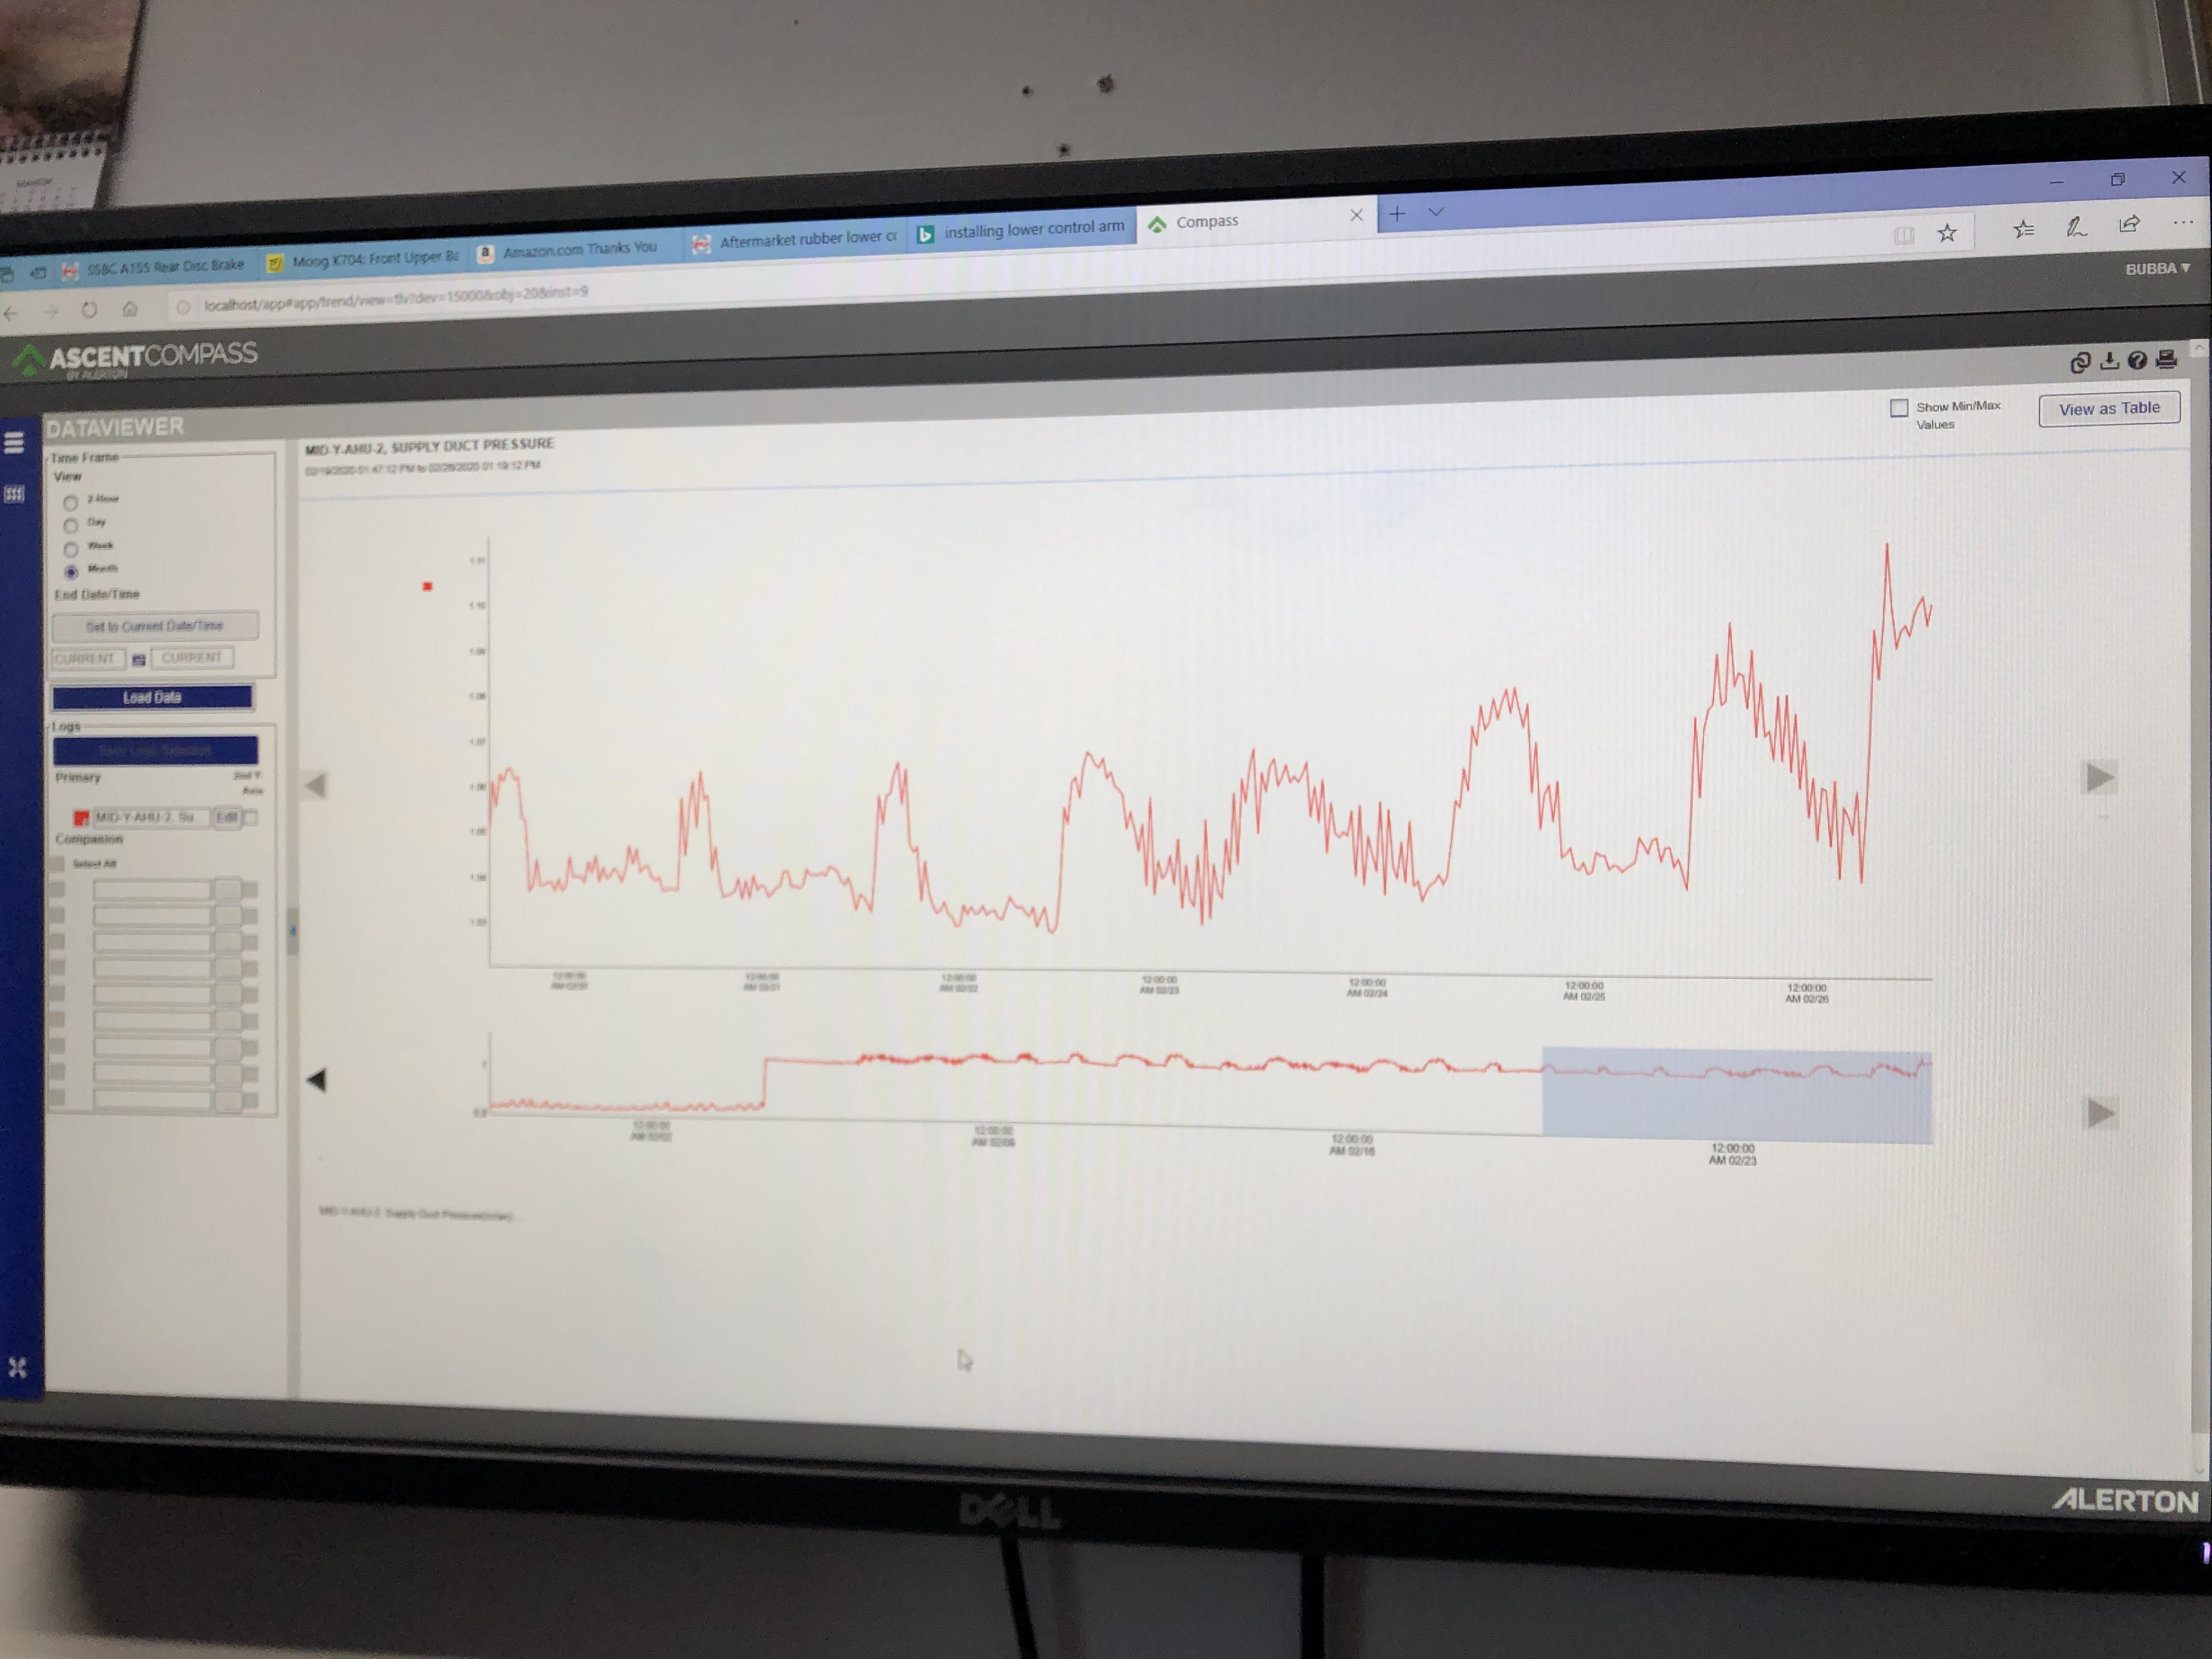
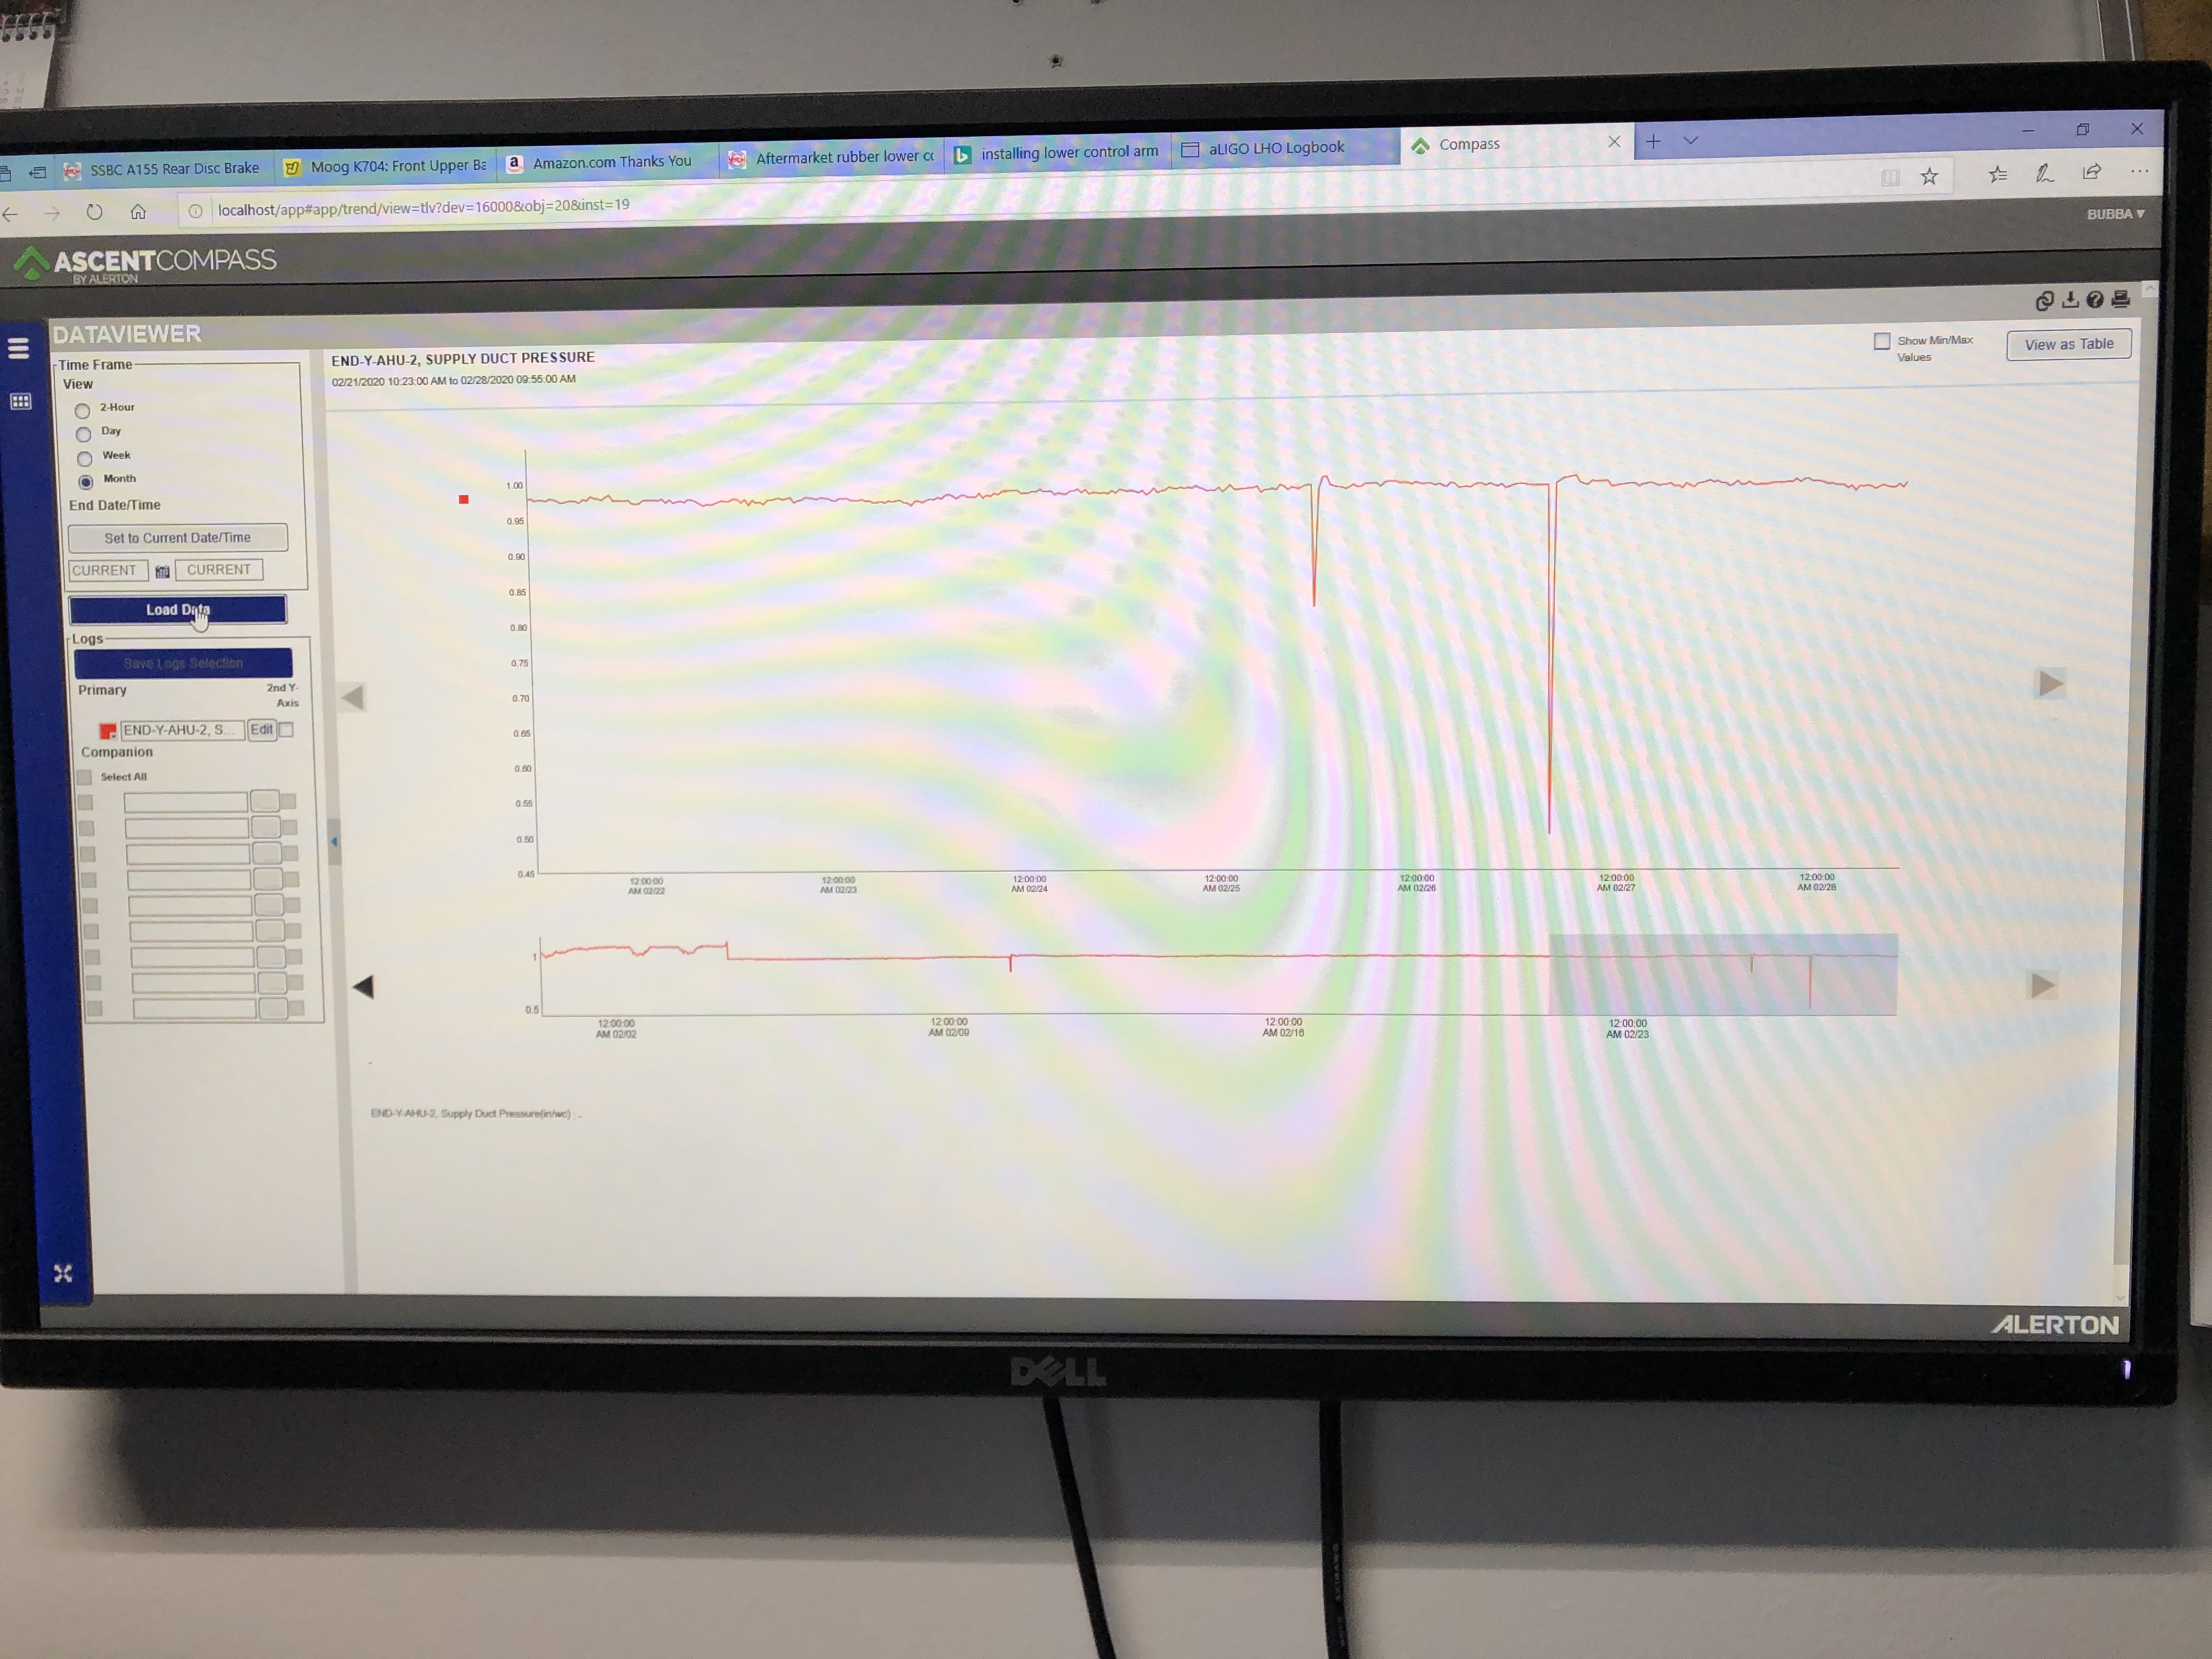
As a follow-up to the controlled burn, plots of HVAC filter dP for corner/mids/ends were displayed to look for any corresponding uptick in dP near the Feb 18 timeframe. None were found. Plots are attached; lower graphs show pressure vs. date for one-month intervals.