
patrick.thomas@LIGO.ORG - posted 12:01, Thursday 27 February 2020 (55334)
Ops Mid Day Shift Status
Have remained locked and in observing. No issues.
Have remained locked and in observing. No issues.

TITLE: 02/27 Day Shift: 16:00-00:00 UTC (08:00-16:00 PST), all times posted in UTC
STATE of H1: Observing at 117Mpc
OUTGOING OPERATOR: TJ
CURRENT ENVIRONMENT:
    SEI_CONF state: TEST_SWARM
    Wind: 3mph Gusts, 1mph 5min avg
    Primary useism: 0.03 μm/s
    Secondary useism: 0.32 μm/s
QUICK SUMMARY: No issues.
Out from 1122-1124UTC.
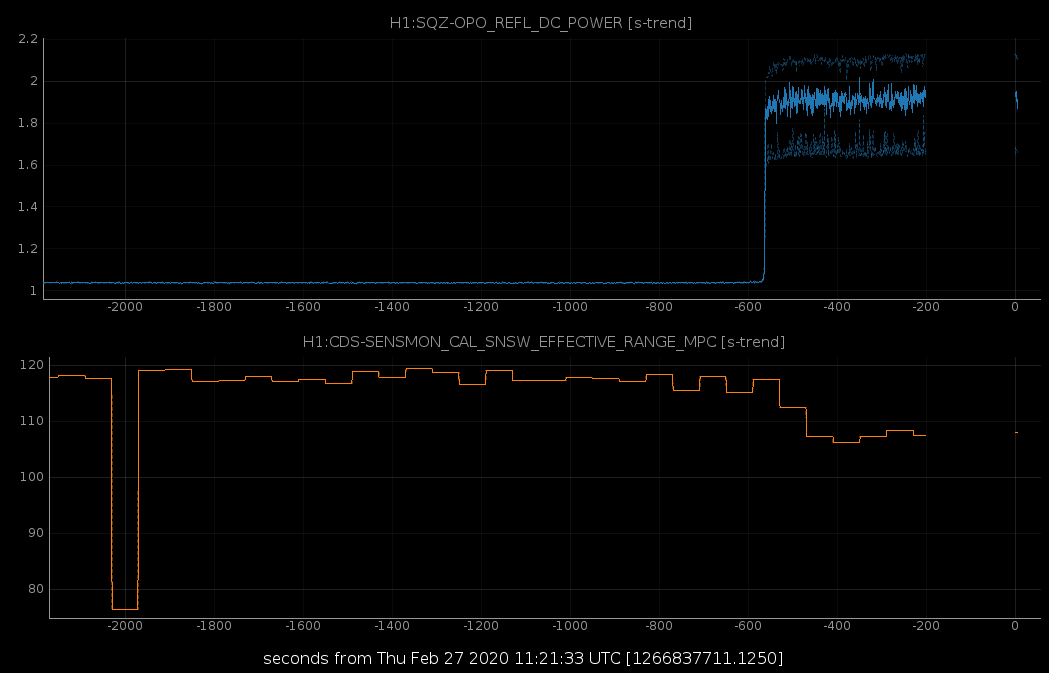
H1:SQZ-OPO_REFL_DC_POWER abruptly jumped up to about 1.9, rather than the usual slow increase from its normal value. The range still showed a slow decay, so I recycled the SQZ_MANAGER and the REFL power is now back to around 1.02 and the range looks better.
TITLE: 02/26 Eve Shift: 00:00-08:00 UTC (16:00-00:00 PST), all times posted in UTC
STATE of H1: Observing at 118Mpc
INCOMING OPERATOR: TJ
SHIFT SUMMARY:
H1 plods along with a lock which is 33+hrs & steady range of 119Mpc.
Temperature variations at the end stations have stabilized.
LOG:
Smooth sailing with H1 locked almost 29.5hrs. The End Station temperatures are stabilizing (thanks, Bubba!).
Violin Damping guardian node as a User Message for a gain not at Guardian value for ITMy MODE 12 (Cheryl took the gain to 0.5).
So far we have:
Attached plot shows last 7-days. Today there were some FMCS issues which came up (noted in Patrick's alog).
I left a voicemail on Bubba's cell phone.
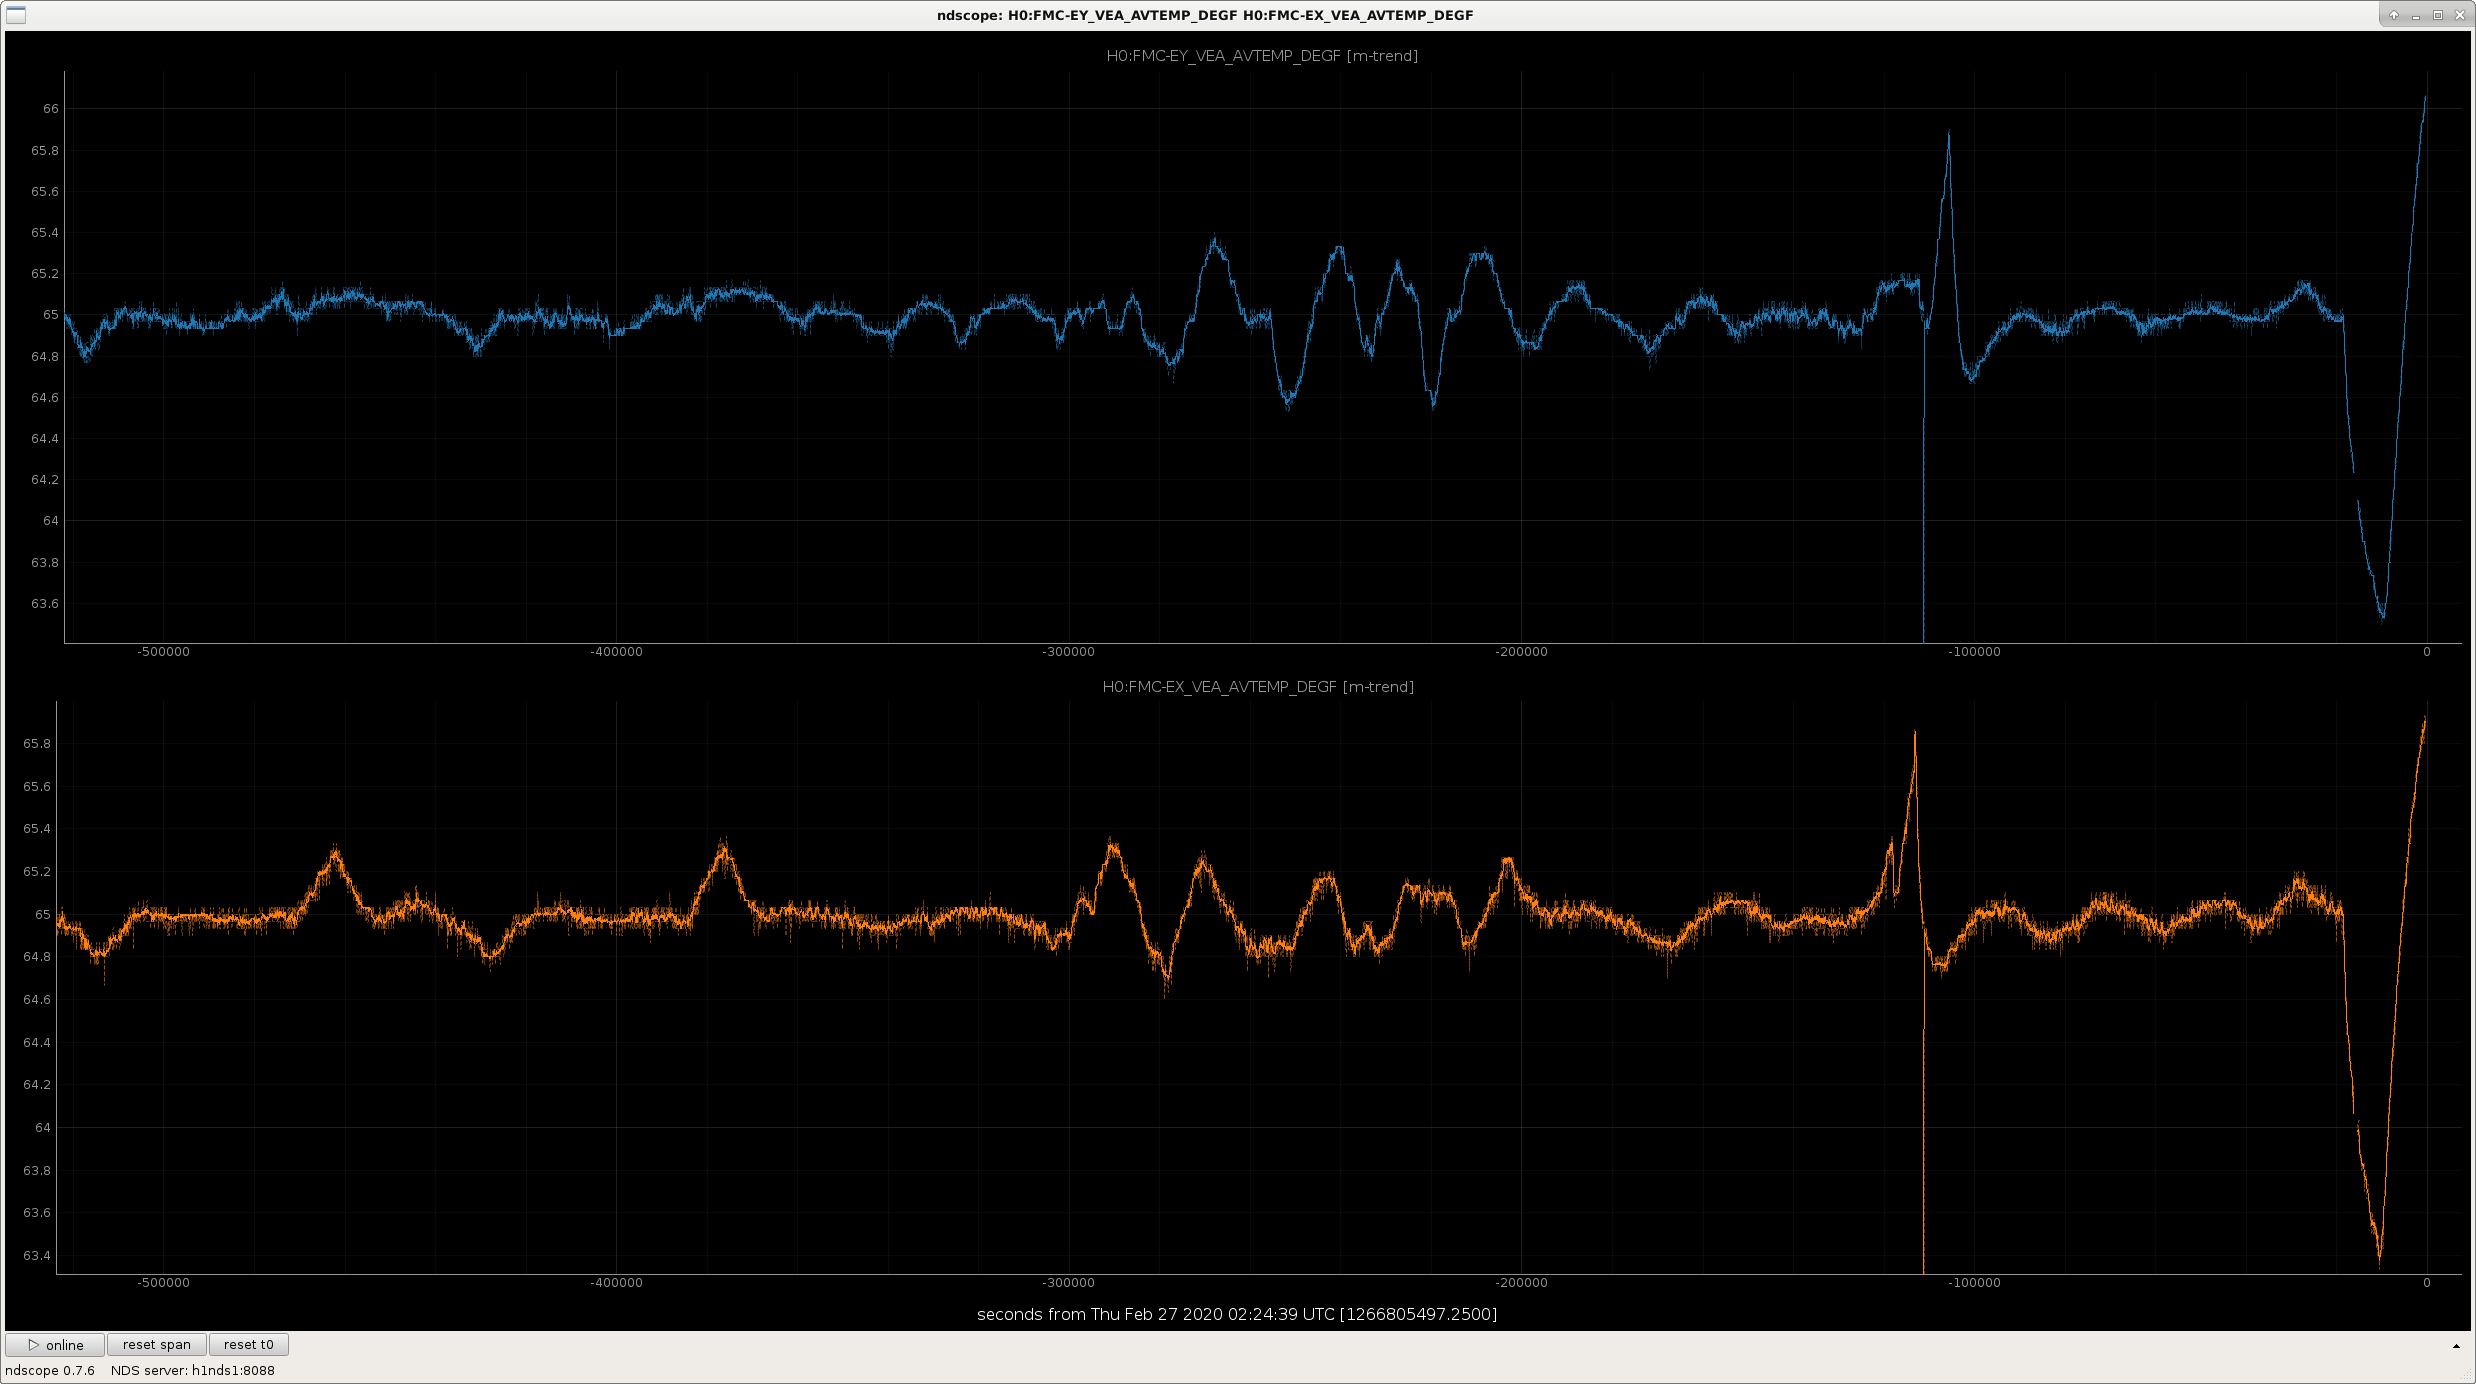
The air handler controller modules at both end stations required rebooting this afternoon which in turn briefly disabled the air handlers. This likely caused the temperature of the VEAs to vary considerably along with the outside temperature dropping from unseasonably warm daytime temperatures.
I have been monitoring the FMCS and the temperature in the VEAs appears to be stabilizing. I will continue to monitor.
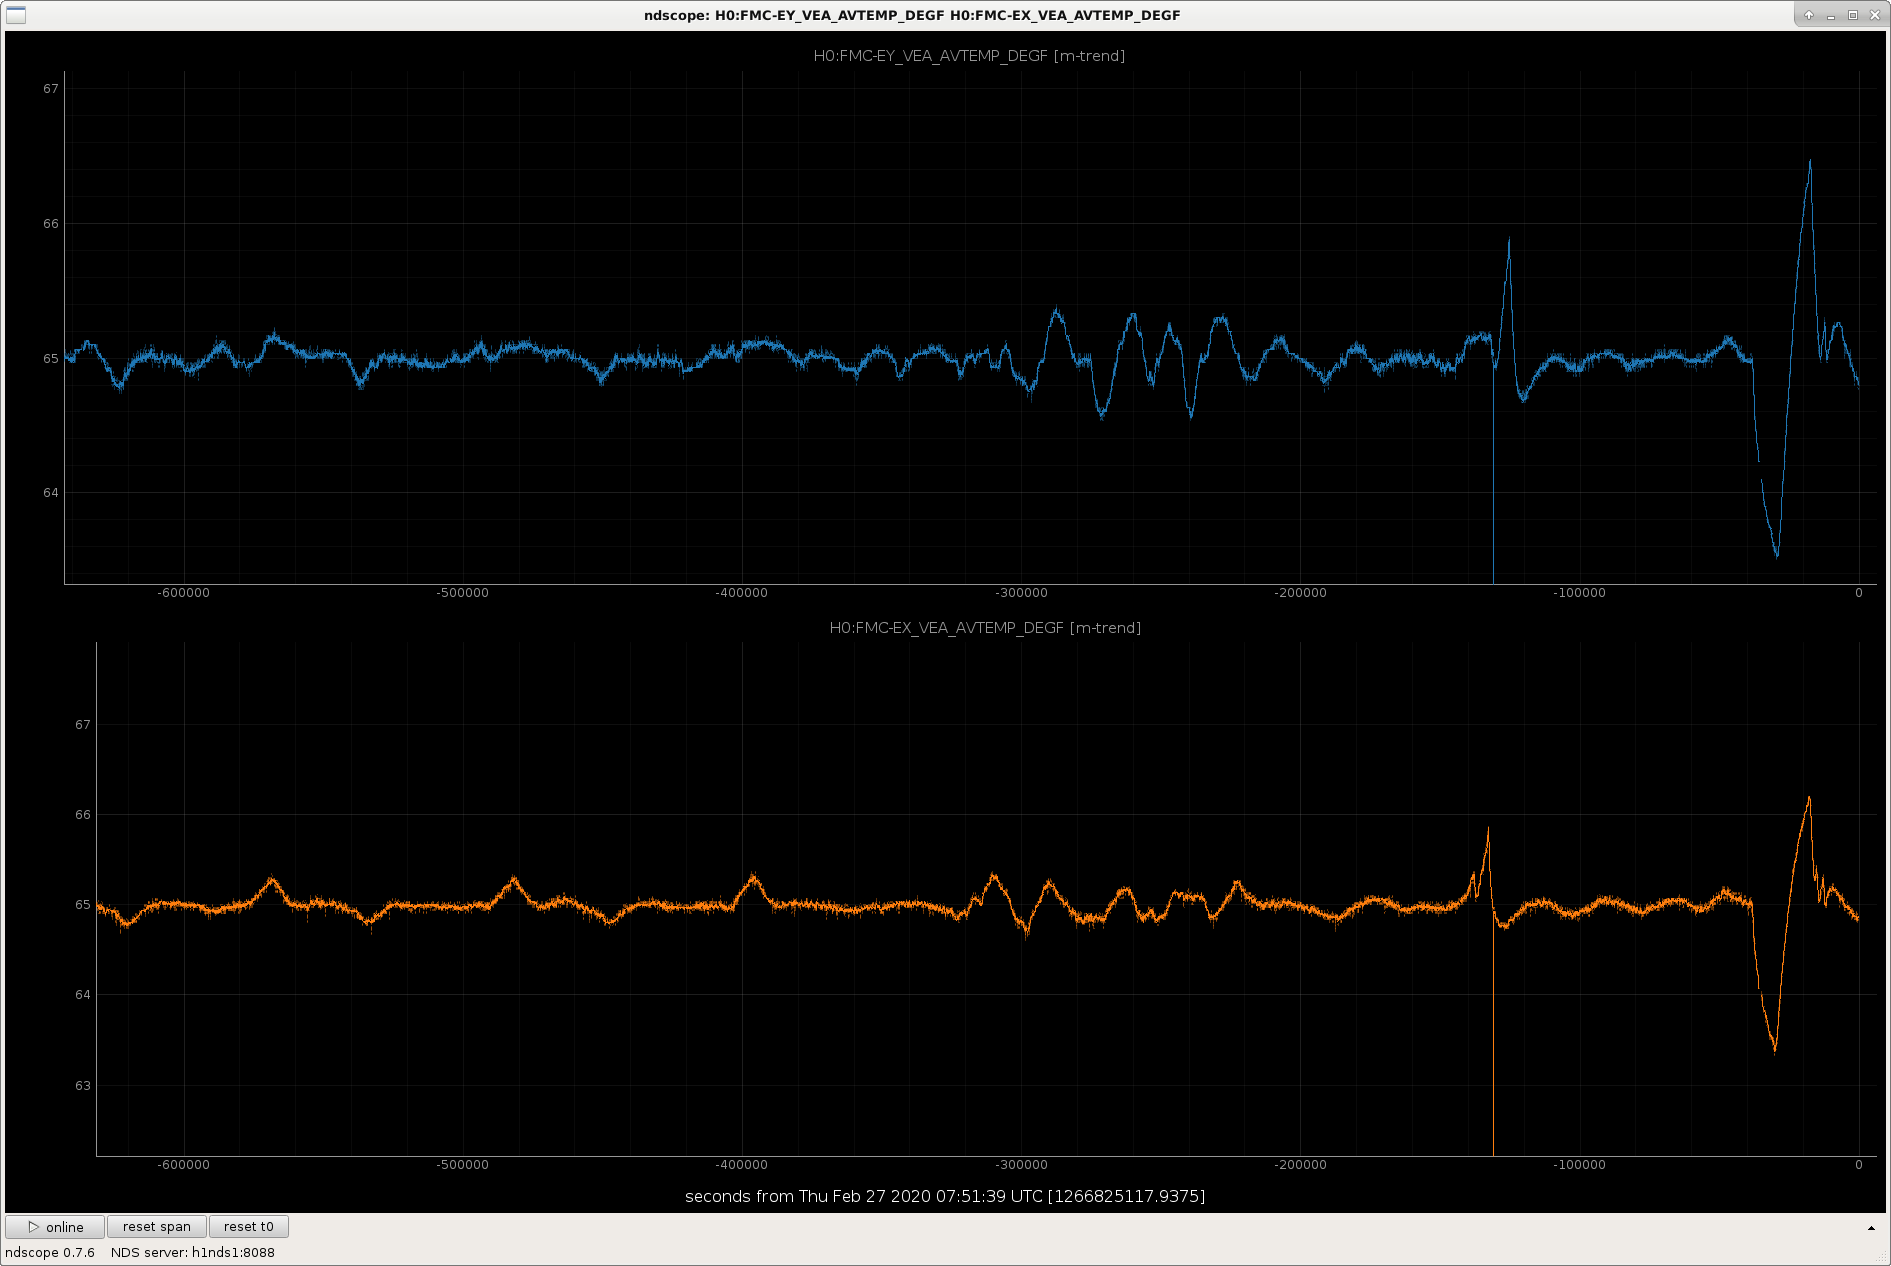
Temperatures have stabilized at the end stations (see attached).
Nice catch, team!!
Tagging OpsInfo & FMP for the thank you.
Tagging @DetChar in case it turns out to be important later.
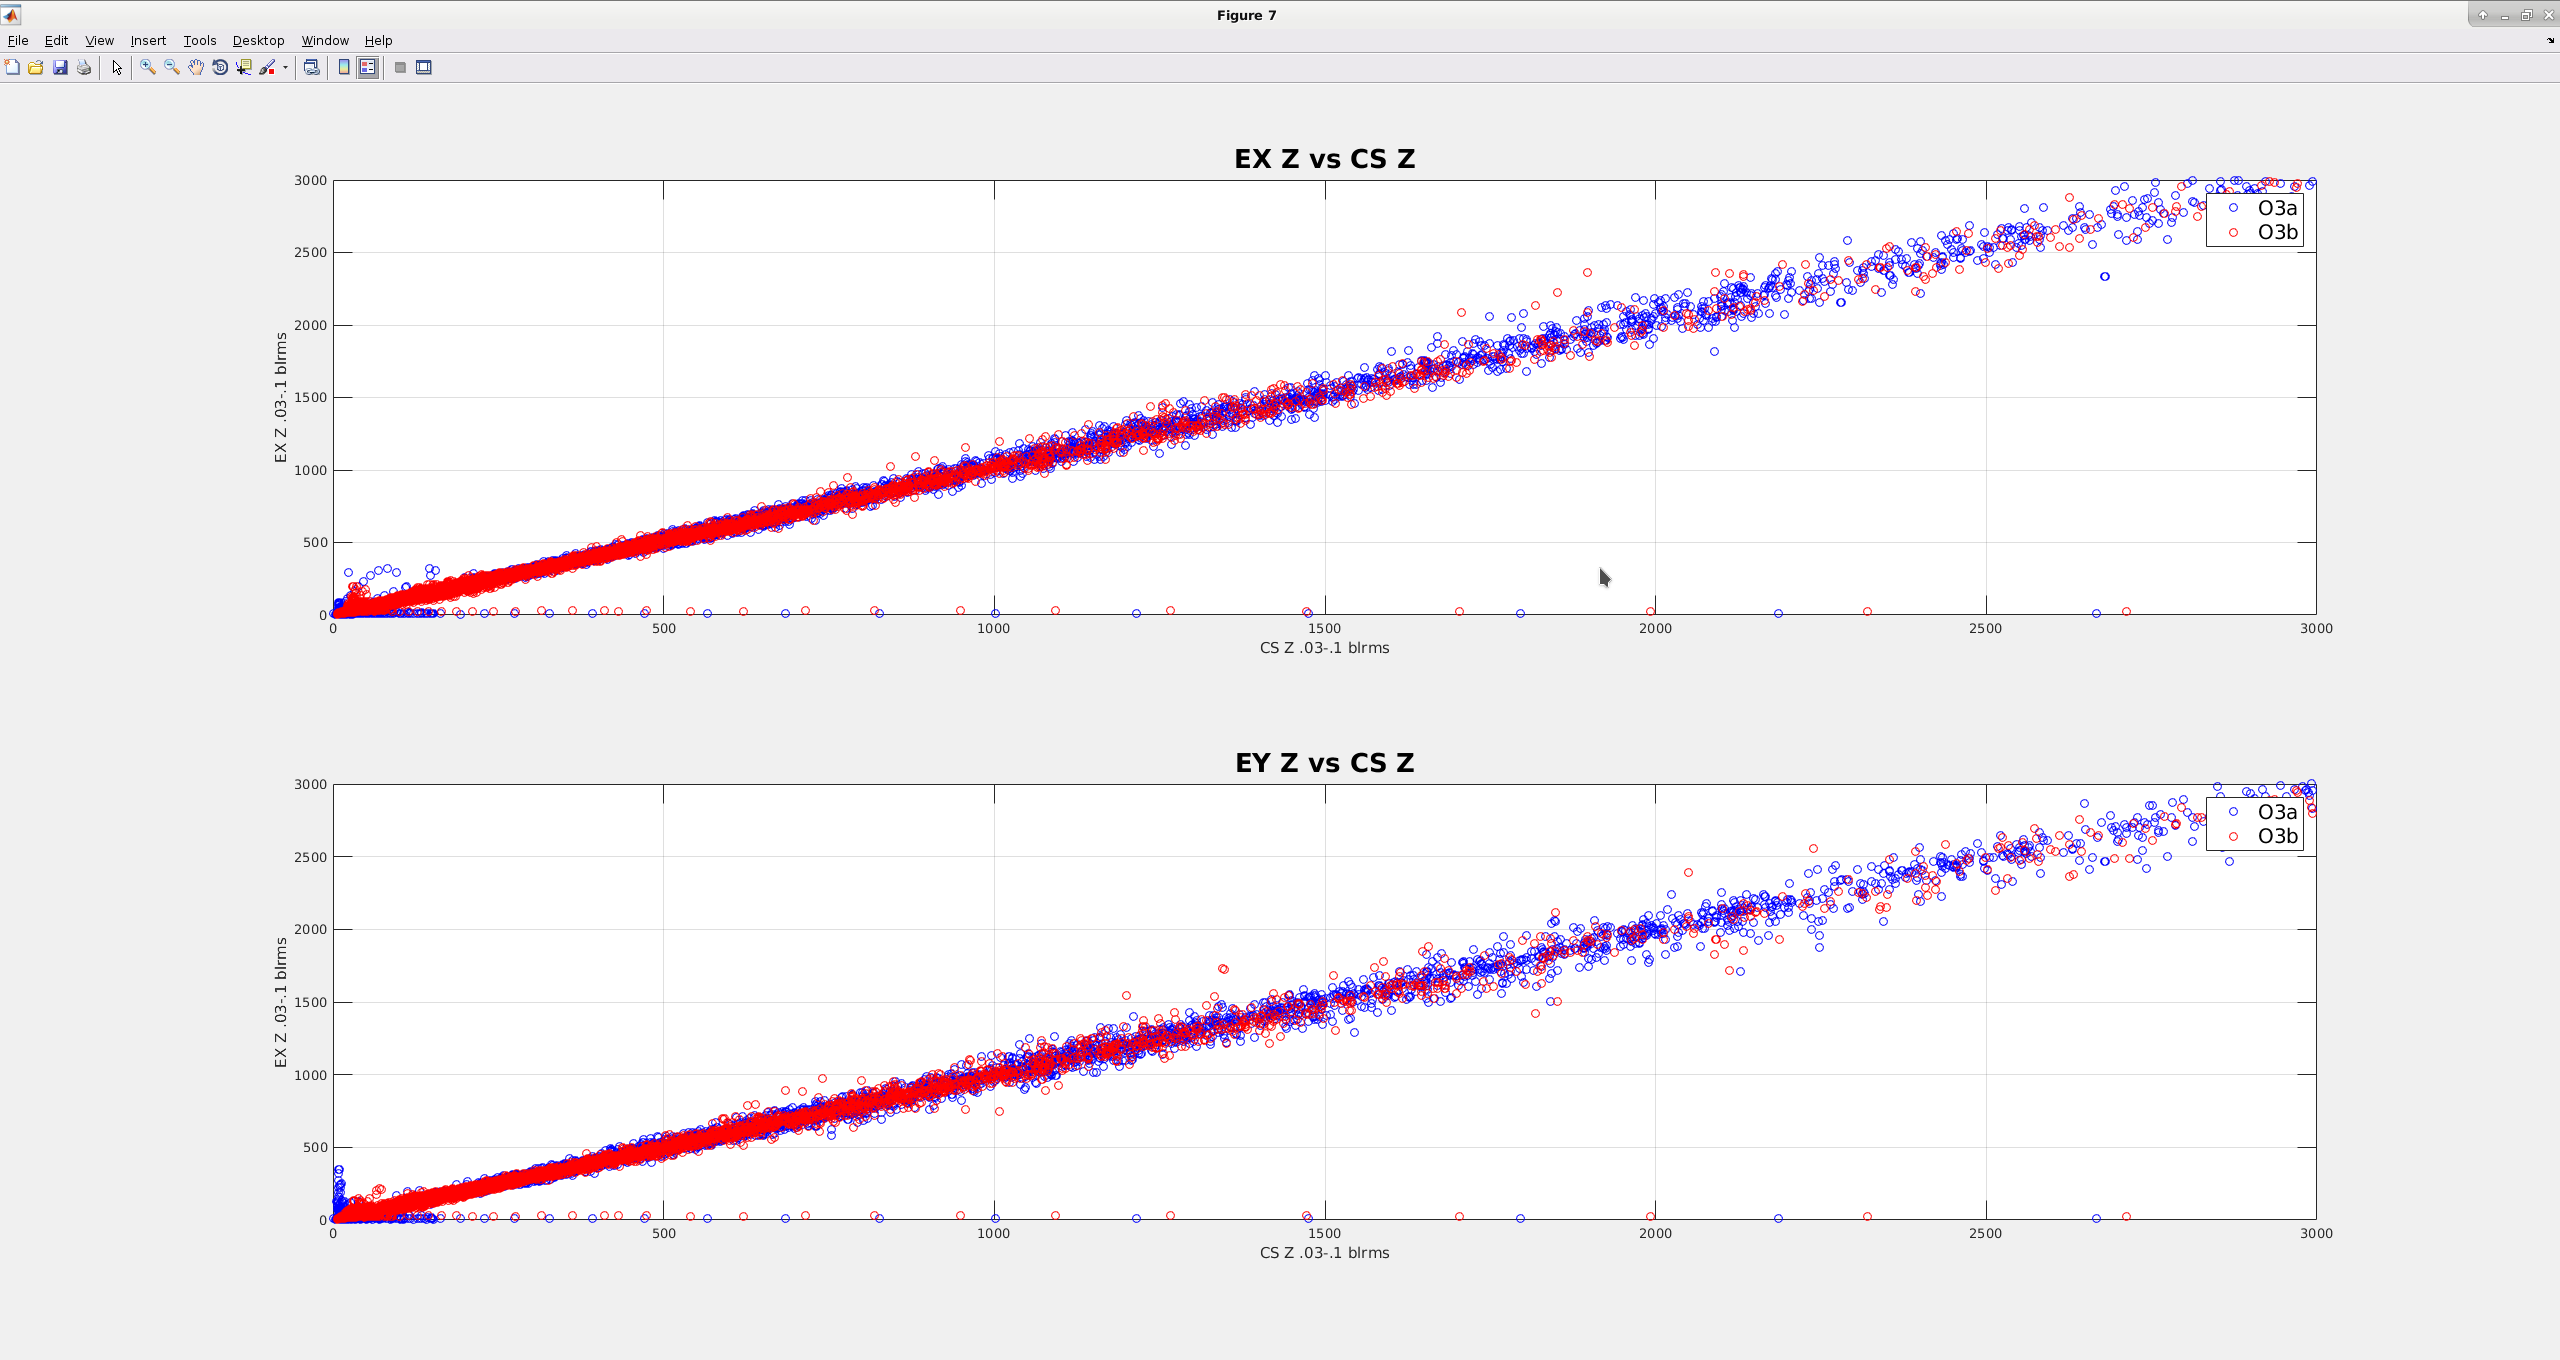
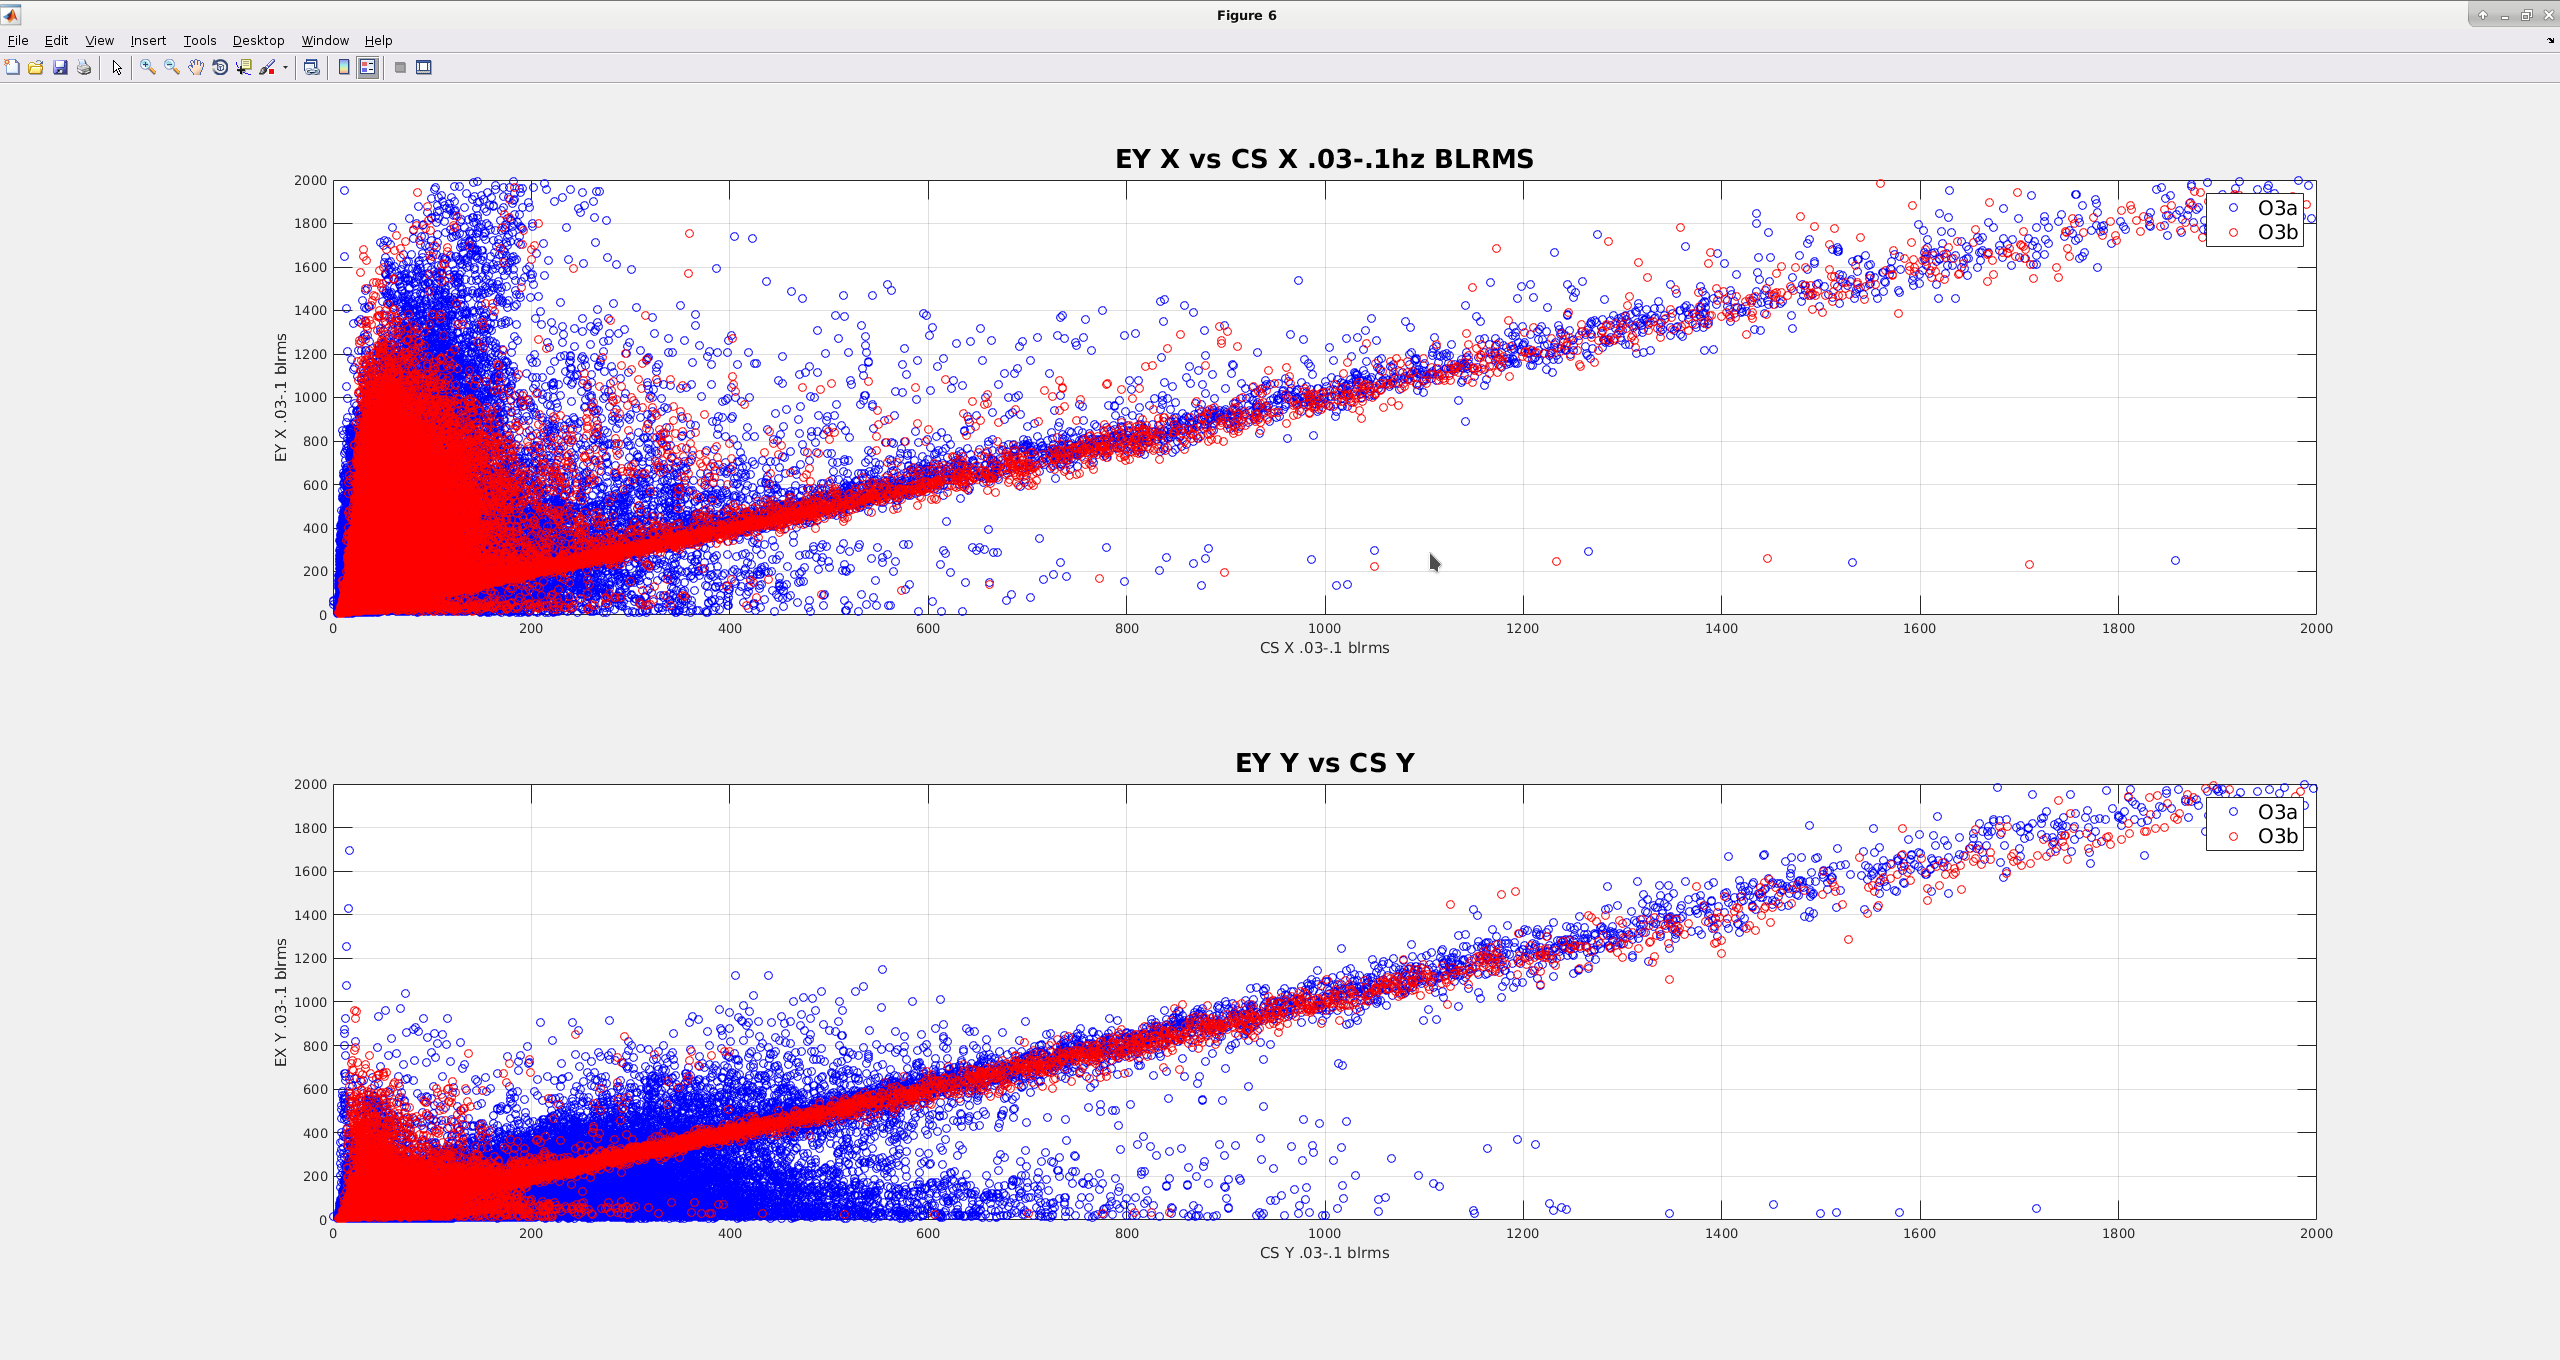
I've been staring at some data to see if the wind fences have had a measureable effect on building tilts at the end stations. I'm still working on this, but I have a couple interesting plots, that I think show that the low frequency motion is more correlated now after the wind fence went up, than before. Attached plots are kind of like scatter plots for the .03-.1hz blrms motion for the ITMY and ETMY seismometers, i.e. each point represents the corner station blrms motion on the X axis and the end station motion on Y axis. If each station were moving the exact same at the moment, all of the points would lie on a one-to-one line.
First plot compares the ITMY Z, ETMX Z and ETMY Z ground STS .03-.1hz blrms. The blue points are for O3a, before the fences went up, red is O3b, after the fence went up. Most of the data falls on a line of slope 1,suggesting the motion is related for this dof. Not suprising, because most of the motion in this direction at these frequencies has wavelengths many times the size of the site, so ends and corner are mostly moving together. Wind is more local, but doesn't show up in Z as strongly.
Second plot compares the X&Y for ITMY and ETMY ground STS. Again, blue points are O3a, red is O3b. Since the fence went up, the X&Y blrms now lie more on the 1 to 1 slope than they did before October. I would expect that if wind were still the strongest effect on the low frequency motion, the red lines would have stayed more "blobbish" in the lower right of the plot, for lower velocities. This is especially noticeable in the Y dof, which makes sense, given the orientation of the fence at EY. The fence will do a good job blocking winds coming from IFO +Y, and not at all for winds coming along X. Keep in mind the winds in the past 2 months have been much worse than during the entire O3a part of the run. It would instructive to run this on a similarly windy time prior to O3.
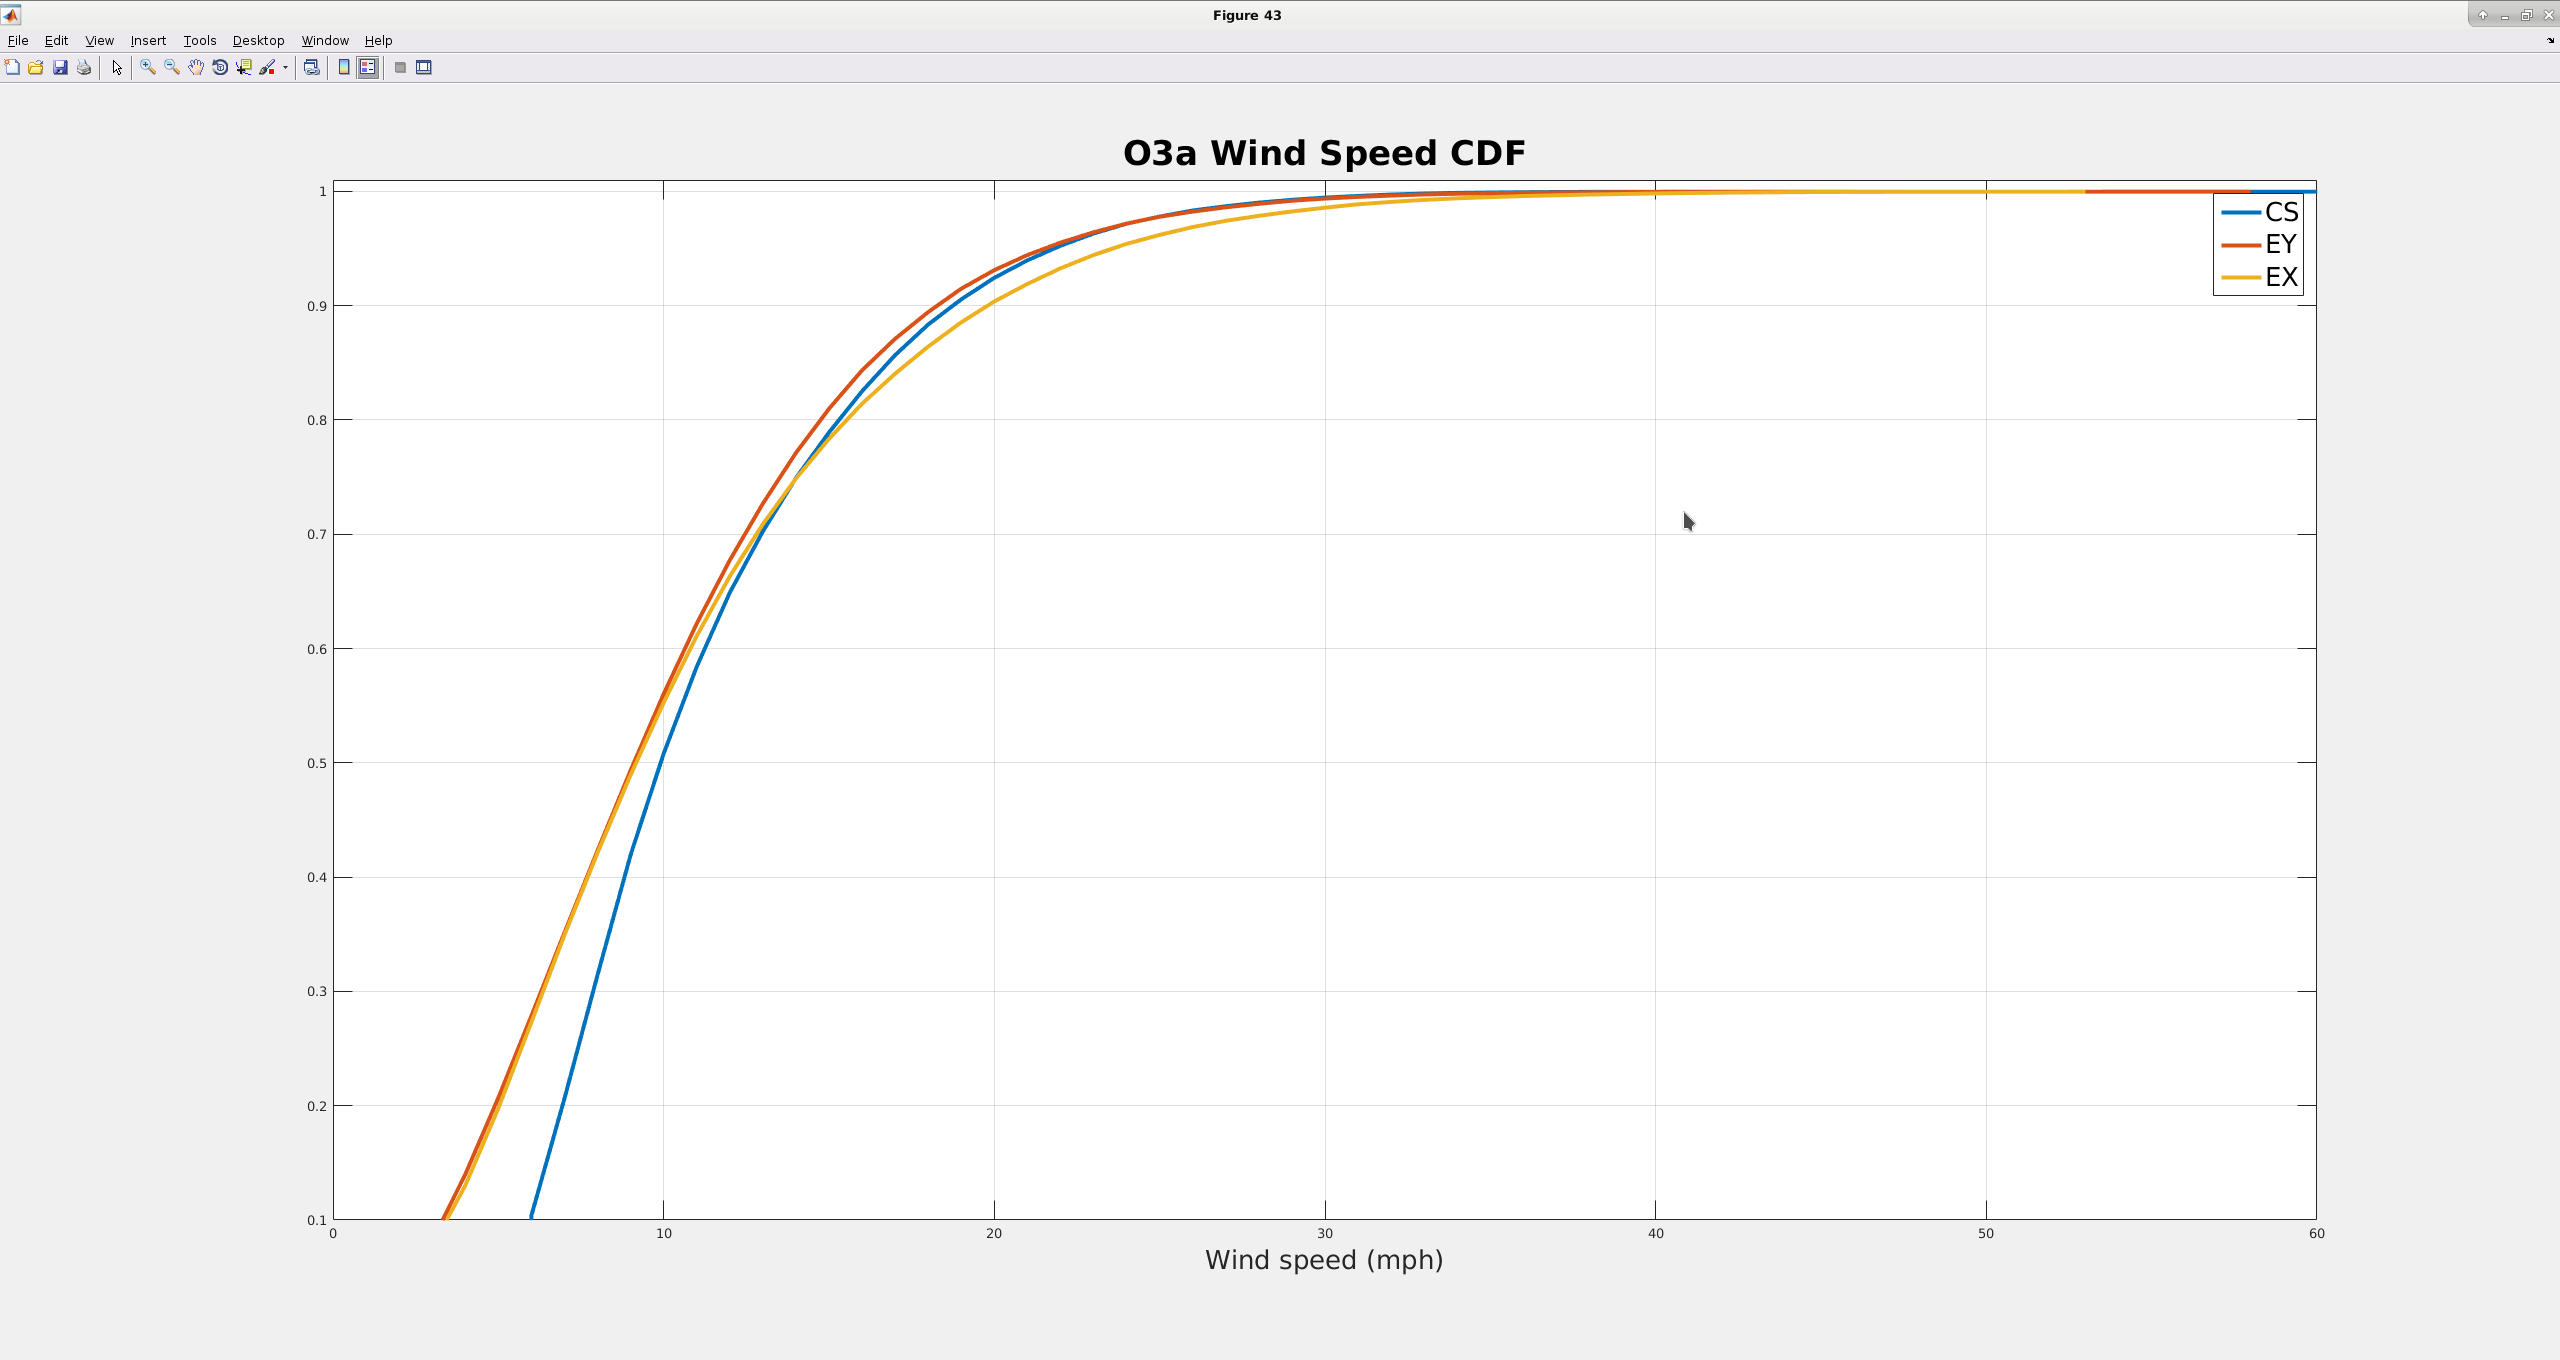
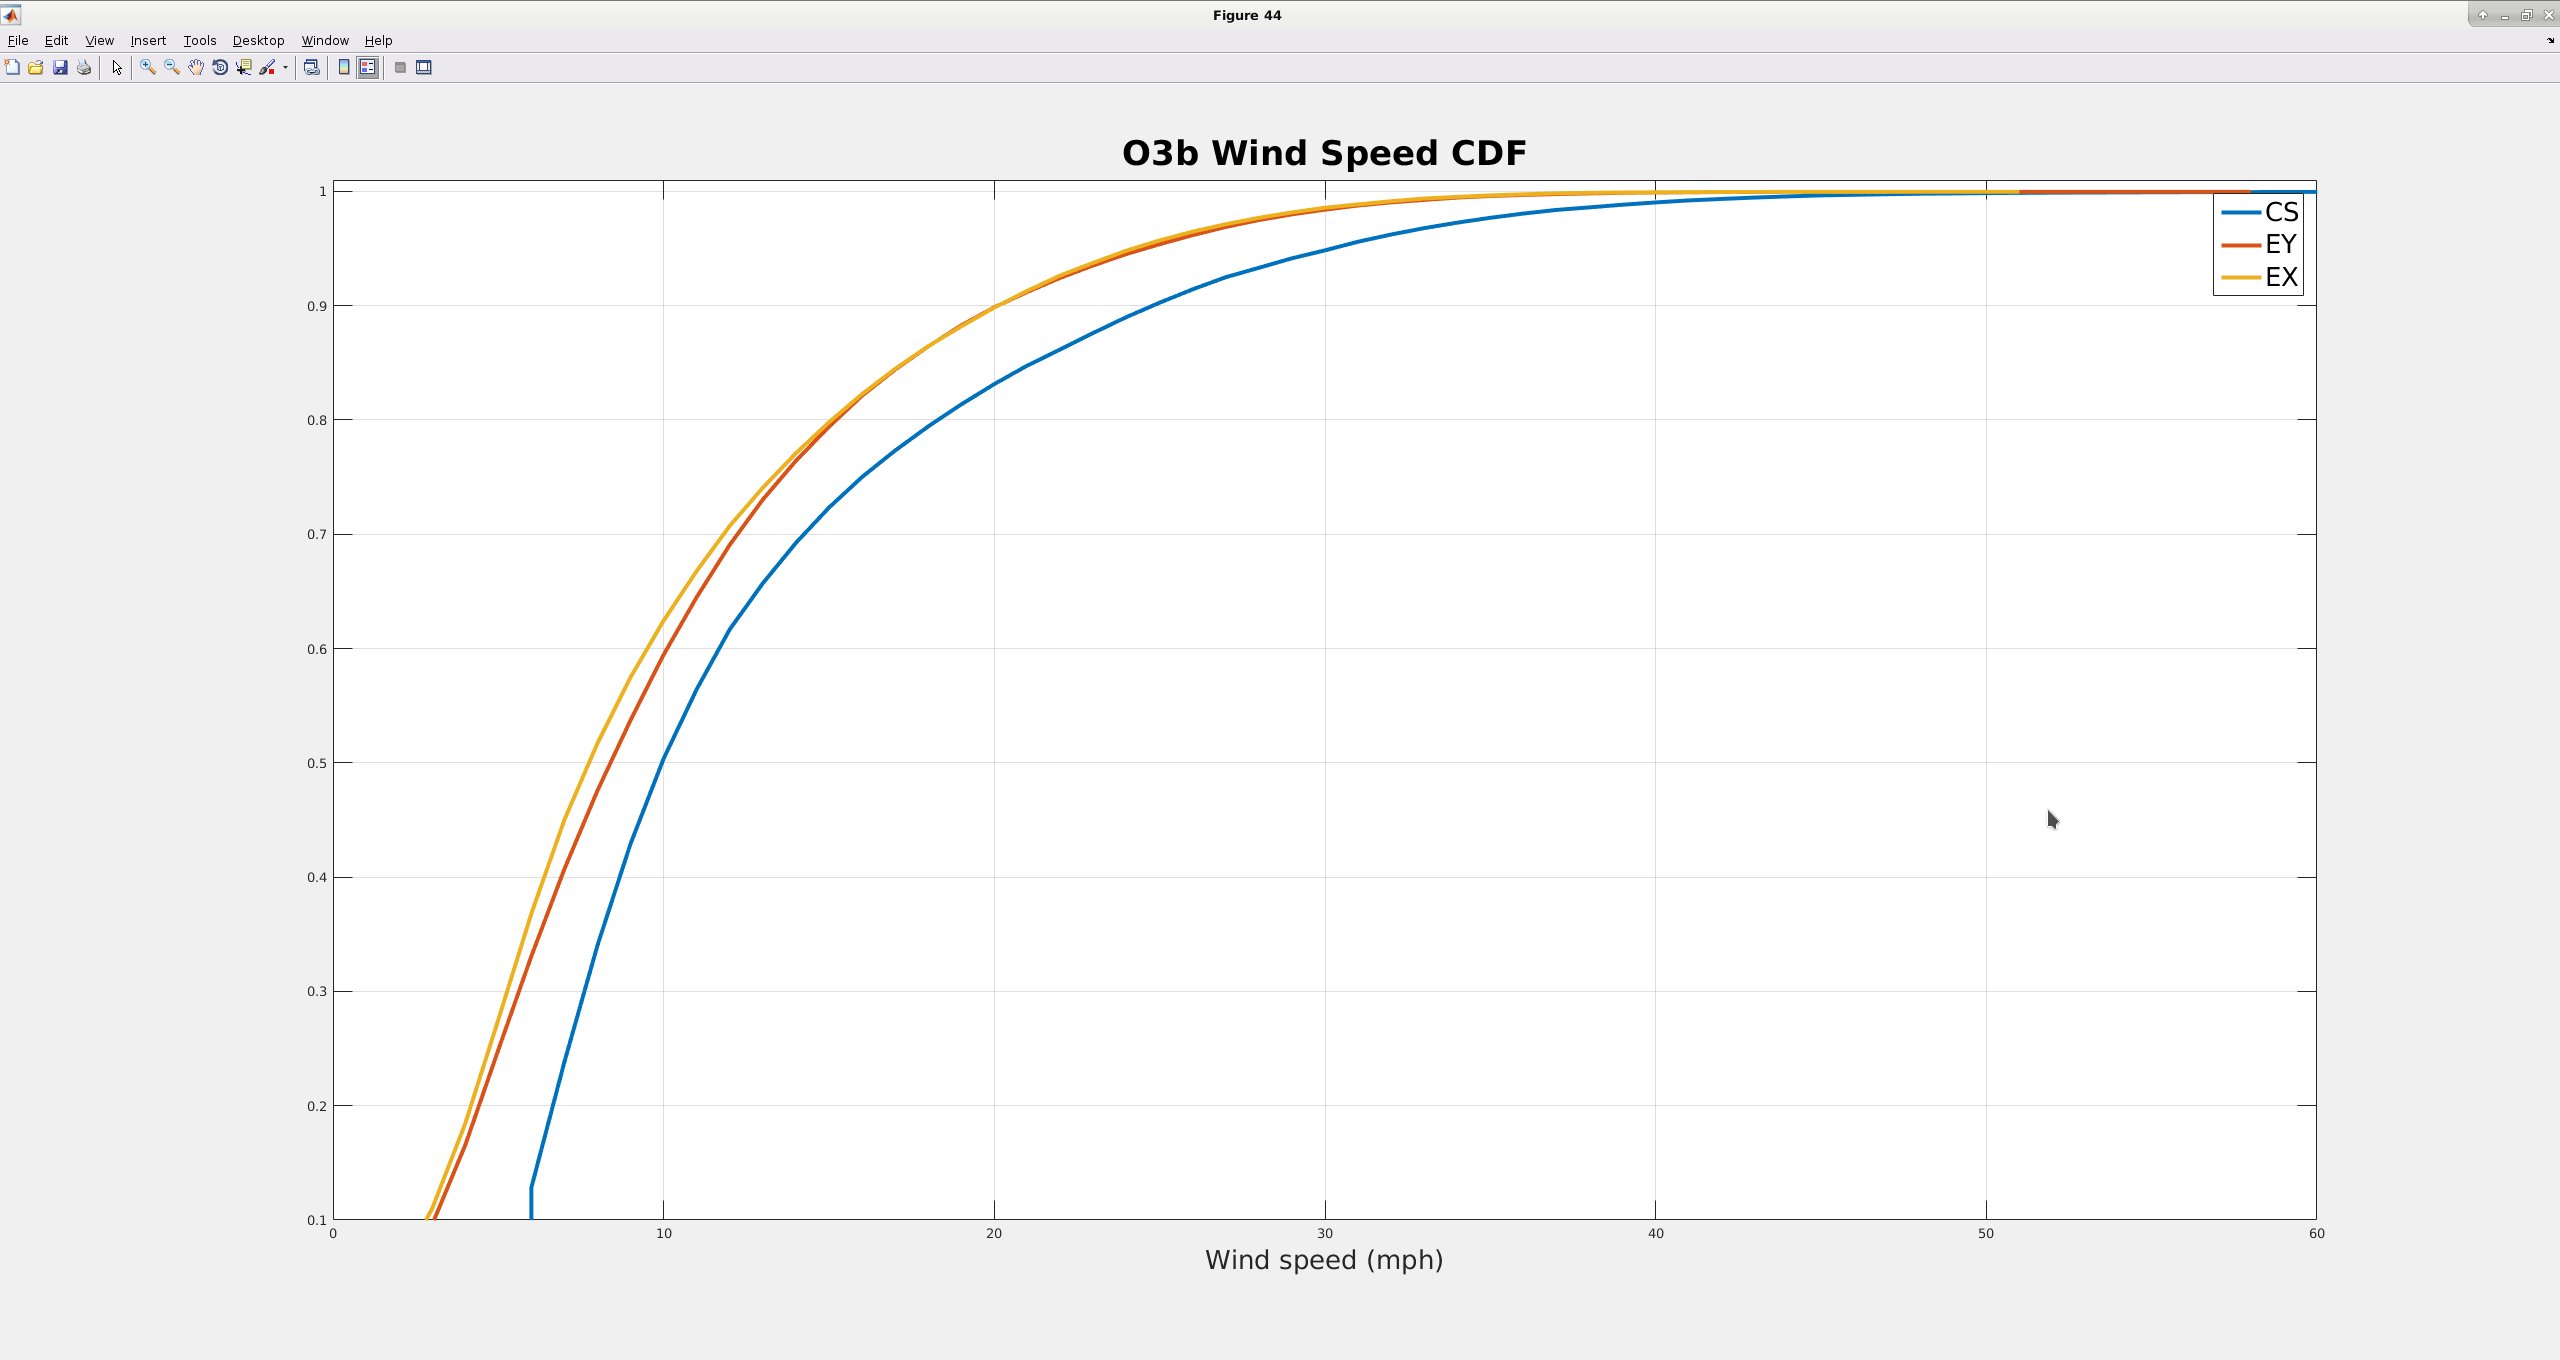
I'm attaching plots comparing the cumulative distributions of the winds for the 2 end stations and the corner. For these distributions, I had to look at times when the corner station was above 5mph. I think this makes sense, because higher winds will tend to be more sustained. The distributions tended to be kind of dominated by the lower winds, making it hard to tell the difference between the distributions above ~95%.
For O3a (first image), the distributions for the 3 buildings are pretty similar, especially above ~10 mph. The 50% level is about 10mph for the corner, maybe 9mph for the ends. The 90% level is just shy of 20mph for all 3 buildings
For O3b (second image), there is more of a consistent difference between distributions for the ends and the corner. And the distributions are toward lower wind speeds for the ends, again suggesting that the wind fences are having the impact on wind speeds at the buildings that we want. Again, the corner 50% level is about 10 mph, the ends are maybe 8 mph. The 90% level for the corner is now about 25 mph ( an increase of 5mph, reflecting the rather windy winter we've been having), while the ends are still right at 20 mph.
WP8550
As a preventative maintenance item, I rebooted h1dc0 and h1broadcast0 at 14:00 PST. Both machines are running GT2.6.35 (which has an instability if running over 208.5 days) and both machines had been running for 211 days (last reboot Tue 30 July 2019). As expected an FSCK was forced by the OS, which slowed the reboot times to about 10 minutes. Due to the unusual restart sequence the DAQ came back partially, and then reset itself.
I completed my script to restart all the FOM displays which are NDS clients, needed after every DAQ restart.
TITLE: 02/26 Eve Shift: 00:00-08:00 UTC (16:00-00:00 PST), all times posted in UTC
STATE of H1: Observing at 118Mpc
OUTGOING OPERATOR: Patrick
CURRENT ENVIRONMENT:
SEI_CONF state: TEST_SWARM
Wind: 6mph Gusts, 4mph 5min avg
Primary useism: 0.02 μm/s
Secondary useism: 0.37 μm/s
Small step up in microseism from 22hrs ago, but still below 90th percentile. Had recent small increase in winds for about 2hrs, but they have already dropped.
QUICK SUMMARY:
H1's been locked for 25+hrs with a range of 119Mpc. Continue to operate H1 with SEI_CONF in the new TEST_SWARM state (heard Jim say that it is performing well and this change was approved by Keita).
TITLE: 02/26 Day Shift: 16:00-00:00 UTC (08:00-16:00 PST), all times posted in UTC
STATE of H1: Observing at 120Mpc
INCOMING OPERATOR: Corey
SHIFT SUMMARY: Remained locked the entire shift. Some brief commissioning. Issues with FMCS at end stations resolved by rebooting system. FMCS Compass server needs to be rebooted on Tuesday to finish updates. Hanford fire department was on site to burn tumbleweeds.
LOG:

16:01 UTC Clicked 'revert changes' on REMOTE_OWL_SELECTION medm. Kicked out of observing. Put back in observing.
16:11 UTC Niko to optics lab
Hanford fire department through gate to X arm to burn tumbleweeds
17:08 UTC Vanessa to mid X
18:23 UTC Knocked out of observing by squeezer. TJ taking opportunity to reload IFO node.
18:25 UTC Back to observing
20:19 UTC Christina to end Y to retrieve receipt from Norco
20:52 UTC Chris to optics lab
21:19 UTC FMCS INVALID alarm, H0:FMC-EX_AH_COOLTEMP_2_DEGF
Richard to end X to reset FMCS controller
22:01 UTC Out of observing. Dave restarting DAQ. Bubba to LVEA.
22:06 UTC Camilla to mechanical room
22:14 UTC Bubba back.
22:15 UTC Dave done. Sheila commissioning.
22:15 UTC Camilla back
22:22 UTC Sheila done commissioning
22:43 UTC Richard back. Back to observing.
23:17 UTC Bubba to end X mechanical room
23:29 UTC Bubba booting FMCS system at end X
23:33 UTC end X FMCS channels back
23:36 UTC Bubba heading to end Y to reboot FMCS system there
end Y FMCS back
Gerardo and I, with Rahul in training, bonded PUM ear S1201472 to the test mass ITM01 S3 flat. (Yes, a PUM ear on a test mass - this was deemed acceptable in times of short test mass ear supply.) The bonding was straight forward and placed with 0.04mm measured error along the beam path axis (0.1mm is the tolerance).
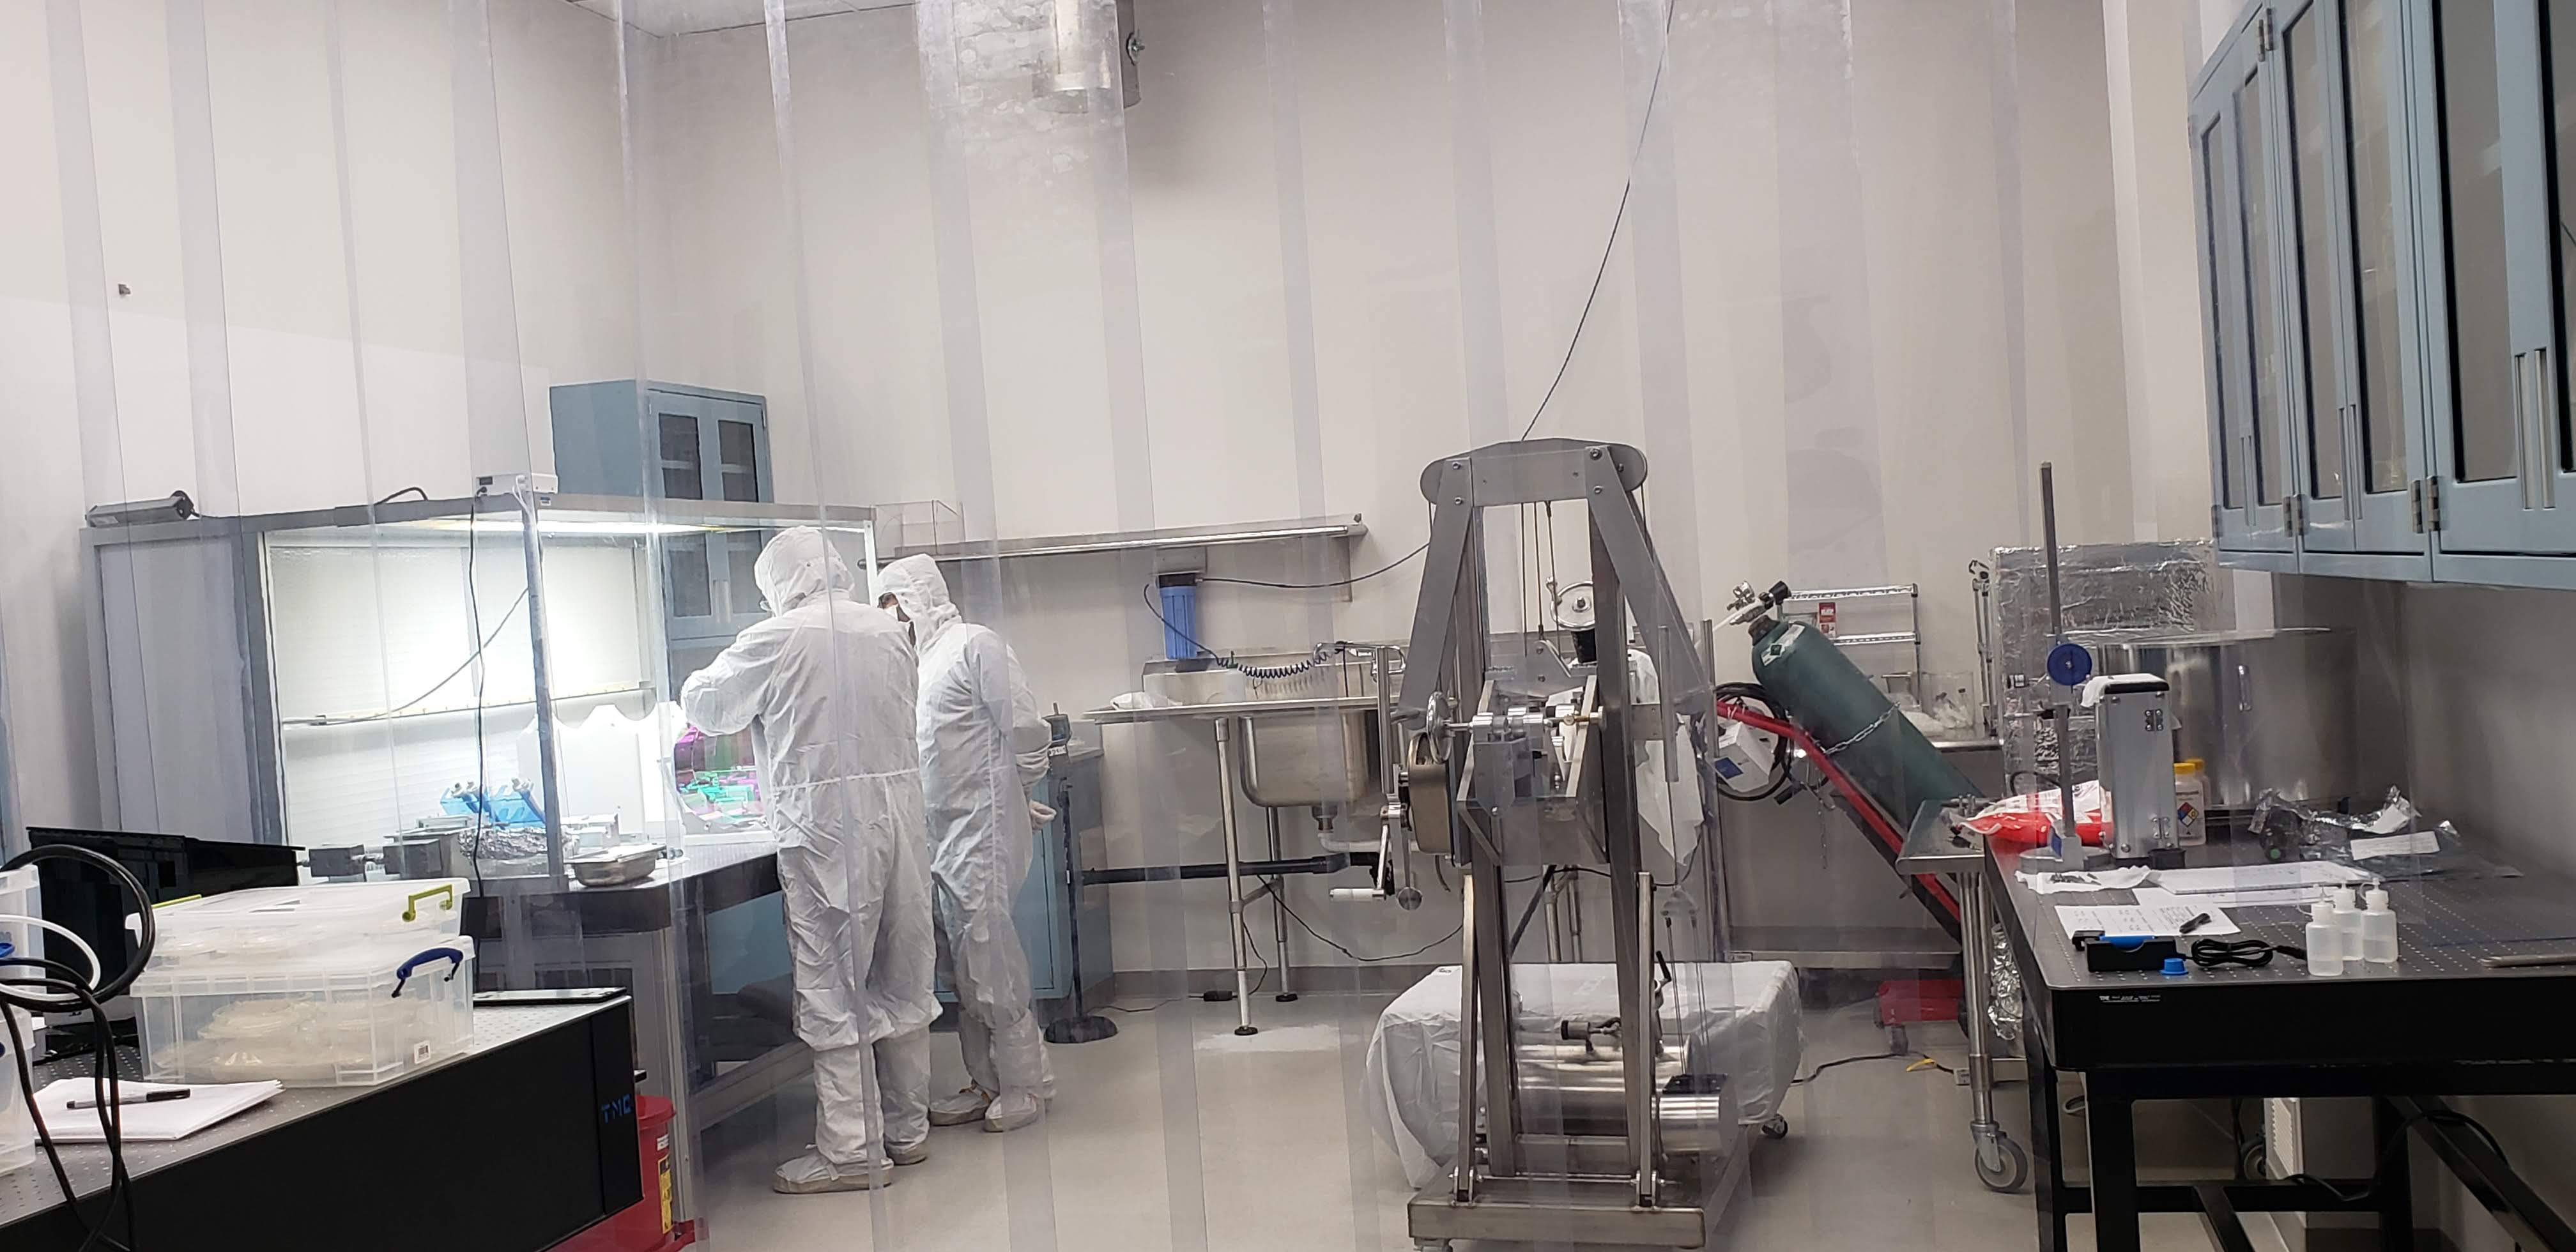
Note this was the first bond in the new lab space. All systems up and working well, thanks to Bubba/Tyler/Chris and the many hours Travis spent to help move everything.
The second ear bonding session is scheduled for next week.
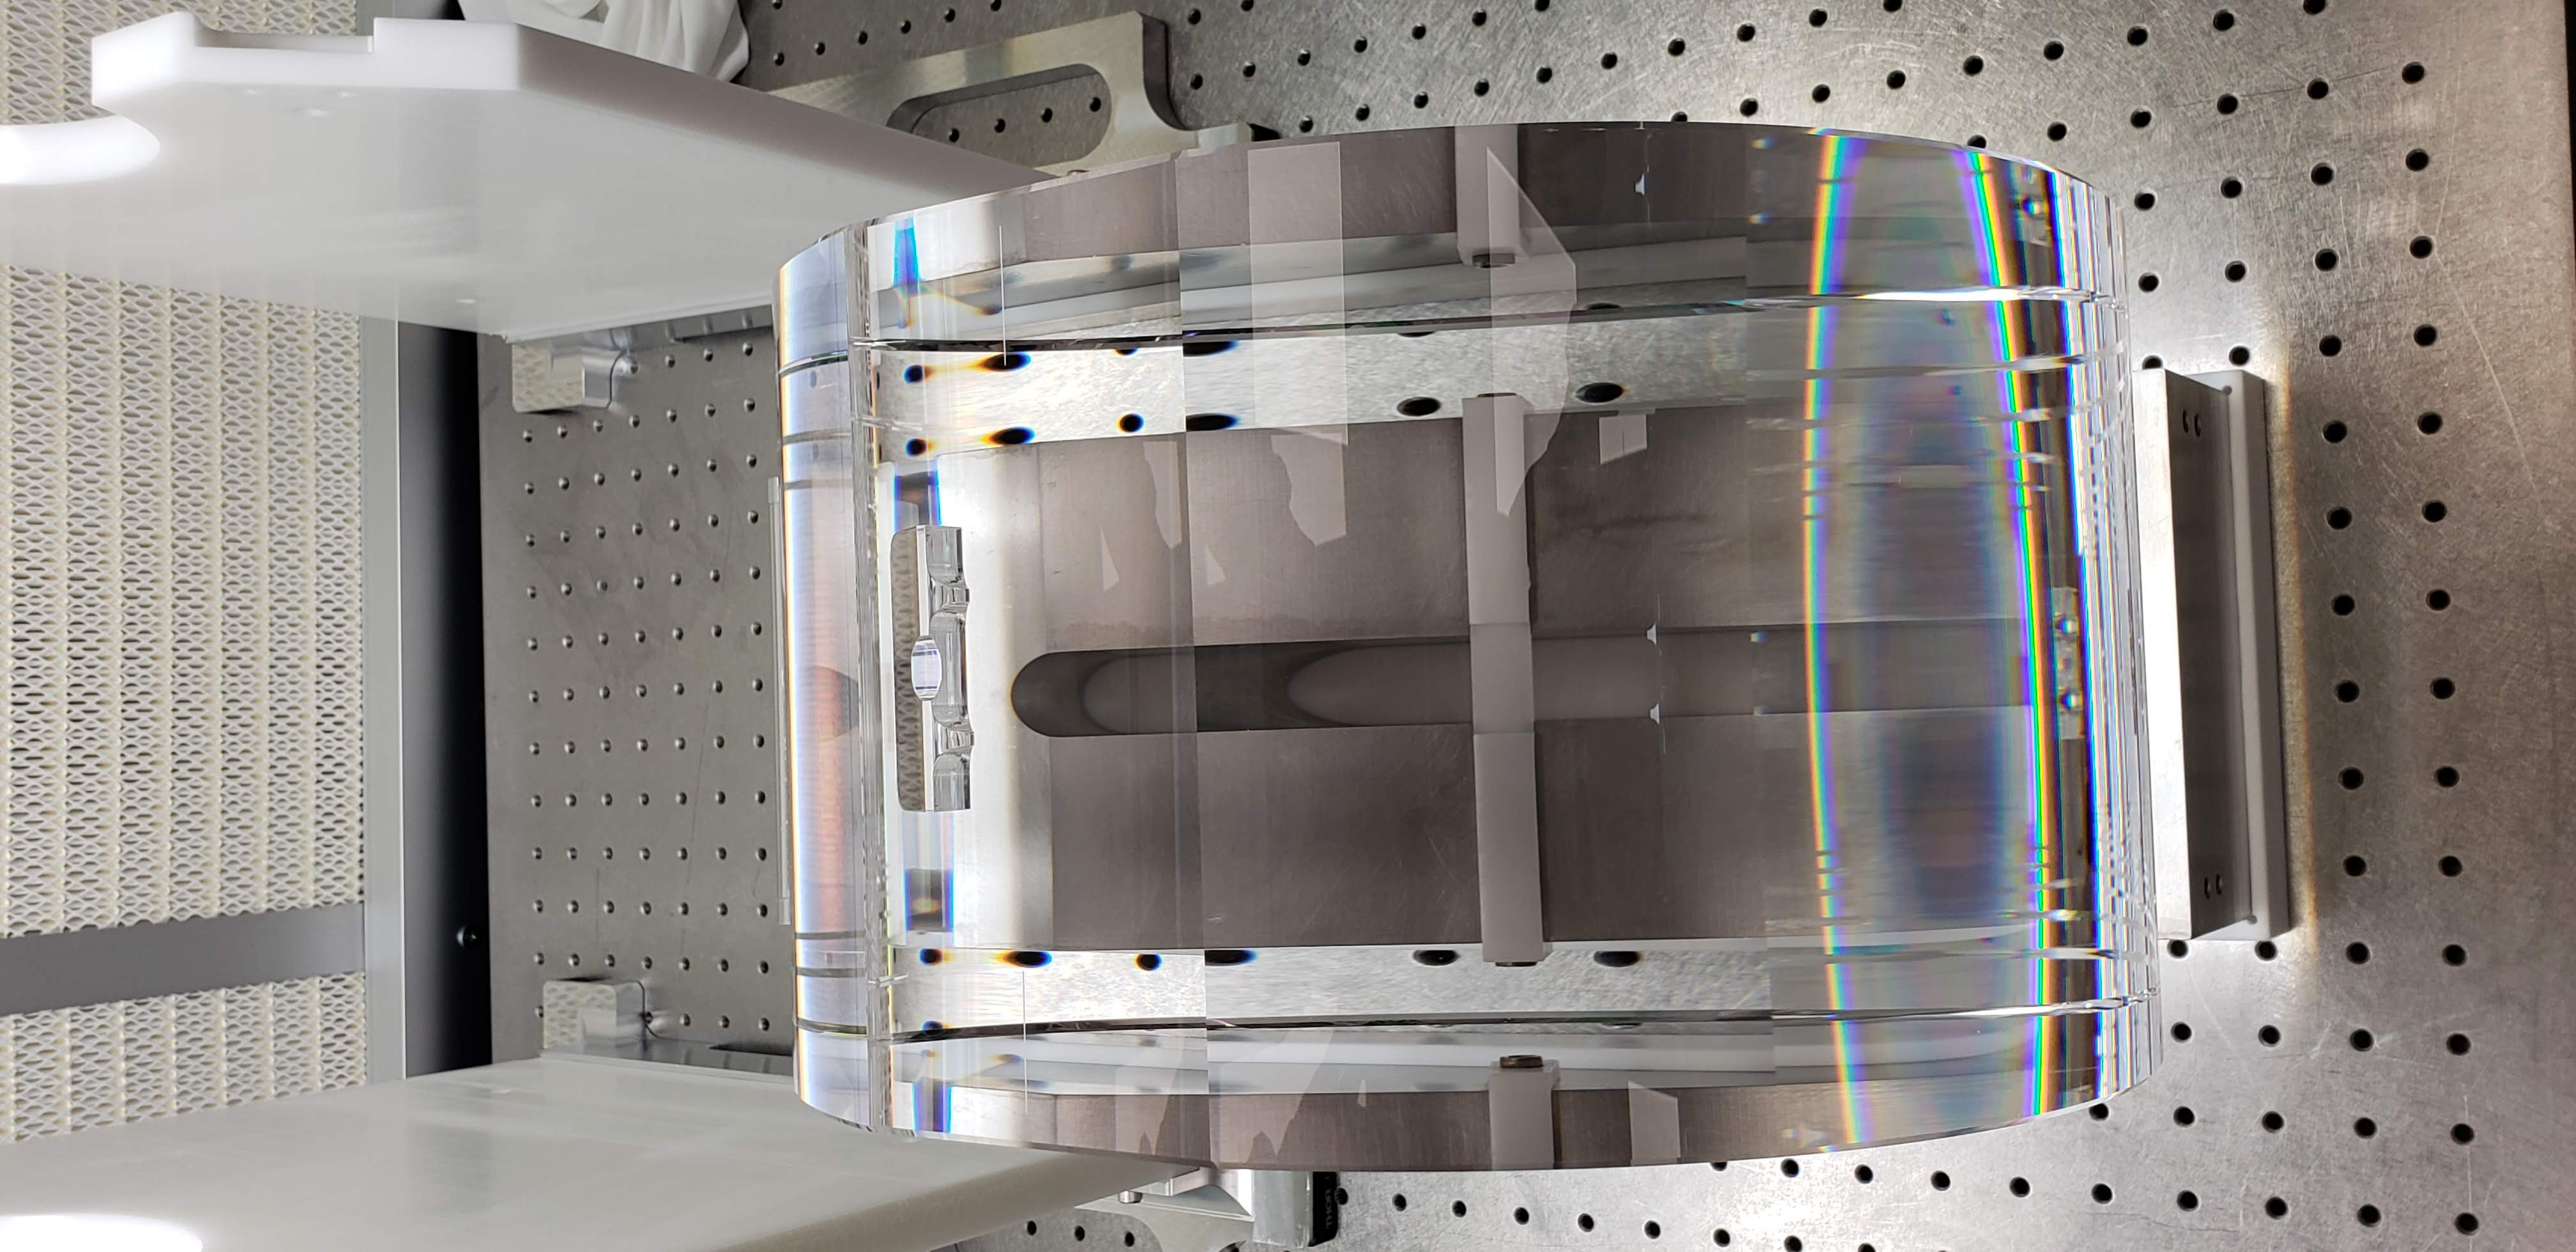
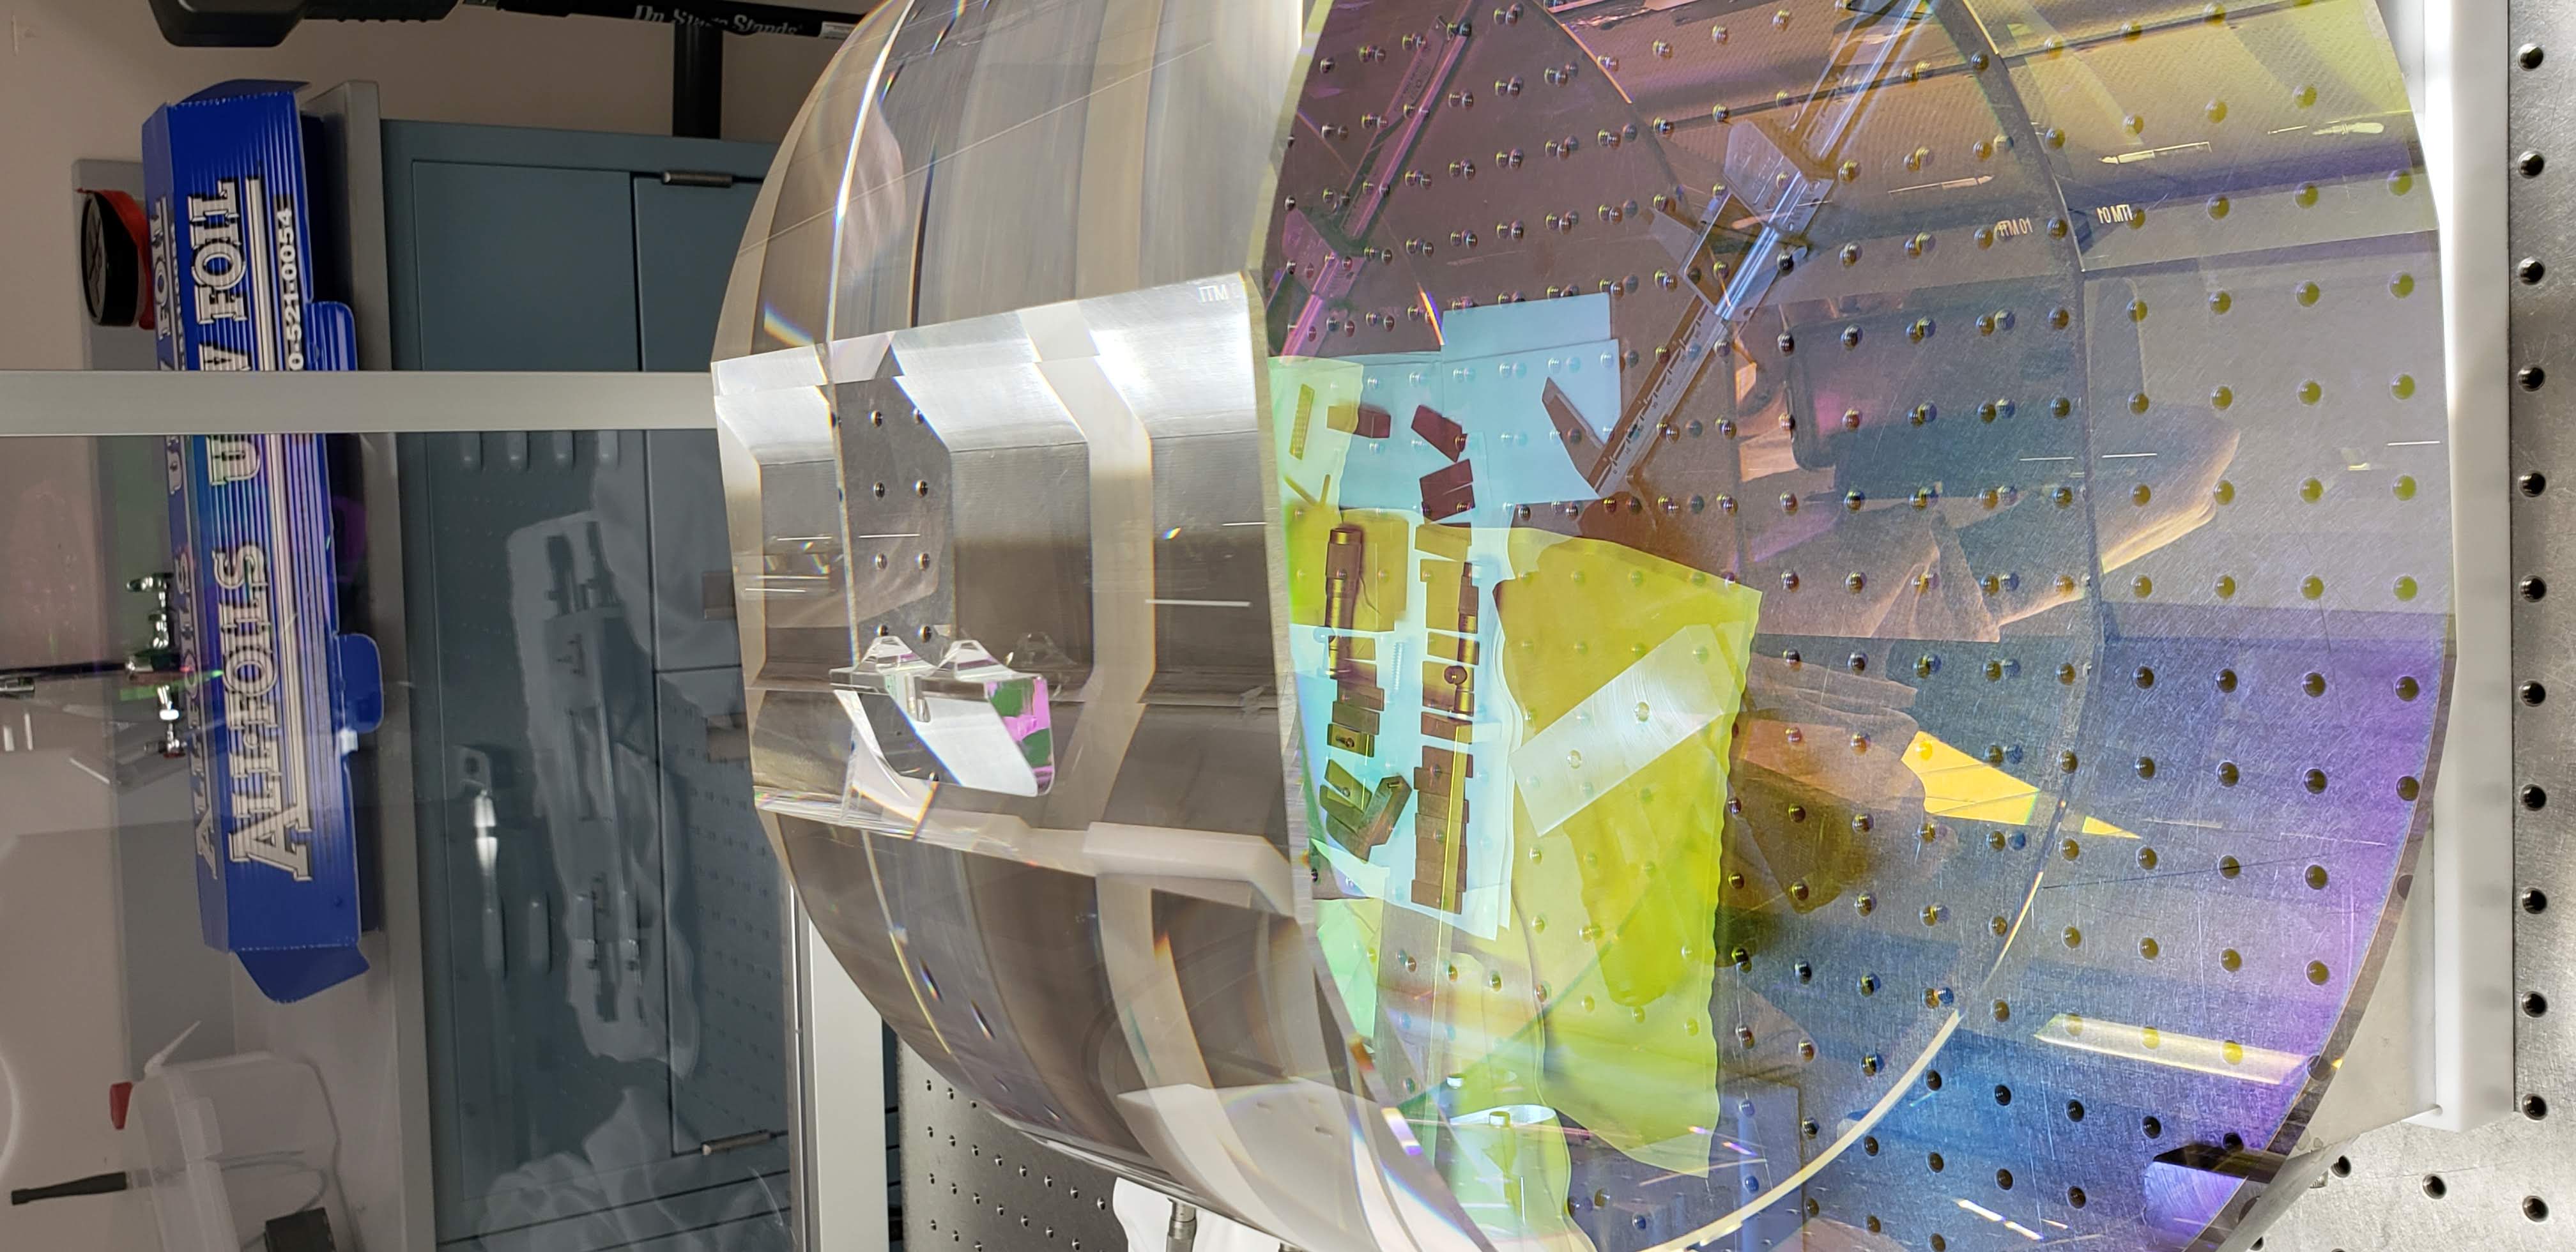
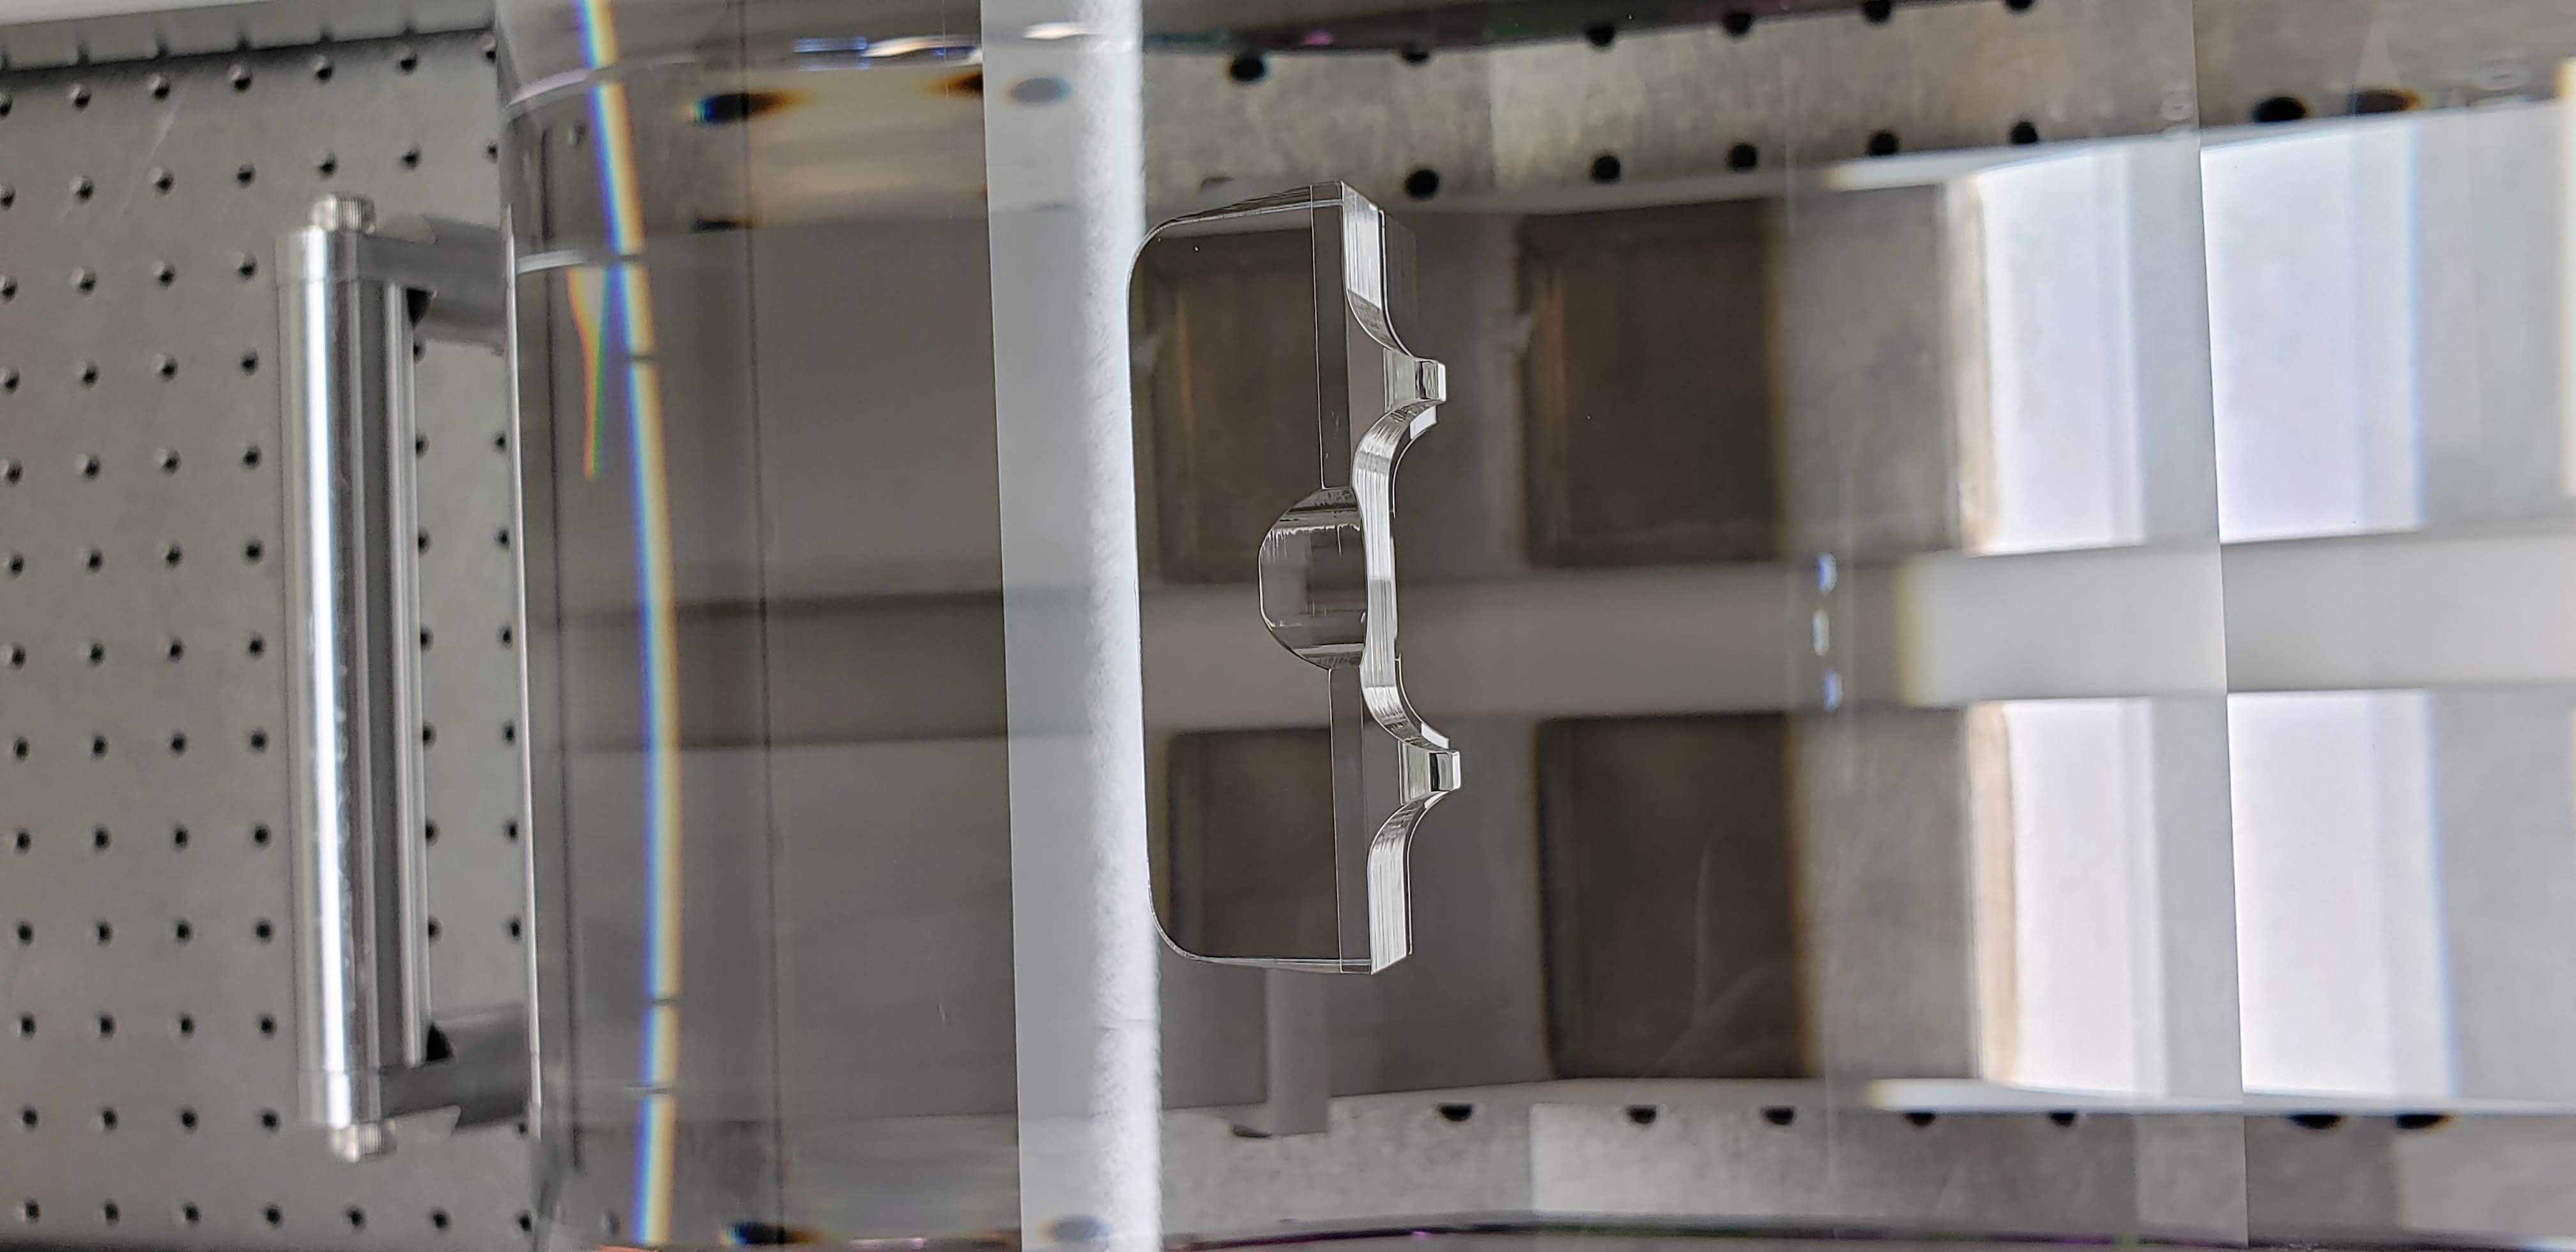
Late entry - ITM01 had the second ear bonded on March 4th, 2020.
A PUM ear was again used. Ear - S1201484
During the bond, there was initially a set of bubbles which we watched migrate out over the course of a few hours. At 2 hours the location and bubble situation (very minimal) were well within tolerance.
The optic will be FirstContact cleaned and stowed in the coming week.
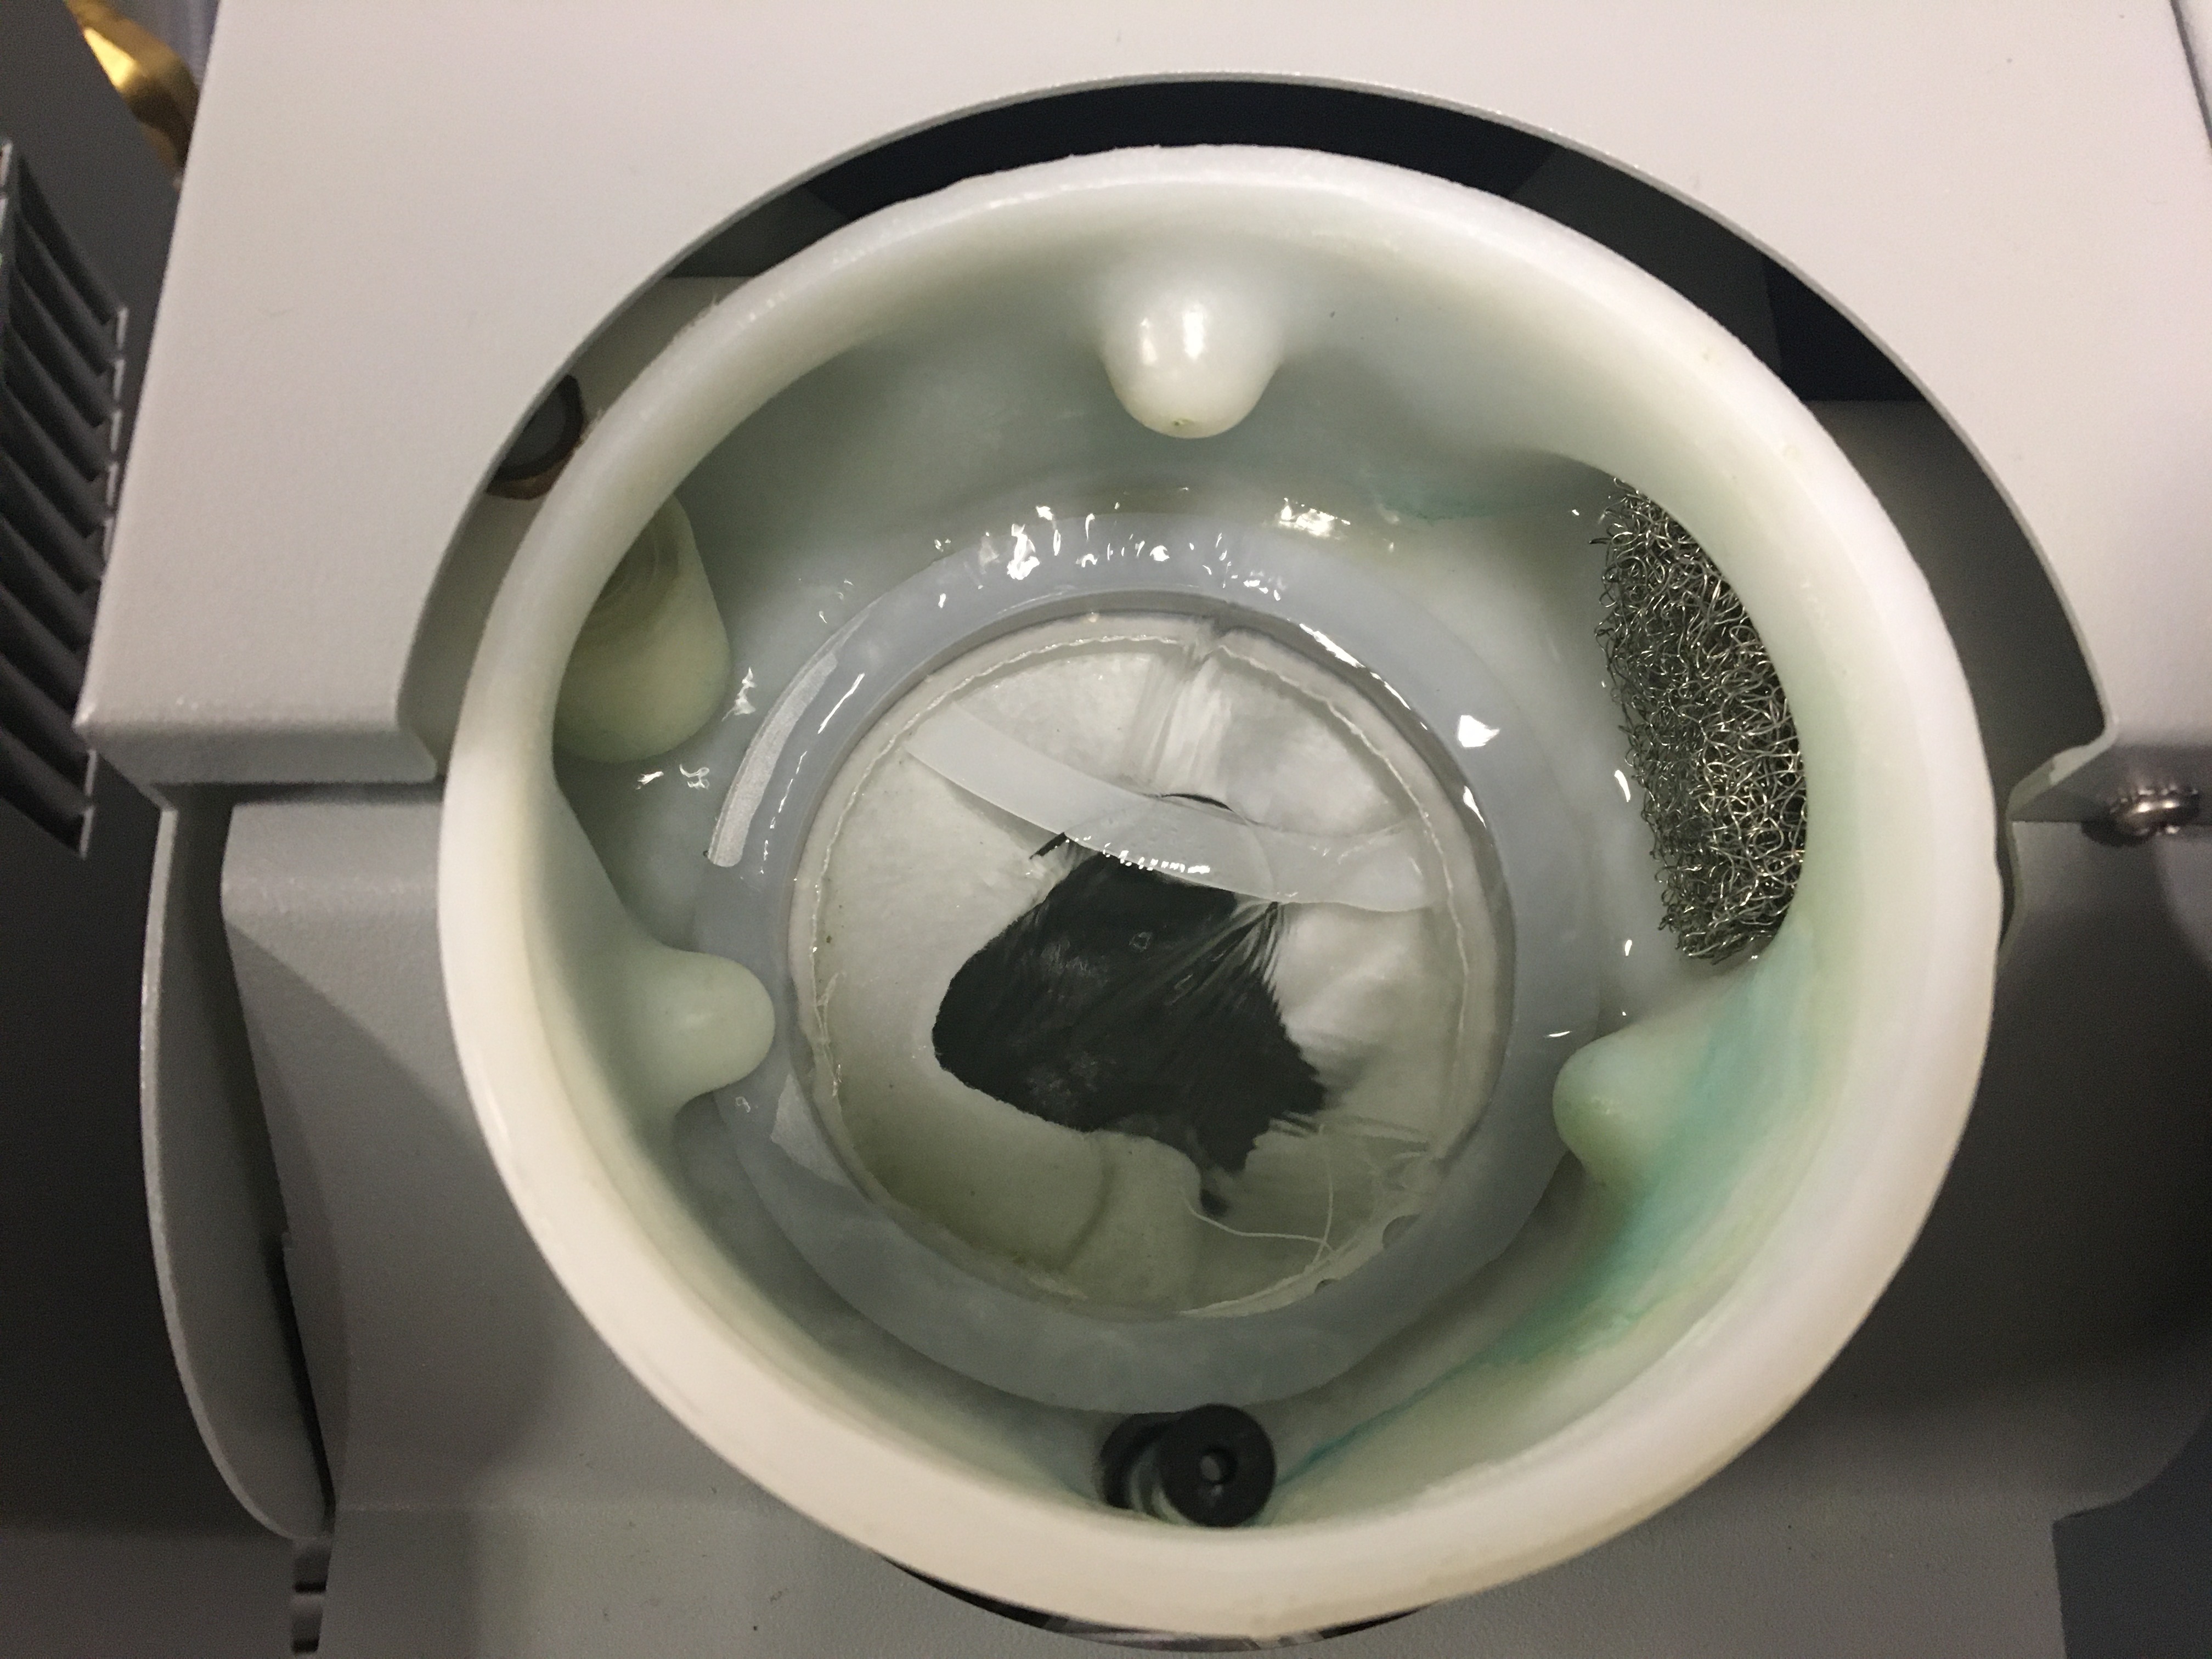
Does this green filter look more green than usual, given service life? Are there any substantial particles within the mesh? Wondering how those on site are reacting to the findings of this log.
It seems that there is no apparent large particulate, which may have been precursors to the LLO TCS CO2 laser chiller filter issues (ref. LLO aLOG 25658, LLO aLOG 22766, E1600282). However, thought I'd check to confirm that this is the case.
There isn't any particulate like in the LLO2276, just the usual greenish-grey coloring and sludge of the same color in the wire mesh filter. I don't think that the this greening has been getting worse, but I could anecdotally say that I find the TCSX filter needing to be swapped more frequently (need to check logs at the chiller to verify).
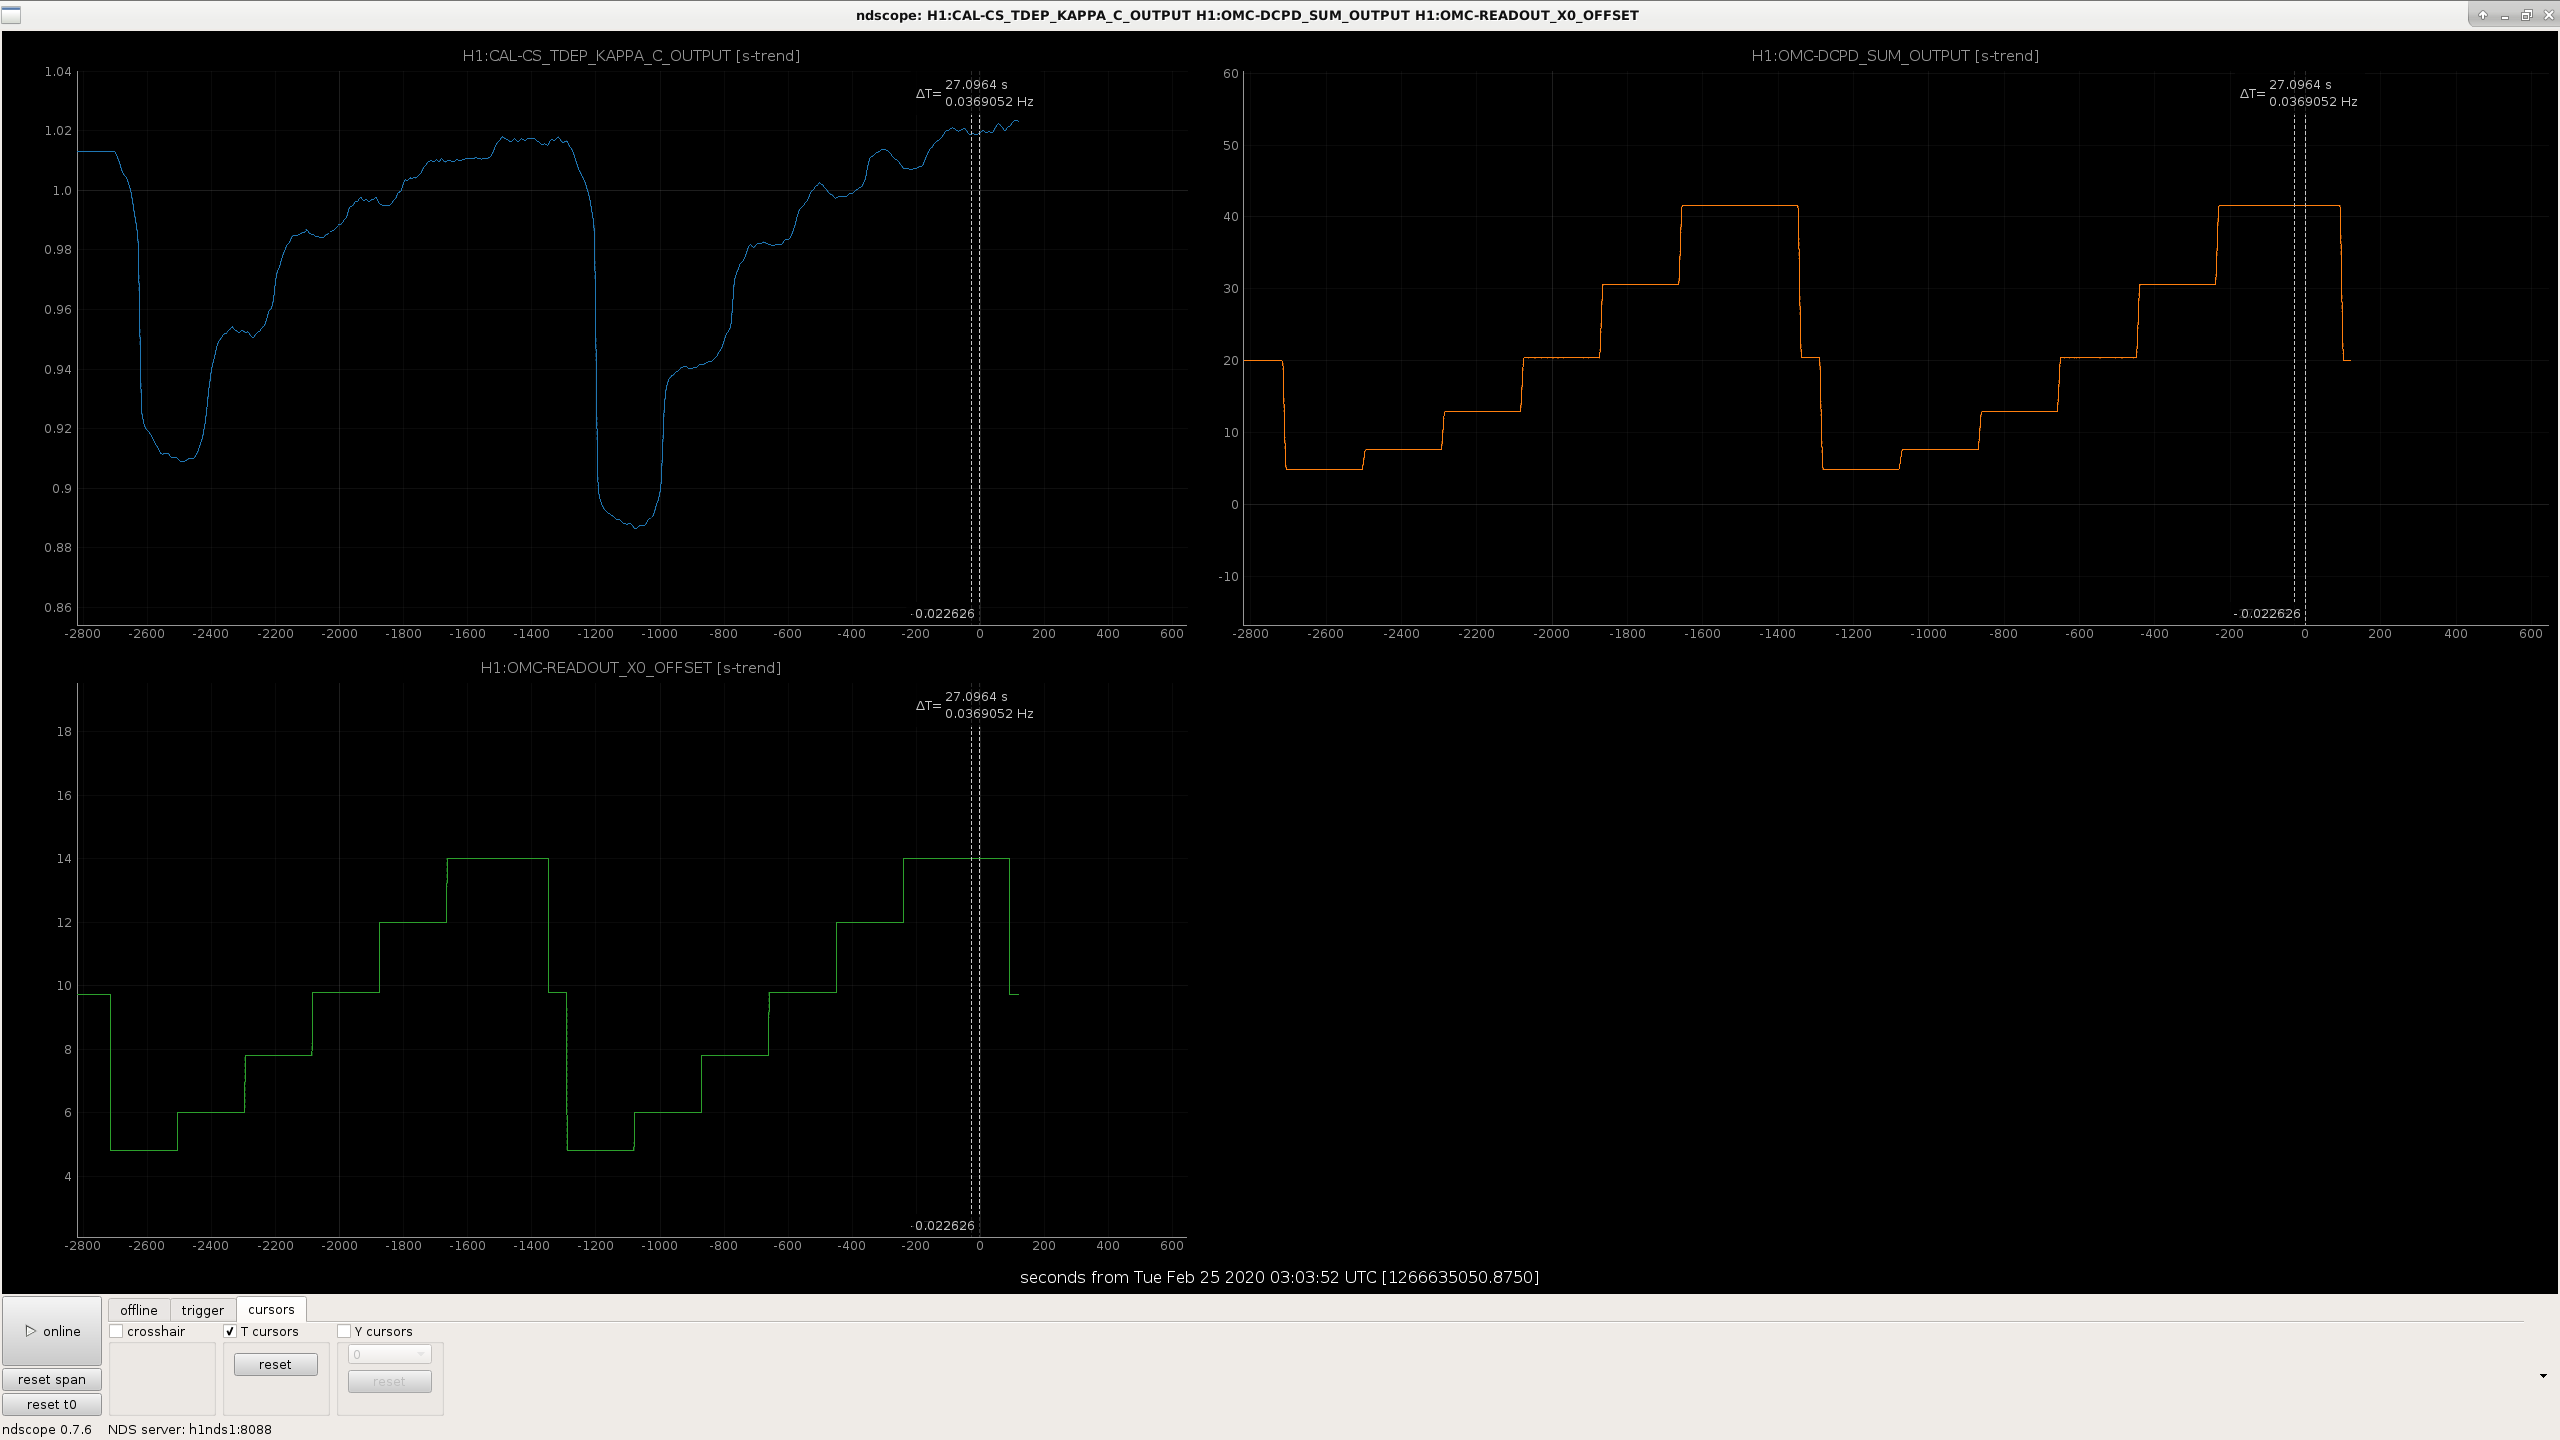
I measured the optical gain for different light levels on the DCPDs before and after lowering the 9MHz modulation depth. We did this as we relocked.
The scan started at 2:18:40 UTC Feb 23rd, and went until 3:05:23 UTC
Attached is a plot of the DCPD power vs optical gain during this test. Although these two traces look similar when plotted this way, there is a consistent difference between the two, and fitting for the amount of junk light inboth cases gives 1.09 +/- 0.06 mA in the high modulation depth measurement, and 1.35+/- 0.06 mA in the low modulation depth case.
While looking at this data I realized that I had made an error in an earlier alog about modulation depths, which is corrected in the comment now. Based on the change in modulation depth (first scan taken with a 23.4dBm epics setting on driver, which means 0.189 radians modulation depth, second scan taken at 20.3dBm setting which means 0.159 radians), we would expect that carrier light in the interferometer would be reduced by 0.5% and the sideband power injected would be increased by 40% when the modulation depth is decreased.
This result suggests that the junk light we are seeing is probably not the 9th order 9MHz mode which is near resonance in H1's OMC 46667.
One explanation for this result could be that I made the test while the interferometer was still thermalizing. The attached screenshot shows trends while the measurement was taken, the fastest part of the thermal transient was over.
There was a 0.8% increase in the circulating power in the Y arm, 0.9% increase in the X arm, when the modulation depth was increased, so both of those are sligthly higher than we expected for the change in modulation depth. It could be that an alignment set point changes when we change the 9MHz modulation depth, which is generating extra carrier junk light.
The increase in junk light after the 9MHz reduction made Keita and I ask ourselves why we are doing this reduction, and if the tests that motivated the change would have the same outcome in our current configuration. It seems plausible that the reason this produces junk light (if it does) are related to TCS settings, spot positions and circulating power.
history of 9MHz modulation depth:
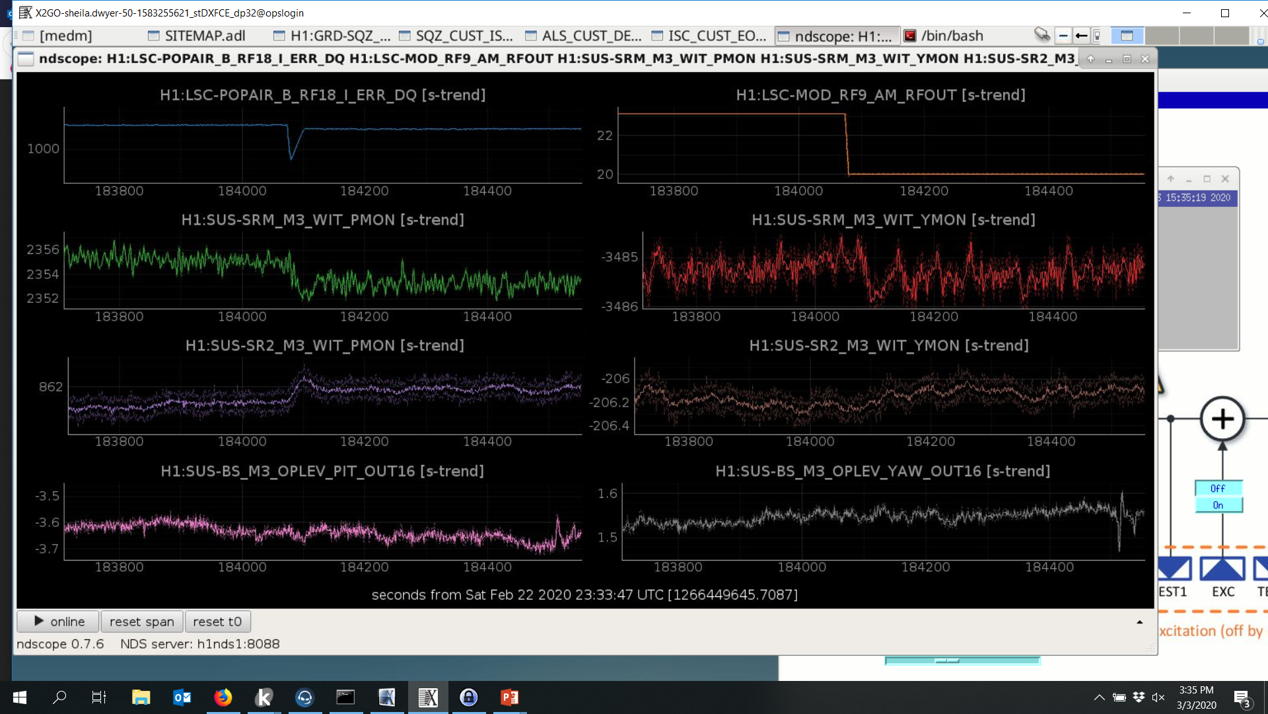
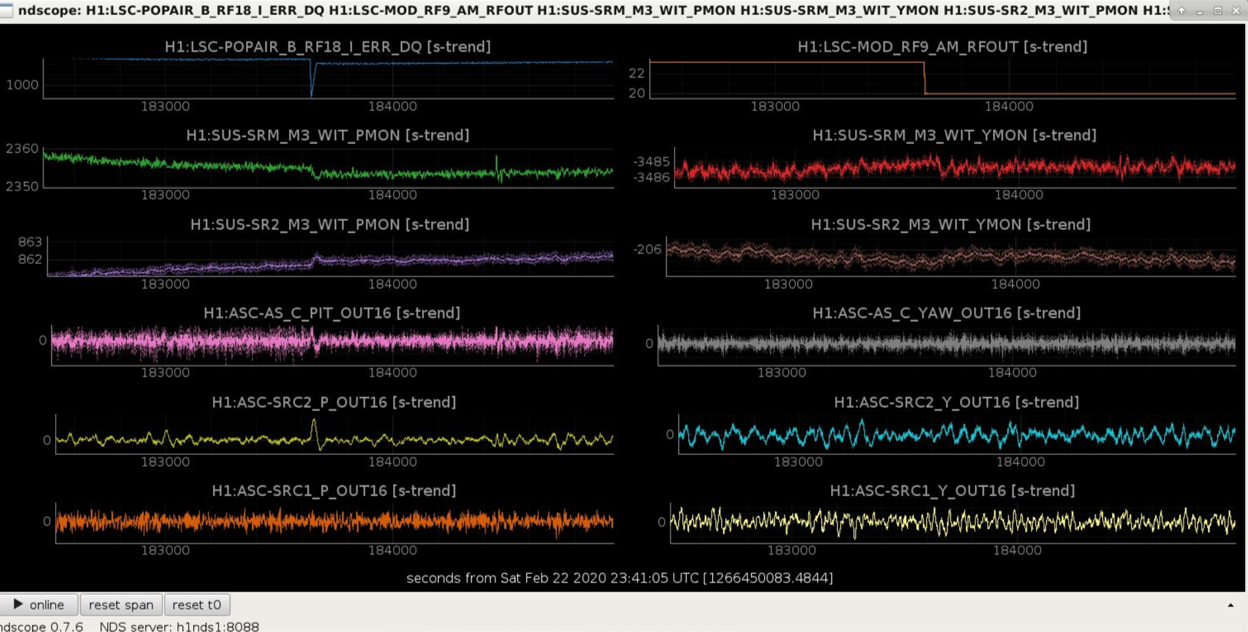
Daniel suggested that we look at what happens to the BS alignment when the modulation depth changes, since AS36 is the signal used to control the BS alignment. Jenne looked into this and found that the beam splitter doesn't react to the change in modulation depth, but SR2 and SRM both do. The first attachment shows that this is mostly in pitch, but there is also a yaw reaction. The second attachment shows that the AS-C QPD seems to be the reason why changing this modulation depth changes the alignment of the SRC. (You can see the change in AS_C before the SRC2 loop brings it back to it's error point by moving the alignment of SR2+SRM). There is not much happening in the AS72 loop (SRC1), which you would expect if they are well diagonalized.
This suggests that the amount of junk light we have on the DCPDs can be changed by changing our offset on AS_C. We plan to try a test of this tomorow.
Took ASC sensing matrix measurement with 'userapps/asc/h1/scripts/sensingMatrix/run_sensmat.py', using updated injection amplitudes. DHARD & CHARD yaw were too low to get a coherent measurement, I've left a note for next time.
| dof: | DHARD | CHARD | DSOFT | CSOFT |
| AS_A_DC_PIT | 7.4e+04 118 | 1.7e+02 -60 | 4.6e+02 66 | 3.6e+02 86 |
| AS_A_RF36_I_PIT | 1.1e+06 -16 | 2.3e+03 13 | 1.37e+05 163 | 2.1e+04 -170 |
| AS_A_RF36_Q_PIT | 1.3e+06 -80 | 9.2e+03 157 | 2.17e+05 156 | 2.4e+04 -125 |
| AS_A_RF45_I_PIT | 3.0e+05 18 | 3.98e+03 -130 | 8.57e+03 170 | 9.39e+03 11 |
| AS_A_RF45_Q_PIT | 8.54e+05 -24 | 1.53e+04 -171 | 1.43e+04 -119 | 2.09e+04 -8 |
| AS_B_DC_PIT | 2.7e+04 -83 | 3.3e+02 -49 | 6.0e+02 161 | 8.8e+02 -135 |
| AS_B_RF36_I_PIT | 2.9e+06 37 | 1.7e+04 -57 | 2.52e+05 -19 | 1.1e+05 168 |
| AS_B_RF36_Q_PIT | 3.5e+06 -162 | 1.3e+04 148 | 2.24e+05 -24 | 5.4e+04 -24 |
| AS_B_RF45_I_PIT | 1.2e+05 -29 | 3.22e+03 176 | 7.94e+03 -162 | 5.5e+03 100 |
| AS_B_RF45_Q_PIT | 7.70e+05 157 | 8.82e+03 39 | 1.01e+04 29 | 1.98e+04 154 |
| AS_C_PIT | 1.6e-02 58 | 5.49e-04 -69 | 1.55e-03 -119 | 1.0e-03 109 |
| REFL_A_DC_PIT | 4.1e+04 150 | 3.6e+02 -103 | 1.7e+03 -87 | 3.1e+03 155 |
| REFL_A_RF9_I_PIT | 7.1e+06 137 | 2.42e+05 168 | 1.9e+05 -117 | 4.7e+05 135 |
| REFL_A_RF9_Q_PIT | 7.4e+06 -7 | 9.76e+04 -12 | 6.0e+04 24 | 2.3e+05 -38 |
| REFL_A_RF45_I_PIT | 6.3e+06 107 | 3.42e+05 172.9 | 1.9e+05 -88 | 2.2e+05 147 |
| REFL_A_RF45_Q_PIT | 3.1e+06 52 | 1.01e+05 171 | 3.1e+04 88 | 1.3e+05 -17 |
| REFL_B_DC_PIT | 1.6e+04 48 | 5.4e+02 173 | 7.7e+02 -66 | 3.4e+03 137 |
| REFL_B_RF9_I_PIT | 4.5e+06 130 | 1.71e+05 162 | 6.8e+04 -120 | 1.5e+05 147 |
| REFL_B_RF9_Q_PIT | 1.4e+06 -3 | 4.80e+04 -15 | 2.3e+04 -69 | 3.0e+04 -10 |
| REFL_B_RF45_I_PIT | 3.0e+07 143 | 3.26e+05 161 | 3.6e+05 -105 | 3.0e+05 110 |
| REFL_B_RF45_Q_PIT | 9.6e+06 146 | 1.03e+05 160 | 1.1e+05 -110 | 6.7e+04 88 |
| POP_X_RF_I_PIT | 2.7e+06 -3 | 1.62e+05 -16 | 9.3e+04 158 | 2.2e+05 -37 |
| POP_X_RF_Q_PIT | 3.3e+06 -97 | 2.3e+04 172 | 2.5e+04 -3 | 4.2e+04 164 |
| POP_A_PIT | 3.8e+03 -119 | 7.81e+01 -28 | 2.2e+01 92 | 9.0e+01 -55 |
| POP_B_PIT | 3.1e+02 148 | 1.34e+01 143 | 1.2e+01 72 | 7.2e+00 -152 |
| X_TR_A_PIT | 2.5e+03 -179 | 4.31e+03 157 | 1.01e+02 -3 | 1.8e+02 -32 |
| X_TR_B_PIT | 3.5e+03 -166 | 5.29e+03 157 | 2.89e+02 159 | 3.46e+02 164 |
| Y_TR_A_PIT | 6.2e+03 -20 | 5.37e+03 159 | 3.78e+02 163 | 3.3e+02 -6 |
| Y_TR_B_PIT | 4.0e+03 -80 | 1.53e+03 156 | 7.75e+02 -22 | 7.37e+02 167 |
| dof: | DHARD | CHARD | DSOFT | CSOFT |
| AS_A_DC_YAW | 8.1e+04 40 | 7.6e+03 157 | 5.1e+02 -169 | 4.0e+02 -2 |
| AS_A_RF36_I_YAW | 3.8e+06 -129 | 9.0e+04 52 | 1.12e+05 -12 | 6.37e+04 167 |
| AS_A_RF36_Q_YAW | 4.7e+06 -154 | 1.2e+05 -75 | 2.05e+05 -19 | 2.4e+04 -22 |
| AS_A_RF45_I_YAW | 3.3e+05 0 | 1.1e+04 87 | 1.02e+04 20 | 3.1e+03 -22 |
| AS_A_RF45_Q_YAW | 9.0e+05 -5 | 1.7e+04 127 | 1.12e+04 57 | 4.8e+03 40 |
| AS_B_DC_YAW | 6.6e+04 -84 | 2.5e+03 128 | 6.6e+02 49 | 3.1e+02 -17 |
| AS_B_RF36_I_YAW | 3.8e+06 -118 | 1.7e+05 -60 | 2.11e+05 167 | 1.2e+05 145 |
| AS_B_RF36_Q_YAW | 4.2e+06 154 | 3.9e+05 117 | 2.26e+05 156 | 9.3e+04 -49 |
| AS_B_RF45_I_YAW | 1.8e+05 -23 | 1.7e+04 -130 | 6.14e+03 -19 | 2.1e+03 69 |
| AS_B_RF45_Q_YAW | 8.7e+05 -173 | 2.4e+04 -26 | 1.21e+04 -78 | 8.2e+03 172 |
| AS_C_YAW | 1.4e-01 -175 | 4.2e-03 -4 | 1.44e-03 143 | 6.2e-04 -147 |
| REFL_A_DC_YAW | 2.8e+05 -75 | 1.7e+04 -137 | 2.3e+03 52 | 3.2e+03 97 |
| REFL_A_RF9_I_YAW | 4.5e+07 -69 | 2.1e+06 -116 | 1.3e+05 171 | 3.0e+05 108 |
| REFL_A_RF9_Q_YAW | 7.2e+06 -116 | 3.1e+05 -17 | 5.6e+04 -136 | 2.5e+04 144 |
| REFL_A_RF45_I_YAW | 1.2e+08 -82 | 7.1e+06 -96 | 5.2e+05 -175 | 8.1e+05 133 |
| REFL_A_RF45_Q_YAW | 2.8e+07 -88 | 2.0e+06 -91 | 1.6e+05 -177 | 1.7e+05 152 |
| REFL_B_DC_YAW | 5.6e+04 -166 | 1.3e+04 -86 | 6.3e+02 -23 | 1.3e+03 141 |
| REFL_B_RF9_I_YAW | 9.9e+06 96 | 6.3e+05 165 | 4.7e+04 28 | 1.25e+05 -13 |
| REFL_B_RF9_Q_YAW | 1.6e+06 137 | 3.5e+05 11 | 1.5e+04 163 | 6.6e+04 170 |
| REFL_B_RF45_I_YAW | 5.8e+07 102 | 2.4e+06 108 | 3.0e+05 158 | 2.1e+05 -6 |
| REFL_B_RF45_Q_YAW | 1.9e+07 111 | 8.1e+05 76 | 8.2e+04 -169 | 5.0e+04 -34 |
| POP_X_RF_I_YAW | 8.1e+06 175 | 1.1e+06 7 | 8.6e+04 -145 | 1.4e+05 175 |
| POP_X_RF_Q_YAW | 4.6e+06 87 | 2.3e+05 -50 | 7.1e+04 -24 | 4.8e+04 -36 |
| POP_A_YAW | 7.2e+03 7 | 6.8e+02 -164 | 1.6e+02 -45 | 9.8e+01 -59 |
| POP_B_YAW | 2.3e+03 11 | 7.7e+01 84 | 3.9e+01 -38 | 9.4e+00 46 |
| X_TR_A_YAW | 5.2e+03 -76 | 4.39e+03 161 | 1.2e+02 -168 | 1.8e+02 129 |
| X_TR_B_YAW | 6.6e+03 -93 | 3.22e+03 169 | 7.96e+02 -23 | 6.17e+02 -23 |
| Y_TR_A_YAW | 9.0e+03 177 | 5.50e+03 -24 | 2.7e+02 147 | 2.8e+02 -14 |
| Y_TR_B_YAW | 1.2e+04 165 | 2.72e+03 -22 | 6.74e+02 -31 | 6.24e+02 166 |
Updated yaw sensing matrix, with DHARD & CHARD inputs increased by a factor of 3:
| dof: | DHARD | CHARD | DSOFT | CSOFT |
| AS_A_DC_YAW | 2.8e+04 -152 | 2.2e+03 -25 | 4.6e+02 -100 | 4.0e+02 108 |
| AS_A_RF36_I_YAW | 6.3e+05 -177 | 9.6e+04 -84 | 1.22e+05 -18 | 5.7e+04 130 |
| AS_A_RF36_Q_YAW | 1.6e+06 -28 | 5.4e+04 -49 | 1.98e+05 -15 | 1.9e+04 -39 |
| AS_A_RF45_I_YAW | 3.73e+05 -6 | 1.31e+04 164 | 1.11e+04 5 | 1.4e+03 16 |
| AS_A_RF45_Q_YAW | 9.41e+05 -22 | 2.9e+04 174 | 1.50e+04 47 | 3.5e+03 105 |
| AS_B_DC_YAW | 1.7e+04 37 | 1.7e+03 -96 | 3.8e+02 -43 | 4.9e+02 -50 |
| AS_B_RF36_I_YAW | 1.2e+06 -169 | 1.2e+05 -52 | 2.20e+05 162 | 7.1e+04 107 |
| AS_B_RF36_Q_YAW | 7.5e+05 -111 | 1.4e+05 171 | 1.96e+05 169 | 1.7e+04 -50 |
| AS_B_RF45_I_YAW | 8.6e+04 -47 | 7.8e+03 -163 | 6.00e+03 -12 | 4.9e+03 68 |
| AS_B_RF45_Q_YAW | 7.93e+05 161 | 2.96e+04 -4 | 1.10e+04 -91 | 4.5e+03 -105 |
| AS_C_YAW | 4.94e-02 -163 | 1.9e-03 -38 | 1.2e-03 129 | 7.9e-04 -126 |
| REFL_A_DC_YAW | 4.0e+04 -56 | 7.3e+02 -37 | 1.2e+03 109 | 7.2e+02 -7 |
| REFL_A_RF9_I_YAW | 1.9e+06 131 | 2.7e+05 82 | 2.1e+05 80 | 8.3e+04 63 |
| REFL_A_RF9_Q_YAW | 1.2e+06 -168 | 3.5e+05 18 | 4.0e+04 23 | 3.0e+04 68 |
| REFL_A_RF45_I_YAW | 8.0e+06 149 | 1.9e+06 36 | 7.2e+05 65 | 2.3e+05 49 |
| REFL_A_RF45_Q_YAW | 3.3e+06 133 | 6.9e+05 38 | 2.2e+05 56 | 7.8e+04 52 |
| REFL_B_DC_YAW | 1.6e+04 -94 | 3.1e+03 20 | 2.6e+02 106 | 7.8e+02 -36 |
| REFL_B_RF9_I_YAW | 1.4e+06 8 | 3.85e+05 154 | 4.4e+04 103 | 9.6e+04 -4 |
| REFL_B_RF9_Q_YAW | 5.3e+05 124 | 1.2e+05 -94 | 4.4e+04 -122 | 4.7e+04 -166 |
| REFL_B_RF45_I_YAW | 3.4e+06 43 | 1.3e+06 -169 | 2.6e+05 -127 | 1.2e+05 -167 |
| REFL_B_RF45_Q_YAW | 2.6e+05 -110 | 2.6e+05 -147 | 1.0e+05 -116 | 4.8e+04 -93 |
| POP_X_RF_I_YAW | 2.0e+06 -172 | 2.9e+05 -58 | 1.2e+05 -104 | 5.4e+04 179 |
| POP_X_RF_Q_YAW | 7.1e+05 161 | 9.7e+04 -169 | 3.7e+04 -75 | 7.3e+04 118 |
| POP_A_YAW | 1.1e+02 -48 | 7.16e+01 -21 | 6.4e+00 45 | 3.7e+00 -50 |
| POP_B_YAW | 6.0e+02 -50 | 5.84e+01 159 | 8.9e+00 -124 | 1.0e+01 148 |
| X_TR_A_YAW | 5.3e+03 165 | 3.53e+03 159 | 1.6e+02 -120 | 4.5e+01 -31 |
| X_TR_B_YAW | 3.6e+03 167 | 2.73e+03 160 | 7.08e+02 -26 | 6.96e+02 -32 |
| Y_TR_A_YAW | 7.1e+03 159 | 6.04e+03 -20 | 3.69e+02 156 | 2.8e+02 -10 |
| Y_TR_B_YAW | 4.3e+03 152 | 2.01e+03 -25 | 7.64e+02 -22 | 6.72e+02 151 |
The whitening / anti-whitening gains in runAnalysis_vII.py were outdated. Attached are the tables with corrected gains, and also in raw cts/rad.
Sheila, Jenne, Keita
Summary: We have some evidence that our sensitivity can be better with a higher DARM offset.
Details:
Last Thursday I took some data with the squeezer off at different DARM offsets, 55086 to compare with the data that Jenne took 54969.
The high frequency noise is consistent with the measured change in optical gain and the dark noise:
The last two plots show the low frequency sensitivity and the impact of SRCL subtraction, comparing our nominal DARM offset of 10pm to the candidate new offset of 14pm.
I went back and got a few more data points of DCPD current vs optical gain from the time when Jenne moved the DARM offset (54969). Attached is a new version of the 4th attachment above, where the optical gain is plotted against the DCPD power along with a fit to the data (from both times). There are only 2 parameters in the fit, the quadratic coefficient and an offset from junk light which doesn't change with the DARM offset or contain any DARM signal.
This fit suggests that we have 1.7mA of photocurrent from junk light, which would mean 1.95mW of junk light (without the data from Jenne's ealier test we get 1.5mA). This can be compared to the 1.7mW that Craig found in 51273, with 20W of input power.
Summary: I've made an estimate of low frequency noise that could be explained by intensity noise on the junk light that we have on the DCPDs. It is below the DARM residual but within a factor of a few.
If we assume that the low frequency increase in noise at 5pm compared to 14pm is due to intensity noise on the junk light, and assume that intensity noise stays the same when the DARM offset is changed, we can make an estimate of where this noise is when we are operatoing at 10pm.
The first attachment shows the GDS strain data from above with the power based SRCL subtraction, you can more clearly see that there is a low frequency sensitvity difference. If this is due to intensity noise on the junk light, we can use the difference here to estimate the intensity noise. The DARM PSD in displacement is
DARM PSD(5 pm) = Intensity PSD /(optical gain (5pm)^2) + PSD of noises which are independent of DARM offset
and similar for 14pm DARM offset. We can find the Intensity PSD by comparing the two DARM PSDs and knowing the optical gain.
Intensity PSD = [DARM PSD(5pm) - DARM PSD(14pm)]/[1/optical gain(5pm)^2 - 1/optical gain(14pm)^2 ]
The RIN estimated this way is around 5e-8 at 40Hz, shown in the second attachment. The third attachment shows the estimated intensity noise scaled by the optical gain at our nominal DARM offset of 10pm. We can compare this to the attached noise budget residual This is a noise budget for Jan 20th, although we haven't updated the coupling measuremetns used here in several months. The reason that the noise budget misestiamted the quantum noise around 200 Hz is that we don't have the frequency dependence of the squeezer modeled correctly here). The peak at around 48Hz in this noise budget total is from a vibration noise estimate from the PEM website before the 48Hz peak was fixed, this peak should go away when we update that. The message is that the noise I'm estimating to be caused by junk light intensity noise is about half of our noise budget residual at 50Hz, and about a third of the residual at 40 Hz. We would need 4 noise sources of this size to explain our residual at 50Hz, and 8 noise sources this size to explain our residual at 50Hz).


