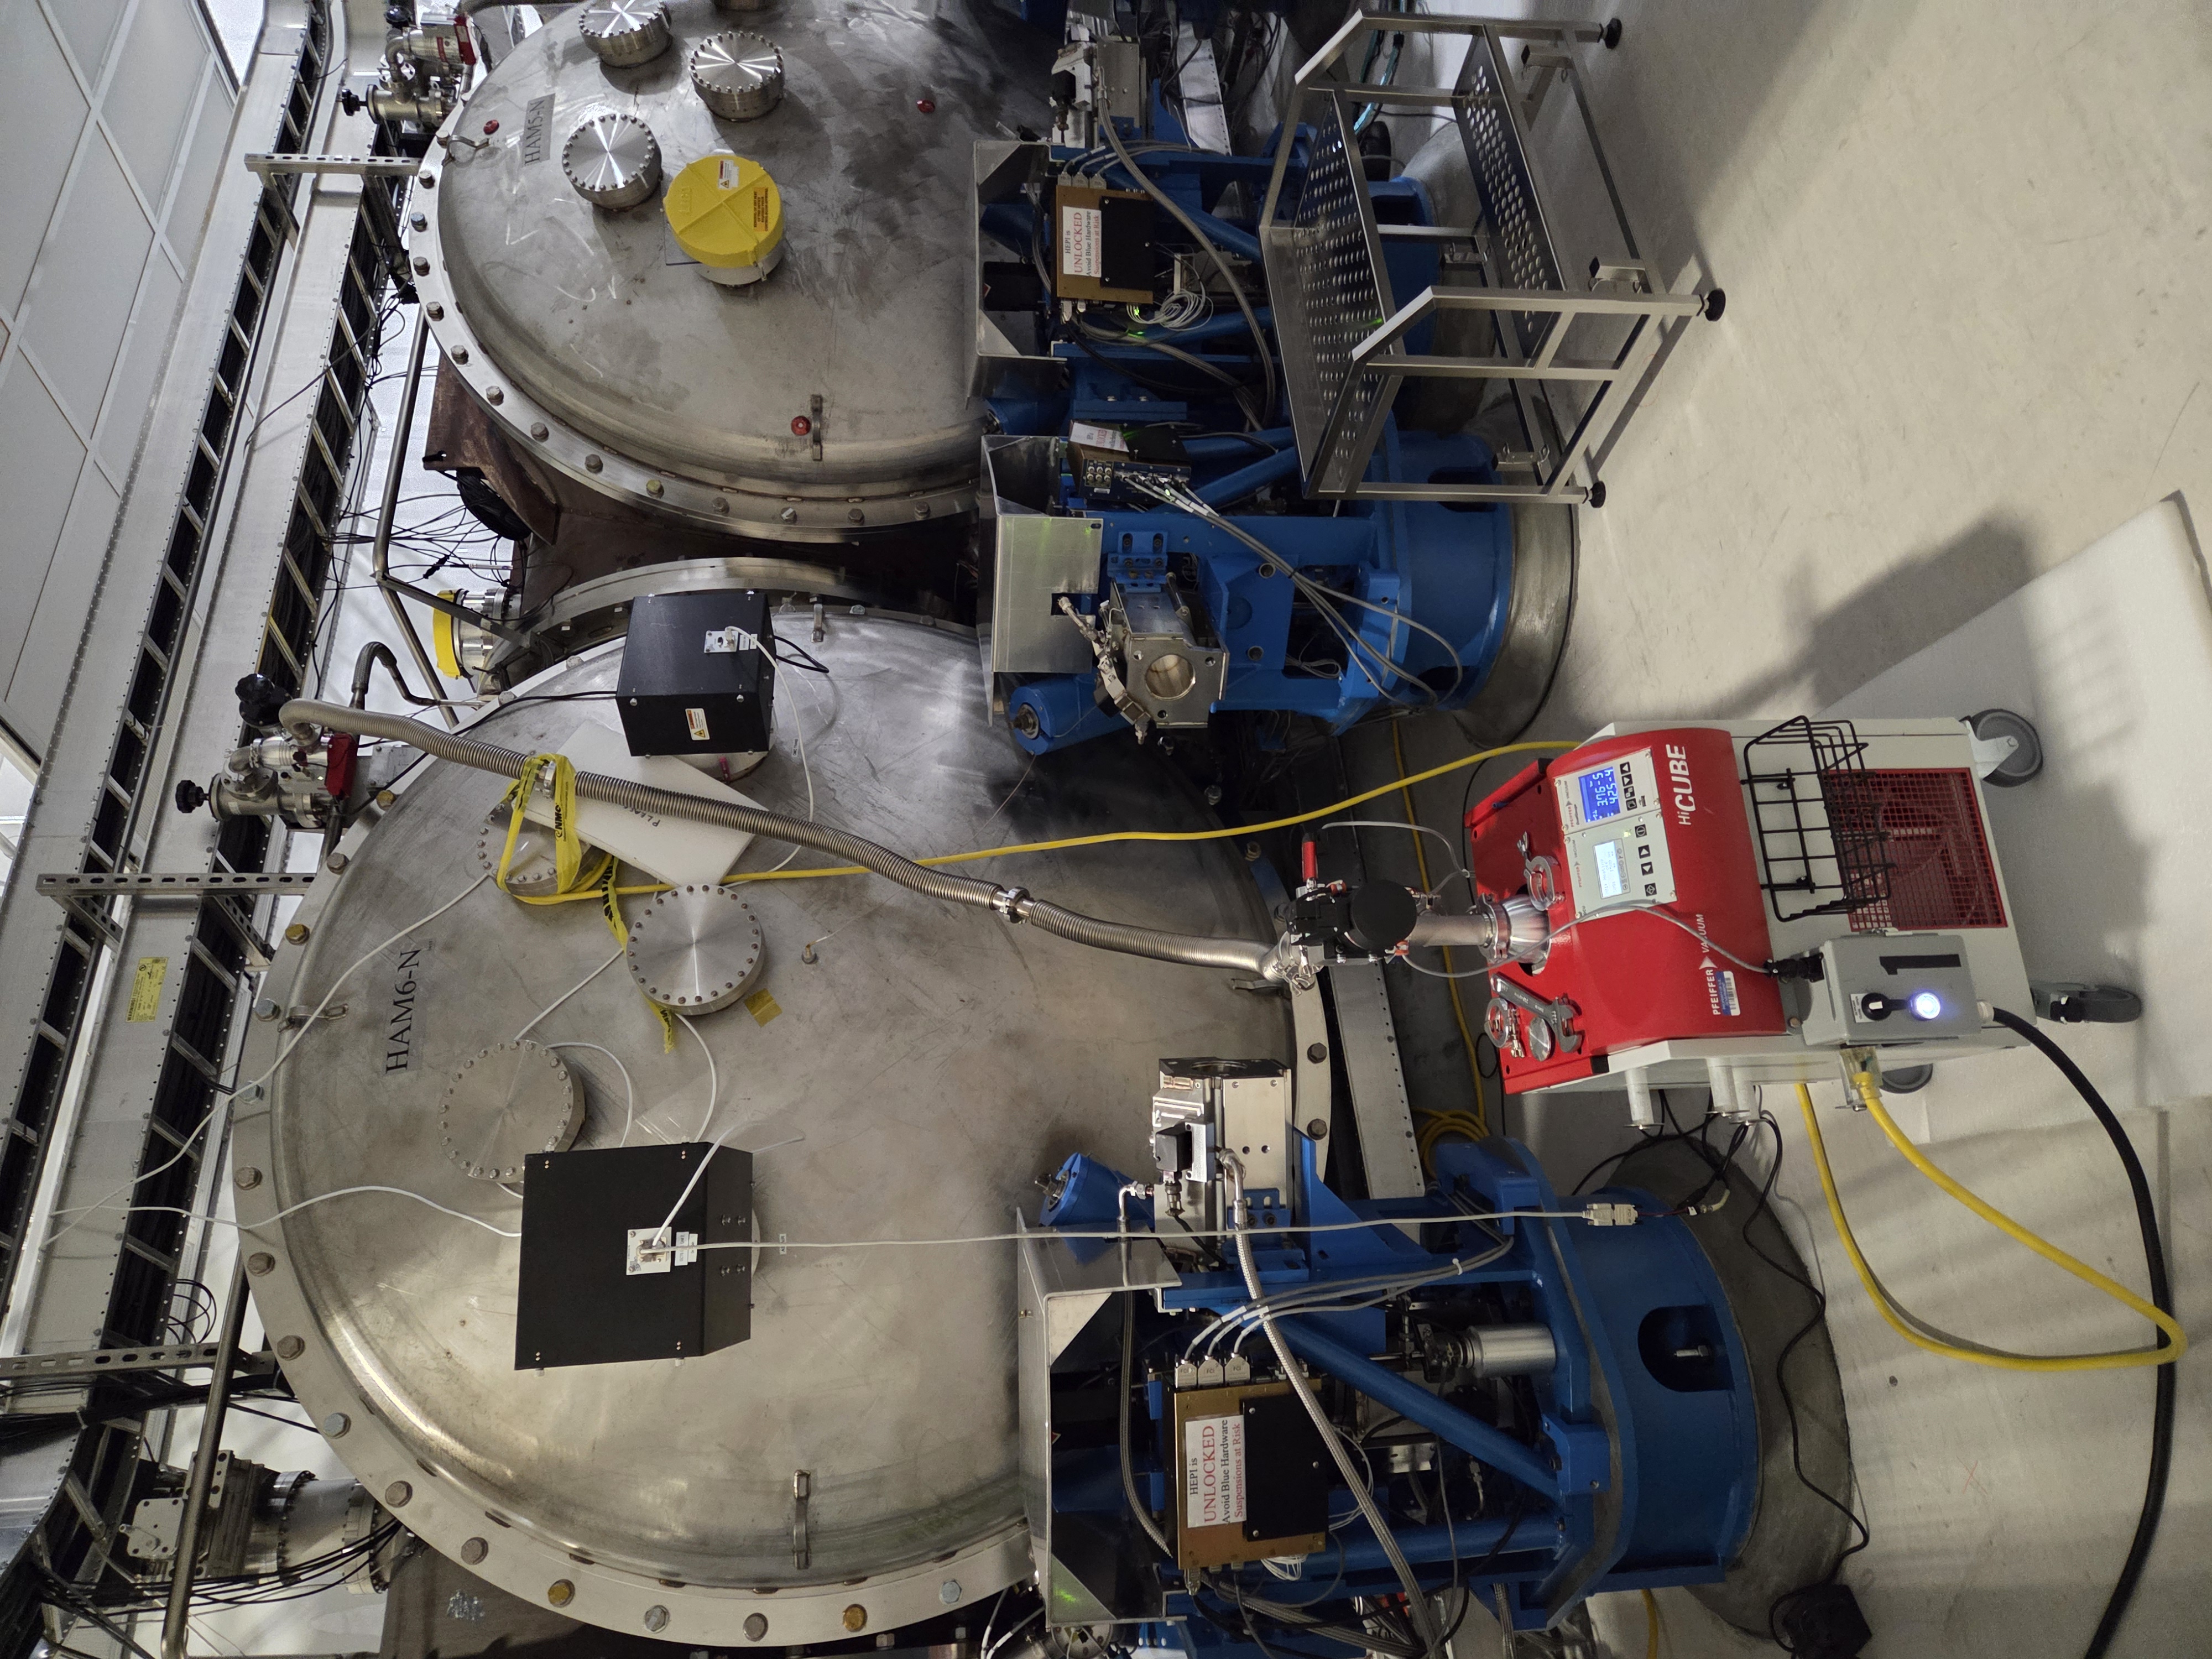
During Tuesday maintenance, we swapped the HAM6 AIP (Starcell). Note this annulus system is connected to HAM5 via the septum plate. We vented the lines with dry nitrogen and left a continuous nitrogen purge(~.3 psi) of the line during the pump swap. Nitrogen attached to HAM5 pump out port while HAM6 pump out port was left open to atmosphere.
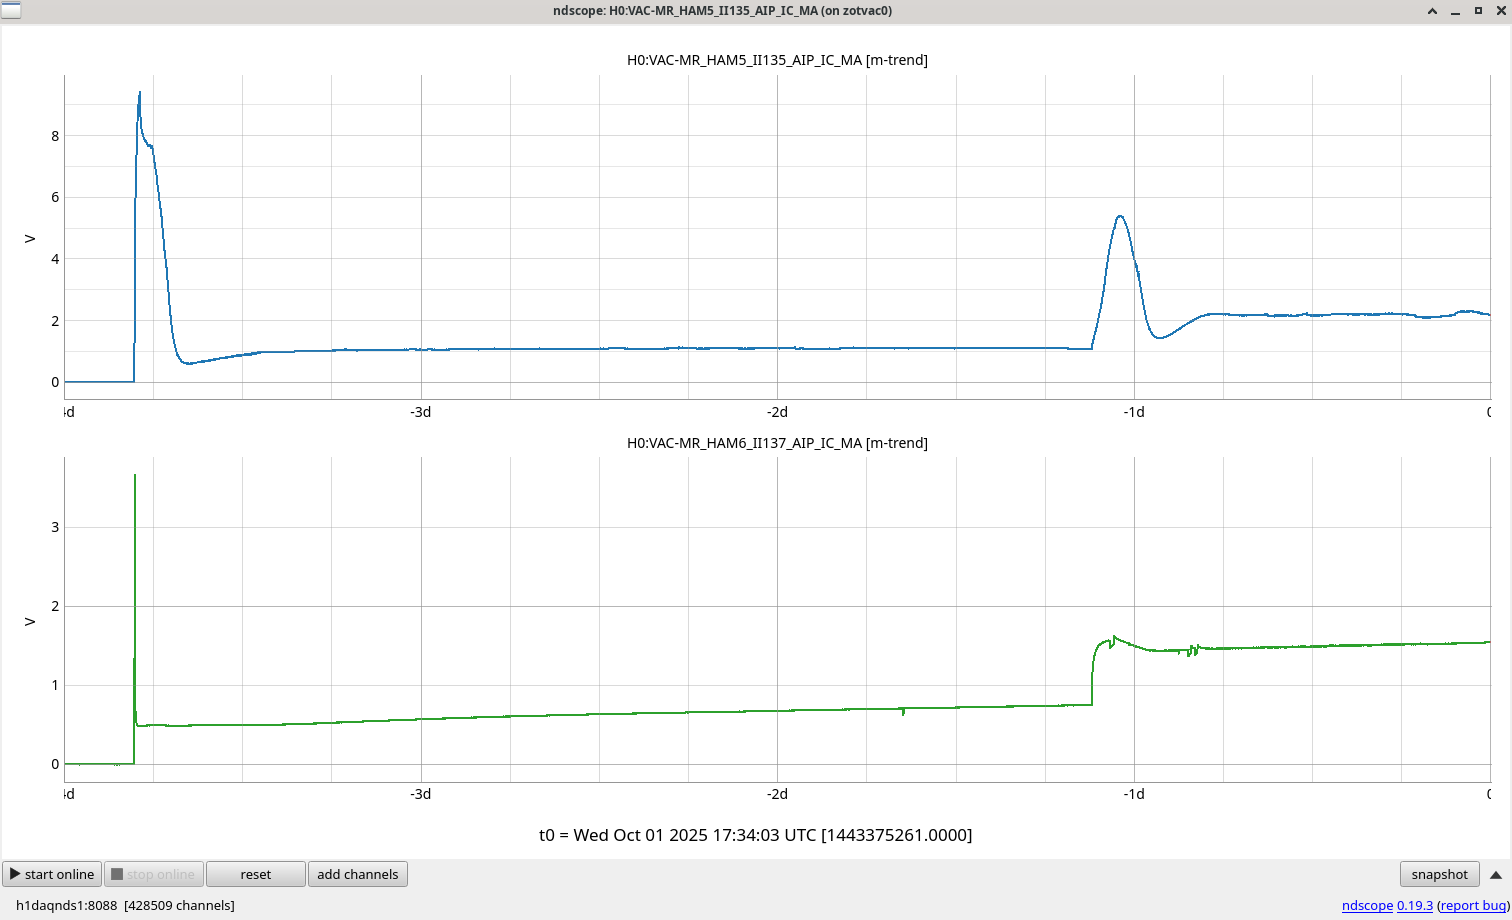
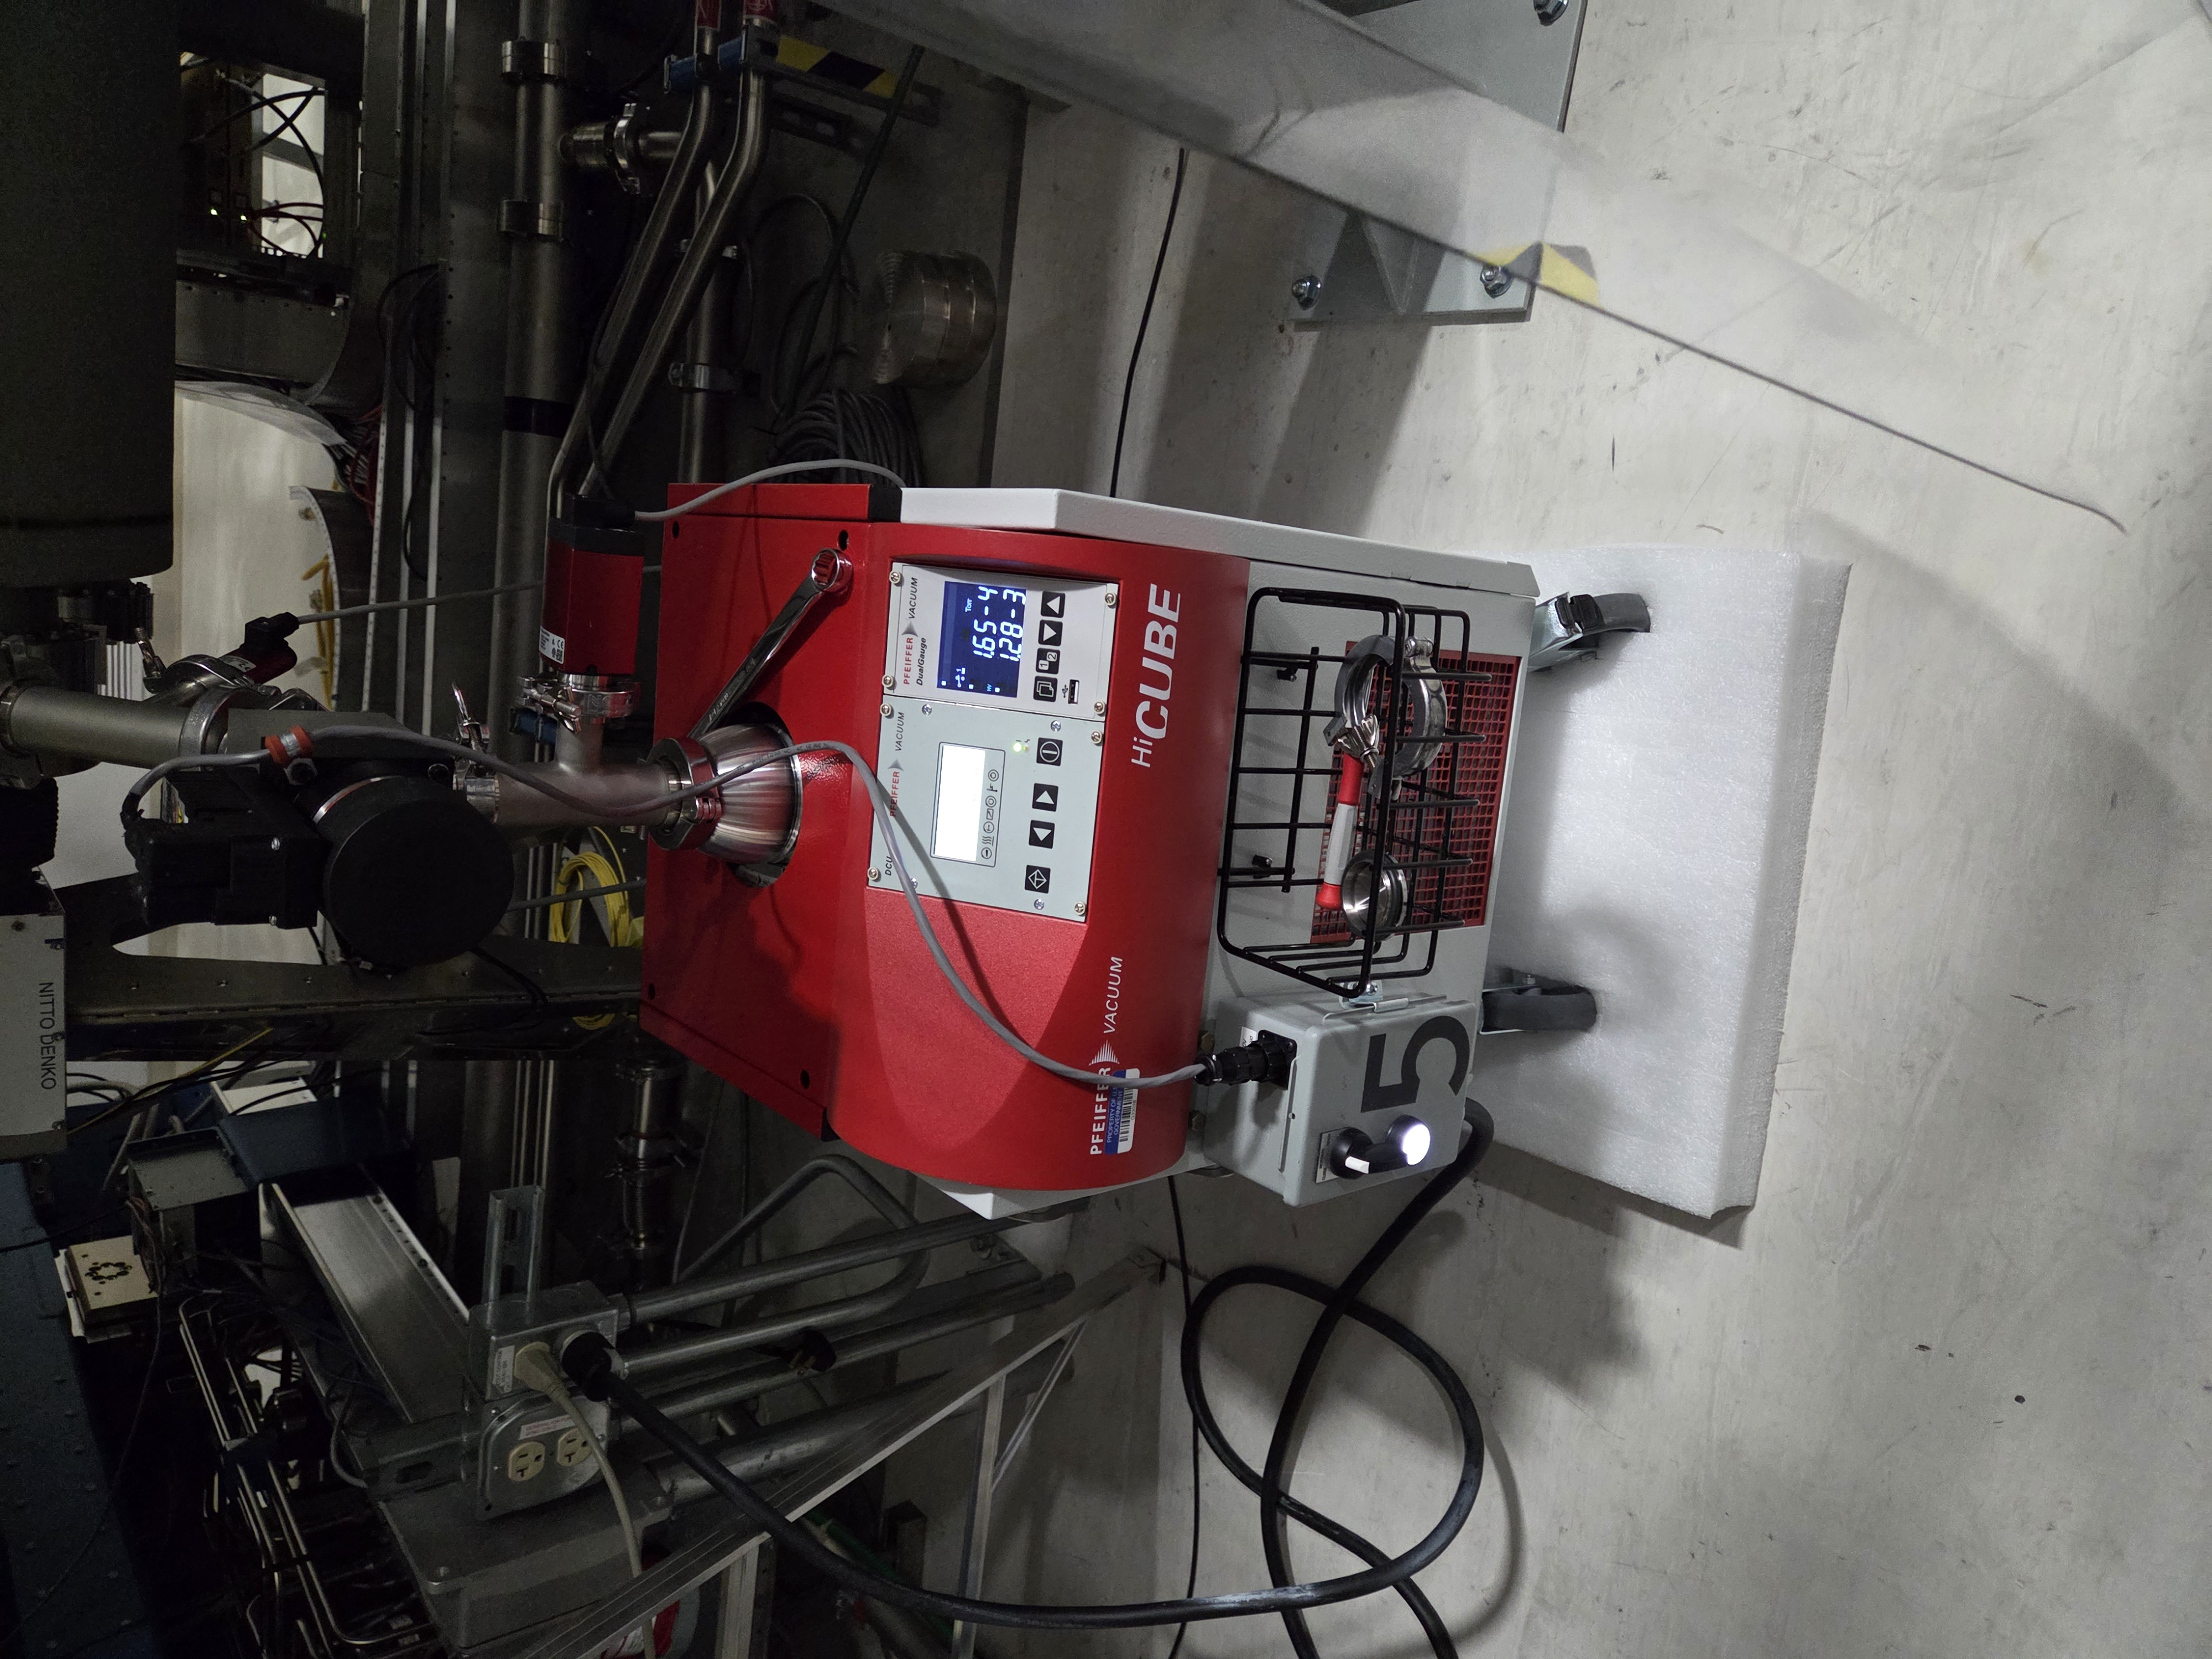
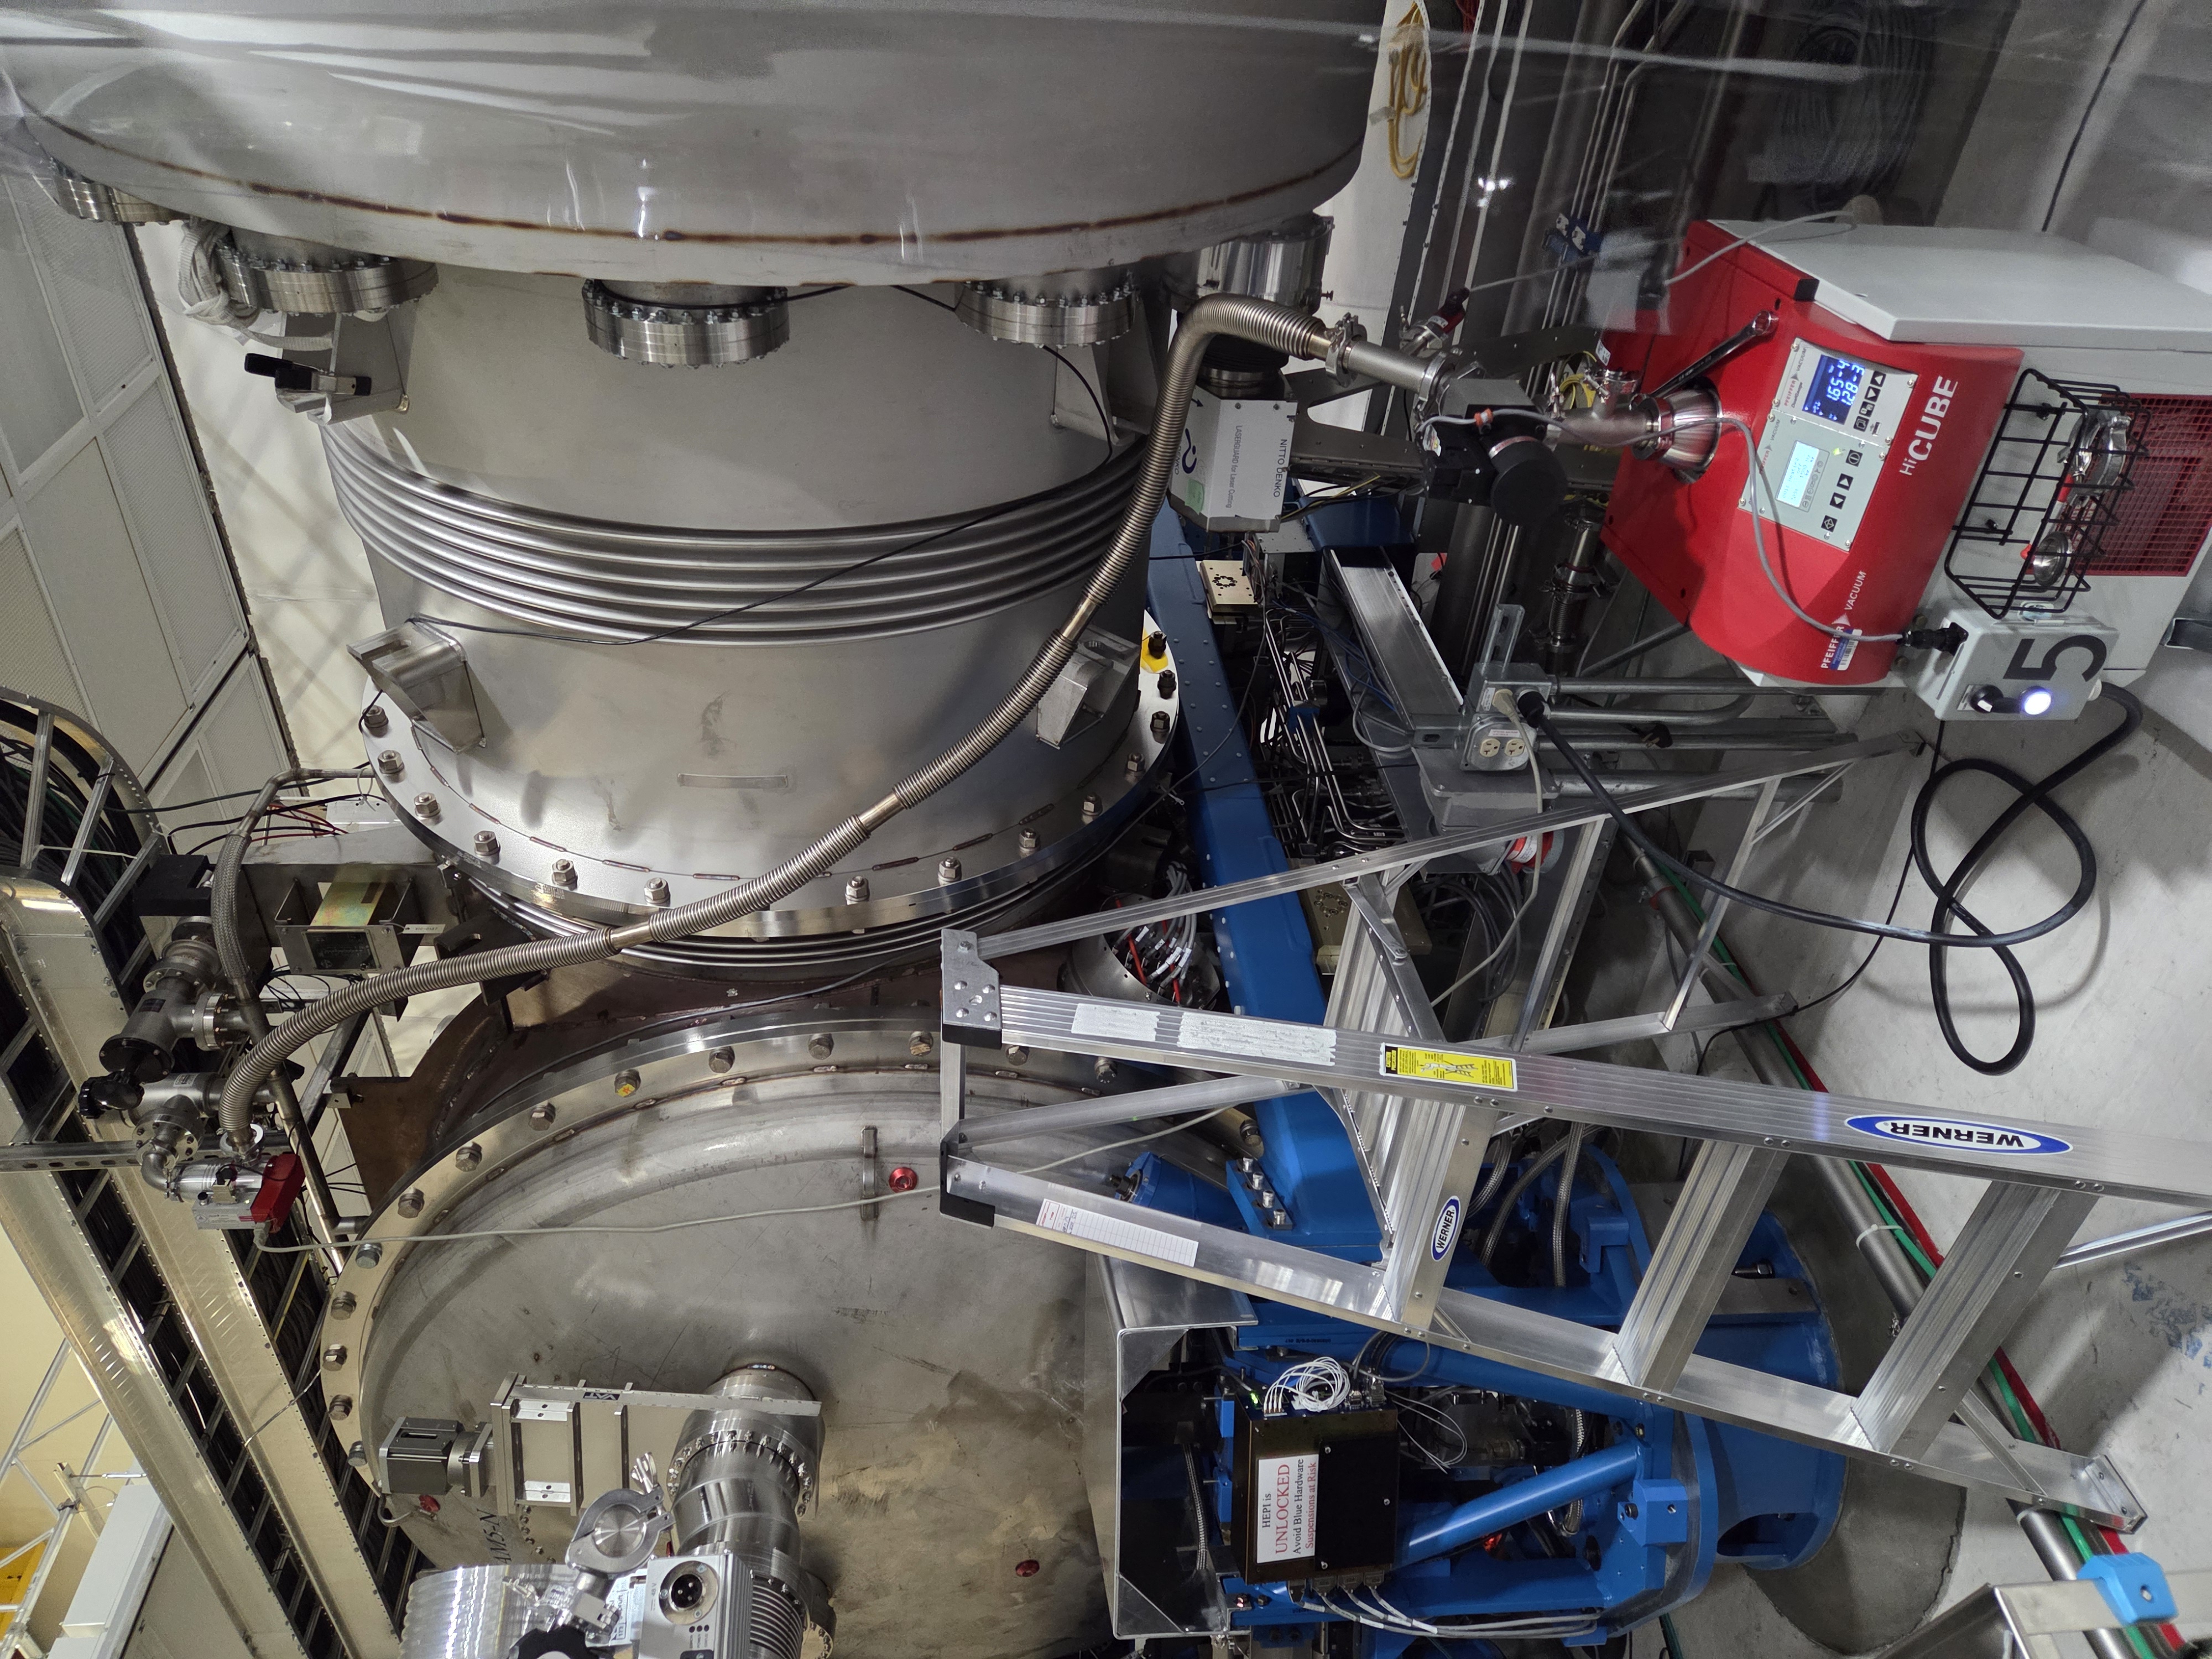
No issues during the swap, annulus system is now pumping at both HAM5 & 6 ports with an aux cart and turbo pair. As of end of maintenance, the HAM6 cart was at ~3E-5 Torr, HAM5 cart at ~1E-4 Torr. These pumps will continue running until pressure is <1E-5 Torr at which point the ion pumps will be powered on.
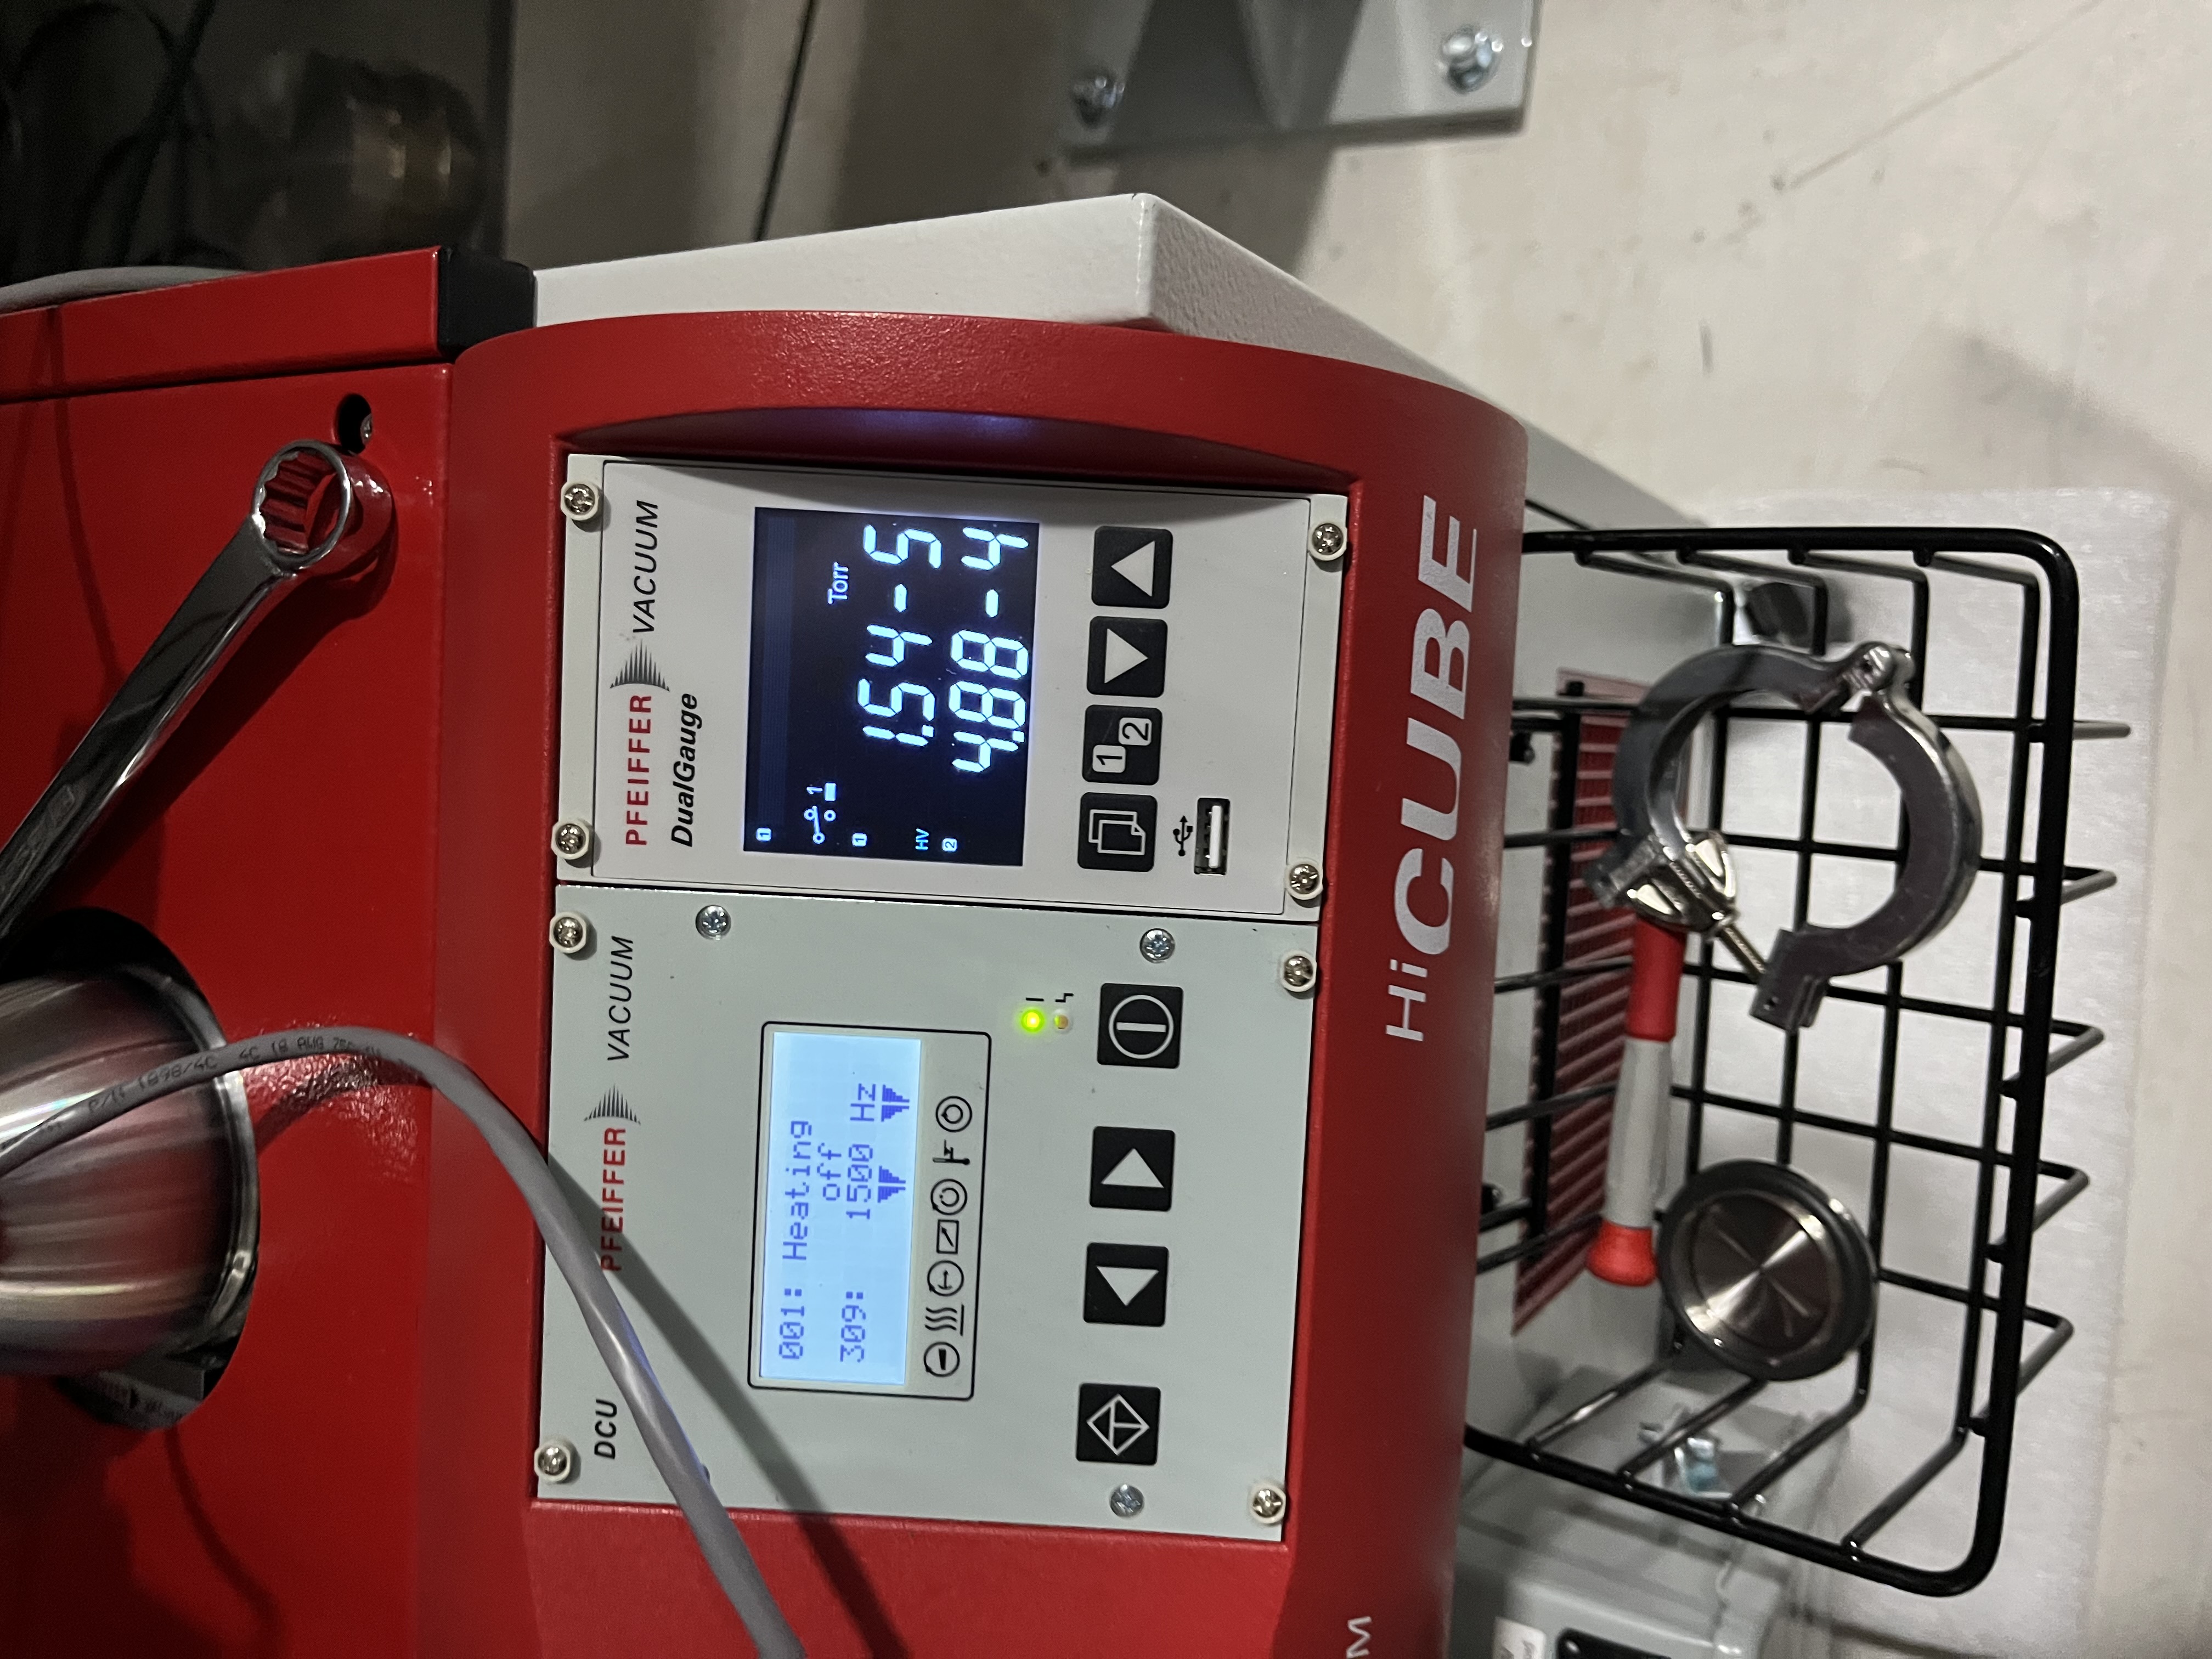
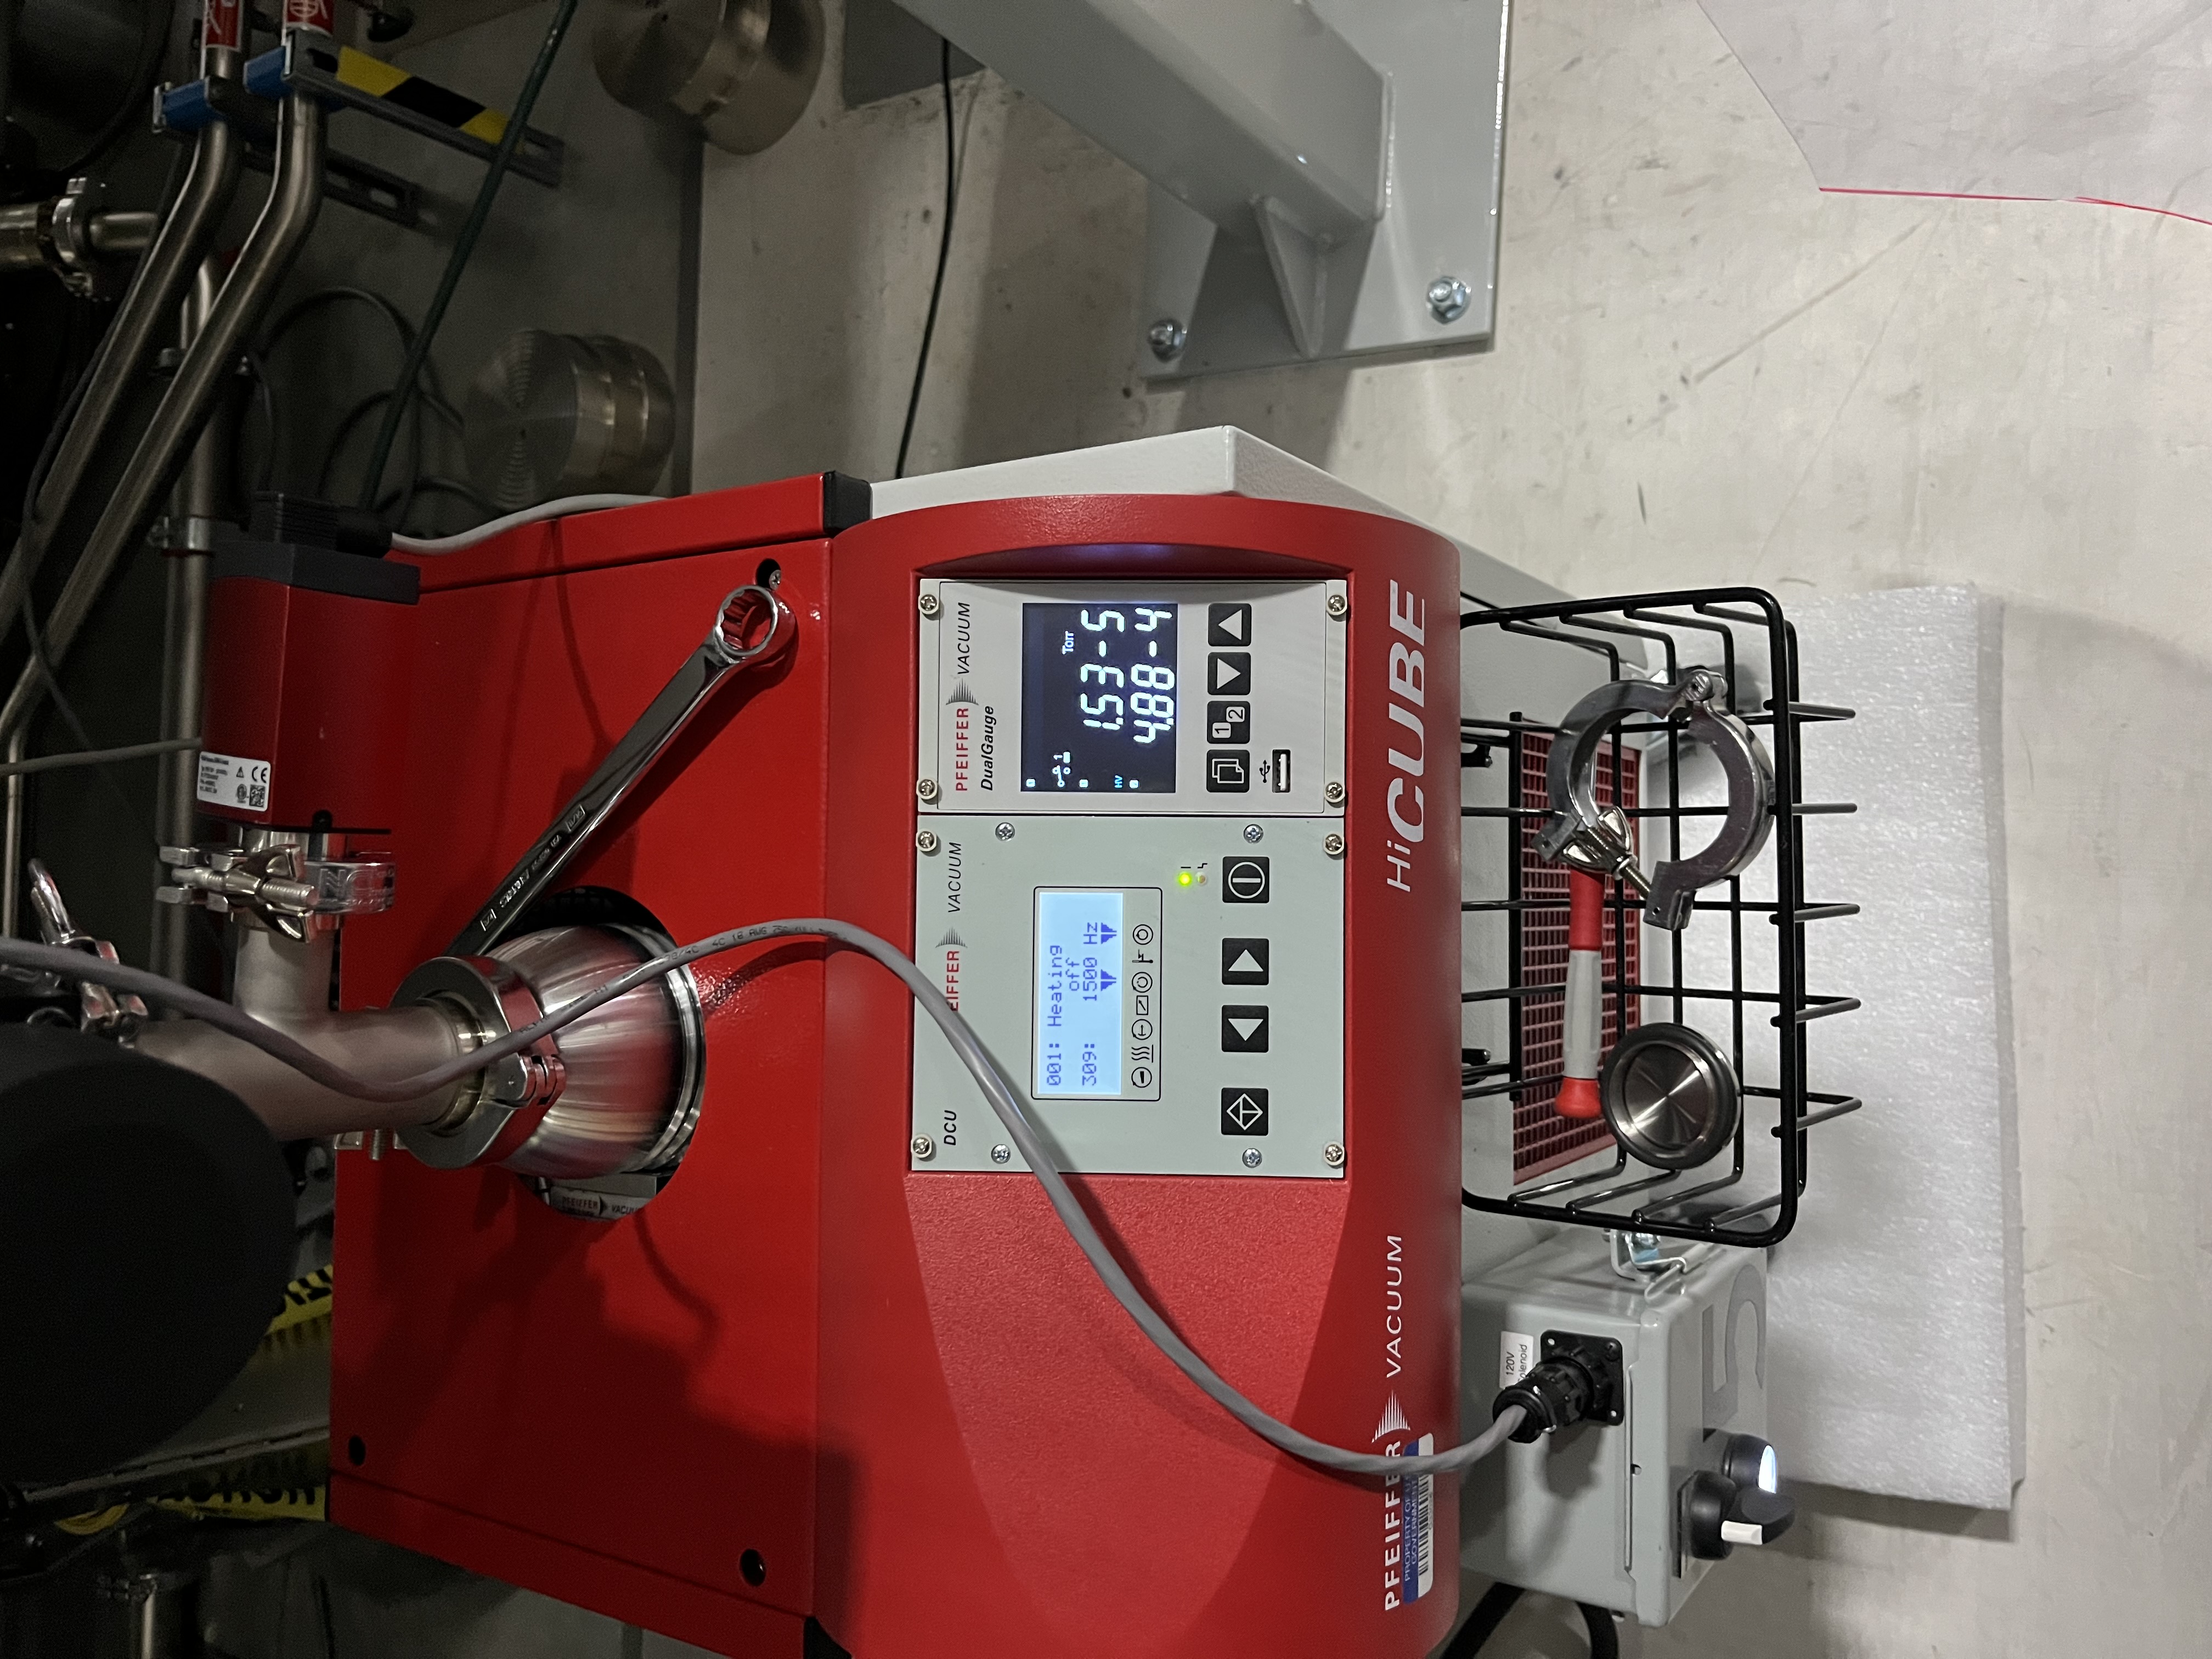
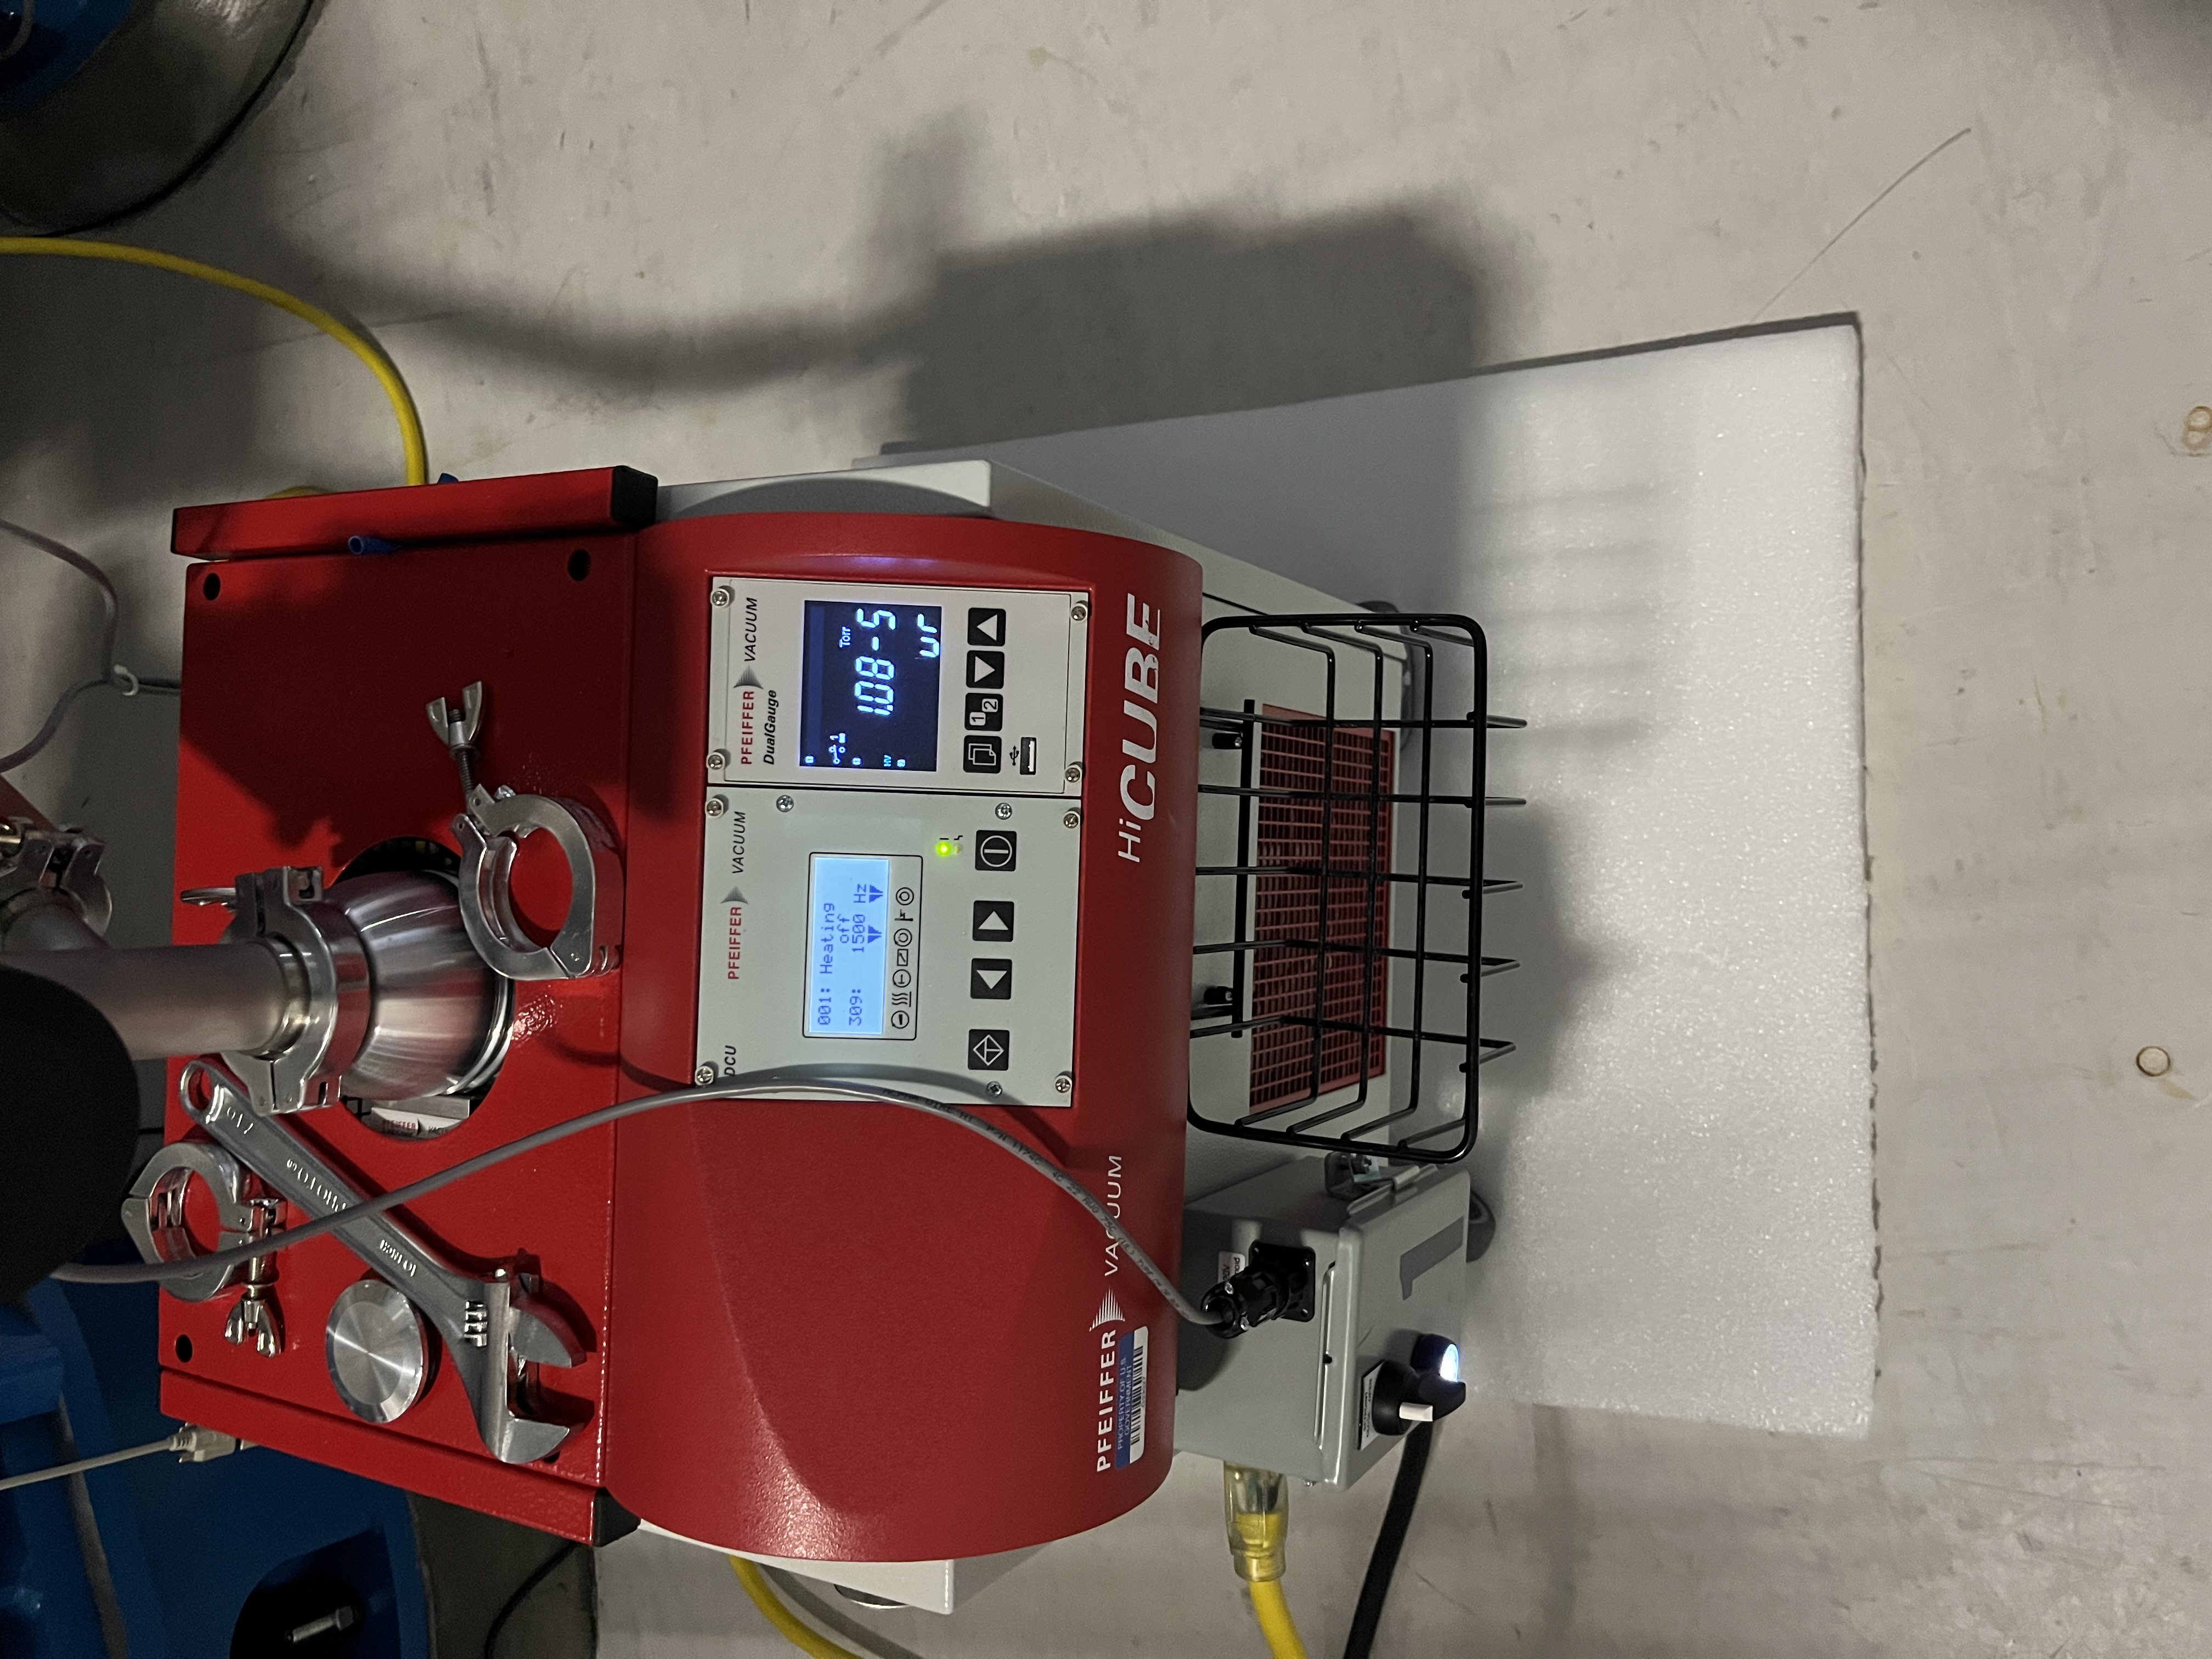
Carts are placed on foam for isolation, and a piece of foam between the flex hose running up to HAM6 pump out port and HAM6 chamber. See attached pictures.
Work permit will be closed once pumps are disconnected from chambers.
Update.
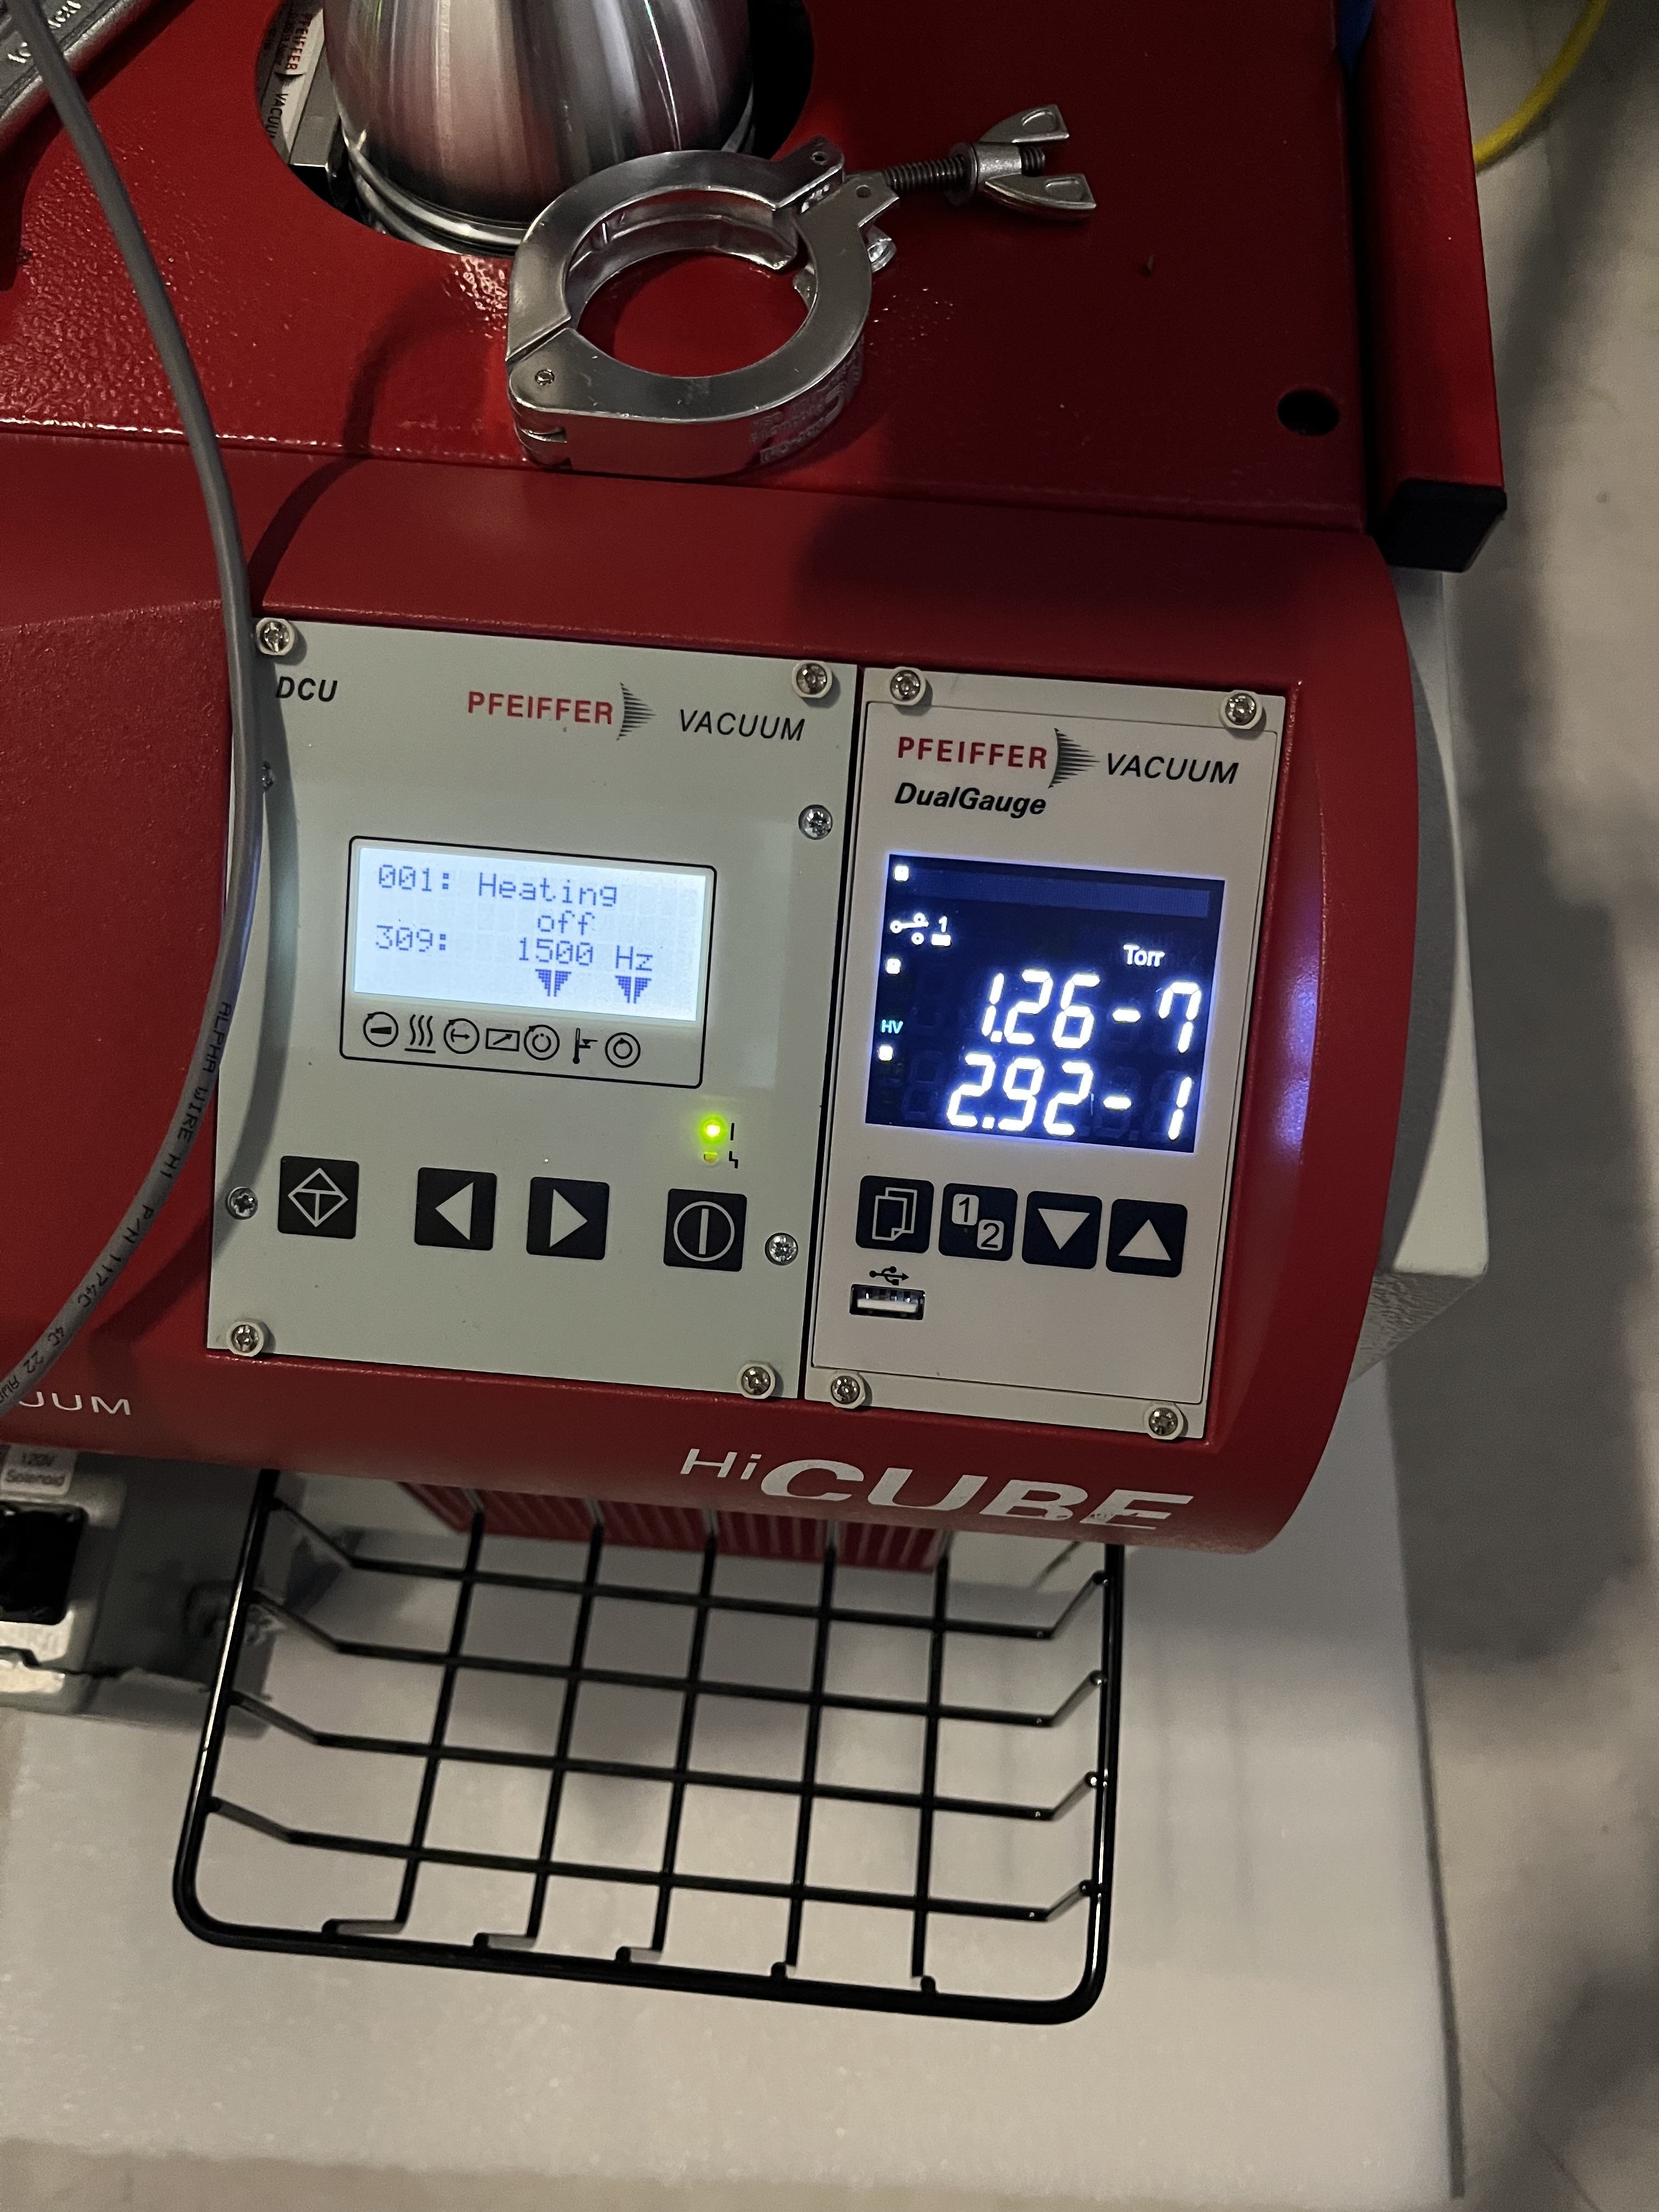
IFO was out of lock due to an earthquake, I went in to the LVEA to check on the aux-carts pumping down on the annuli for HAM5 and HAM6. HAM5 aux-cart was good and pumping down on the annulus, however HAM6 aux-cart safety valve somehow managed to trip between yesterday and today, time is unknown as of now, I restored aux cart, and opened the valve. Aux-cart for HAM6 was reporting a dubious pressure number of 1.26 x 10-07 Torr.
After restoring pumping to HAM6 annulus, both aux carts are reporting more believable numbers.
(Jordan, TJ, Gerardo)
Late entry.
TJ powered ON the ion pumps over the weekend, that allowed for the pumps to reach very good vacuum pressure on the shared annuli system, then on Tuesday morning, Jordan isolated the annuli system for HAM5 and HAM6 from the mechanical pumps and turned off the aux carts.
A couple of hours later we removed the small can turbos, flex hoses and aux carts from the HAM5/6 area, to conclude the replacement of the HAM5 annulus ion pump body.