Belated alog from Friday.
Summary:
After realigning IMC and IM2 on Thursday, we continued aligning IM3 to put the beam in front of the PRM to the nominal position, IM4 to set the beam position in front of PR2, and PRM so the beam retroreflects. IM1 was left untouched, so the only change in IM1-IM2 line is from the change in the IMC alignment.
Clipping on IM4 baffle (HA12) disappeared completely. Beam position on IFI output baffle looked OK. Beam position on IFI input baffle didn't change (as expected) and still looked OK. There are some mystery
We saw flashes on ASC REFL sensors but they were weak. We tried to center them using RMs but RM2 seems to rail in YAW.
| Before P, Y [urad] | After P, Y | difference P,Y | |
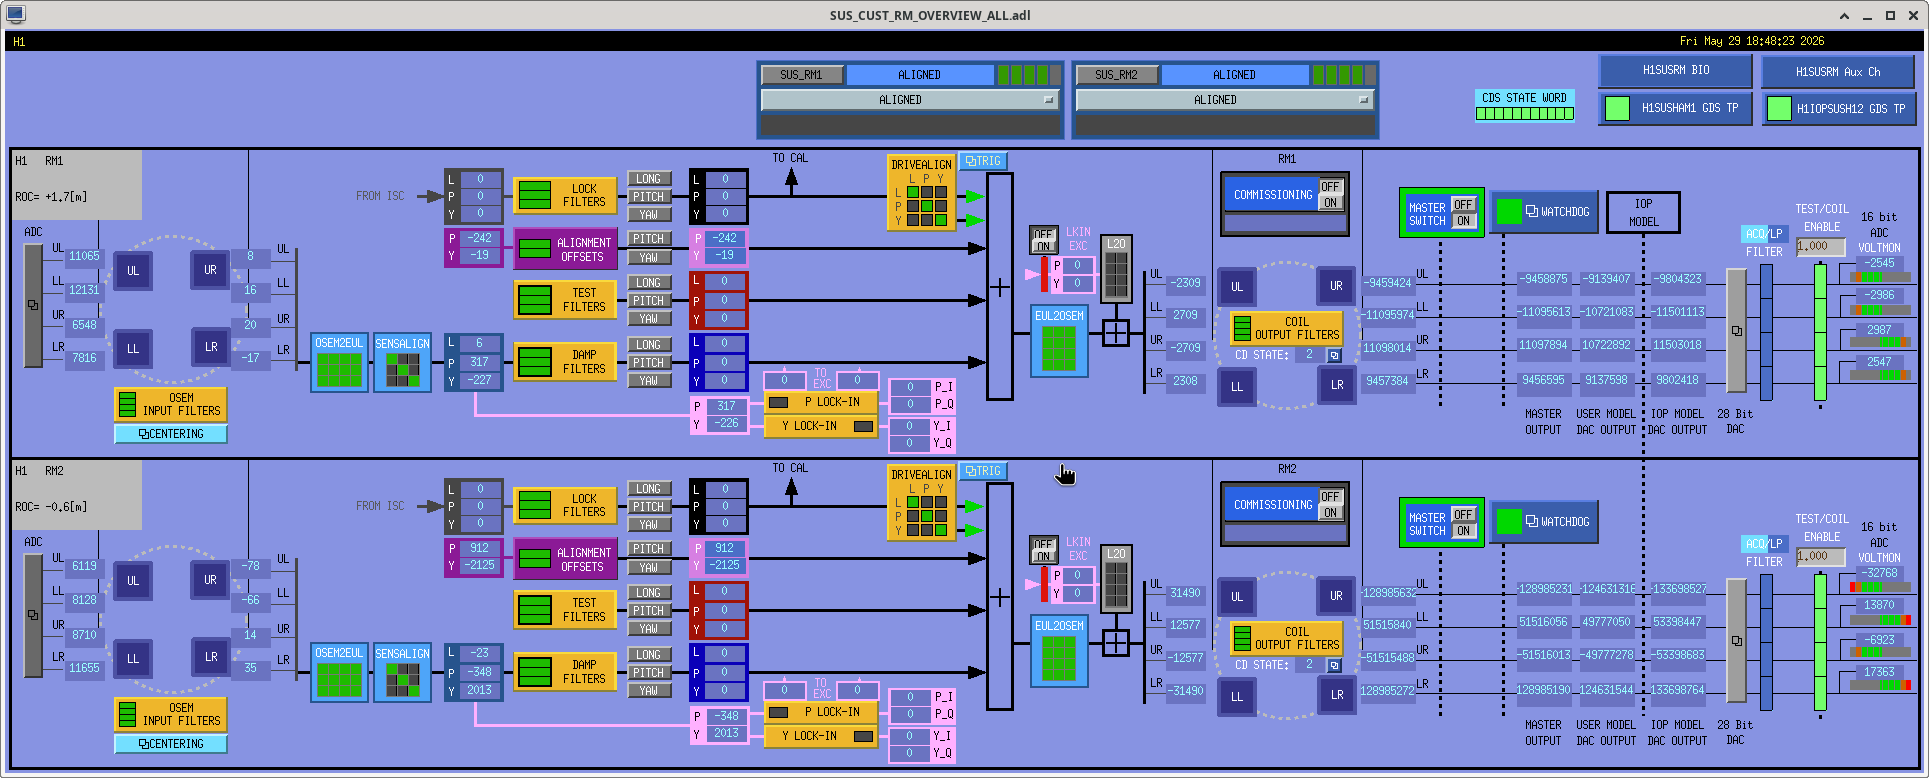
| RM1 | -196, 281.8 | -242, -19.3 | -46, -301.1 |
| RM2 | 910, 490 | 912.1, -2125.15 (railing) | +2.1, -2615.15 |
What to do:
Scan PRM to make sure that we're NOT looking at some kind of ghost beam on ASC REFL sensors.
Assuming that we're looking at the real beam on REFL sensors, we can do either (or some of) these:
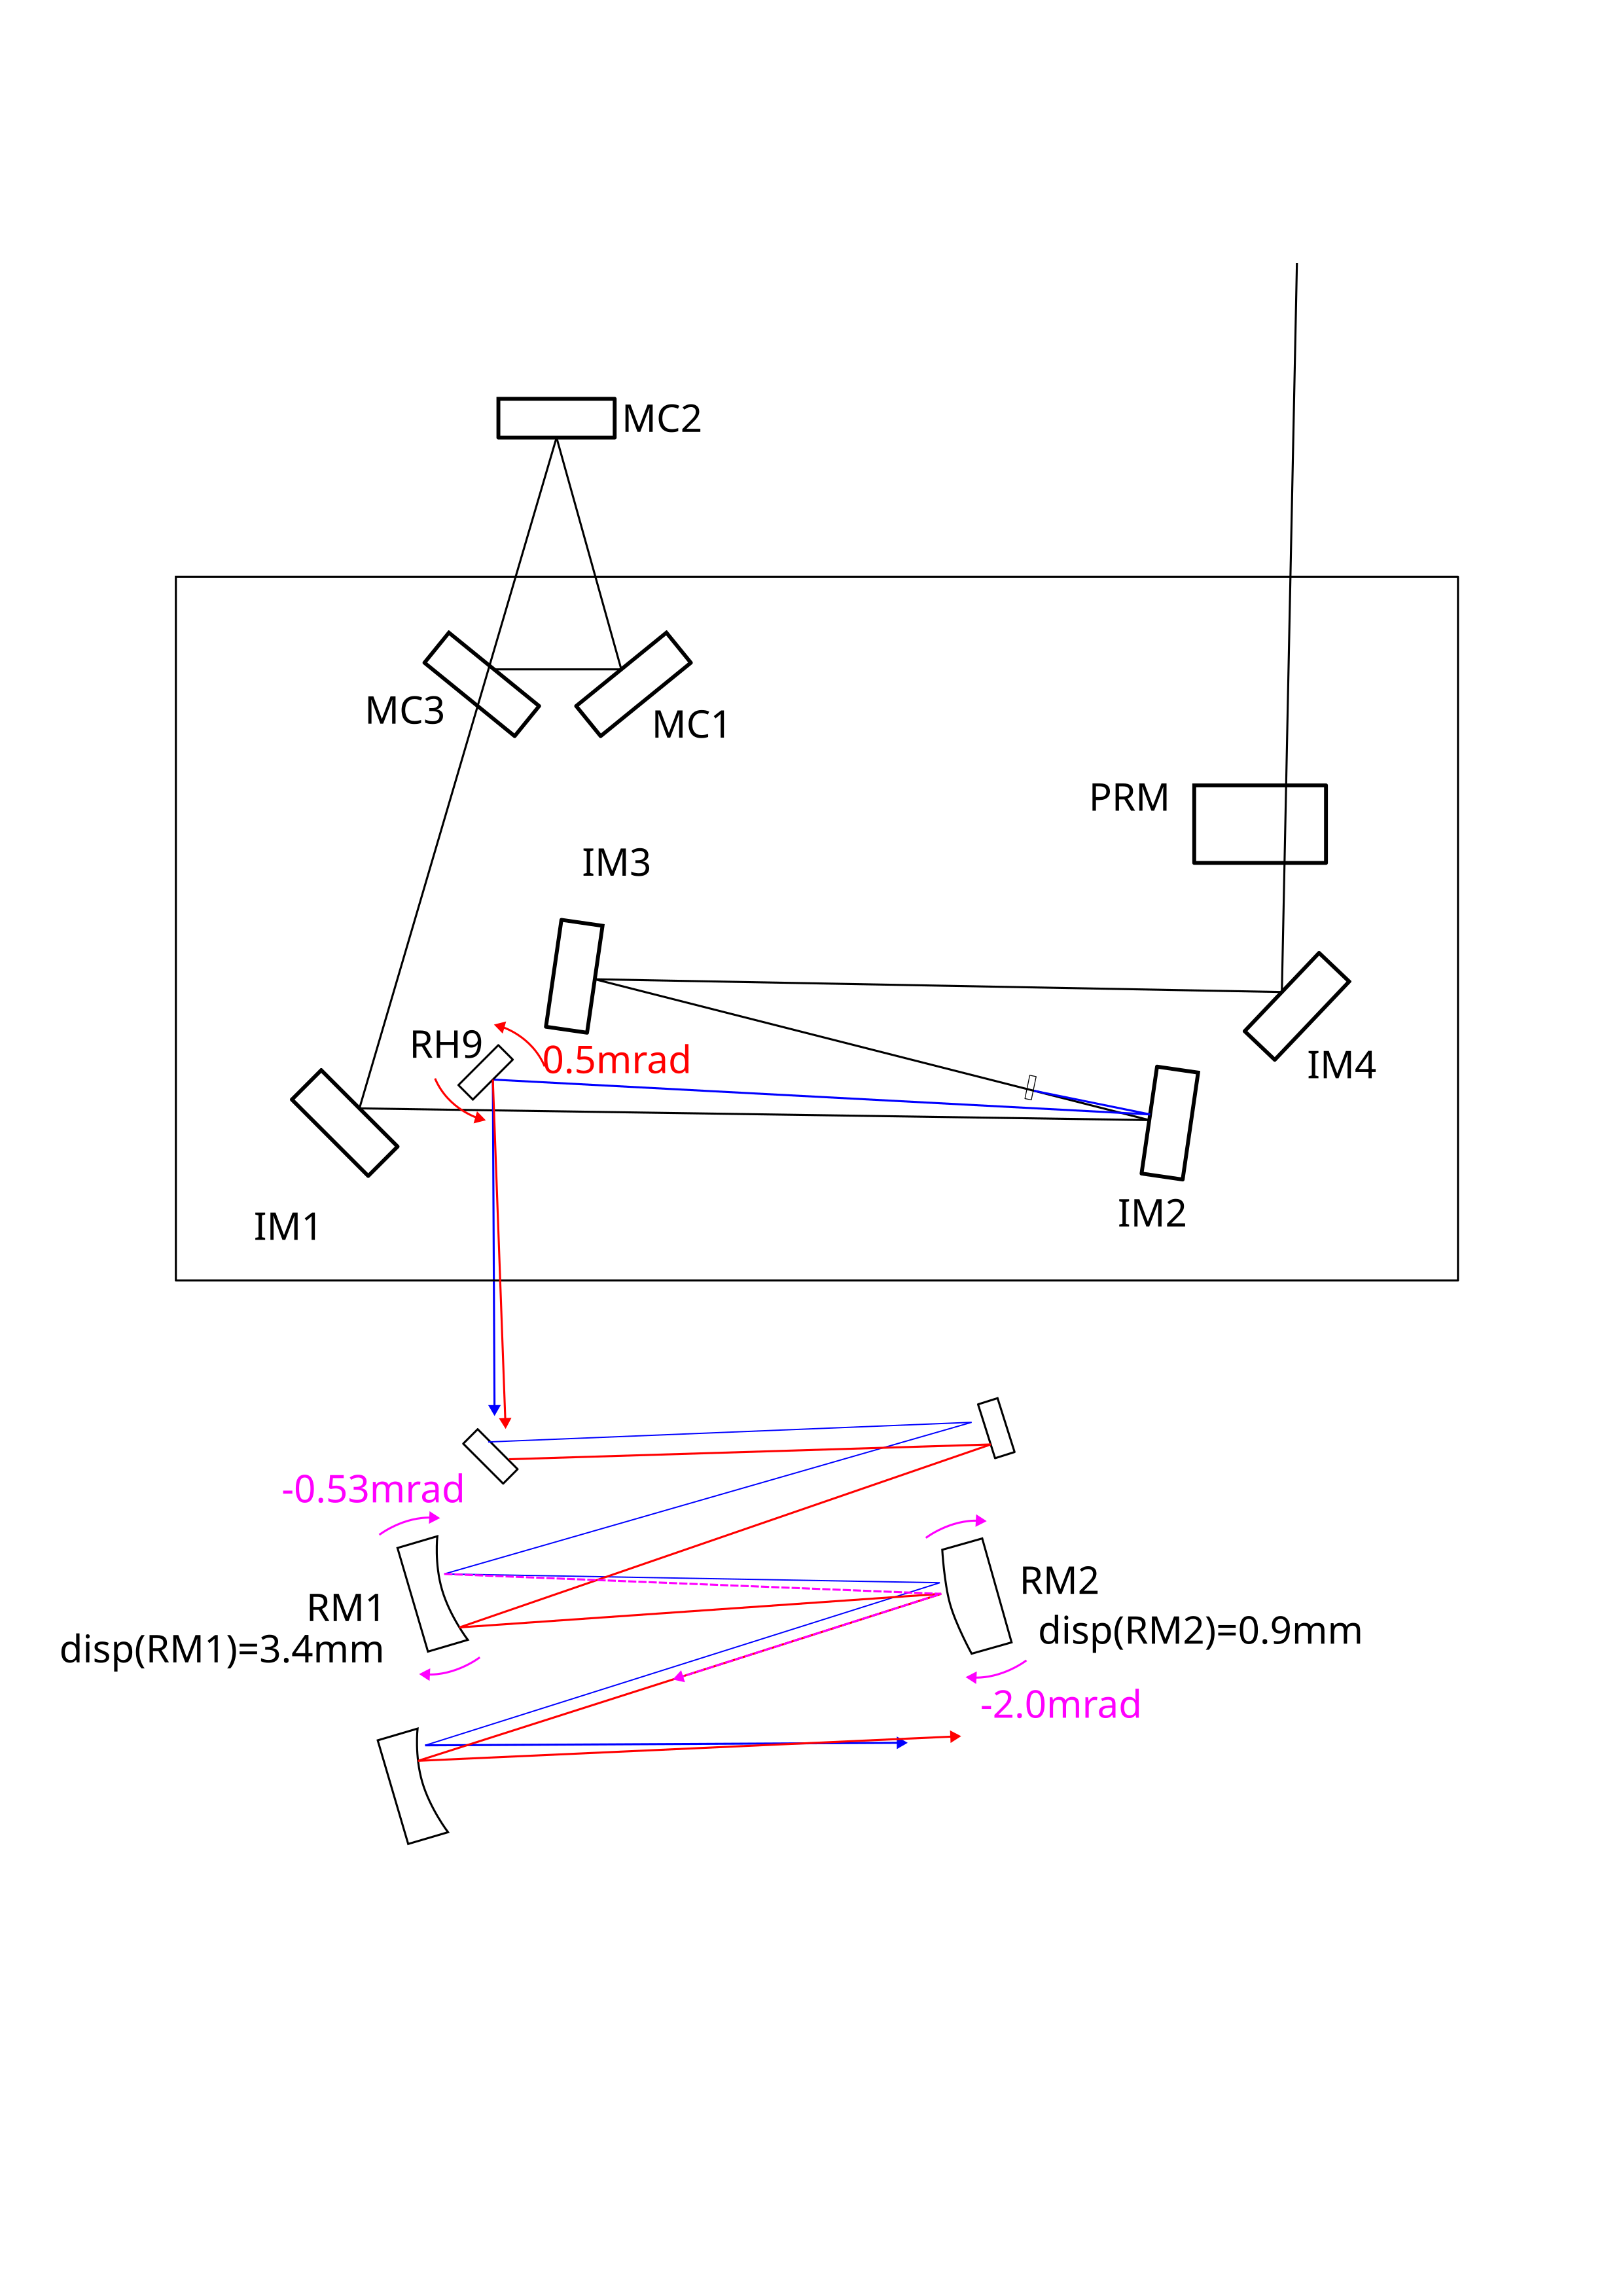
- Relieve RM2 by rotating RH9 (the fixed IFO refl pick off mirror in HAM2) by positive 500urad or so in YAW. This is the equivalent of the combination of negative 0.53 mrad for RM1 and negative 2mrad for RM2 in YAW. After doing this we can add 530urad to RM1 and 2000urad and continue centering from there. See attached cartoon (doesn't scale but the sign of things is correct) and the script.
- IM1 is almost degenerate as RH9 as far as relieving RM1 and RM2 is concerned, so we can rotate IM1 by negative 500urad or so in YAW. This requires that we tweak IM3, IM4 and PRM again but has an added benefit of moving the beam spot on the IFI input baffle closer to the center. See IM1rotation.png.
- If you aren't sure how IM1 rotation is translated to the IFO refl beam, IM1rotation_straightened.png is a simplified and unfolded version. The beam going out of IM1 goes through CWP at the IFI input (deflected but it's not written in the cartoon for simplicity), is retroreflected and comes back to CWP and defflected, the deflection for the REFL beam is depicted here. Without IM1 rotation the beam goes along the black path. With IM1 rotation (red path), the red refl beam converges with the black refl beam where the distance from the conversion point to the CWP is equal to that from the IM1 to CWP. The angle change of REFL is the same with the input and the lateral displacement of red refl relative to black is ~(distance(IM1_CWP)-distance(RH9_CWP))*angle_change.
- Make the OSEM coil driver output impedance smaller for RMs to gain more range. 1.2k to 500 Ohm should be safe.


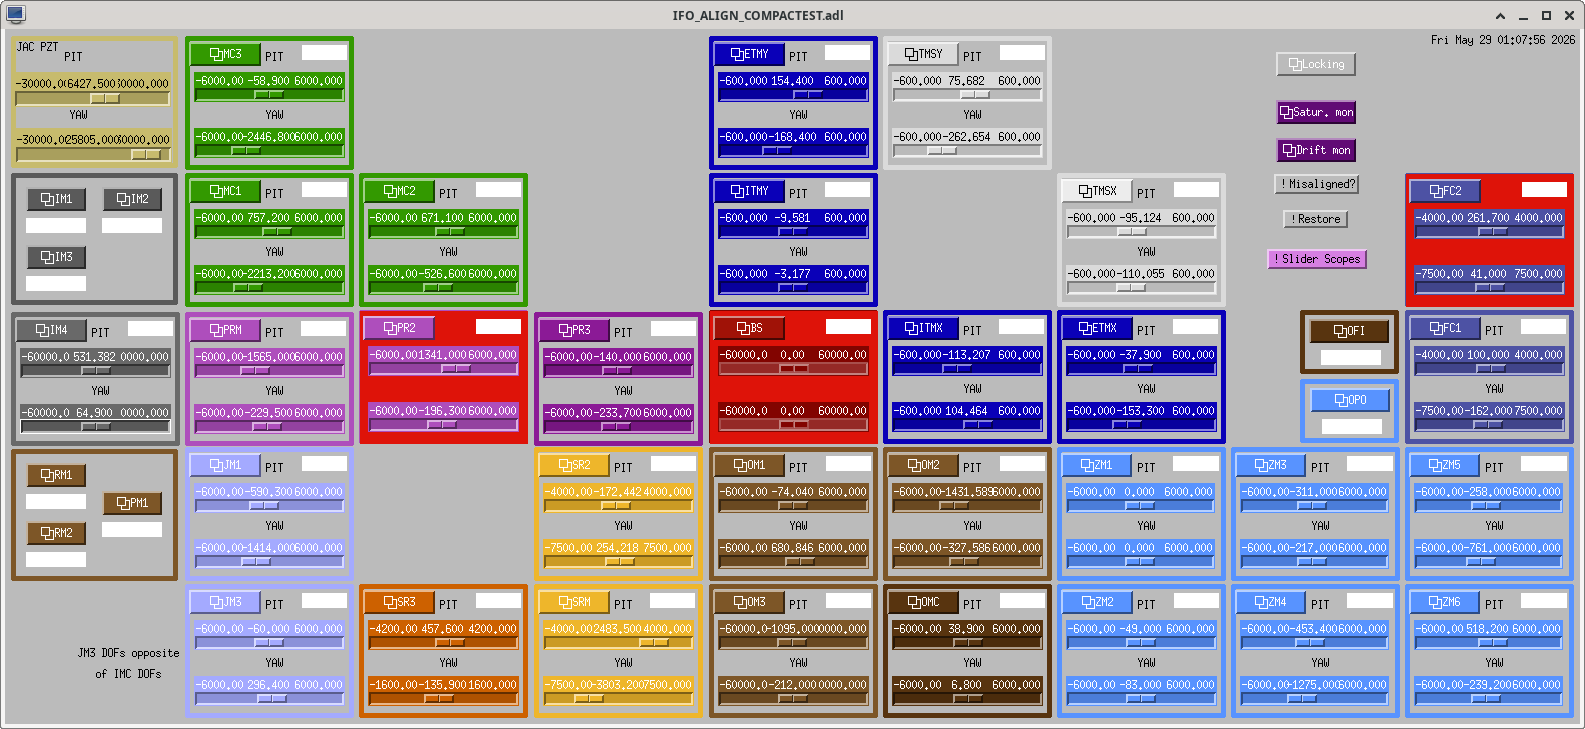
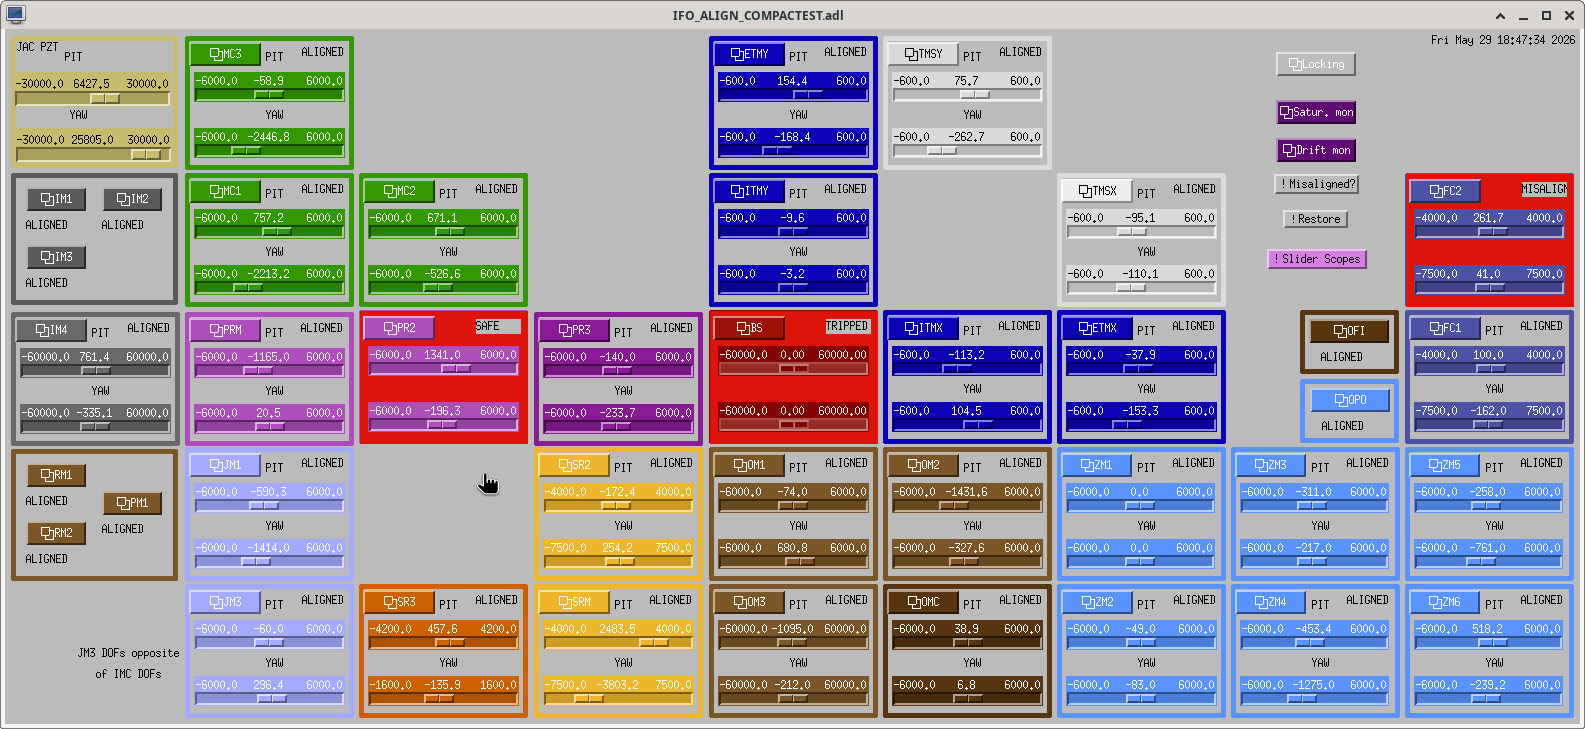
See screenshot for before/after slider values for RM, IM and other optics.


Baffle pictures. Whenever appropriate, there are two pictures (one to access PIT and the other to access YAW) to avoid the parallax problem as the thickness of the baffles cannot be ignored.
IFO REFL looks good on the IFO REFL baffle (HA13) in front of the HAM2-HAM1 septum window (IFO_REFL_HA13.jpg).
IM4 baffle (HA12) is good in PIT (IM4_HA12_PIT_good.jpg), not great in YAW but is OK (IM4_HA12_YAW_OFF.jpg). Next time I'll take a picture through IM4 to show you it's quite acceptable than it looks from these pictures.
IR picture of the IM4 baffle (HA12) shot from IM3 side shows a ghost beam it catches when there's a flash (IM4_HA12_ghostbeam.jpg). Circled in red is the ghost beam (in this case it was 10 mode flash). Circled in green are things that are always visible (IM4_HA12_noflash.jpg) and aren't the ghost beam.
IFI input beam position is great in PIT, not great in YAW (IFI_INPUT_PIT_GREAT_YAW_OFF.jpg, IFI_INPUT_PIT_GREAT.jpg).
However, I still see some kind of clipping of bacdkward-going beam once in a while. See the IR photo shot from IM3 direction IFI_INPUT_clipping.jpg. You're looking at the baffle aperture through calcite wedge from the direction of IM1. Compare with IFI_INPUT_noflash.jpg where there was no flashing.
Not every flash shows this clipping-like thing, it seems to happen less frequently than the flashing.
To make things more confusing, there's a reflection of something shiny in IFI and the edge of that shiny thing is almost on top of the edge of the IFI input baffle aperture so it's hard to say what's going on. Nothing like this was visible on the input side facing IM2.
We temporarily moved IM1 to move the beam spot on IM2 more centered (IFI_INPUT_IM1movedtocenter.jpg) and I can see something closer to the center (probably scattering from the CWP?) but no clipping. So probably it's a good thing to move IM1 counter-clockwise as I indicated in the alog above. We cannot do it too much as we rail RM2 in the opposite direction, but we can probably move the beam by a mm or so on IM2.