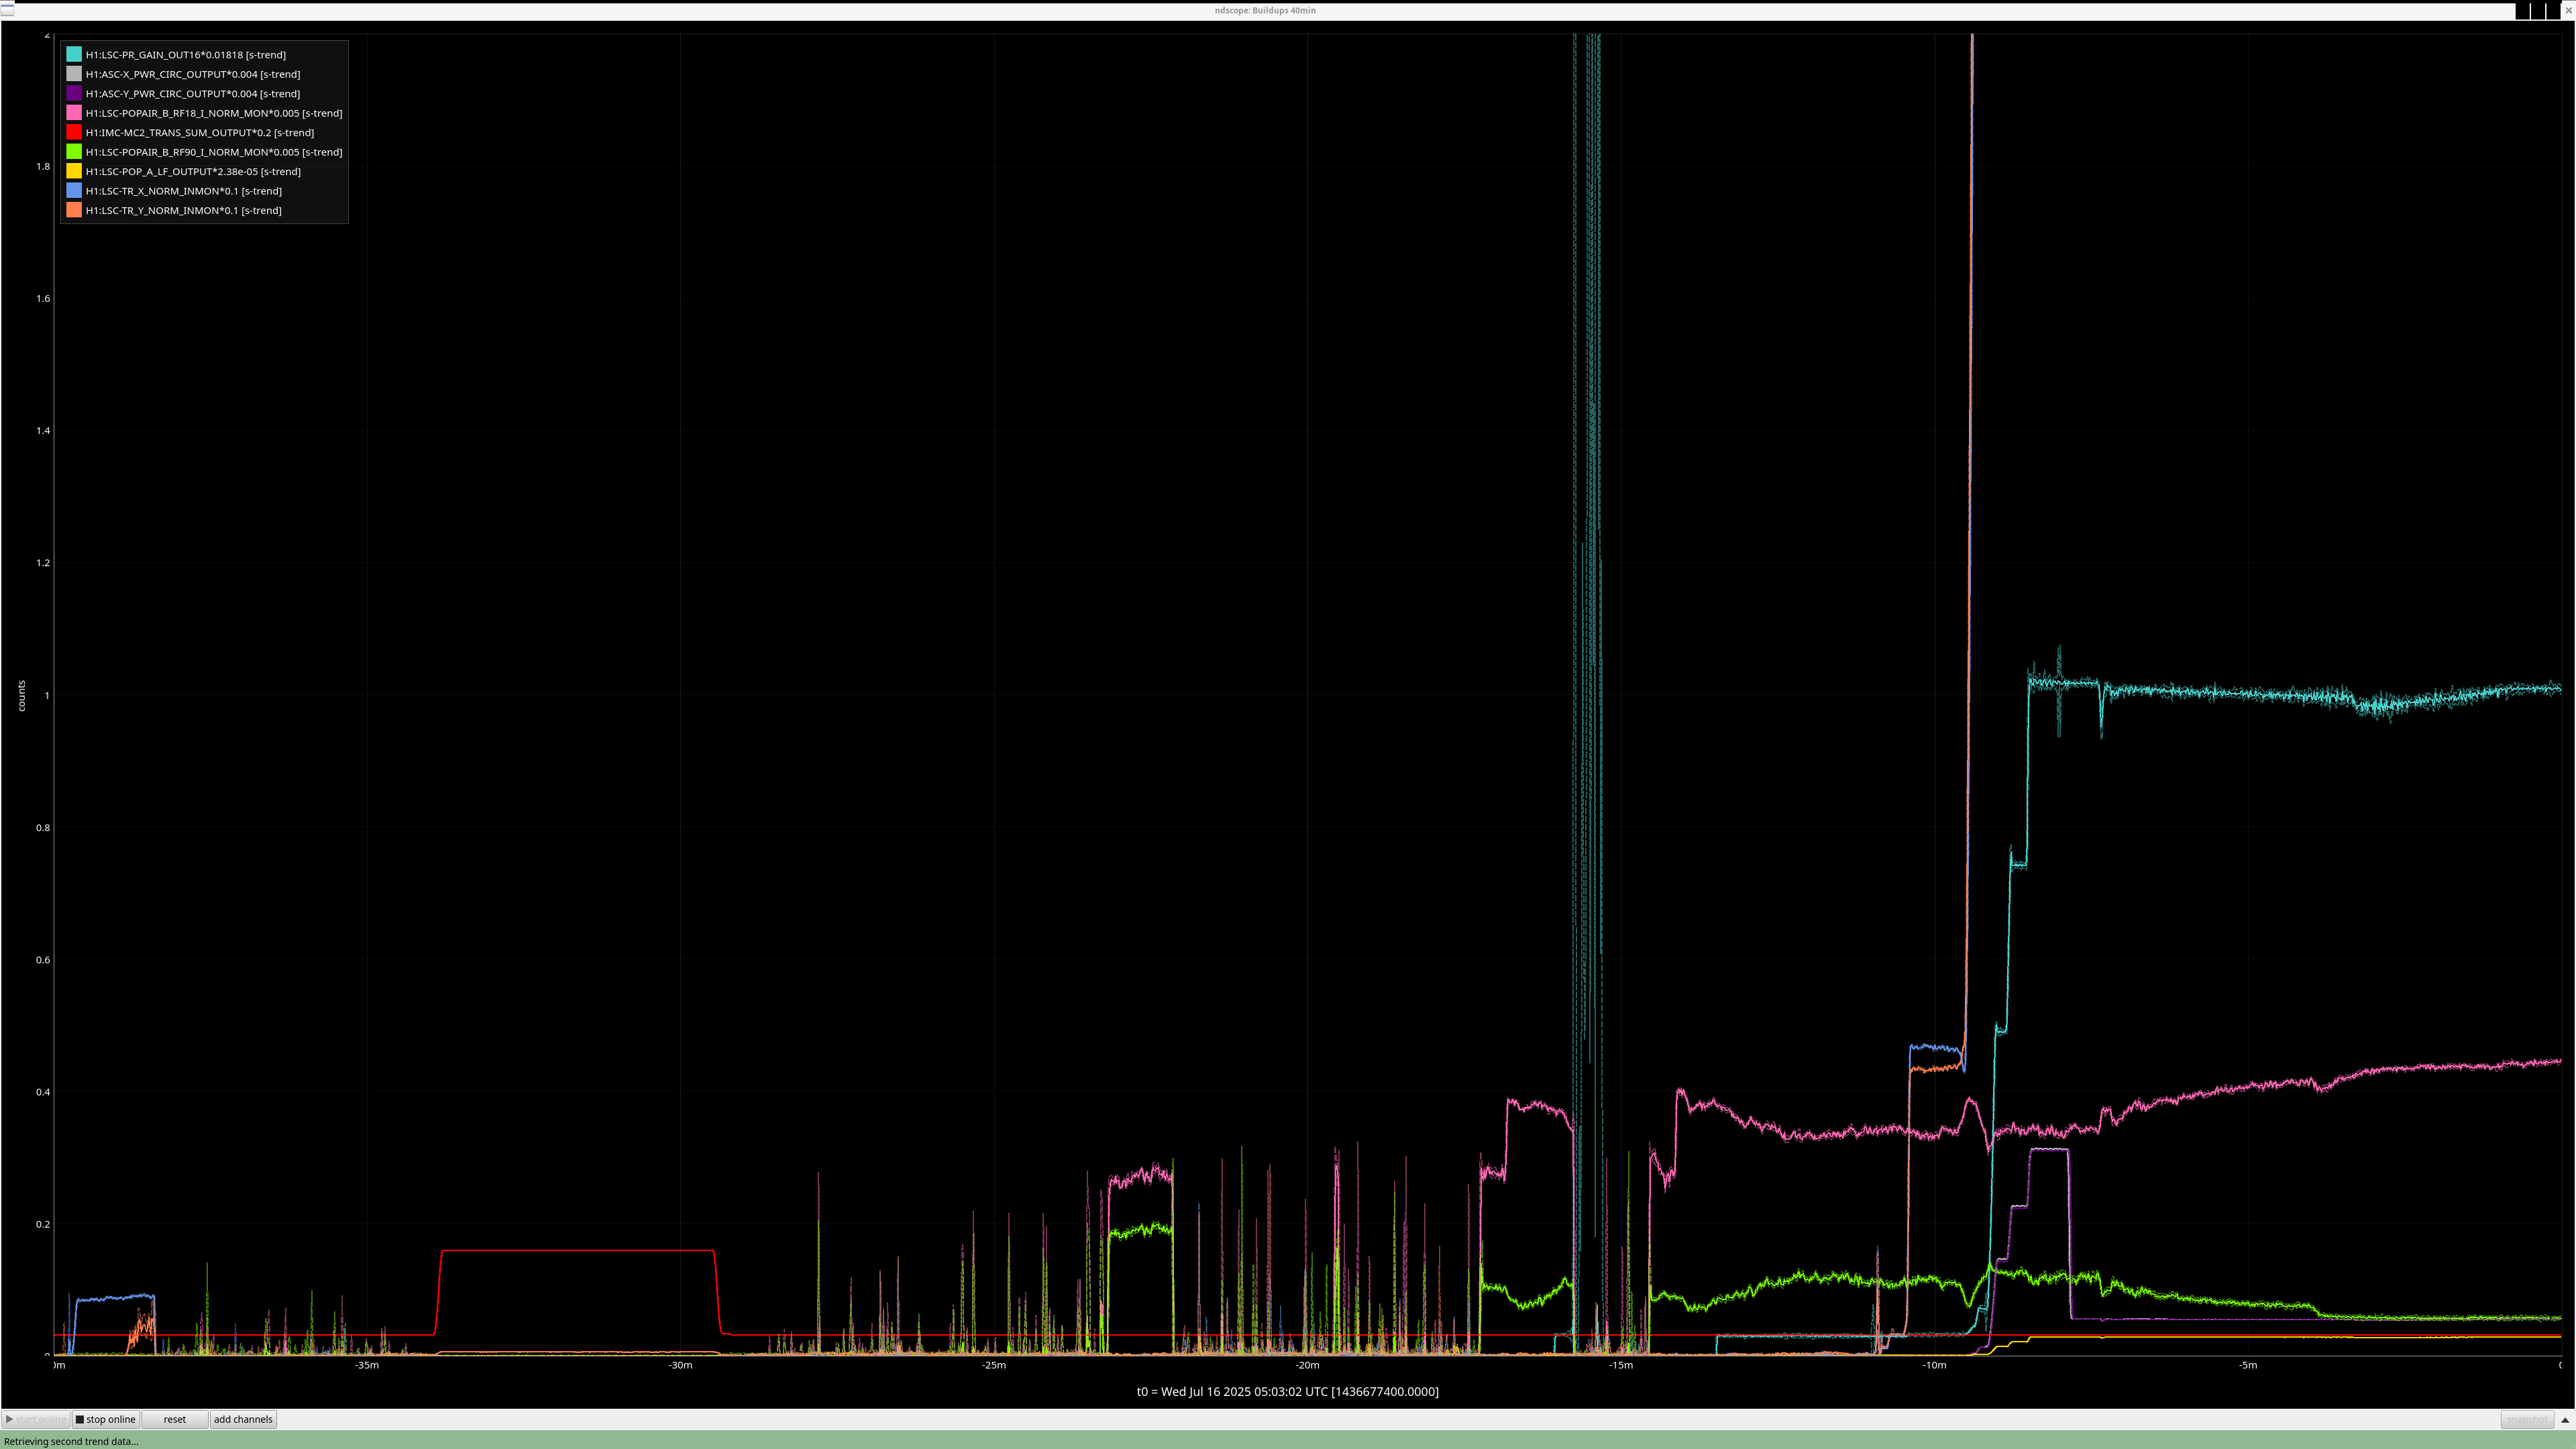
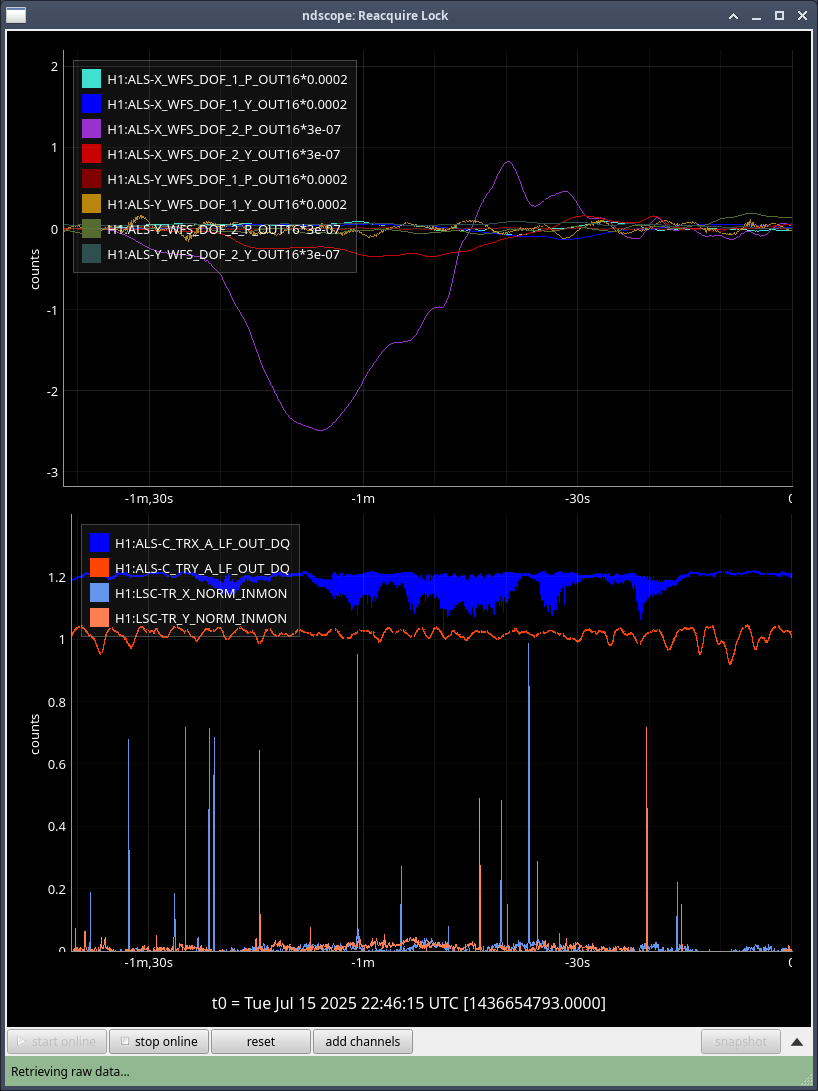
Was called by H1 Manager, we were at NLN but there were some SDF diffs that needed to get accepted to go in to Observing. They're related to the SRCL changes done yesterday, so I acepted them and we went into Observing.
TITLE: 12/13 Eve Shift: 0030-0600 UTC (1630-2200 PST), all times posted in UTC
STATE of H1: Observing at 156Mpc
INCOMING OPERATOR: Oli
SHIFT SUMMARY: Very quiet shift with H1 locked and observing for the entirety; current lock stretch is up to 24.5 hours. Secondary microseism is on the rise.
TITLE: 12/13 Day Shift: 1530-0030 UTC (0730-1630 PST), all times posted in UTC
STATE of H1: Observing at 155Mpc
INCOMING OPERATOR: Ryan S
SHIFT SUMMARY: We stayed locked the whole shift, 19hours. PRM camera is blue, 2ndary microseism seems to have flatlined, its likely from storms both off the coast and near Greenland as the arms see similar phase differences from the CS. Low frequency noise seems intermittently elevated based on DARM and SQZ dtts.
LOG:
Start Time | System | Name | Location | Lazer_Haz | Task | Time End |
---|---|---|---|---|---|---|
16:53 | OPS | LVEA | LVEA | YES | LVEA IS LASER HAZARD | 21:13 |
15:41 | FAC | Kim | Optics lab | N | Tech clean | 16:06 |
15:50 | OPS | RyanC | Vac prep | N | Restart dust monitor | 15:54 |
17:01 | PEM | Robert | LVEA | Y | Setup TCS shaker test | 17:06 |
17:01 | ISC | Camilla | CR | N | SRCL improvement | 18:24 |
17:25 | PEM | Robert | LVEA | Y | Viewport work | 19:09 |
17:39 | FAC | Kim | OSB receiving | N | Lift door for cardboard | 18:04 |
18:12 | FAC | Kim | H2 encl | N | Tech clean | 18:36 |
19:32 | FAC | Christina | OSB receiving | N | Put away cardboard | 19:44 |
19:41 | TCS | TJ | Mech room | N | Turn down TCSY flow | 19:44 |
19:45 | TCS | TJ | LVEA | Y | Restart CO2Y laser | 19:52 |
19:58 | PEM | Robert | LVEA | Y | Turn off PEM stuff | 20:02 |
23:32 | CAL | Rick, Francisco | PCAL lab | LOCAL | PCAL work | 00:32 |
TITLE: 12/12 Eve Shift: 0030-0600 UTC (1630-2200 PST), all times posted in UTC
STATE of H1: Observing at 154Mpc
OUTGOING OPERATOR: Ryan C
CURRENT ENVIRONMENT:
SEI_ENV state: USEISM
Wind: 8mph Gusts, 5mph 3min avg
Primary µseism: 0.04 μm/s
Secondary µseism: 0.48 μm/s
QUICK SUMMARY: H1 has been locked for 18.5 hours.
[Robert, Jenne]
We've updated the Jitter cleaning coeffs. Robert had noticed that the last few weeks we've really had some jitter peaks in the ~100-200 Hz range (additional to our normal jitter peaks), so we looked at retraing the jitter cleaning.
In the first attachment the bottom panel is the subtraction before the update. The top panel is after the update. You can see that indeed the red in the upper panel does a better job of subtracting than the lower panel for most of the range. There may be a little tiny bit of extra noise at a low level below ~70 Hz that most searches will not notice, but the long-duration searches (eg stochastic) may see it. However, Robert and I agree that the major benefit makes this an overall win, so I have accepted the new jitter coefficients in both the safe and observe.snap files.
The second screenshot is of the range, where the time cursor shows when the new jitter cleaning started. Since we were squishing this in at the end of commissioning, it's a little hard to see here the range improvement, but I put it in anyway just so it's a little more clear when exactly the 'reset' button in the bottom row was pushed to reset the cleaning coefficients.
Sheila, Camilla. Repeat of 78776, continuing 81575.
During the emergency July/August OFI vent, we accidentally left off the SRCL ASC offsets and the OM2 heater. Today we tried to find best SRCL1 ASC offsets with OM2 heater off. We could improve CAL FCC (but kappaC decreased) with SRC1 ASC YAW offset (-0.62) and adjusted SRCL LSC offset (-140) with SQZ FIS data. This decreased the range so we reverted settings back to nominal. May continue next week and look at FC de-tuning, OMC ASC offsets and LSC FFs as these may need to be updated too.
We repeated the setup in 81575, turned off SRCL LSC offset, opened the POP beam divertor, turned off SRCL1 ASC loops and then moved SRM in pitch and Yaw (0.1urad steps in groups of 5urad). Saw no change in pitch but an offset in yaw improved the FCC (but decreased KappaC). Could see ASC-OMC_NSUM's changing so we may need to update OMC offsets too. could see RF18 increase. FCC (couple cavity pole) increased 4.5Hz. Plots here and here.
Added a -0.62 offset into SRC1 (need to put into ISC_LOCK / sdf / lscparms). Then turned back on SRC1 ASC (ramp time 0.1s turned on offset and on button at same time).
Repeated SQZ FIS vs SRCL de-tuning dataset from 80318, this gave us the SRCL offset of -140 to use:
Outputs from Sheila's 80318 code attached: DARM spectra, fitted SRCL de-tuning to model, offset fit that gave us -140.
Once we reverted the changes, you can see here that the: range increased 5MPc, FCC decreased 4.4Hz, kappaC increased 0.8%, RF18 decreased, RF90 increased.
While we still had the SRCL ASC and LSC offsets in place, I tried some different FC de-tuning values from -29 to -38 (nominal is -32) 0.1Hz 50% overlap 35 average for 3minutes of data each. -35 is maybe the best FC de-tuning though there isn't much of a difference. The most interesting is that the no SQZ time is considerably worse <40Hz than the no SQZ data on 12/9 (IFO locked 2hrs) with the original SRCL offsets. Plot attached.
I took a quick look at the LSC coherence (MICH/PRCL/SRCL) during this change to see if it changed and that explained the worse noise. There is no change in the coherence. I also tried running a nonsens subtraction of the LSC channels on CALIB STRAIN and there was nothing of worth to subtract. Safe to say that these changes today in SRCL detuning do not worsen the LSC coupling.
Commissioning wrapped up and we resumed observing at 20:05 UTC, we've been locked for 14:40.
A comprehensive method to periodically check suspension anomalies in various OSEMs spectrums.py - is a collection of functions that can be used to study fluctuations of various OSEM suspensions over time. git link: https://git.ligo.org/hanford_osem/hanford_OSEM/-/blob/main/spectrums.py?ref_type=heads How to use it: We can git pull from the link above. In any LIGO cluster terminal or Jupyter we can use igwn-py kernel and import just the following dependency: from spectrums Import * # define a time segment object: time_seg = time_segment() In the prompt this will ask to enter a ref_time (reference time), this would be gps time when OSEMs were known to have no anomalies. Once pressed enter, it will ask for check_time, this would be another gps time which is being checked against ref_time. Finally it will ask to enter duration. For a long duration this might take a long time to execute. Keeping duration =180 (in seconds) is a reasonable choice. This will create a time segment object as a dictionary. Now, we can either check the OSEM fluctuations directly by running the following command: host = 'nds.ligo-wa.caltech.edu' osem_fluctuations(time_segments = time_seg, host=host) This will show us available OSEMs and we can enter at least one or a list of OSEMs that we wish to investigate. It may take a few minutes to get all the plots. Checking individual OSEMs might be time consuming, a quick alternative is to check their BLRM values first: check_blrms(time_segments = time_seg, host=host, fs = 256, lowcut = 15, highcut = 20, threshold = None) Runing this function allows us to enter either one or a list of OSEMs like before to have their BLRM values printed. We can apply a threshold of choice to see which OSEM(s) look problematic. Then only check plots of those OSEMs in osem_fluctuations() function.
Thu Dec 12 10:04:12 2024 INFO: Fill completed in 4min 9secs
Gerardo confirmed a good fill curbside.
At 15:40:28 yesterday, Wed 11dec2024 we had another sensor glitch on the BSC vacuum gauge (PT132). This was another sharp 2 second wide spike in the pressure reading, which was detectec by VACSTAT as a delta-p trip.
VACSTAT went into SINGLE (sensitive) mode and the CDS ALARMS block on the overview went red because an alarm was sent to CDS.
This morning I cleared the alarm by resetting VACSTAT at 07:39 Thu 12dec2024 PST.
I ran the scheduled calibration measurements starting at 16:30 UTC following the wiki.
Broadband Start Time: 1418056220
Broadband End Time: 1418056588
Simulines Start Time: 1418056620
16:43:42 UTC EX saturation
Simulines End Time: 1418058008
Files Saved:
2024-12-12 17:00:28,850 | INFO | File written out to: /ligo/groups/cal/H1/measurements/DARMOLG_SS/DARMOLG_SS_20241212T163643Z.hdf5
2024-12-12 17:00:28,857 | INFO | File written out to: /ligo/groups/cal/H1/measurements/PCALY2DARM_SS/PCALY2DARM_SS_20241212T163643Z.hdf5
2024-12-12 17:00:28,862 | INFO | File written out to: /ligo/groups/cal/H1/measurements/SUSETMX_L1_SS/SUSETMX_L1_SS_20241212T163643Z.hdf5
2024-12-12 17:00:28,866 | INFO | File written out to: /ligo/groups/cal/H1/measurements/SUSETMX_L2_SS/SUSETMX_L2_SS_20241212T163643Z.hdf5
2024-12-12 17:00:28,870 | INFO | File written out to: /ligo/groups/cal/H1/measurements/SUSETMX_L3_SS/SUSETMX_L3_SS_20241212T163643Z.hdf5
ICE default IO error handler doing an exit(), pid = 900165, errno = 32
PST: 2024-12-12 09:00:28.919662 PST
UTC: 2024-12-12 17:00:28.919662 UTC
GPS: 1418058046.919662
Wed Dec 11 10:04:17 2024 INFO: Fill completed in 4min 14secs
Gerardo confirmed a good fill curbside. Late entry for yesterday's fill. Note Y marker on trend is displayed incorrectly as 70C, it is actually 65C.
TITLE: 12/12 Day Shift: 1530-0030 UTC (0730-1630 PST), all times posted in UTC
STATE of H1: Observing at 153Mpc
OUTGOING OPERATOR: TJ
CURRENT ENVIRONMENT:
SEI_ENV state: CALM
Wind: 8mph Gusts, 4mph 3min avg
Primary useism: 0.03 μm/s
Secondary useism: 0.32 μm/s
QUICK SUMMARY:
I ran the coherence check and range comparison (Sheila said she's not sure if these plots are showing exactly what they should be though) comparing the better range at the start to now.
2ndary microseism also took a step up above the 90th percentile in the past 30 minutes and brough SEI_ENV to useism.
Sheila found that H1:TCS-ITMX_CO2_ISS_CTRL2_OUT_DQ stepped up from -0.2 to 0 on 2024/12/05 21:40:07 UTC (13:40 PST) Plot attached. This is of interest as this channel has ben a witness to our noisy/low range periods in DARM but is not connected to anything. I see no reason for this step up, the only person in the LVEA at the time was Robert setting up VP measurements (near HAM3 not CO2X) 81628, the CO2 laser remained l locked and we were not touching the CO2 chiller around the time 81634.
Since this step up, this channel has not been a good witness of our DARM noise, maybe the cable wasn't grounded and something changed to ground it on 12/05. Plot of it being a witness to the noise on 12/02 and not on 12/11.
Before and after the step up, this CO2 channel is still a witness to the CO2 rotation stage moving, attached. Both CO2X and CO2Y ISS CRTL2 channels see the rotation stages move, some crosstalk in chassis? CO2Y signal is orders of magnitude larger. Jason was looking into these channels and the chassis
I don't see any change in the H1:TCS-ITMX_CO2_RIN_INLOOP_OUTMON channel at that time, but the reason for the step in the CRTL2 output is from a turned off digital offset in the H1:TCS-ITMX_CO2_AOM_SET_POINT bank. I turned this off when we were looking at it and I forgot to alog it, apologies.
Curious that we lost sensitivity to whatever this is when an offset was removed, but I think this is a good clue.
I've just put the offset back in just to see if we get our "monitor" back. Accepted in safe and observe snaps, but only one screenshot.
It seems that with the offset on again, this channel is again a witness of the noisy times.
Today we ran a correlated noise measurement for 1 hour starting at 1416594379, meaning that the detector was locked, thermalized, and with no squeezing engaged for this period of time. We left calibration lines on during the measurement. The measurement was preceeded by a calibration measurement as well, see alog 81461.
During the measurement I ran a script that I edited from Sander Vermeulen that collects the full 524kHz OMC DCPD channels (H1:OMC-DCPD_{A,B}0_IN1) (see Jeff Kissel's comment in alog 69398 which gives a good description of how these channels are created). The data from these two channels was saved in in hdf5 files as 1 second frames. Those files can be found in /ligo/home/elenna.capote/OMC_DCPD/242511-102557/, and on the DCC at this file card: T2400394.
Sheila noted one large glitch at UTC 18:35, so this data may need to be gated around that time.
Edit: the resulting zip file is 9GB so the DCC cannot host it. I am thinking of other ways to share this data with others....
Editedit: added box link to DCC for data access.
This data has been posted to the DCC here: T2400394.
This morning there was a range drop on H1 (163Mpc down to about 151Mpc, see attachment#1). Was working on trying to figure out how to run the Range Check measurements, but while chatting with Vicky on Teamspeak, she reminded me about the daily CP1 Fill can affect range (see attachment #2 which is plot from Dave's alog) ....and the effect certainly lines up! (Also see Oli's alog from Sept here.) The time in question is 1802-1812utc (1002-1012amPT). I will not share the Low-Range-Plots I took for 1810utc since CP1 Fill is most likely the culprit.
However, a note about the range is that it has not really returned to 163Mpc---it's hovered at 157Mpc post-CP1-Fill for the last 4+hrs.
So I ran another Low Range DTT for about an hour ago (2117utc/1317PT).
Attached plots show the 30 minutes around the CP1 overfill for Sunday and Saturday. The H1 range shows a correlation with the CP1 discharge line pressure. An increase in line pressure indicates the presence of cold LN2 vapor, and later liquid, in the pipe. The Y manifold accelerometer signal shows correlated motion.
The accelerometer correlation can also be seen on the previous Sunday. This is not seen clearly during the week because the ACC was nore noisy, presumably due to LVEA activity around 10am each day.
Attached shows ACC signal Sun 8th Sep 2024 correlated to the discharge pressure. Back then we were filling at 8am. It doesn't appear that the beam manifold motion has gotten any worse over the past two months during cp1 fills.
The attached plots shows the BNS range around CP1 fill times for the last six CP1 fills (10 AM PDT) when the IFO was also in the locked state. In four cases among these six, we can see BNS range drop during the CP1 fill. In the remaining two it is not clear whether CP1 fill happened or not. We see a spike in H0:VAC-LY_TERM_M17_CHAN2_IN_MA.mean, but we don't see an extened increase in that channel as we see in the other four cases.
The attached plot show the BNS range variations during the CP1 fill times during the first ~10 days of December. We are plotting only those days when the IFO was in observing (H1:GRD-IFO_OK == 1). For these days, the drop in the BNS range during the fill times seem lower than what we saw during November (plot in the above comment). We also see that the fill times are in general less in these ten days compared to what were in November. Maybe longer the fill time, more the drop in the BNS range!? Also looking at these plots and plots from November, it seem the range might be coming back to a lower value after the fill than it's value before the fill.