Reasonable first half of the shift. The IFO remained locked through a few earthquakes, and a Squeezer dropout. We were observing all but about half an hour while sorting out the Squeezer issue. Microseism remains elevated, but is not causing problems. Range has been floating around 115Mpc. Had one SubGRB alert, #E356318. Ignored due to high latency (12,824 seconds).
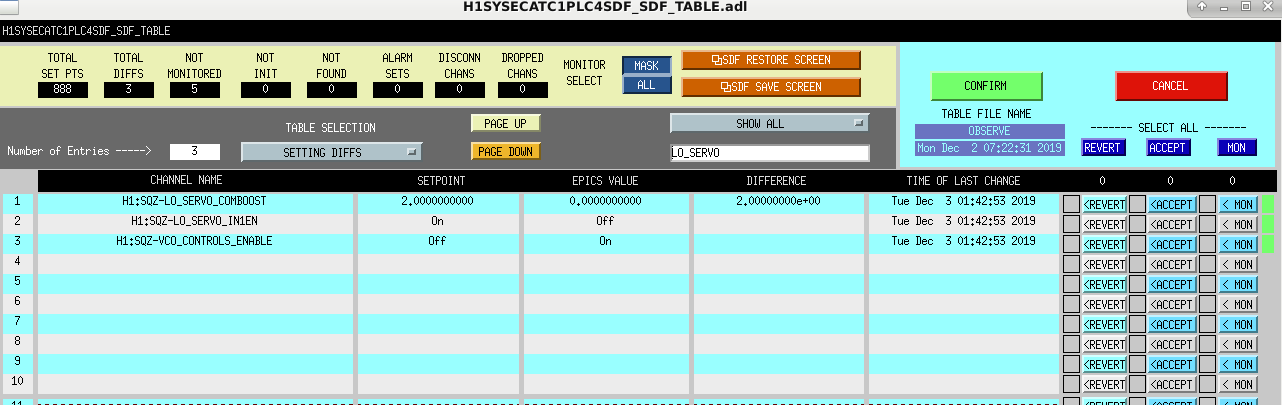
At 09:42 (01:42) drop out of Observing due to Squeezer. SQZ_MANAGER was stalled at LOCK_LO. The SQZ_LO_LR was stalled on LOCKING_OMC. There were three SDF Diffs reported. First I reverted the SDF diffs in the attached file, which did not resolve the issue. At 10:11 (02:11) I took the SQZ_MANAGER to NO_SQUEEZING. When the SQZ_MANAGER was happy at NO_SQUEEZING, selected SQUEEZING. The SQZ_LO_LR node relocked the OMC and the SQZ_MANAGER node arrived at the SQUEEZING state. With all involved nodes back to green, at 10:11 (02:11) put the IFO back into Observing mode.
TITLE: 12/02 Eve Shift: 00:00-08:00 UTC (16:00-00:00 PST), all times posted in UTC STATE of H1: Observing at 114Mpc INCOMING OPERATOR: Jeff SHIFT SUMMARY: Remained locked and in observing. No issues. LOG: 00:47 UTC Set INJ_TRANS back to INJECT_SUCCESS 06:58 UTC GRB-Short E356311, INJ_TRANS set to INJECT_KILL, confirmed with LLO Fermi 597049044 TRIGGER_DUR: 0.512 [sec] Stand Down 07:48 UTC Set INJ_TRANS back to INJECT_SUCCESS
Have remained locked and in observing. No issues.
Laser Status:
Front End Power is 32.33W (should be around 30 W)
70W Output Power is 69.29W
Front End Watch is GREEN
70W Watch is GREEN
PMC:
It has been locked 27 days, 6 hr 55 minutes (should be days/weeks)
Reflected power = 11.59Watts
Transmitted power = 52.38Watts
PowerSum = 63.97Watts.
FSS:
It has been locked for 0 days 10 hr and 55 min (should be days/weeks)
TPD[V] = 2.746V (min 0.9V)
ISS:
The diffracted power is around 2.5%
Last saturation event was 0 days 10 hours and 55 minutes ago (should be days/weeks)
Possible Issues:
TPD[V] = 2.746V (min 0.9V) - Jason will be addressing this during Maintenance tomorrow
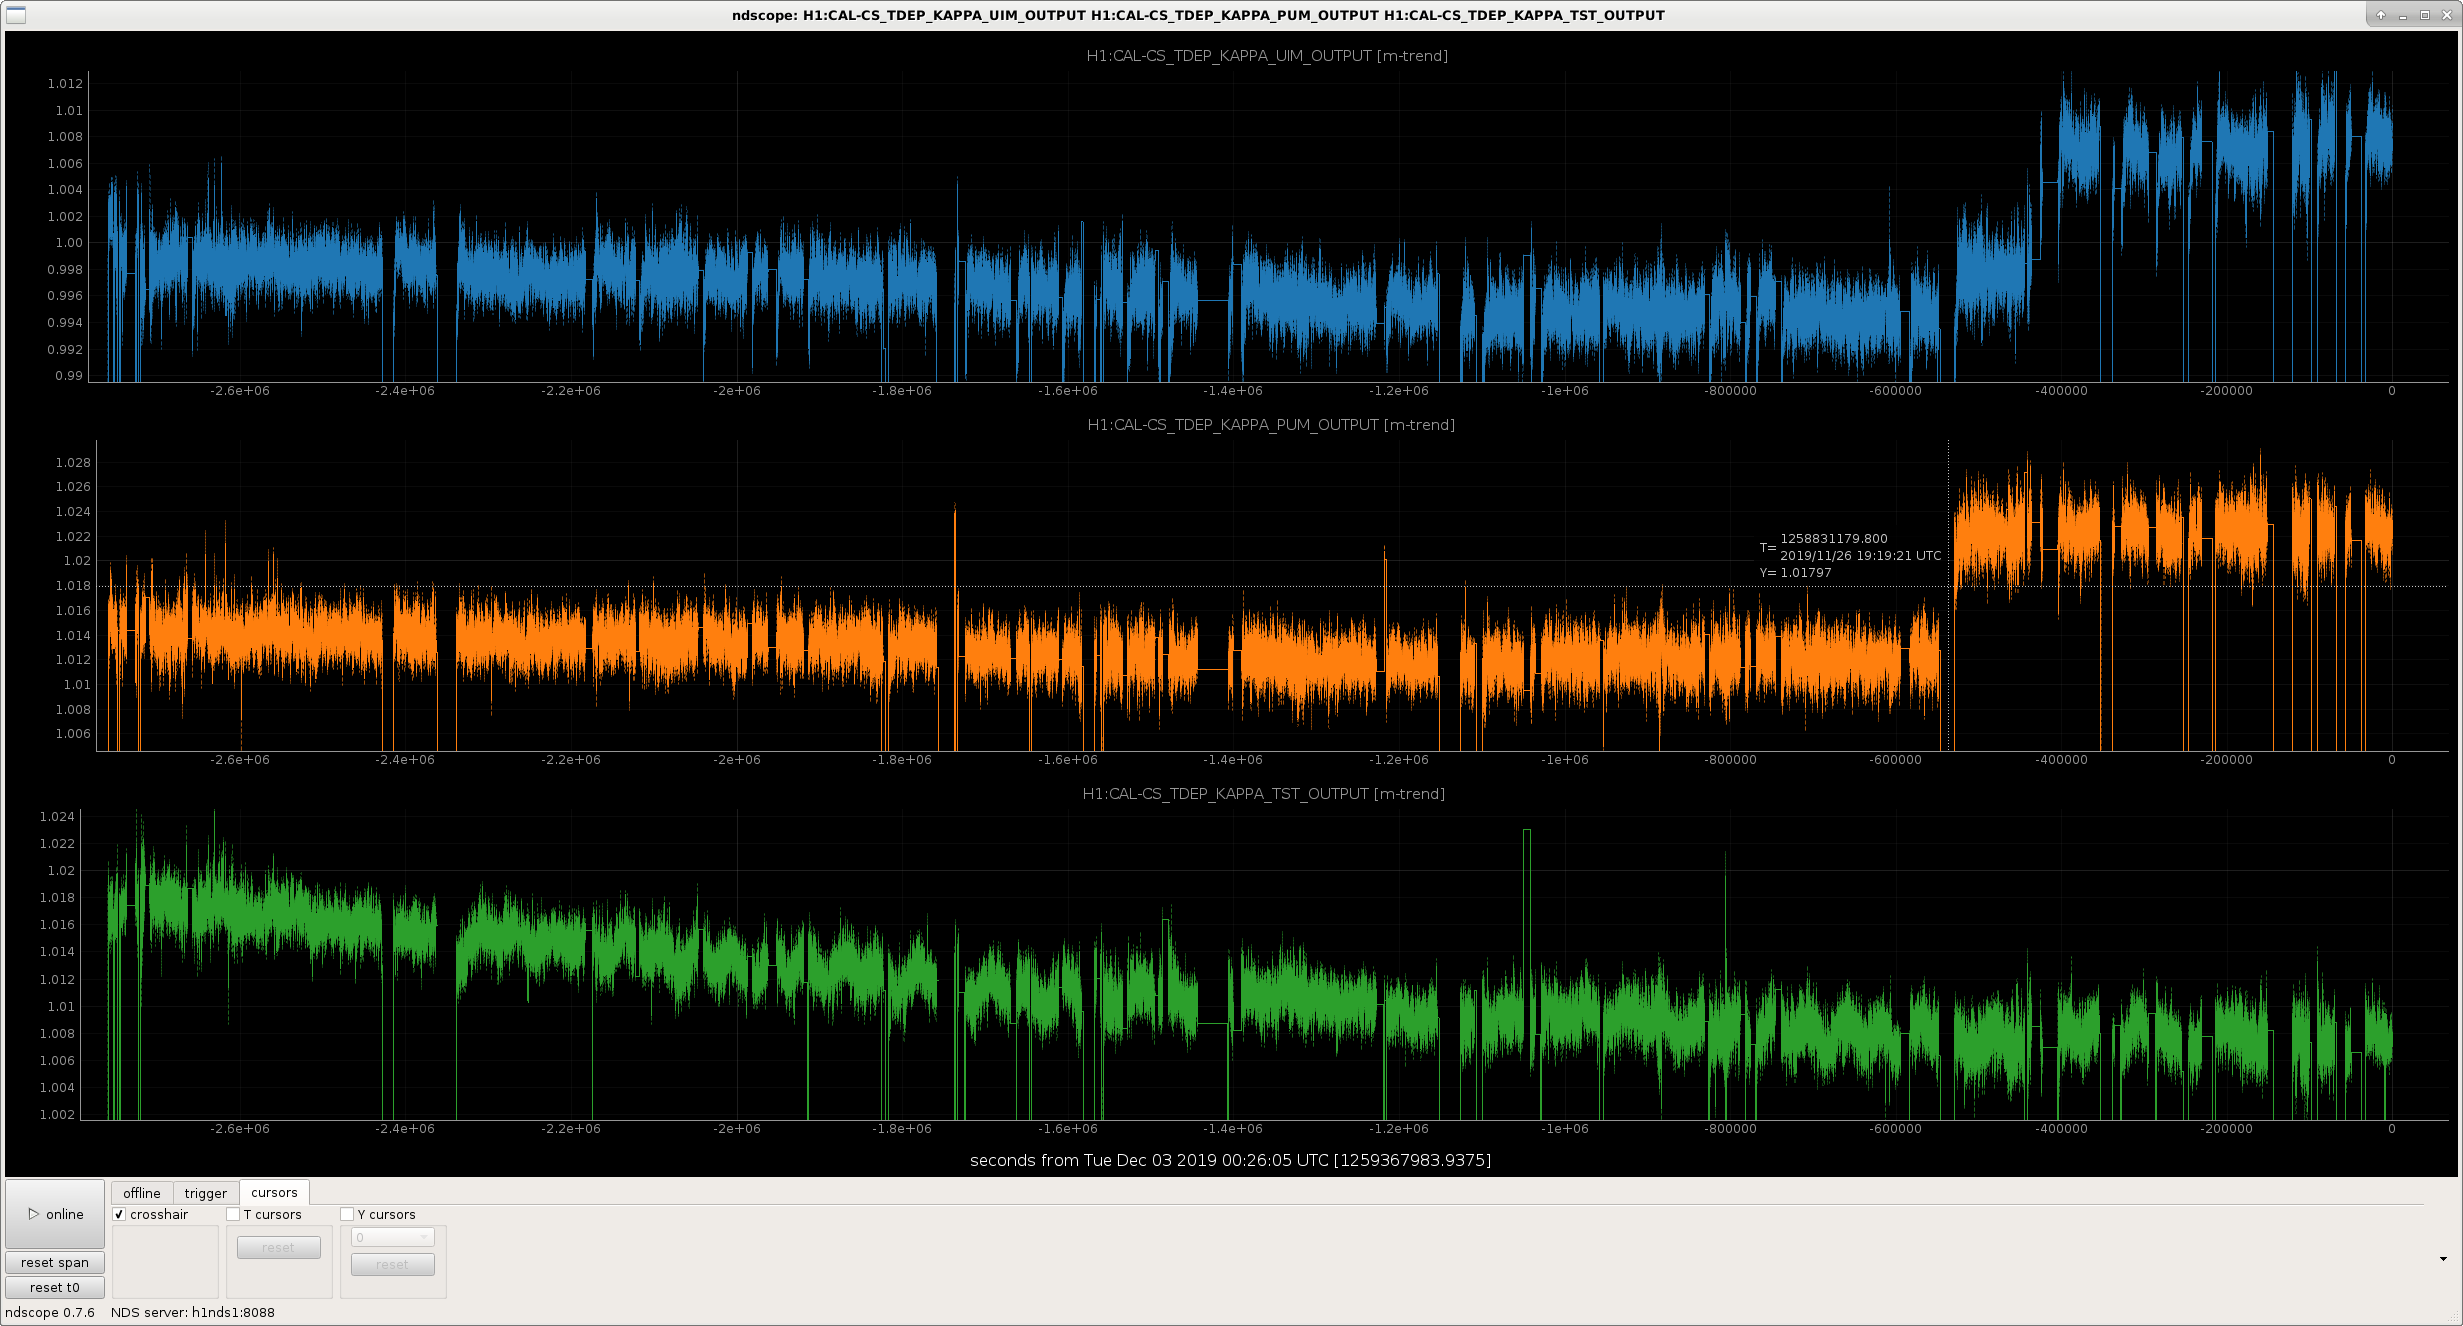
J. Kissel I've processed the ETMX longitudinal actuation strength data from 2019-11-11 (see day-of LHO aLOG 53162) for each of the three stages. In doing so, I've trended the front-end produced time-dependent correction factors to see if the systematic error between "the actuator strength used in the currently-still-in-use 2019-09-09 model" (which is actually the same numbers we've been using since the start of O3 in April 2019) and "the fit to the 2019-11-11 data" is small (i.e. the percent difference is unity). In short -- it's the perennial question: "anything that shows evidence that we need to update the model?" or, asked differently, "any evidence that the time dependent correction factors are not doing their job?" Summary: All continues to be well-understood and accurate at the level of concern needed with the O3 ETMX actuator. But, beneath that level of concern, there are interesting things happening. The attached .pdfs are the plots that show the fits to the 2019-11-11 data. Below is a table highlighting the results which help answer the above question: UIM PUM TST Reference Model 7.67e-08 (N/ct) 6.036e-10 (N/ct) 4.727e-12 (N/ct) MCMC Fit 8.038e-08 6.086e-10 4.780e-12 kappa via MCMC 1.0478 1.00824 1.01124 kappa via CALCS 0.997 1.013 1.012 Systematic Error 0.048% -0.0047% 0.00075% (MCMC-CALCS)/MCMC I was at first a bit alarmed by the 4% systematic error in the UIM, but the MCMC fit appears to be poor -- spoiled by the data point at 10 Hz -- so I've resumed a state of zen. Also, we've shown that a 5% scale factor systematic error on the UIM has no significant impact on the overall response function systematic error above 10 Hz, so even if the systematic error was real, I'd still brush it off. The previous time this table was made was for the 2019-10-28 measurement. See LHO aLOG 52973. Then, all actuation fits agreed with TDCFs within 0.5%, so I argue that the TDCFs are tracking reality well. Finally, the image attachment is a 1 month trend of the time-dependent correction factors, just because they turned out to be interesting -- but not consequential -- when I looked. The interesting points: (1) The high duty cycle from this month allows us to *clearly* resolve a six-hour period, 0.2% amplitude fluctuation in the ESD actuation strength. I attribute this to the first time LHO has demonstrably seen the impact of differential reaction-chain to main-chain distances changing due to tidal control. This change in chain-to-chain distance means the gap between reaction mass (the ESD pattern) and the test mass changes, thus impacting the ESD actuation strength. LLO regularly sees this because they drive all of their tidal control to *only* the main chain at the TOP mass level, as opposed to LHO which drives tidal to the UIM stage. This actuation strength fluctuation is real, noticeable, but at the 0.2% level, it doesn't really matter, especially since we're correcting for it. (2) The actuation strength as drifted down in 1 month, from 1.018 to its current value of 1.008. Again, inconsequential, because we correct for it, but I wonder what effect is causing this slow drift. I can think of three things that would evolve on that time scale: vacuum pressure, residual charge, and ambient temperature. The former two won't have changed over the course of the month, but trending further back in time reveals that that was a ~1% increase in drive strength between the end of O3A and the start of O3B, and the strength appears to just be returning to that level. The ambient temperature has changed for the colder over this month... (3) There has been significant step function in the PUM *and* UIM actuation strength, at the ~1% level after the 2019-11-26 the maintenance day break. The only activity that day at the end stations was powering up and leaving on the NCAL, setting up a PEM instrumentation array around it, and Robert making scattered light investigations. I could believe that the former two might have some electrical effect in the strength... but it's shear speculation. I'll be gathering a new set of data this Wednesday to continue the assessment, and confirm that we see this ~1% increase in the sweeps as well. I suspect it will.
In the above entry, I confusingly say
I've trended the [... TDCFs ...] to see if systematic error between [ ... the model of the actuation strength ...] and [the fit to this new data] is small (i.e. the percent difference is unity).
I meant either
- "the percent difference is close to zero" where percent difference is 100*[({new data fit} - model) / model] or
- "the ratio is unity," where the ratio is {new data fit} / model
and in my haste convolved the two.
And then, I totally botched the reporting of the percent difference, adding the *label* for %, without actually multiplying by 100.
For example, for the TST stage TDCF, the percent difference is
100 * (1.01124 - 1.012) / 1.012 = -0.075, and thus "0.075%"
and the ratio is just
1.01124 / 1.012 = 0.9992
Sorry for the confusion! It's too late for me to edit the entry proper, so please forgive the error and interpret with the corresponding grain of salt.
TITLE: 12/02 Eve Shift: 00:00-08:00 UTC (16:00-00:00 PST), all times posted in UTC
STATE of H1: Observing at 115Mpc
OUTGOING OPERATOR: Cheryl
CURRENT ENVIRONMENT:
SEI_CONF state: WINDY
Wind: 5mph Gusts, 4mph 5min avg
Primary useism: 0.02 μm/s
Secondary useism: 0.38 μm/s
QUICK SUMMARY: No issues.
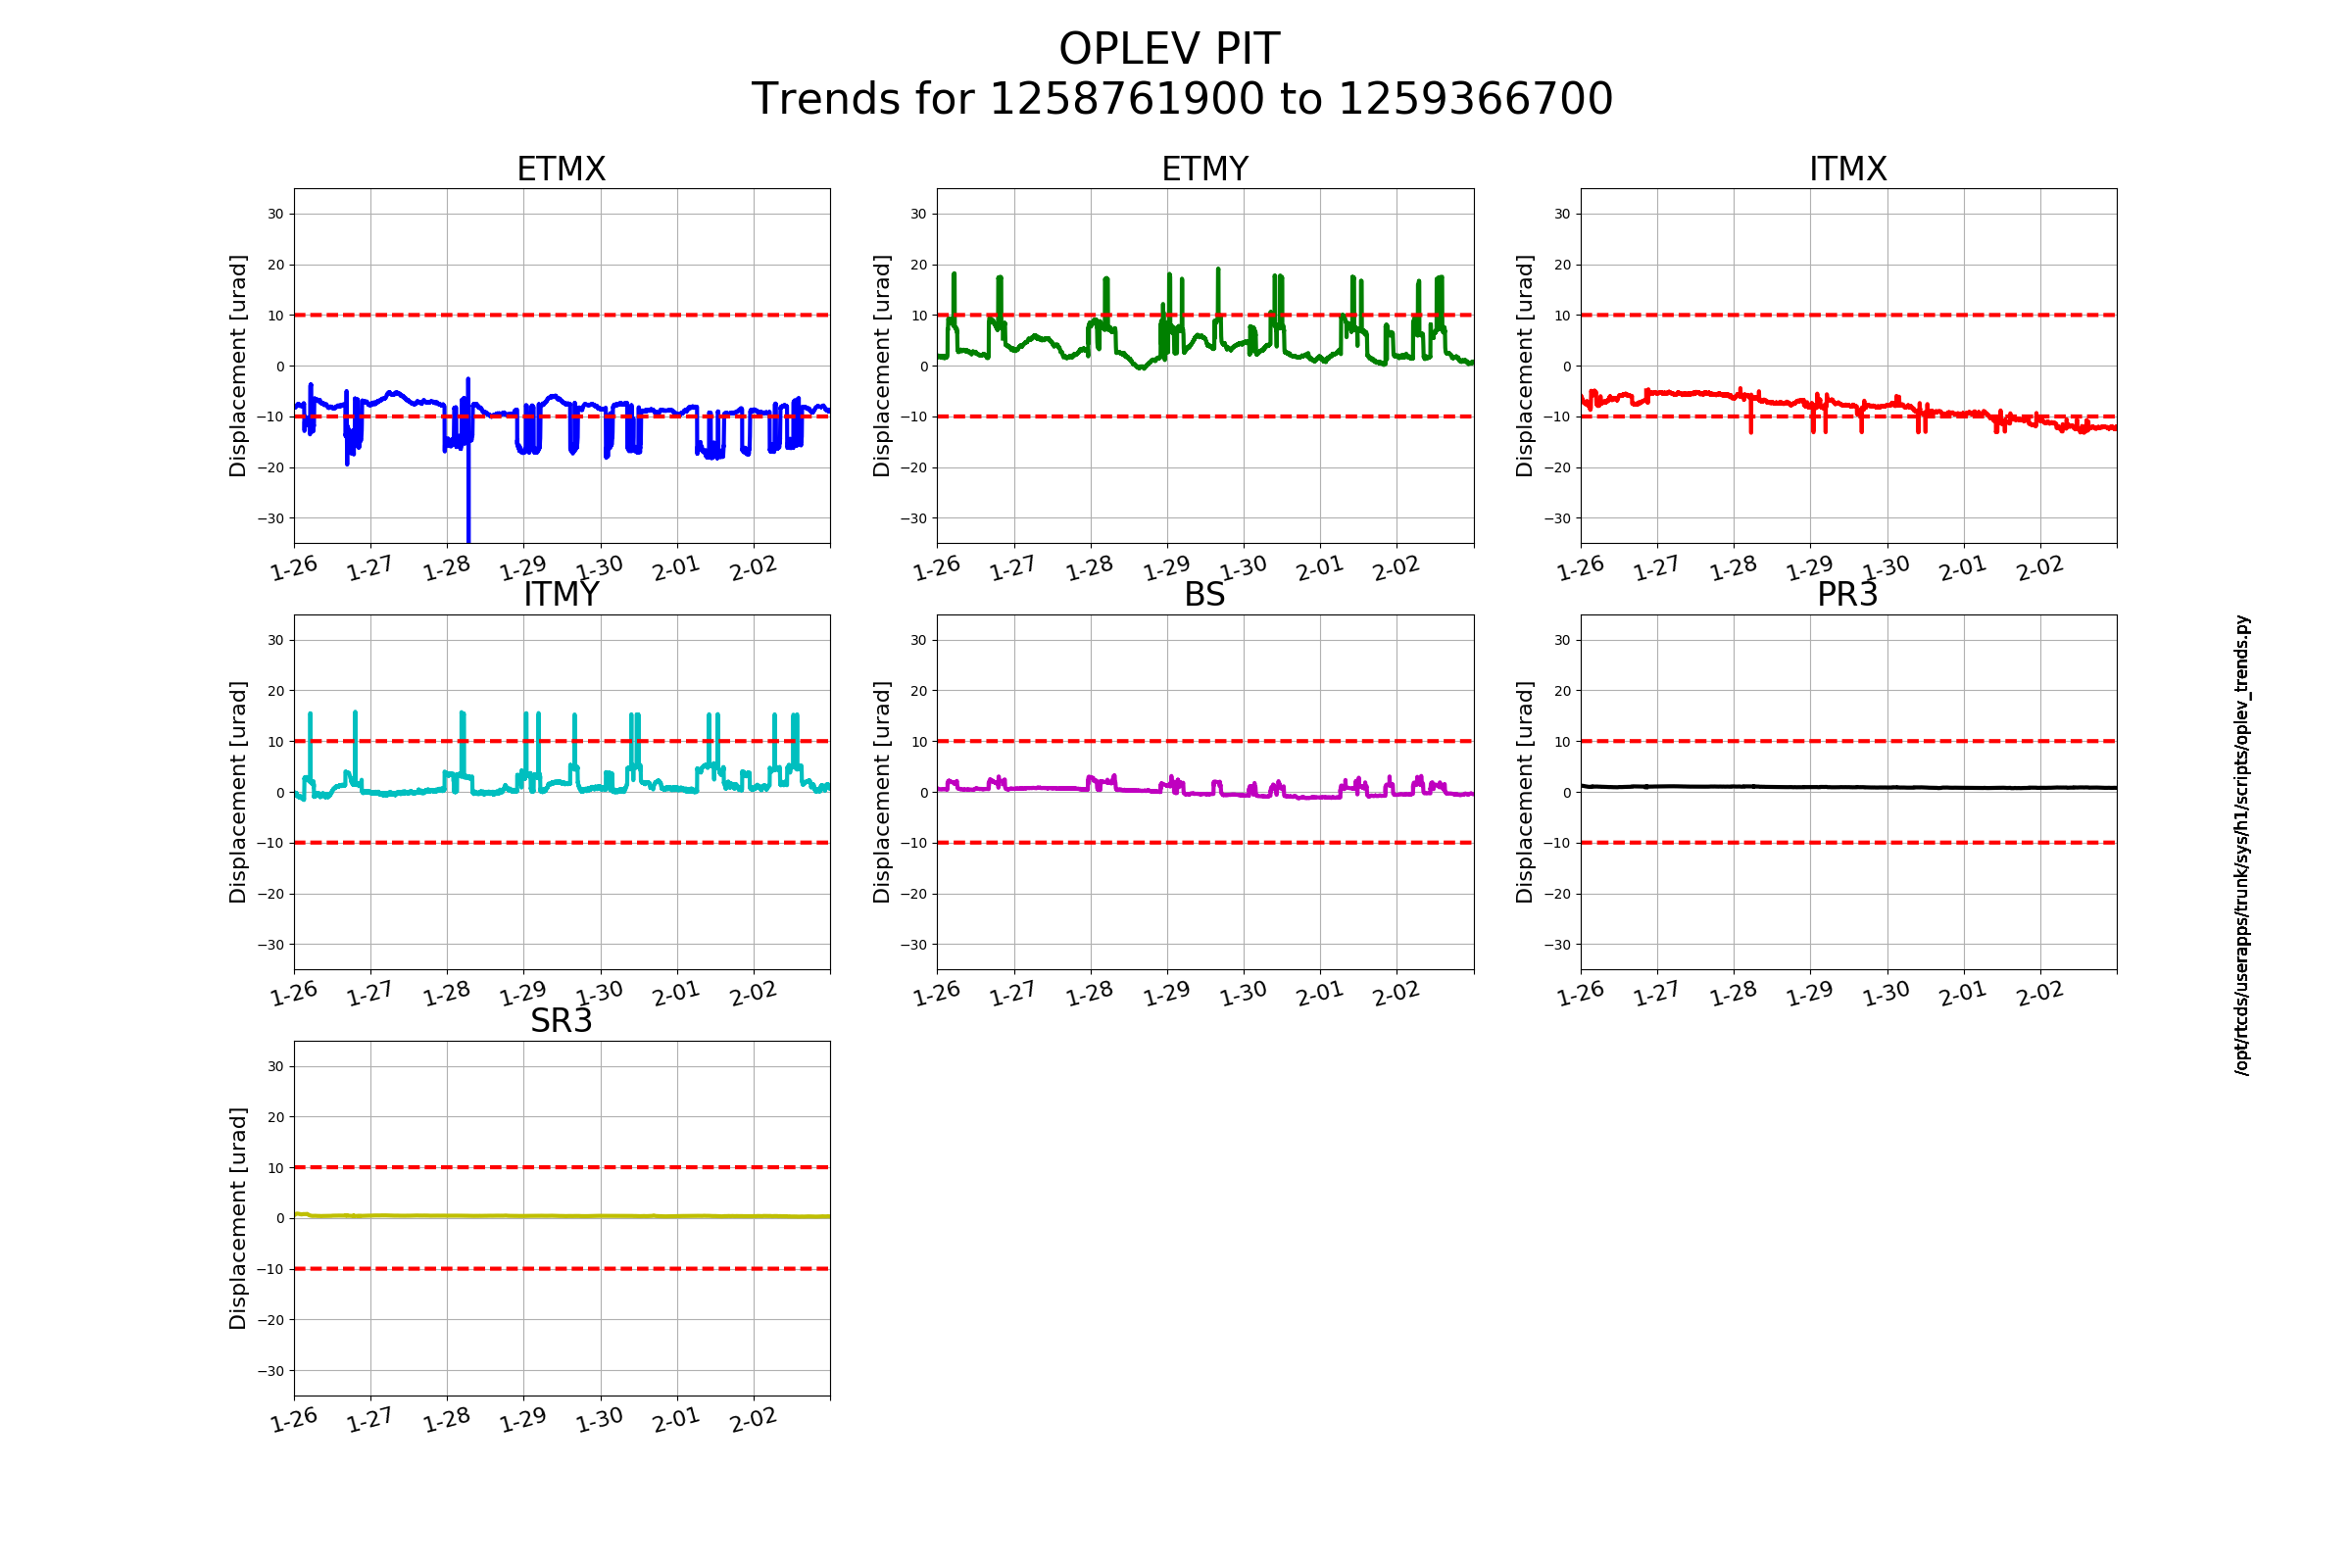
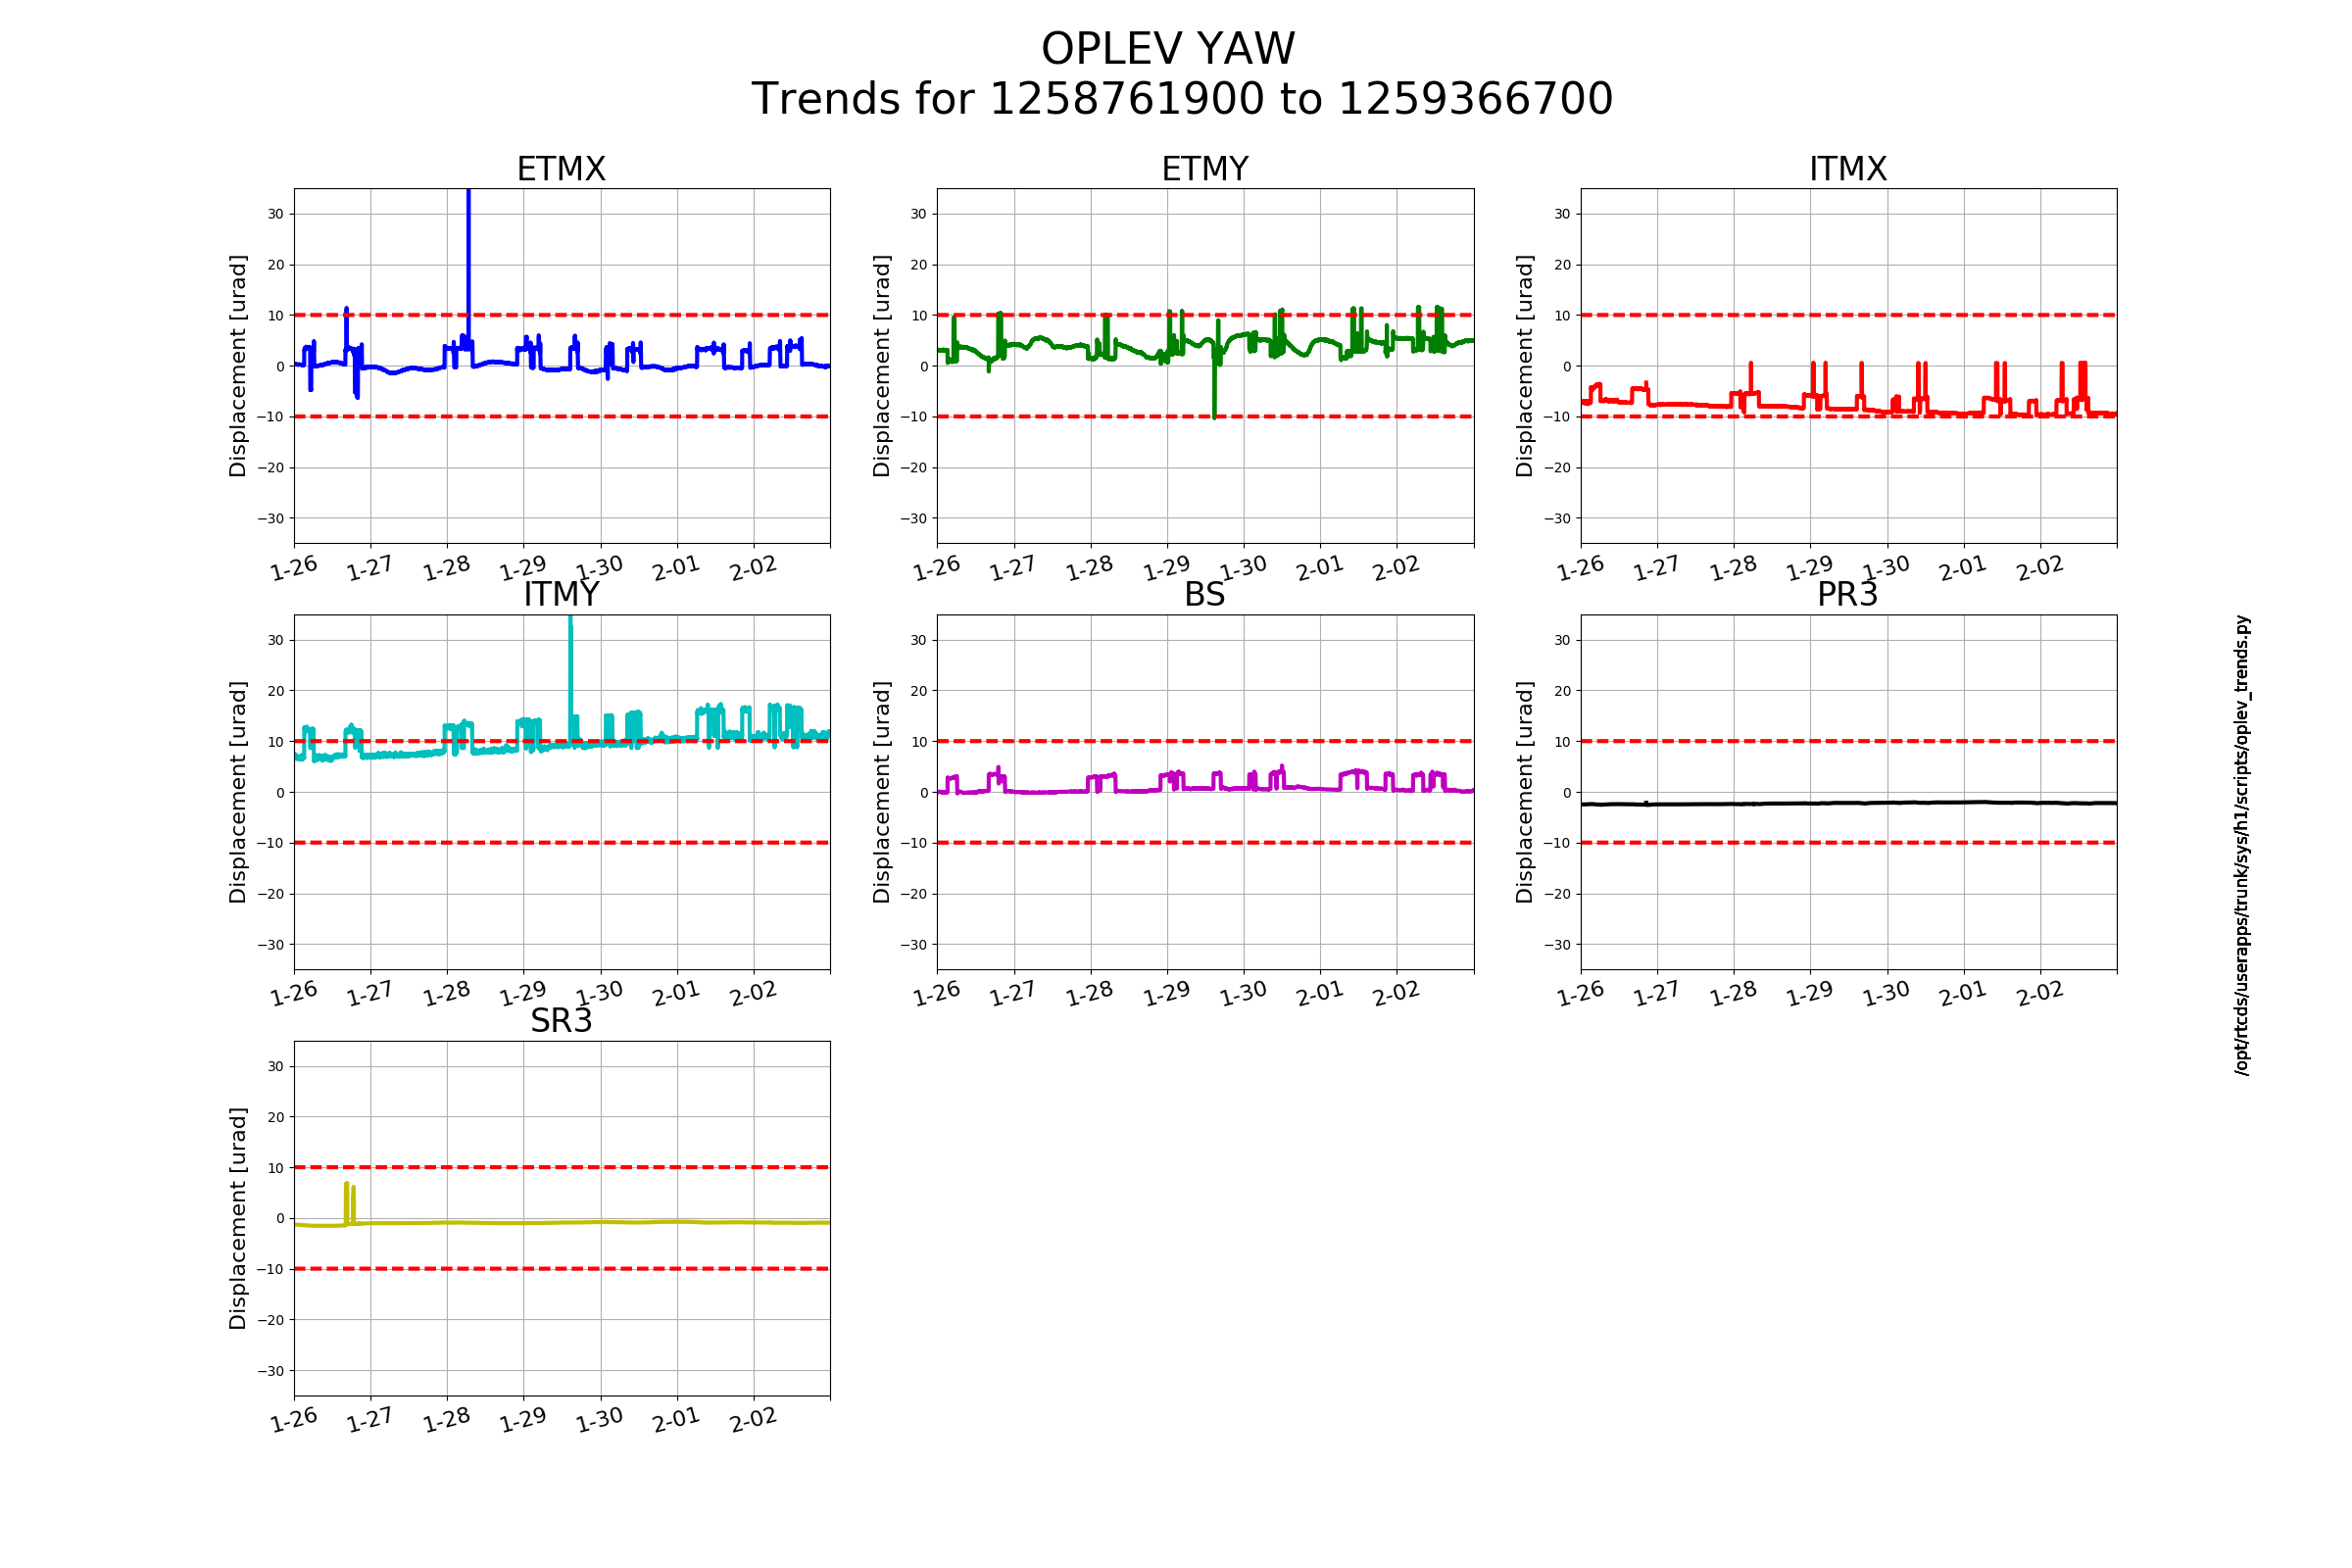
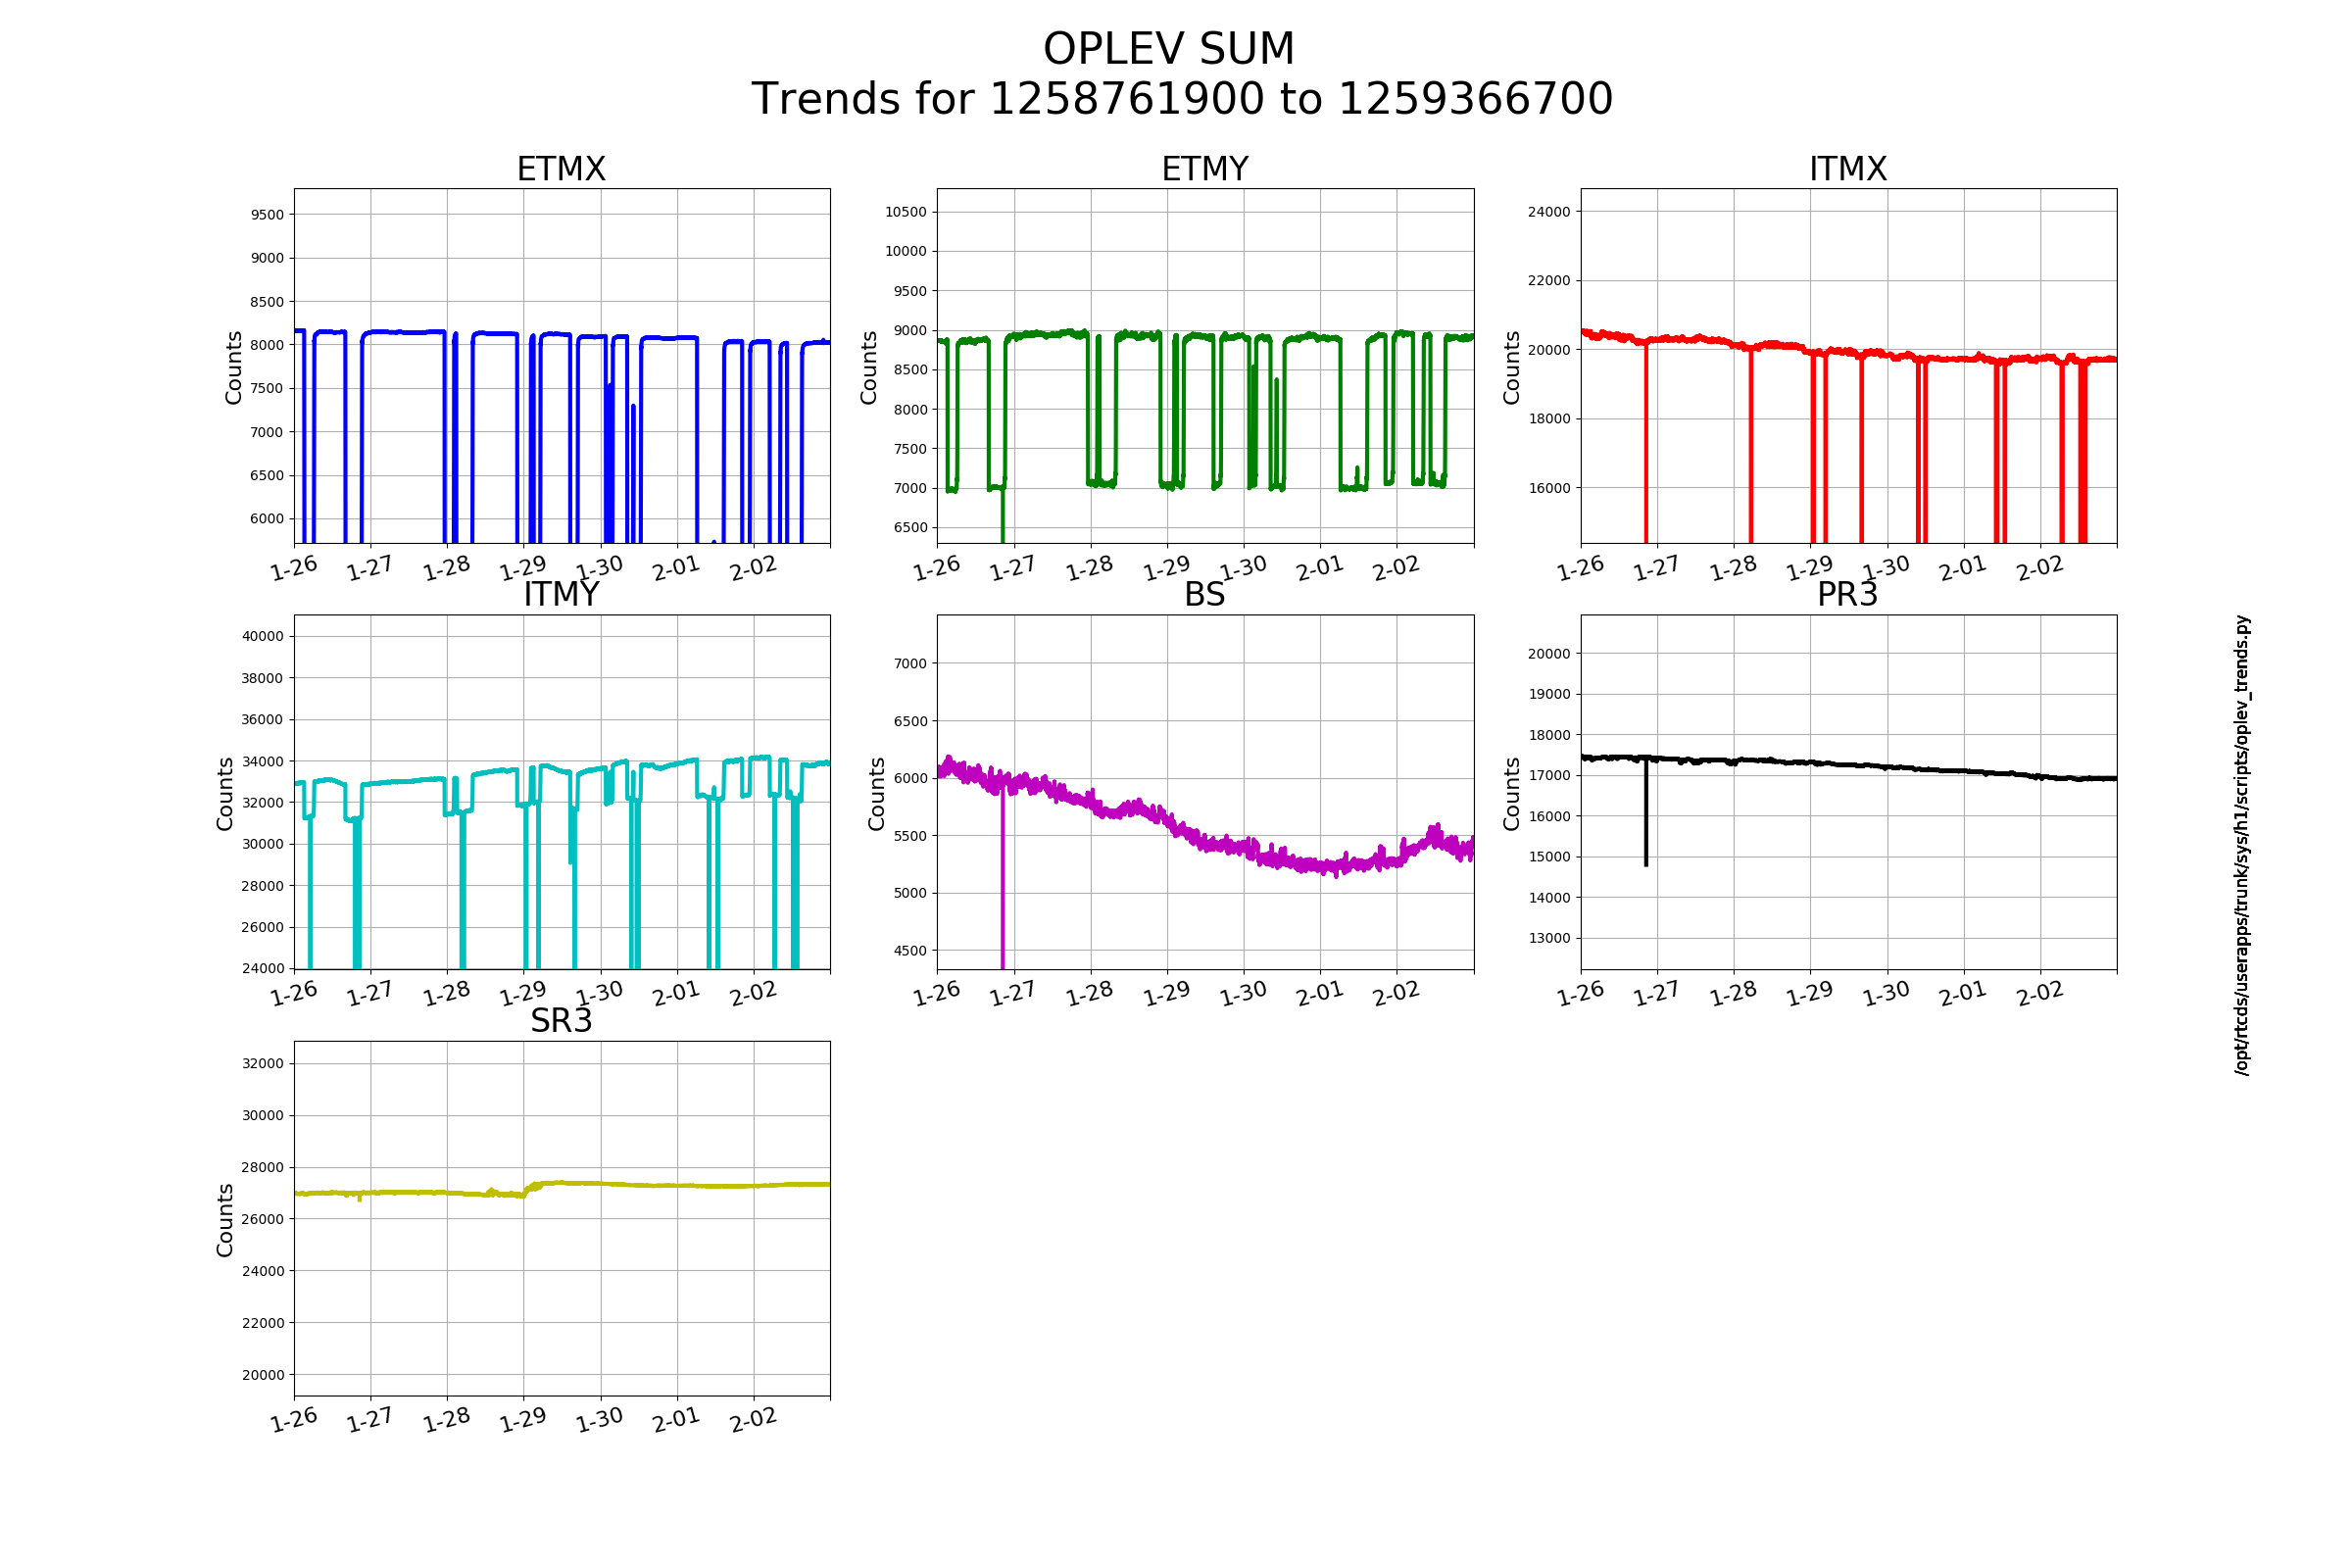
FAMIS 11246 Trends attached. ITMX is out of range in pitch and close to out of range in yaw. ETMX is close to out of range in pitch. ITMY is out of range in yaw.
J. Kissel
I think it might be time to redefine this FAMIS task. The above trends are only showing the last few days, and
(a) any number of things can happen (including several cycles of intentionally aligned vs. misaligned optics), and
(b) the +/-10 urad "range limits are not anysort of physical, functionality limits of the oplevs, they're merely "if the optic started at centered when we first started caring, then we'd be alarmed if the optical lever continually zoomed off 'in to the weeds' by 10 urad, or if the alignment was varying over 'days' by 10s of urads.
As the trends above stand, you can't tell either of these worrisome things from these from them.
Admittedly, there are other things to check for that the above trend would show, like
(a) Has the SUM dropped to some abnormally low value, or
(b) Does the few day trend show that the optical lever is *not* tracking the intentional alignments and misalignments, or
(c) Has there been some sort of "sudden" days worth of VEA temperature excursion
but we'd want to see these problems immediately, vs. the "once a week" that this test is made.
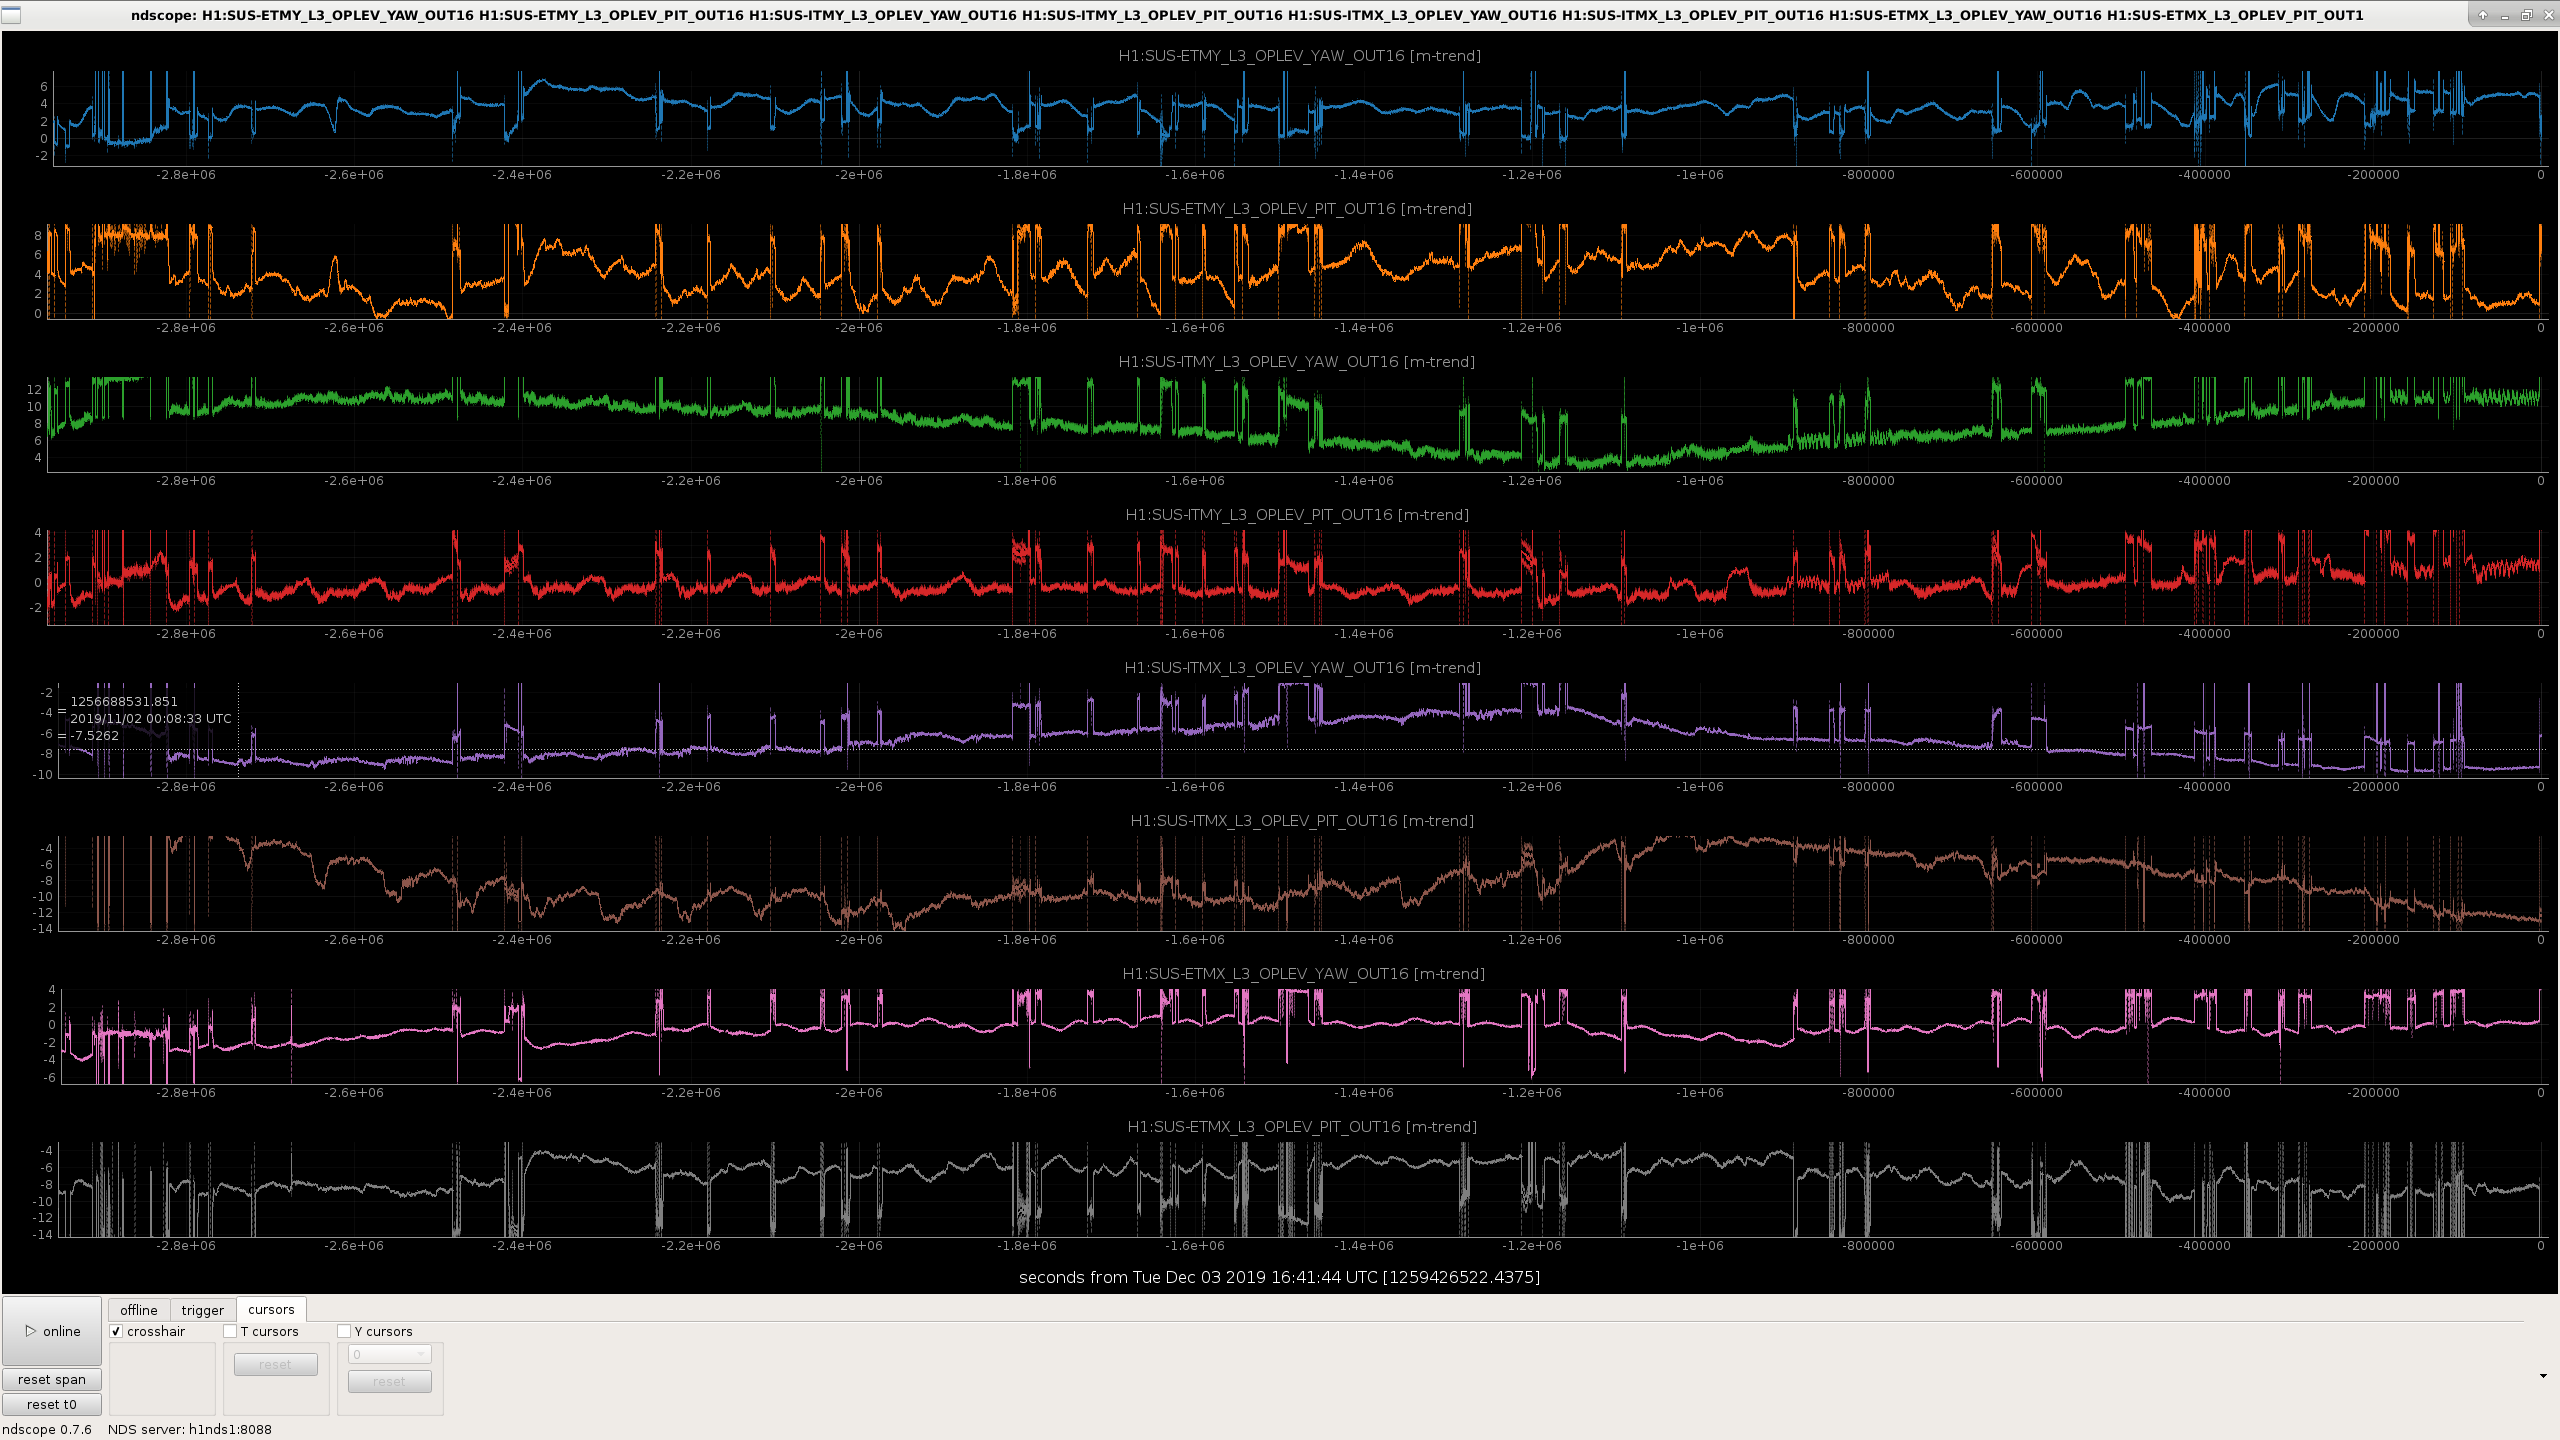
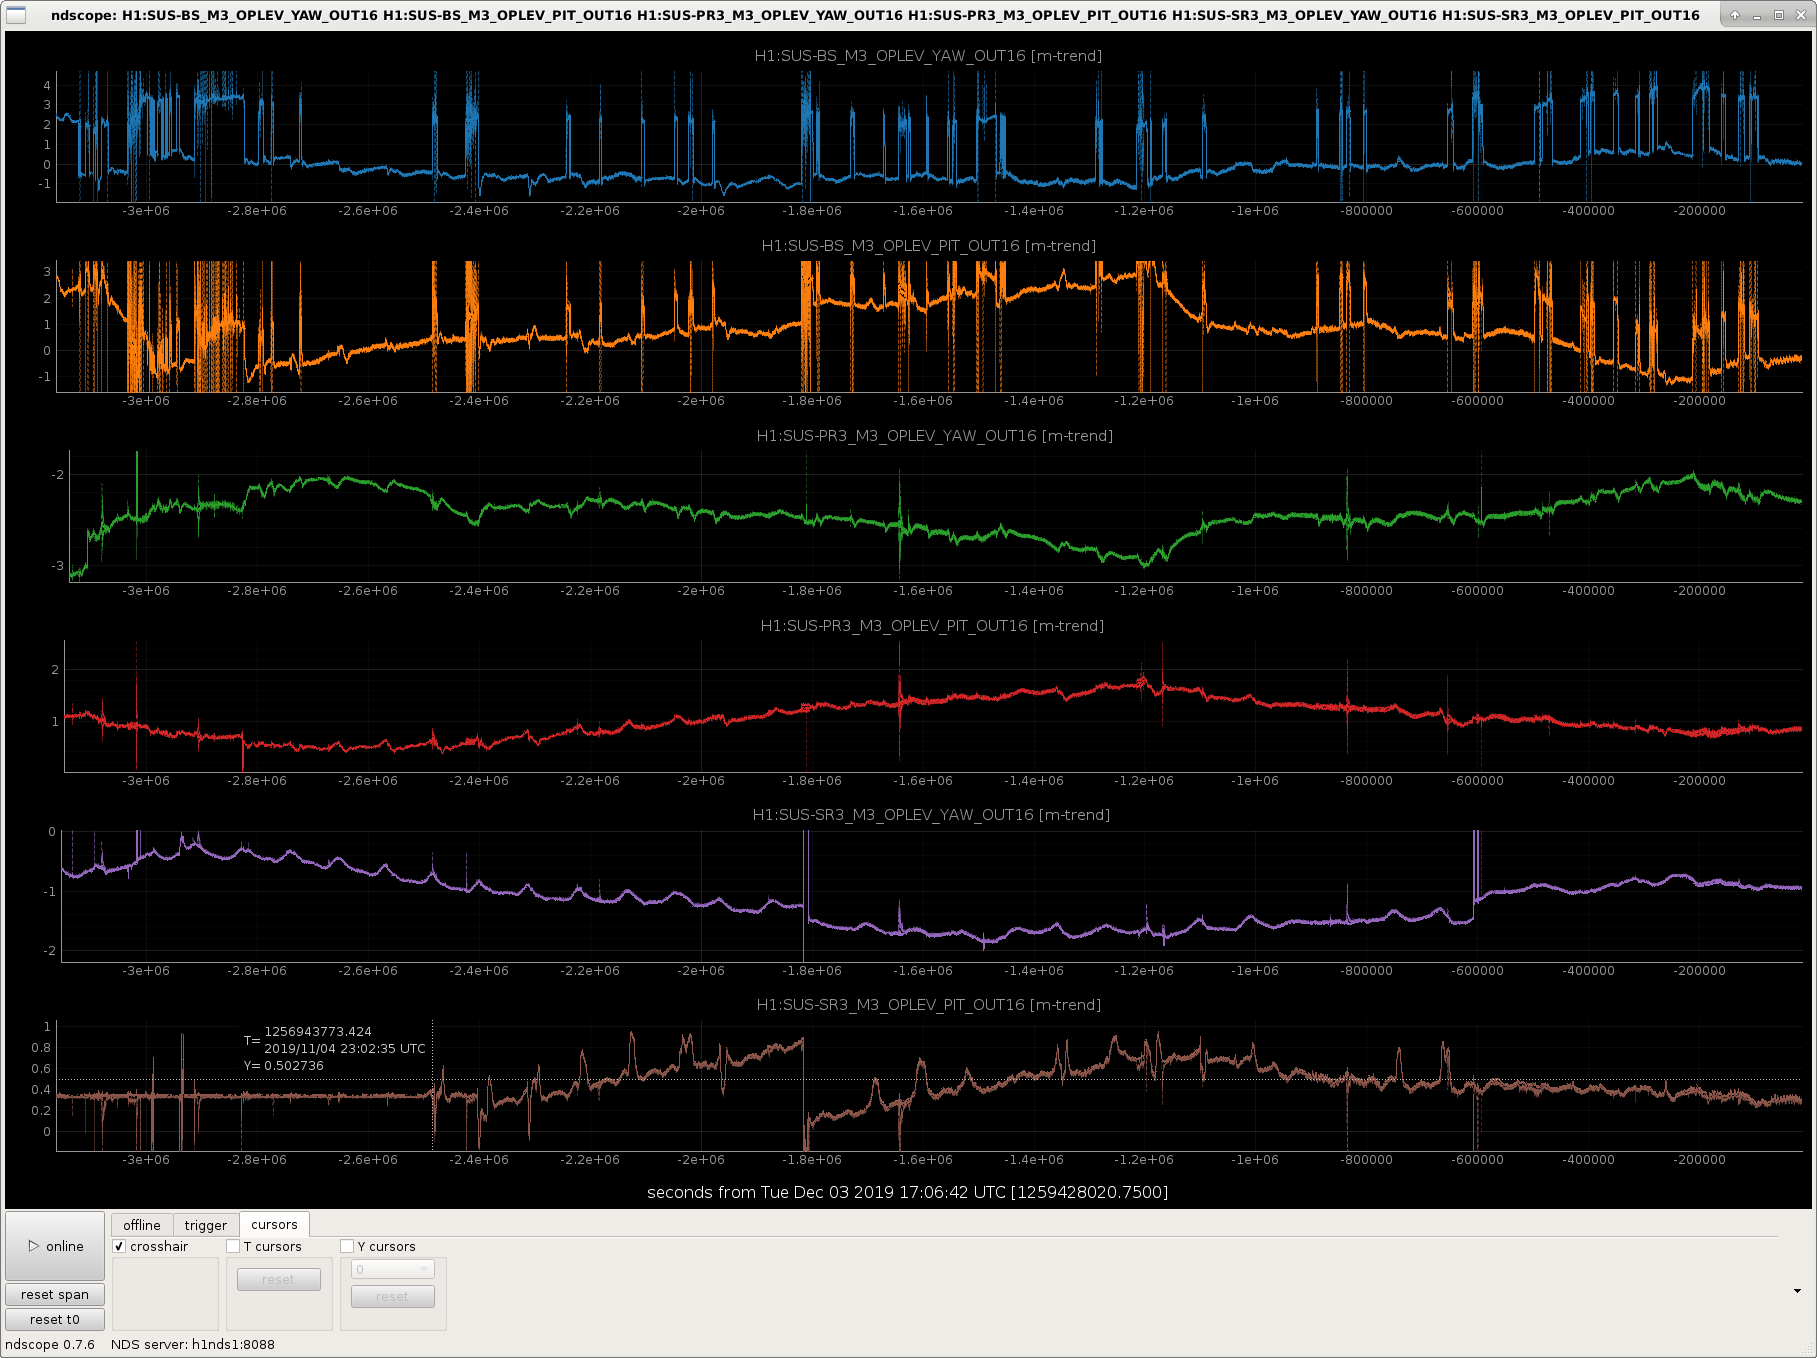
I attach a ~1 month ndscope trend, and I see that all of the optical levers (in PIT and YAW) for the QUADs, then all the Triples -- even though they did not *start* as "centered," they haven't drifted more than a few urad since the start of O3B. Thus, I would prefer that we keep the long term alignment reference rather than resetting this zero. Mostly because in the *future* month, we'll see a drop to zero, and we have to take the extra time to figure out if there was a centering that occurred.
Anyways -- just hoping start the conversation, with the goal being *my* usual -- let's think about the regular tests we do, 'cause maybe they're no longer needed and we can stop. OR if we're doing them regularly, let's make sure the results that we post reflect the questions we really want so we can answer them without further inspection. Further, if there are new tools out there that may answer the question better, let's use them (in this case, ndscope templates instead of python script).
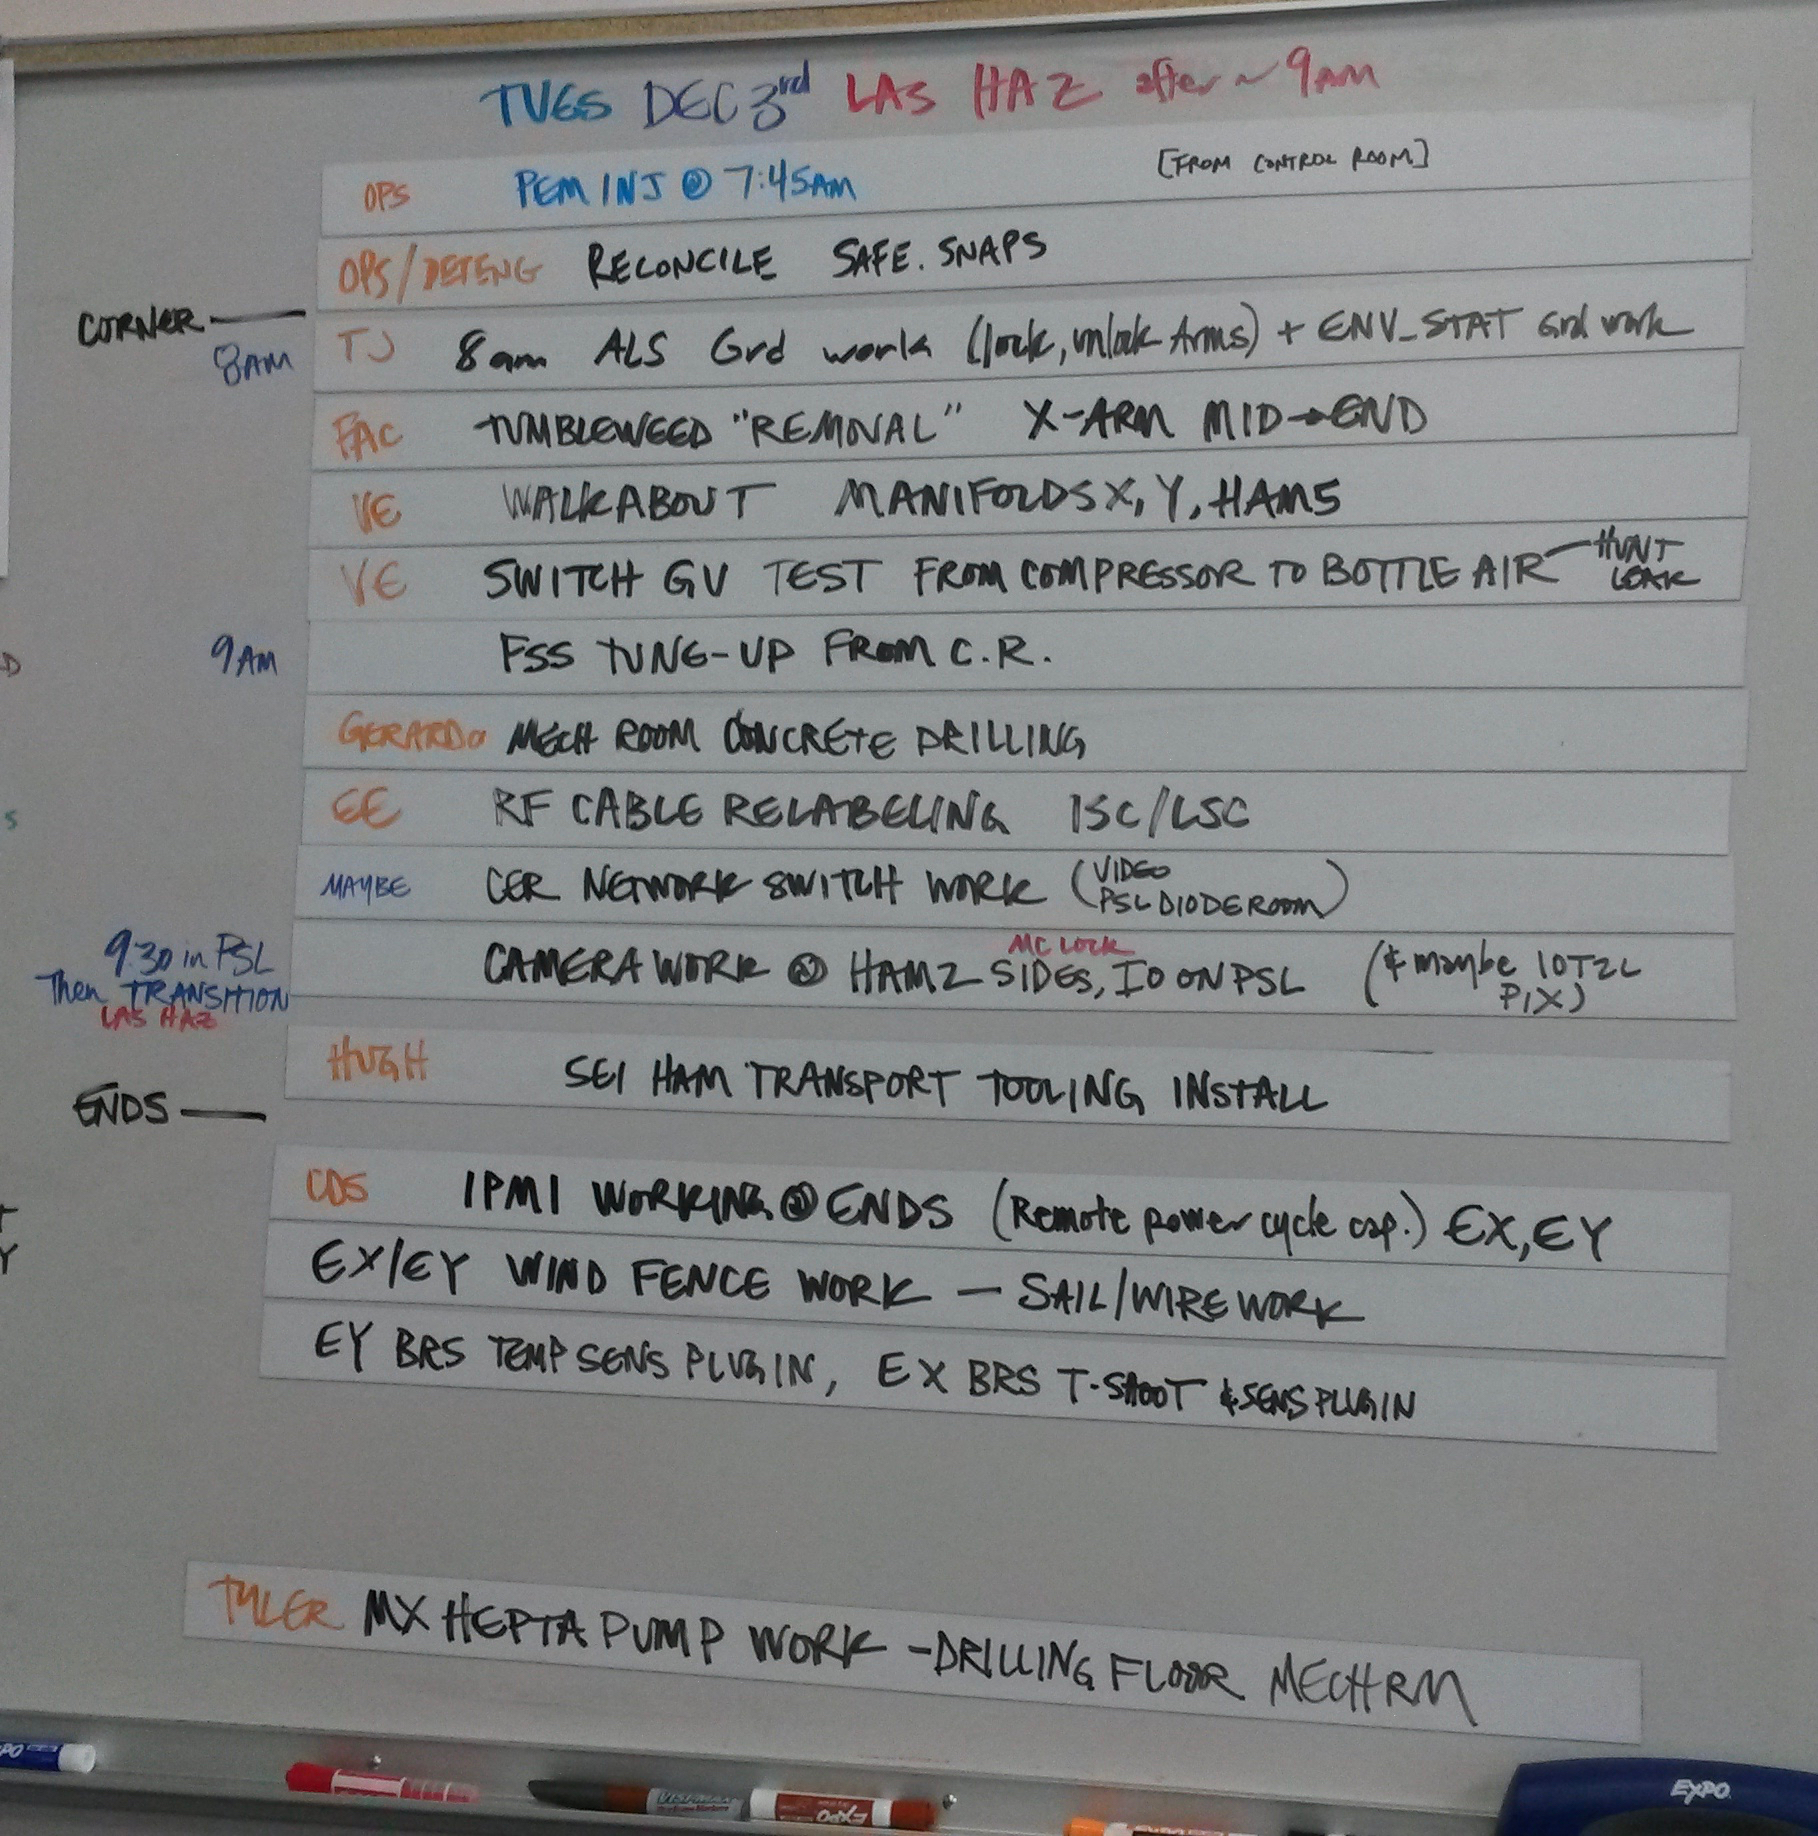
Time sensitive activities:
All activities listed in attached image:
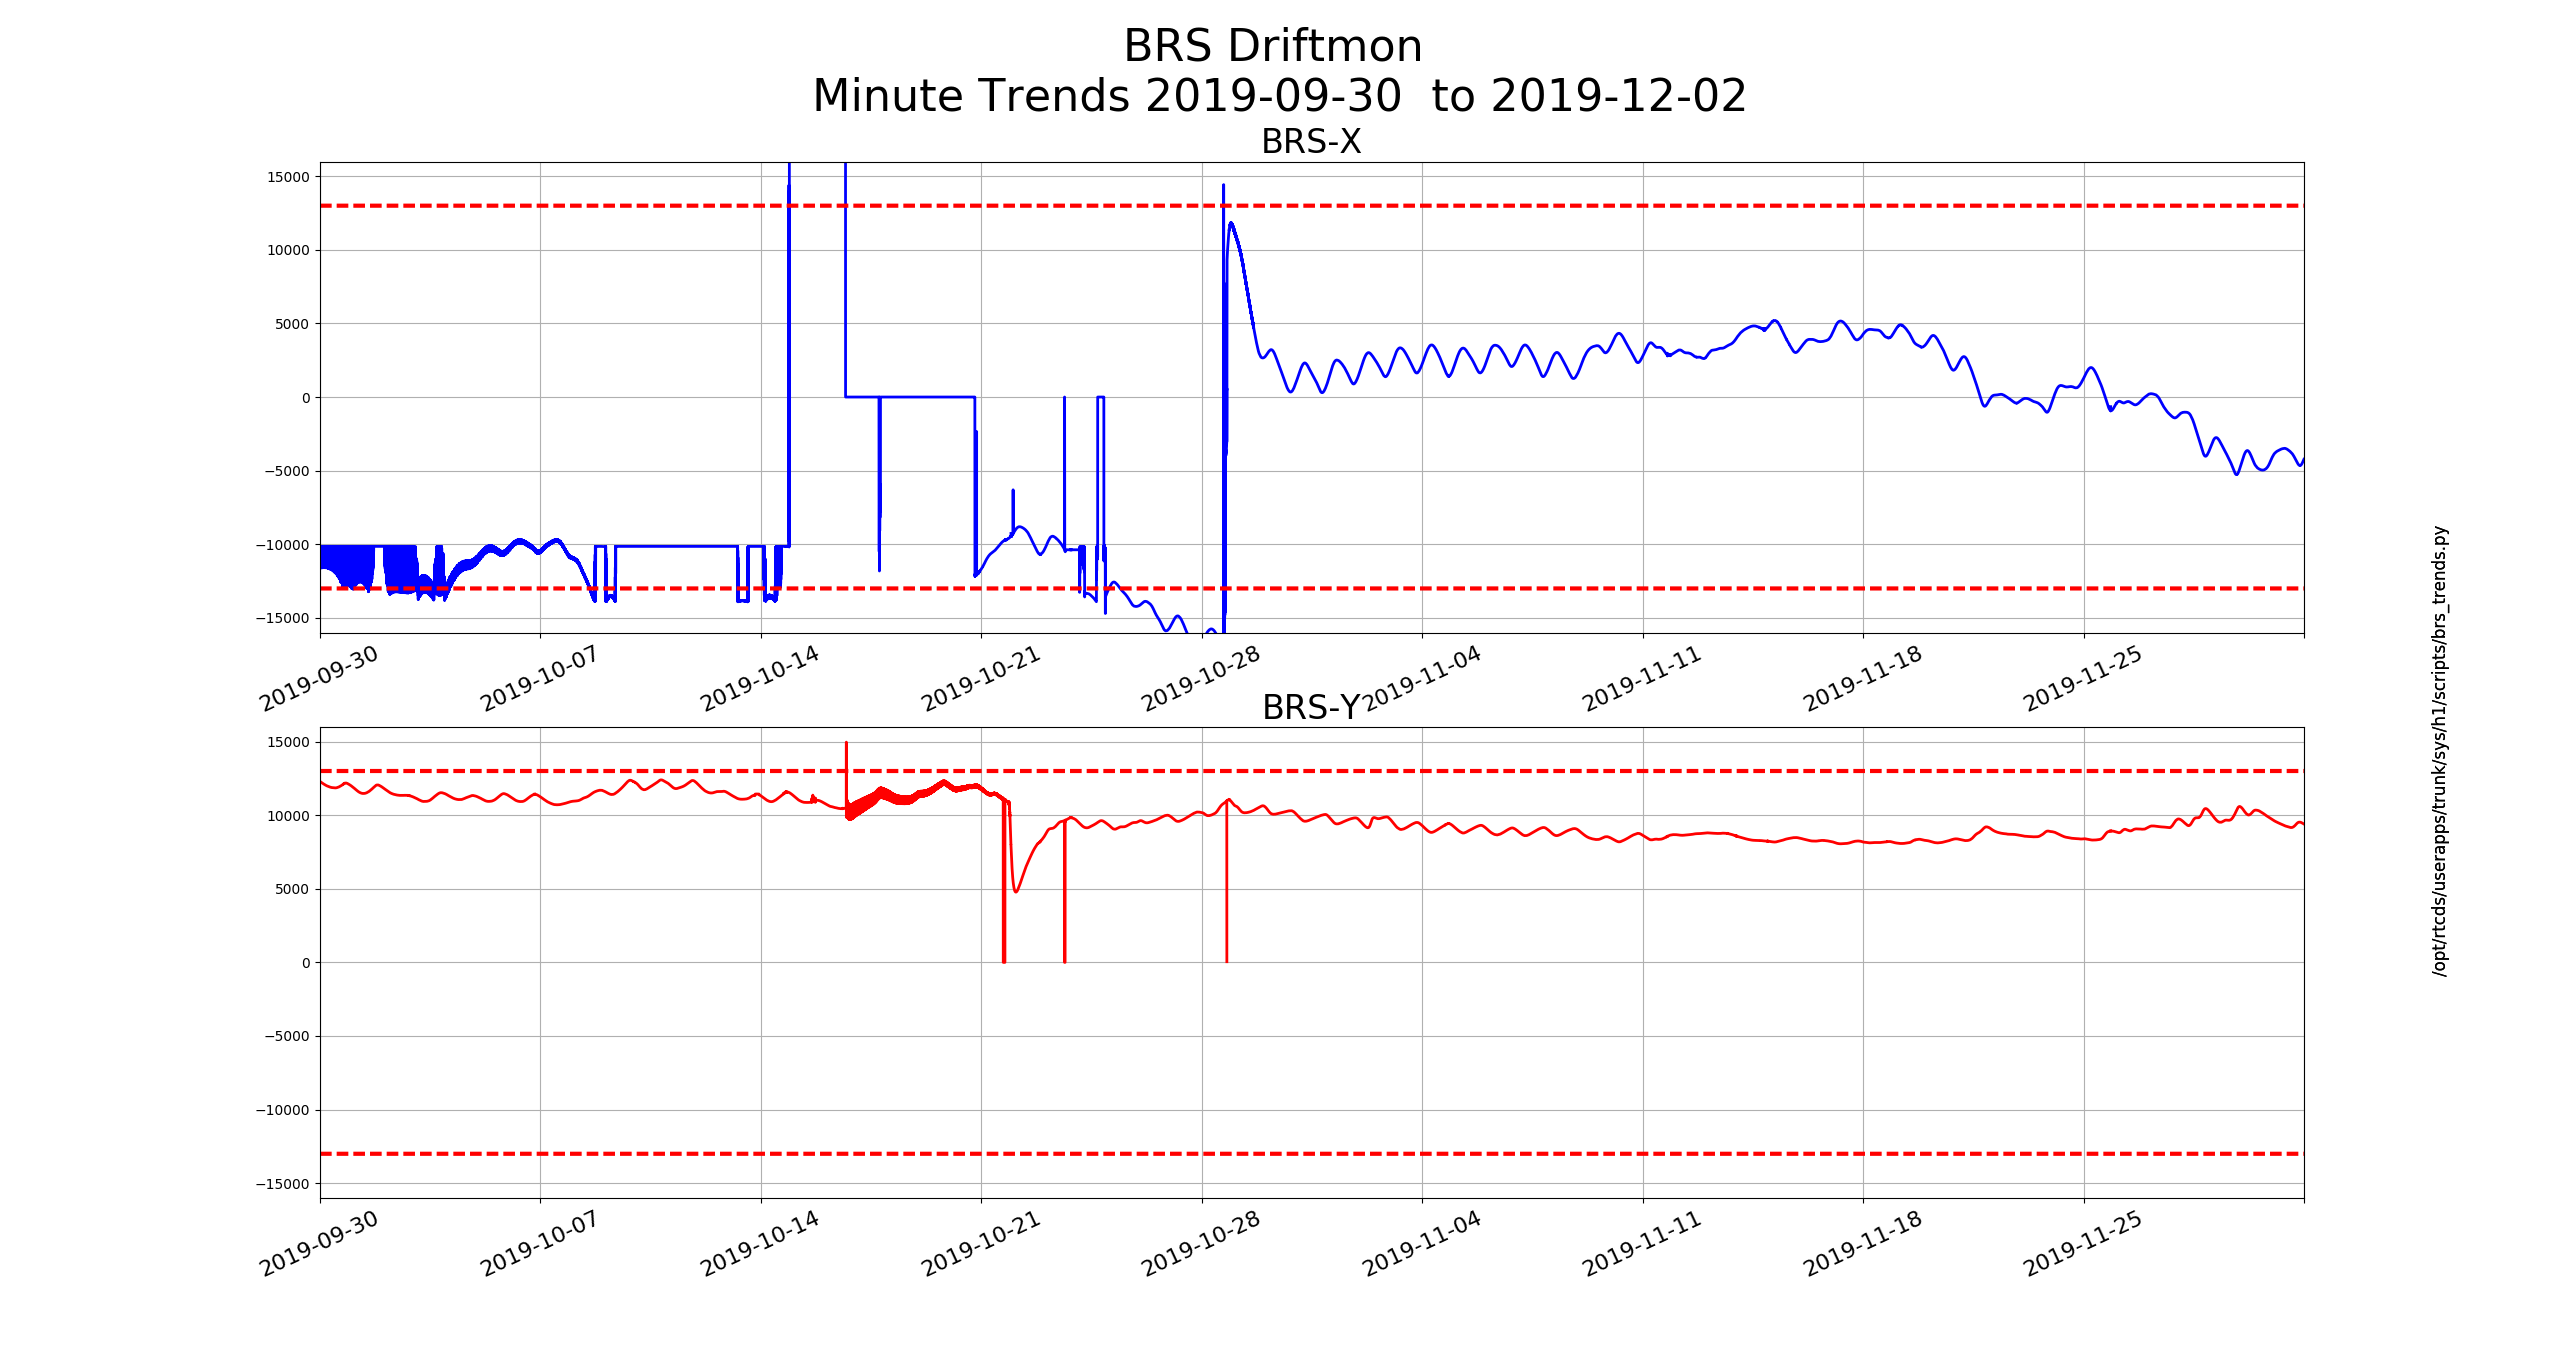
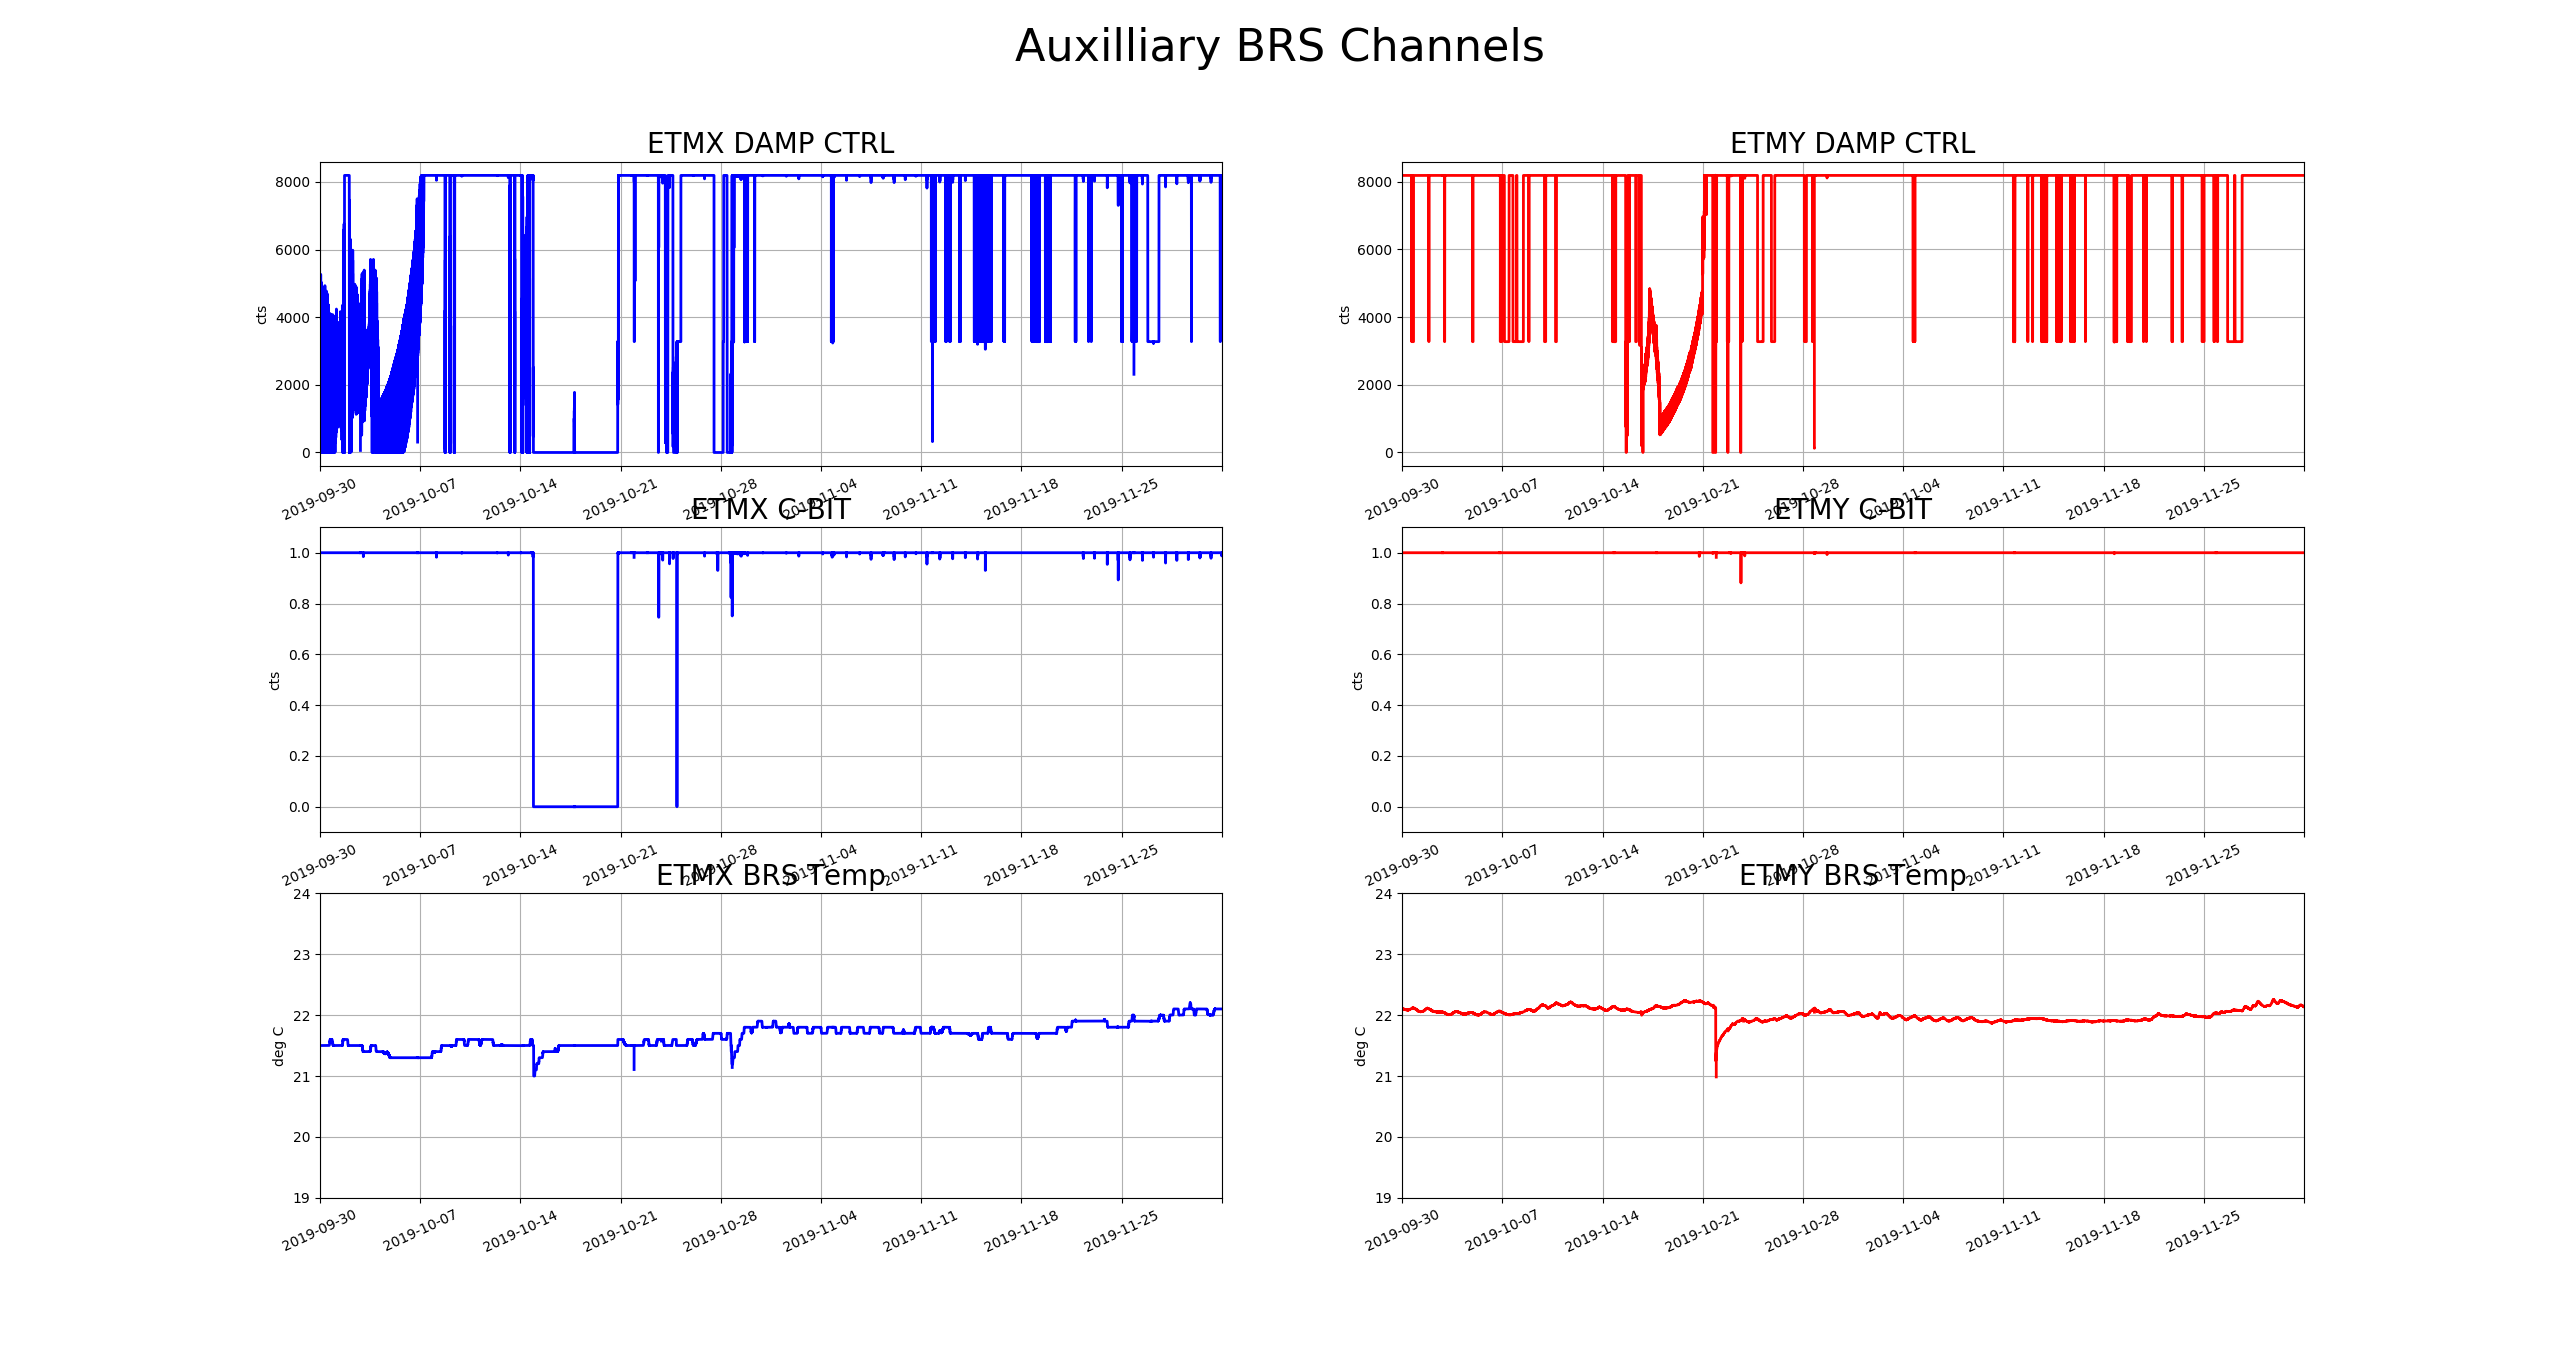
FAMIS 9245 Trends attached. BRS Y may be a little high.
TITLE: 12/03 Day Shift: 16:00-00:00 UTC (08:00-16:00 PST), all times posted in UTC
STATE of H1: Observing at 21Mpc
INCOMING OPERATOR: Patrick
SHIFT SUMMARY: H1 locked all shift, brief exits from Observe
LOG:
[Sudarshan, Sheila]
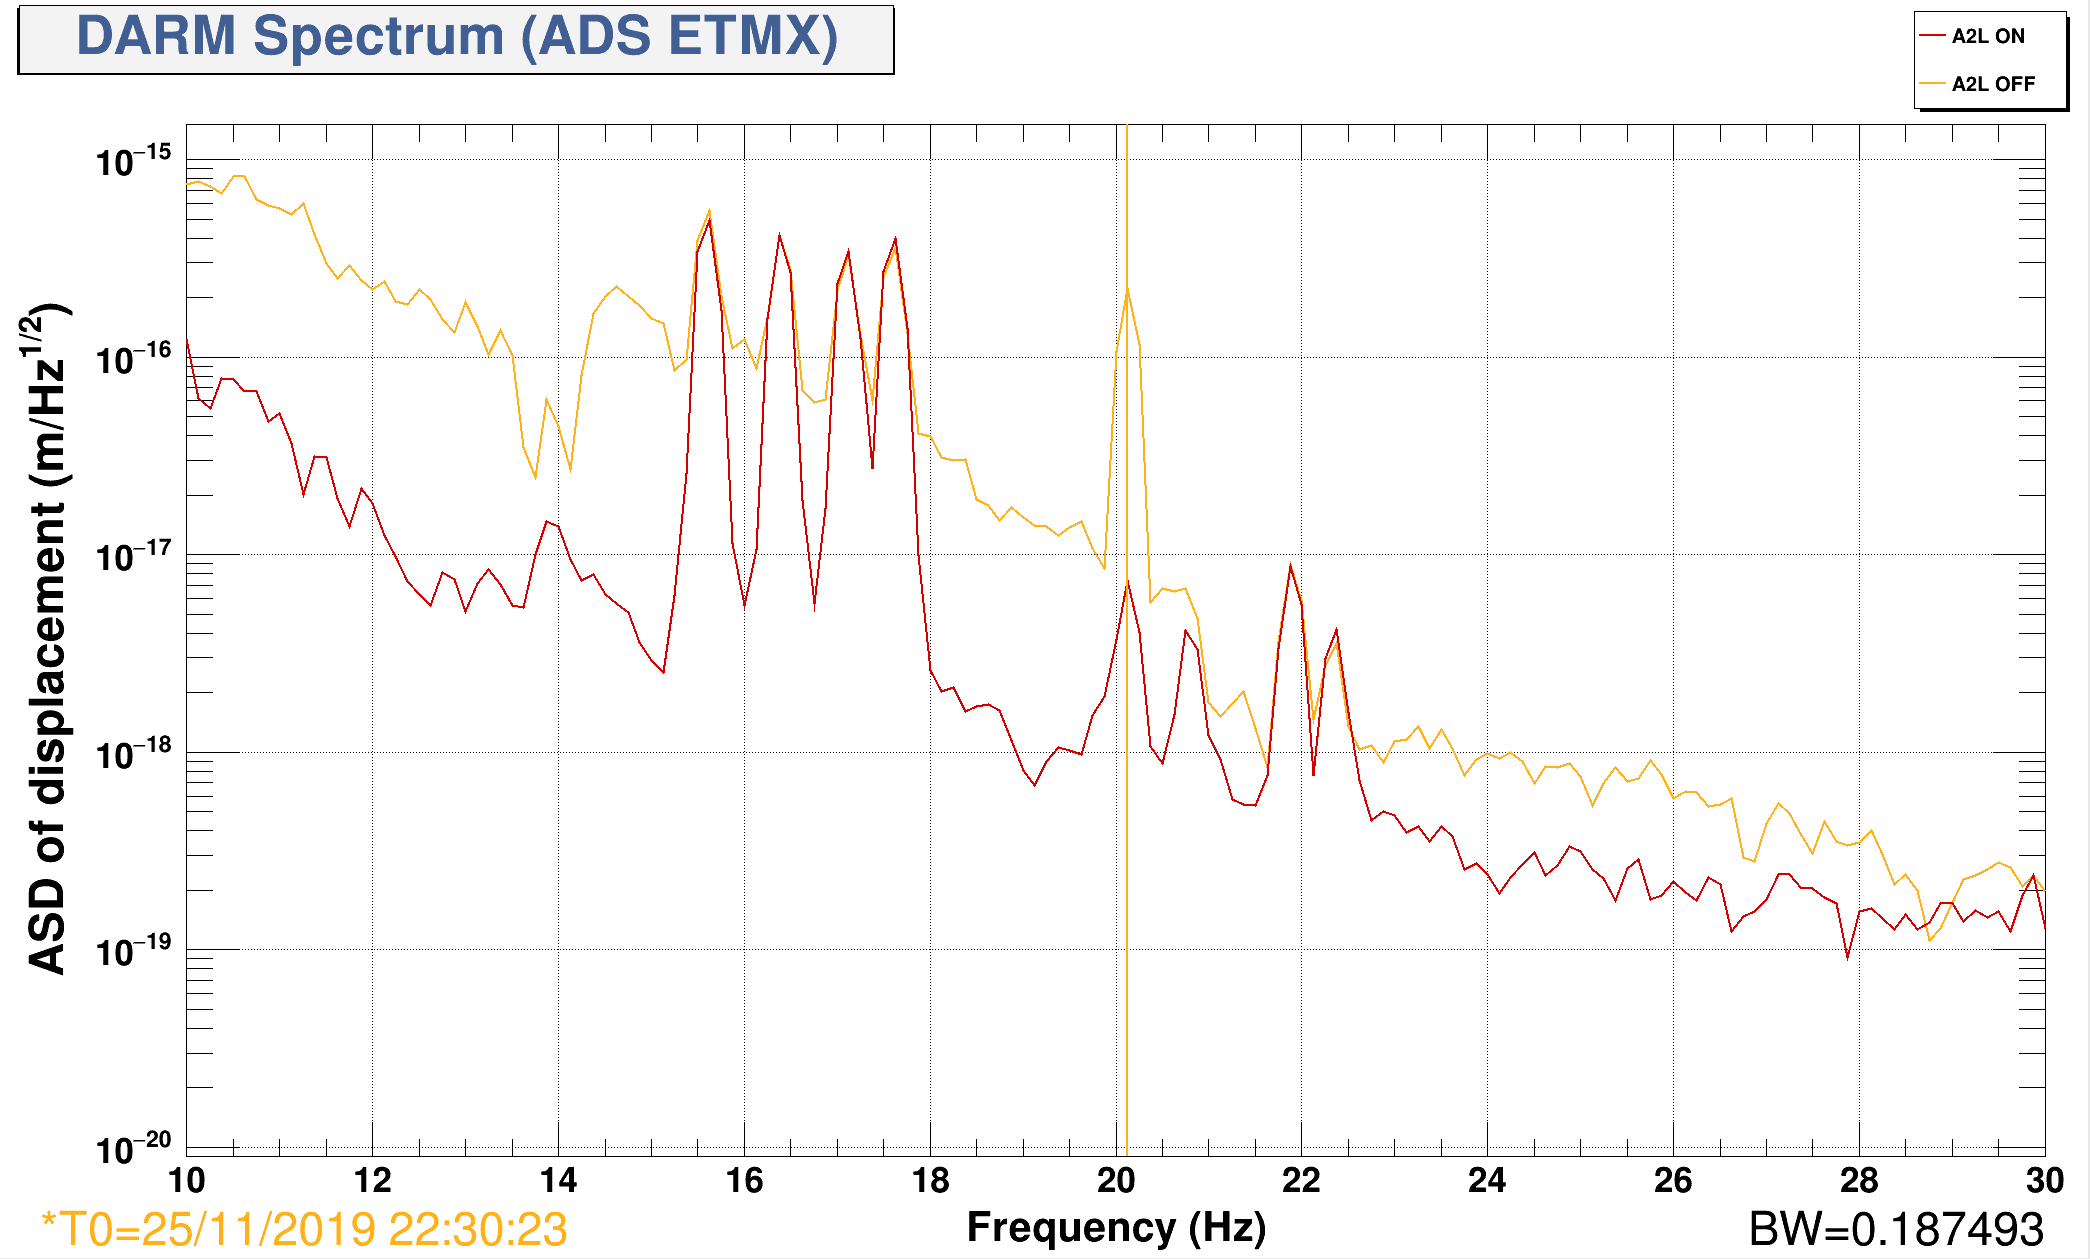
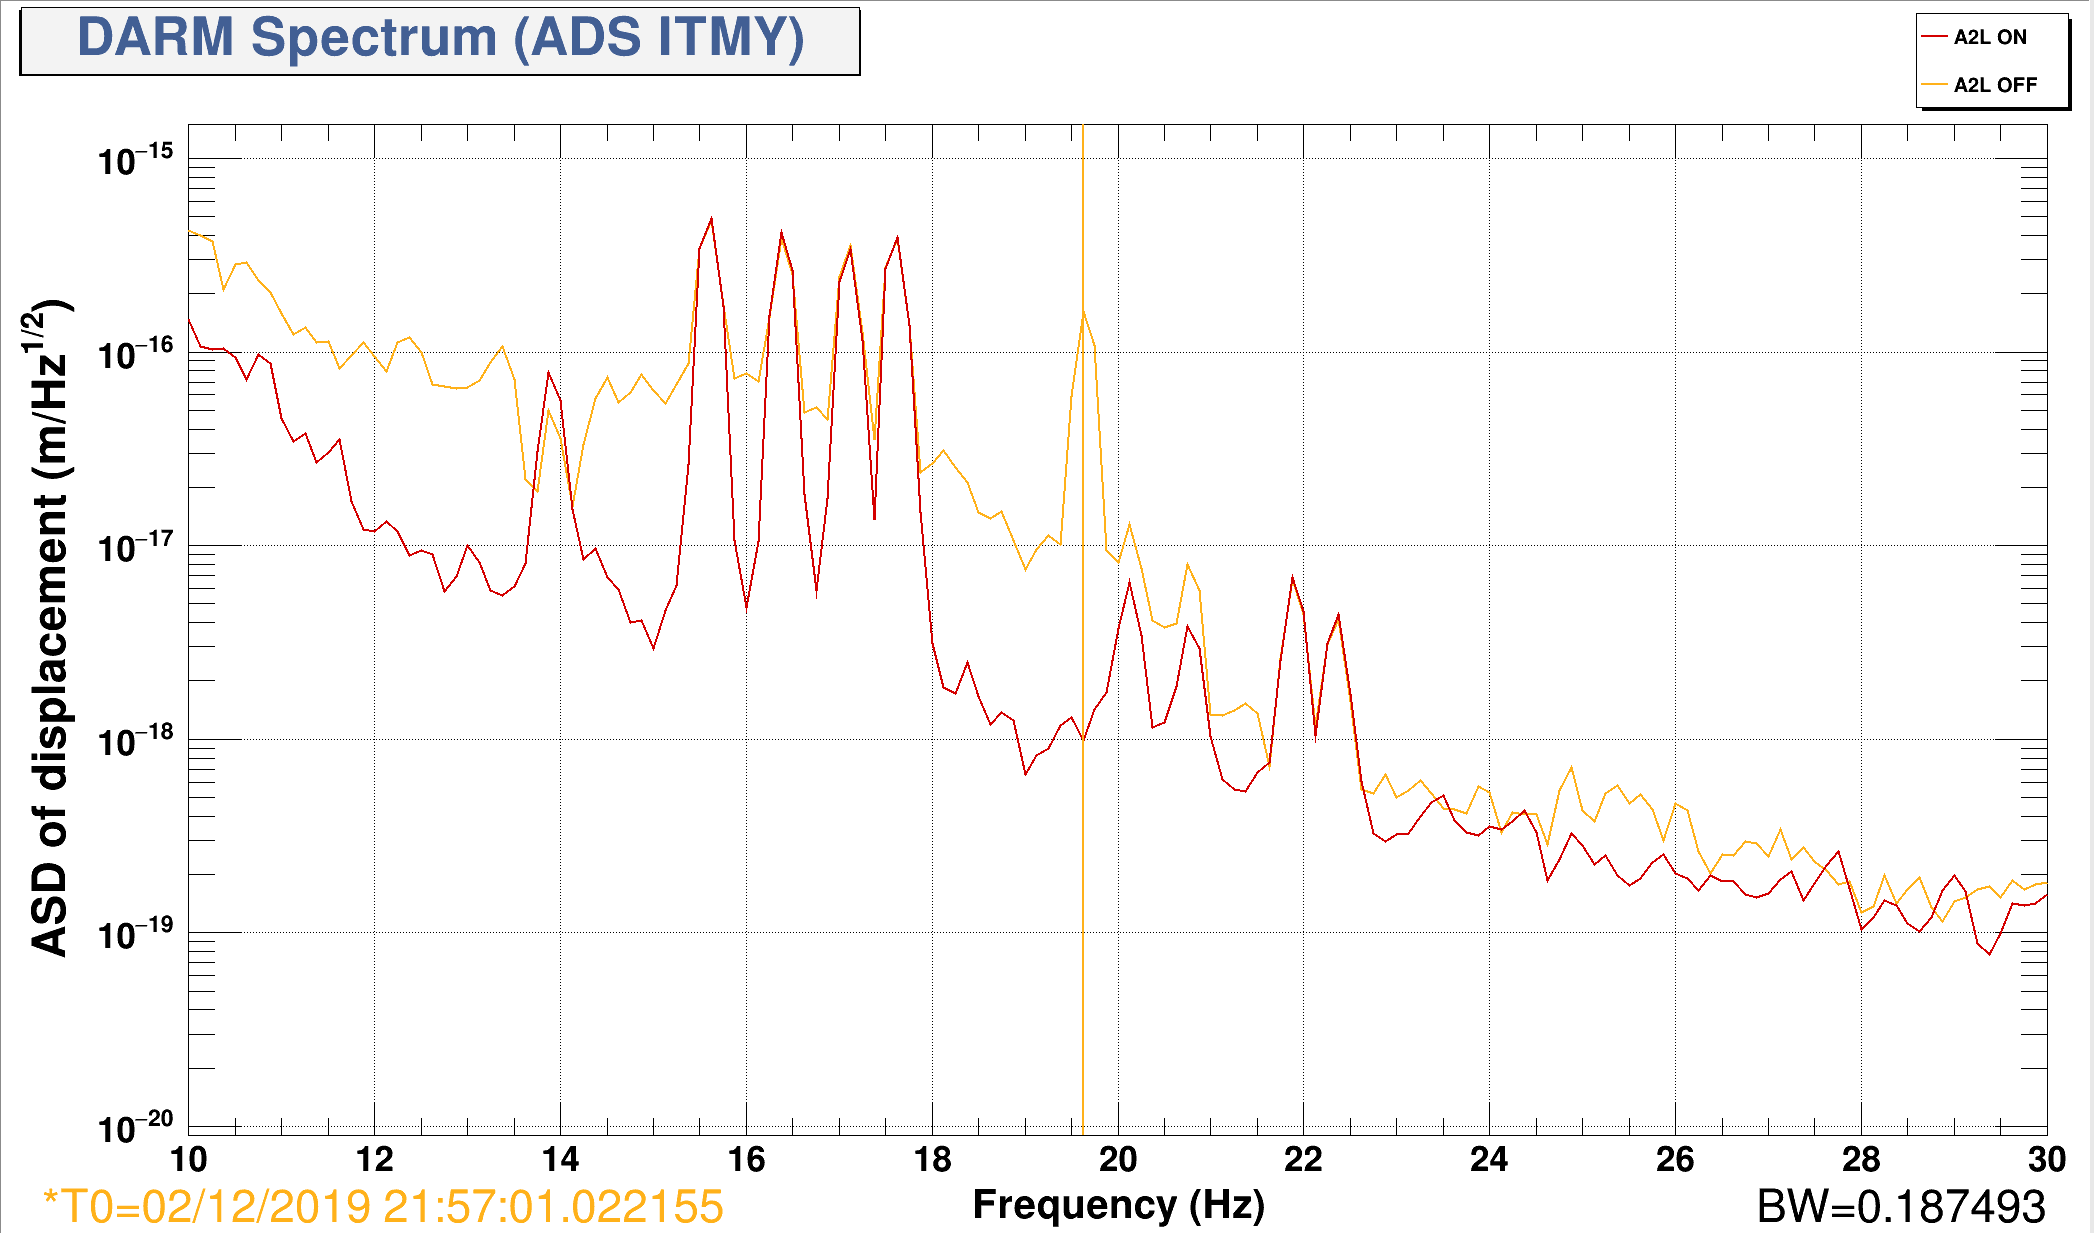
We turned off the A2L filters on ETMX last week to see how much of the ADS line shows up in DARM, compared to when the filters are on. At the ADS line frequency, we saw about factor of 30 suppression with the A2L filter engaged (Attached Fig 1). Today we tried similar measurement with ITMY and measured the suppression by a factor of 165 at the line frequency (Attcahed Fig 2). The fact that ADS lines with similar amplitude gets suppressed to the noise level at ITMY and not at ETMX seems to suggest there might be some frequency dependent A2L coupling associated with ETMX (A2L digital filter is currently a scalar). We have additional measurements on the can (and some planned) for further investigations.
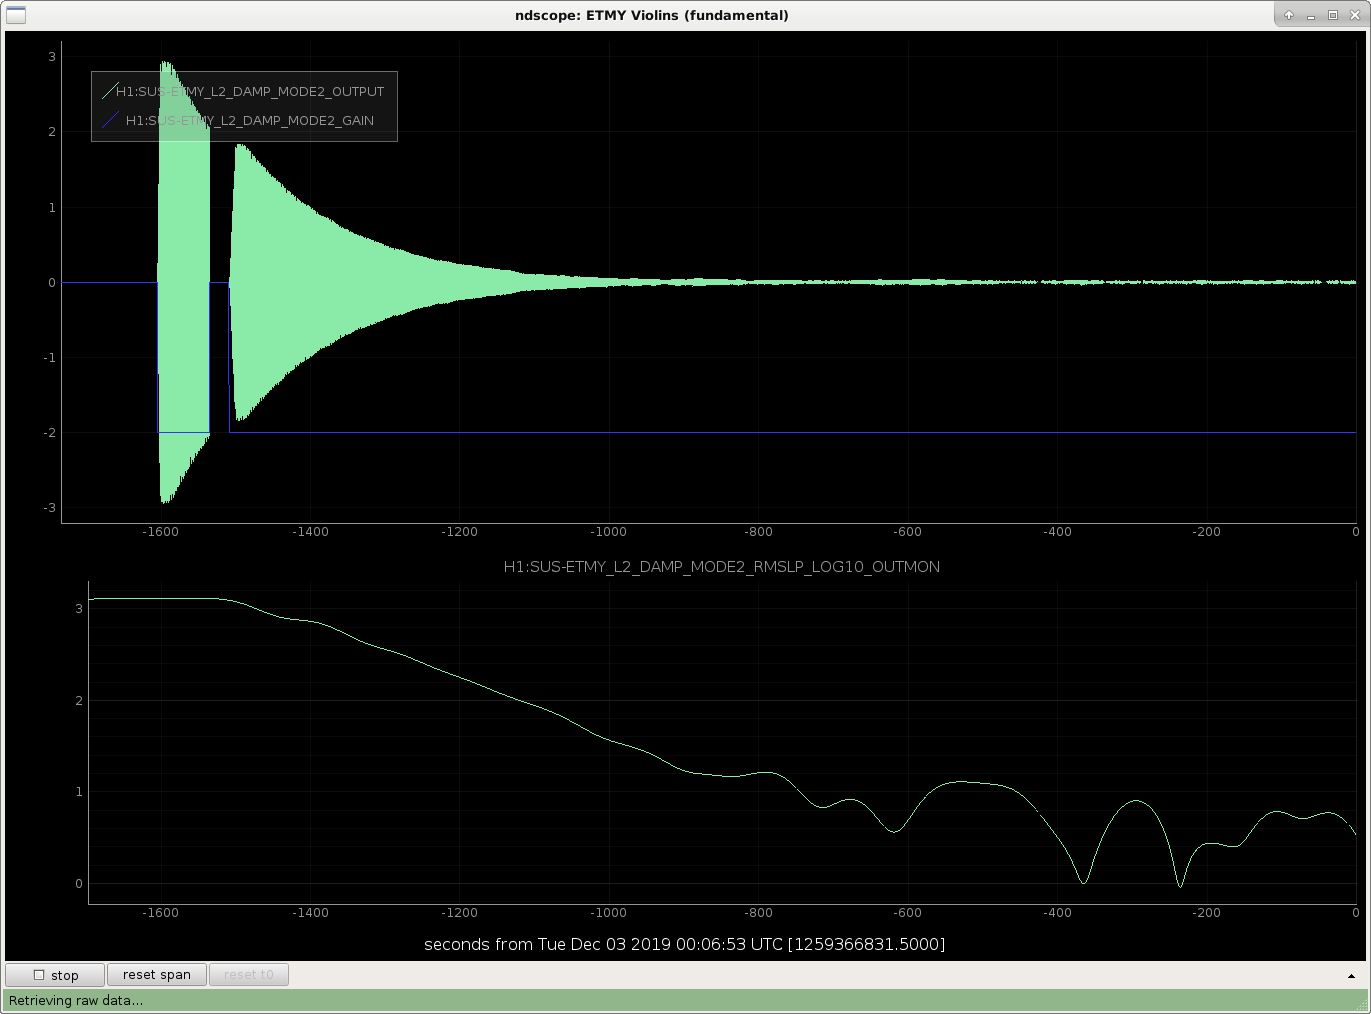
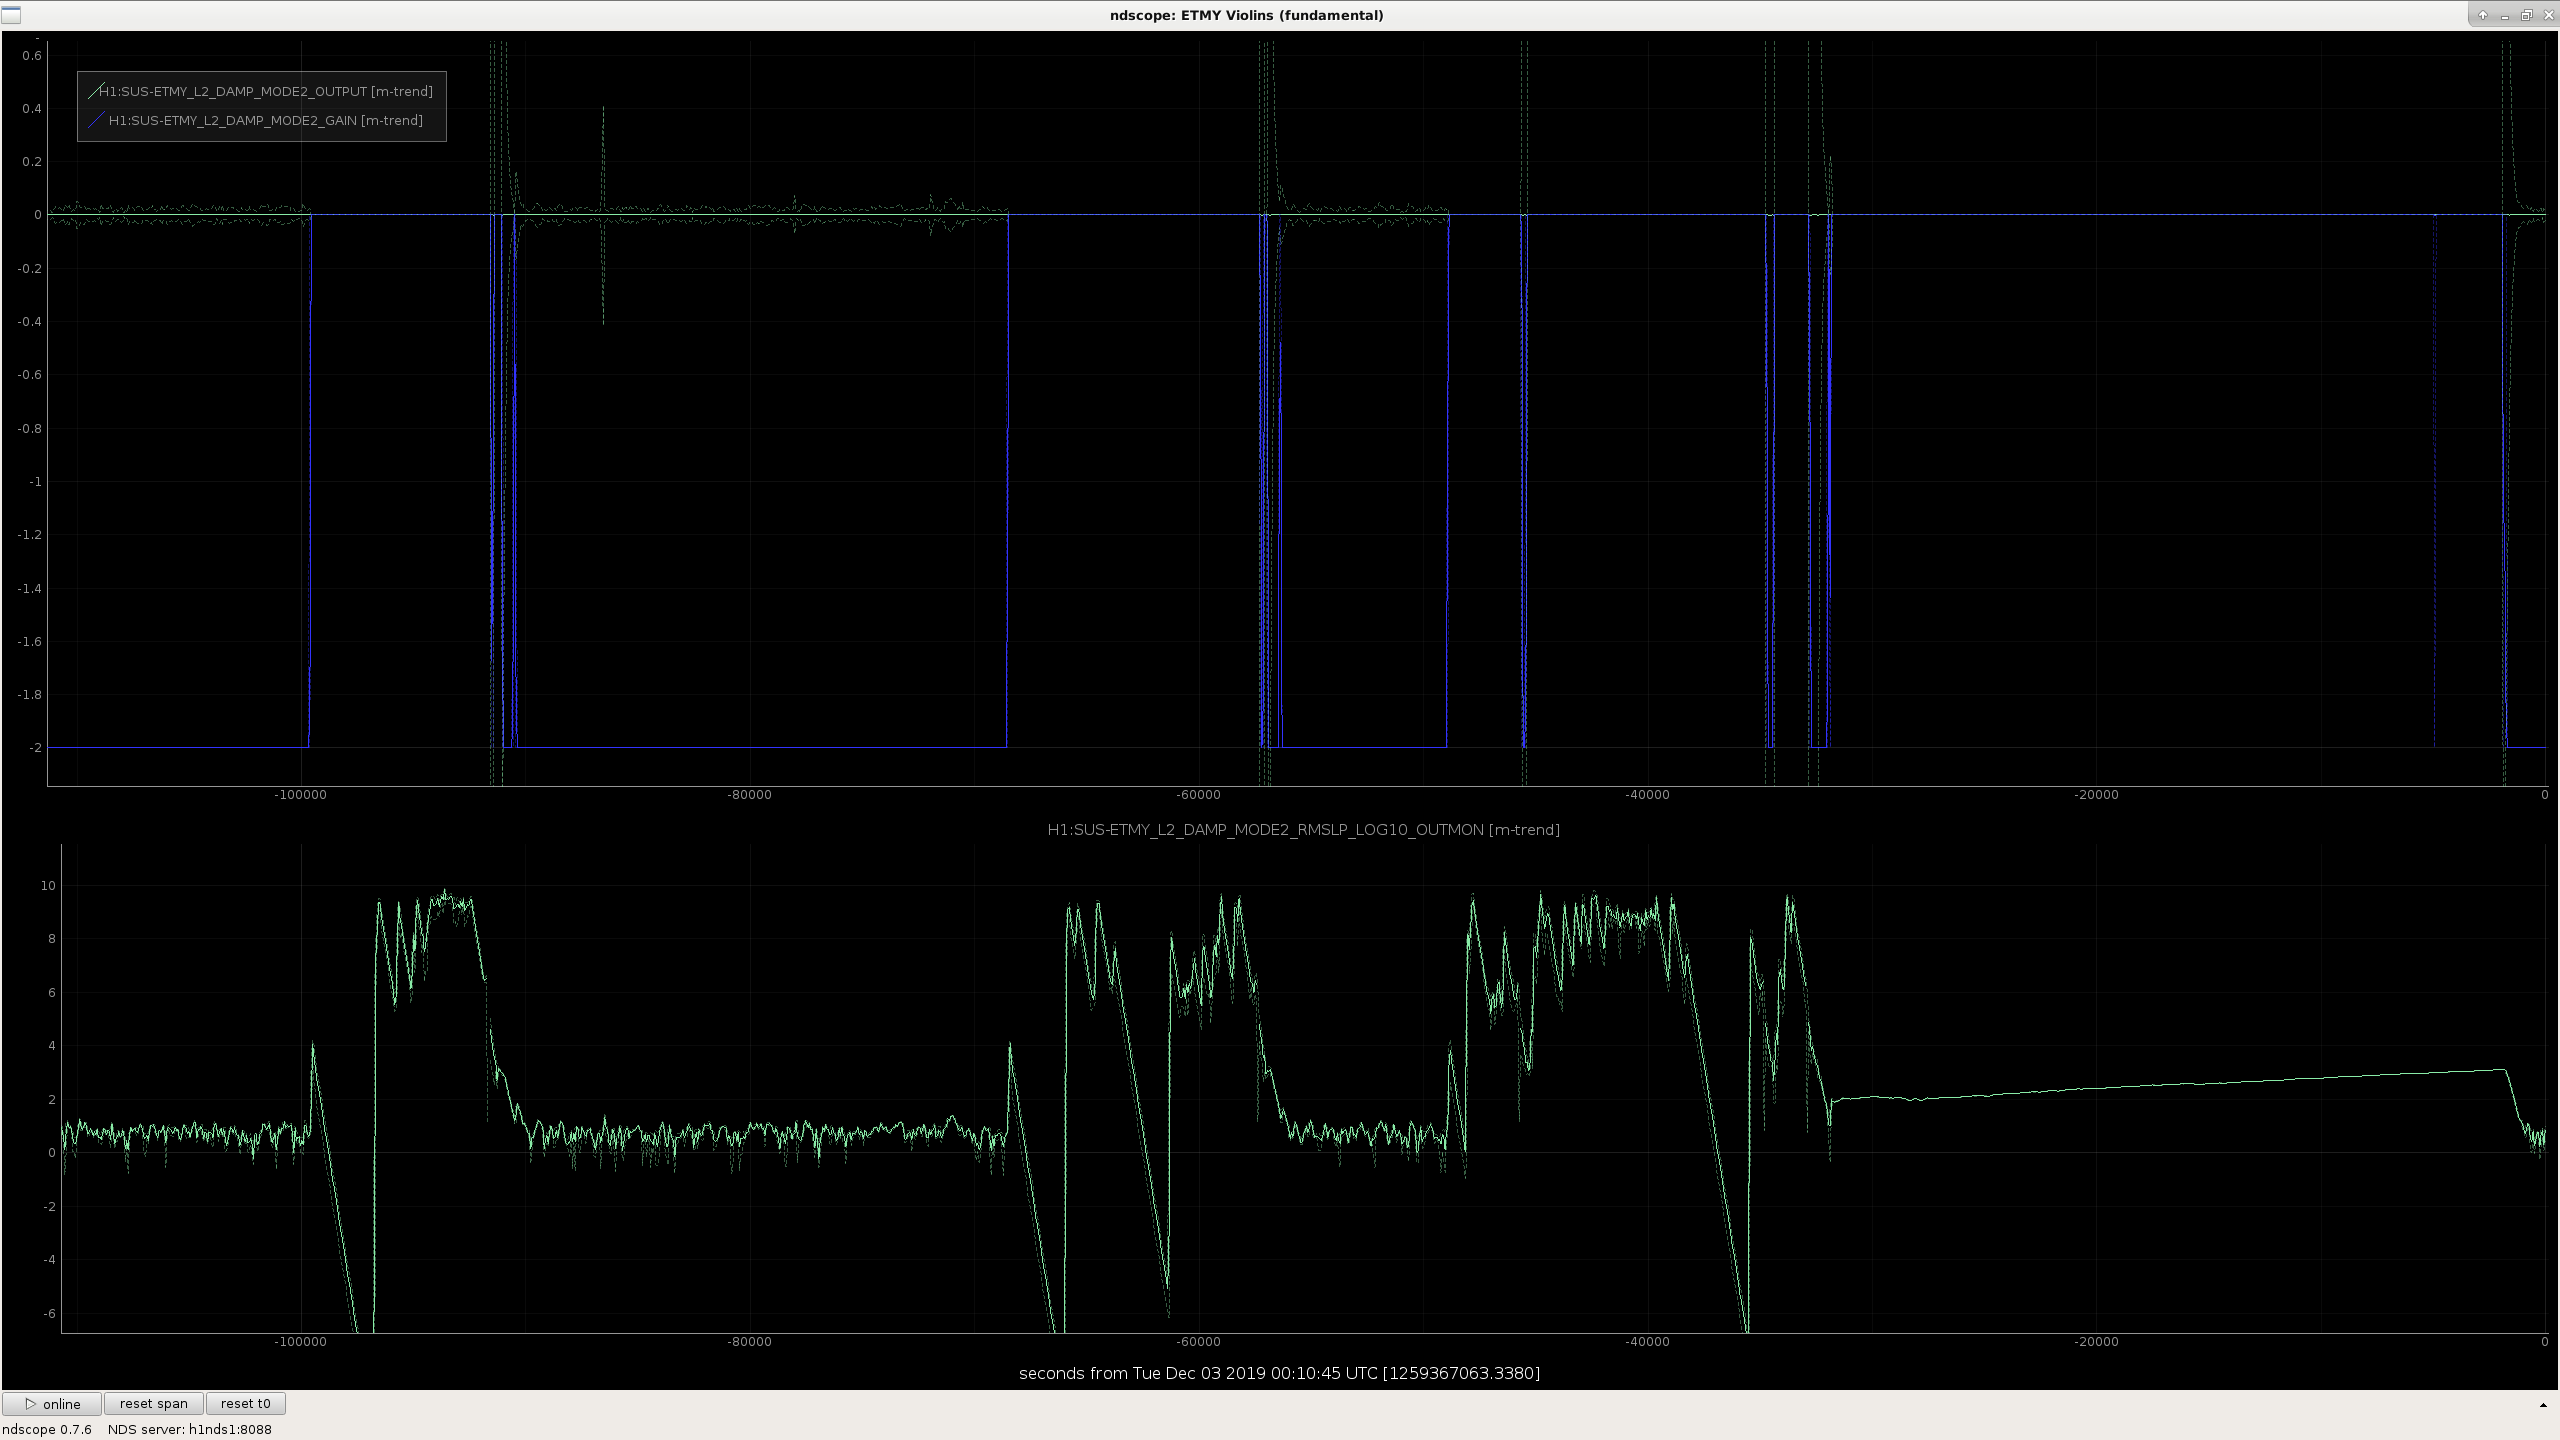
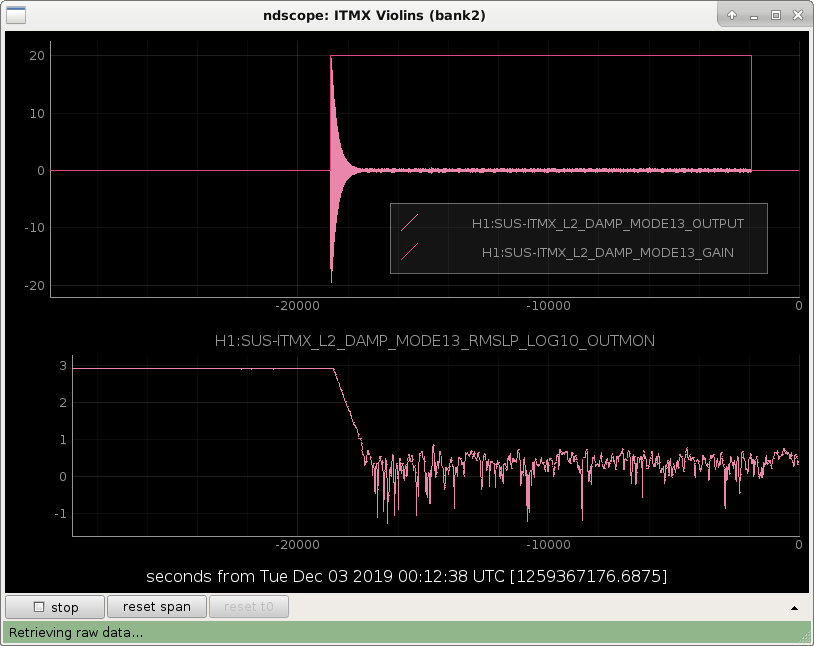
ETMY violing mode 2 damping was turned off by guardian at the beginning of the lock, and without damping, this mode consistantly rings up. The RMS crossed over 3.0, so I took H1 out of Observe, Camila damped the mode, and put H1 back in Observe.
J. Kissel While we continue investigate the parasitic cross-coupling with the low-frequency sensing function a.k.a. the DARM plant (see e.g. LHO aLOG 53378), we're stuck with just taking whatever the IFO gives us as far as a response below 20 Hz. Unfortunately this feature has resumed being time dependent (unlike the ~1 month between "after we installed the 100 ct offset on 2019-08-28" and "the end of O3A on 2019-10-01"). Obnoxiously, with only ~5 data sets so far, we can only say that that time dependence is bi-modal: in the first two weeks the response is different from the most recent two weeks. Check out the attached collection of data, from 2019-10-31, 2019-11-04, 2019-11-11, 2019-11-20, and 2019-11-27. One can see two things: (1) The bi-modality of the data below 30 Hz (though, yes, the 2019-10-31 data set appears to have yet a third response) (2) That the 2019-09-09 model used at the tail end of O3A is still quite good above 30 Hz, and the systematic error between these data sets and the model are still below the threshold in which we say "we really need to do something about this," which -- according to studies in G1901479 -- is "the systematic error of any one measurement show be no more than 8 (,16) % or 5 (,10) deg at 20 (,15) Hz (assuming the error is decreasing as a function of frequency as has been seen in the past)." Further unfortunately, until we have a good model of what's happening between the mixing of detuning vs. L2A2L, and/or more than one metric such that we can separate the tracking, we have no good way to re-contruct the frequency dependent change in response with a few parameters derived from, calibration lines (like what we normally do with the optical gain, DARM coupled cavity pole frequency, the ESD actuator strength, etc). Thus, we'll have to move forward with what has been done for the first parts of O3A, force the uncertainty in our unknown systematic error (i.e. the GPR fit to residual between model and collection of measurements and it's associated uncertainty) to be some value that we believe sufficiently covers the realm of possibility of this response (within a 68% confidence interval). Sad that we have to rely on such human metrics, but so be it!
J. Kissel, As we've done in O3A (see LHO aLOG 51245), I hold this space for documenting start times of high-frequency roaming calibration line sweeps to be used for estimating the sensing function uncertainty above 1 kHz. (All times UTC) 2019-11-01 16:55:02 HIGH_FREQ_LINES guardian reinitialized for the Start of O3B, starting at 4001.3 2019-11-12 18:35:25 data not found on ndscope while only shortly at last data point, 1001.3, [CAL EX / EY front-end models restarted, and filter coefficients updated; see LHO aLOG 53188 LHO aLOG 53210] resumes at 2019-11-12 18:38:37 re-started at 4001.3 Hz 2019-11-21 00:49:47 re-started at 4001.3 Hz 2019-11-29 14:40:20 re-started at 4001.3 Hz (and not yet finished)
Start Date Starttime Endtime
2019-11-01 1256662520 1257619135
2019-11-12 1257619135 1258332605
2019-11-21 1258332605 1259072078
2019-11-29 1259072078 1260382861
2019-12-14 1260382861 (not yet finished)Start Date Starttime Endtime
2019-11-01 1256662520 1257619135
2019-11-12 1257619135 1258332605
2019-11-21 1258332605 1259072078
2019-11-29 1259072078 1260382861
2019-12-14 1260382861 1261341875
2019-12-25 1261341875 1262275805
2020-01-05 1262275805 (not yet finished)
Start Date Starttime Endtime
2019-11-01 1256662520 1257619135
2019-11-12 1257619135 1258332605
2019-11-21 1258332605 1259072078
2019-11-29 1259072078 1260382861
2019-12-14 1260382861 1261341875
2019-12-25 1261341875 1262275805
2020-01-05 1262275805 1263263360
2020-01-17 1263263360 1264044992
2020-01-26 1264044992 1265150433
2020-02-07 1265150433 (not yet finished)
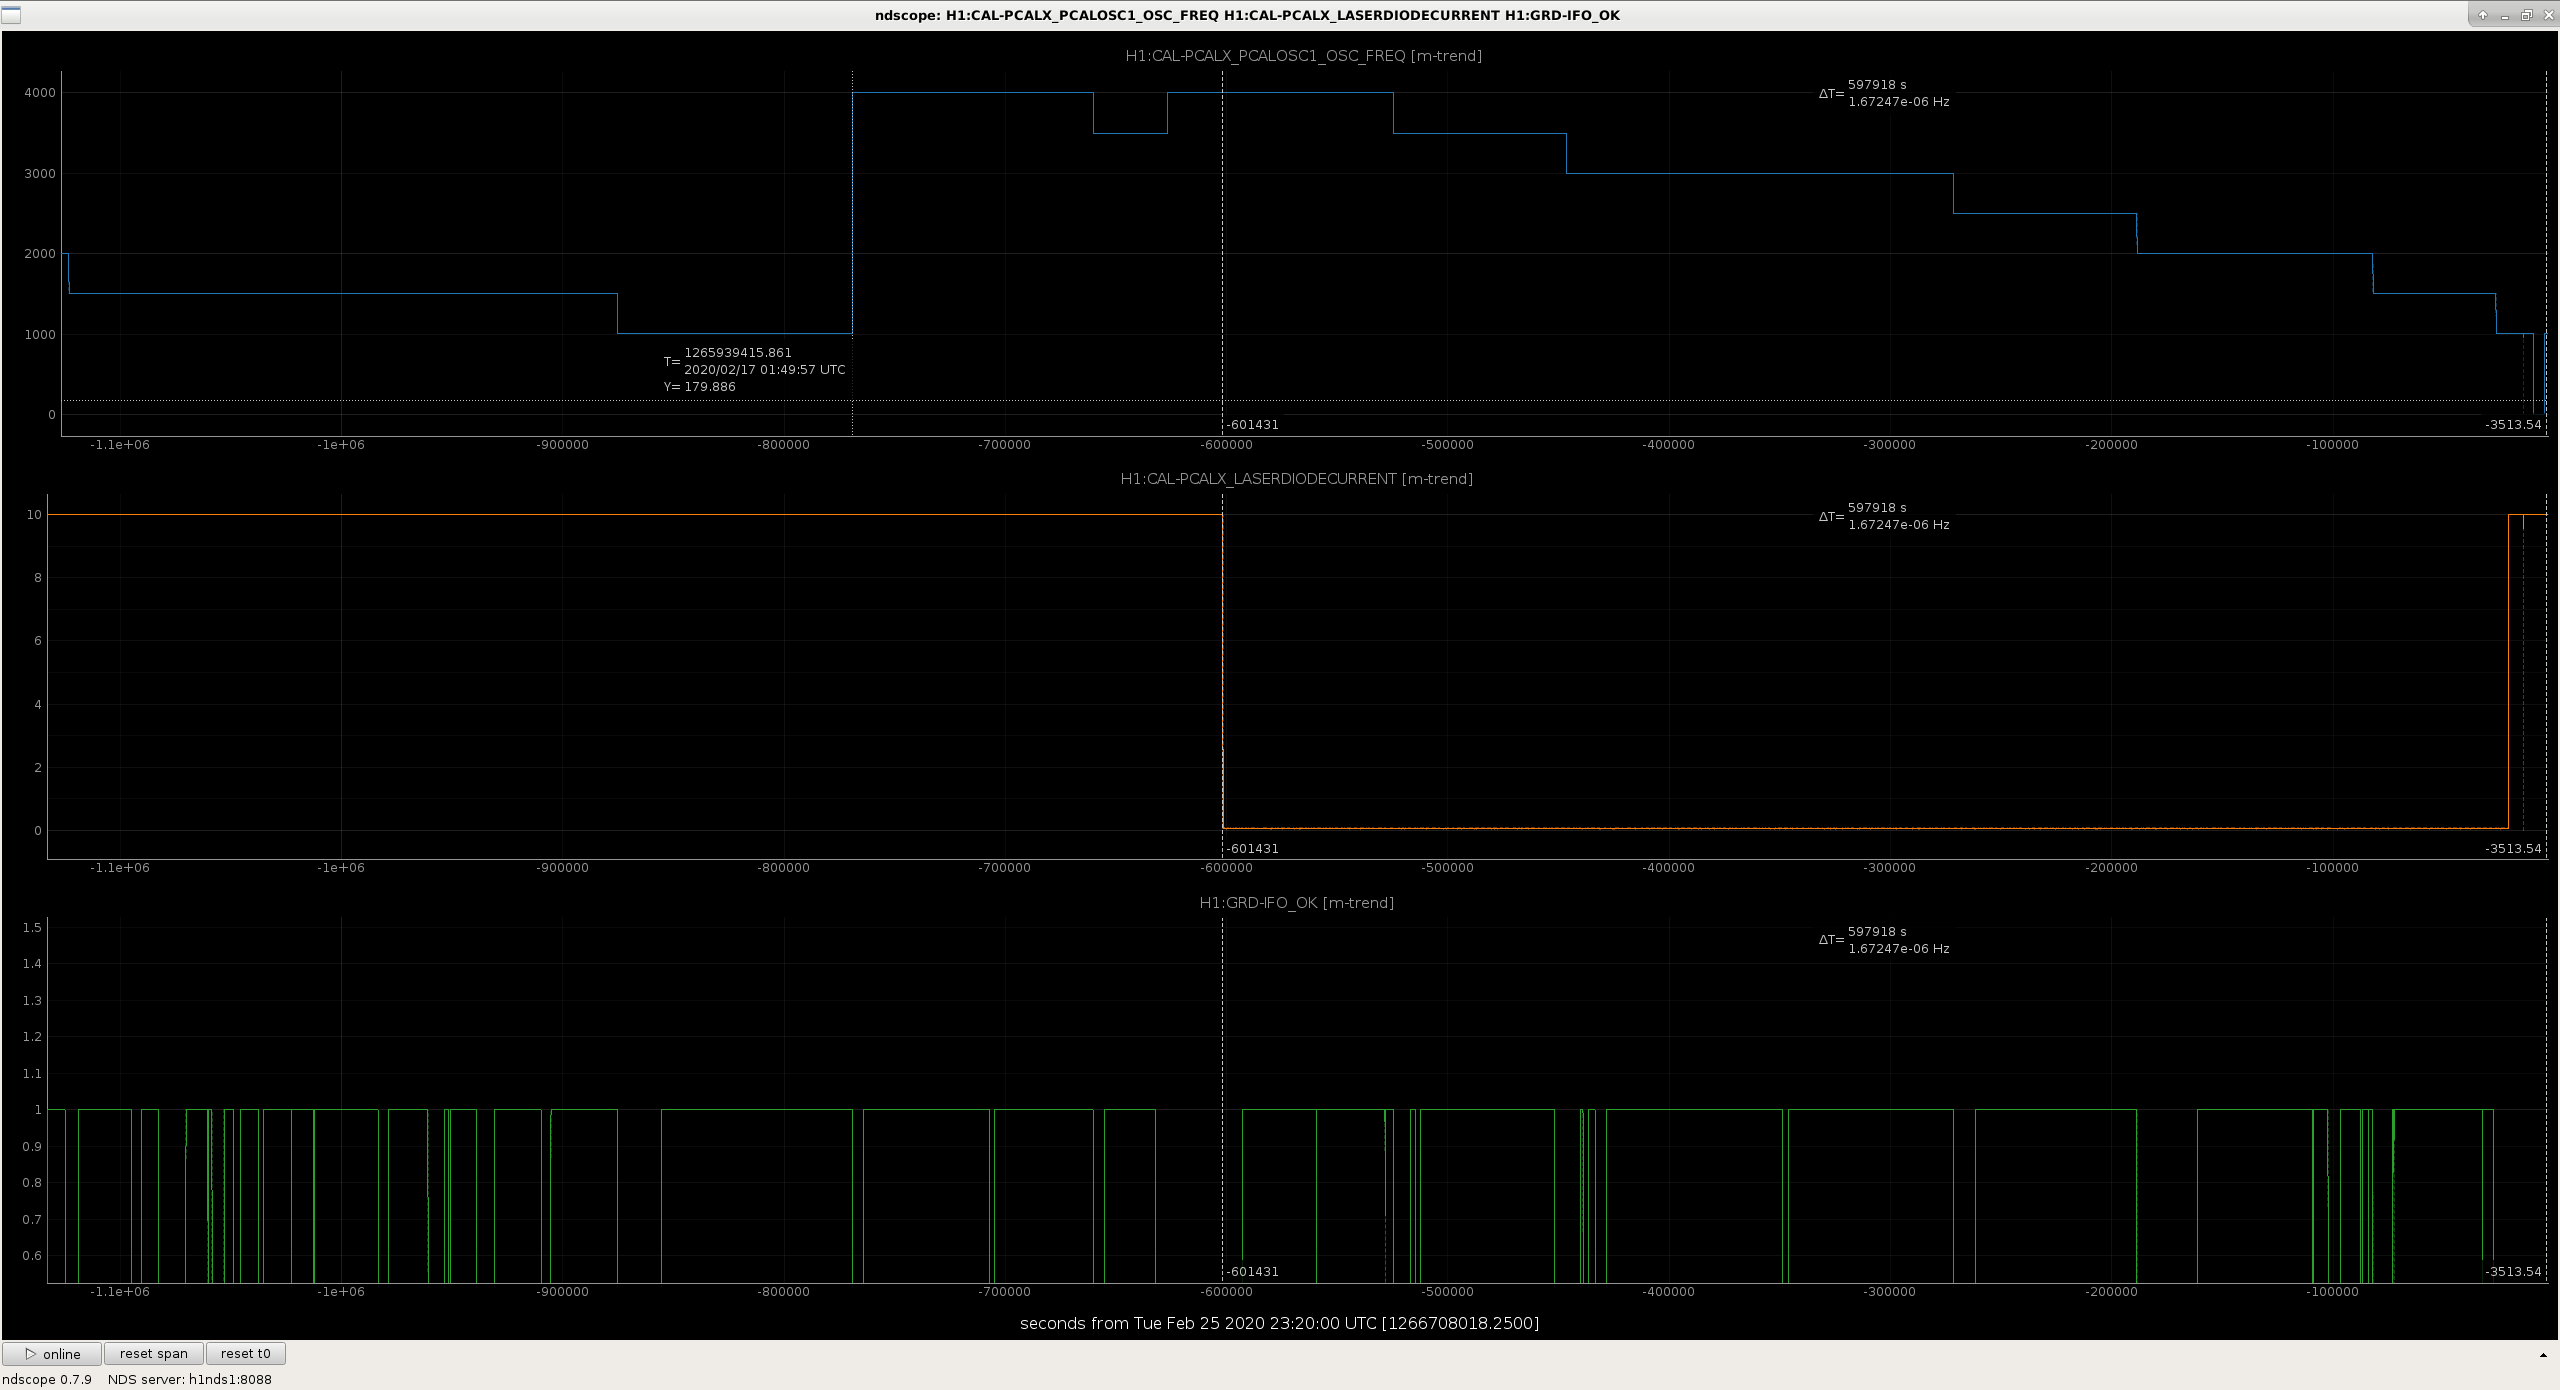
Start Date Starttime Endtime 2020-02-07 1265150433 1265939082 2020-02-17 1265939082 lost because PCALX interlock was inadvertently tripped during the majority of this sweep. I *should* have restarted the sweep upon the fix of the problem today, but was distracted by trying to install a frequency comb and forgot to trend this before we hit OBSERVATION_READY. Had I, I probably would have re-initialized the HIG_FREQ_LINES guardian to restart a new sweep. Ah well. The first OBSERVATION_READY segment that PCALX returns to functionality is at 1266706798 (2020-02-25 22:59:40 UTC), with a frequency of 1001.3 Hz. The guardian should take care of "restarting the sweep" at 4001.3 Hz on the next nominal low noise stretch.
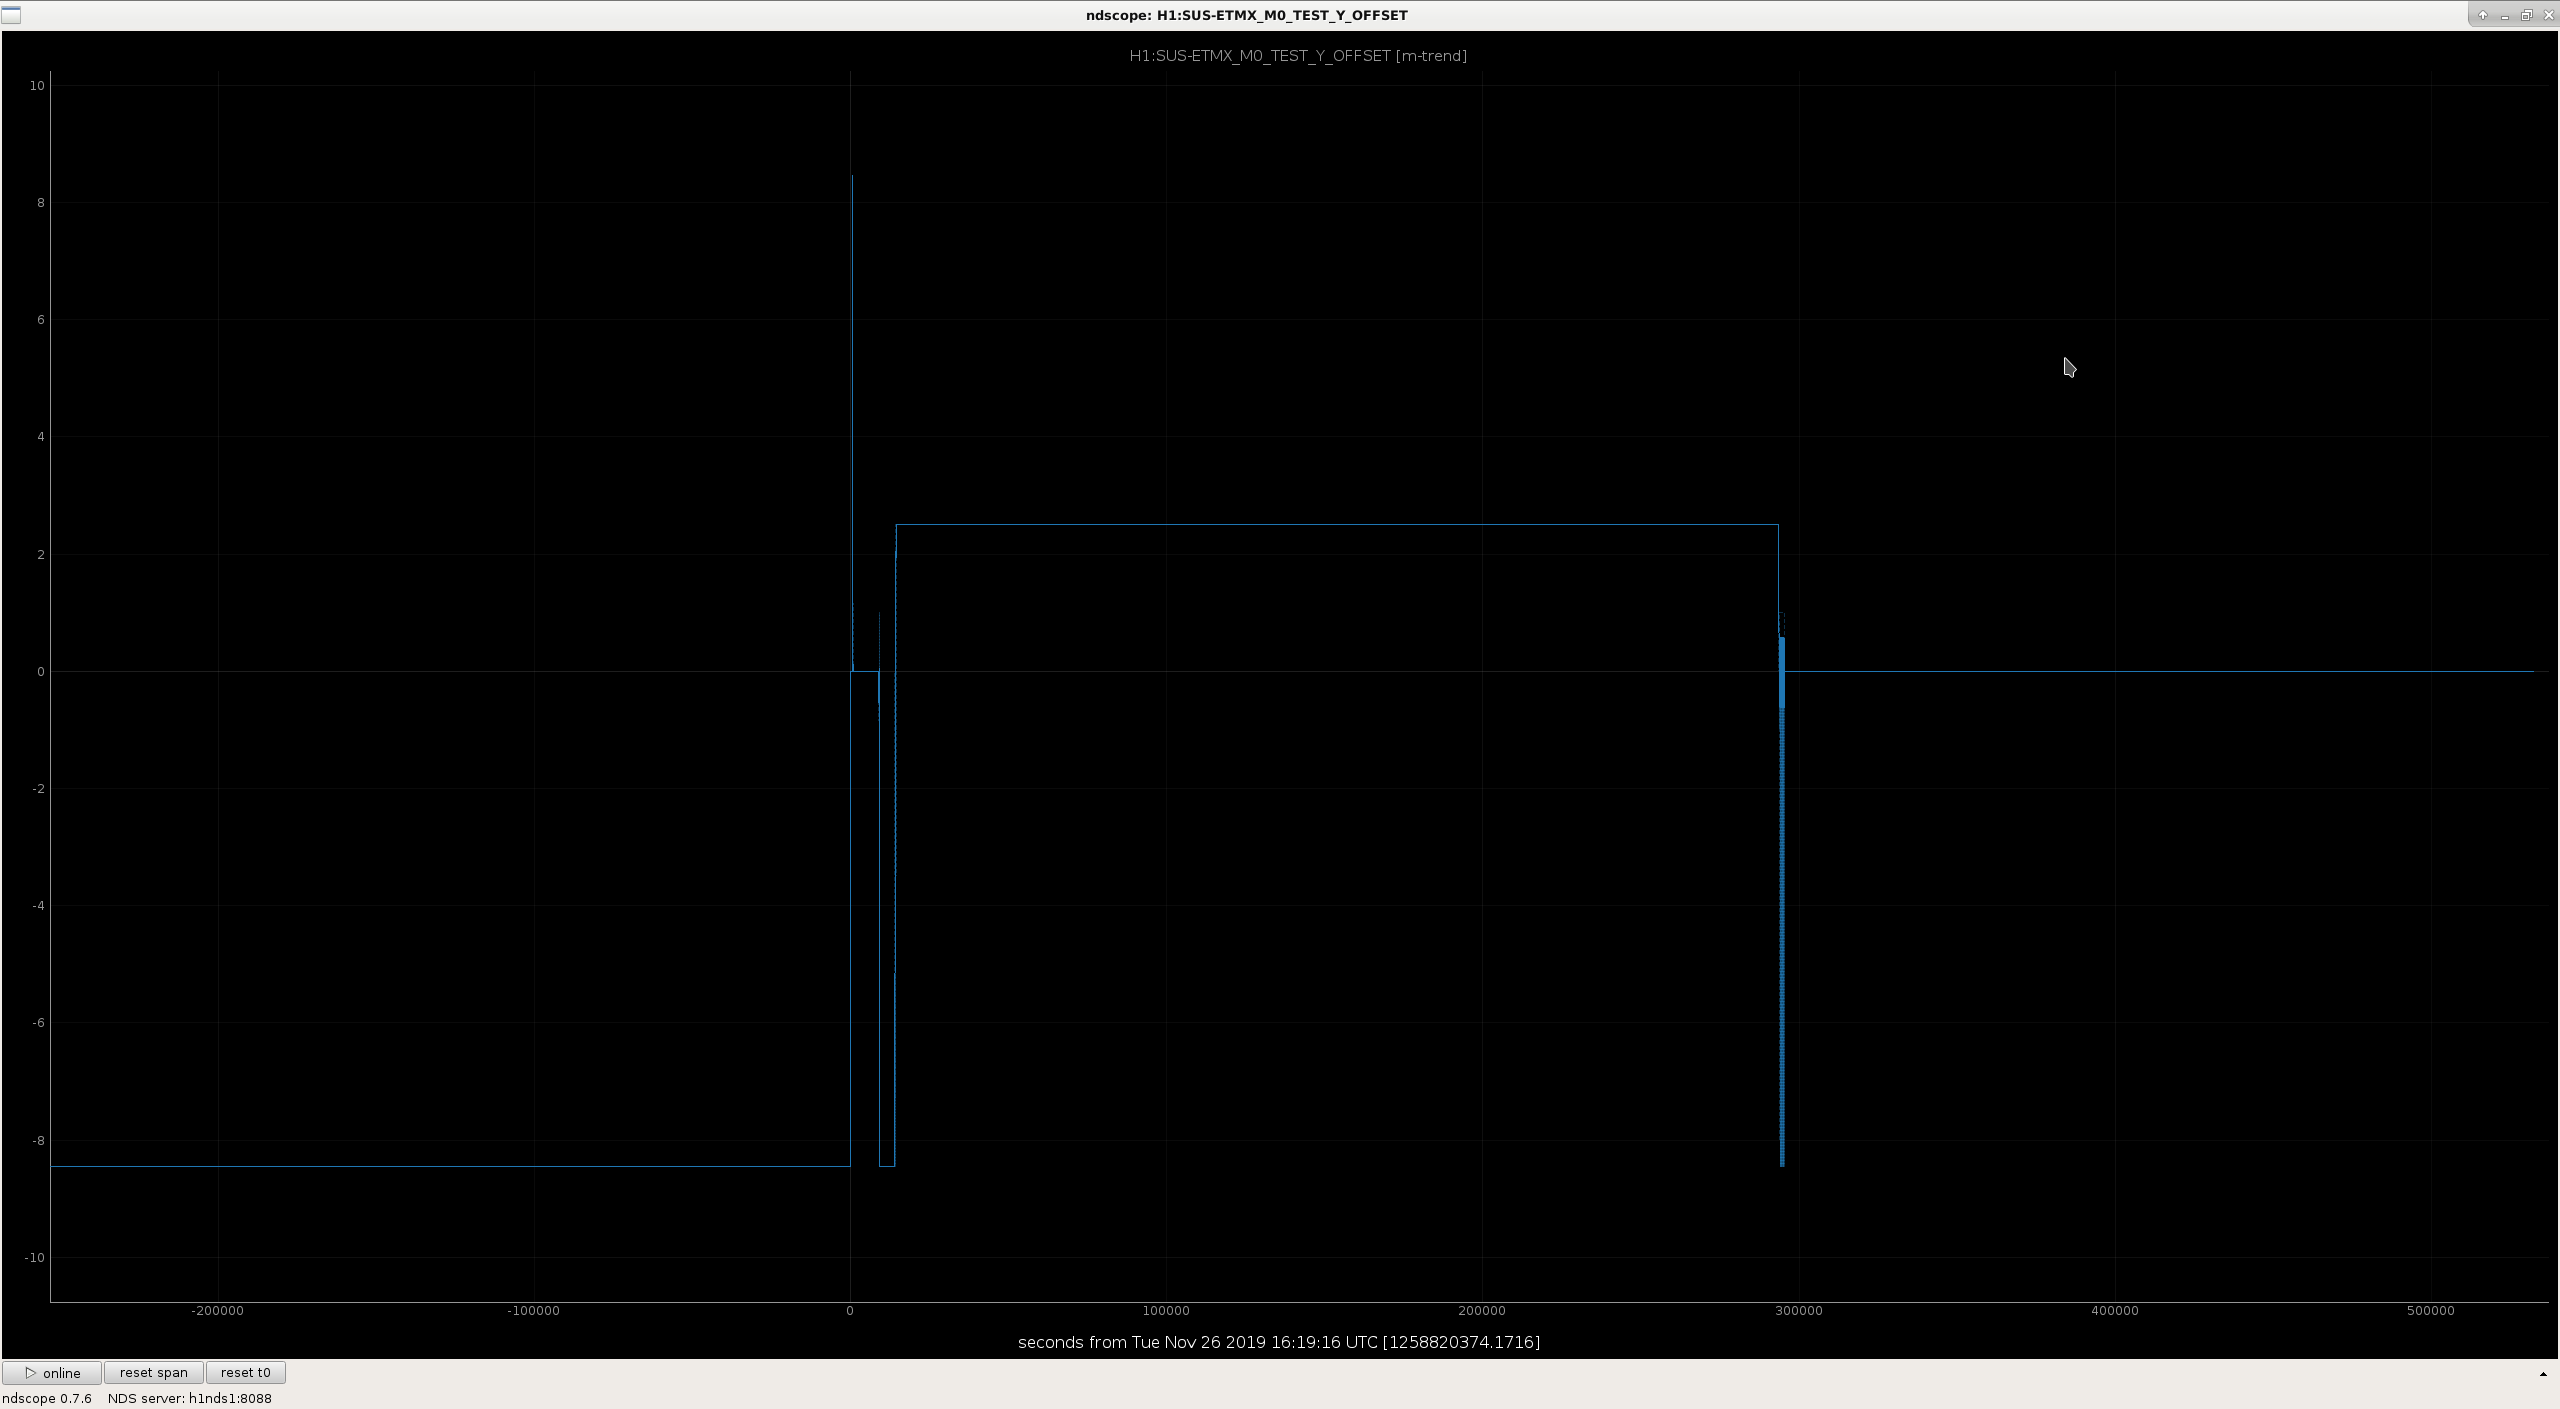
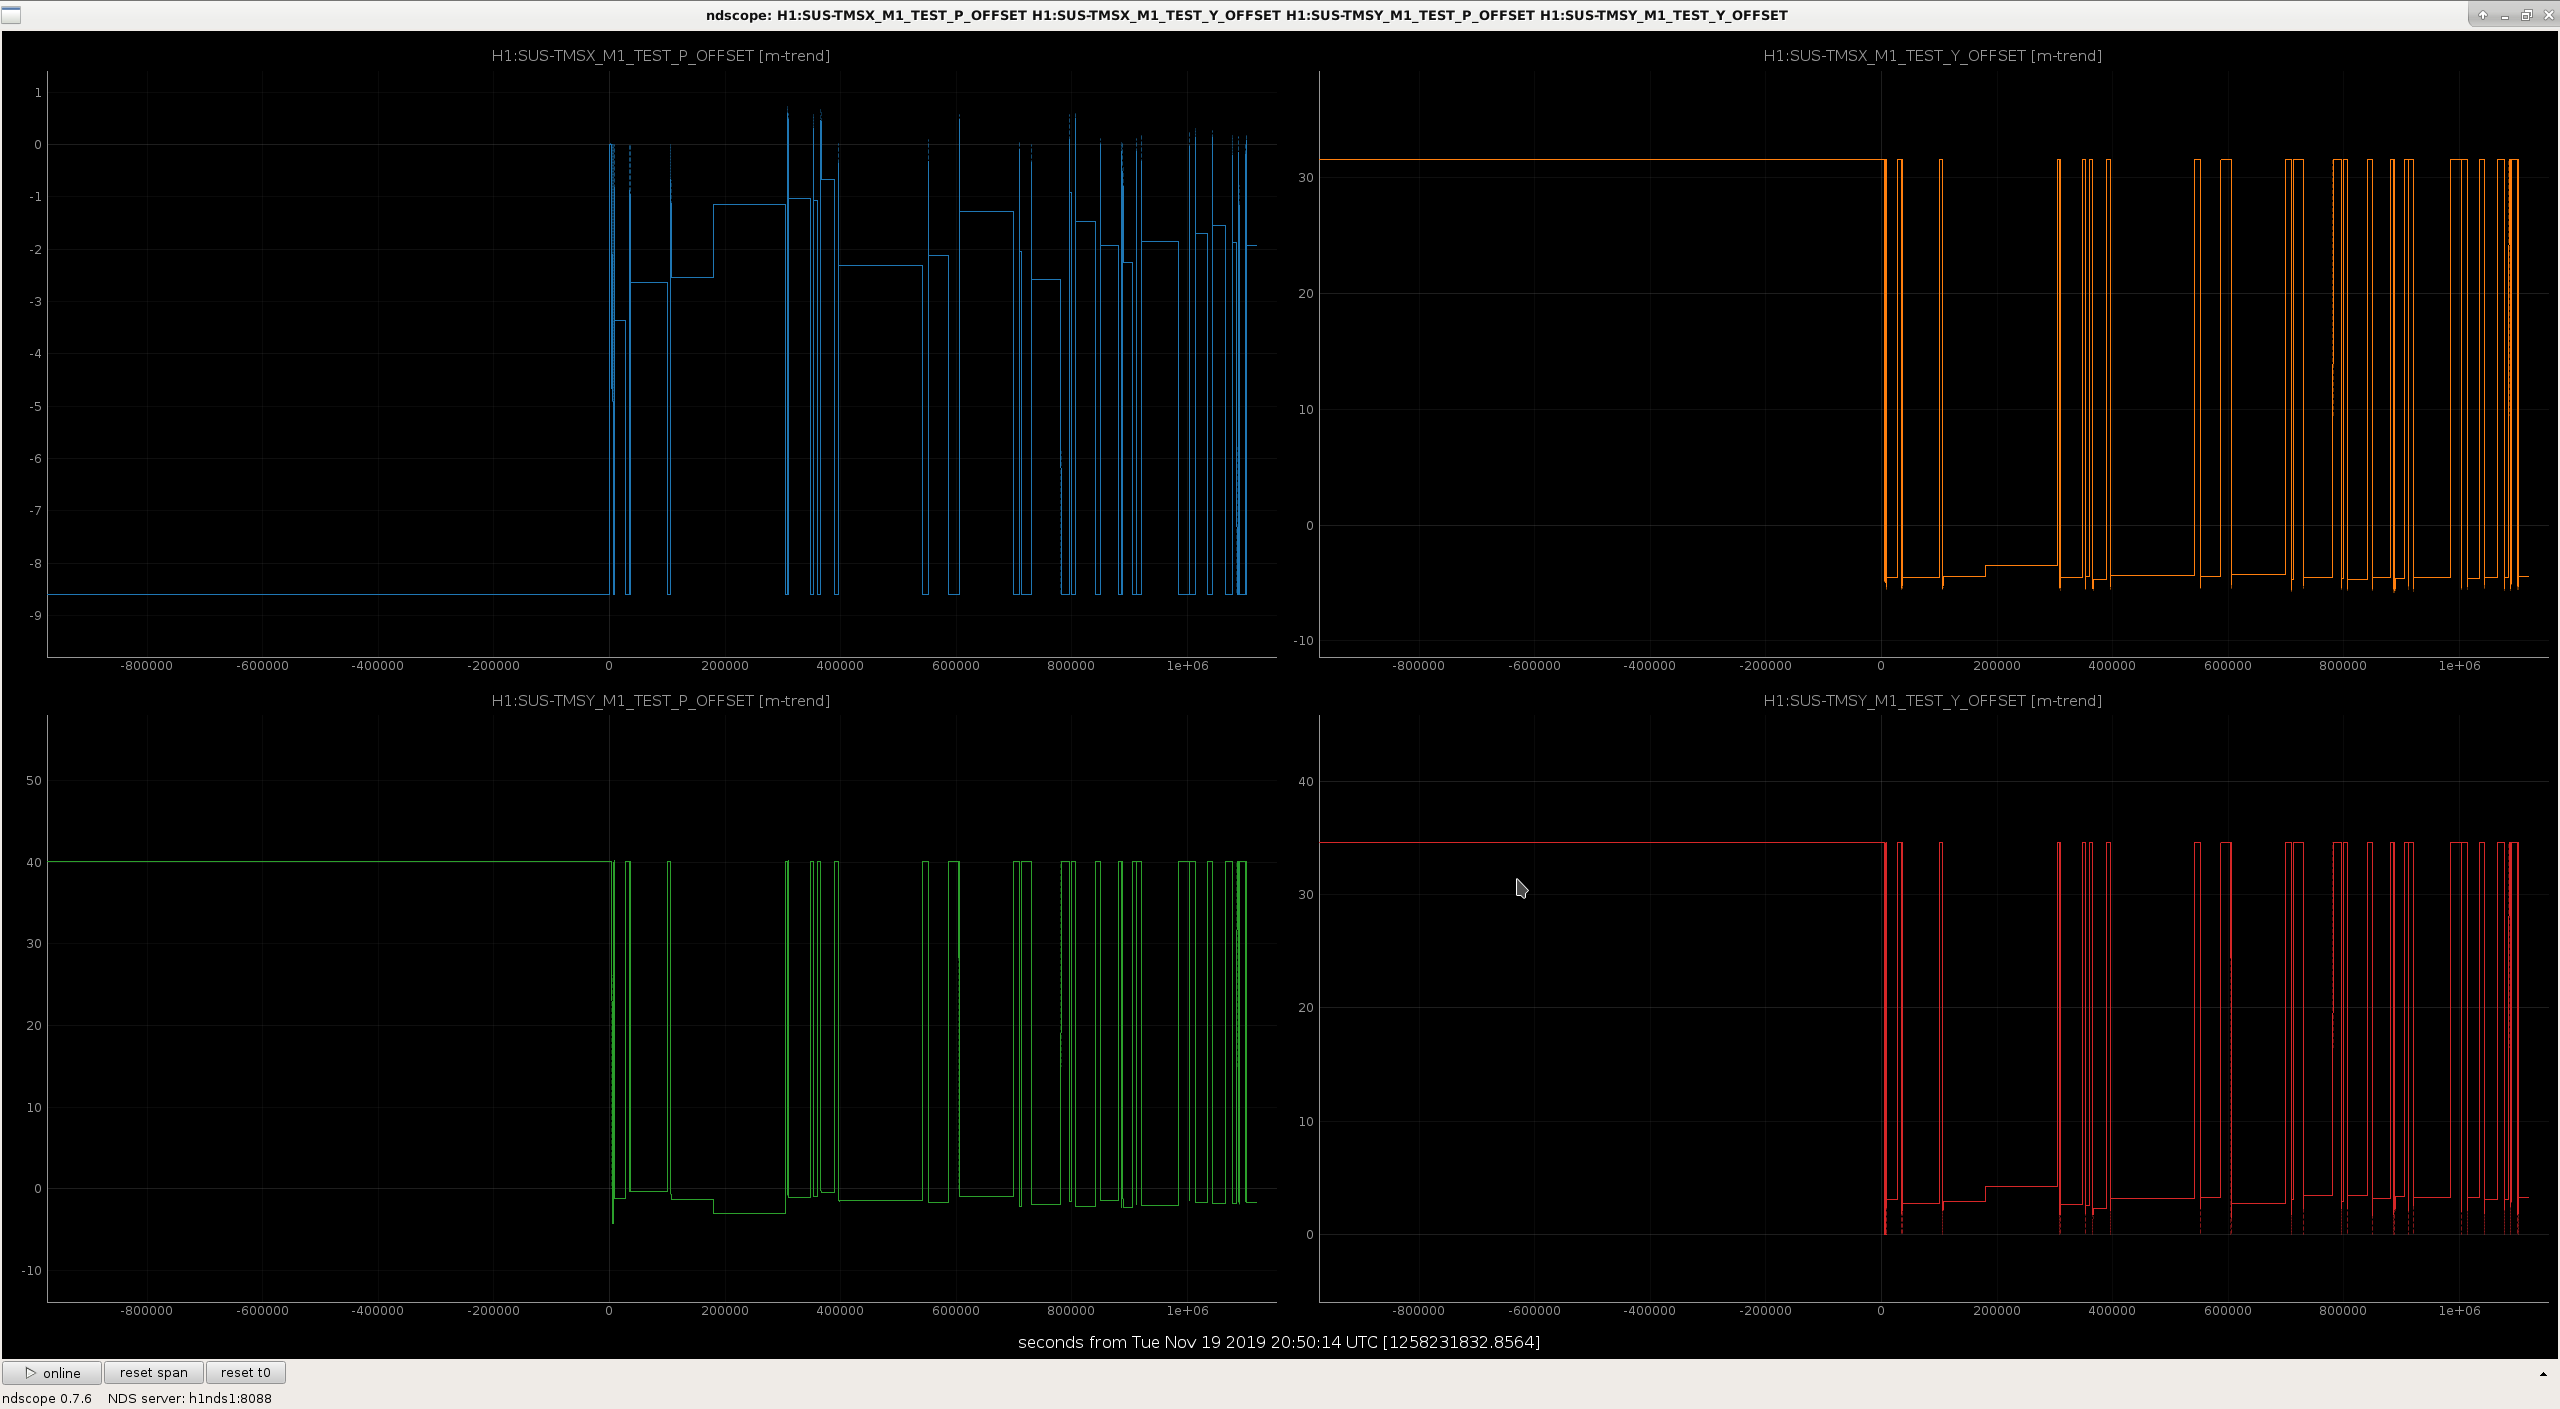
TEST OFFSETs on all optics are typically a fixed value, and not active during NLN/Observe. Currentl there are two situations that need correction/understanding, listed below:
Plots of ETMX TEST YAW and TMS TEST OFFSETs attached.
Current list of TEST OFFSET values:
Looks like the only work in the alog on Nov. 19th, that mentions the TMSs, is Craig's QPD servo work (alog53362). The script he mentions doesn't seem to be checked into the SVN, so I can't see it at the moment to see if it uses the TEST bank.
Looking at the tms_qpd_centering_servos.py script, this is where the TMS change on the 19th came from.
All mysteries solved.
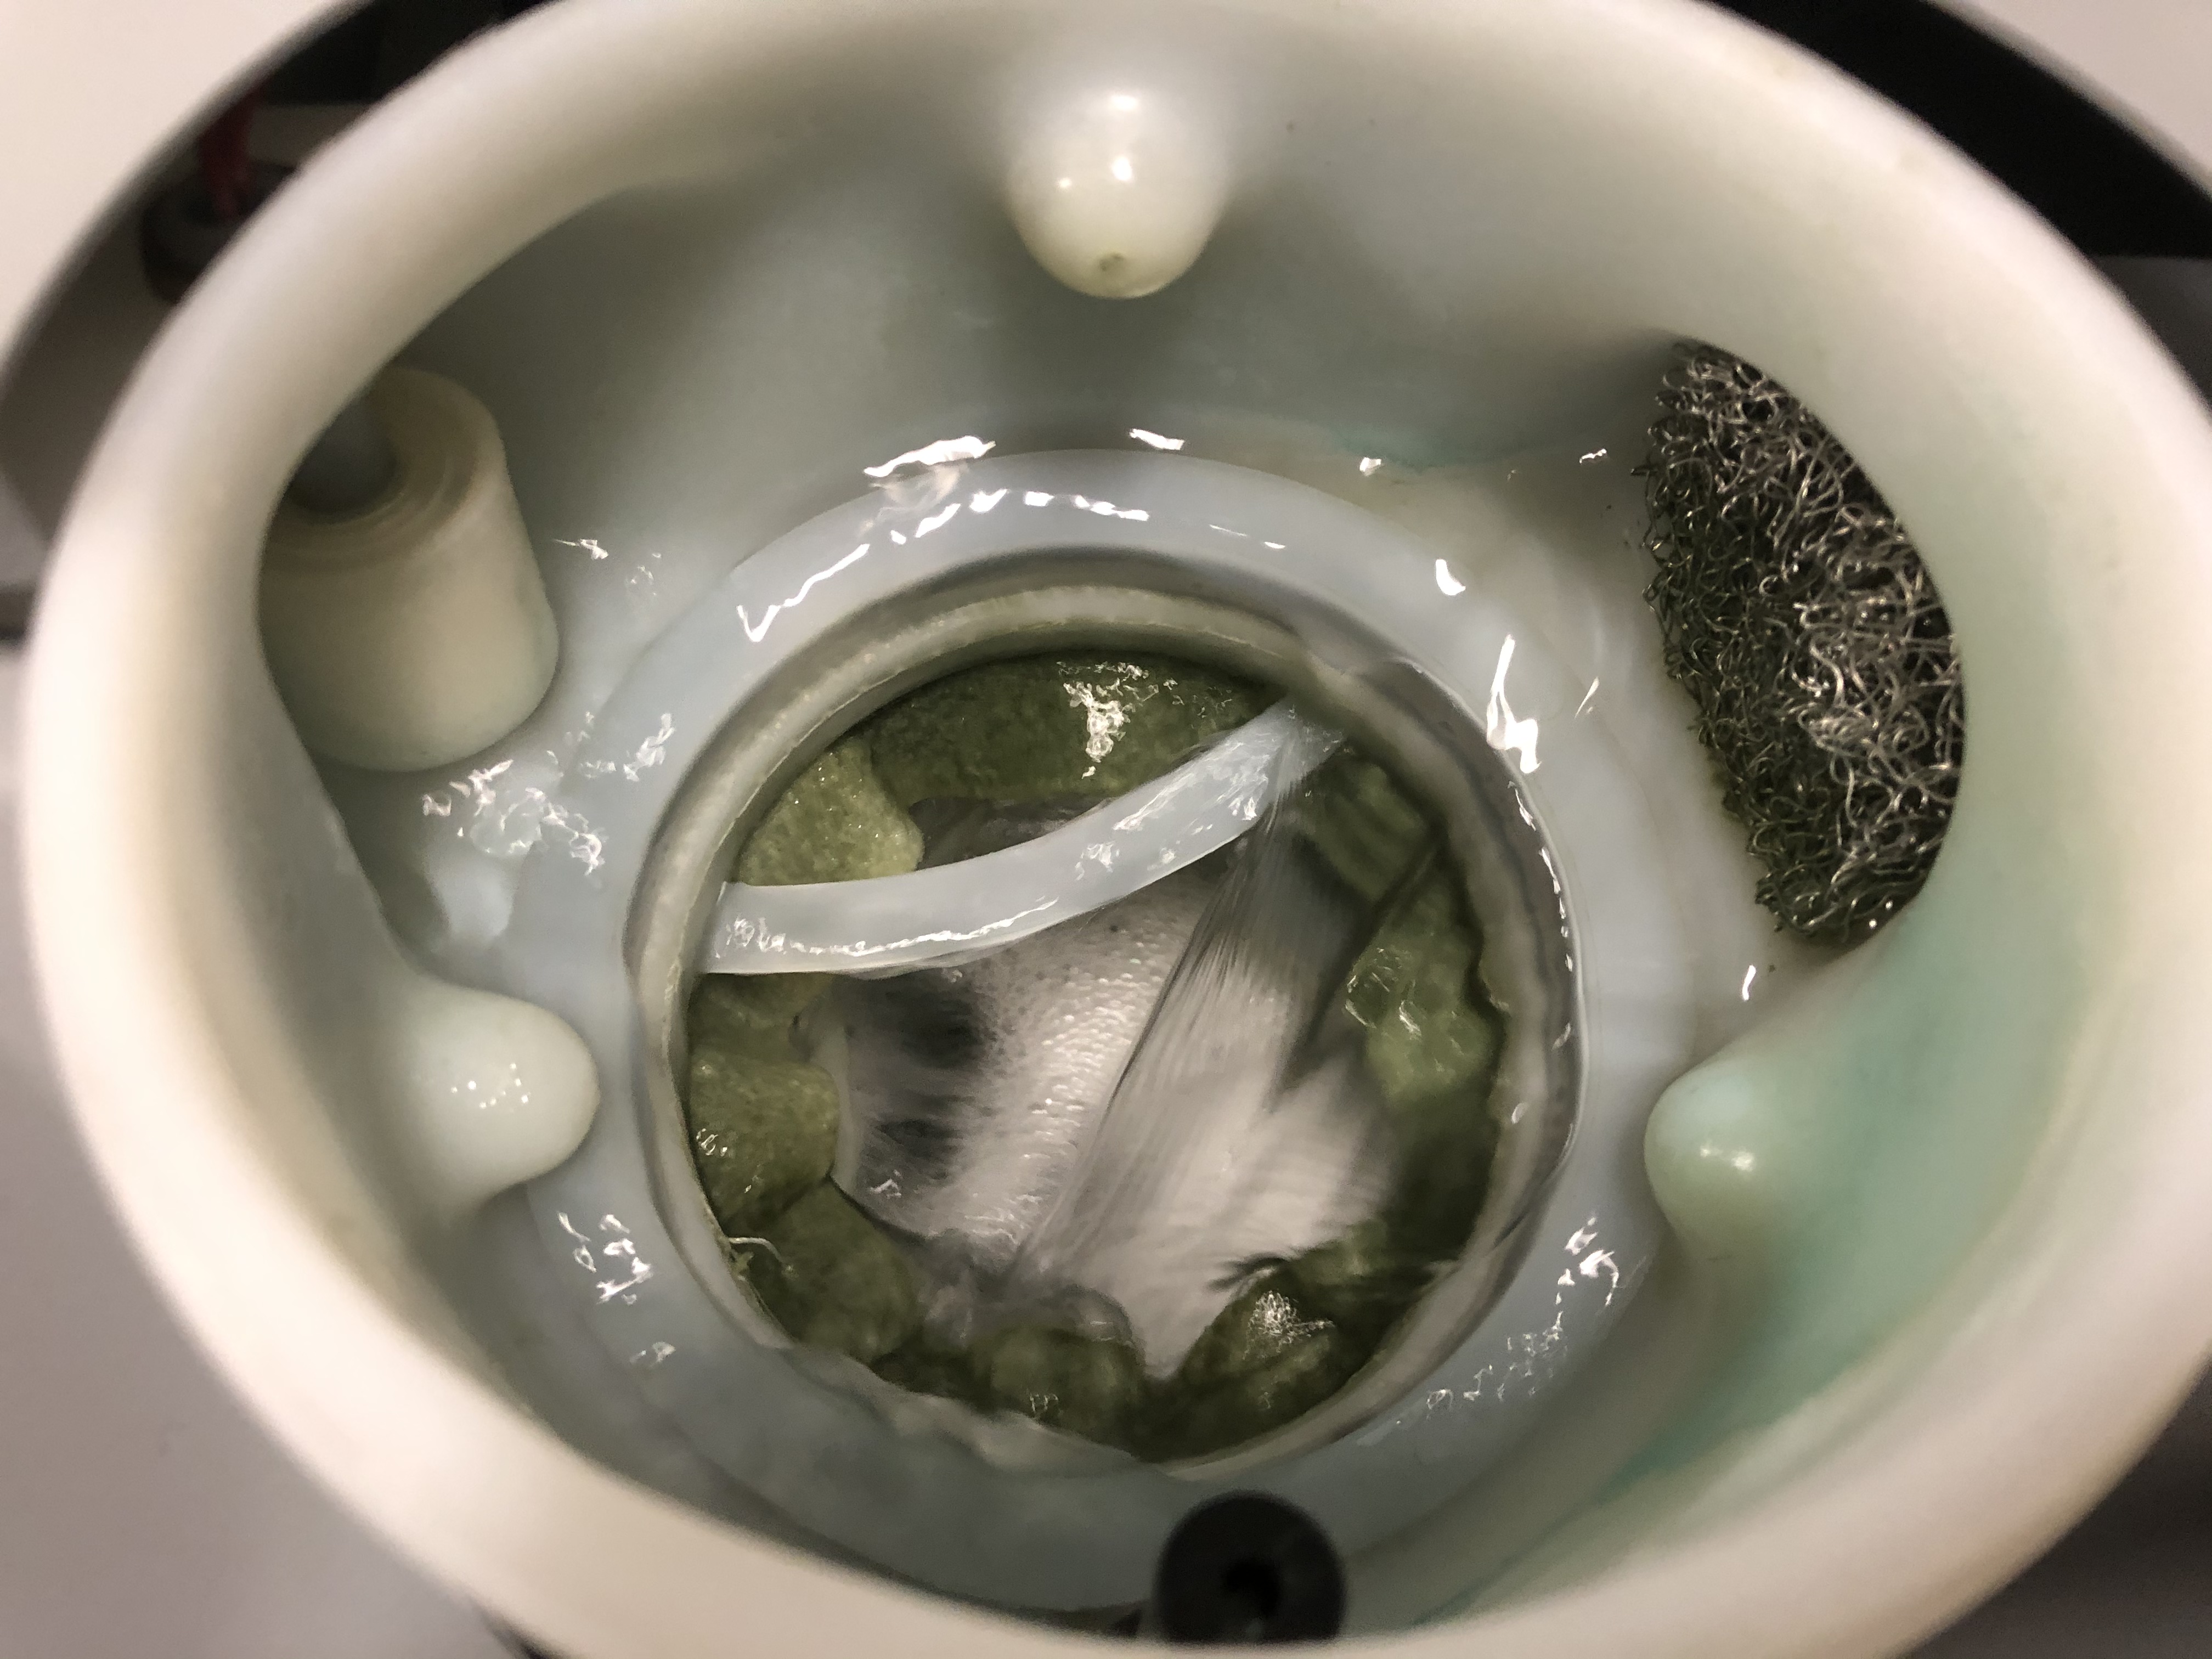
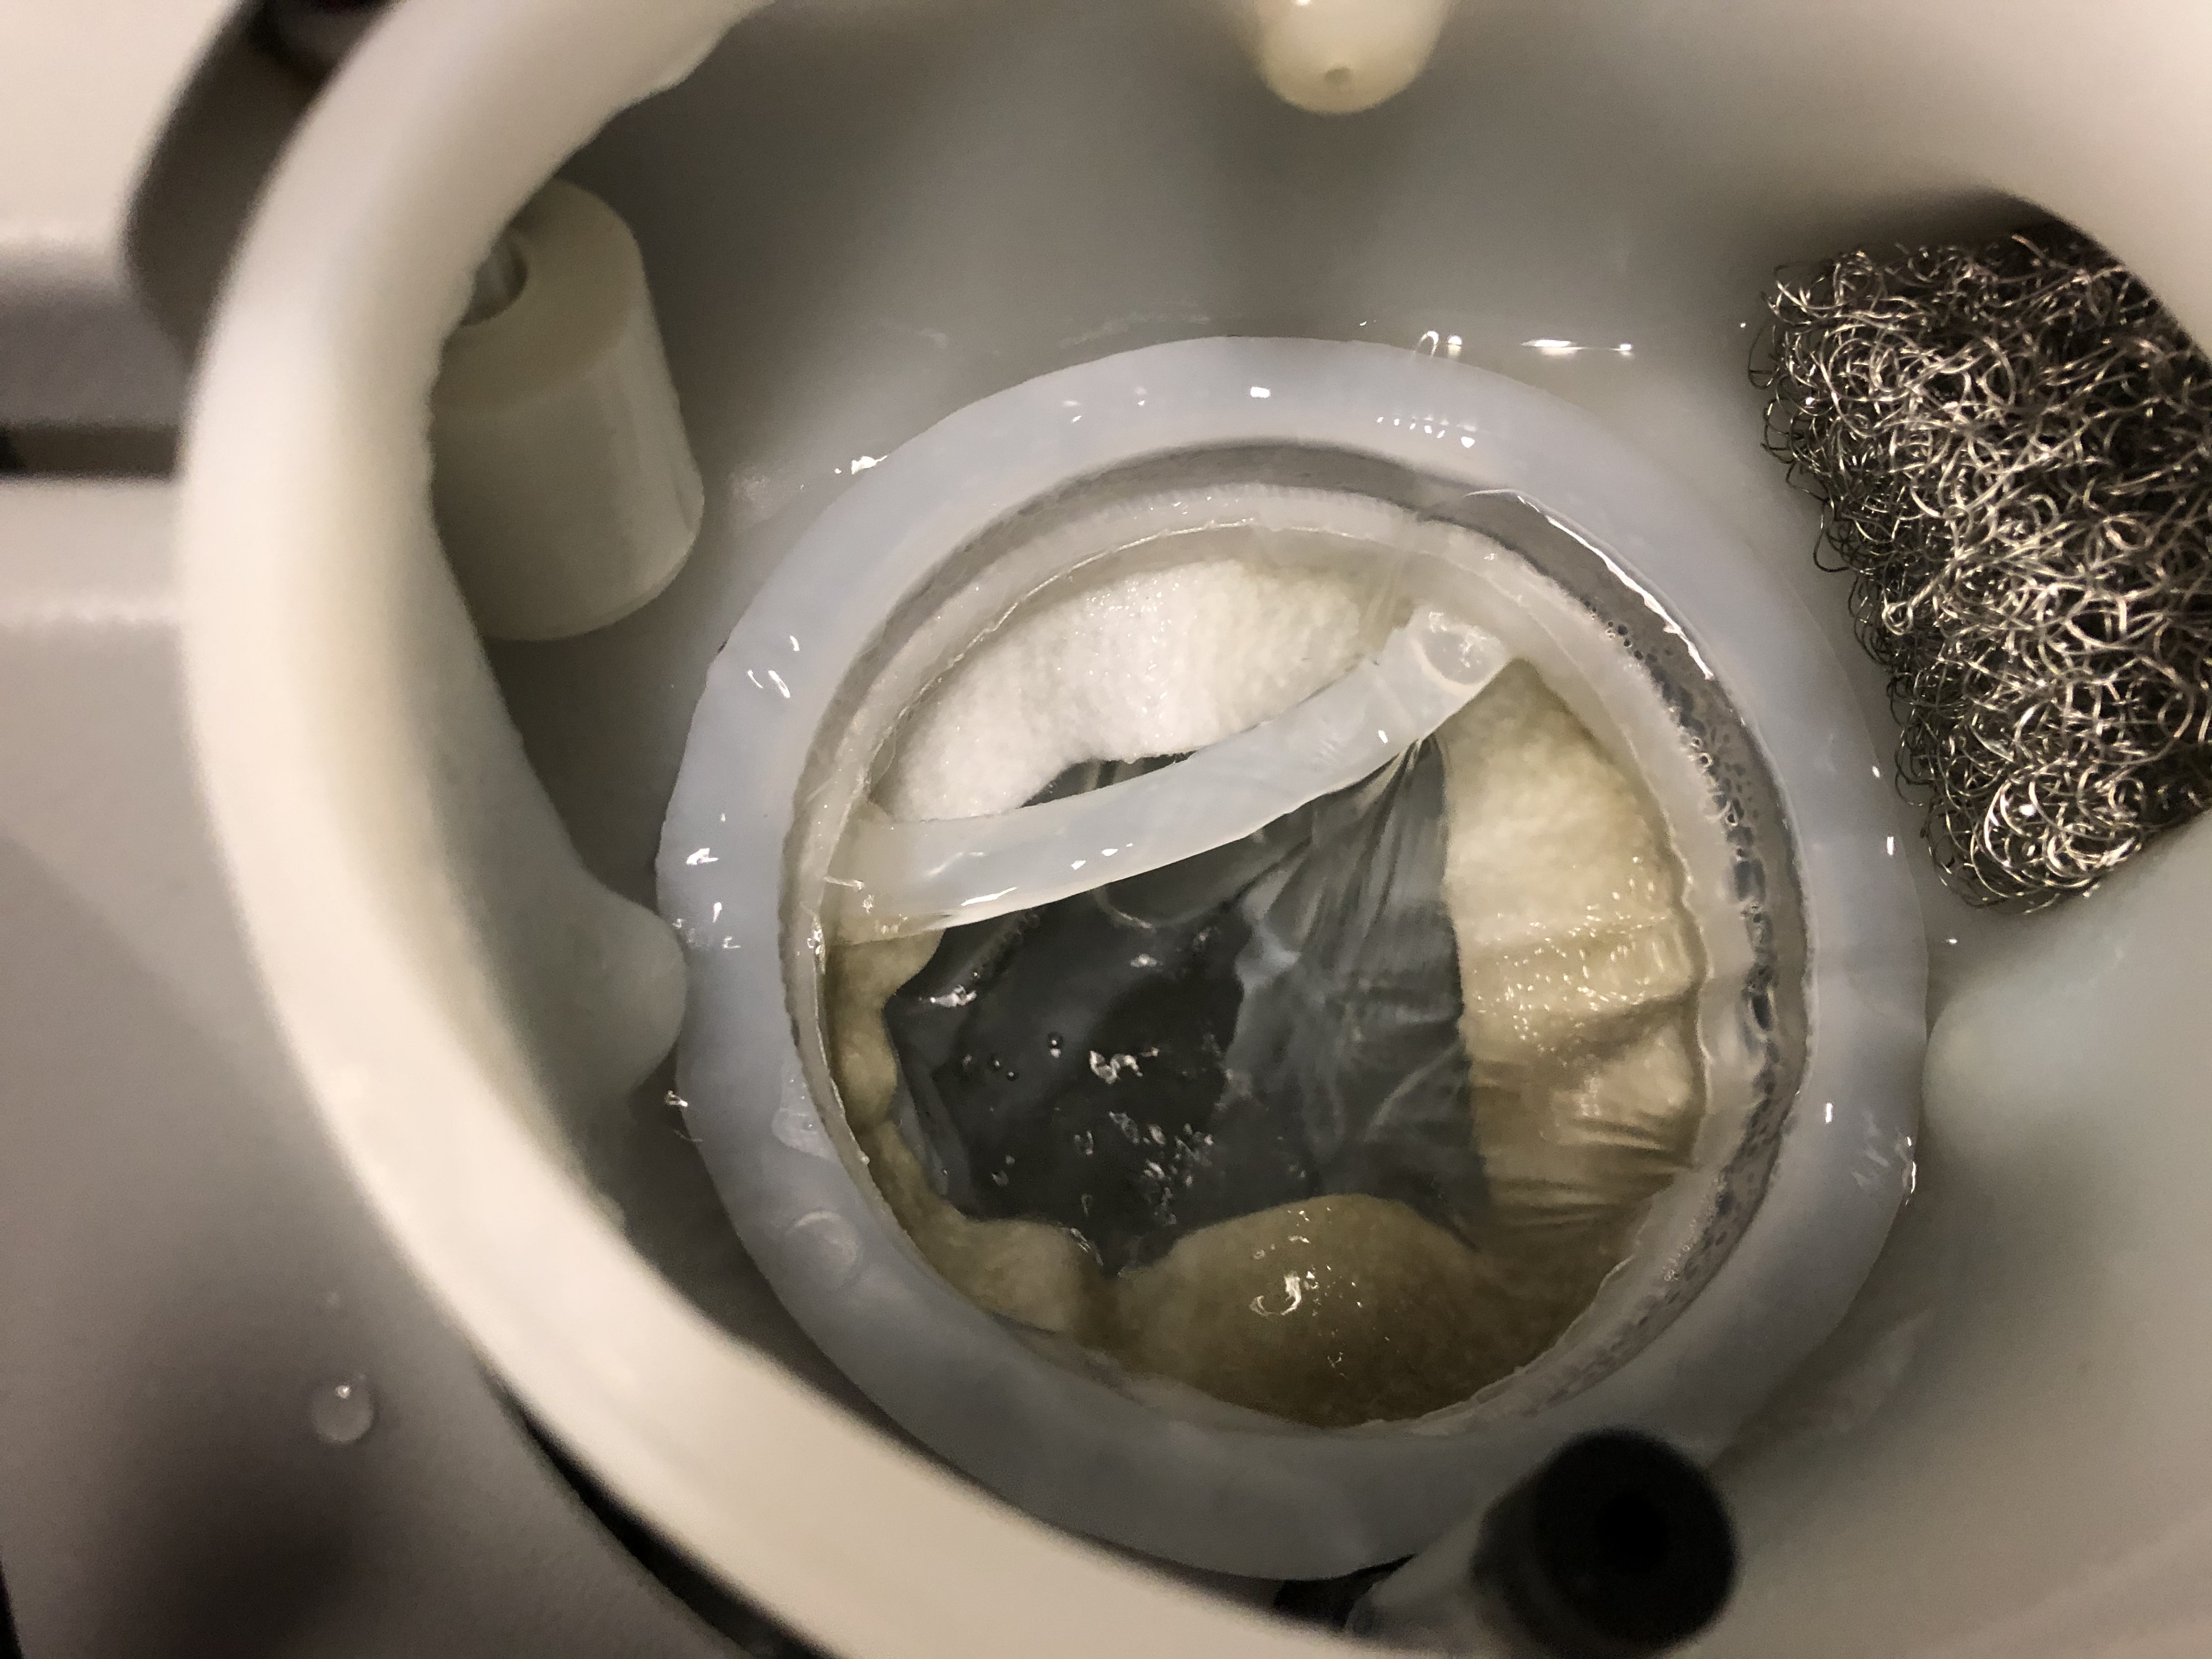
Addressed TCS Chillers (10:40-10:55utc); Camilla did all the work, and I am documenting.
Green TCSx Chiller!
Noticed that TCSx Chiller looked fairly green inside area where we pour water (photos attached with a green TCSx & normal TCSy chiller). This has been noticed the last few weeks (Cheryl, TJ).
So, at my last mention of Initial Alignment, a lot has transpired.
10:04 I ran Initial Alignment
10:18 I attempted to re-lock
10:43 back to attempting to re-lock
10:57 Lockloss at TURN_ON_BS_STAGE2
11:00 Attempt #2
11:14 Attempt #3
11:47 Attempt #4
On another note:
As a matter of discovery:
A note on the 2.8W and searching for home:
The LASER_PWR node was complaining because it had to bootstrap the power too much (requesting 2.7W to get 2W => ~35% difference). Searching for home was the correct move here, and we haven't done this in quite some time. After searching for home via the medm, not the Guardian node, the node became confused. Requesting a different power and then back to 2W, as Ed did, is one way to solve this. The other to use the Search_For_Home state in LASER_PWR to aliviate some of the confusion.
Perhaps we should set up a consistent schedule to search for home on the rotation stage.