
edmond.merilh@LIGO.ORG - posted 15:49, Thursday 07 November 2019 (53075)
H1 to EQ mode
BLRMS approaching 1um/s following multiple reports from Azerbaijan area.
BLRMS approaching 1um/s following multiple reports from Azerbaijan area.
21:39 21:11 H1 to Commissioning. TOO as L1 also commissioning
21:39 21:11 Squeezer team out to squeezer area in LVEA
Keita Kawabe, Sheila Dwyer
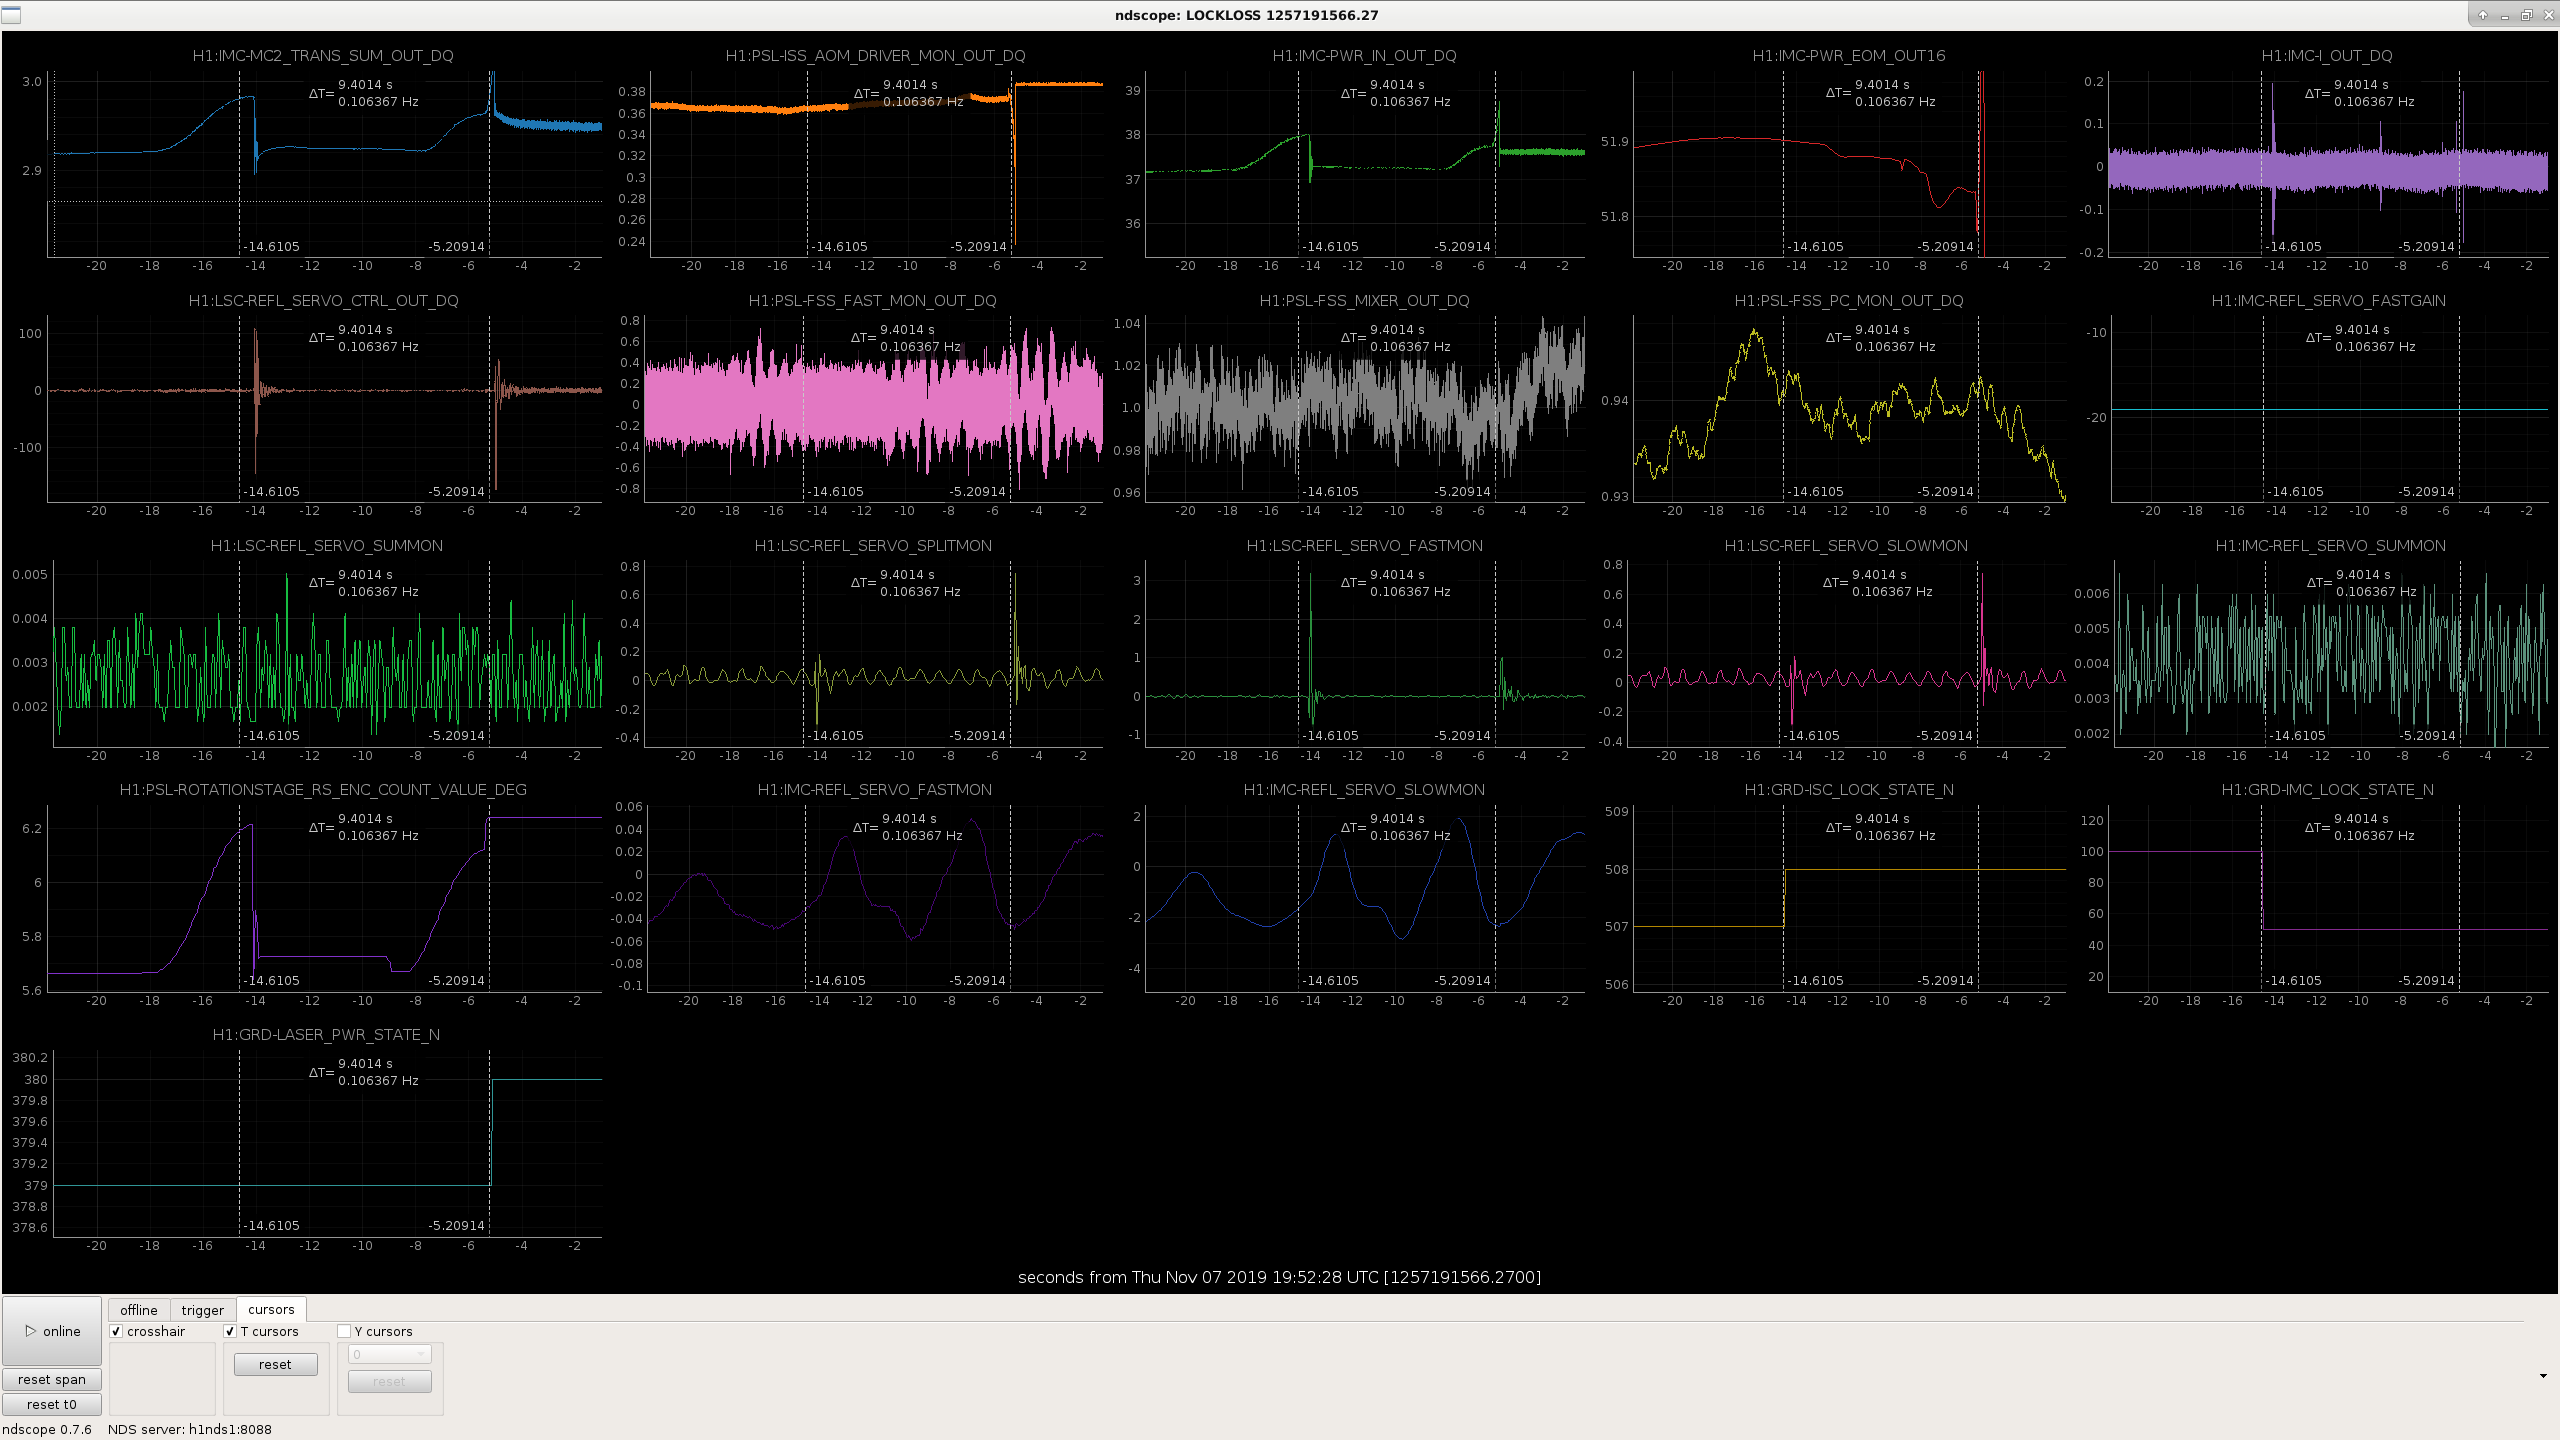
We investigated the lockloss that Ed and Camilla just had at LOWNOISE_ASC (1257191567), and we believe that the ISS second loop attempted to close while the PSL rotation stage was still moving. We have made some changes to prevent this, although we can't say with certainty that this was the cause of the lockloss, because this seems to have stopped about 4 seconds before the lockloss. The attached screenshot shows that the power input to the IMC was having large gltiches a few seconds before the lockloss, which show up in downstream powers and CARM channels.
One of the recent changes to the guardian was moving the ISS second loop engagement from happening after DRMI locks to happening at the end of the power increase. The other guardian change that might be a cause is that TJ recently changed the LASER POWER guardian to fine adjust the input power to get it closer to the requested power, so our input power will be more consistent from lock to lock. The ISC_LOCK gaurdian was not checking that the LASER_POWER guardian was arrived and done before moving on to the next guardian state. You can see in the attached screenshot that ISC_LOCK moves from 507 (Maximum power) to 508 (low noise ASC) while the laser power guardian was still changing the power.
We have made two changes, moving the ISS engagement back to DRMI, and adding a check that the LASER POWER guardian has arrived before we return true from MAXIMUM power. We still are not sure that we understand the behavoir of the rotation stage.
18:09 Lockloss
Re-lock attempt -1
18:11 ALSY needed aligning
18:23 FIND_IR starting
18:35 Lockloss - trying to play catch-up with diff slider
18:39 Re-lock attempt - 2
19:10 Initial Alignment
19:25 IA complete
19:27 Re-Lock attempt - 3
19:52 Lockloss @ LOWNOISE_ASC
19:53 Re-Lock attempt -4
20:06 lockloss
20:07 Re-Lock attempt- 5
20:37 NLN
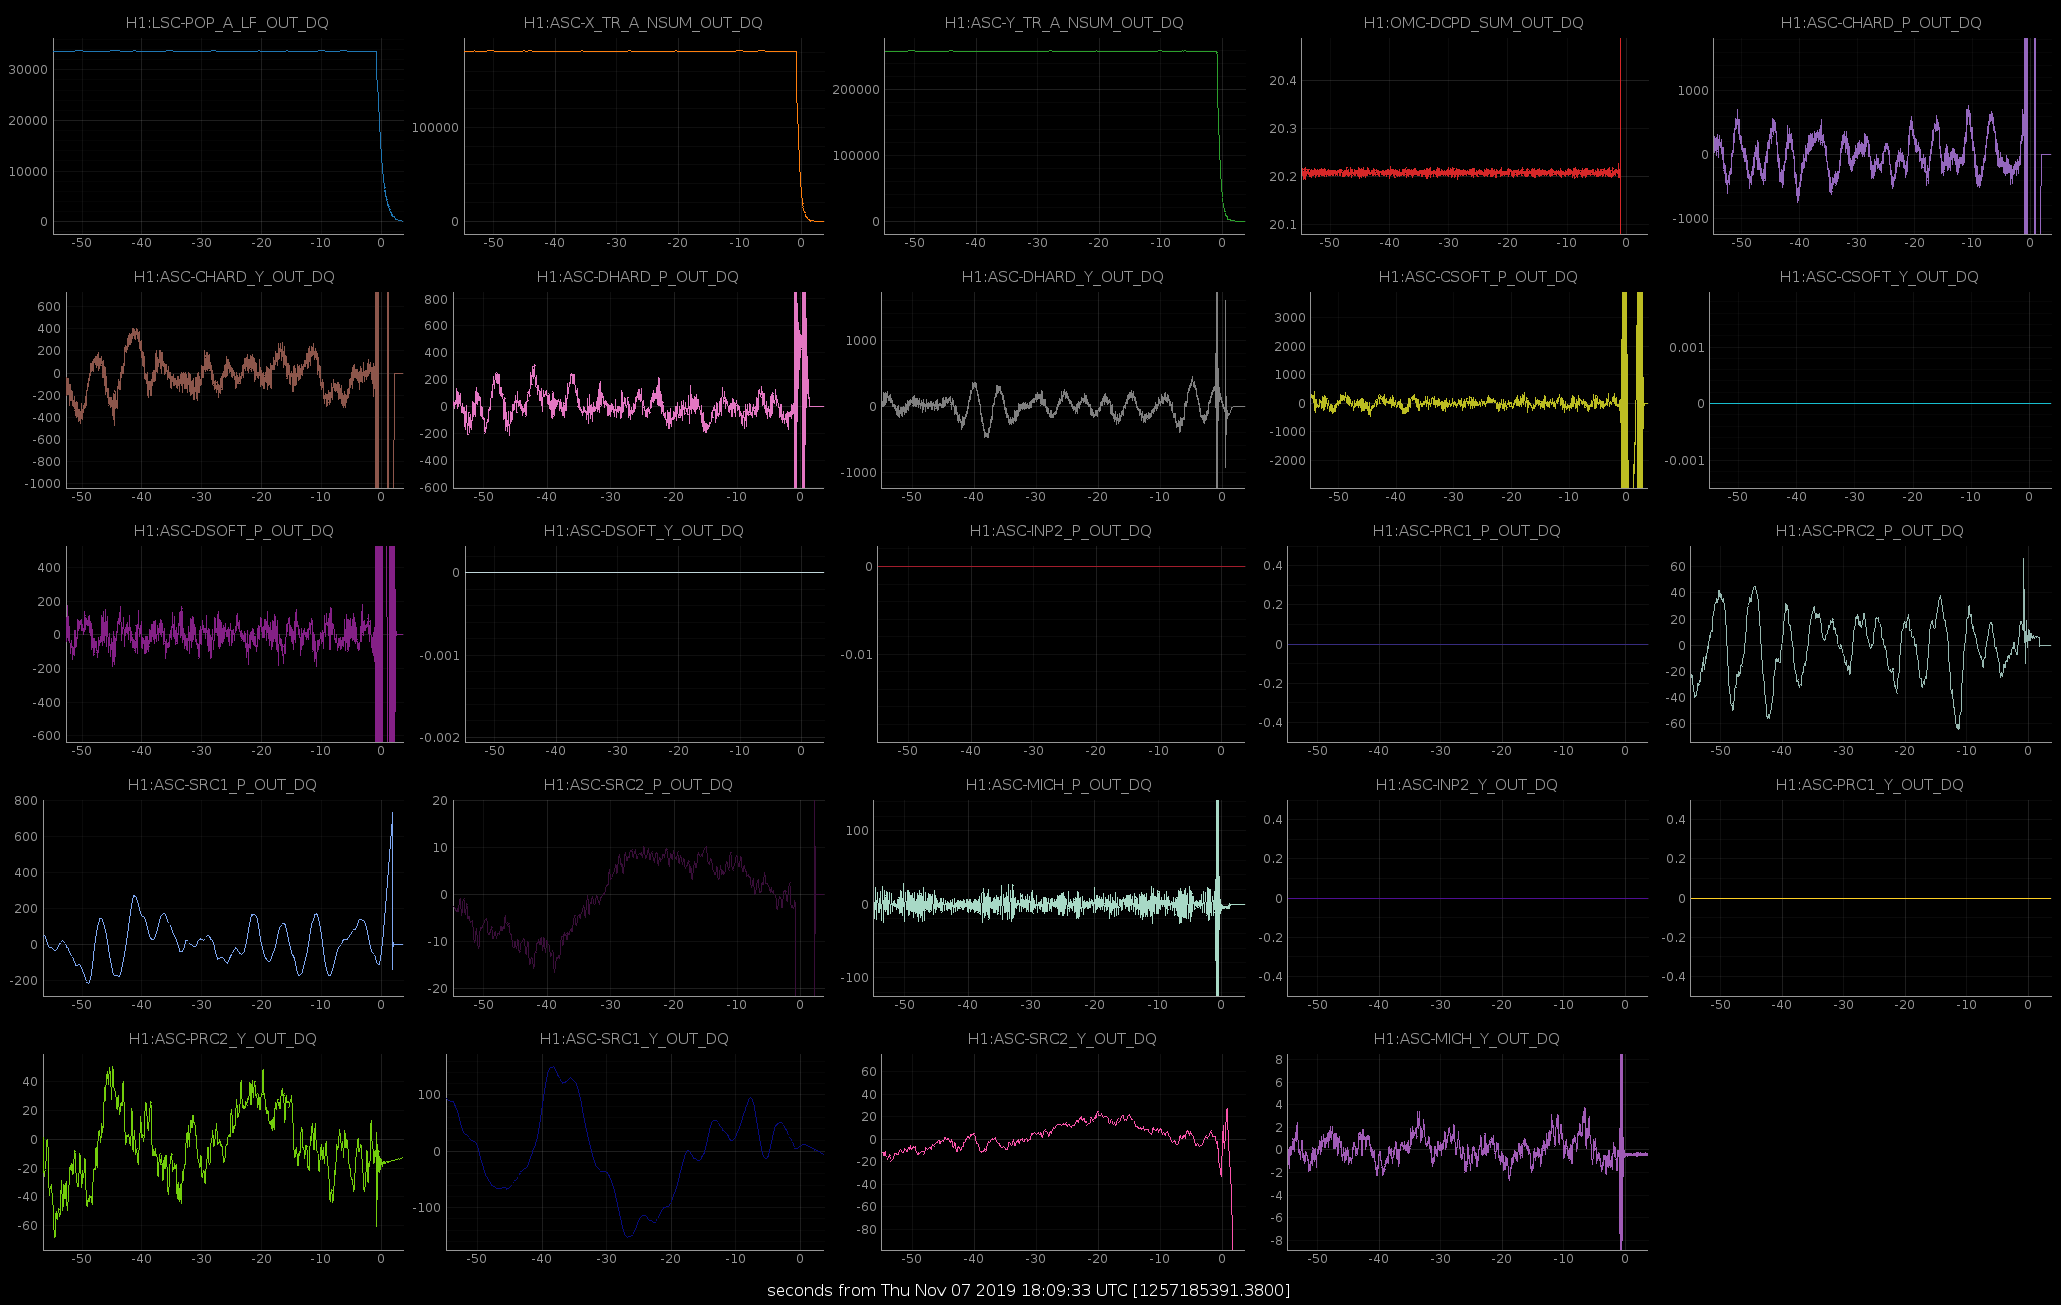
A very fast lock loss. I didn't see anything in the ASC signals (1st attachment), then I noticed that the squeezer lost lock just before the rest of the IFO (2nd attachment). I'm not sure how to tell if the squeezer losing lock was a cause or effect though.
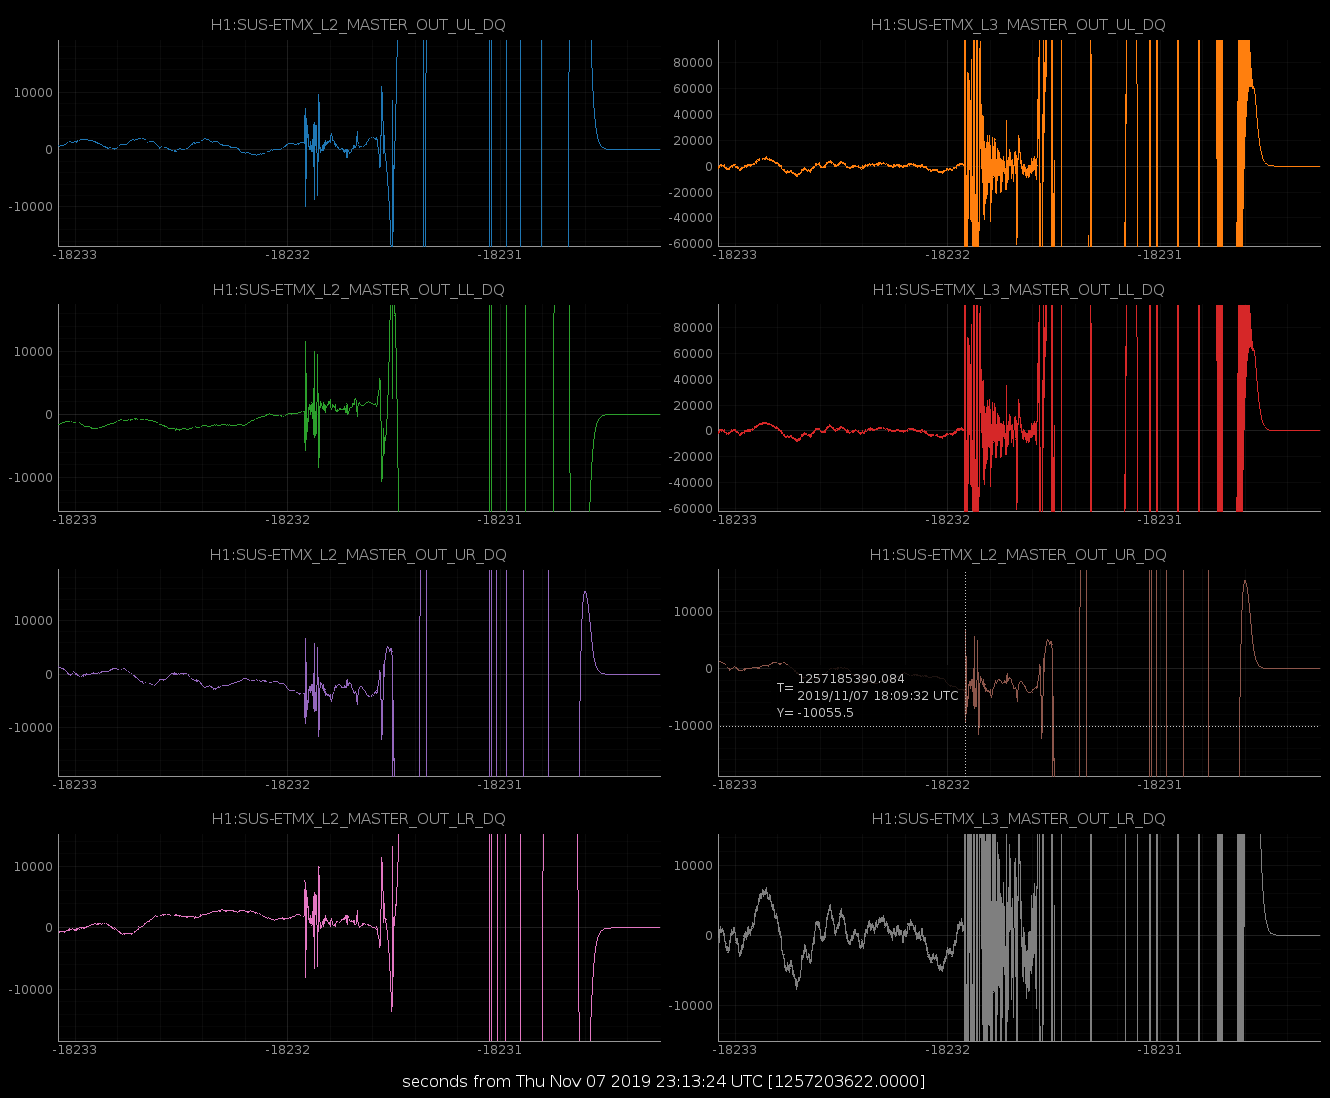
Anther oddity is the slight jitter in H1:SUS-ETMX_L3_MASTER_OUT channel just before the lock loss. It seems to have large amounts of drive almost .4 seconds before. Out of time time to track down from where.
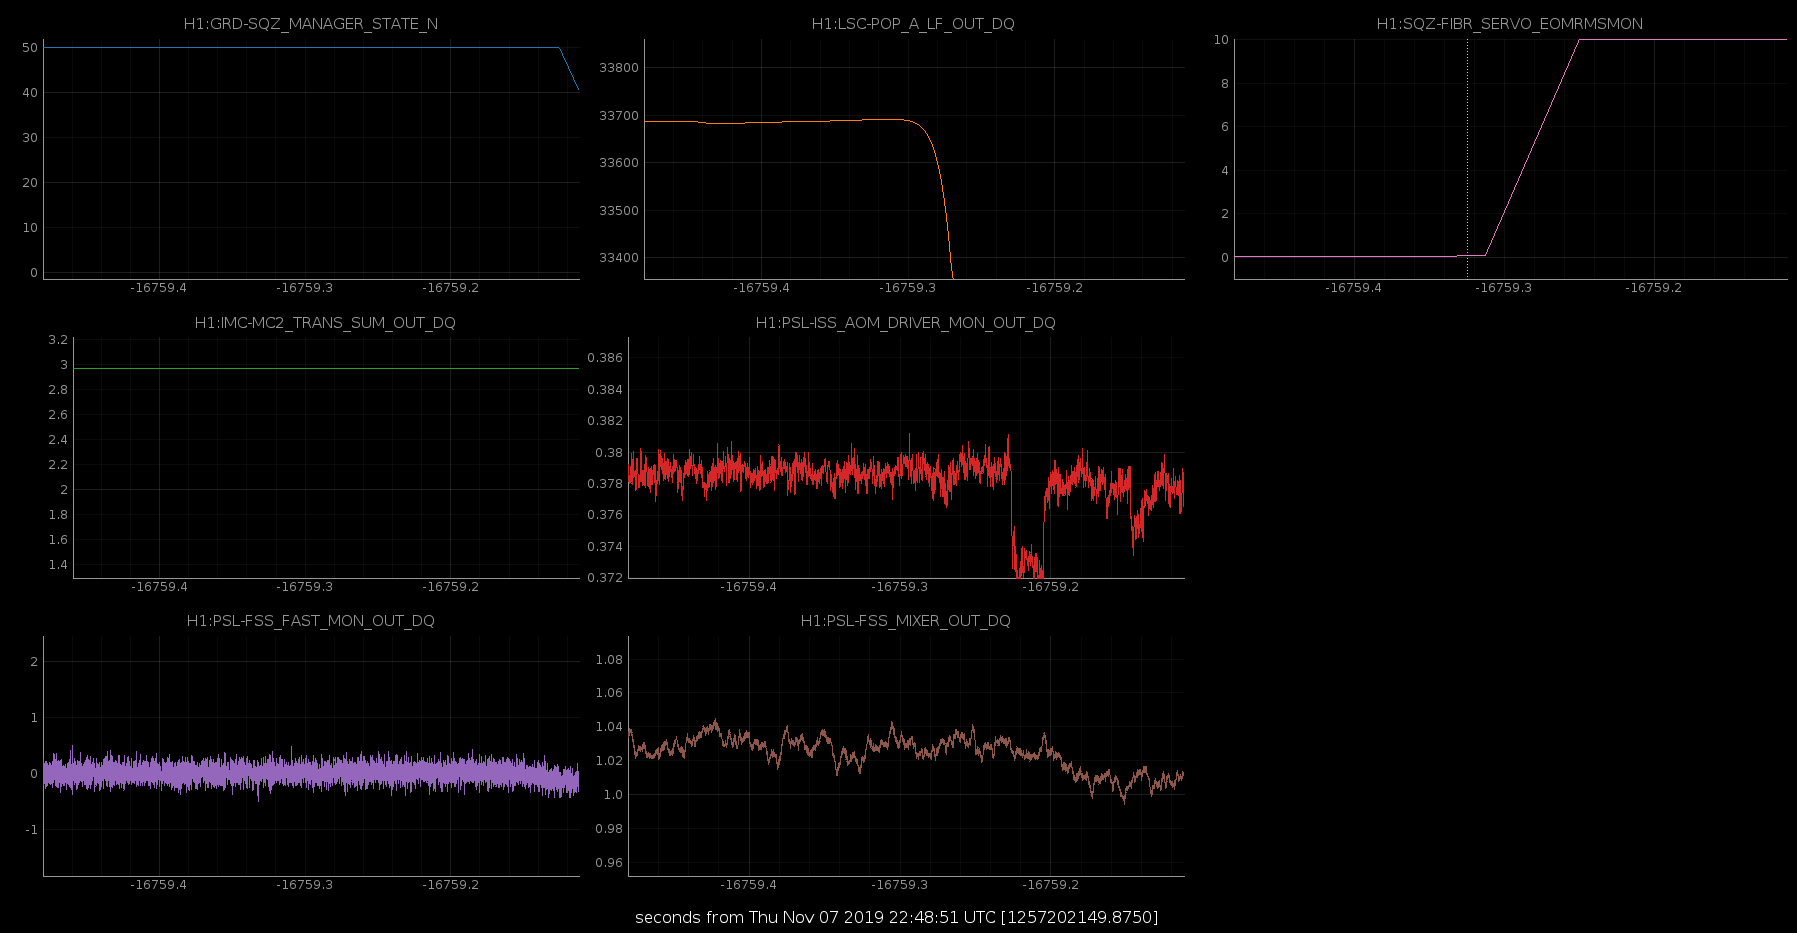
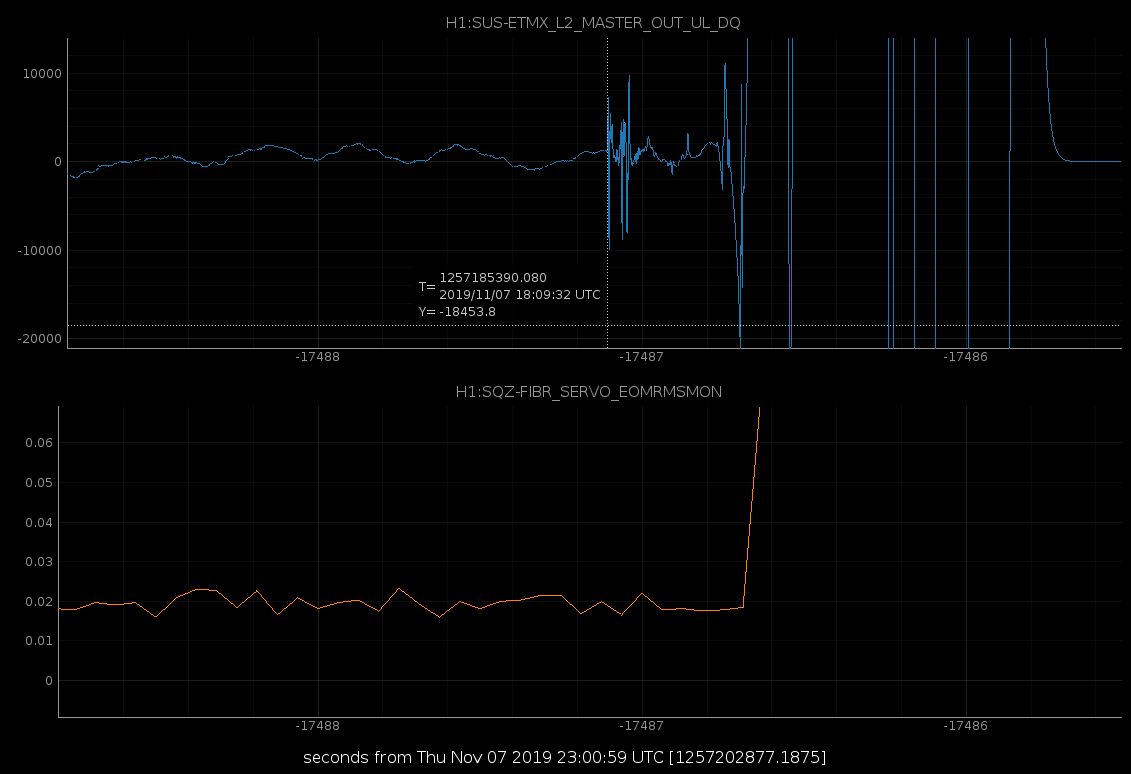
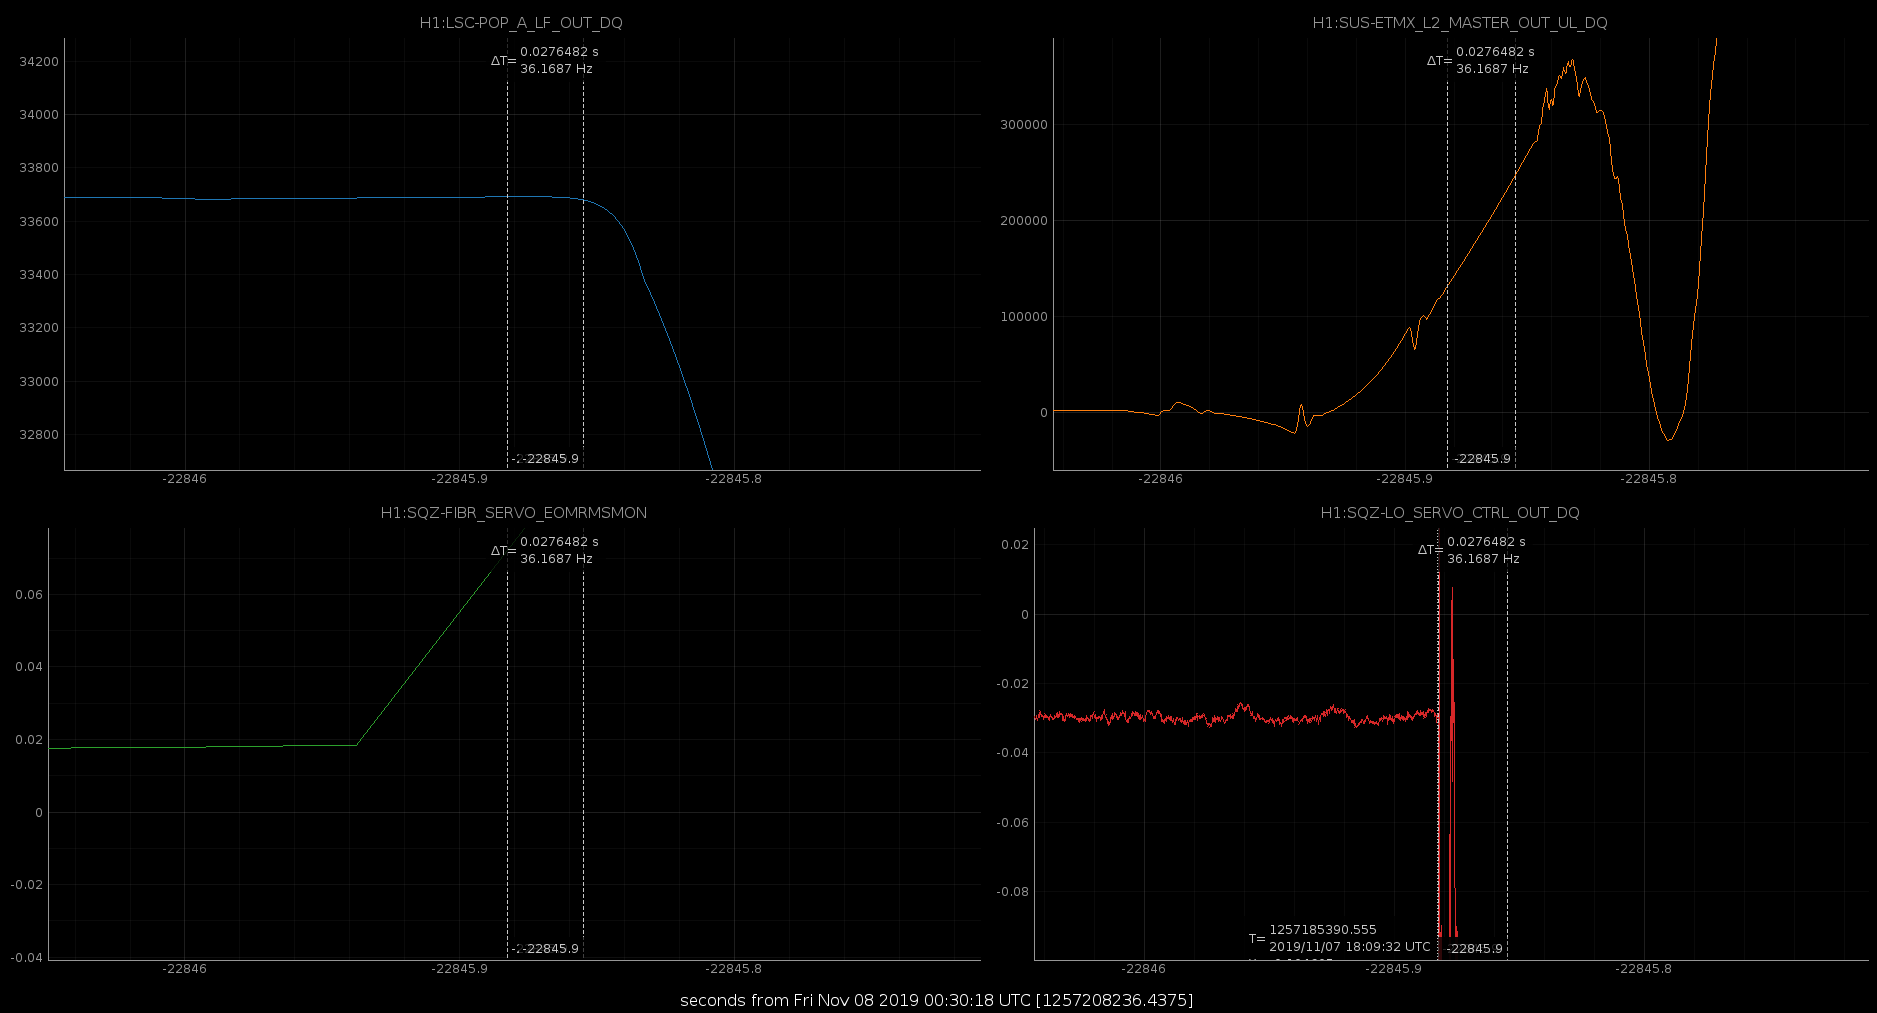
One more, I looked at H1:SQZ-LO_SERVO_CTRL_OUT_DQ and it loses it before the main IFO.
TITLE: 11/07 Day Shift: 16:00-00:00 UTC (08:00-16:00 PST), all times posted in UTC
STATE of H1: Observing at 115Mpc
OUTGOING OPERATOR: Patrick
CURRENT ENVIRONMENT:
SEI_CONF state: WINDY
Wind: 4mph Gusts, 3mph 5min avg
Primary useism: 0.01 μm/s
Secondary useism: 0.18 μm/s
QUICK SUMMARY:
TITLE: 11/07 Owl Shift: 08:00-16:00 UTC (00:00-08:00 PST), all times posted in UTC
STATE of H1: Observing at 117Mpc
INCOMING OPERATOR: Ed
SHIFT SUMMARY: Squeezer took us out of observing twice. There is a user message: SQZ_MANAGER: NOT IN MANAGED MODE.
LOG:

08:00 UTC Squeezer takes us out of observing
08:02 UTC Hit INIT on SQZ_MANAGER. Squeezer relocked.
08:03 UTC Back to observing
11:01 UTC Squeezer takes us out of observing
11:02 UTC Hit INIT on SQZ_MANAGER. Squeezer relocked.
11:04 UTC Back to observing
Nutsinee, Sheila, Camilla
We looked into the reasons why the squeezer didn't recover automatically last night. We've made 2 changes to the squeezer manager to try to address the problem, but haven't loaded the changes yet.
The problem was that the CLF didn't lock on the first relocking attempt. Currently the guardian only tried to lock it once and then gives up, in the past this always worked on the first try. For now we have added some checks in the SQZ MANAGER LOCK_CLF state to request down from the CLF, wait 5 seconds, and re-request locked.
Another confusing point was that the manager was requesting down from the CLF node while the CLF was trying to relock. Bassically there was a race condition, where the CLF guardian realized that the loop was unlocked, went to down and tried to relock. SQZ_MANAGER has a function called turn_off_sqz() which also requests down from the CLF guardian, which was happening ~ half a second later, once the CLF guardian was already trying to relock. We've edited that function so that it no longer makes requests of the CLF guardian.
The reason the squeezer lost lock was the OPO PZT running out of range, this happened twice overnight.
Squeezer has taken us out of observing twice. No other issues.
TITLE: 11/07 Owl Shift: 08:00-16:00 UTC (00:00-08:00 PST), all times posted in UTC
STATE of H1: Observing at 118Mpc
OUTGOING OPERATOR: Jim
CURRENT ENVIRONMENT:
    SEI_CONF state: WINDY
    Wind: 3mph Gusts, 2mph 5min avg
    Primary useism: 0.01 μm/s
    Secondary useism: 0.10 μm/s
QUICK SUMMARY: Squeezer dropped out at very start of shift. Hit INIT on SQZ_MANAGER and it relocked. There is a user message: SQZ_MANAGER: NOT IN MANAGED MODE.
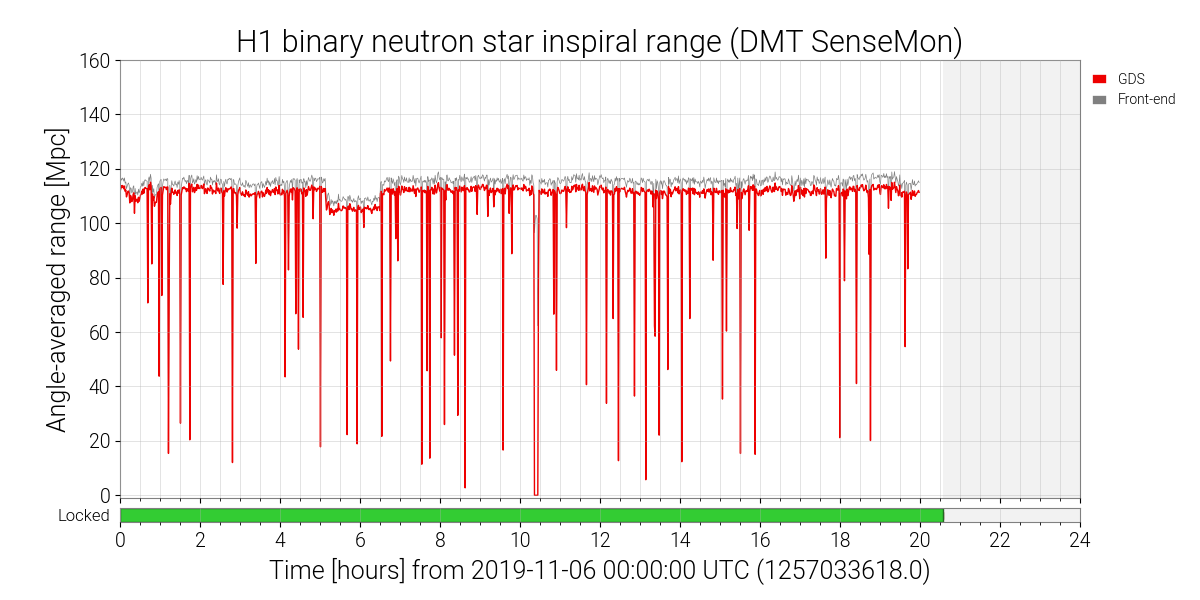
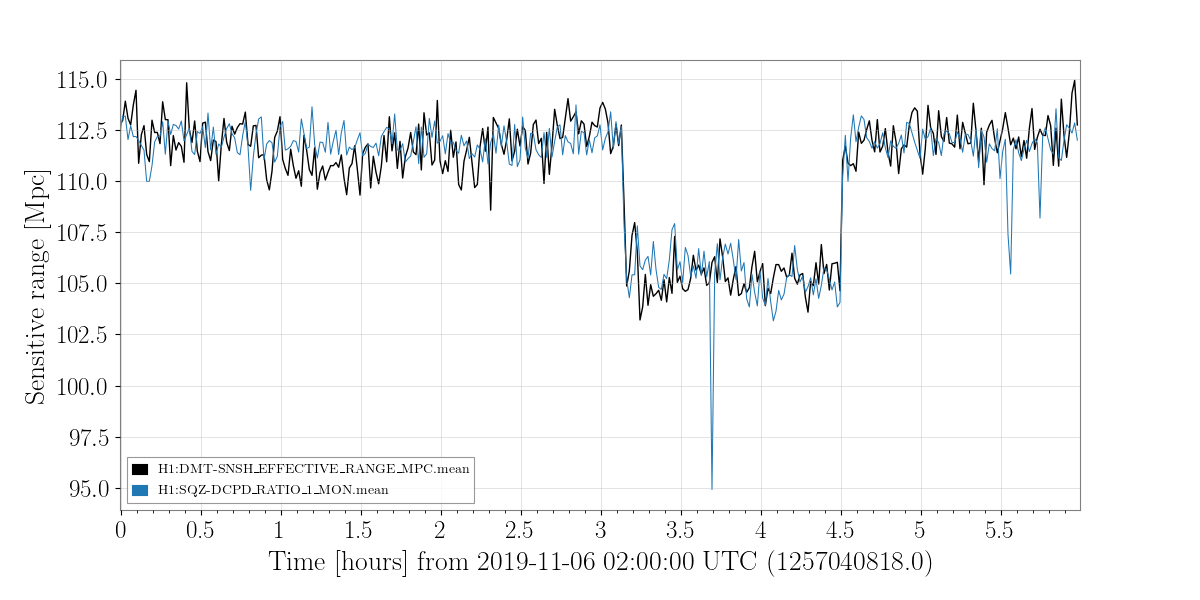
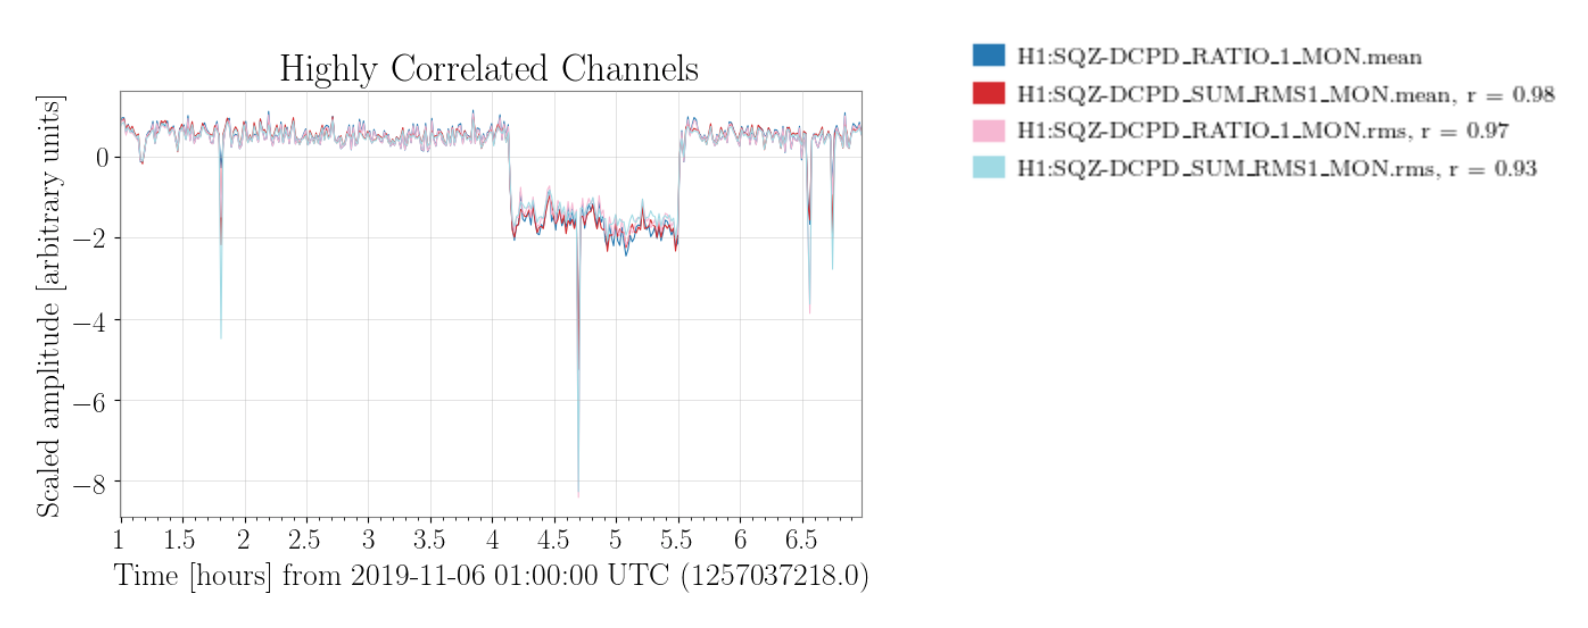
Following up on work by Beverly, I ran a short Lasso run on today's range drop. The run spans 2019-11-06 02:00-07:00. Clearly very highly correlated channels are as follows:
Channel "Pearson Coefficient"
0.9799929848627831 H1:SQZ-DCPD_SUM_RMS1_MON.mean
0.9725502574463882 H1:SQZ-DCPD_RATIO_1_MON.rms
0.9312747855964804 H1:SQZ-DCPD_SUM_RMS1_MON.rms
The full page output is at https://ldas-jobs.ligo-wa.caltech.edu/~jrsmith/detchar/O3b/lasso-Nov-6-2019-2/ (updated using the fancy new python 3 version)
Figures below show:
1) The range drop from the summary pages.
2) The range and scaled SQZ DCPD channel
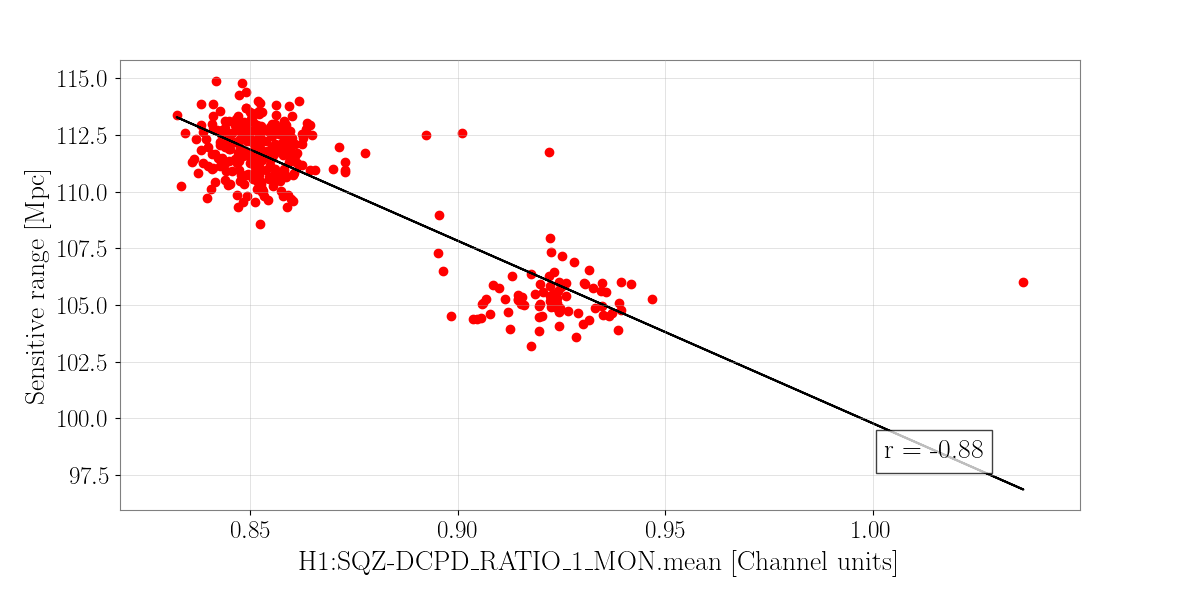
3) A scatter plot of range vs SQZ values
4) The other channels that are duplicate of the SQZ winner
I think not much new from what Beverly reported so far. Happy to follow up with further inquiries.
@DetChar -- these channels contain DARM / DELTAL / h(t) in them. They're BLRMS monitor channels comparing the squeezer performance (SQZ; via the NULL stream [the "difference" between OMC DCPDA and B]) against the OMC's DCPD SUM (i.e. the gravitational wave detecting photodiodes, and the DARM loop error signal).

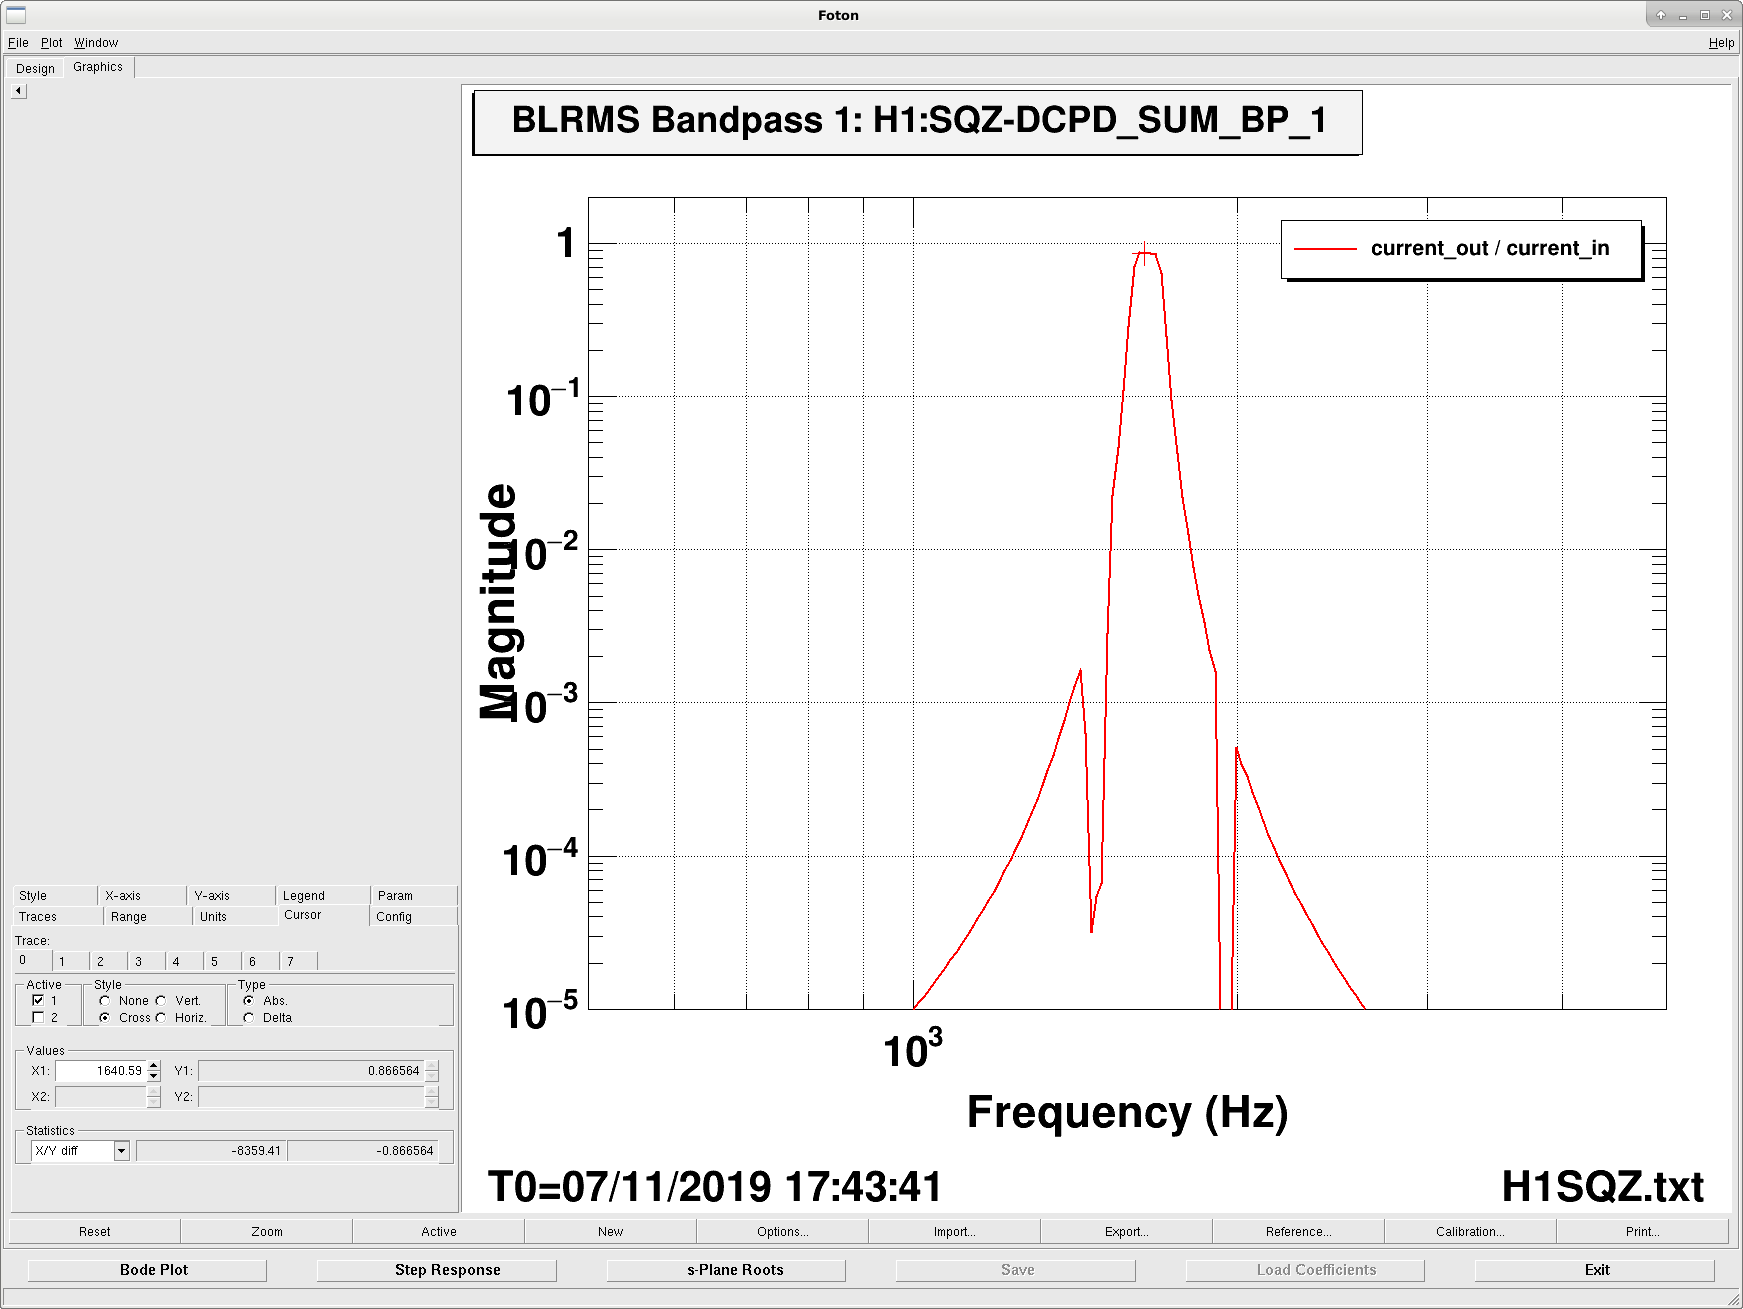
The first band (i.e. what eventually forms H1:SQZ-DCPD_SUM_RMS1_MON, and then H1:SQZ-DCPD_RATIO_1_MON), is a tight band pass around 1640 Hz -- the frequency region simply chosen to be a region we believe to be "shot/quantum noise dominated with no features."

There are 4 of these BLRMS data streams, and they should probably just be considered "unsafe" as copies of the gravitational wave channels.


H1:SQZ-DCPD_NULL_BP_1_INMON  (**and other associated EPICs records on similar name, but with the standard filter module suffixes; OUTMON, EXCMON, OFFSET, etc.)
H1:SQZ-DCPD_NULL_BP_2_INMON   **
H1:SQZ-DCPD_NULL_BP_3_INMON  **
H1:SQZ-DCPD_NULL_BP_4_INMON   **
H1:SQZ-DCPD_NULL_LP_1_INMON  **
H1:SQZ-DCPD_NULL_LP_2_INMON   **
H1:SQZ-DCPD_NULL_LP_3_INMON  **
H1:SQZ-DCPD_NULL_LP_4_INMON   **
H1:SQZ-DCPD_NULL_RMS1_MON
H1:SQZ-DCPD_NULL_RMS2_MON
H1:SQZ-DCPD_NULL_RMS3_MON
H1:SQZ-DCPD_NULL_RMS4_MON
H1:SQZ-DCPD_RATIO_1_DB_MON
H1:SQZ-DCPD_RATIO_1_MON
H1:SQZ-DCPD_RATIO_2_DB_MON
H1:SQZ-DCPD_RATIO_2_MON
H1:SQZ-DCPD_RATIO_3_DB_MON
H1:SQZ-DCPD_RATIO_3_MON
H1:SQZ-DCPD_RATIO_4_DB_MON
H1:SQZ-DCPD_RATIO_4_MON
H1:SQZ-DCPD_SUM_BP_1_INMON **
H1:SQZ-DCPD_SUM_BP_2_INMON  **
H1:SQZ-DCPD_SUM_BP_3_INMON **
H1:SQZ-DCPD_SUM_BP_4_INMON  **
H1:SQZ-DCPD_SUM_LP_1_INMON **
H1:SQZ-DCPD_SUM_LP_2_INMON  **
H1:SQZ-DCPD_SUM_LP_3_INMON **
H1:SQZ-DCPD_SUM_LP_4_INMON  **
H1:SQZ-DCPD_SUM_RMS1_MON
H1:SQZ-DCPD_SUM_RMS2_MON
H1:SQZ-DCPD_SUM_RMS3_MON
H1:SQZ-DCPD_SUM_RMS4_MON
Thank you very much Jeff. We have taken steps to remove all {IFO}:SQZ-DCPD_ channels for future lasso runs. However, it also occured to me that lasso was updated to by default not consider channels that don't change in the first ten minutes of its run. This is not a good way to catch changes in the middle of a segment. So I generated a full channel list by hand using:
(ligo-summary-3.7) [joshua.smith@ldas-pcdev1 lasso-Nov-6-2019-4]$ gw_data_find -o H -t H1_T -u file -s 1257040818 -e 1257040918 -n | xargs FrChannels | egrep -v "OAF-RANGE|CDS-SENSEMON|CAL-CS_DARM|SQZ-DCPD_|SUS-*TM*MODE*" | egrep ".mean|.rms" | cut -d\ -f1 > chans.txt
and ran lasso on this much longer channel list.
(ligo-summary-3.7) [joshua.smith@ldas-pcdev1 lasso-Nov-6-2019-4]$ nohup gwdetchar-lasso-correlation -i H1 -f chans.txt -T minute -a 0.2 -O 2.5 -J 16 -j 16 1257040818 1257058818 &
The results are here: https://ldas-jobs.ligo-wa.caltech.edu/~jrsmith/detchar/O3b/lasso-Nov-6-2019-4/
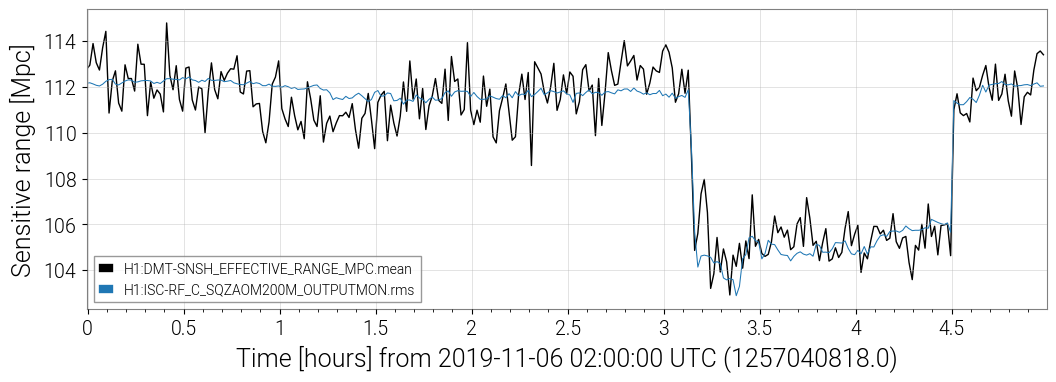
Conclusion: This points to H1:ISC-RF_C_SQZAOM200M_OUTPUTMON as the most highly correlated. But also has a list of channels highly correlated to that one, which I've pasted below. I am posting this hastily, as I have to run, so I am sorry, again I have not investigated these channels as a follow up yet, but I thought it could be helpful for commissioners to see the updated list.
|
Channel |
Pearson Coefficient |
|
-0.9999996566205920 |
H1:ISC-RF_C_SQZAOM200M_OUTPUTMON.mean |
|
-0.9330572847583630 |
H1:OMC-LSC_I_OUT_DQ.rms |
|
0.8875620058071610 |
H1:ASC-OMCR_B_PIT_OUT_DQ.mean |
|
0.887557437214179 |
H1:ASC-OMCR_B_MTRX_P_OUTMON.mean |
|
0.8875548329386750 |
H1:ASC-OMCR_B_PIT_OUT16.mean |
|
0.8875269357613680 |
H1:ASC-OMCR_B_PIT_INMON.mean |
|
0.8875269357613680 |
H1:ASC-OMCR_B_PIT_OUTPUT.mean |
|
-0.8867419443426080 |
H1:OMC-ASC_Y2_X_SIN_OUT16.rms |
|
-0.8818601017037520 |
H1:SYS-TIMING_C_FO_A_PORT_5_SLAVE_VCXOCTRL.mean |
|
-0.8818600988445600 |
H1:SYS-TIMING_C_FO_A_PORT_5_SLAVE_VCXOCTRL.rms |
|
-0.8750126151025700 |
H1:OMC-ASC_P1_X_COS_OUT16.rms |
|
-0.8673301041530260 |
H1:OMC-ASC_P2_X_SIN_OUT16.rms |
|
-0.8642192268464130 |
H1:ISI-BS_ST2_BLND_RZ_GS13_CUR_IN1_DQ.rms |
|
-0.8627117825481380 |
H1:OMC-ASC_Y2_X_COS_OUT16.rms |
|
-0.861022683603709 |
H1:PEM-C_SUP_RACK1_TEMPERATURE.rms |
|
-0.8610220968306960 |
H1:PEM-C_SUP_RACK1_TEMPERATURE.mean |
|
0.858408671078947 |
H1:IOP-ASC0_ADC_DT_OUT16.mean |
|
0.8573914259079220 |
H1:IOP-ASC0_ADC_DT_OUT16.rms |
|
-0.8571425309954690 |
H1:HPI-ITMY_BLRMS_VP_30M.rms |
|
-0.8571423785897070 |
H1:HPI-ITMY_BLRMS_VP_30M.mean |
|
-0.856700860825061 |
H1:OMC-ASC_Y1_X_COS_OUT16.rms |
|
-0.856420367475446 |
H1:HPI-ITMY_BLRMS_LOG_VP_30M.rms |
|
-0.8564203318837560 |
H1:HPI-ITMY_BLRMS_LOG_VP_30M.mean |
|
-0.8527525850009830 |
H1:IMC-TRANS_IN1_DQ.mean |
|
-0.8527518540230320 |
H1:IMC-TRANS_OUT_DQ.mean |
|
-0.8527496025226880 |
H1:IMC-TRANS_OUT_DQ.rms |
|
-0.8527473701532360 |
H1:IMC-TRANS_OUT16.rms |
|
-0.8527470948451950 |
H1:IMC-TRANS_OUT16.mean |
|
-0.8527326142606620 |
H1:IMC-TRANS_IN1_DQ.rms |
|
-0.8523469401317910 |
H1:OMC-ASC_P1_X_SIN_OUT16.rms |
|
-0.850131863101939 |
H1:OMC-LSC_Q_OUTPUT.rms |
|
-0.850131863101939 |
H1:OMC-LSC_Q_INMON.rms |
Ethan, Adrian, Sheila
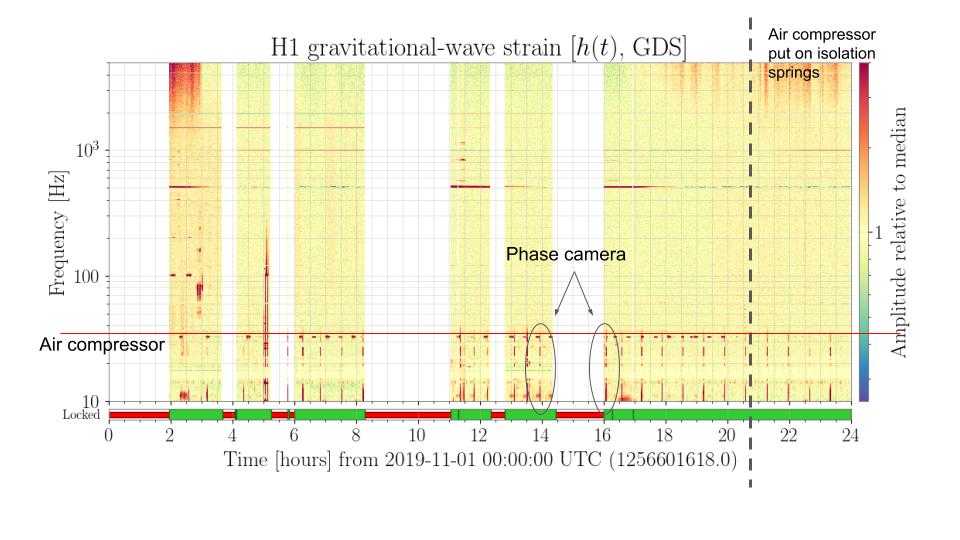
A few minutes before Nov 01 2019 20:41:42 UTC, the instrument air compressor was put on isolation springs in order to mitigate scattering in DARM at 35 Hz (see alog 52879). The first attached plot shows when the compressor was placed on springs. The horizontal red line in the figure it set slightly above 35 Hz.
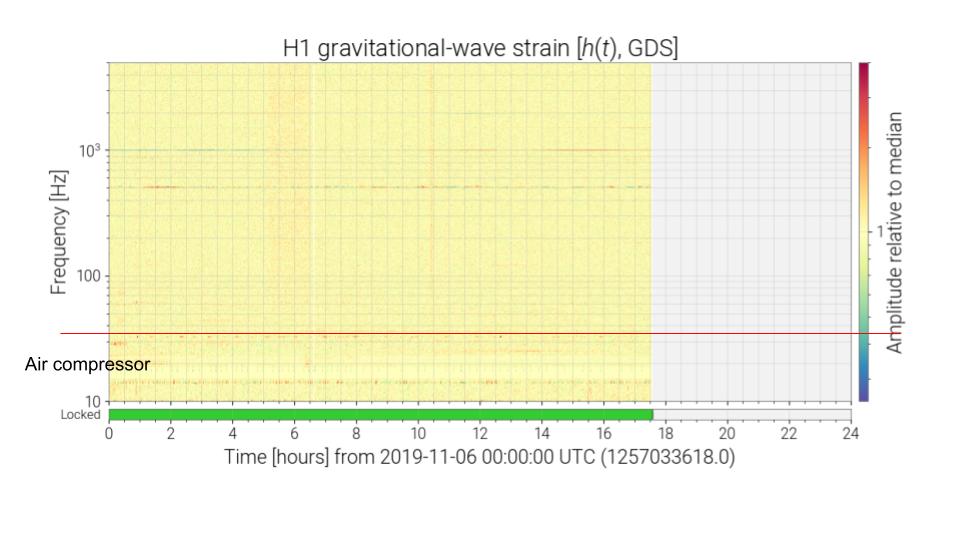
Following up on this a few days later (Nov 6), we see there is still some scattering at 35 Hz that is consistent with the behaviour of the air compressor. This seen in the second attached figure.
Some work could be undertaken to better isolate the compressor and/or locate the coupling site.
I've written a mid-level library of functions I always use to quickly get and plot data from nds2 in python 3.  It's called nds2utils.

If you'd like to use it and provide feedback, I'd welcome it at https://git.ligo.org/craig-cahillane/nds2utils.  There are 11 examples.

It's on PyPi, so you can pip install it in your favorite virtual environment.

pip install nds2utils
Tagging @CDS and @DetChar -- maybe we can make this a part of standard CDS workstation environments? Perhaps add it to the RemoteAccess collection of utilities for the LSC?
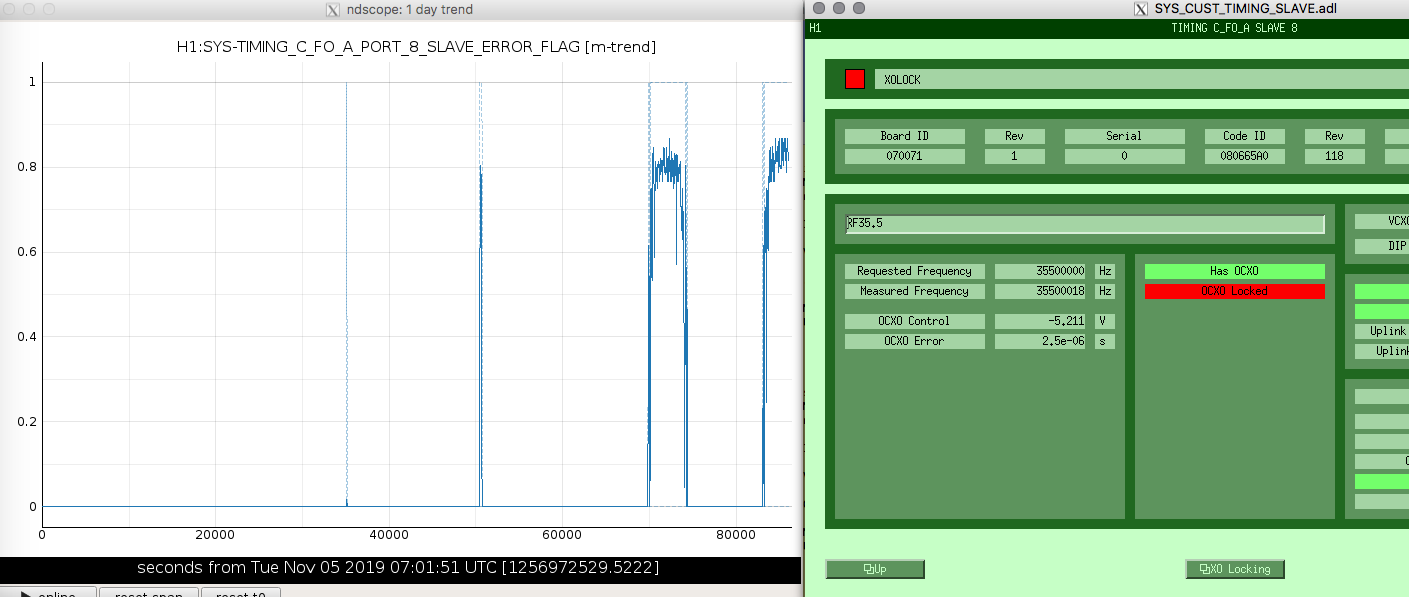
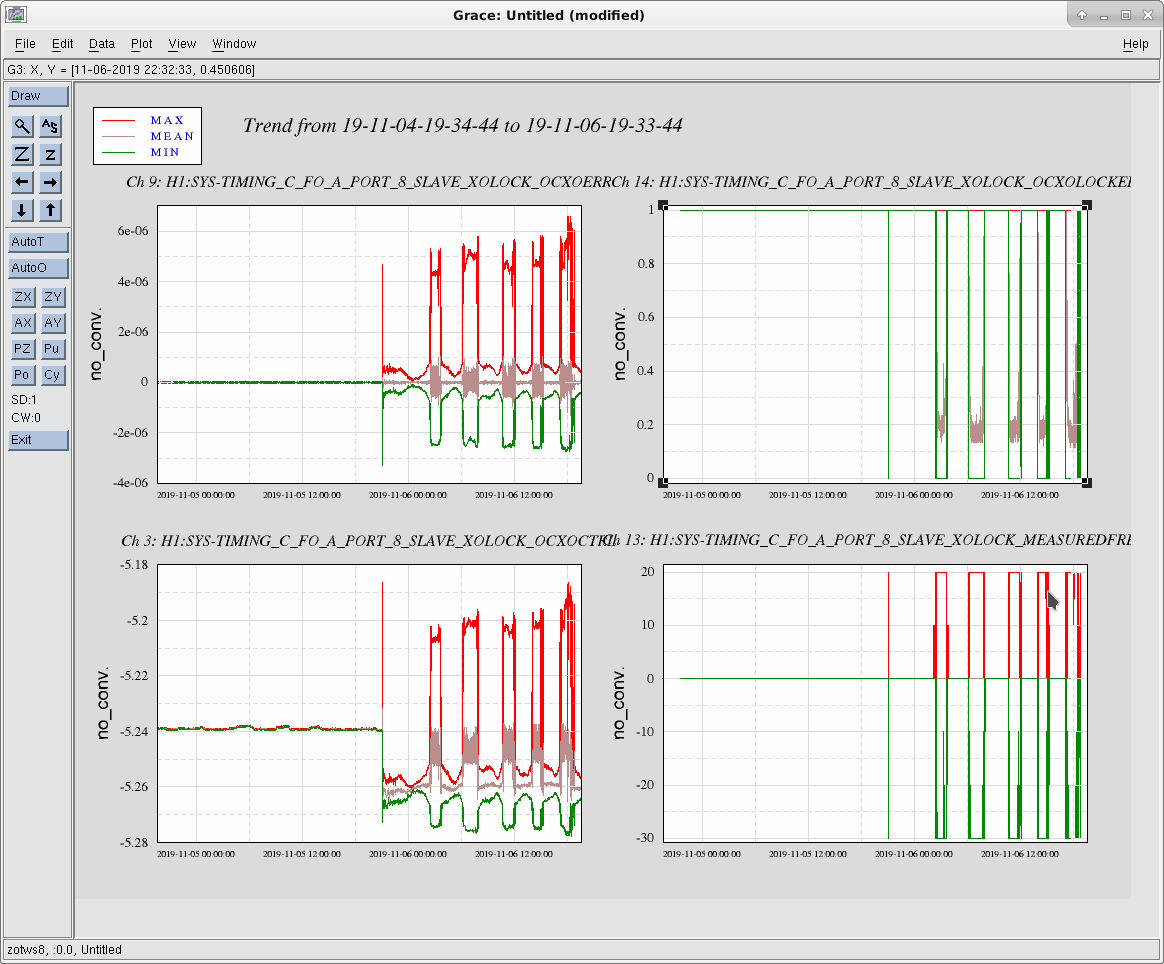
I just noticed an intermittent timing error on the CDS overview. The RF Amp attached to port 8 of CER fanout-A has been showing a locking error on the oven controlled crystal oscillator. Image shows a 24 hour trend of the error signal alongside the Amp MEDM at a time when the system was in error. First error showed around 08:40 PST this morning, the large error stretches in the plot are roughly between 18:30 to 19:30, and from 22:15 to now (23:00).
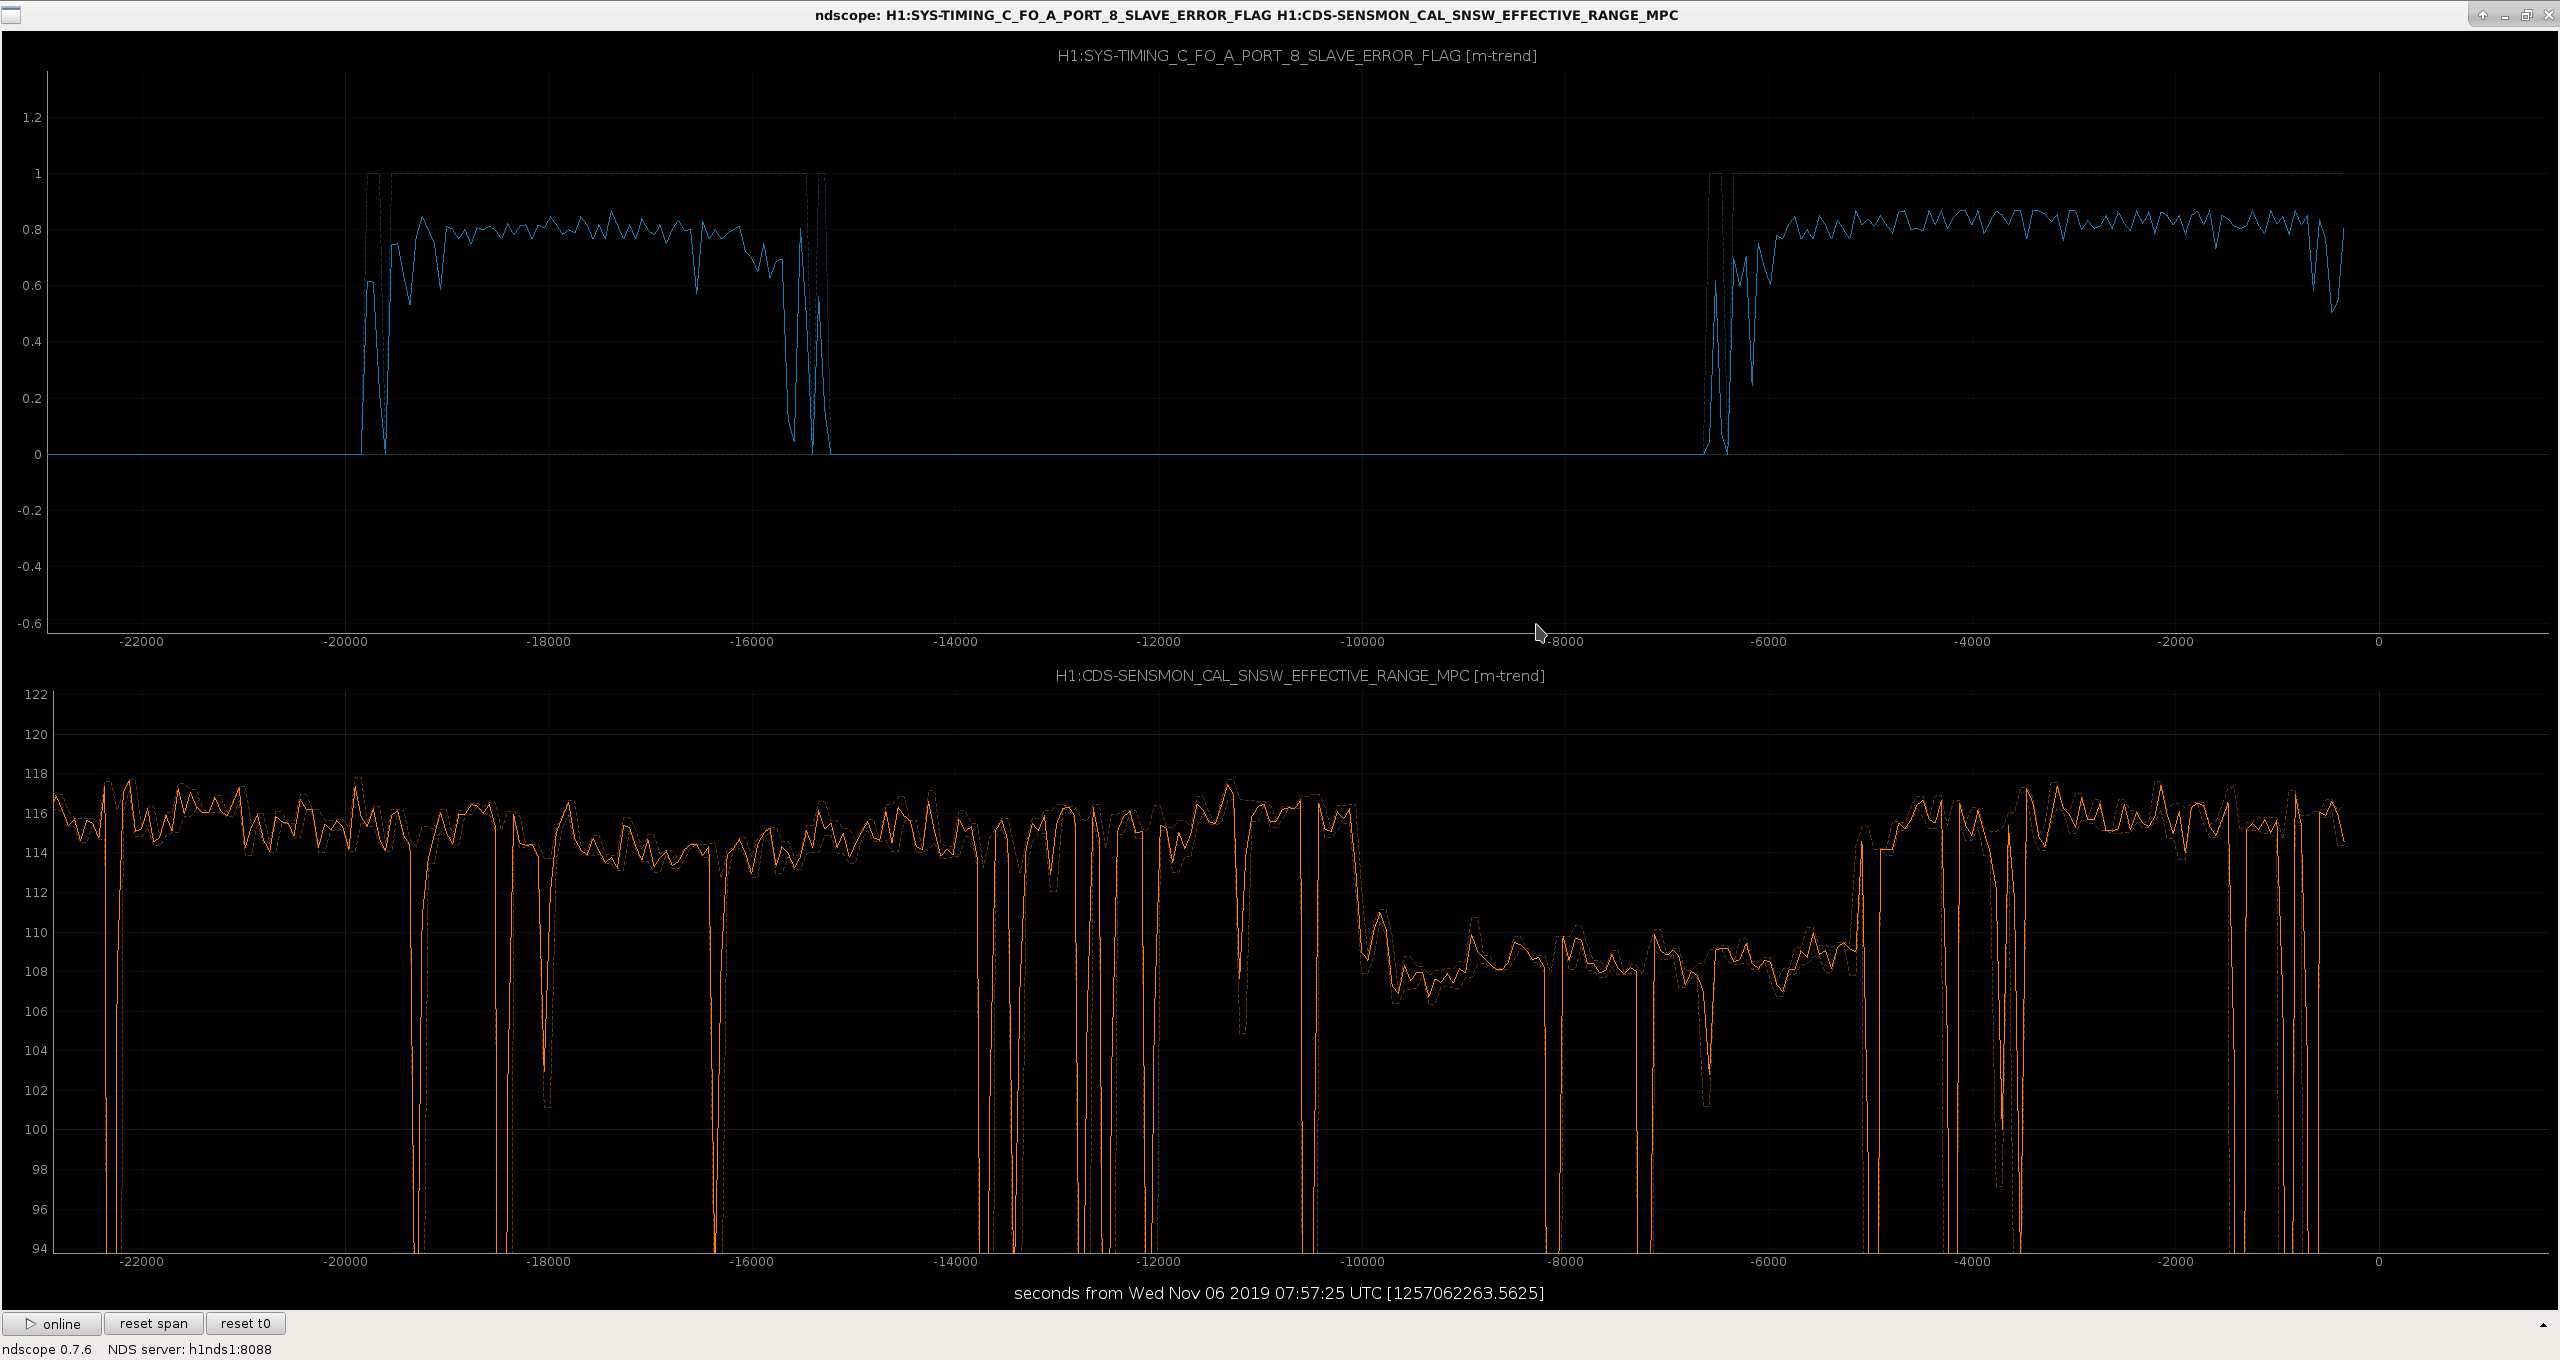
I had thought that the times Dave gave me over the phone almost lined up with increases in range, but maybe not. Attached screenshot shows the last several hours of his error flag (blue) and the sensmon range (yellow), doesn't really seem to be a relationship.
This oscillator source started going wonky around 11/5/2019 21:03 UTC
Tagging @Detchar, in case they can add more to the impact of these channels (and just in case they've also found this as an idea for correlation with the range drops).
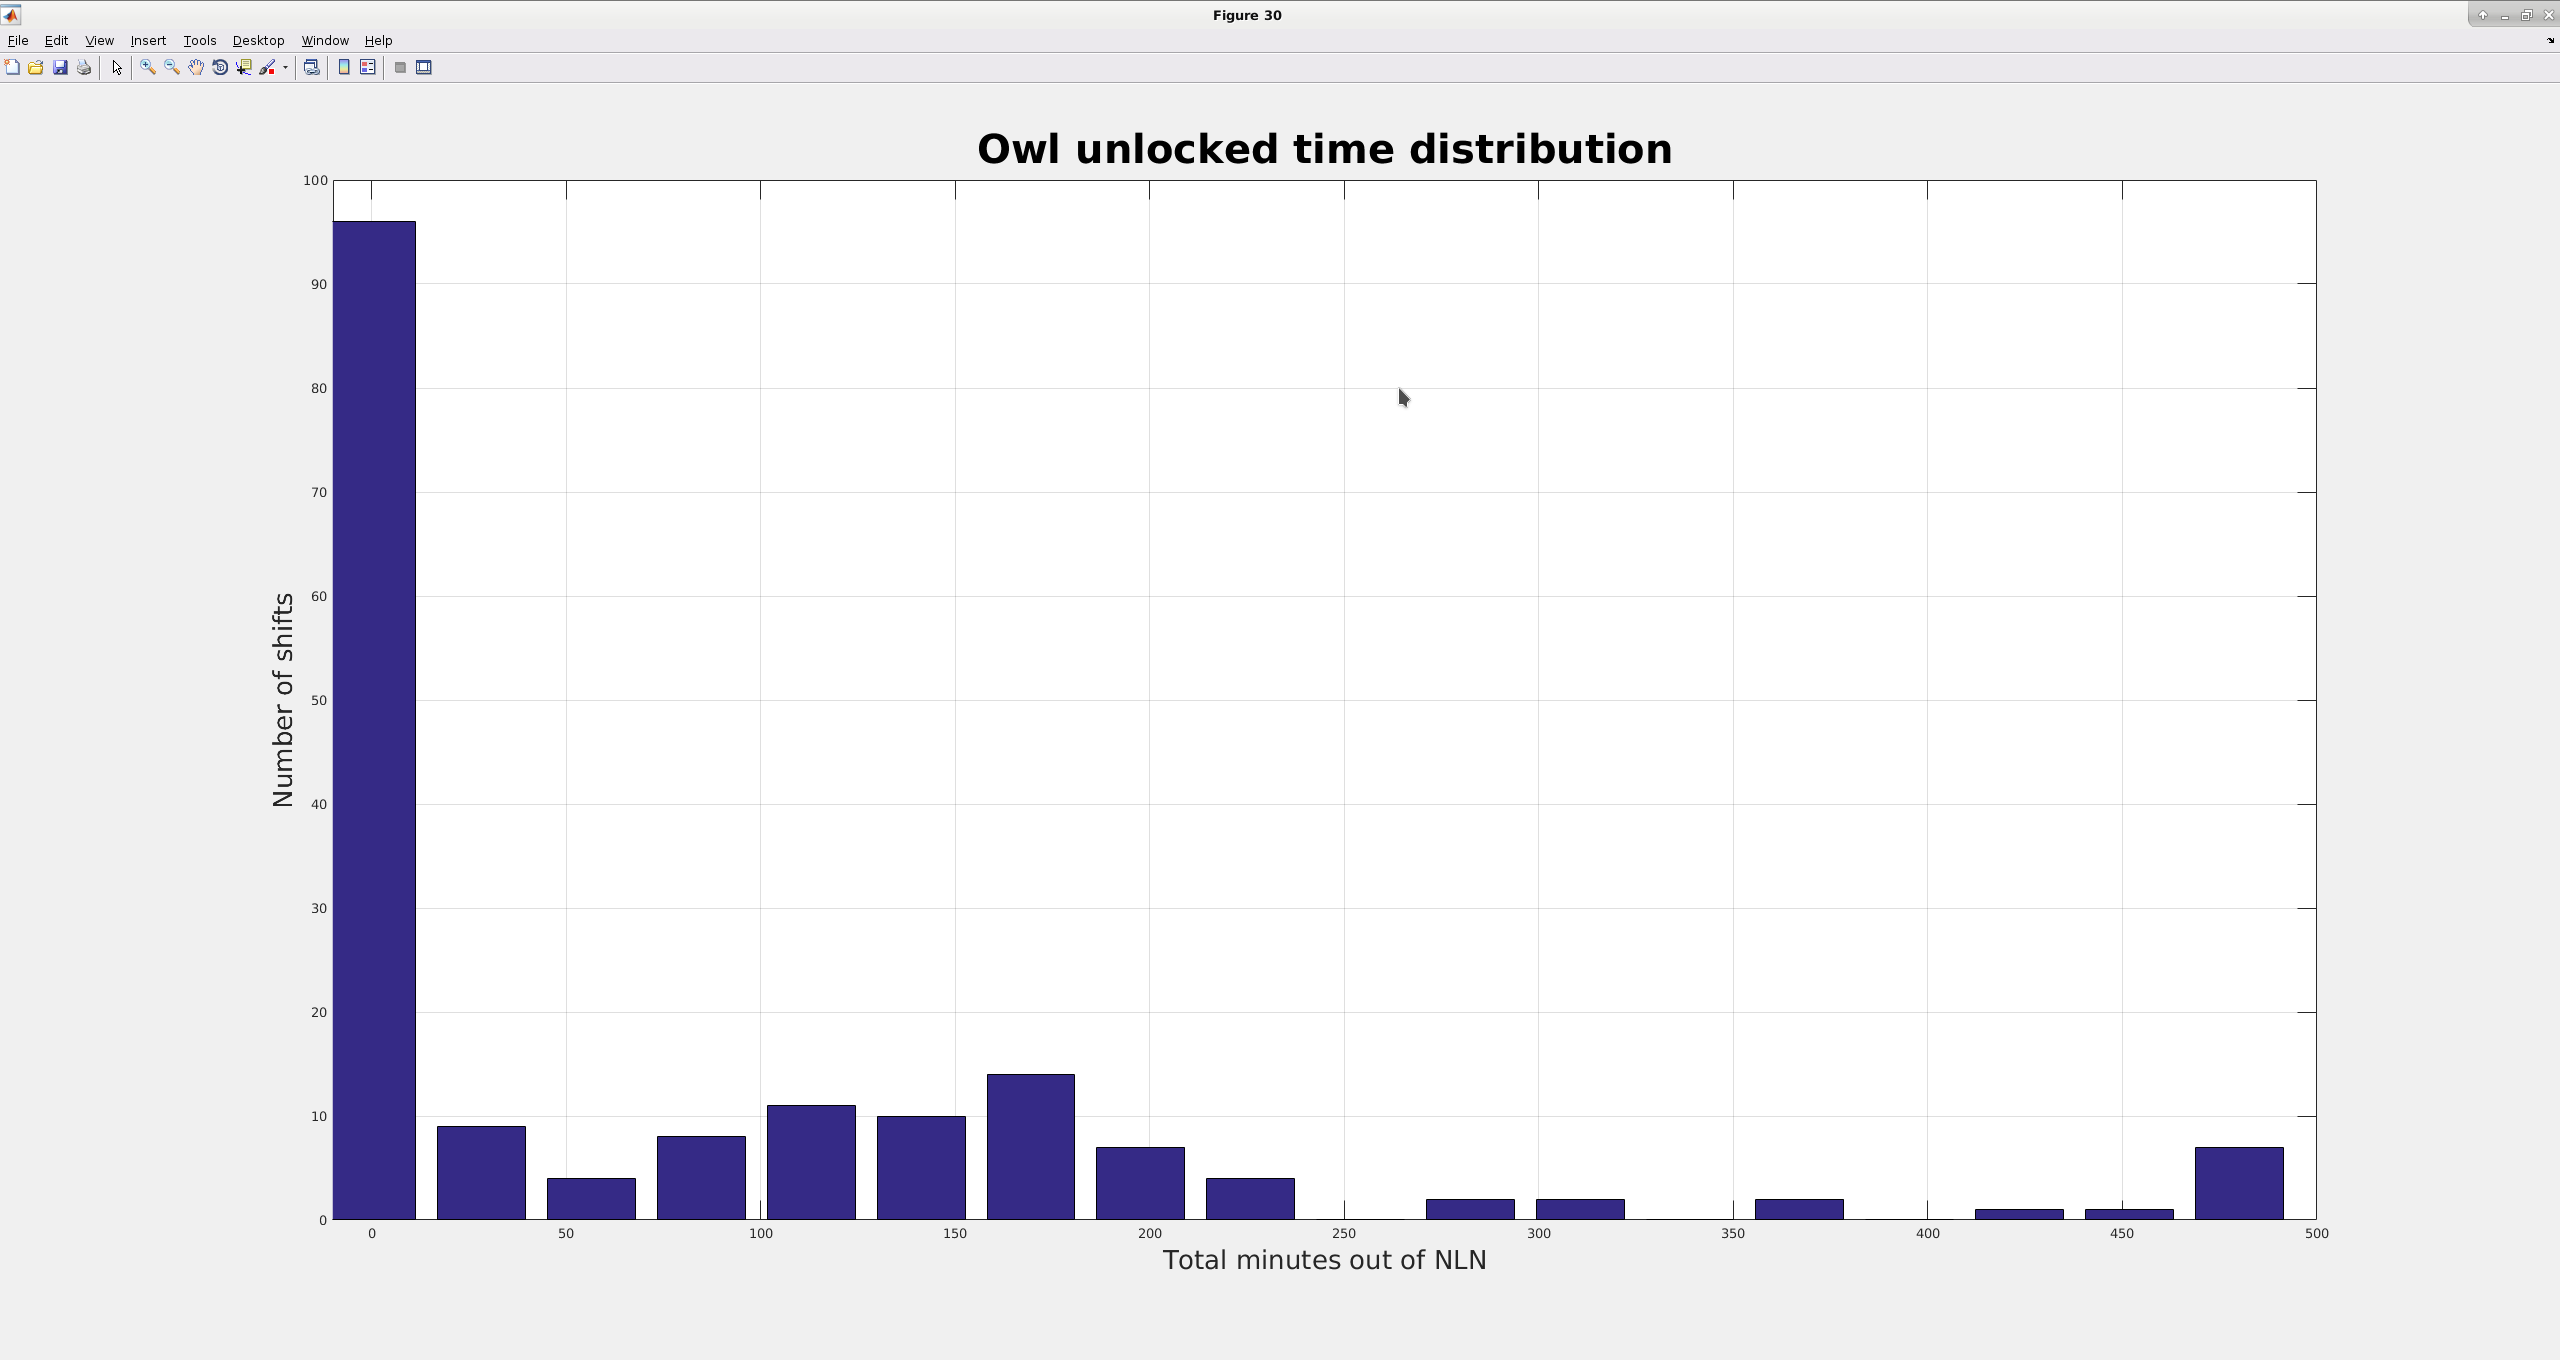
I've had a quick look at the duty cycle during owls for O3a. A couple of quick numbers:
Of 176 total owl shifts, there were 96 shifts the IFO was locked when the owl shift started and stayed locked the entire time.
There were 7 shifts where the IFO never got to NLN.
The duty cycle for all O3a owl shifts was 84%, or: we were in some state other than NLN for 16% of the time.
Attached plot is the distribution for the amount of time the IFO was not in nln. The X bins are the number of minutes (with 30 minute bins) the IFO wasn't locked, the Y axis is the number shifts for each bin (i.e if the ifo was out of nln for 130 minutes, that shift gets counted as 1 instance in the 120-150 minute bin). I'll point out the tallest spike by far is the one at 0, where the IFO was locked the entire shift.
Not too sure what else to make of this, but the lump around 150 minutes kind of lines up with our normal time required to relock, indicating to me that mostly we lost lock once, then had a normal time relocking. Probably, most of the bins below 100 and above zero are from locklosses at the end of a shift, or a reacquisition that was started before the owl shift.
Adding a few tags so that more people see this entry. Great information, Jim!
The first plot on the first page of the figure shows that the seismic signal from the instrument air compressor was reduced today by seismic isolation. But the huge DARM noise, with close to the same periodicity, is still occurring. Our manipulation of the on and off pressures for the compressor, and the new GV5 and 7 pressure settings, see previous entries, did not seem to affect the DARM noise – see end of first page time series. This and the observation that the noise does not occur at exactly the same part of the compressor cycle every time, is evidence that they are causally unrelated, though they have similar periods. On the other hand, the second plot seems to show that the period of the DARM noise changed with the period of the compressor a couple of days ago…. Chandra, Kyle and I were in the LVEA from UTC 23:40 to 00:06 on Nov 1 and 2.
Associated with FRS Ticket 13809.
Sheila, Timesh, Robert
There have been several alogs about this and there will be others, but I wanted to try make the situation more clear to detchar.
When the new instrument air compressor turns on, for about 5 minutes approximately every 25 minutes, we see a 35Hz line in DARM, which goes away when it is turned off. Around the time the compressor swtiches off, there are terrible scattering shelves in DARM. The onset of scattering in DARM seems to happen around the time of the compressor switching off (as seen by PEM seismometers), sometimes it is 16 seconds after, sometimes 24 seconds, sometimes before the ground motion drops off by up to a minute.
The first attached screenshot shows the regular switching of the compressor, and the board band large noise in DARM when the compressor goes off. The second screenshot shows darm spectra in 3 states: compressor off, compressor on (there is a 35Hz peak added to DARM) and compressor switching off, shelf. The PRCL/SRCL/MICH spectra also show fringe wrapping when the compressor is swtiched off.
These are probably interesting times for people who are interesting in looking for scattered light. Bubba and Tyler have ordered some parts to better isolate the new equipment, so this should be mitigated within a few days.


Bubba and Tyler have put this on isolation springs a few minutes before Nov 01 2019 20:41:42 UTC. The compressor was running on the springs for a few minutes before that and switched off at at 1256676120
There was no fringe wrapping in DARM around the time that it switched off.
Now associated with FRS Ticket 13809.
