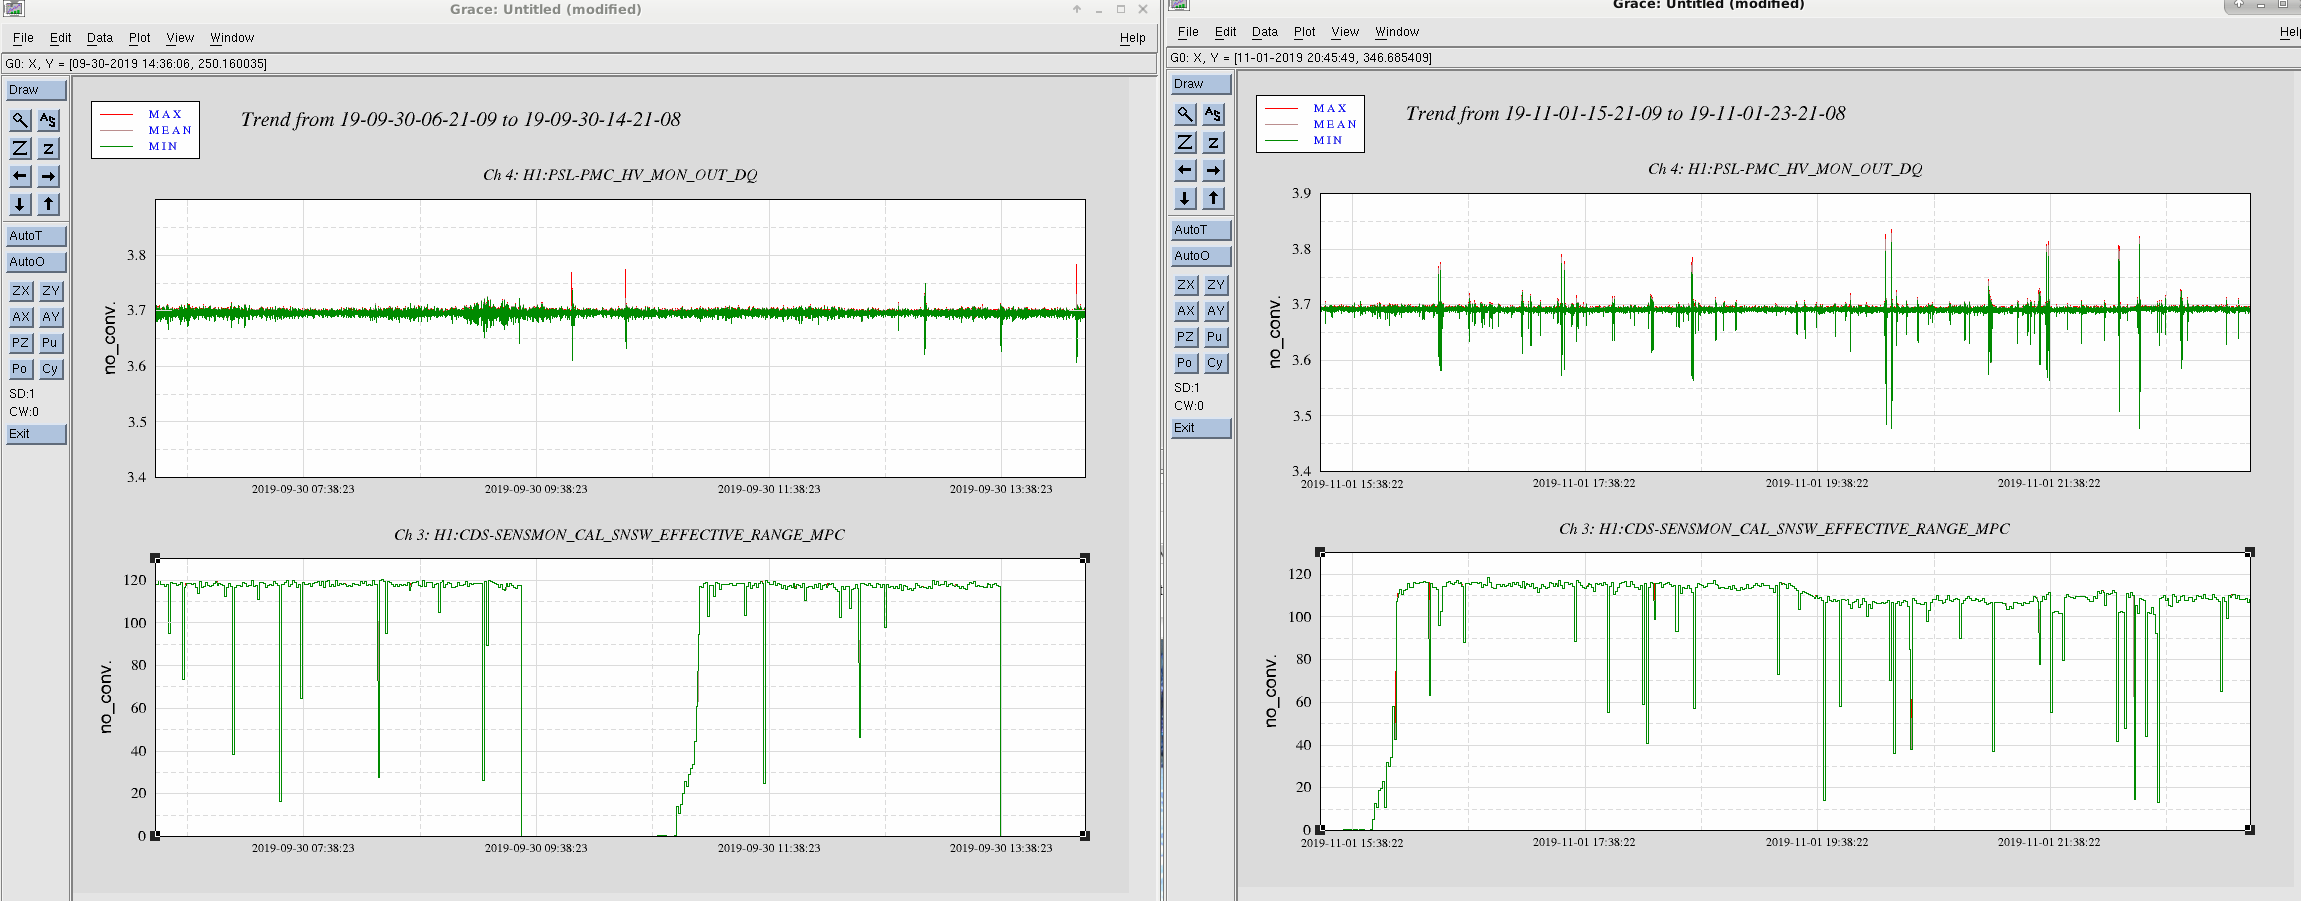
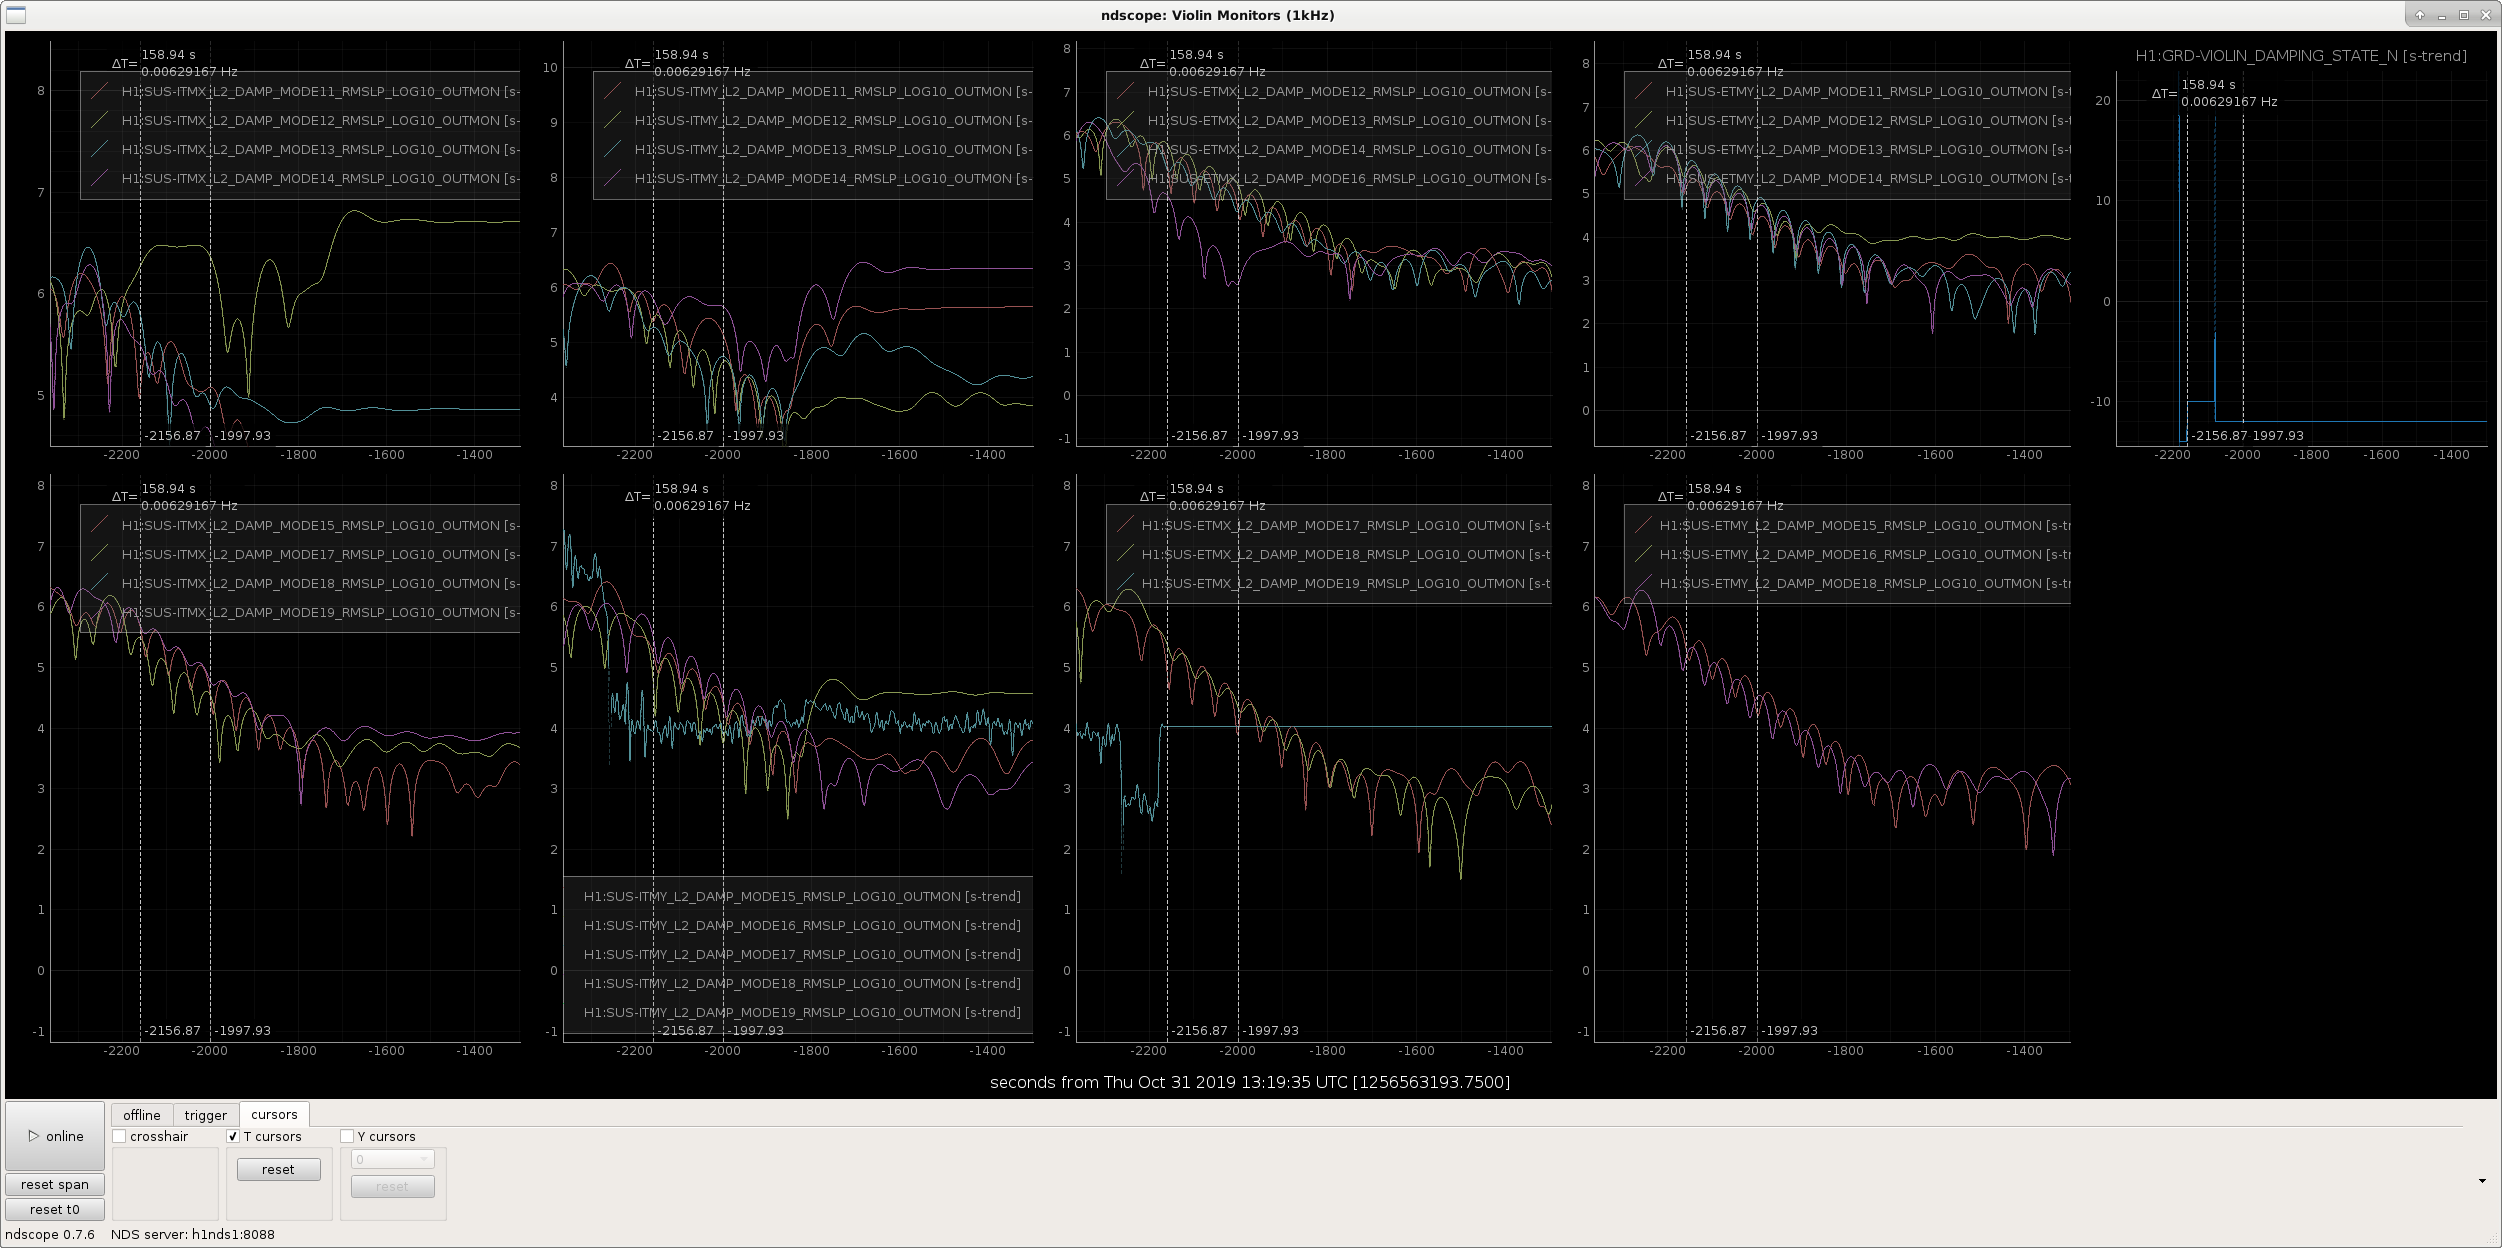
8 hours of data in each plot - left = Sept. 30 - right = Nov. 1 - significantly more glitching in Nov. 1 plot
TITLE: 11/01 Eve Shift: 23:00-07:00 UTC (16:00-00:00 PST), all times posted in UTC
STATE of H1: Observing at 108Mpc
OUTGOING OPERATOR: Cheryl
CURRENT ENVIRONMENT:
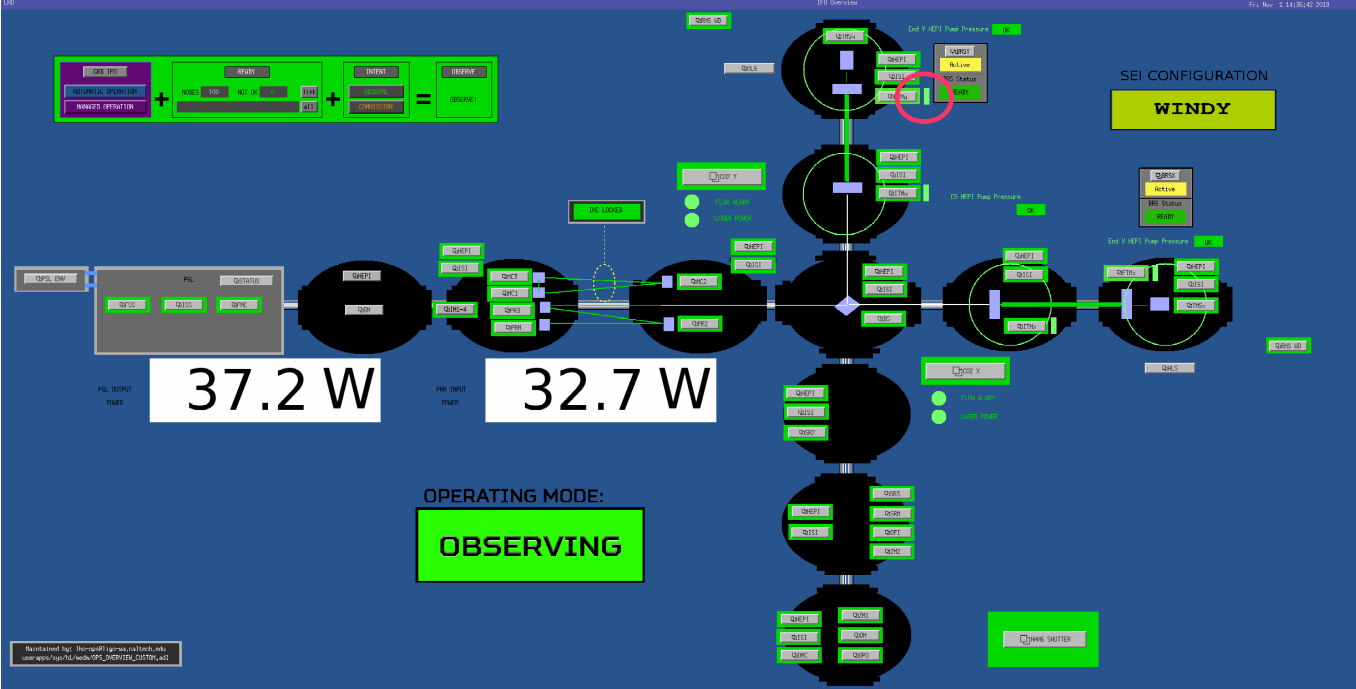
SEI_CONF state: WINDY
Wind: 6mph Gusts, 5mph 5min avg
Primary useism: 0.02 μm/s
Secondary useism: 0.15 μm/s
QUICK SUMMARY:
Commissioners investigating noise sources in DARM.
DriptaB, EthanP, RickS
Attached below are tables that list force and displacement coefficients for the Pcal power sensors in the transmitter (Tx) and receiver (Rx) modules at the end stations at both LHO and LLO and their associated uncertainties..
Also attached below are tables listing the components of the force coefficients and their statistical and systematic uncertainties. The elements in square bracket contribute to the overall uncertainty estimates.
The displacement uncertainties include contributions from unintended rotation of the ETMs (0.38%, larger for O3 due to the extreme iterferometer beam miscentering on the ETMs to minimize impact of point absorbers) and measurement of the ETM masses (0.007%).
Note that force coefficiets have changed slightly (order 0.05%) due to how the mean values are now calculated, and this results in slight changes in the displacement coefficients as well.
Epics records for force coefficients have not been changed, so the numbers from yesterday are the reference values for the O3b run. Pcal coefficients are expected to change slightly as more measurements infom estimates of mean parameter values and standard errors on the means are updated.
We found an error in the LHOX ETM mass, it was off by 1g. We earlier reported it to be 39656g, the correct ETM mass is 39657g. The updated tables with the correct ETM mass and displacement coefficients is attached. This correction does not change the uncertainty in the displacement coefficient, it is still 0.54% for both Tx and Rx at LHO X. The relative change has however decreased by 0.01% for both Tx and Rx at LHO X
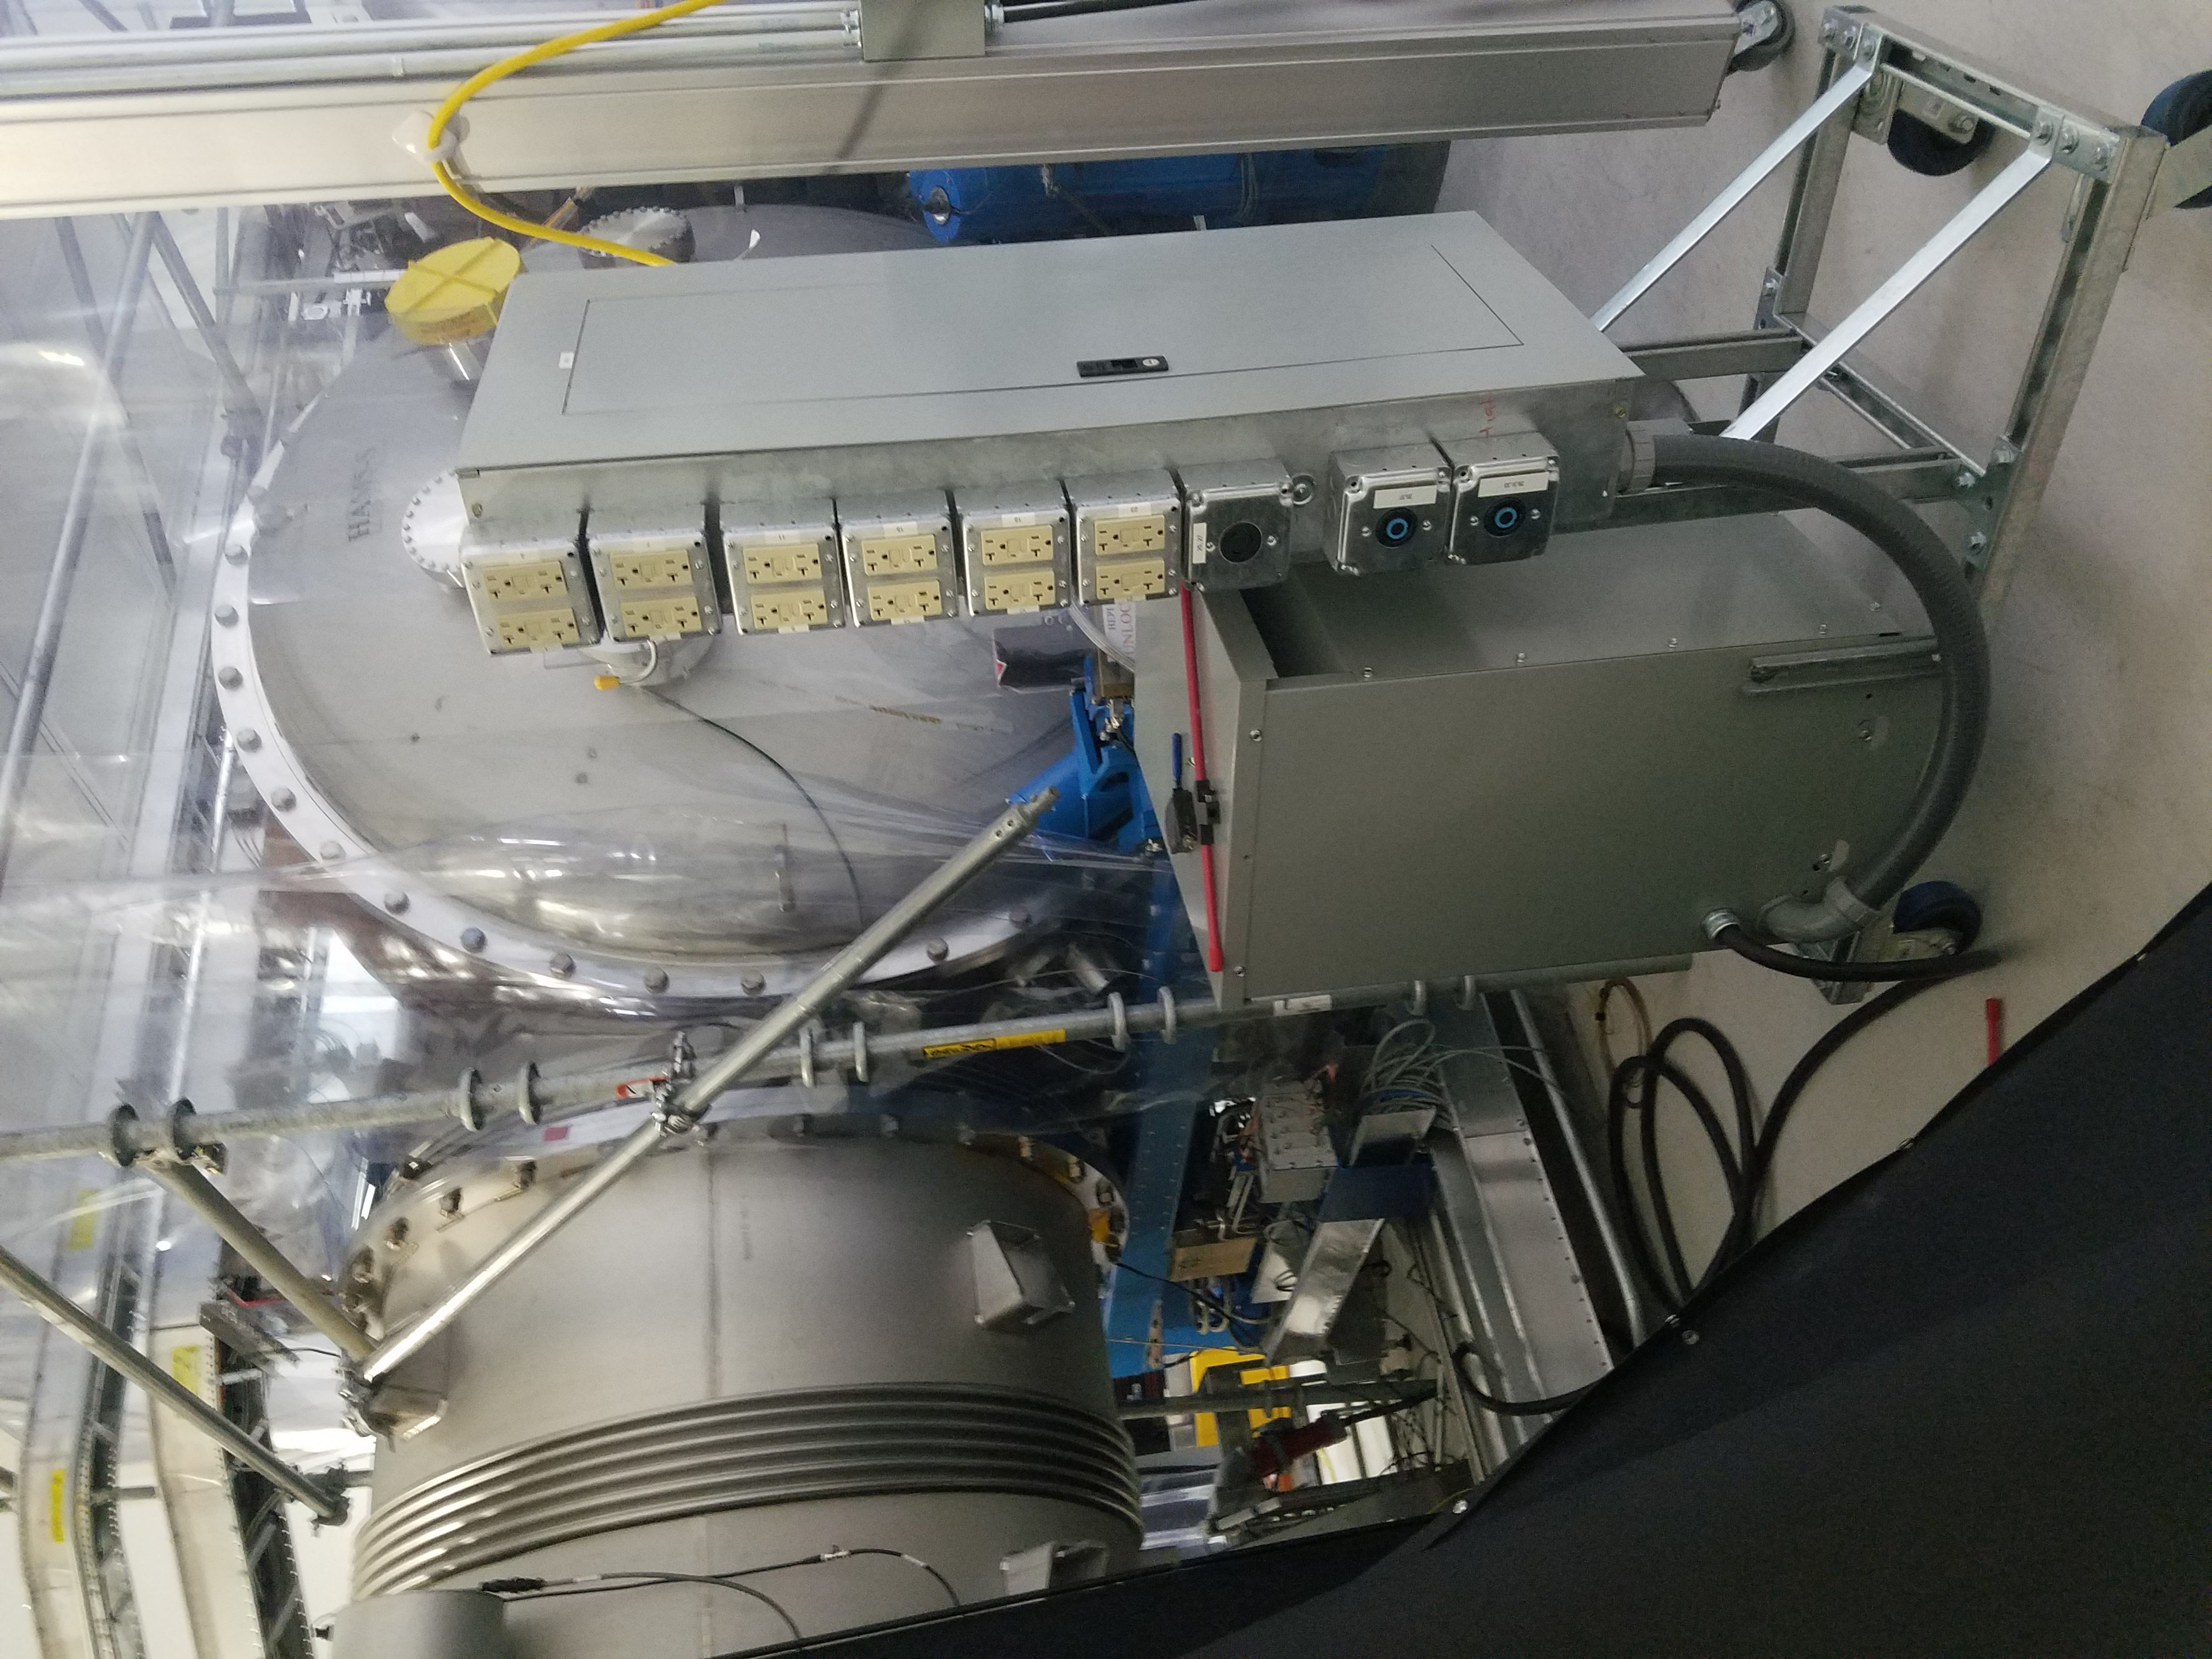
Small light next to the optic. One light for all four quadrants.
Thank you!
Range started dropping about 2 hours ago, and commissioners have been working to diagnose, and are ready to work on SQZ.
GRB353779 stand down time of 45 minutes prior to event and 15 minutes after event have been satisfied.
As of 22:34:51UTC, H1 is back in Observe.
Relative humidity levels seem normal. These plots were made using new EasyLog data loggers, so will look different than previous plots.
J. Kissel
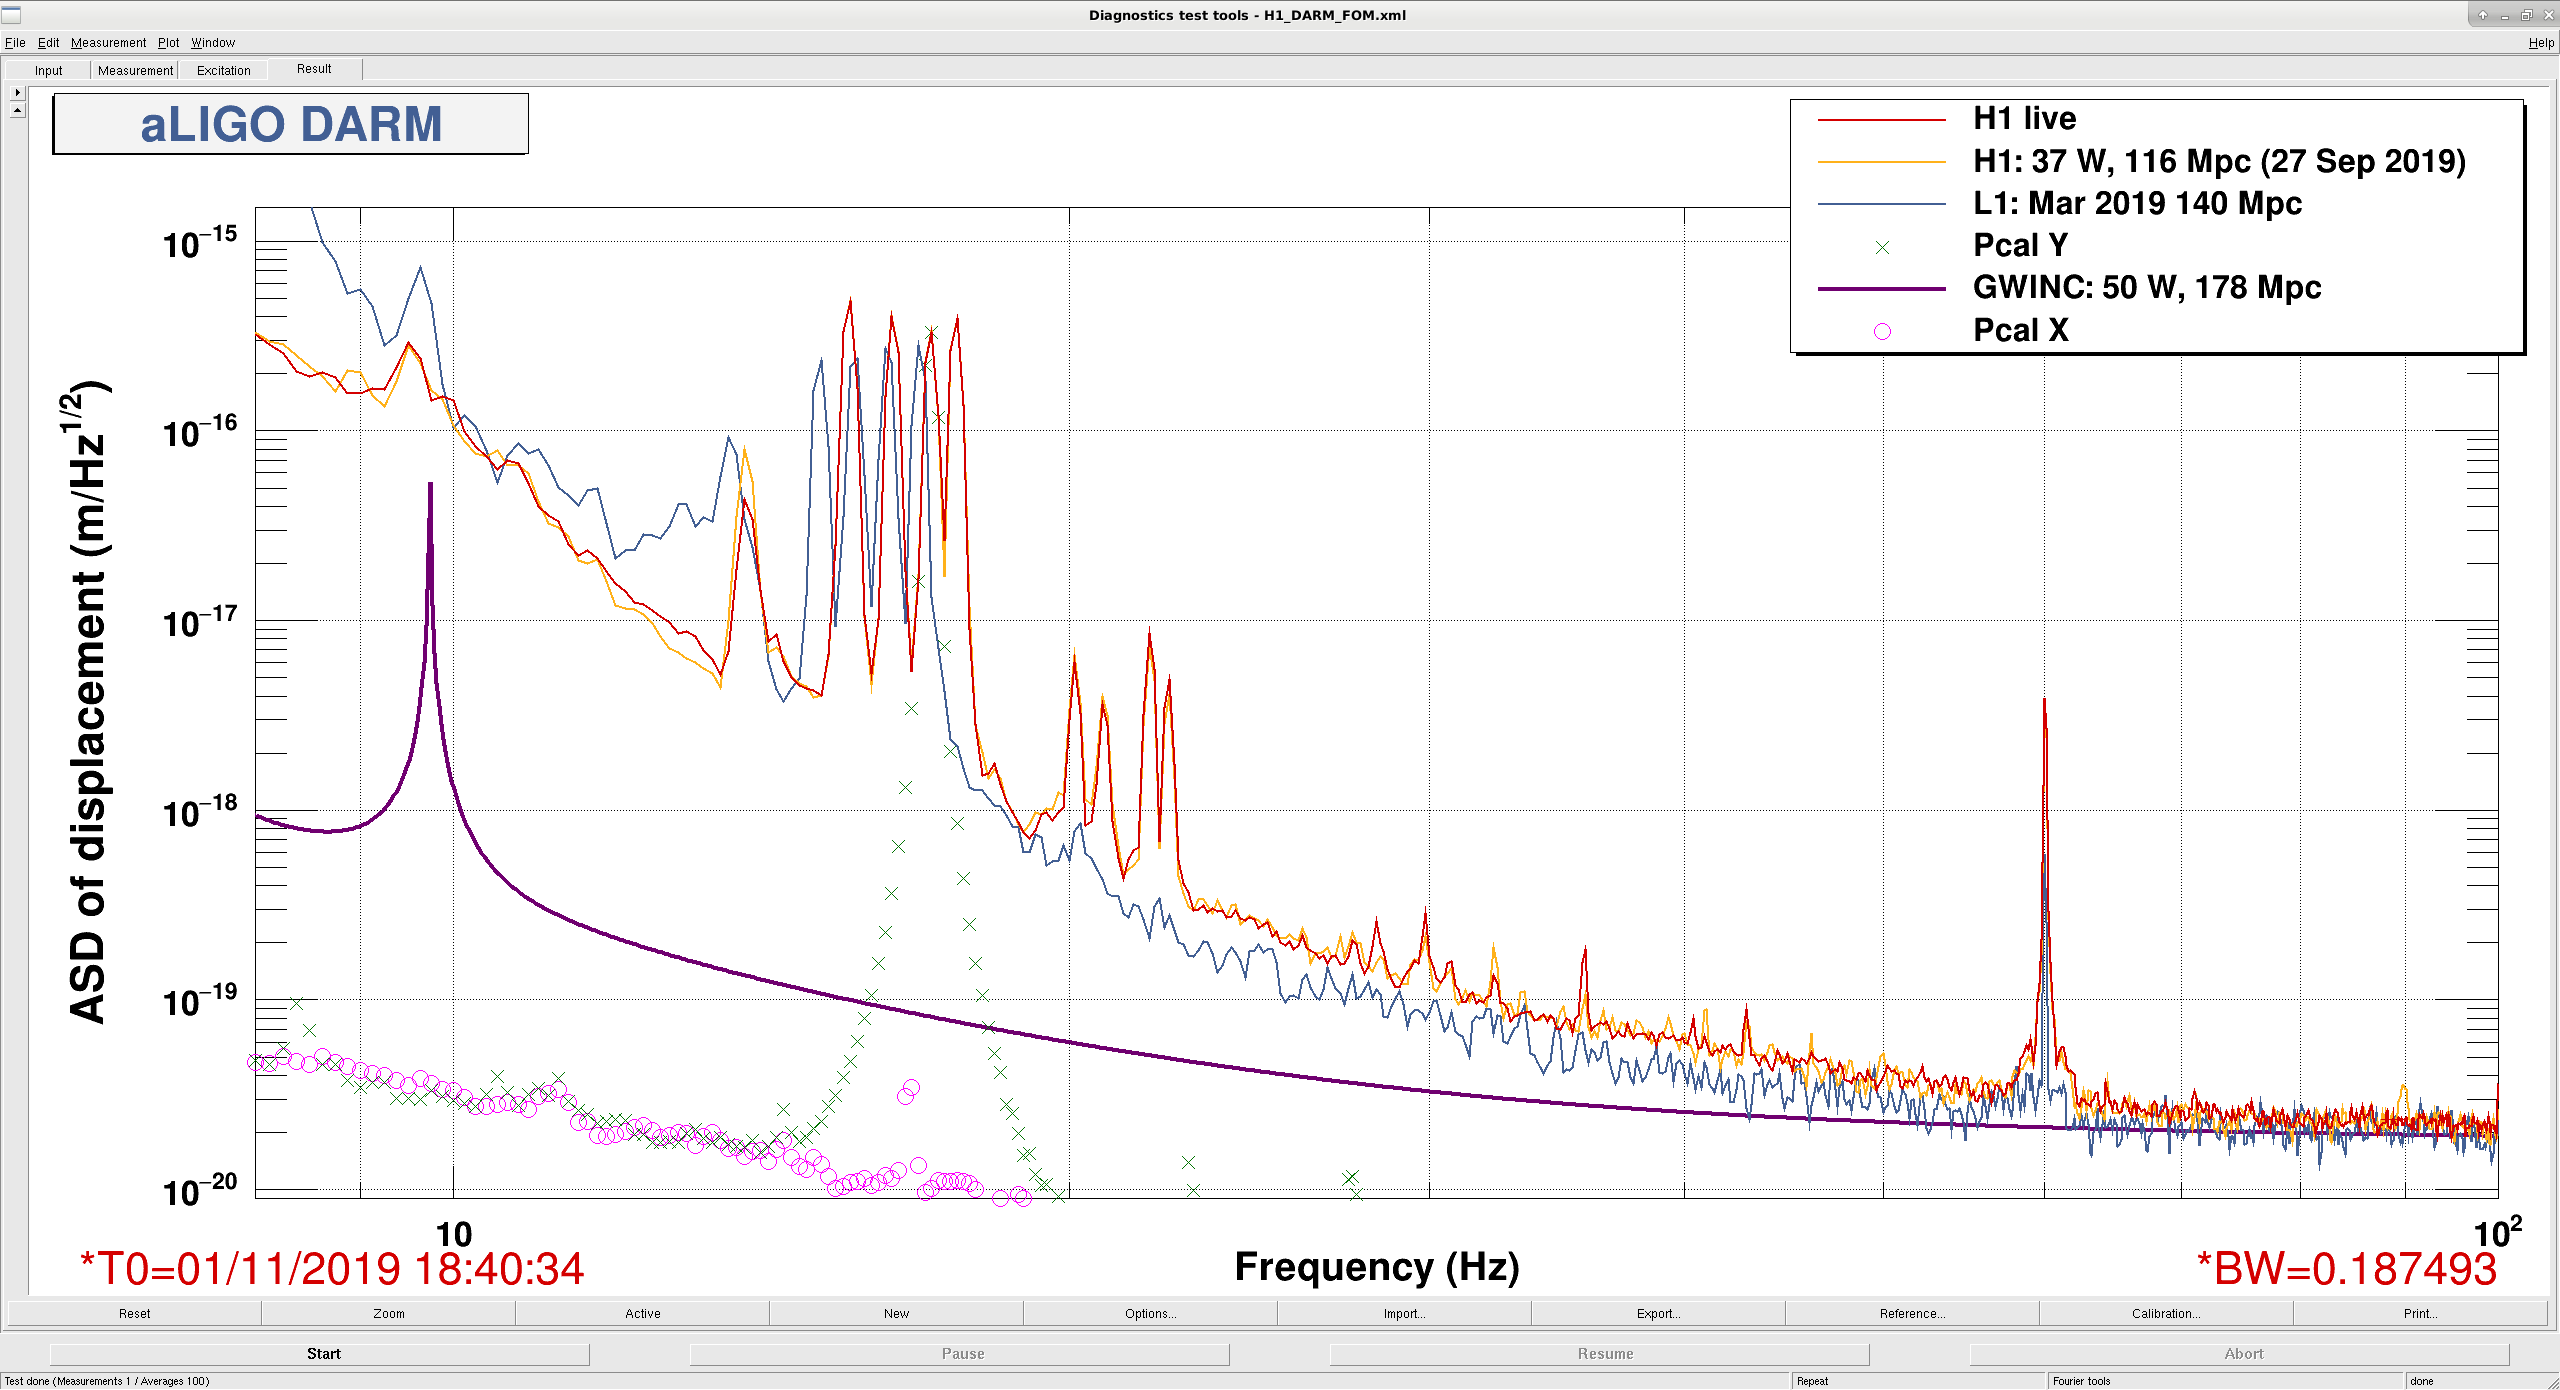
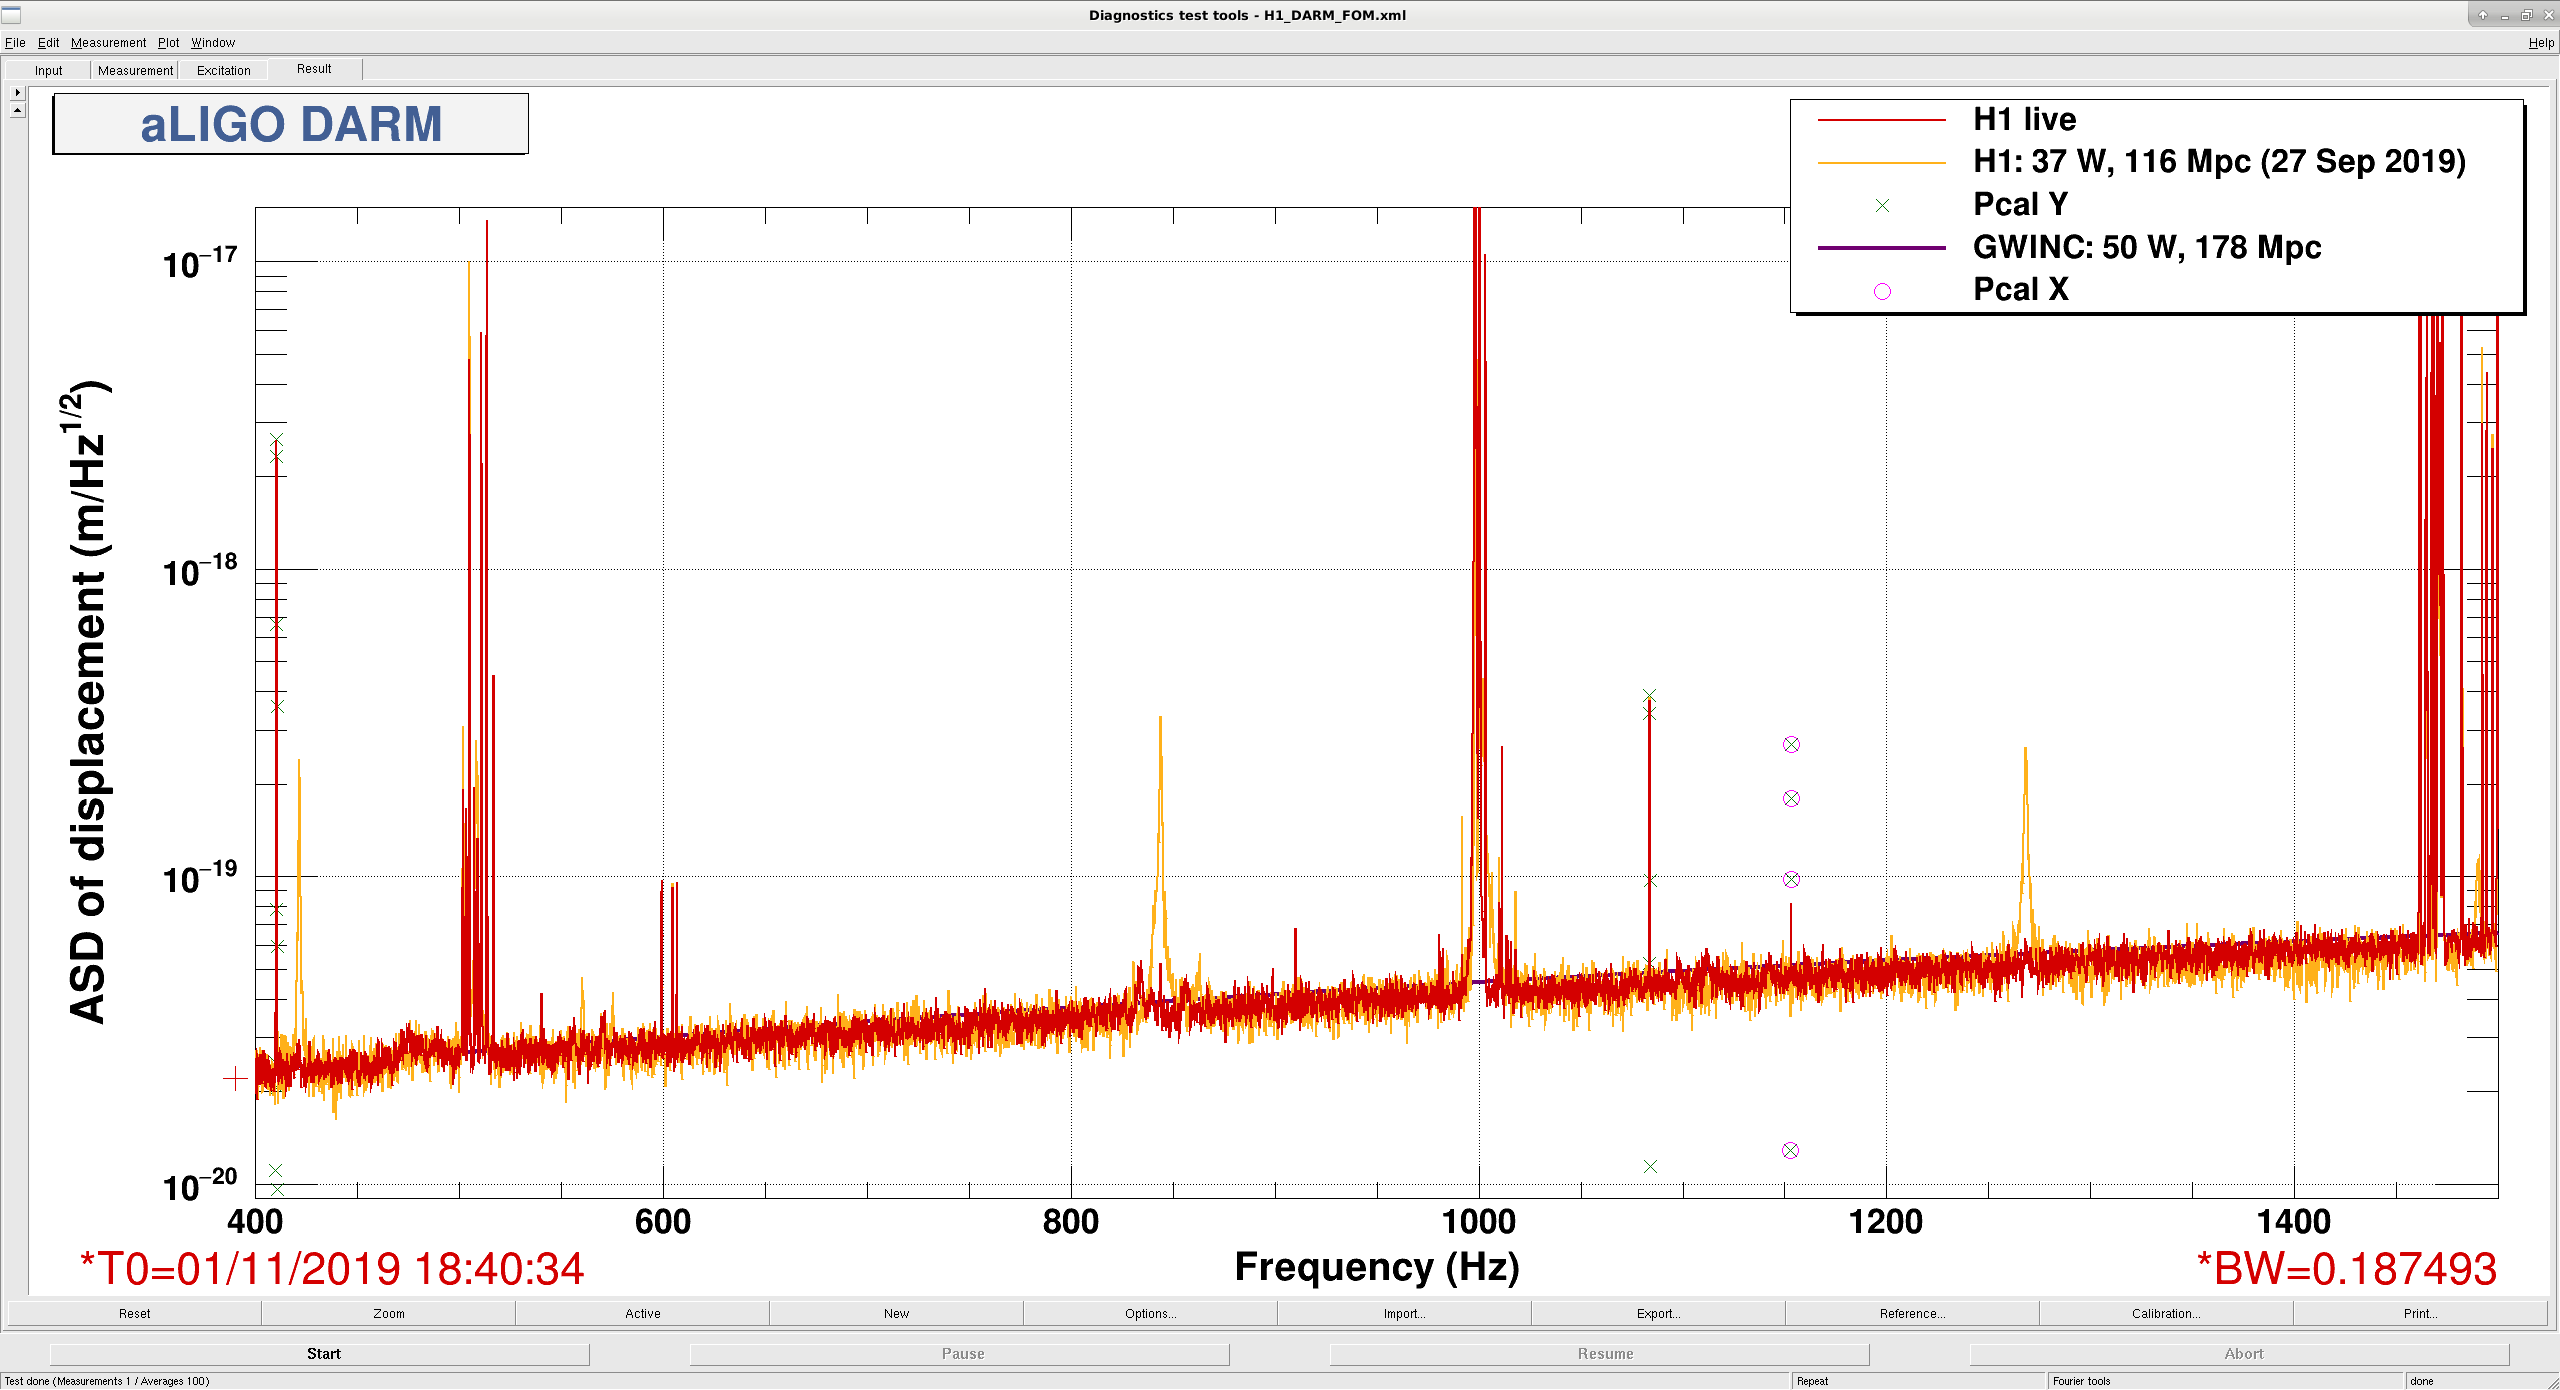
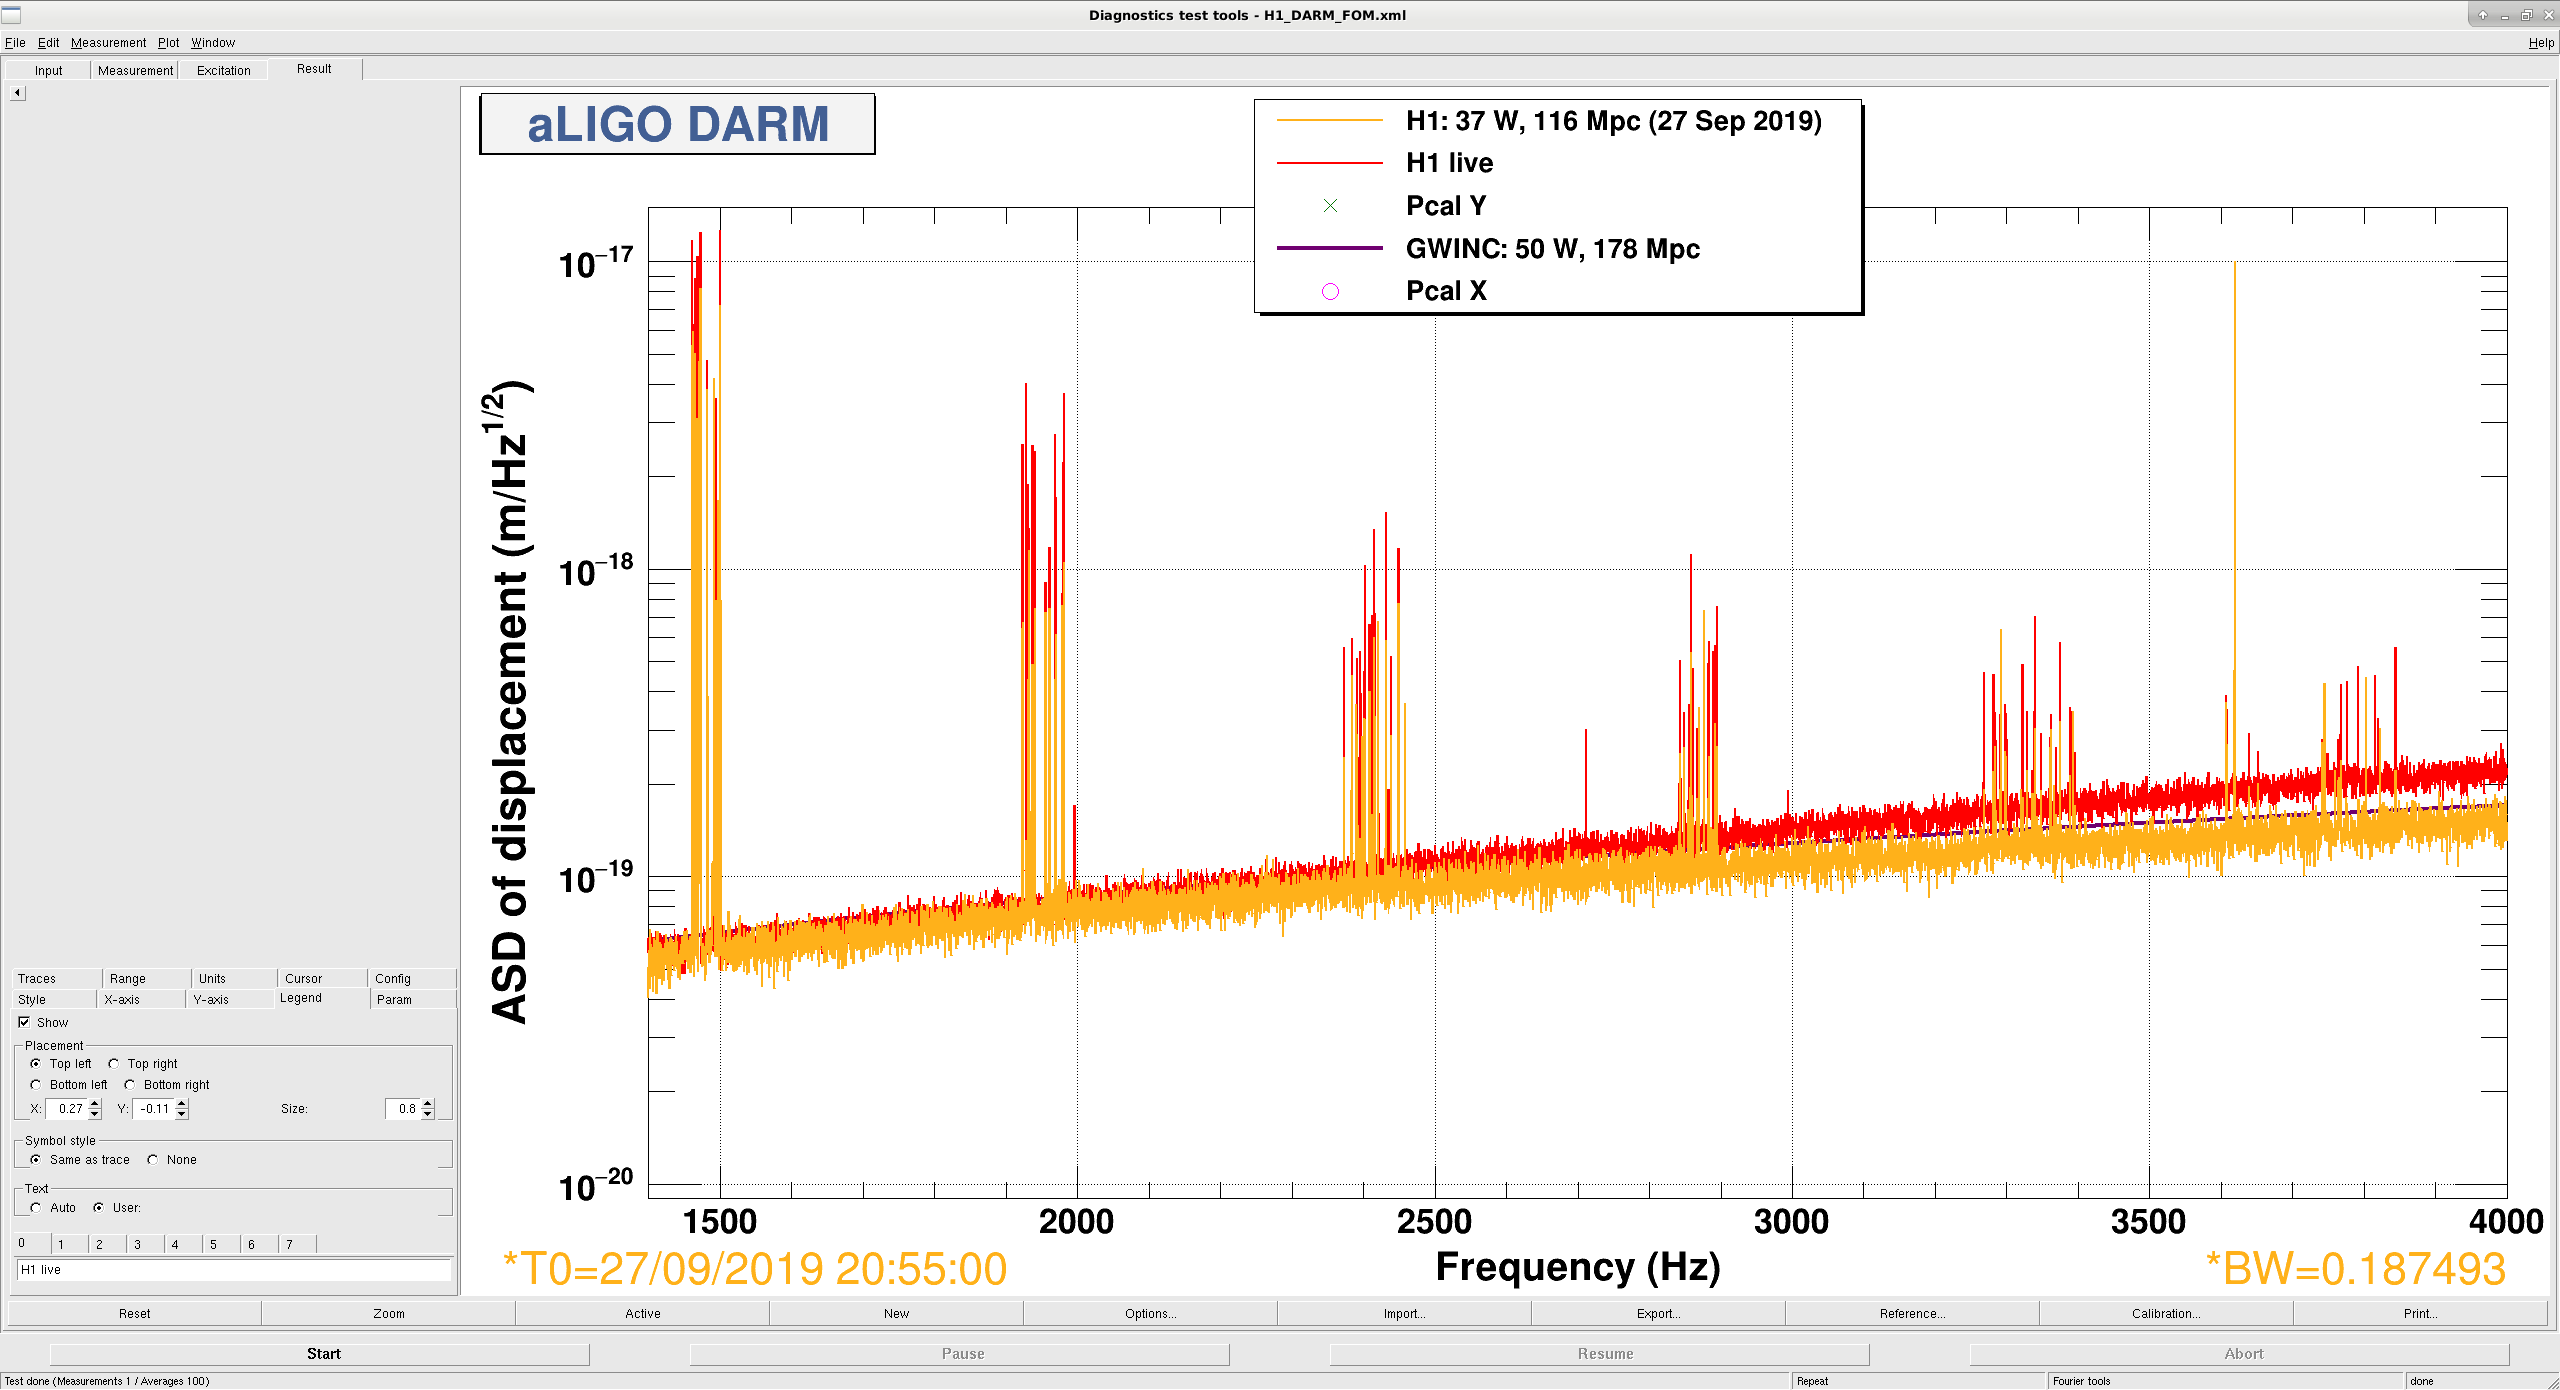
We're still in the earliest stages of understanding the differences between the O3A and O3B interferometer, so wanted to call some attention to the major spectral features that we see which are different:
Broadband:
(1) First and for most, above 1.5 kHz, the noise is a factor of a few worse. We're still investigating as to why, but we suspect the usual culprits at these frequencies: intensity and frequency noise. Craig has already reduced this noise by increasing
the common FSS gain last night to improve the frequency noise impact, and I suspect there will be more work to come.
Sharp Features:
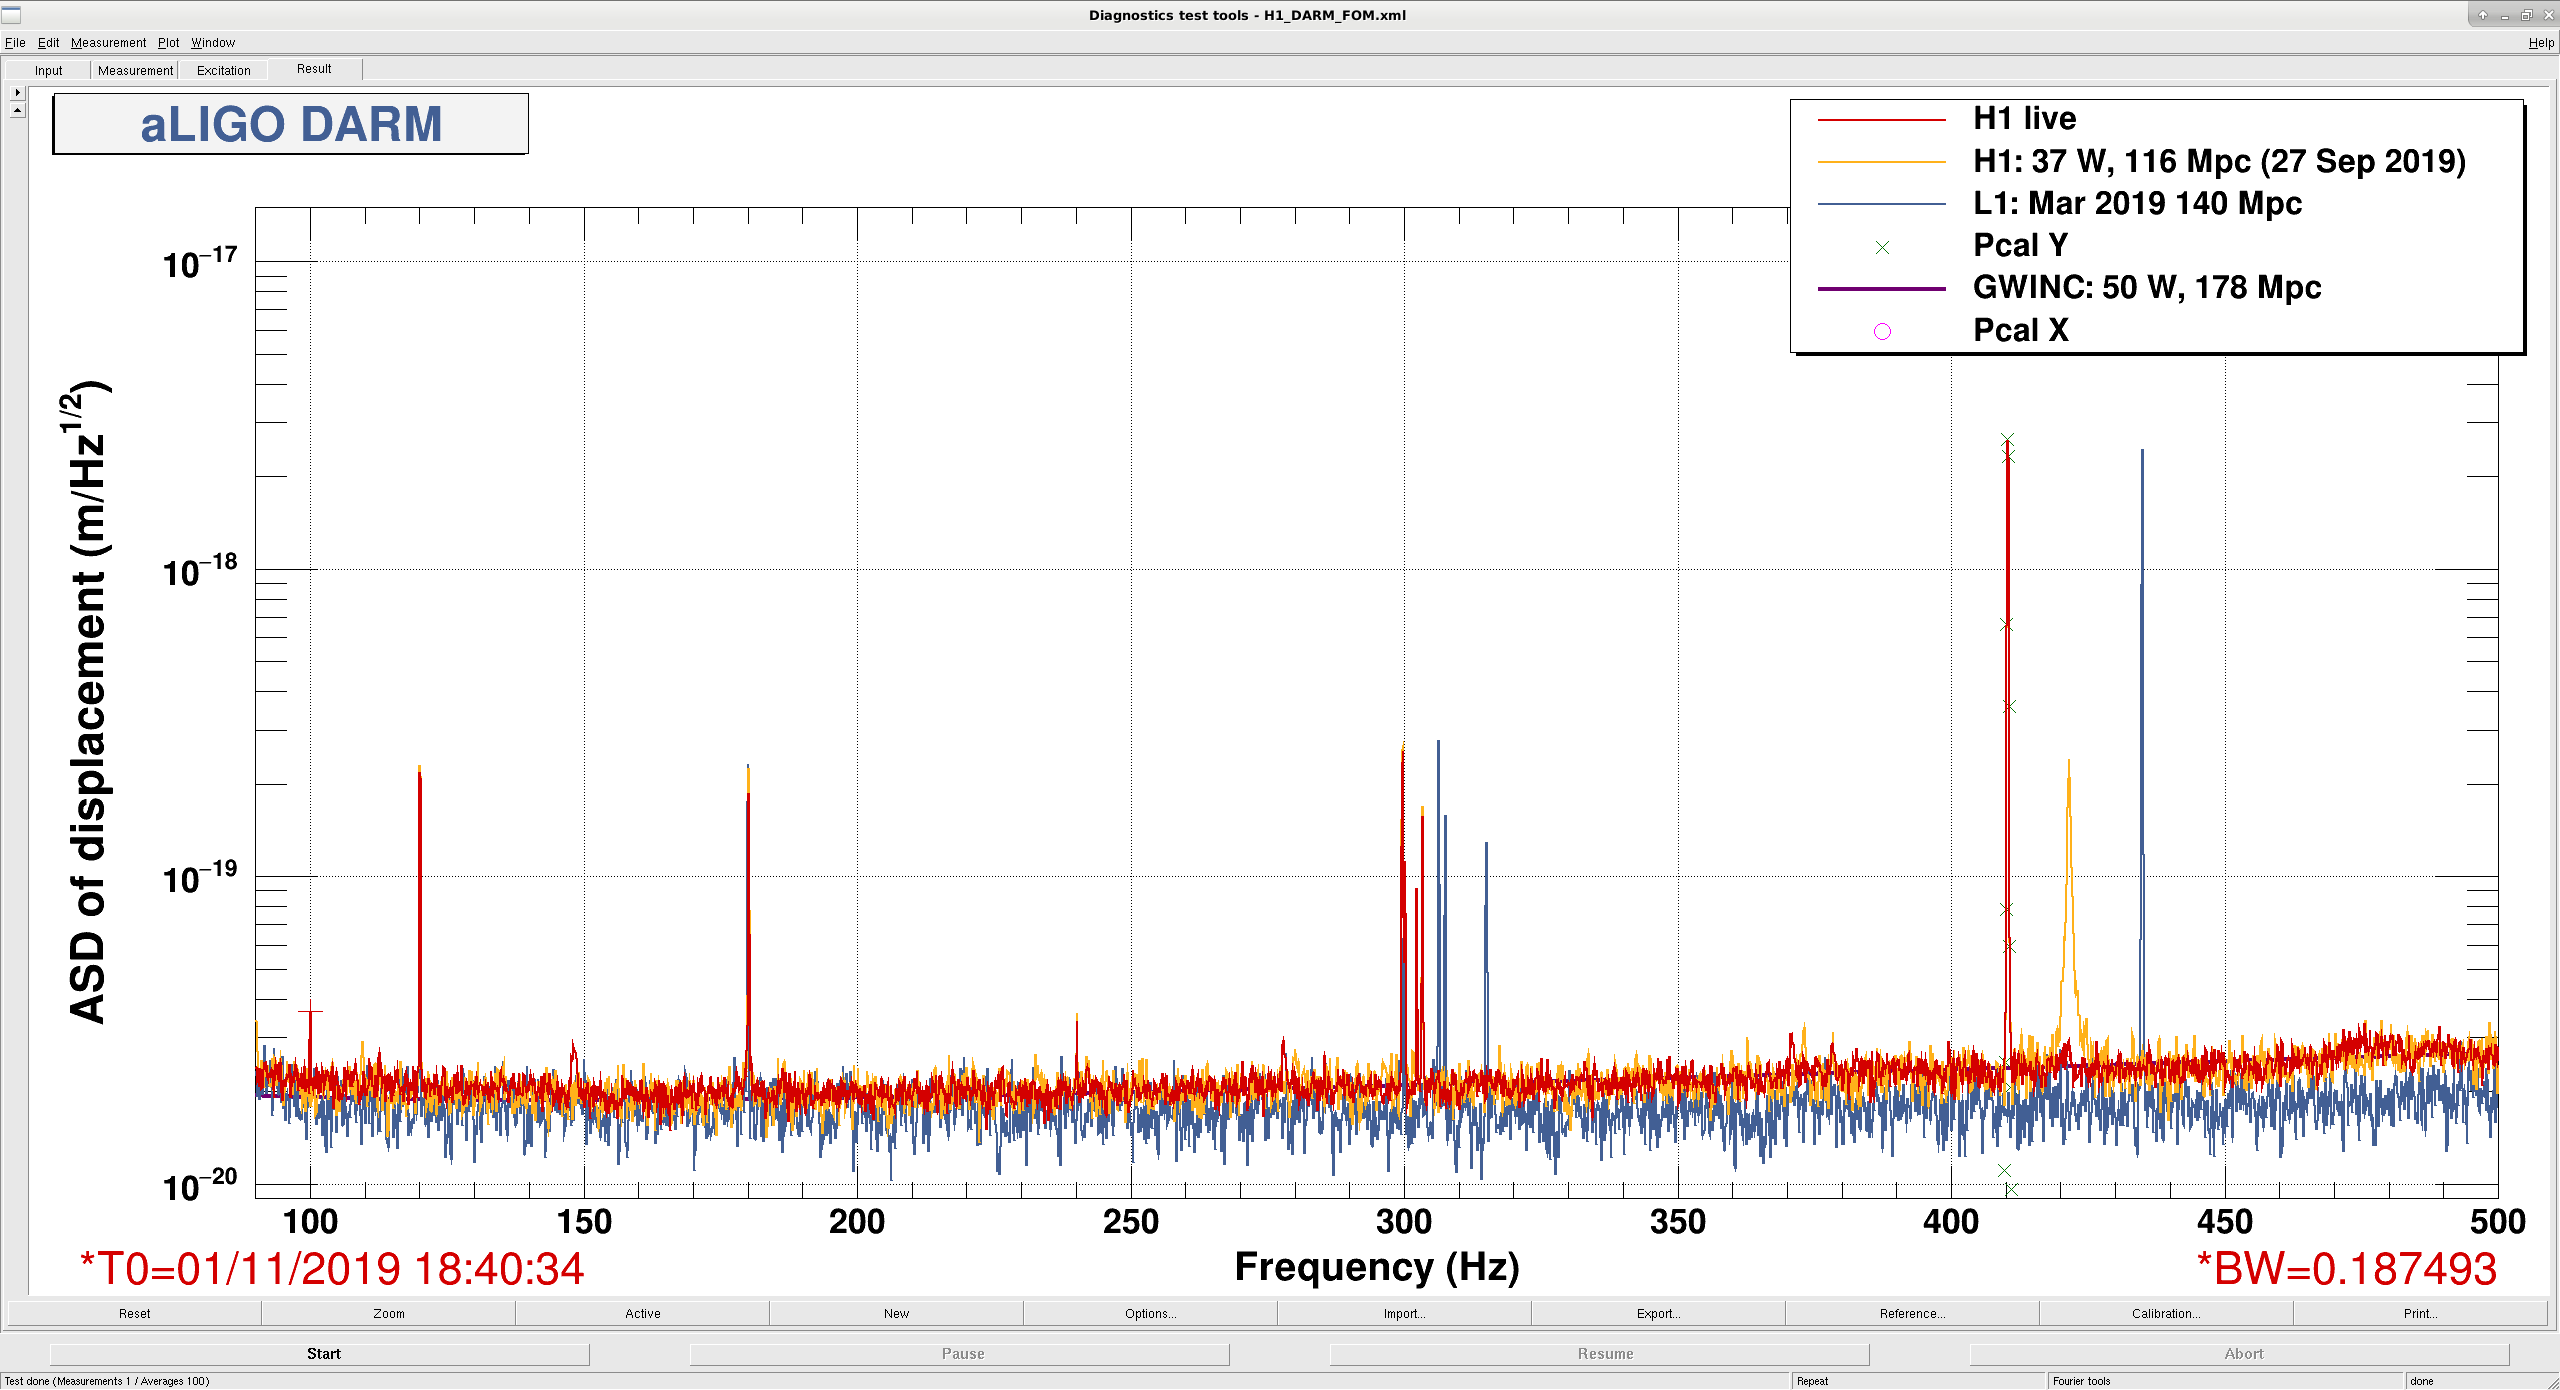
(2) There is a particular collection a features that have a low enough Q that they're likely mechanical at 421.45 and roughly harmonic frequencies of 843.79 Hz, and 1267.77 Hz. These are now gone from the ASD. No one has a good idea yet what these were (we didn't pay too much attention to improving the damping on any major item during the break).
(3) The only other features that are "gone" are at 89.875 and 373.125. Similarly no known (ok, "immediately remembered" even with Robert in the room) physical mechanisms for these.
(4) There are *new* features that were not there before at 35.75, 100.0, 148.125, and 370.875 Hz. One might argue that 373.125 Hz has *moved* to 370.875 Hz.
Attached is a comparison between DELTAL_EXTERNAL amplitude spectral density just before the break (Sep 27 2019 @ 20:55 UTC) against now (Nov 01 2019 18:40:34 UTC) broken up into various frequency zooms such that you can better read the changes in features.
Note: We've made no changes to the calibration of the instrument. The optical gain, relative to what it was for the 20190909 model is 0.98 (i.e. a bit lower), and the cavity pole is cruising around 412 Hz (i.e. also a bit lower than the 417 Hz that's in the reference model).
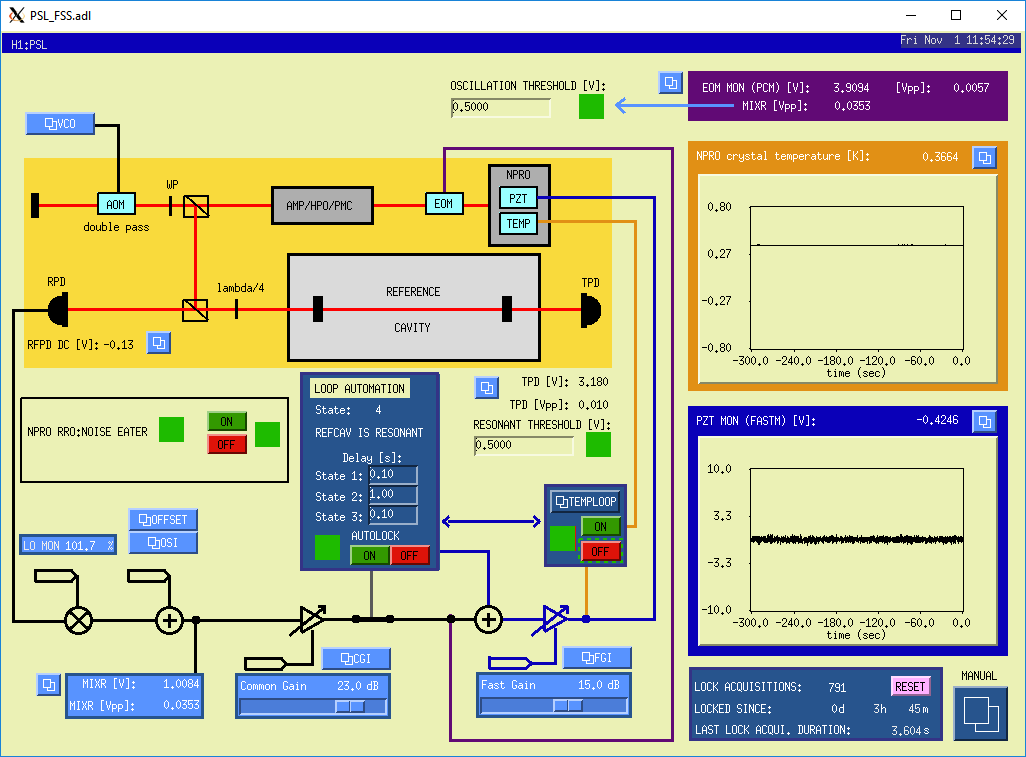
We're seeing another somewhat quick drop in the FSS RefCav TPD. Back on October 14th I adjusted the beam alignment into the FSS RefCav and got a TPD of 5.4V. Between the 14th and this last Tuesday, the 29th, the RefCav TPD dropped from that 5.4V to 4.2V. I attempted to use the picomotor-controlled mounts to return to the 5.4V level, but was only able to get back to 4.8V (subsequently, I think being unable to get back to the previous TPD volatge is an indication that not only are we about to see a quick drop in the RefCav TPD, but that drop is likely to require a PSL enclosure incursion to fix). In the ~72 hours since I performed that last beam alignment tweak the RefCav TPD has dropped from 4.8V to ~3.2V, a drop of 33% in just 3 days. The attached picture shows the FSS screen as it is right now; as can be seen, the FSS common gain has been increased by 3dB to account for this loss of optical gain. At the next available opportunity (earthquake, upcoming Tuesday maintenance window), I will attempt to use the FSS picomotor-controlled mounts to tweak the beam alignment into the RefCav. If I am unable to get the TPD back to its previous levels, then we will have to plan an enclosure incursion to fix (as was done back in May).
My current best guess for the underlying cause is temperature changes in the PSL causing mounts to move slightly. We are currently coming out of a mid-autumn cold snap, and temps in the PSL enclosure are slightly lower than they have been the last several months; when we encountered this issue back in May the weather was warming up for the impending summer. At this point this is a rather serious WAG on my part, so I'll look back through trends to see if there's any actual evidence for this.
Associated with FRS 13790.
Sheila, Timesh, Robert
There have been several alogs about this and there will be others, but I wanted to try make the situation more clear to detchar.
When the new instrument air compressor turns on, for about 5 minutes approximately every 25 minutes, we see a 35Hz line in DARM, which goes away when it is turned off. Around the time the compressor swtiches off, there are terrible scattering shelves in DARM. The onset of scattering in DARM seems to happen around the time of the compressor switching off (as seen by PEM seismometers), sometimes it is 16 seconds after, sometimes 24 seconds, sometimes before the ground motion drops off by up to a minute.
The first attached screenshot shows the regular switching of the compressor, and the board band large noise in DARM when the compressor goes off. The second screenshot shows darm spectra in 3 states: compressor off, compressor on (there is a 35Hz peak added to DARM) and compressor switching off, shelf. The PRCL/SRCL/MICH spectra also show fringe wrapping when the compressor is swtiched off.
These are probably interesting times for people who are interesting in looking for scattered light. Bubba and Tyler have ordered some parts to better isolate the new equipment, so this should be mitigated within a few days.
Bubba and Tyler have put this on isolation springs a few minutes before Nov 01 2019 20:41:42 UTC. The compressor was running on the springs for a few minutes before that and switched off at at 1256676120
There was no fringe wrapping in DARM around the time that it switched off.
Now associated with FRS Ticket 13809.
After a month of upgrades and comsissioning, and a sprint to return H1 to locking in NLN, H1 is locked and in Observe at 116Mpc!
Most notable LVEA items:
More common LVEA items:
Richard swept the end station VEAs. Most notable features were:
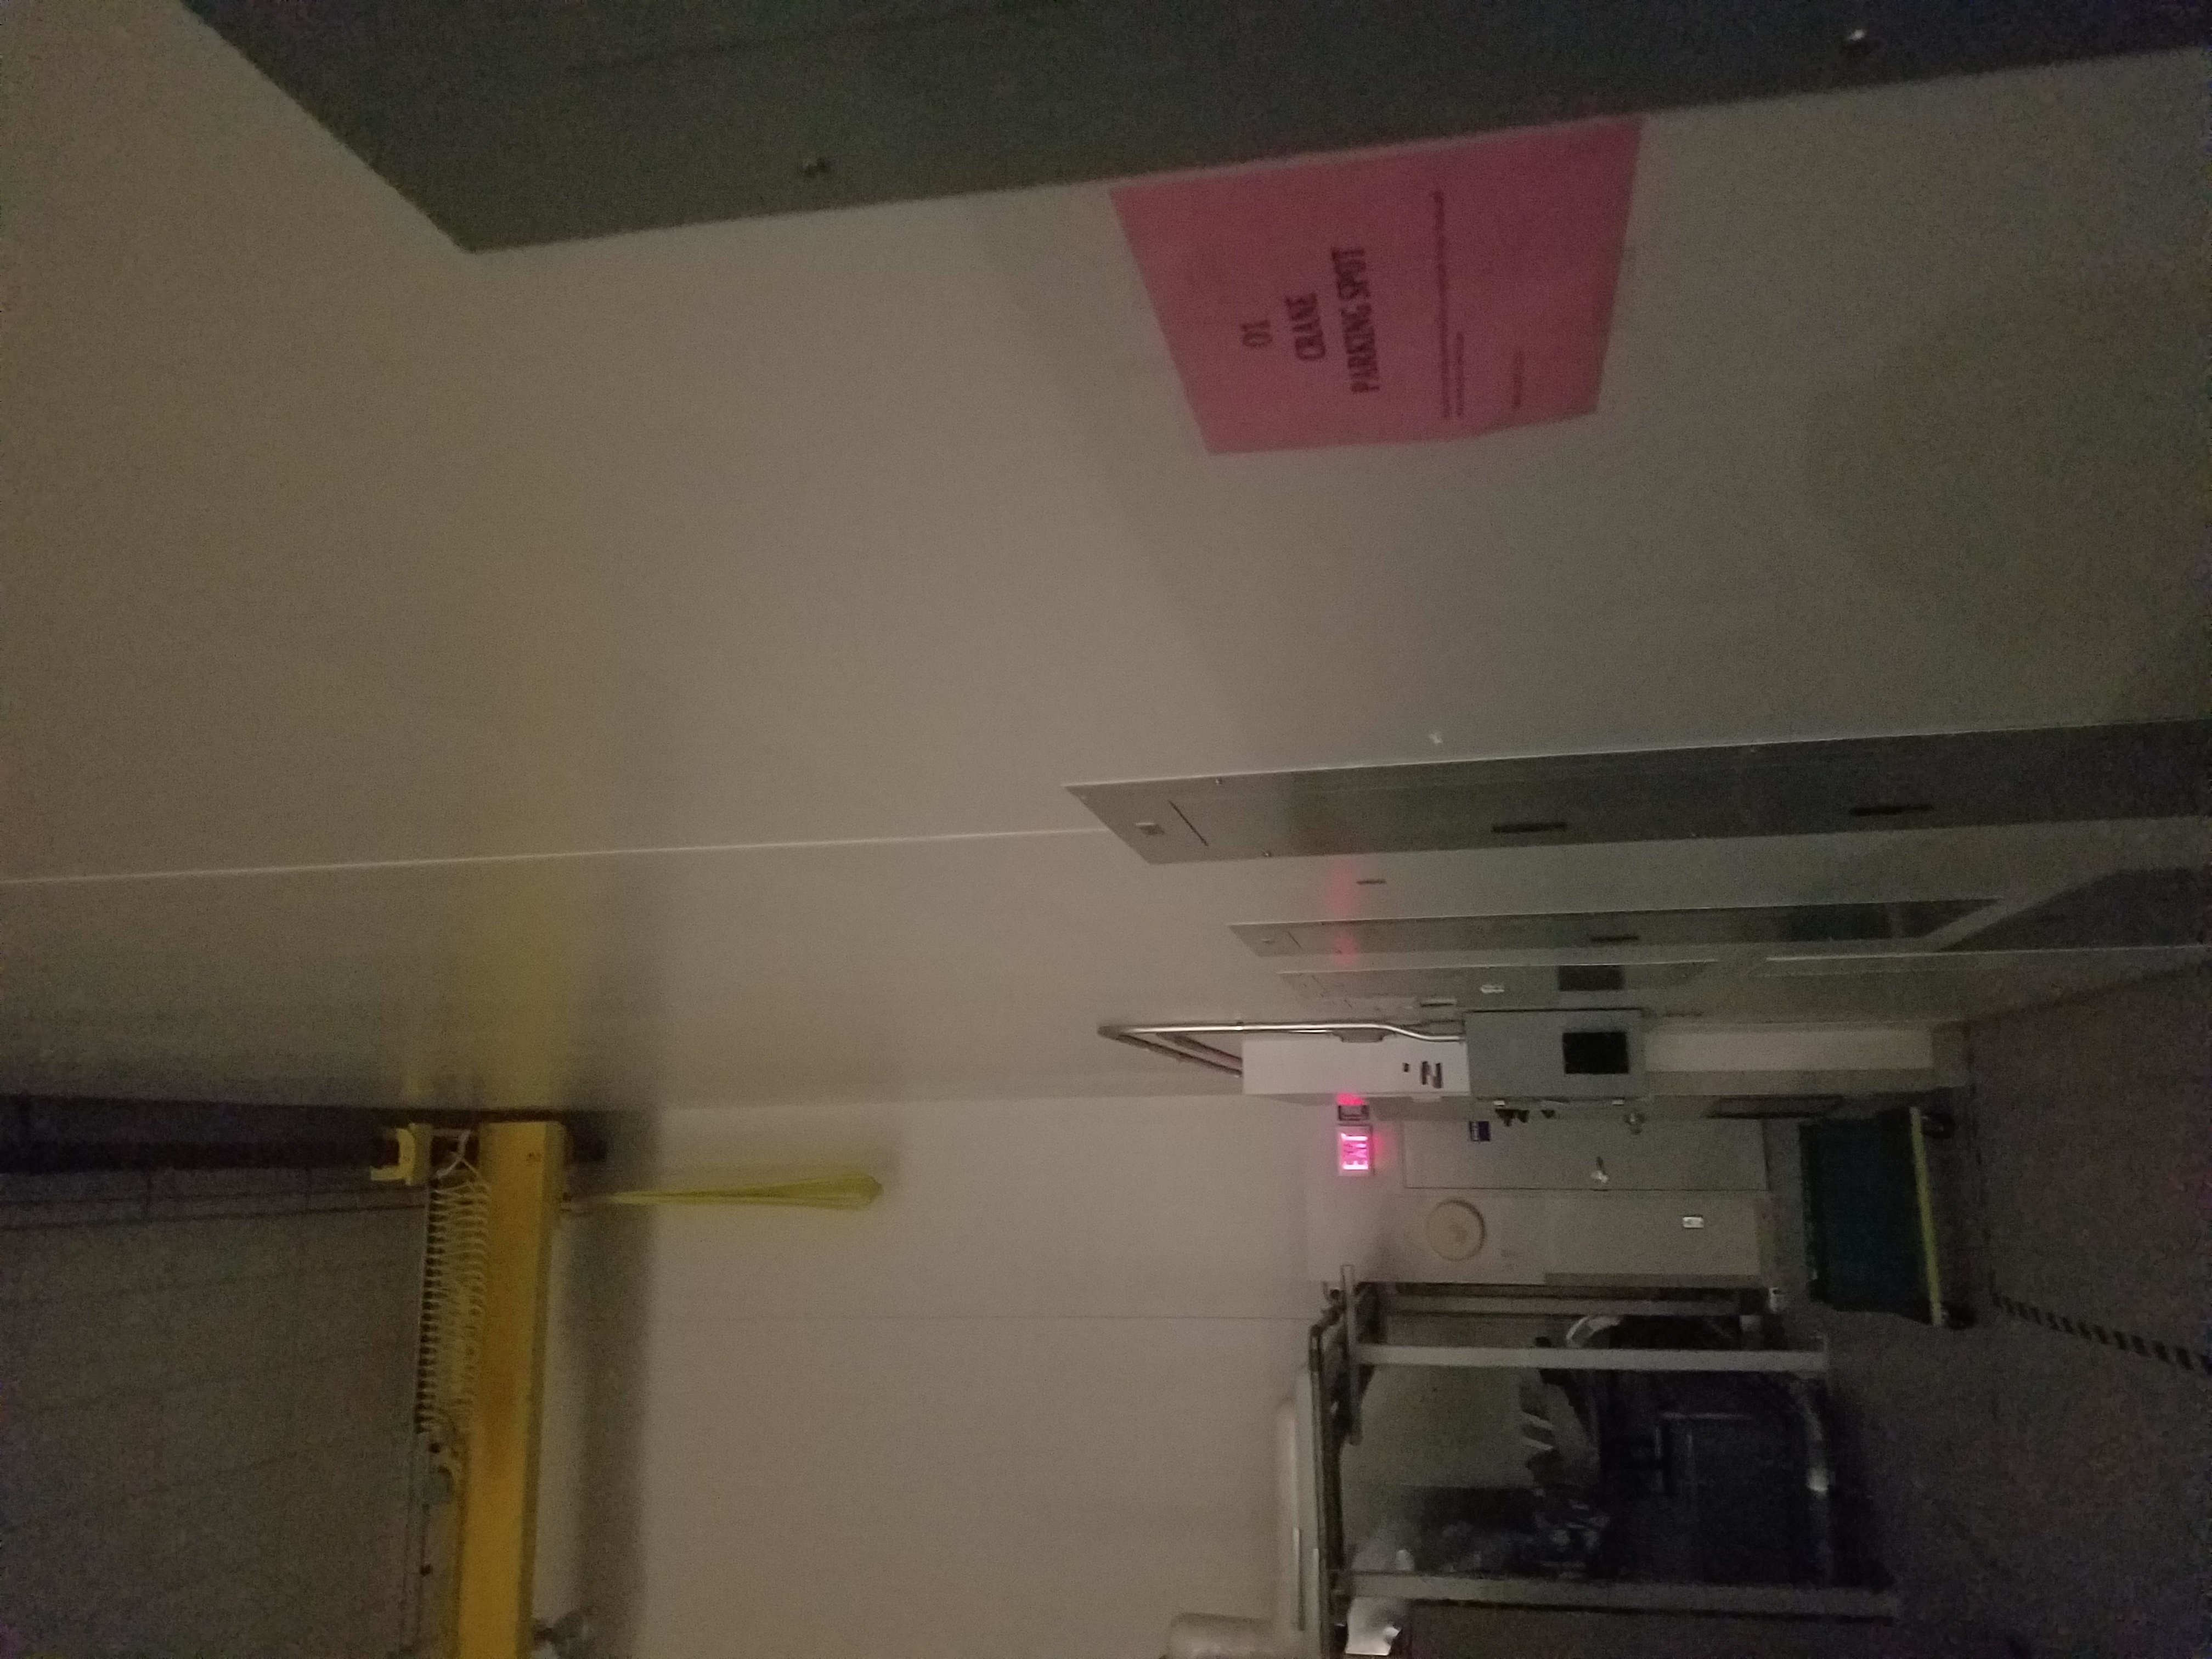
I recall that the North crane had been in its nominal, marked, "parking" location during O3a, i.e., it isn't, now, where it had been prior to the October break.
We got to TRANSITION_FROM_ETMX (where DARM control is temporarily handed off from ETMX L1 L2 L3 to ETMY L1 L2 + ITMX L3) and found that the guardian would not complete the transition as the ITMX ESD high voltage was off (nice catch in the guardian!)
Dan went to the mezzanine and pressed the red button on the box above the HV supply to untrip the high voltage.
It seems like it's been tripped since 00:14 UTC October 31.
Kyle, Fil, Sheila, Rahul
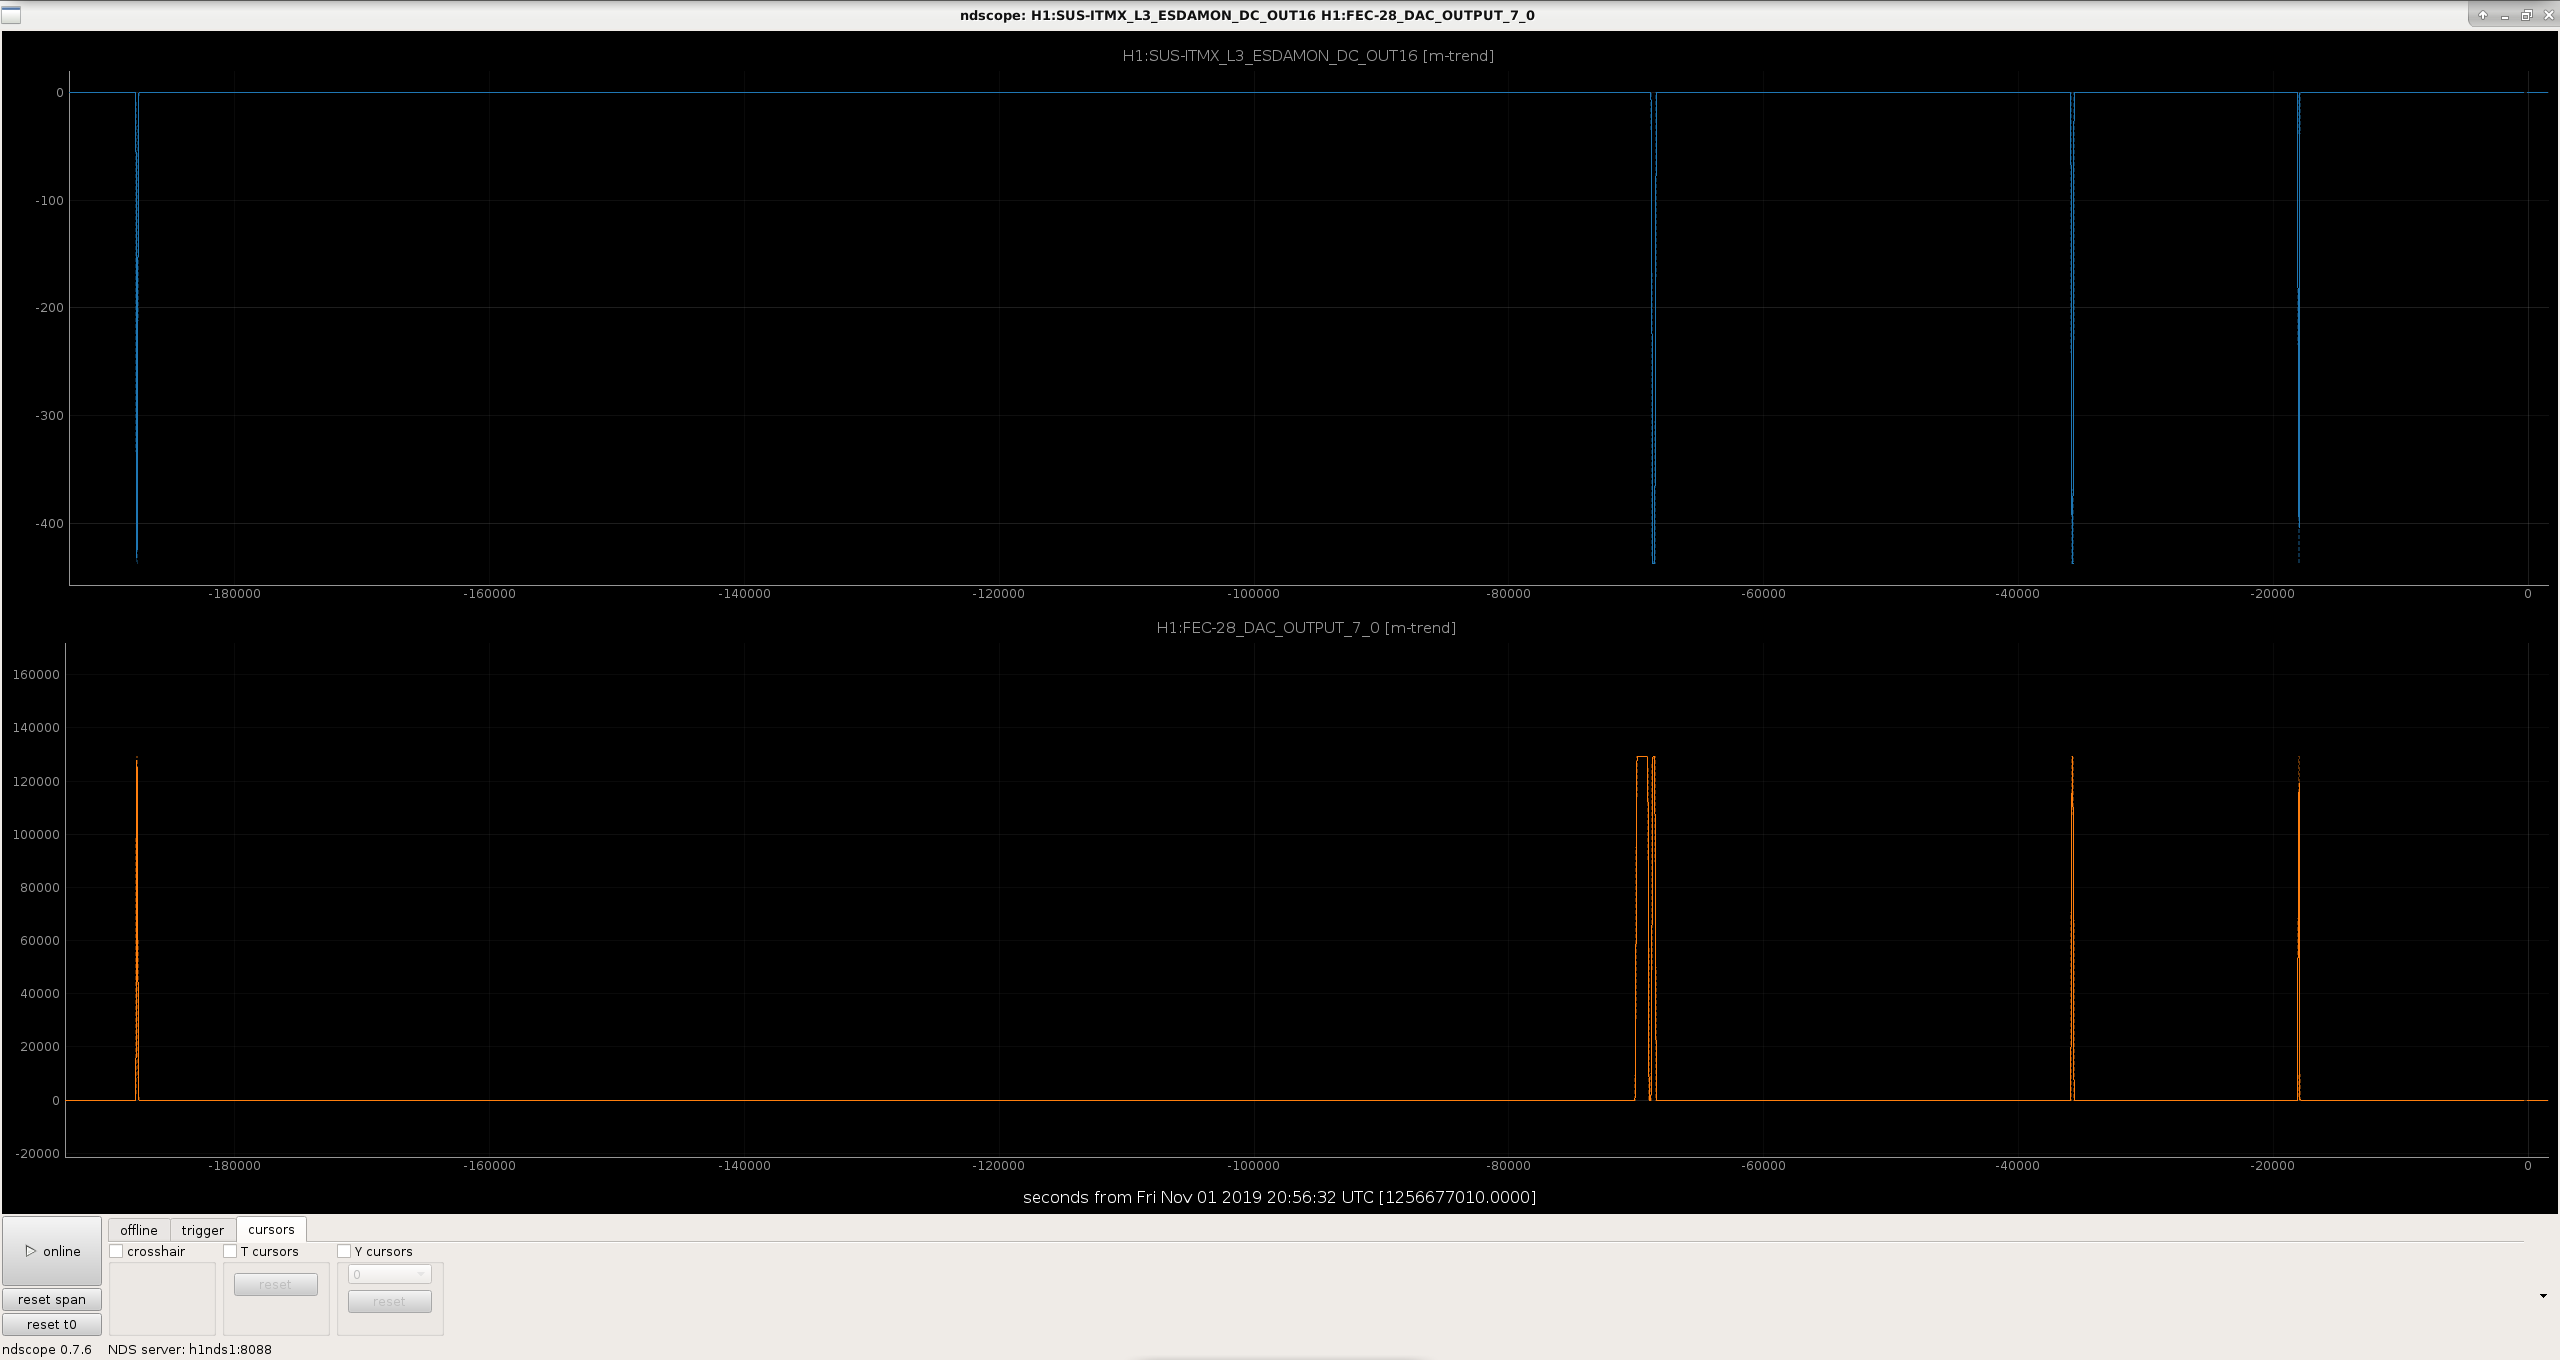
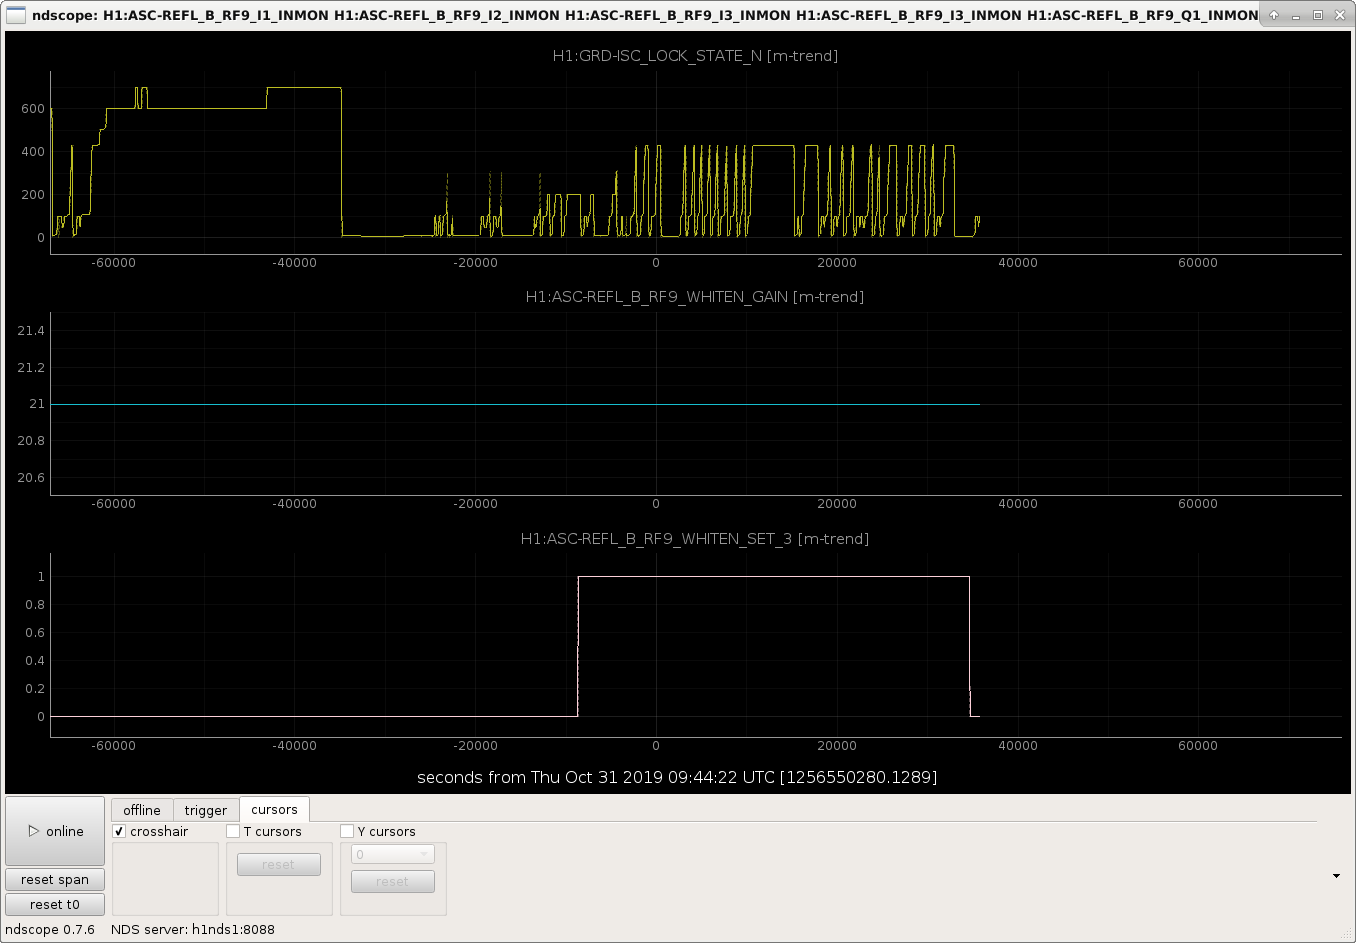
To investigate further on this, I trended the following two channels to see Guardian request for HV at ITMX,
H1:SUS-ITMX_L3_ESDAMON_DC_OUT16 #shows the status if HV has been supplied
H1:FEC-28_DAC_OUTPUT_7_0 #where Guardian is requesting HV
Last evening Guardian requested for HV at 0.1.30 UTC, however HV was tripped (can been seen in the ndscope plot attached). On 30 Oct, this was working fine, which can be seen in the same plot.
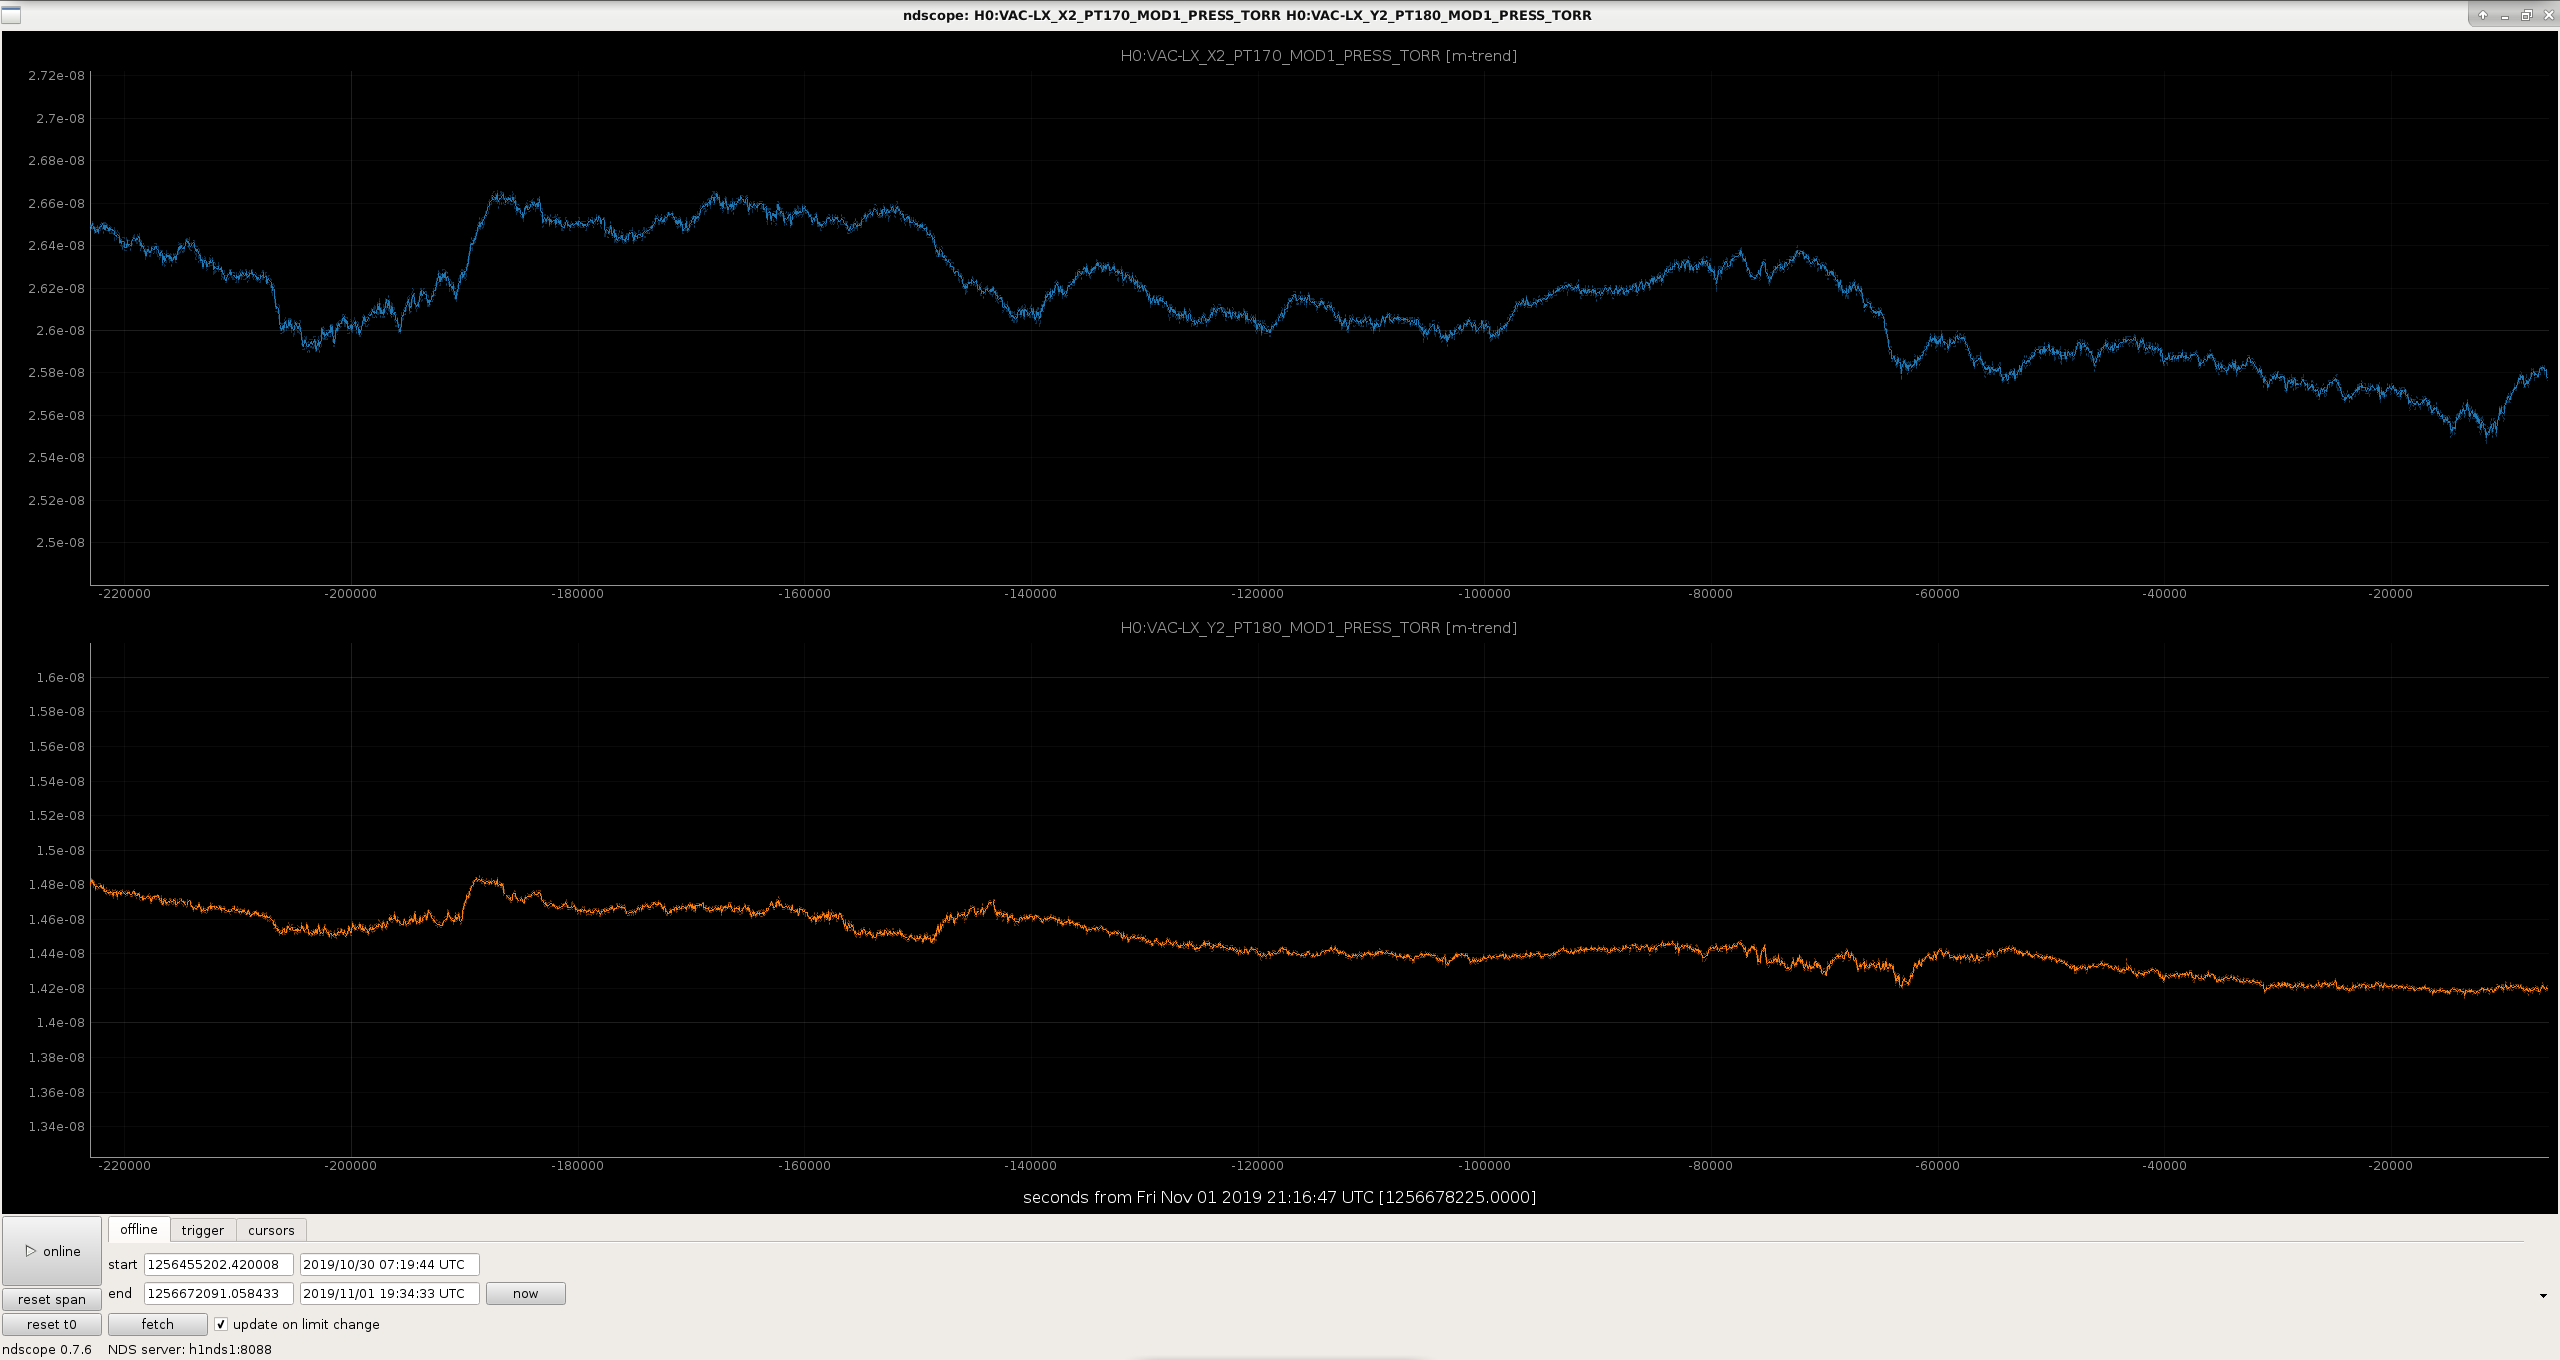
We trended (attached) the HAM (7 and 8) vacuum data (PT 170, PT 180) to look for any drop in pressure which could potentially trip the HV supply. The pressure was fine, however Kyle thinks that the glitches in the gauges could be possible. According to Fil, the safety relays (between vacuum gauges and HV supply) could be another possibility.
The nds1 server tracks connections via a series of (small) bitmaps. Today users in the control room needed more connections than the server could handle. The quick fix is to close down unneeded live streams to the nds1 server (ndscope, dataviewer, dtt, ...). I am evaluating what is needed to significantly boost these limits. It will require an update and rebuild of daqd for the nds1 servers1.
Sheila, Varun, Jenne
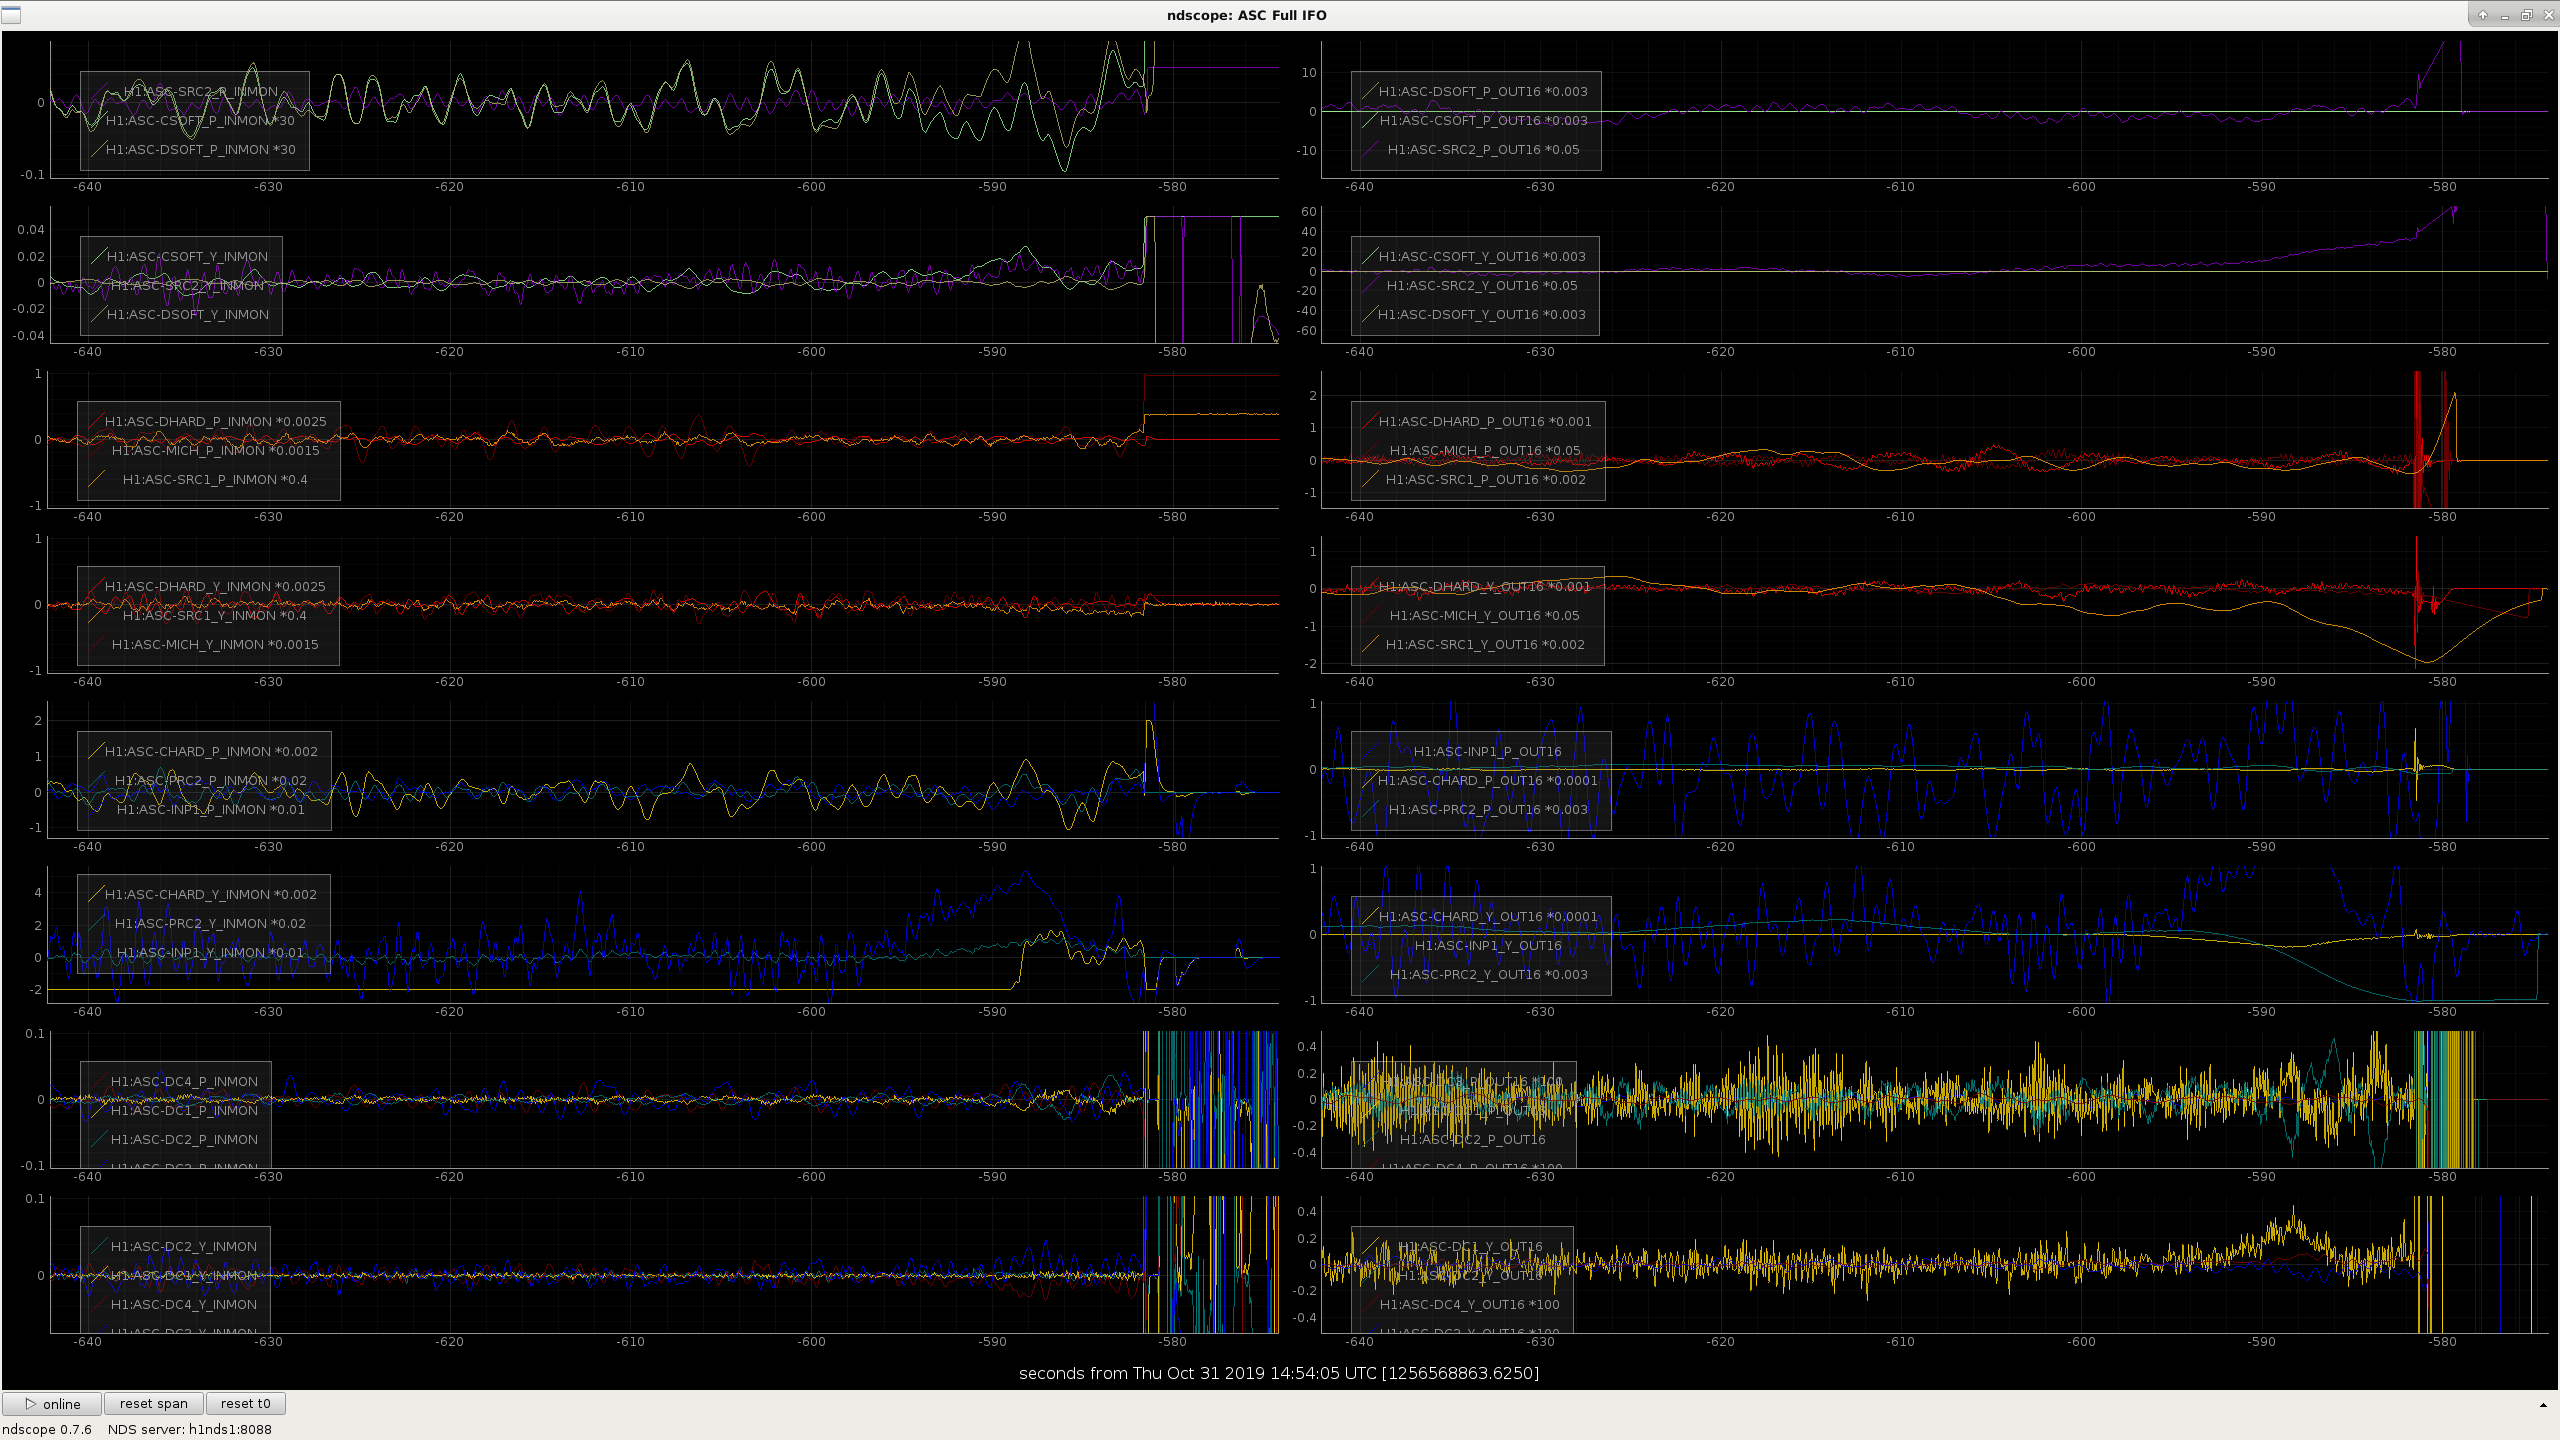
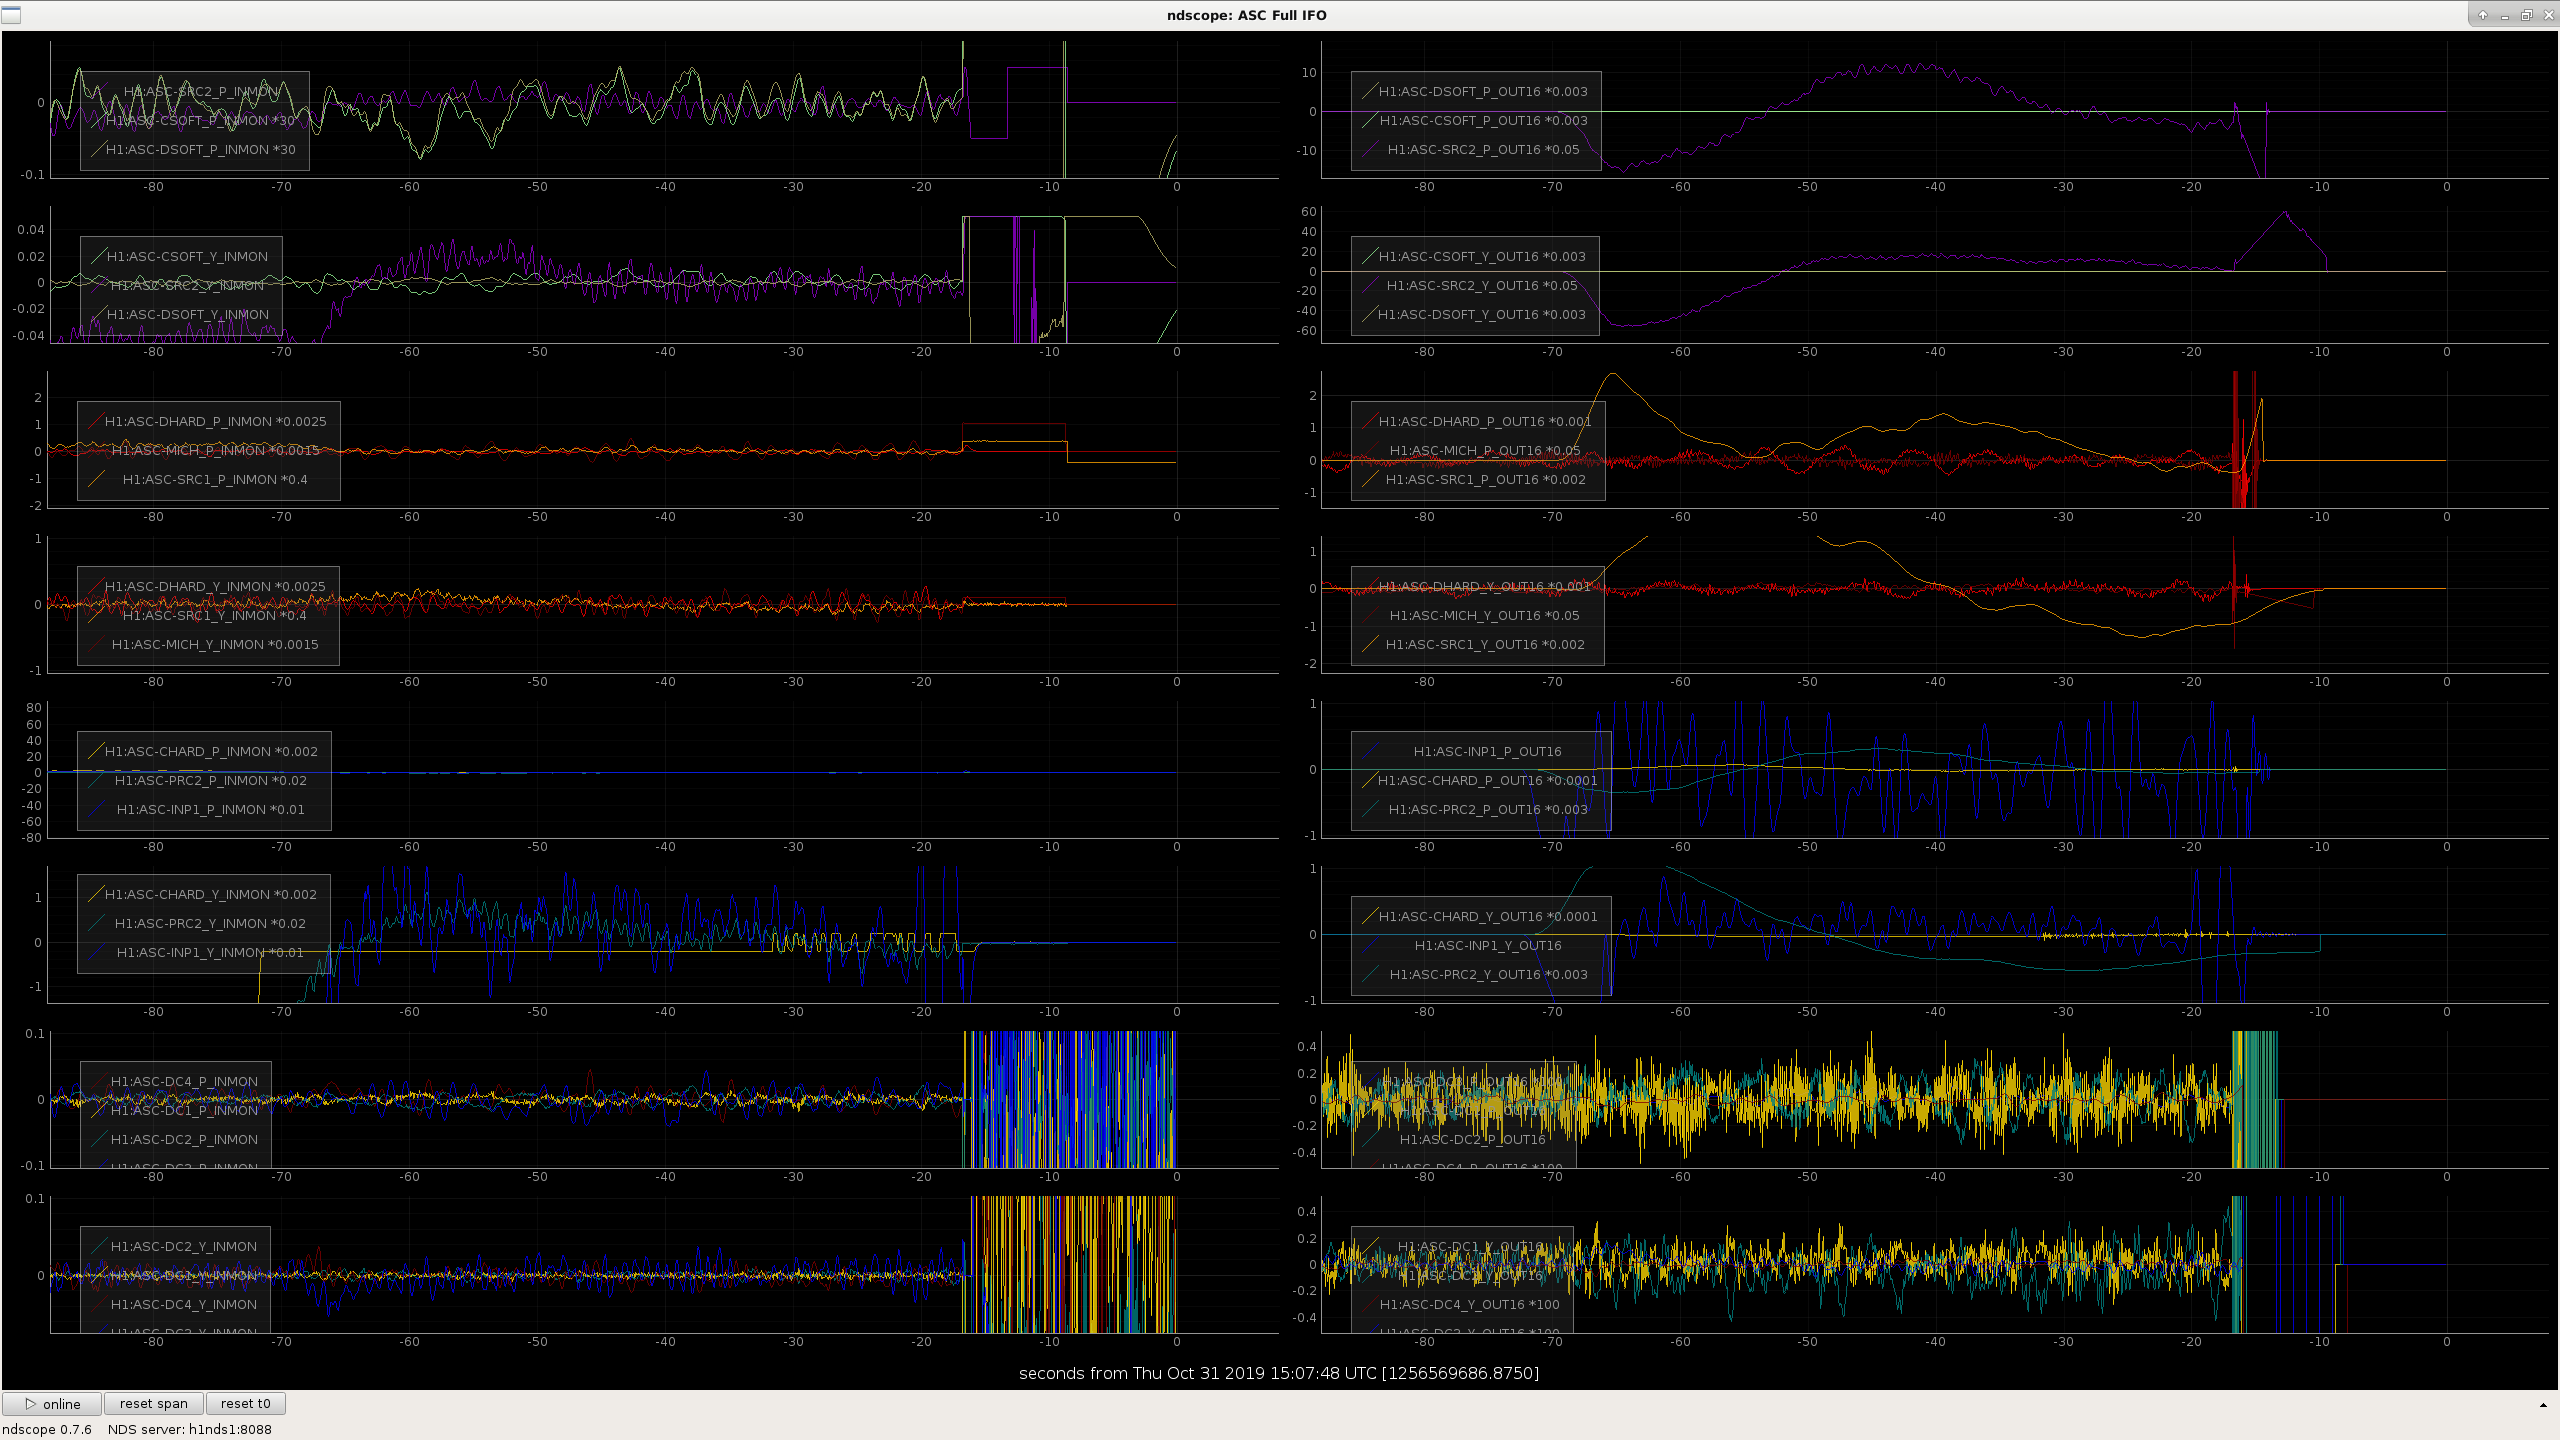
This morning I found that IFO had relocked and lost lock at engage ASC 10 times in a row (some of those where while people were here last night, several more after they left).
There is a proposed solution to the PUM watchdogs, as described in ECR E1600270 and IIET Ticket 6100. It had been put on hold in February 2019.
J. Kissel Recently, the PCAL team identified that we hadn't updated the model of the force-to-displacement transfer function on the PCAL systems for the new O3 test masses, and in parallel, further refined their estimate of the power-to-force coefficient due to more carefully addressing ADC gains and incorporating the results for many more measurements of the transfer coefficients between the gold standard NIST reference and regularly-in-use end-station references (e.g. the RX and TX PDs) -- see more details in LHO aLOG 52828. This has been updated and fixed today, so this will no longer be a problem for O3B. However, this means there's been a systematic error in the PCAL displacement estimate that we've been using as an absolute reference for the IFO calibration for O3A. In this aLOG, I interpret the level of difference between "now" and "earlier" as described in LHO aLOG 52828 in terms how how this impacts our model of the IFO response function, and thus the impact on our estimate of h(t) -- i.e. recasting the "now" vs. "earlier" as a systematic error that we report in our transfer function that we typically report as the "uncertainty budget," e.g. LHO aLOG 52727. In that LHO aLOG 52828, (and the subsequent comment LHO aLOG 52834), we see the definition of the "change in calibrated displacement," xi, as reported is [ NOW ] xi = [ -------- - 1 ] * 100 (1) [ EARLIER ] where NOW is after today when the coefficients were installed (updated to be closer to the correct truth), and EARLIER is prior to today, during all of O3A (which therefore had a level systematic error proportional to xi). We've dealt with systematic error in the PCAL systems in the past: back in the winter of O2 when the alignment of the PCAL beam decayed to the level some level of time-dependent optical clipping on the integrating sphere. LHO aLOG 34153 gives us the formalism to address such systematic error, so we should recast xi into that formalism, which called the systematic error eps (where, for reasons that will become clear later, I re-write the definition of eps in terms of dL_{PCAL} instead of x_pcal): eps is a real number that converts the "apparent" displacement, dL_pcal, (i.e. that which includes a known systematic error) into the real displacement, dL_pcal' (i.e. the "truth" that has no known systematic error): dL_pcal' = eps * dL_pcal (2) so, if "NOW" is the real, truth displacement estimate, dL_pcal', and EARLIER is the "apparent" displacement, dL_pcal, then NOW TRUTH dL_pcal' (1 + xi/100) = --------- = --------- = -------- = eps. (3) EARLIER APPARENT dL_pcal And thus, skipping a few of the steps shown in LHO aLOG 34153 for brevity, the "true" response function, R_pcal', (determined by the NOW, true displacement estimate by PCAL system) is related to the apparent, previously report response function, R_pcal, (determined by the the EARLIER PCAL system which had systematic error) is R_pcal' = eps * R_pcal = (1 + xi/100) * R_pcal (4) So how does this relate to the various metrics we have for calibration? - How will this systematic error be included in uncertainty budgets? - What does it mean for error in the amplitude of previously reported h(t)? - What does that mean for the BNS range? To do this, we have to invoke the nomenclature in T1900169 (which is why I switched from x_pcal to dL_pcal above): Equation 23 of T19000169 states that the uncertainty budget (e.g. LHO aLOG 52727) R_sample ~ R_pcal dL_pcal --------- = ----------- = ----------- (5) R_MAP R_pyDARM h_GDS * L where R_MAP == R_pyDARM is a single response function calculated from the reference model parameters, and R_sample is the posterior distribution of numerically evaluated response functions based on sampling the previously determined uncertainty (and systematic error) on the model parameters, which should bee equivalent to the response function as measured directly by the PCAL, i.e. R_pcal. Via the math shown in Eq. (1) of T1900169, it can be shown that any ratio of response functions is equivalent to the ratio of displacement, and thus the last equivalence in Eq. (5) here. But Eq. (5) is generic, and now we need to fold in the systematic error in PCAL; eps, or xi. For O3A, the denominators R_MAP, R_pyDARM, and h_GDS*L are now fixed. So, in order to reflect an error in dL_pcal, or R_pcal in to the ratio that we display for the uncertainty, R_sample / R_MAP, then we should *multiply* that ratio by eps = (1 + 100*xi): dL_pcal ' R_pcal ' eps * R_pcal R_sample R_sample --------- = -------- = ------------ = eps * -------- = (1 + xi/100) * --------- (6) h_GDS * L R_pyDARM R_pyDARM R_MAP R_MAP which means that the reported h(t), h_GDS, is different from the truth, dL_pcal', by the following uncertainty and systematic error. dL_pcal' = eps * (R_sample/R_MAP) * h_GDS * L = (1 + xi/100) * (R_sample/R_MAP) * h_GDS * L (7) or, if we had known these systematic errors and uncertainties ahead of time, we might say that the "real" "truth" strain amplitude, h_GDS', can be computed from the reported strain stored in the frames, h_GDS, h_GDS' = eps * (R_sample/R_MAP) * h_GDS = (1 + xi/100) * (R_sample/R_MAP) * h_GDS (8) And, assuming no signal, the amplitude spectral density of h_GDS, the sensitivity of the detector, call it ASD_GDS, can be used to define that the "truth" BNS range, r', is related to the "apparent" or "reported" BNS range, r, by the following: { f_max r' = C * | [ ASD_GDS' ]^{-1} * f^{-7/6} df } f_min { f_max = C * | [ eps * (R_sample / R_MAP) * ASD_GDS ]^{-1} * f^{-7/6} df } f_min 1 { f_max = ---- * C * | [ (R_sample / R_MAP) * ASD_GDS ]^-1 * f^(-7/6) df eps } f_min 1 1 r' = ---- * r = ------------ * r (9) eps (1 + xi/100) where, for brevity, the integrated (R_sample / R_MAP) has been dropped on the last line, because in the case where we're only considering a scalar systematic error, the integrand of (R_sample / R_MAP) * ASD_GDS is the same for both r' and r. This would not be true for a frequency dependent systematic error (either in PCAL or in any other component of R_sample/R_MAP). So, depending on whether eps is greater or less than 1, or if xi is positive or negative, then - the uncertainty budget will have a corresponding multiplicative "offset" from unity magnitude, i.e. the "uncertainty budget" plot of R_sample / R_MAP should show a magnitude wiggling around (1 + eps), - the reported strain amplitude has been wrong by a multiplicative factor of eps, - the reported sensitivity, i.e. the ASD of the reported strain has been wrong by a multiplicative factor of eps, and - the reported range has been wrong by by a multiplicative factor of (1 / eps), So: - if eps > 1, or xi > 0, then - if we don't correct the data, then the median line in the uncertainty budget goes up in magnitude, or, - if we were to correct the live data stream (which we will not for O3A), the strain (and noise) amplitude gets larger, the ASD gets worse (less sensitive), and the range goes down. - if eps < 1, or xi < 0, then - if we don't correct the data, then the median line in the uncertainty budget goes down in magnitude, or, - if we were to correct the live data stream (which we will not for O3A), the strain (and noise) amplitude gets smaller, the ASD gets better (more sensitive), and the range goes up.
According to Rick, Dripta, and Jeff, the numbers to be applied to O3a are:
The RRNom changes are as below. (Note: valid GPS time for this correction is set to be chunk 2+3)
Index: RRNom.py
===================================================================
--- RRNom.py (revision 8656)
+++ RRNom.py (working copy)
@@ -172,11 +172,23 @@
# FIXME: Check clipping in O1/O2 (e.g., alog LHO 36884)
# clipCorrection = hfile['Clipping/ClipFactor'].value
# We believe in O3 there's no clipping, so set the correction to 1.
-clipCorrection = 1.0
+# O3a: Jun 11 2019 16:57:18 UTC -- Oct 01 2019 16:23:10 UTC, add Pcal sys error
+# It should apply to all O3a, but we do not correct for the released chunk1 before Jun 11
+if run == 'O3' and args.gpsTime >= 1244307456 and args.gpsTime <= 1253982208:
+ if args.IFO == 'LHO':
+ clipCorrection = 1.0042
+ else:
+ clipCorrection = 1.0031
+else:
+ clipCorrection = 1.0
# TODO: update the value when more measurements are taken
# In O3, the optimistic lower limit is 0.5% (G1900395 Page 14)
-PCALSystUnc = 0.0079
+# It should apply to all O3, but we do not correct for the released chunk1 before Jun 11
+if run == 'O3' and args.gpsTime >= 1244307456:
+ PCALSystUnc = 0.0054
+else:
+ PCALSystUnc = 0.0079
# -------------------------------------------------------
# Create the nominal model using model file
@@ -670,7 +682,7 @@
thisRR = responseFunc(thisSenseTheta, thisActUIMTheta, thisActPUMTheta, thisActTSTTheta, \
thisCCSyst, thisAUSyst, thisAPSyst, thisATSyst, ff, True, \
thisKU, thisKP, thisKT, thisKC, thisFC, thisSenseTheta[2], thisSenseTheta[3], \
- 'all', thisPcalSystErr, clipCorrection)
+ 'all', thisPcalSystErr, 1.0)
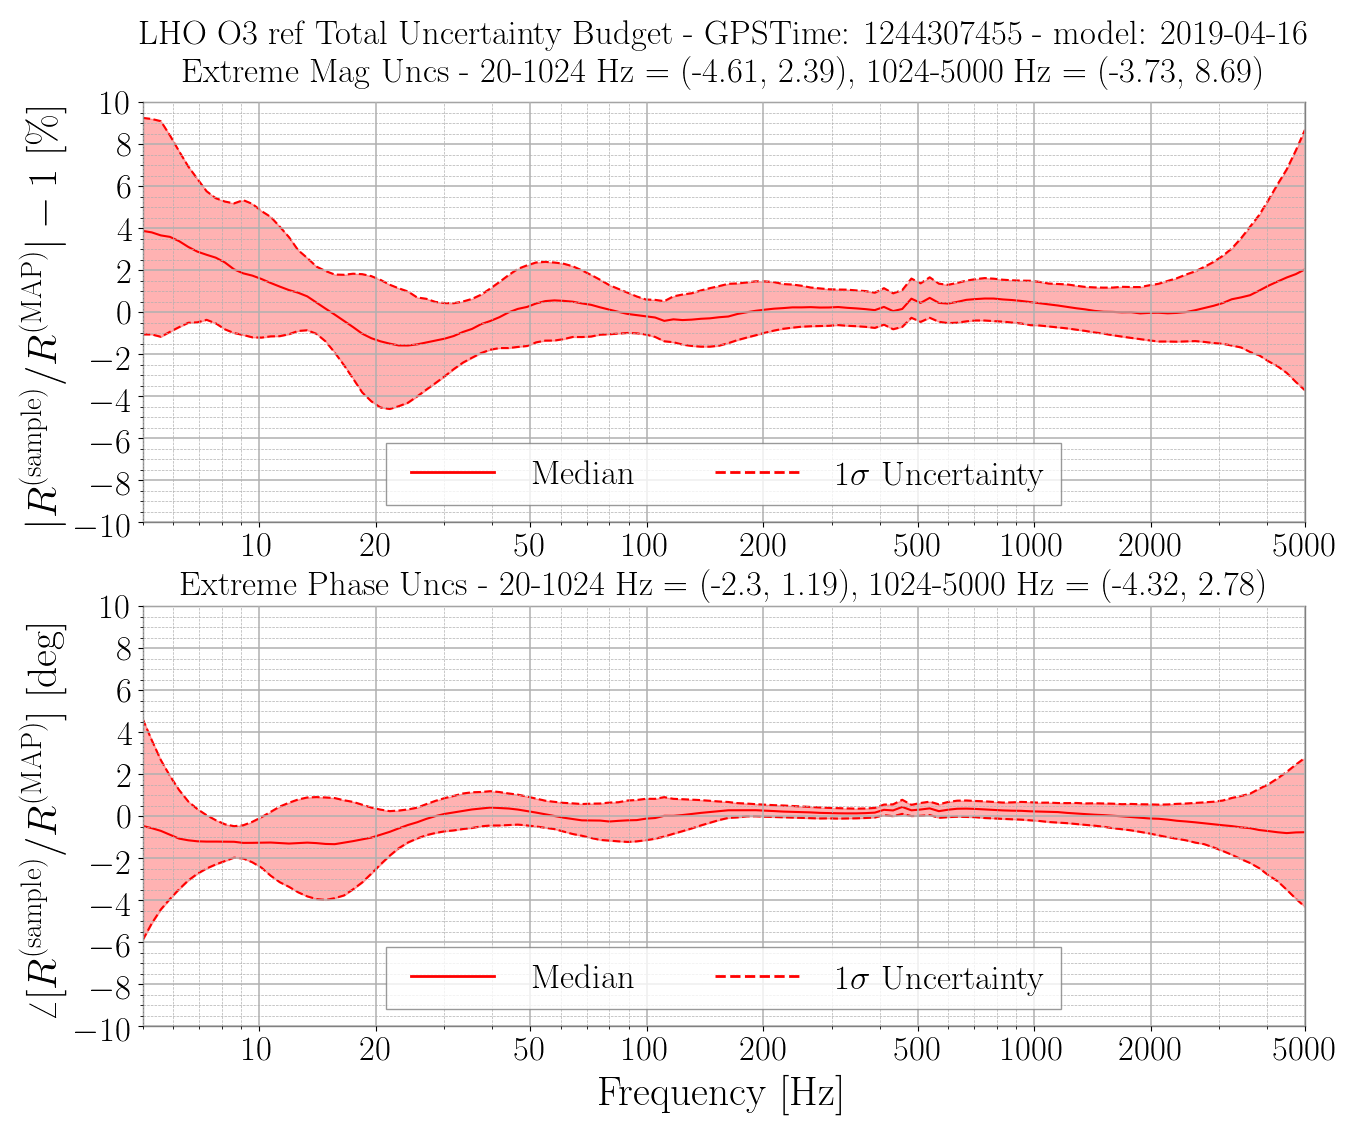
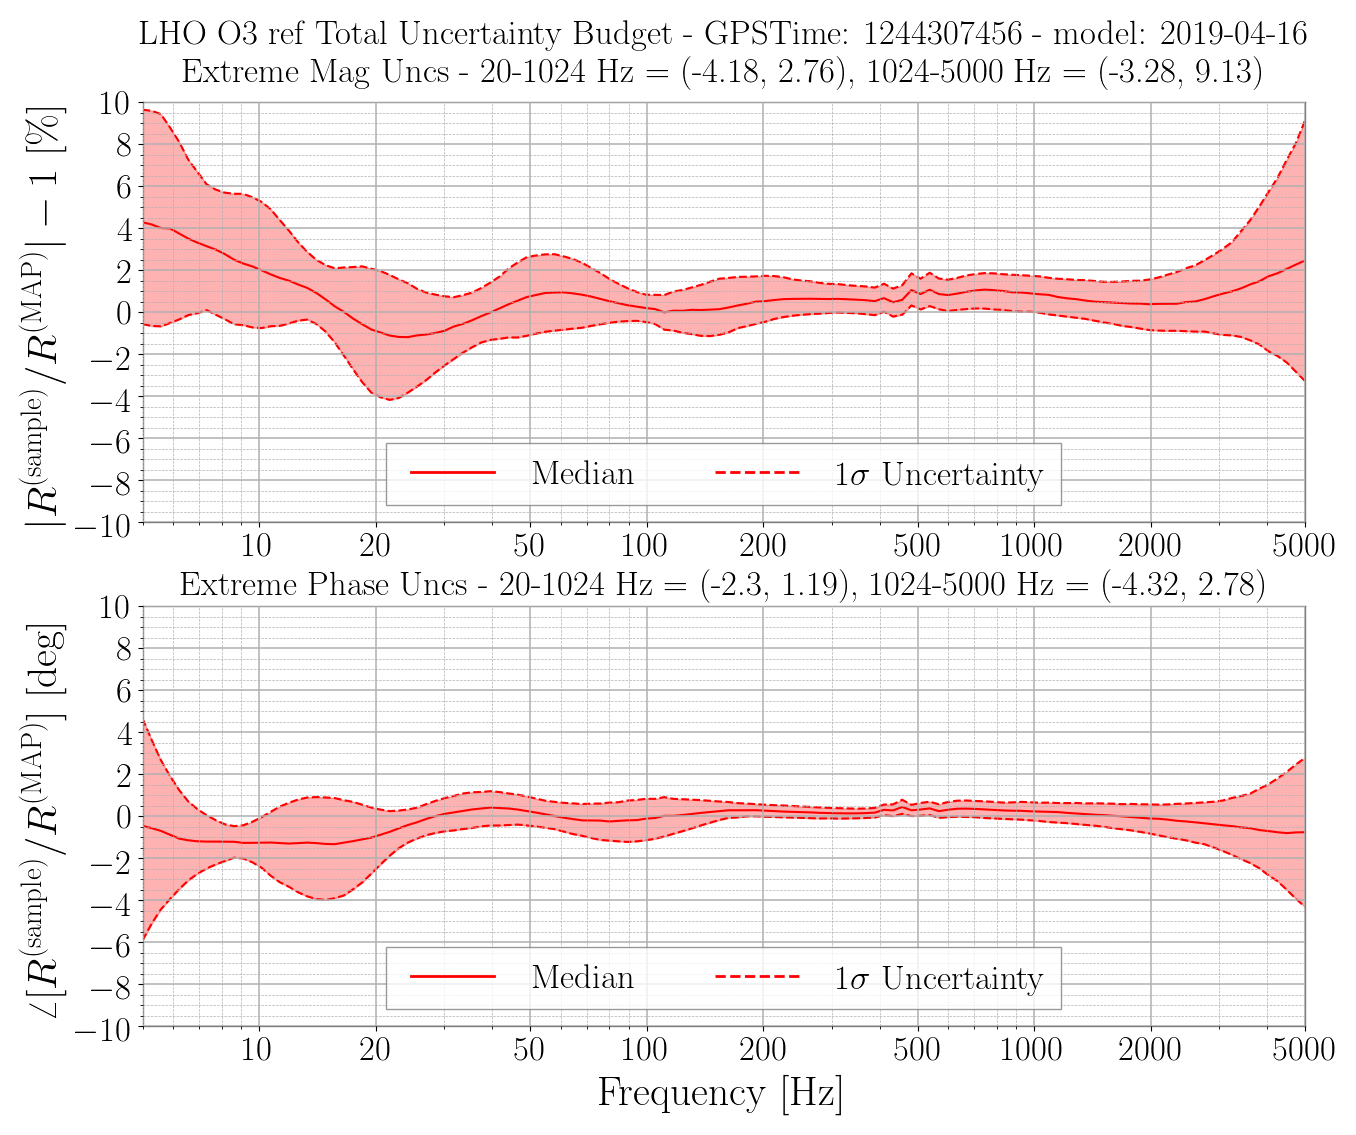
The two attached plots shows the comparison before (old.png) and after (new.png) the PCAL corrections. The commands for generating these plots are:
OLD:
python /home/ling.sun/aligocalibration/trunk/Common/pyDARM/RRNom.py --IFO=LHO --HDF5_A_MCMCresults=/home/ling.sun/aligocalibration/trunk/Runs/O3/H1/Results/Uncertainty/O3_H1_A_MCMC_20190404.hdf5 --HDF5_A_GPRresults=/home/ling.sun/aligocalibration/trunk/Runs/O3/H1/Results/Uncertainty/O3_H1_A_GPR_20190416_meas0327-0925.hdf5 --HDF5_C_MCMCresults=/home/ling.sun/aligocalibration/trunk/Runs/O3/H1/Results/Uncertainty/O3_H1_C_MCMC_20190404.hdf5 --HDF5_C_GPRresults=/home/ling.sun/aligocalibration/trunk/Runs/O3/H1/Results/Uncertainty/O3_H1_C_GPR_20190416_meas0328-0828_withHFafter0611_nofsQcorr_fmin30Hz_lengthscaleZp5.hdf5 --modelPath=/home/ling.sun/aligocalibration/trunk/Runs/O3/H1/params/ --modelFilename=modelparams_H1_20190416 --IFOmodel=modelPars --sampleNumber=1000 --seed=1111 --version=ref --outDir=/home/ling.sun/tmpUnc/ --plot1SigmaUncs --saveSummaries --gpsTime=1244307455
NEW:
python /home/ling.sun/aligocalibration/trunk/Common/pyDARM/RRNom.py --IFO=LHO --HDF5_A_MCMCresults=/home/ling.sun/aligocalibration/trunk/Runs/O3/H1/Results/Uncertainty/O3_H1_A_MCMC_20190404.hdf5 --HDF5_A_GPRresults=/home/ling.sun/aligocalibration/trunk/Runs/O3/H1/Results/Uncertainty/O3_H1_A_GPR_20190416_meas0327-0925.hdf5 --HDF5_C_MCMCresults=/home/ling.sun/aligocalibration/trunk/Runs/O3/H1/Results/Uncertainty/O3_H1_C_MCMC_20190404.hdf5 --HDF5_C_GPRresults=/home/ling.sun/aligocalibration/trunk/Runs/O3/H1/Results/Uncertainty/O3_H1_C_GPR_20190416_meas0328-0828_withHFafter0611_nofsQcorr_fmin30Hz_lengthscaleZp5.hdf5 --modelPath=/home/ling.sun/aligocalibration/trunk/Runs/O3/H1/params/ --modelFilename=modelparams_H1_20190416 --IFOmodel=modelPars --sampleNumber=1000 --seed=1111 --version=ref --outDir=/home/ling.sun/tmpUnc/ --plot1SigmaUncs --saveSummaries --gpsTime=1244307456
DriptaB and RickS
This morning, we updated the Xend and Yend Pcal force coefficients for the Pcal power sensor readback signals.
We have decided not to continue with recording all the parameters that go into these force coefficients via the detailed force coefficient MEDM screens (which end up calculating the static force coefficients 16,000 times per second for the whole run) and instead just write the force coefficient into the records such asH1:CAL-PCALX_FORCE_COEFF_CTS2V_T and set the other record values such that their cumulative effect is just to multiply this coefficient by unity. We plan to update the MEDM screen and variable names ASAP.
The updated force coefficient files for LHO are in the SVN at:
/ligo/svncommon/CalSVN/aligocalibration/trunk/Runs/O3/H1/Results/CALCS_FE/lho_xend_pcal_epics_created-20191030.txt
/ligo/svncommon/CalSVN/aligocalibration/trunk/Runs/O3/H1/Results/CALCS_FE/lho_yend_pcal_epics_created-20191030.txt
and for LLO at:
/ligo/svncommon/CalSVN/aligocalibration/trunk/Runs/O3/L1/Results/CALCS_FE/lho_xend_pcal_epics_created-20191030.txt
/ligo/svncommon/CalSVN/aligocalibration/trunk/Runs/O3/L1/Results/CALCS_FE/lho_yend_pcal_epics_created-20191030.txt
The calculation of the force coefficients is performed in python code written by Ethan Payne. The parameters for the calculations and the resulting force coefficients are listed in the tables in the .pdf file in the comment attached below.
The force coefficients have changed from the values entered at the beginnign of the O3a run (on 20190401) by:
Xend Tx: +0.13%
Xend Rx: +0.29%
Yend Tx: +0.17%
Yend Rx: +0.27%
After updating the Pcal suspension filters (in, for instance H1:CAL-PCALX_TX_PD, hopefully later today) we expect the calibrated Pcal displacements to change by:
Xend Tx: +0.11%
Xend Rx: +0.27%
Yend Tx: +0.31%
Yend Rx: +0.42%
The force coefficients have changed mostly due to updated responsivity ratio estimates benefiting from additional measurments during the O3a run and inclusion of non-ideal ADC coversion factors.
The differences between the changes in force coefficients and the changes in the displacement coefficients is from discrepancies between the O2 ETM masses that have been used in the Pcal suspension filters and the O3 masses that should have been and will be implemented.
Note that these changes will not be fully realized until these filter files are updated.
The Epics records have been updated to the following values:
For Xend:
caput H1:CAL-PCALX_FORCE_COEFF_CTS2V_T 7.9278e-13
caput H1:CAL-PCALX_FORCE_COEFF_CTS2V_R 6.2344e-13
caput H1:CAL-PCALX_FORCE_COEFF_COS_THETA 0.5
caput H1:CAL-PCALX_FORCE_COEFF_RHO_G 1
caput H1:CAL-PCALX_FORCE_COEFF_ALPHA_W 1
caput H1:CAL-PCALX_FORCE_COEFF_ALPHA_T 1
caput H1:CAL-PCALX_FORCE_COEFF_ALPHA_R 1
caput H1:CAL-PCALX_FORCE_COEFF_GAIN_AA_R 299792458
caput H1:CAL-PCALX_FORCE_COEFF_GAIN_AA_T 299792458
caput H1:CAL-PCALX_OPT_EFF_TX2TM_INNER 1
caput H1:CAL-PCALX_OPT_EFF_TX2TM_OUTER 1
caput H1:CAL-PCALX_OPT_EFF_TM_INNER 1
caput H1:CAL-PCALX_OPT_EFF_TM_OUTER 1
caput H1:CAL-PCALX_OPT_EFF_TM2RX_INNER 1
caput H1:CAL-PCALX_OPT_EFF_TM2RX_OUTER 1
caput H1:CAL-PCALX_OPT_EFF_TOT_INNER 1
caput H1:CAL-PCALX_OPT_EFF_TOT_OUTER 1
For Yend:
caput H1:CAL-PCALY_FORCE_COEFF_CTS2V_T 9.2203e-13
caput H1:CAL-PCALY_FORCE_COEFF_CTS2V_R 6.2702e-13
caput H1:CAL-PCALY_FORCE_COEFF_COS_THETA 0.5
caput H1:CAL-PCALY_FORCE_COEFF_RHO_G 1
caput H1:CAL-PCALY_FORCE_COEFF_ALPHA_W 1
caput H1:CAL-PCALY_FORCE_COEFF_ALPHA_R 1
caput H1:CAL-PCALY_FORCE_COEFF_ALPHA_T 1
caput H1:CAL-PCALY_FORCE_COEFF_GAIN_AA_R 299792458
caput H1:CAL-PCALY_FORCE_COEFF_GAIN_AA_T 299792458
caput H1:CAL-PCALY_OPT_EFF_TX2TM_INNER 1
caput H1:CAL-PCALY_OPT_EFF_TX2TM_OUTER 1
caput H1:CAL-PCALY_OPT_EFF_TM_INNER 1
caput H1:CAL-PCALY_OPT_EFF_TM_OUTER 1
caput H1:CAL-PCALY_OPT_EFF_TM2RX_INNER 1
caput H1:CAL-PCALY_OPT_EFF_TM2RX_OUTER 1
caput H1:CAL-PCALY_OPT_EFF_TOT_INNER 1
caput H1:CAL-PCALY_OPT_EFF_TOT_OUTER 1
Tables of previous and updated force and displacement coefficients and O2 and O3 masses are in the attached .pdf file.
Talking with Rick further, the interpretation of the "change in calibrated displacement," which here I'll call xi is as follows:
[ NOW ]
xi = [ -------- - 1 ] * 100
[ EARLIER ]
where NOW is after today when the coefficients were installed (updated to be closer to the correct truth), and EARLIER is prior to today, during all of O3A (which therefore had a level systematic error proportional to xi).
I'll write a separate aLOG that combines this aLOG, the material in LHO aLOG 34153, and in T1900169 so that we understand exactly how this correction should be interpreted / displayed in terms of modifying previous reports of IFO response function uncertainty / systematic error, and what it means for h(t), and what it means for the BNS range.