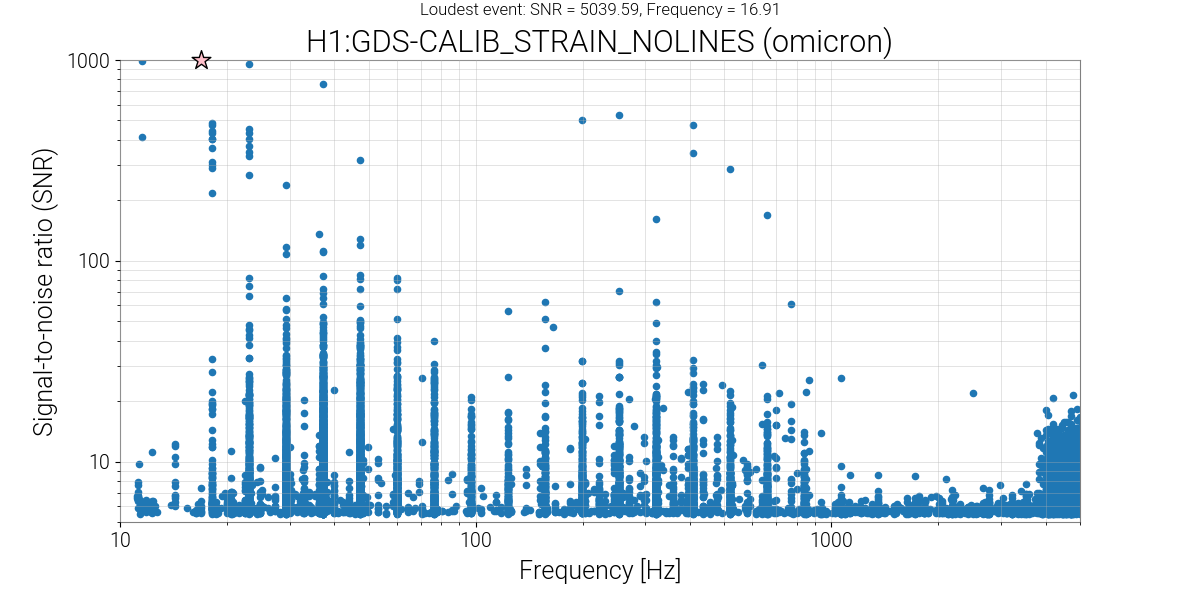
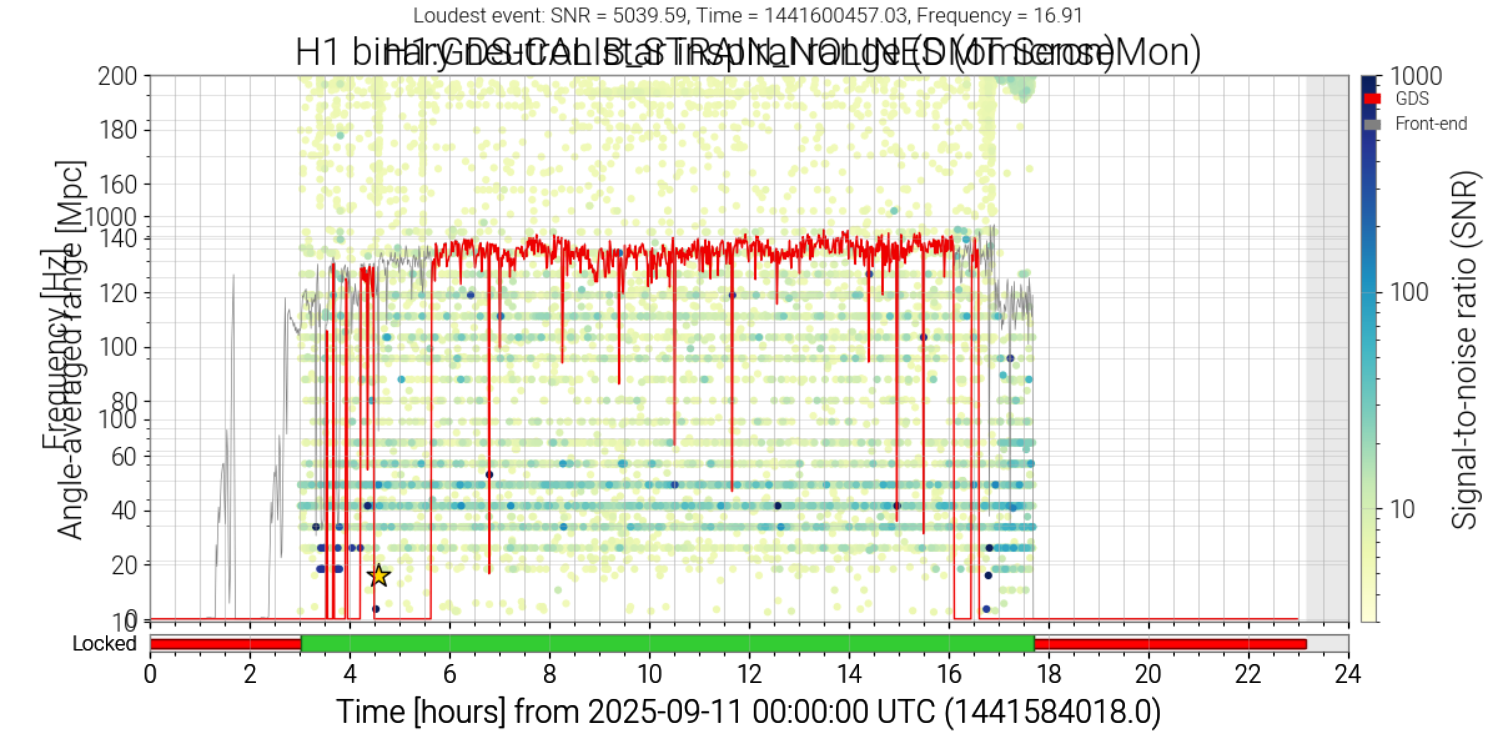
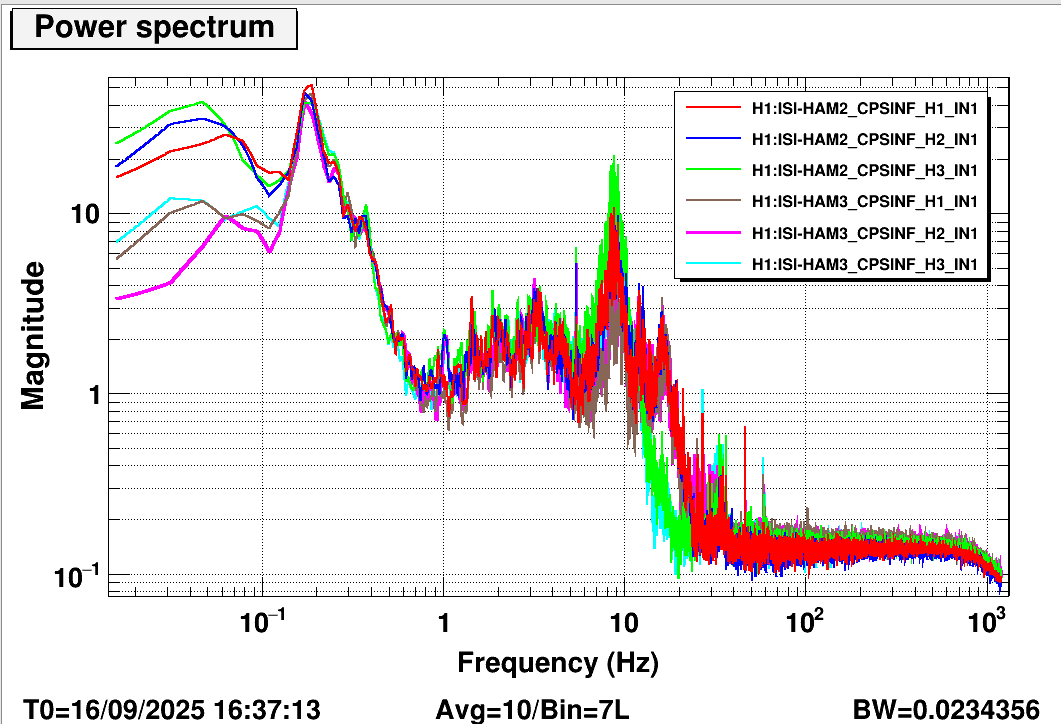
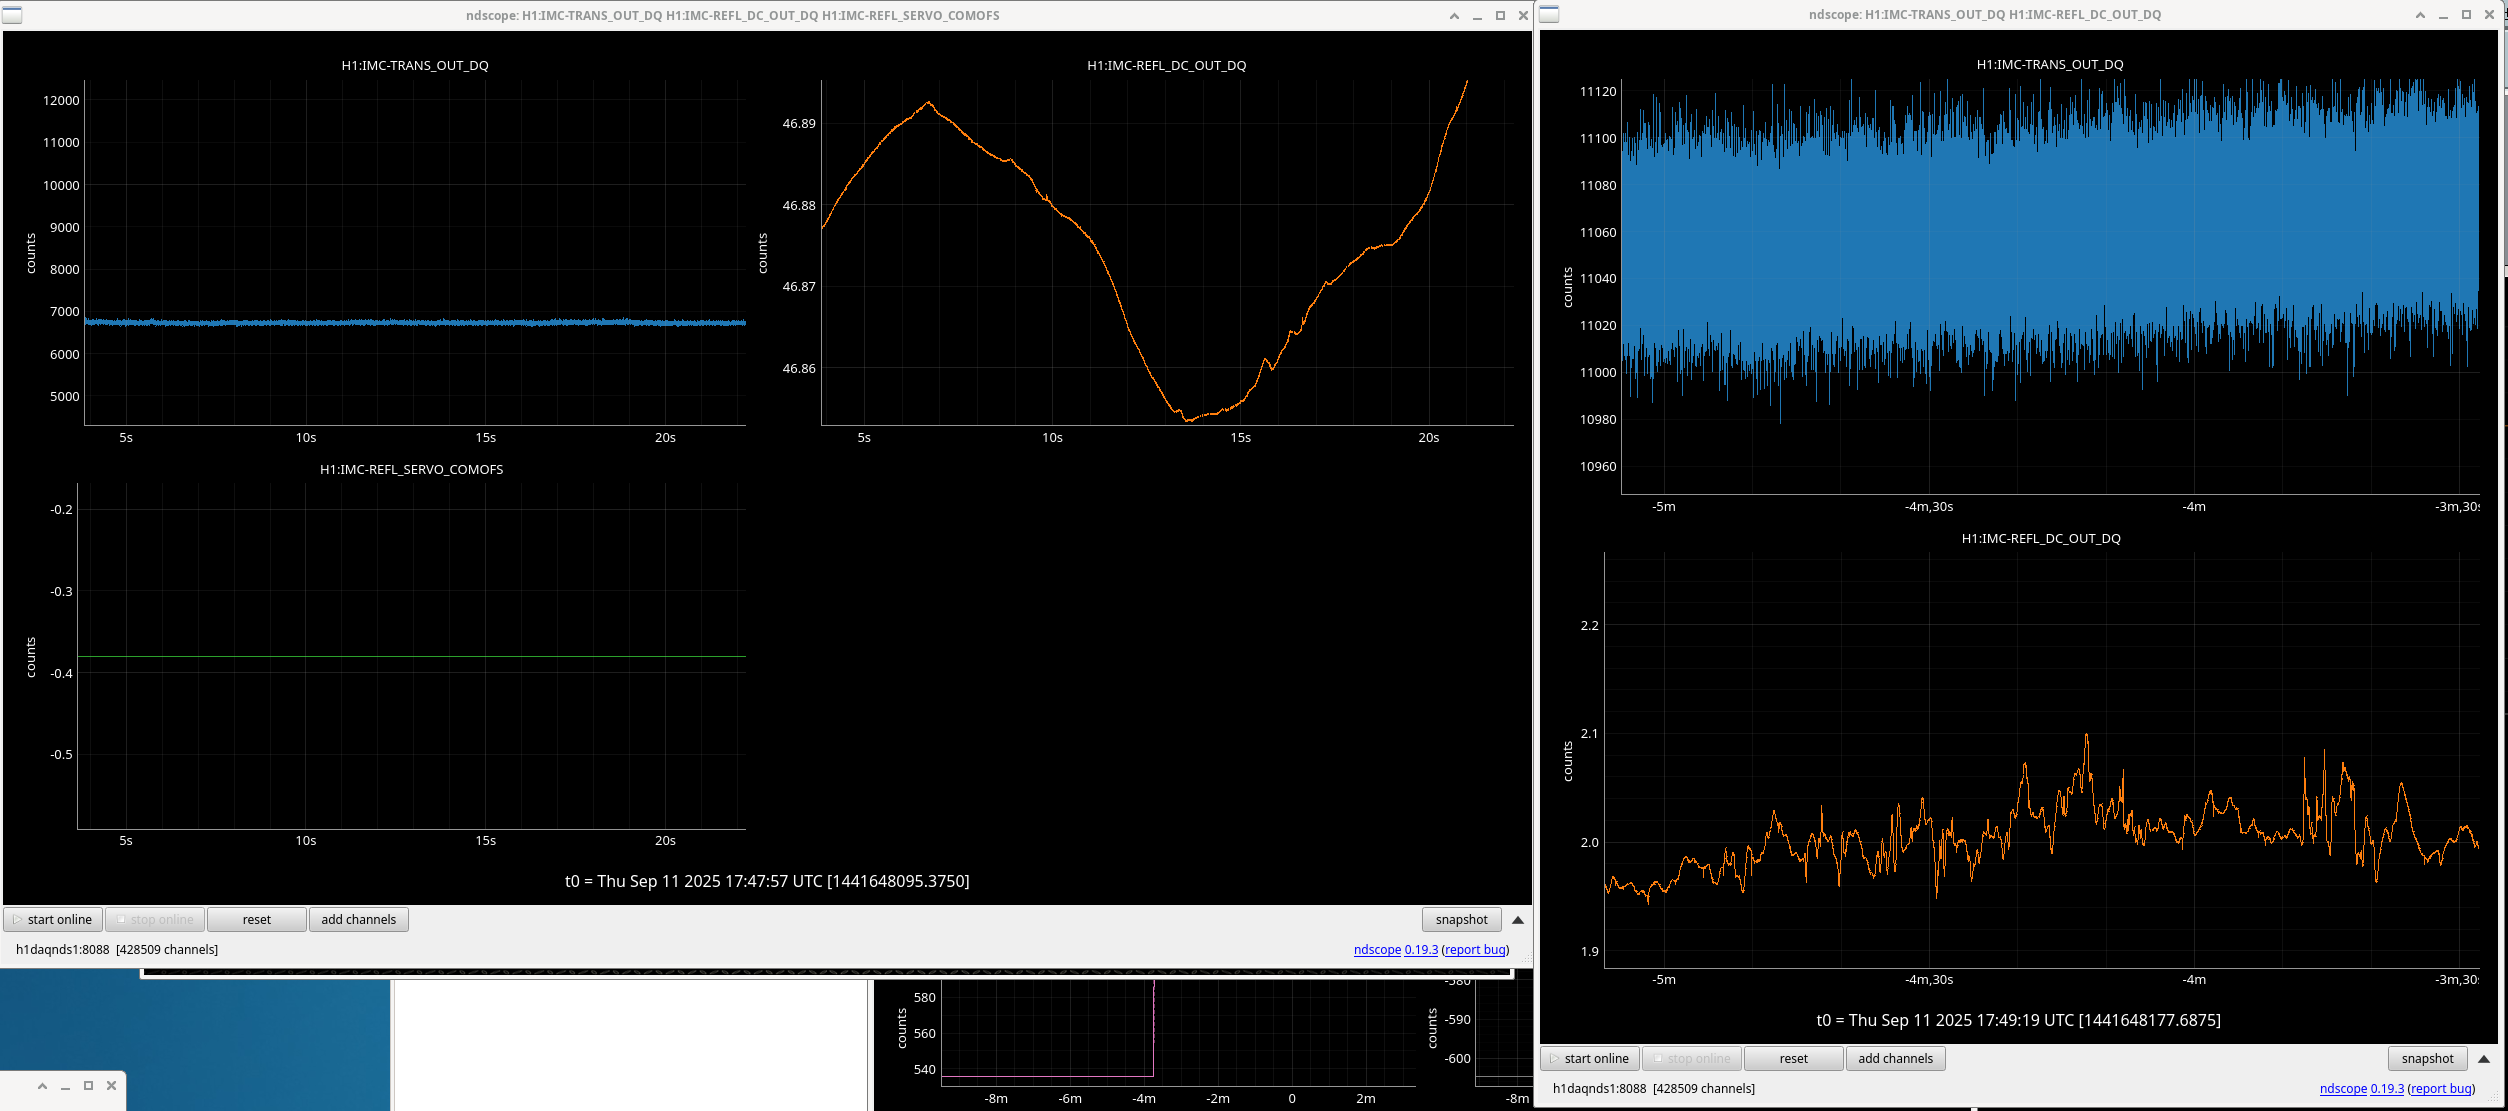
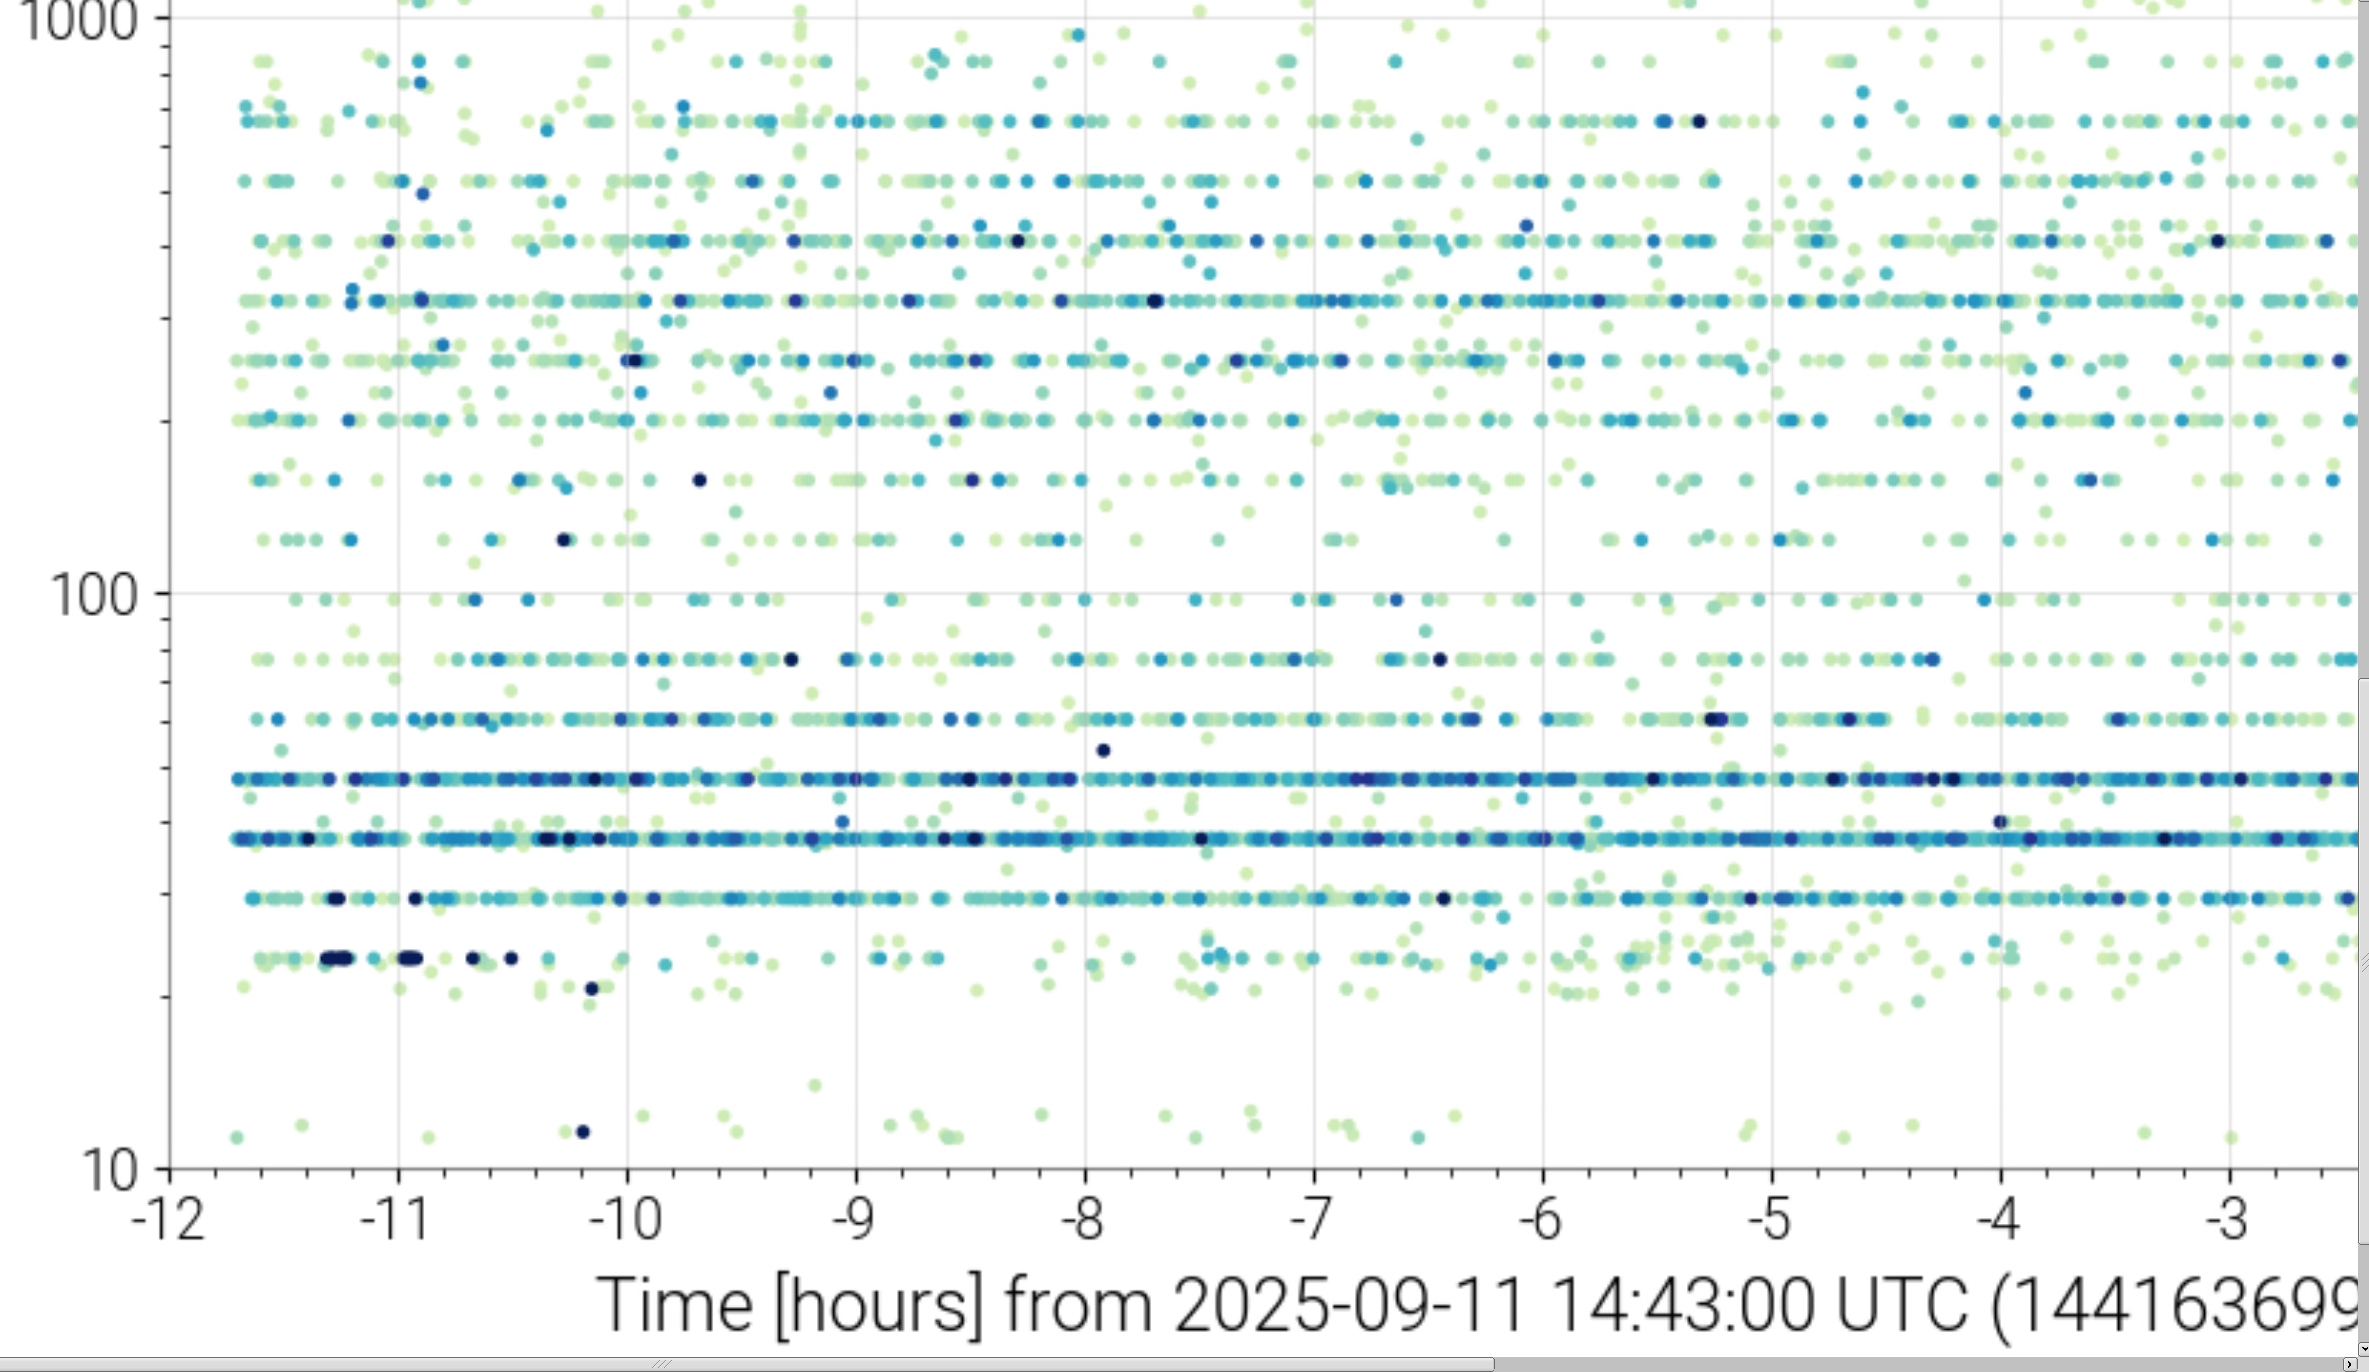
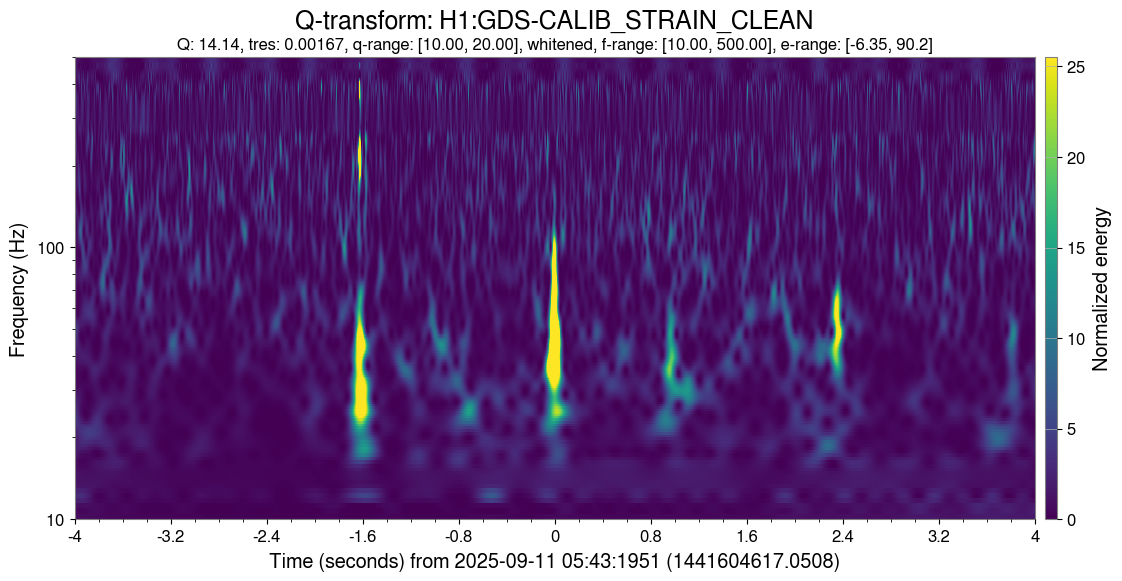
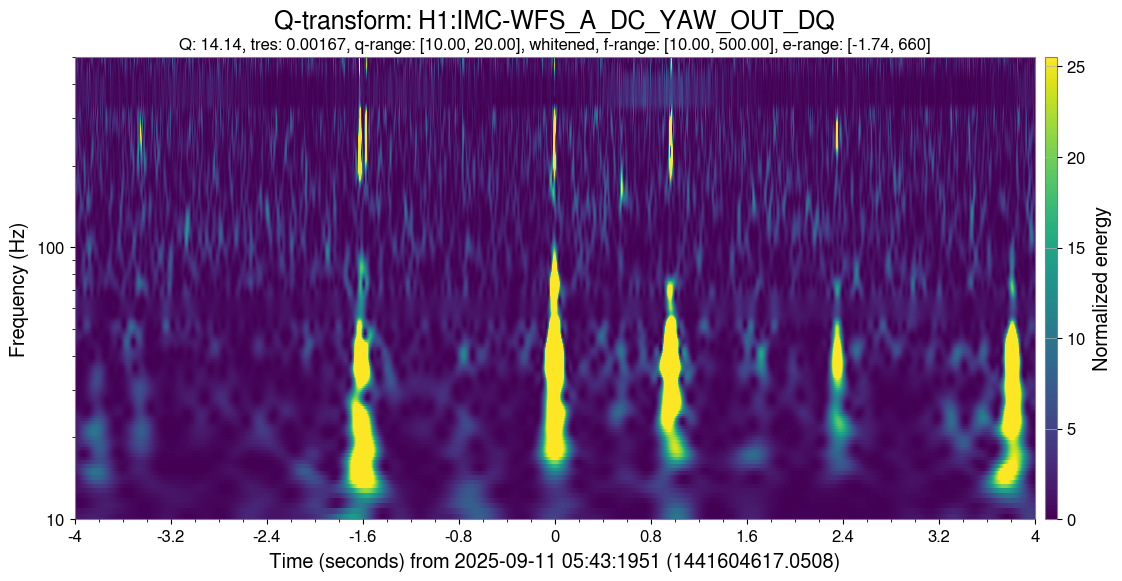
Originally pointed out by Camilla or Elenna earlier today, but I wanted to record it here in case it can help us figure out what the issue is. During last night's low range lock after the power outage (2025-09-11 03:00:47 - 17:42:34 UTC), our glitch rate was way higher than it typically is, and the glitches were mainly confined to several specific frequencies(main summary page, glitches page). I've been able to get some of these frequencies, but there are some frequency lines that I haven't been able to narrow in on the exact frequencies yet.
Here are the frequencies I confirmed, as well as guesses for the other lines:
16.91
24-ish
29.37
37.32
47.41
60-ish
76-ish
90-ish
120-ish
156.97
199.44
250-ish
321.95
409.04
510-ish
660.30
I've plotted them just lined up next to each other as well as plotting the difference in frequency as compared to each one's previous point, and we can see there is a slow exponential increase in the difference between each glitch line frequency. The yellow points are the ones that are around the correct range, but not their exact values.
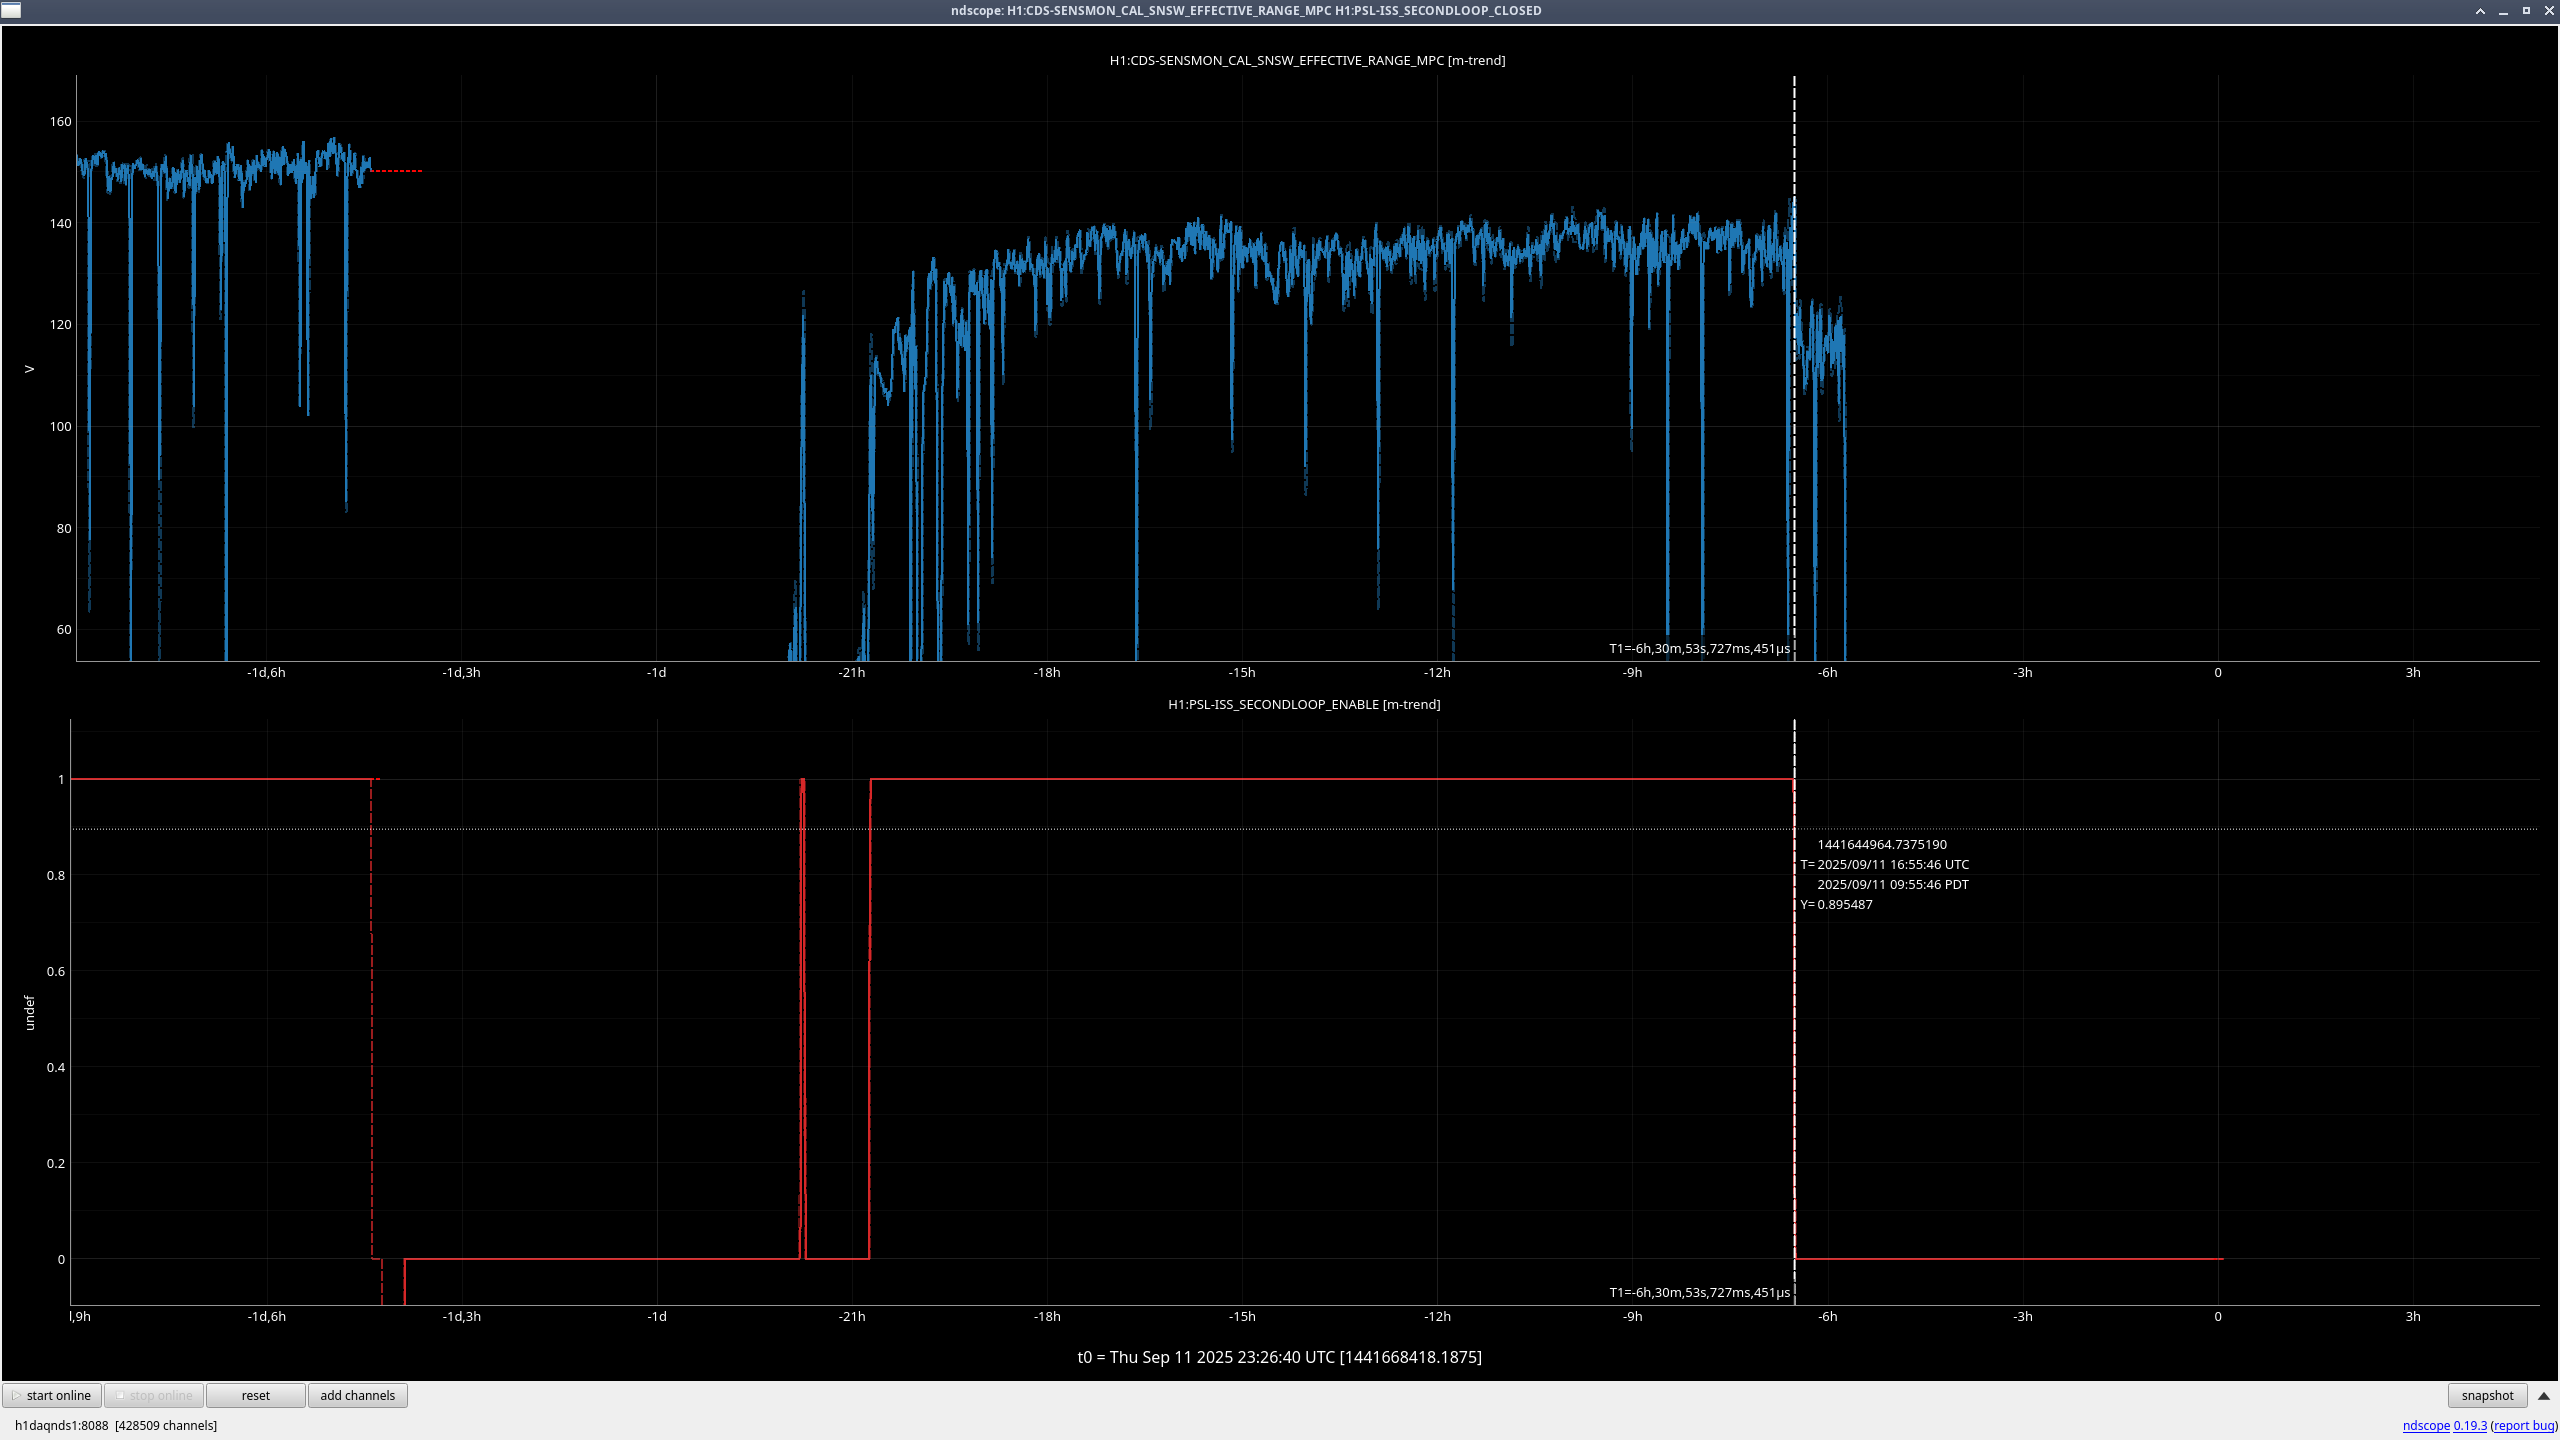
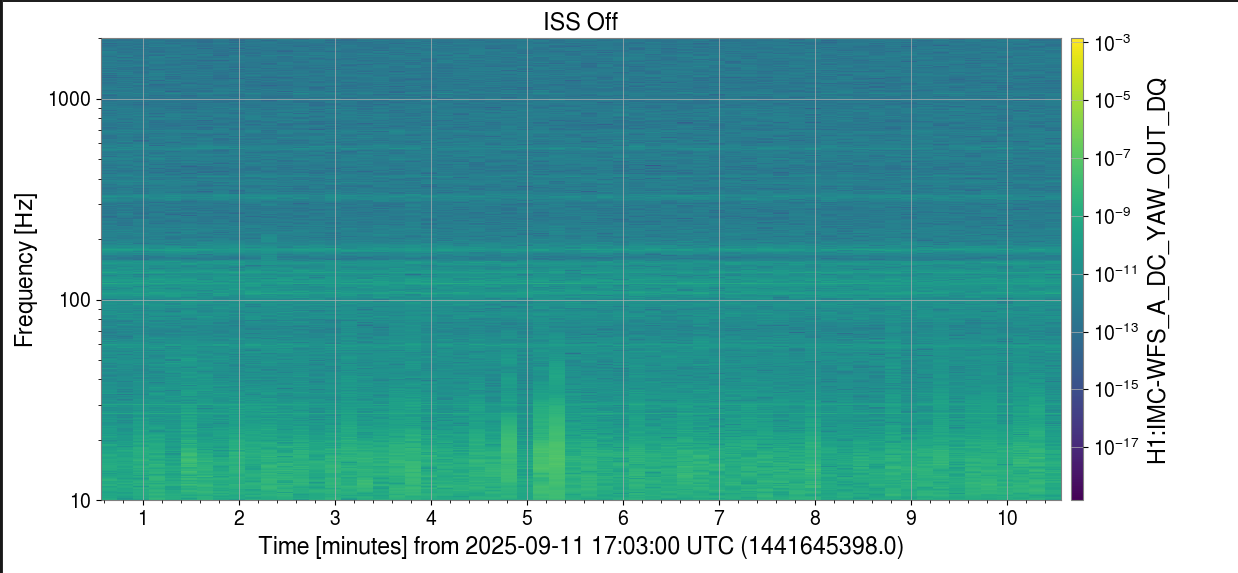
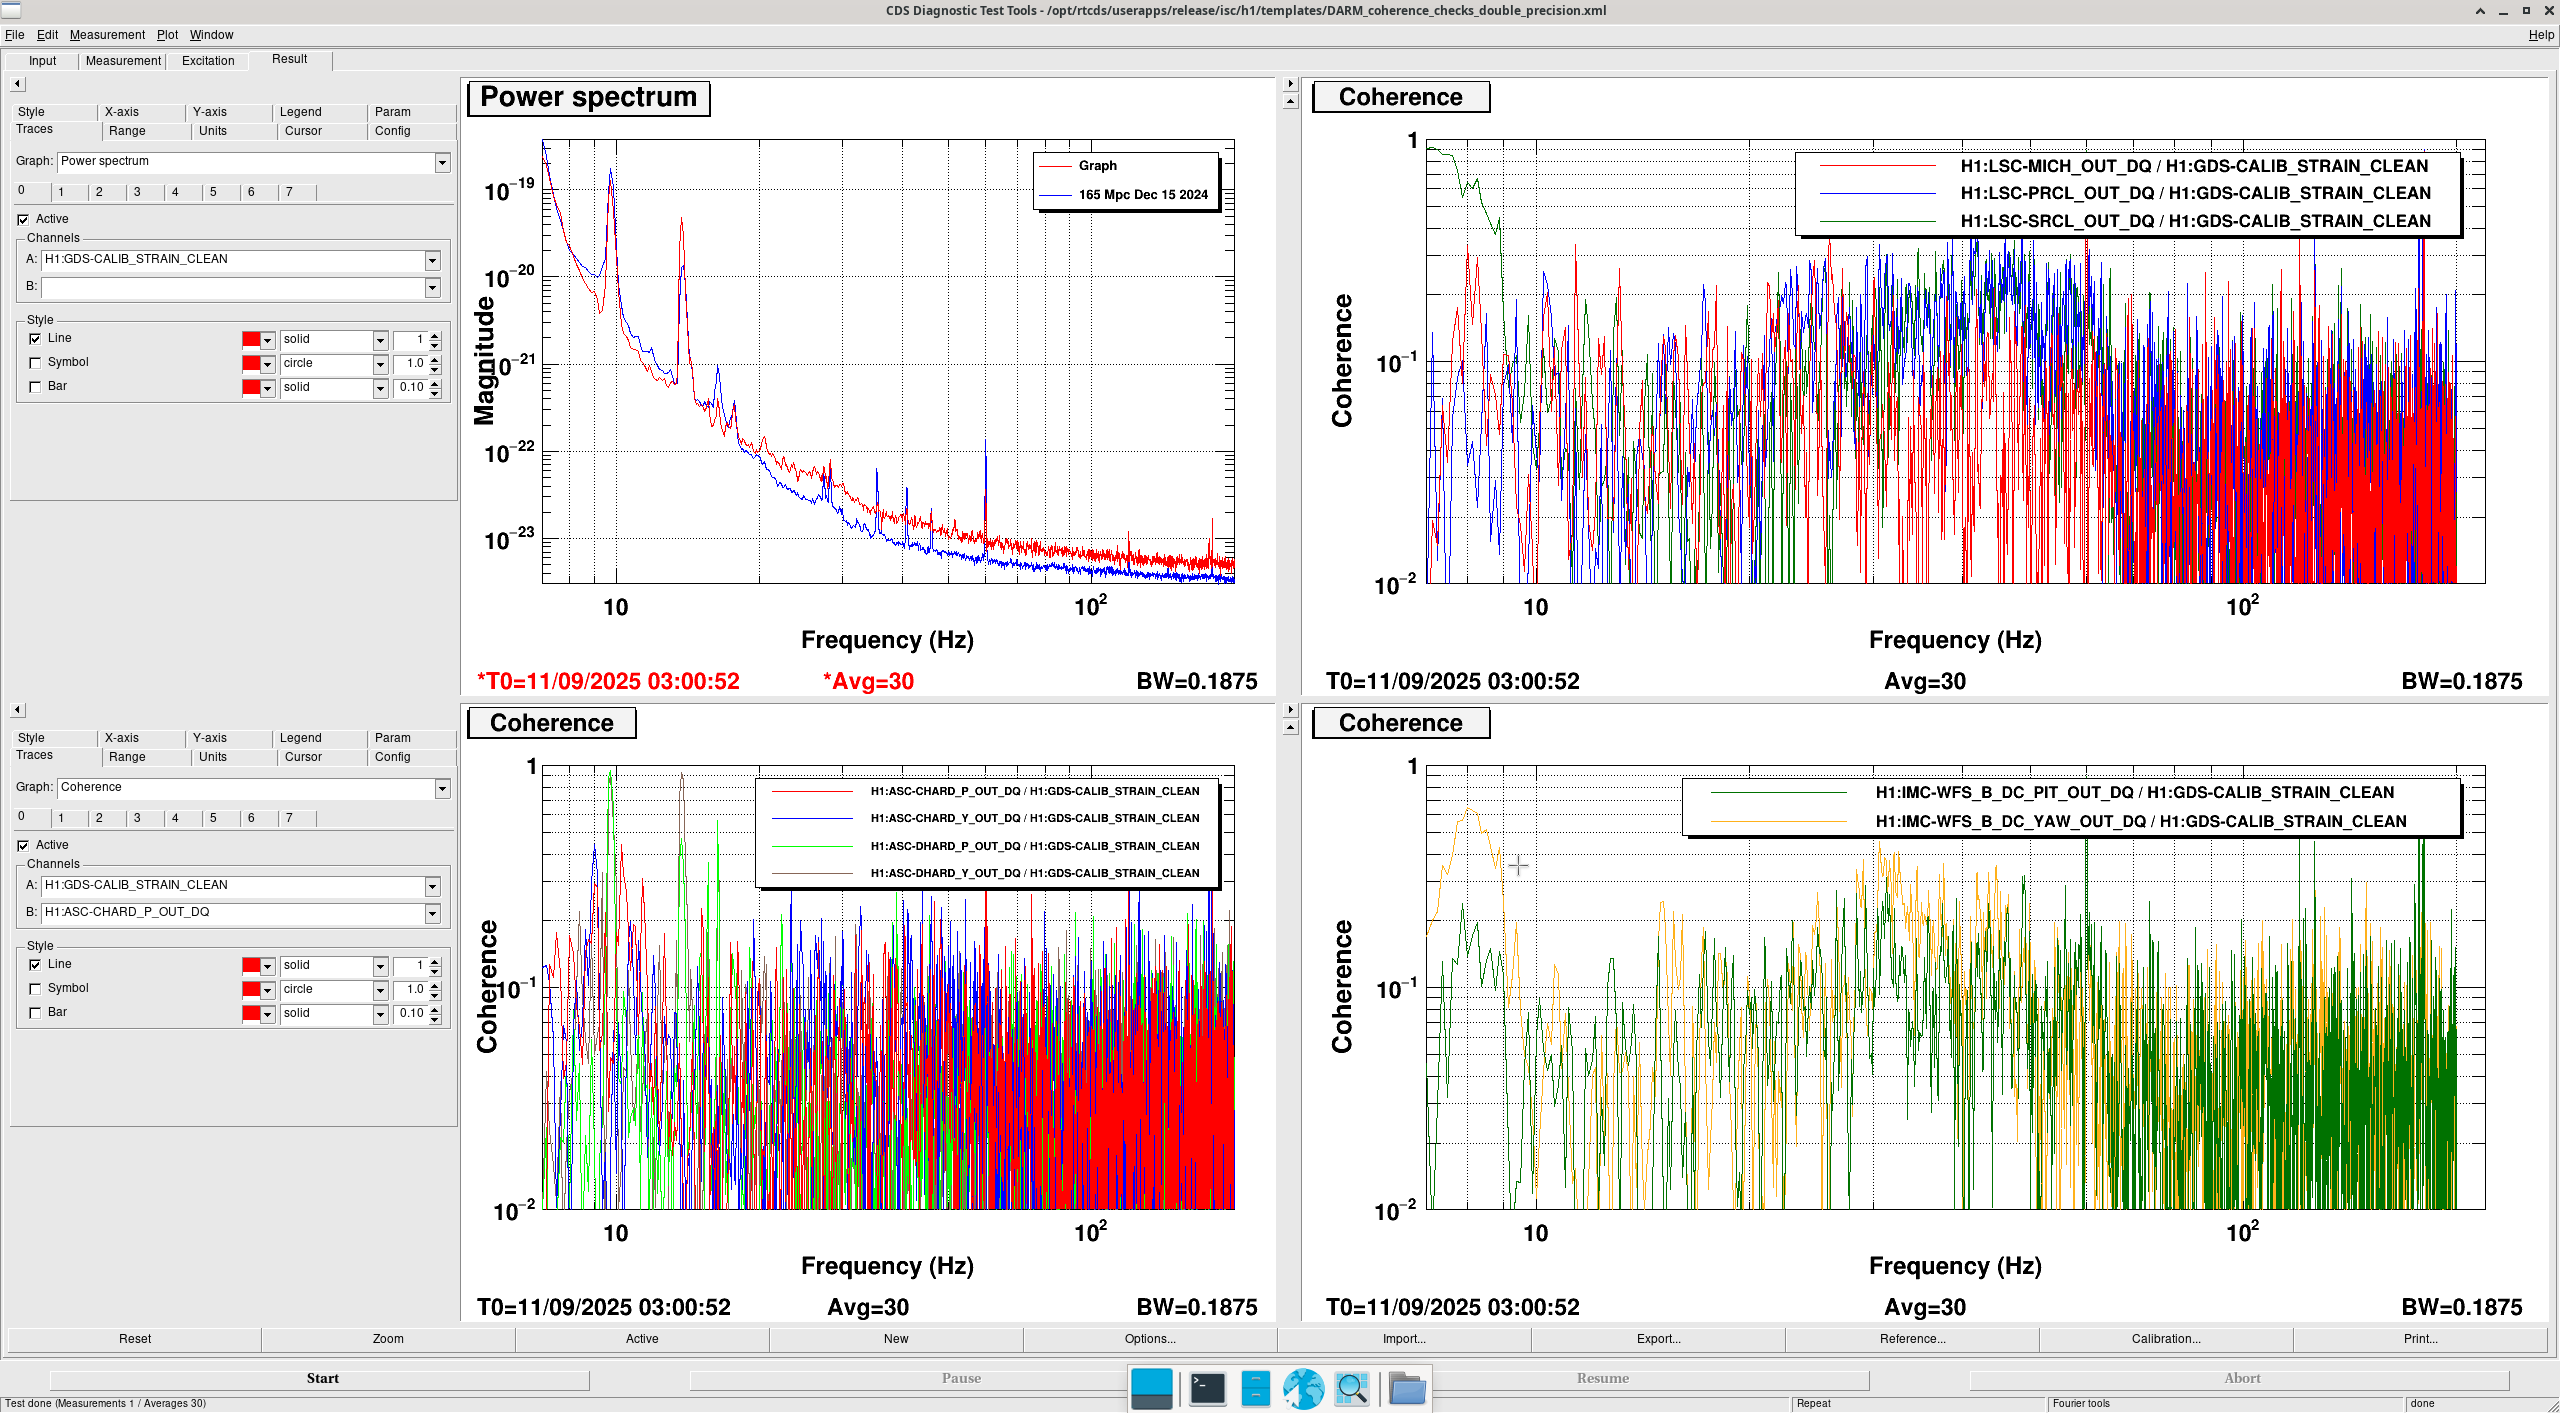
Additionally, once we turned the ISS Second Loop off at 16:55 UTC, the glitches previously appearing between 500 and 1000 Hz stopped almost altogether, the glitches at 409 Hz and below became a lot more common and louder, and we also saw some extra glitches start above 4000 Hz. We understand the glitches above 4000 Hz, but we aren't sure why the glitches between 500 and 4000 Hz would stop when we did this.
Hoping this might help shine a light on some possible electronics issue?
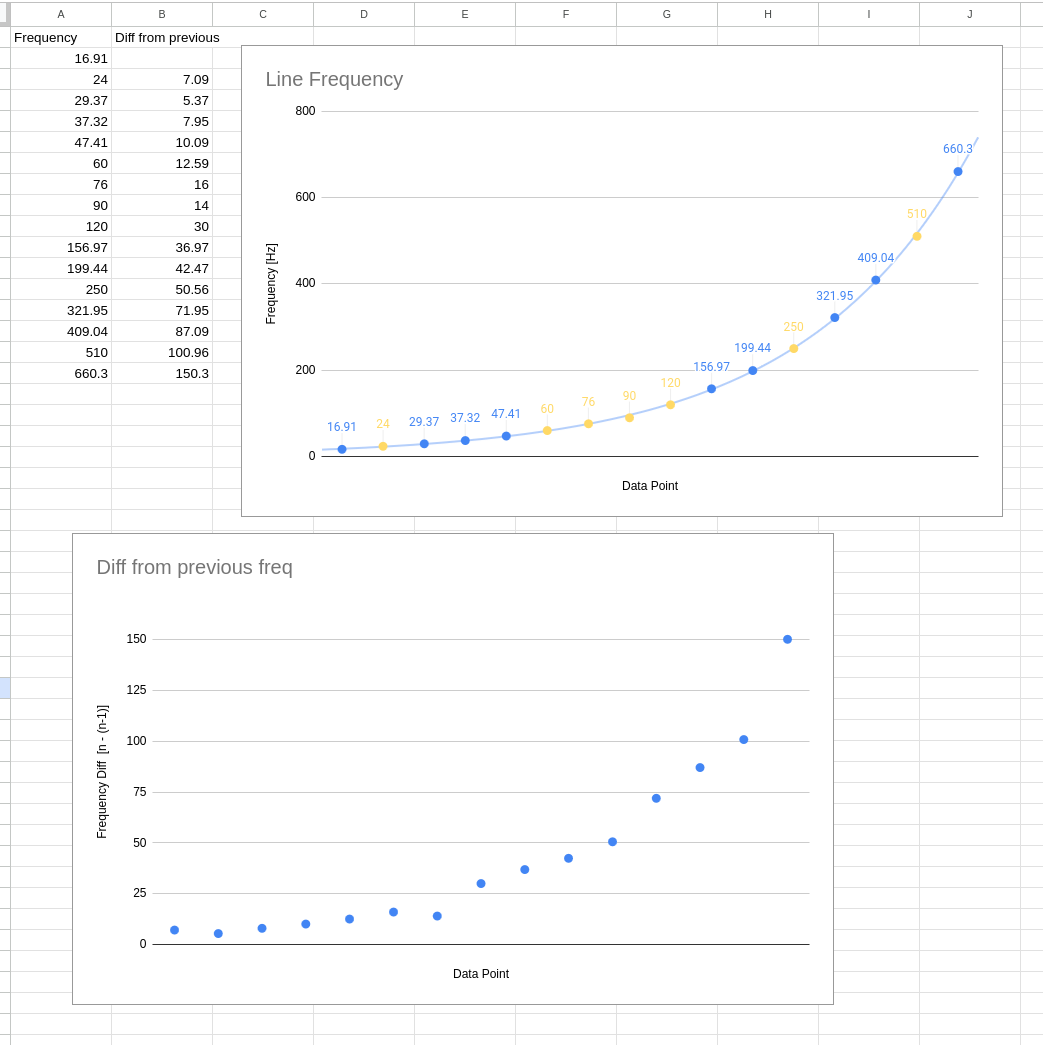
The exponential behavior noted in this alog is related to how frequencies are chosen for the sine-Gaussian wavelets used by Omicron. This type of frequency behavior is what we would expect for broadband glitches, and unfortunately, it does not relate to their physical source in this case.


