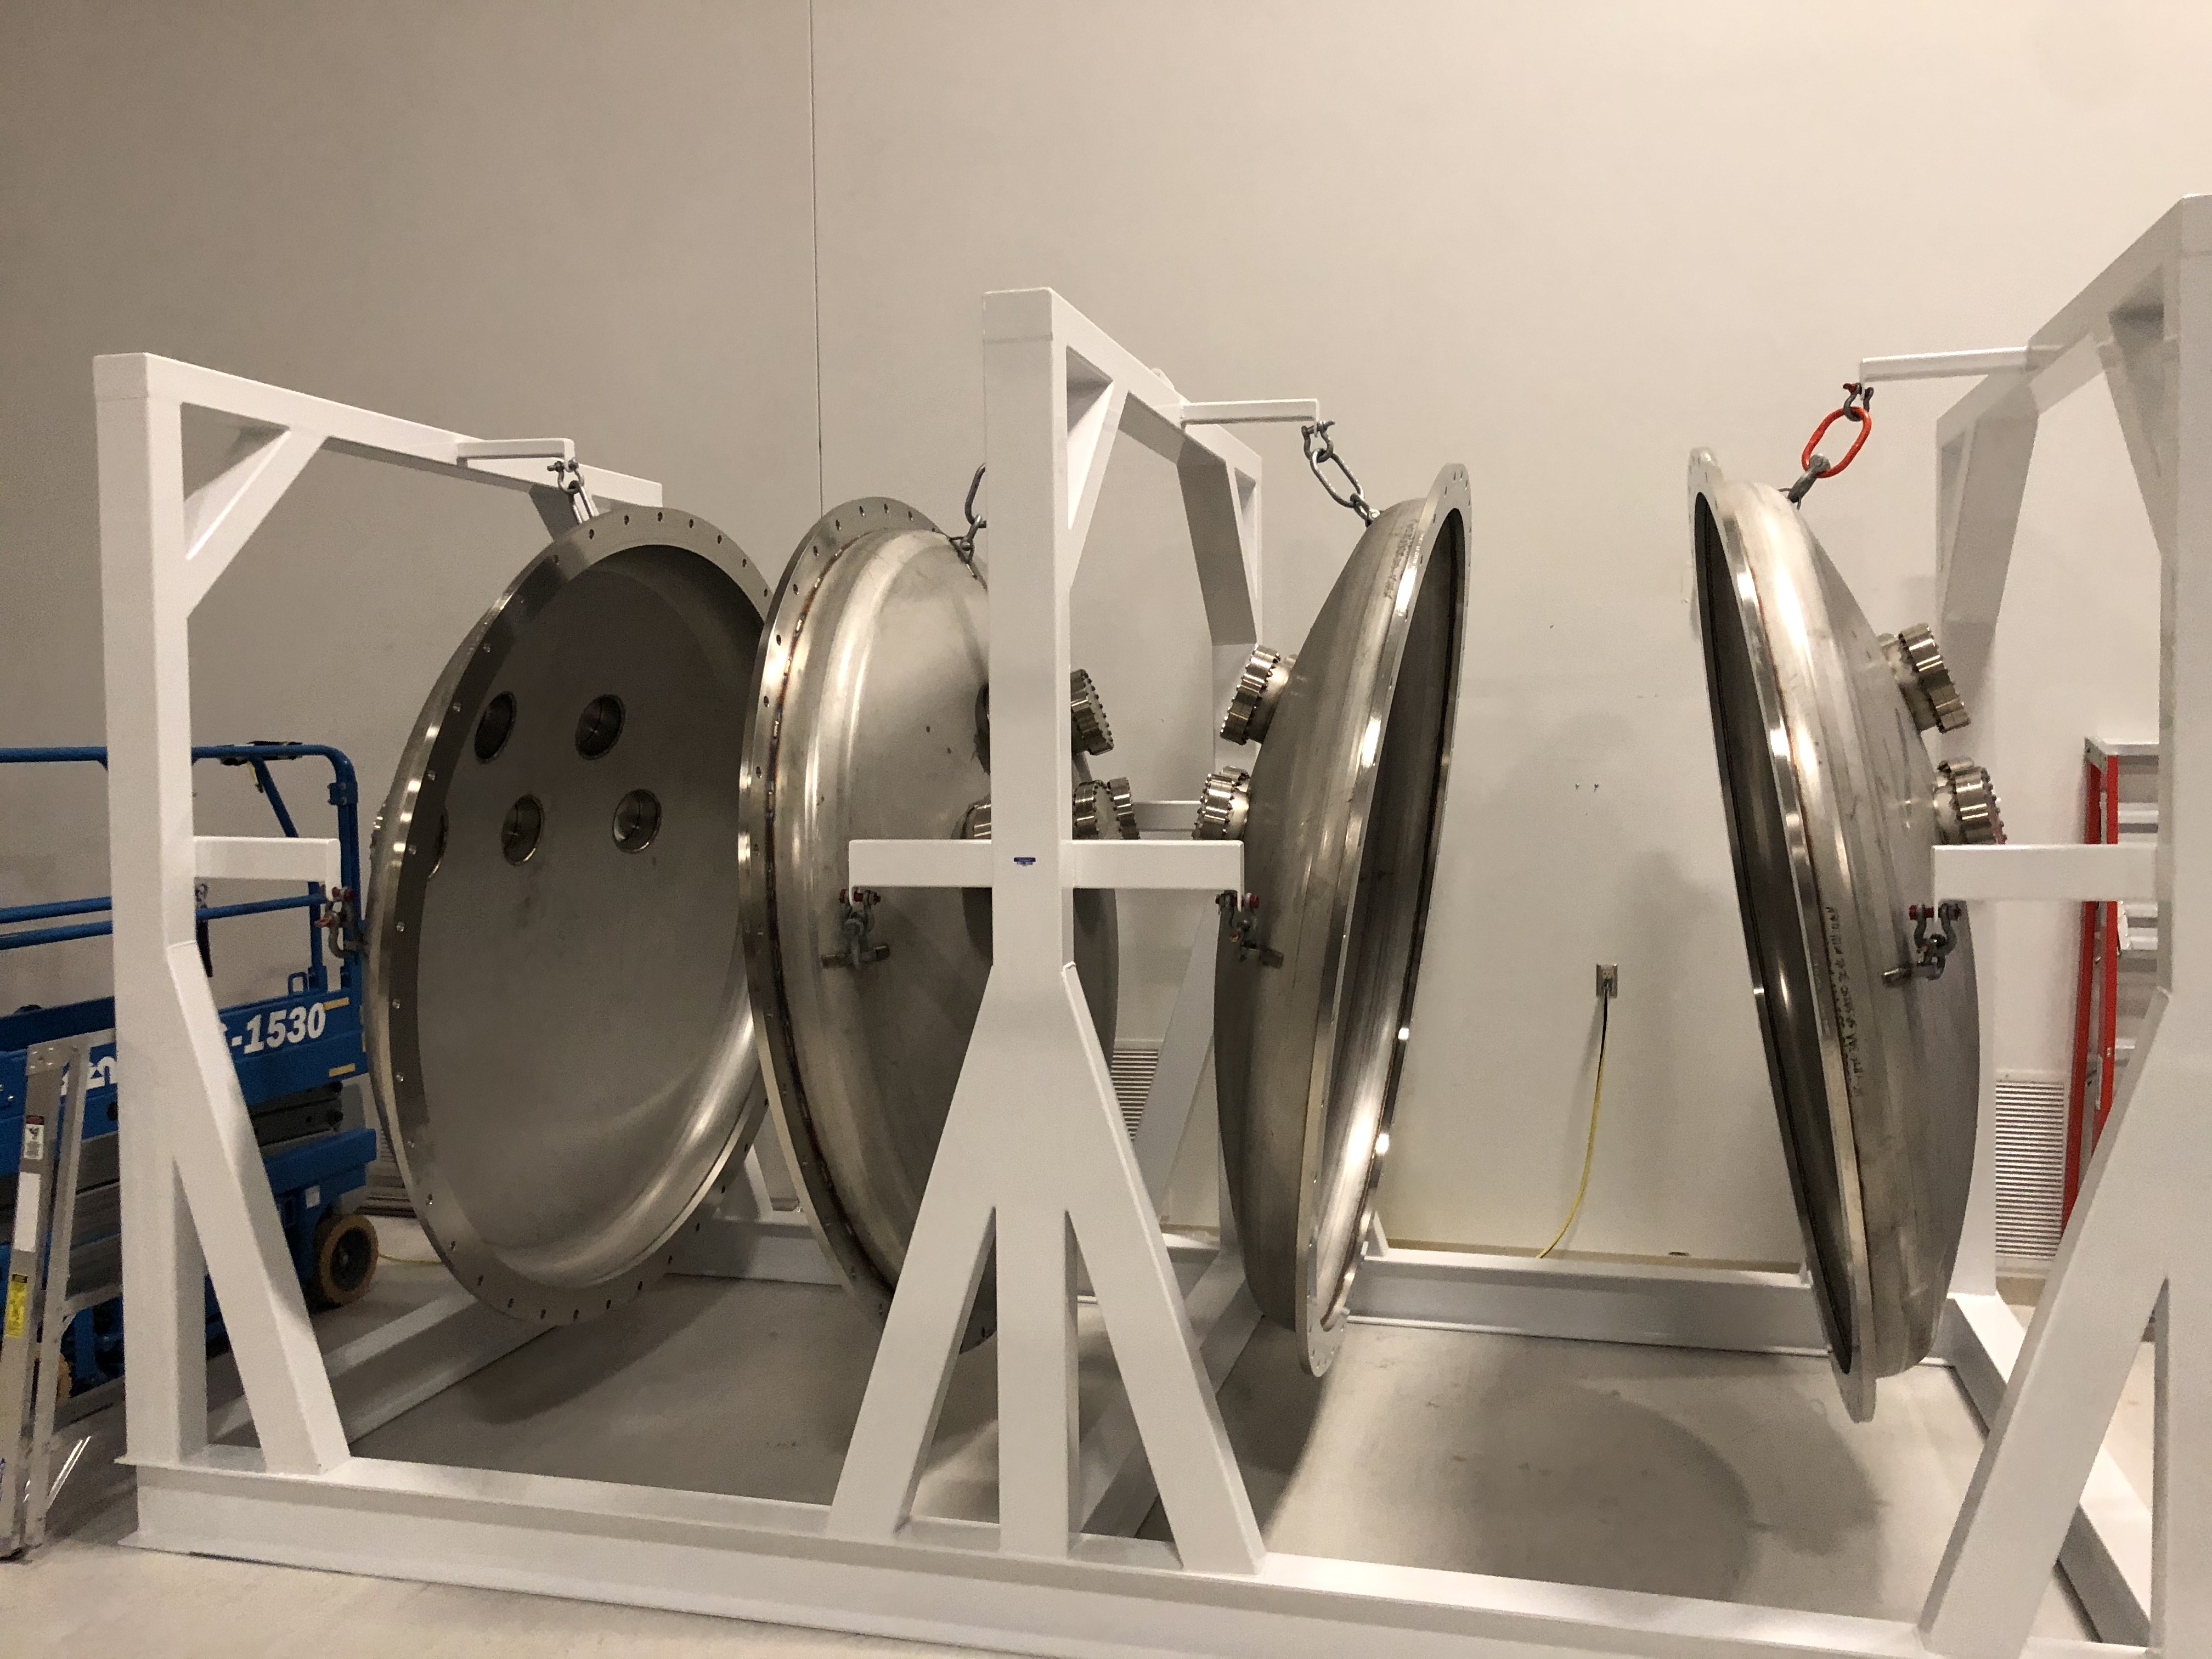
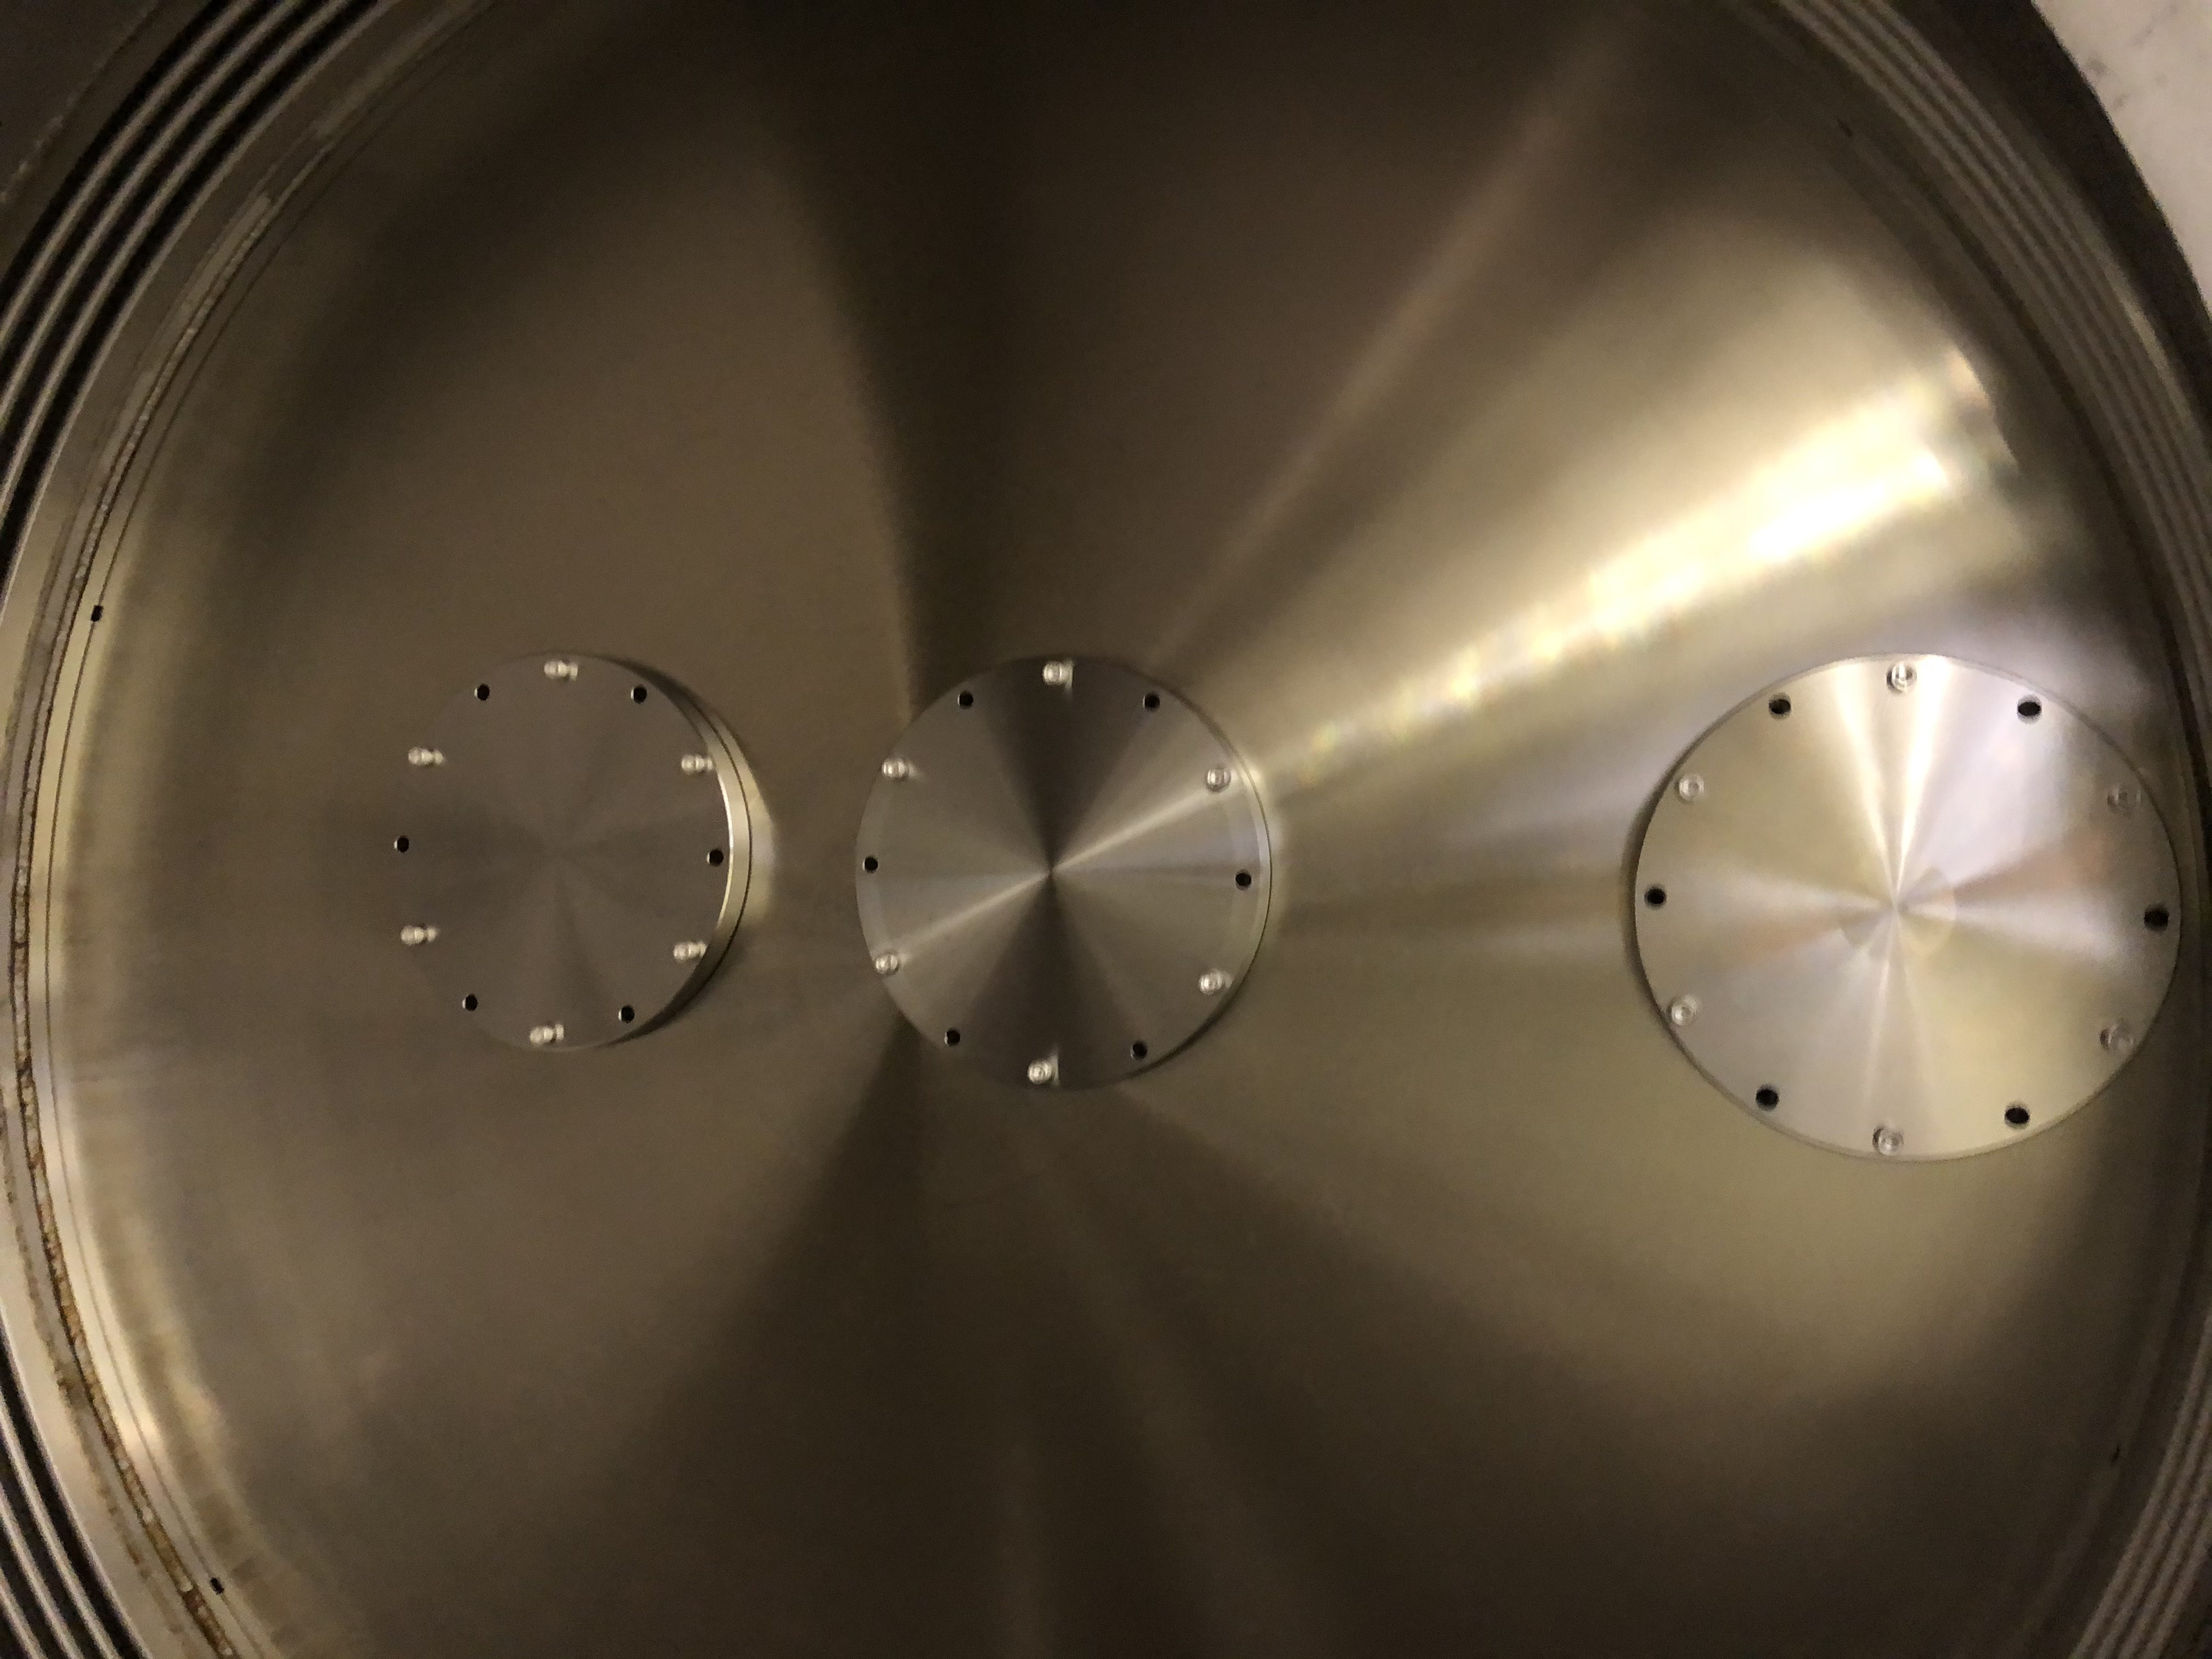
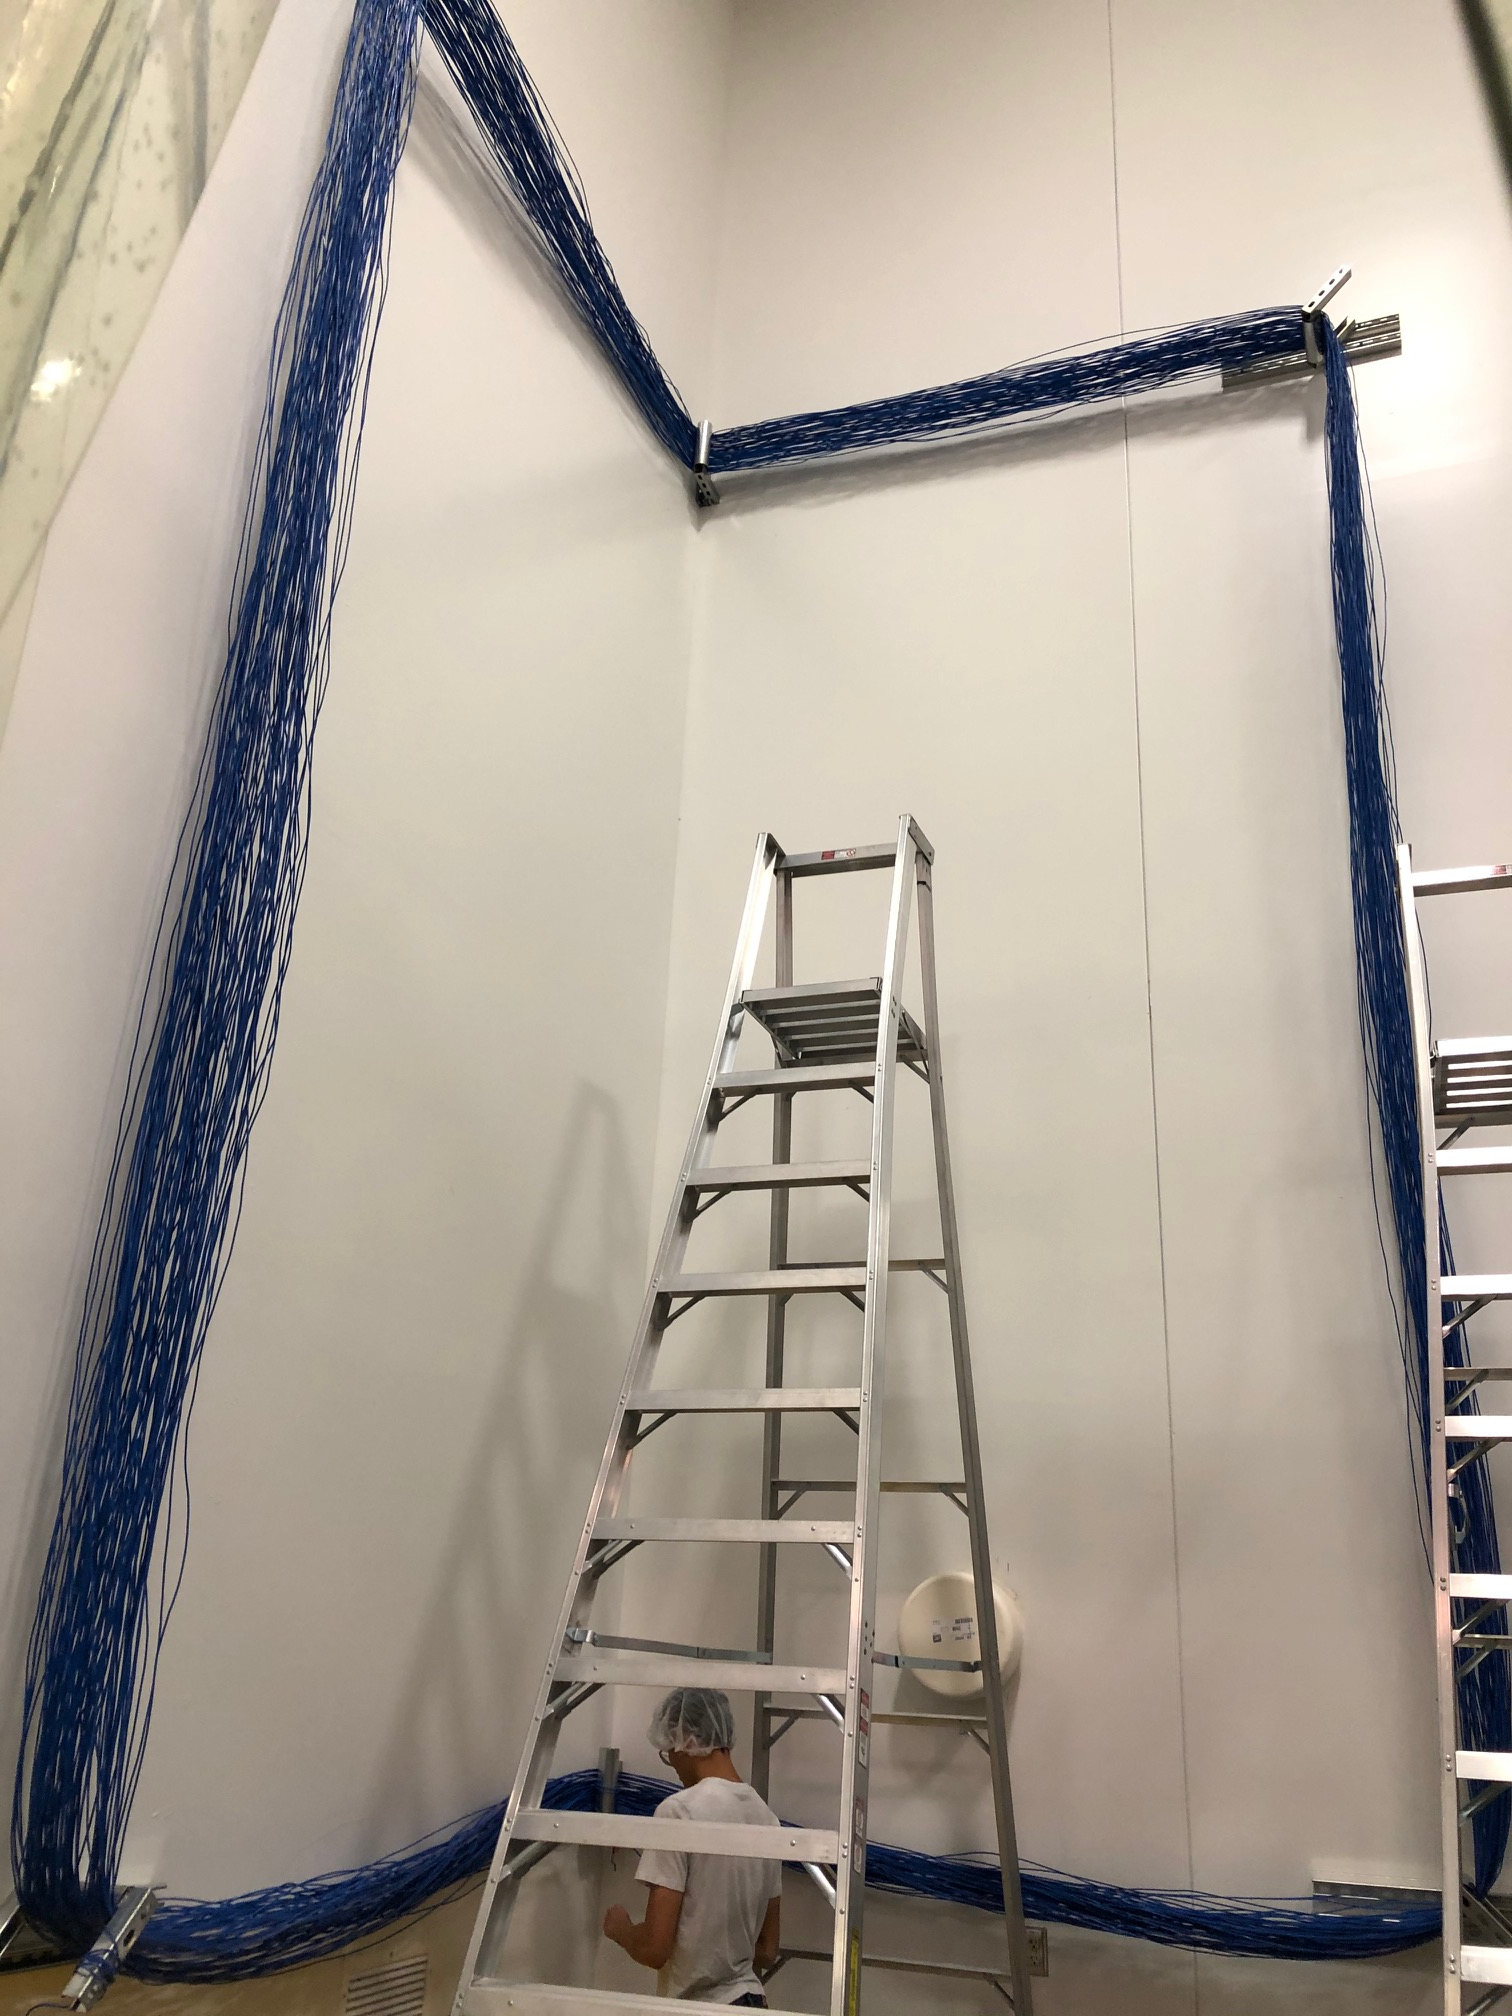
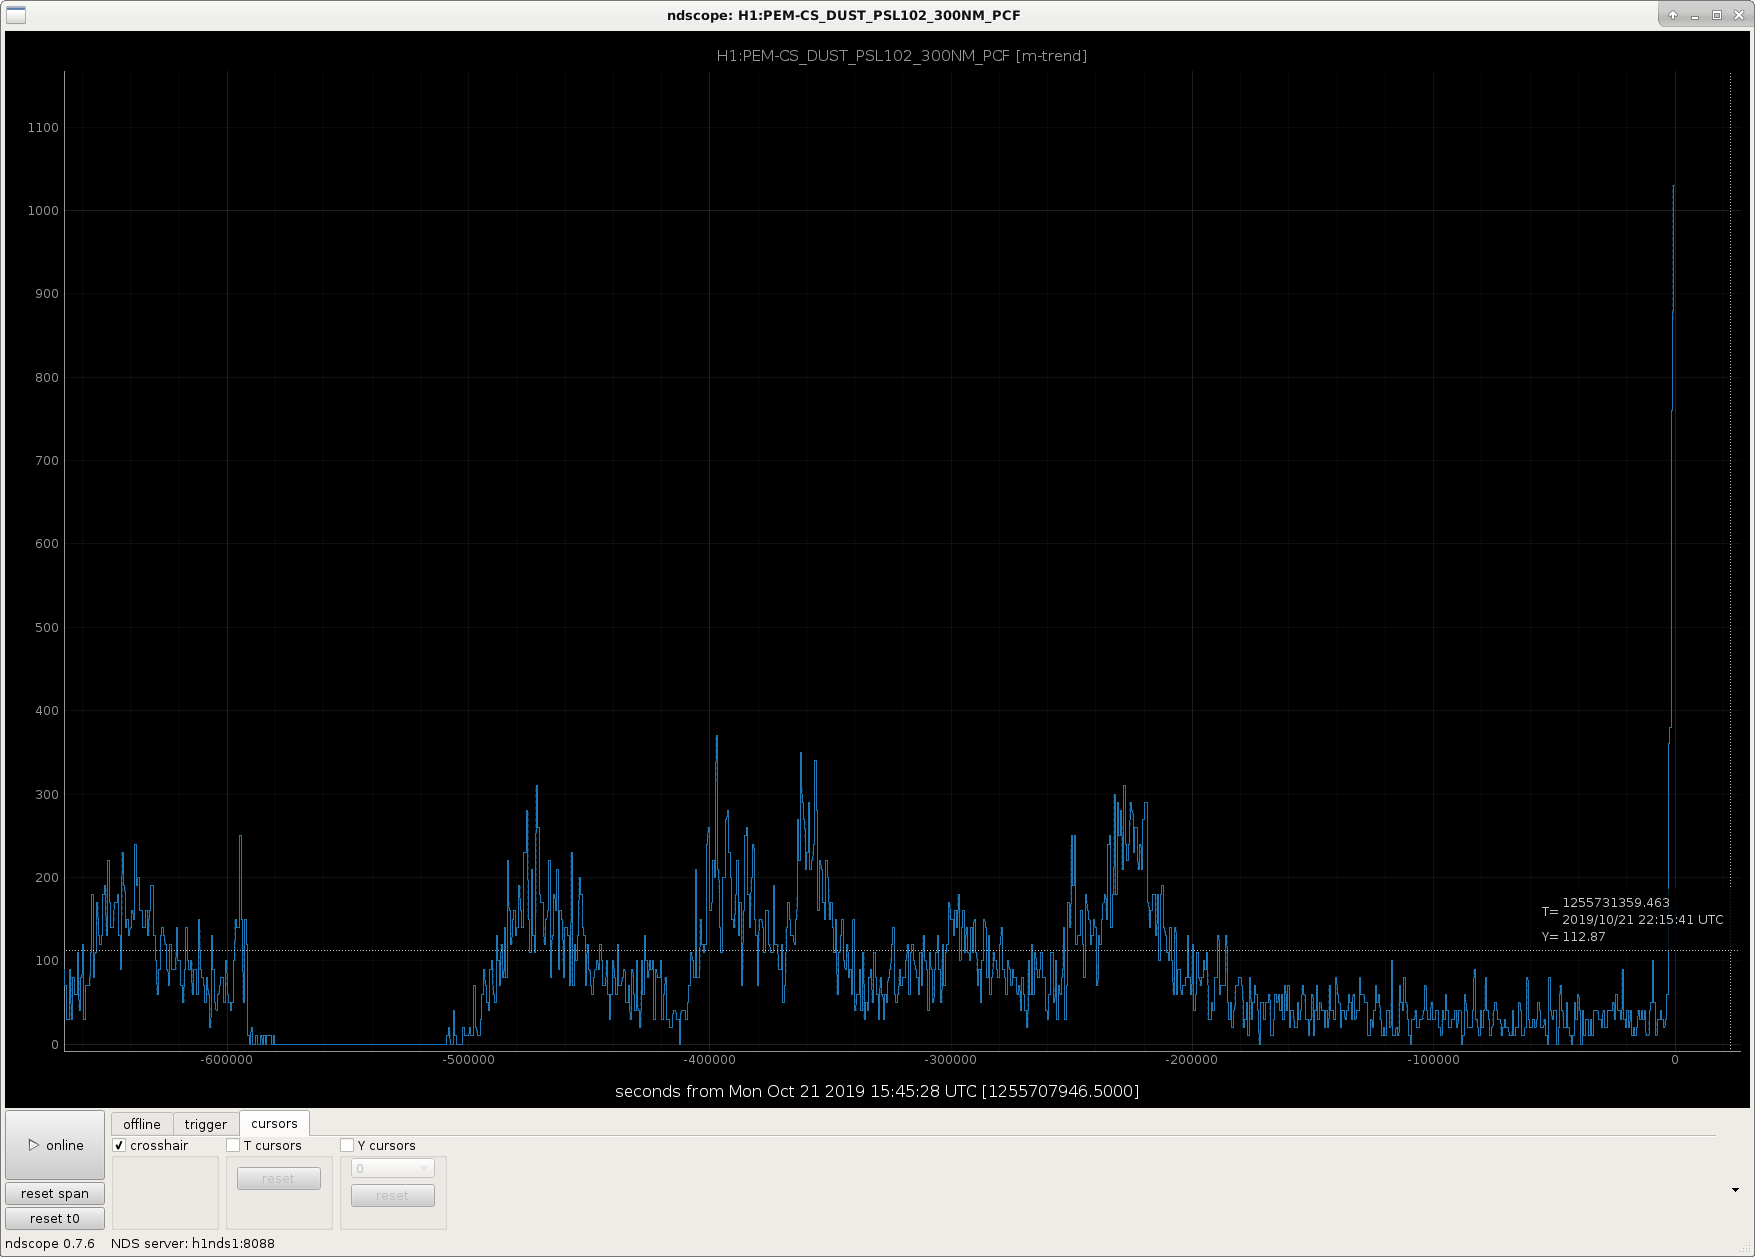
At 8:35 a PSL Dust Monitor went into a MAJOR dust alarm state for 0.3um particles. It generally stays around 0-300 counts, but at 8:35 it jumped up to 1000+ counts (see attached screen shot). Will notify Jason/Jeff B.
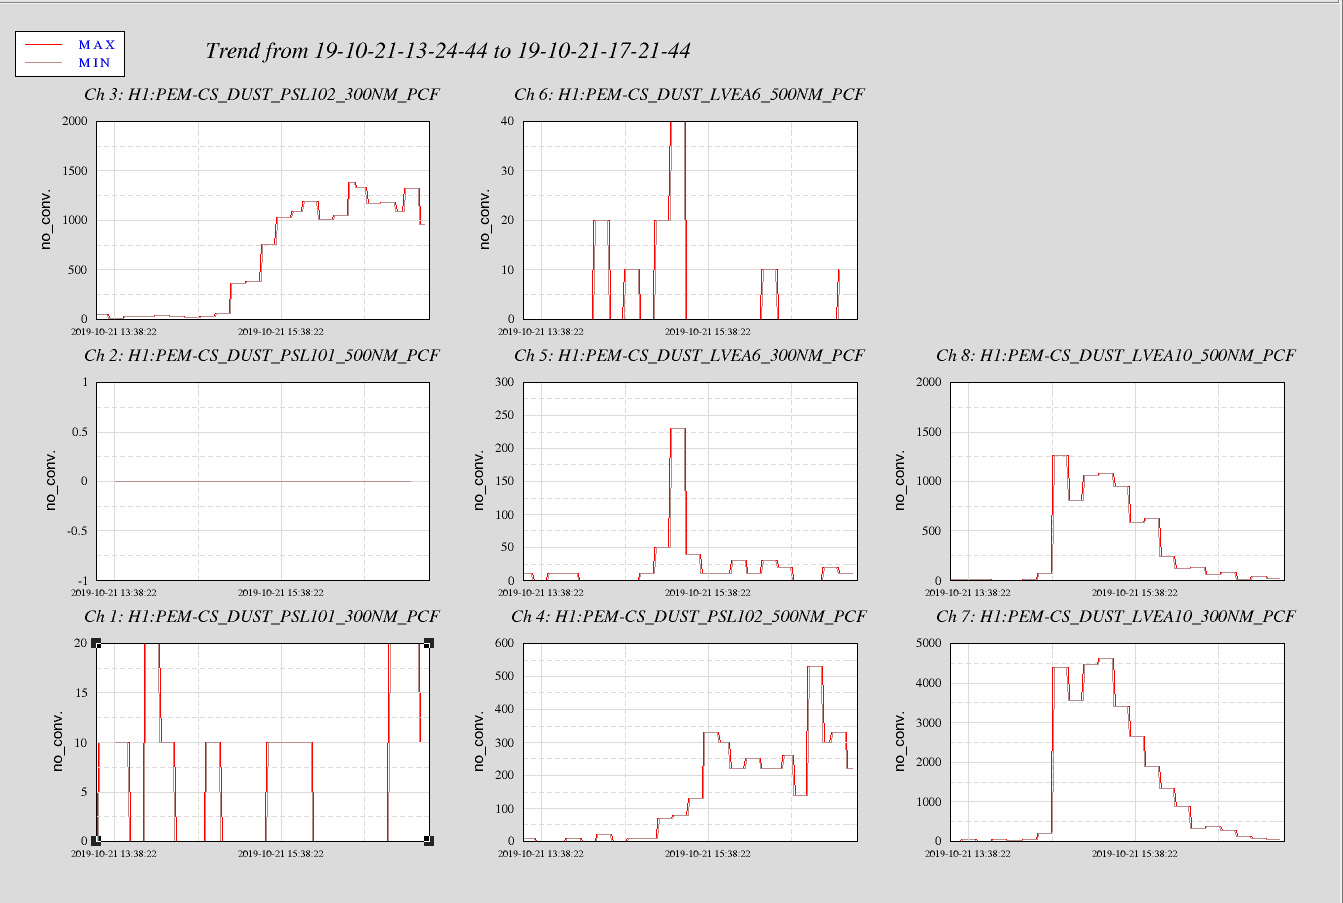
Klye was wet drilling in the west bay this morning between ~14:30 (07:30) and 15:15 (08:50).
Starting at 14:38 (07:38) the particle counts in the Bier Garten (LVEA10) spike up and drop back to normal by 17:00 (10:00).
Similar behavior is observed in HAM6 dust monitor (LVEA6). It starts to climb 14:48 (07:58) and drops off by 15:22 (08:22) - The HAM6 counts are elevated but only to 230 0.3um and 40 0.5um particles.
The dust monitor (PSL101) in the PSL Enclosure did not any counts for the 0.5um particles and no more than 20 of the 0.3um particles.
The Ante-Room-Room dust monitor (PSL102) spikes at 15:00 (08:00) however Ante-Room does not clear out like the rest of the monitored spaces in the LVEA. At the last check (17:50 (10:50)) the counts were 750 0.3um particles (alarm limit is 700 counts) and the 0.5 um counts are in the 200s.
See attached plot.
The PSL Ante-Room air is supplied by any overpressure from the LVEA and enters through vents in the bottom of the enclosure. The exhaust fans are not running during these times. Therefore there was no HEPA fan extraction of air from the Ante-Room and no corresponding air exchange. This is why the counts remained high in the PSL Ante-Room. Given the current design of the PSL Enclosure, if there are particles in the LVEA room air and the exhaust fans are on in the PSL Ante-Room these particles are going to be drawn into the PSL Anti-Room.
The 0.3um counts are still above the minor alarm level but getting better.
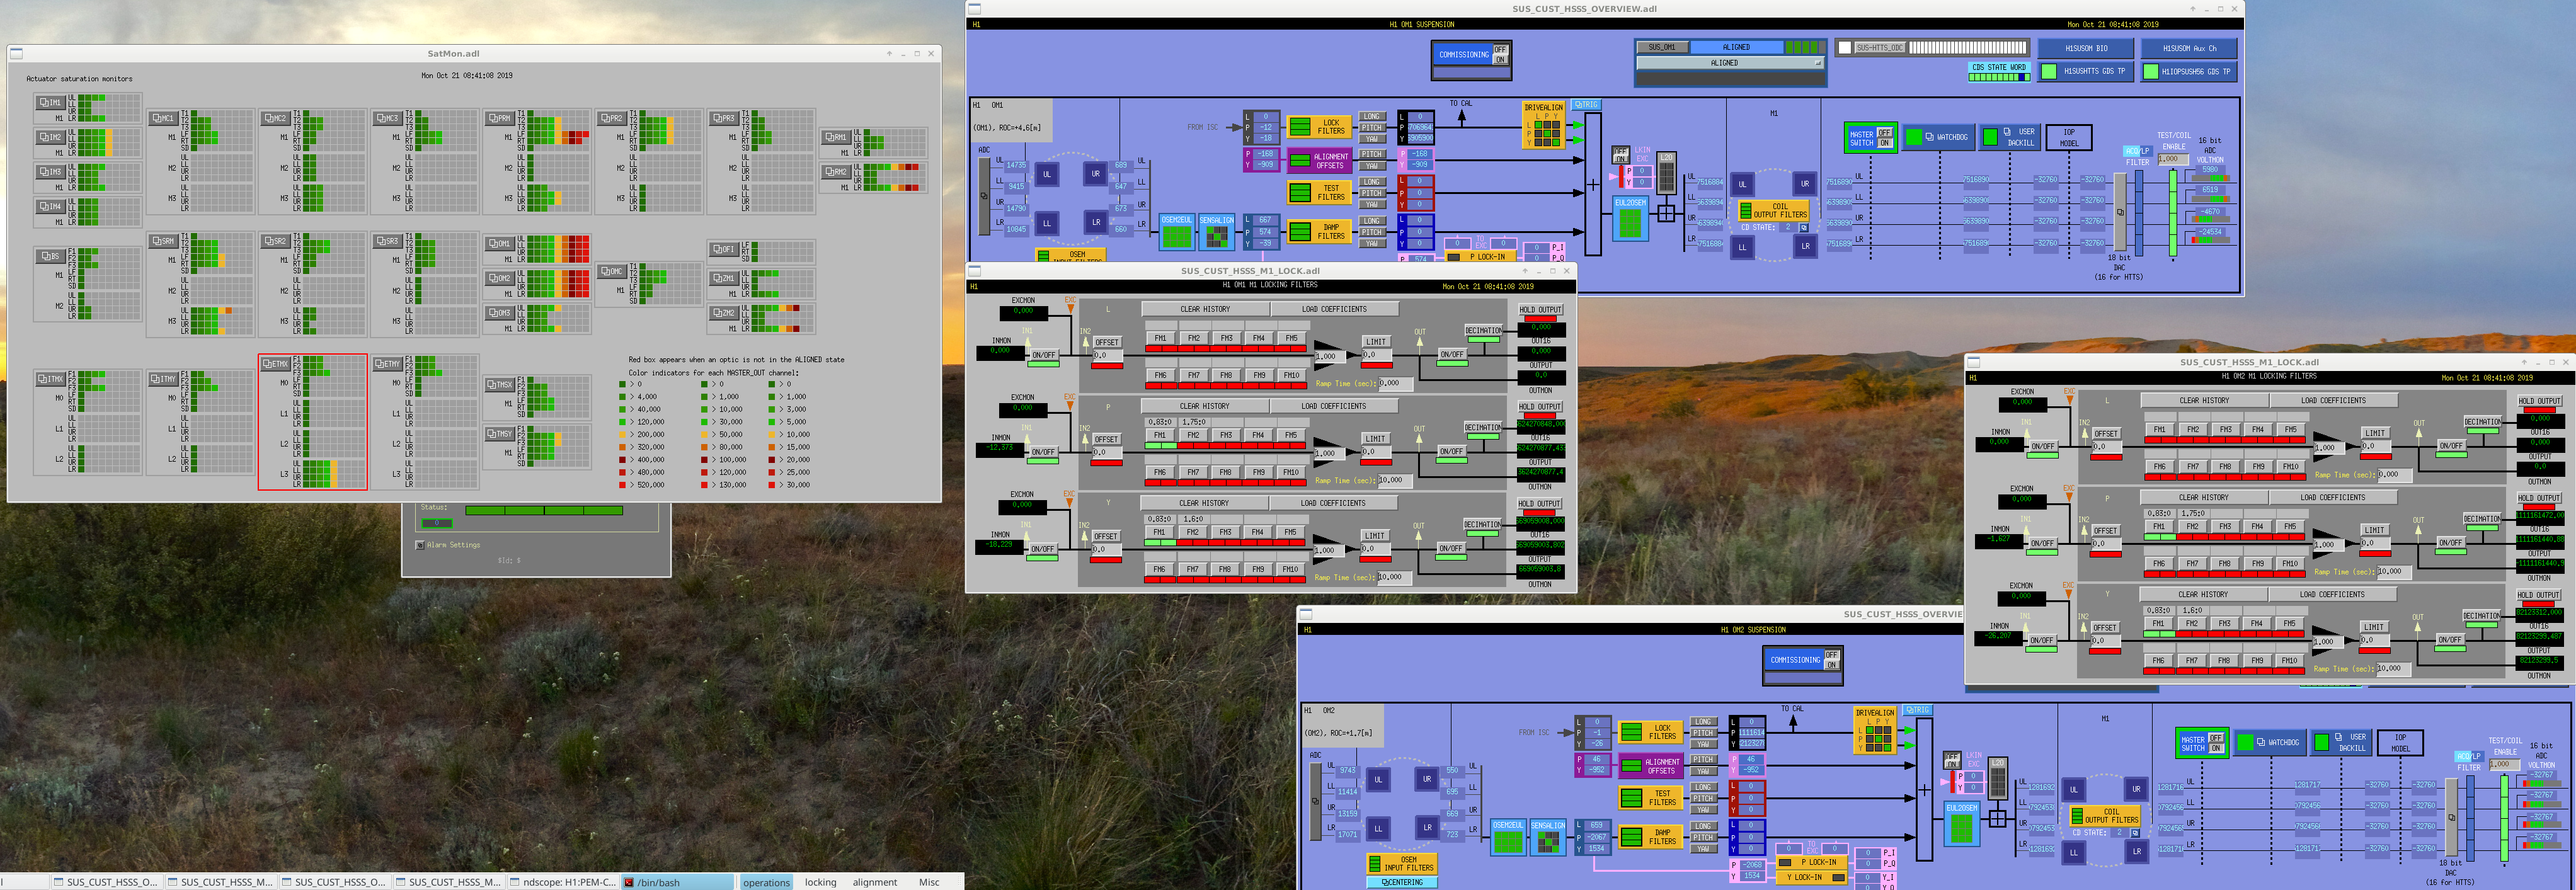
Both OM1 & OM2 have their LOCK FILTERS outputs for Pit & Yaw filter banks saturated (over 100million for both, see attached). Clearing Histories did not address them.
TITLE: 10/21 Day Shift: 15:00-23:00 UTC (08:00-16:00 PST), all times posted in UTC
STATE of H1: Planned Engineering
OUTGOING OPERATOR: Niko
CURRENT ENVIRONMENT:
SEI_CONF state: TEST_SWARM
Wind: 8mph Gusts, 6mph 5min avg
Primary useism: 0.02 μm/s
Secondary useism: 0.28 μm/s
QUICK SUMMARY:
The last few days we have been struggling to find a good alignment for locking the vertex, especially SRY. We found something that worked ok a few days ago but the corner ISIs all tripped yesterday and we lost that alignment. I have been moving the input and PR2 alignment by hand for awhile trying to maximise PRMI buildups, and have eventually found something that works. SRY locks straight away now and I can go through to DRMI_WFS_OFFLOADED with no issues. The builds ups with DRMI locked are now RF18~35 and RF90~16.
Cao and I are going to work on some phase camera tests for the rest of the day. We'll need to go on ISCT1 to do some realignment quickly and to switch it off at the end of the day, but we can run the phase camera remotely now from the control room so we won't be in there long.
In https://alog.ligo-wa.caltech.edu/aLOG/index.php?callRep=52528 we took some phase camera images of the 9, 45 and carrier. We noticed the carrier looked pretty messy.
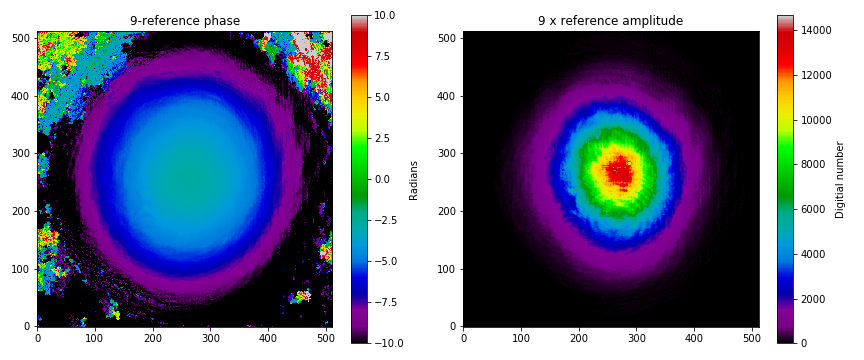
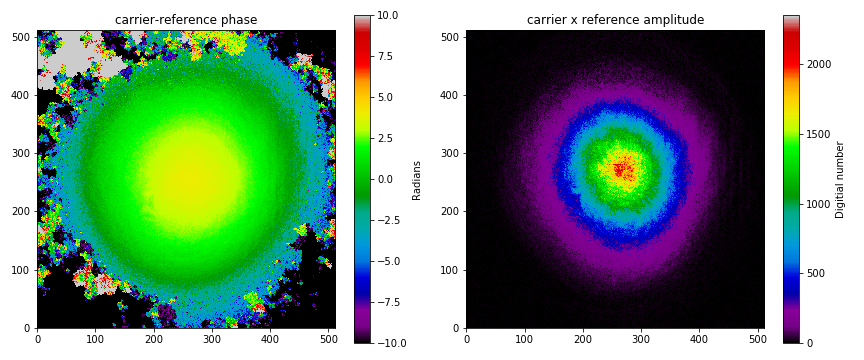
Interestingly, today after doing some realignment the carrier is looking much cleaner, attached are the 9 and carrier images. I've unwrapped the phase and adjusted the camera exposure and binning to get a better SNR on the carrier.
The last time SRMI was done at Hanford is described by Ellie in 17451 17106 16993. At that time MICH was triggered on ASAIR DC, which no longer exists, and the signal hadn't been replaced in the LSC model.
I added an IPC to the ASC model for AS_C NSUM, and in the LSC model normalized this signal by the PSL power normalization (which isn't done in the ASC model), and replaced ASAIR in the trigger matrix, the power normalization matrix, and the input matrix with this signal. I also changed the name of this rown in the matrix dictonaries for the trigger matrix and the input matrix in ISC_library. Dave did the restarts and DAQ restarts yesterday.
SRMI:
Craig, Cao, Varun, and I added two states for SRMI to the DRMI guardian, PREP_SRMI and LOCK_SRMI, although we haven't found settings that work these set up the servo filters, input matrix and trigger. I had another look today at the signals while SRMI is flashing, but the alignment was not good, and it seems as though we have some kind of a clipping problem. Checking that we are not clipping in the SRC becomes much easier once we can align the ITMs to the arms.
Cao, Dan,
Today we have been working on locking the internal FPGA clock to an external reference from LIGO. The short version of this story is using the 91 MHz provides the best lock and images from the phase camera. We are currently running the 91 MHz from the CER to ISC-R1 using one of the spare ports. We still need to properly route the cable going to ISCT1, at the moment it is just running along the floor for testing.
Slightly longer version: our phase camera demodulates at a constant 25 MHz. To image each sideband the reference must be locked with an offset of 25MHz from the sideband of interest, e.g. to image the -9 MHz the reference is offset to +16MHz. The FPGA controls the frequency locking of the reference field, to lock the frequency/phase it internally demodulates at a value like -9+25 MHz so we always lock the phase to the carrier (or another field with the large amplitude). If the FPGA's clock doesn't agree with the clock generating the 9.1MHz then they will drift and the phase will vary image to image. If so, we can't average images over a long period of time and we loose significant amounts of dynamic range in the camera. An FPGA also has a discrete number of frequencies it can pick, clock_frequency/ 2**32. For the FPGA to get *exactly* 9.100230MHz and 45.501150MHz the clock frequency has to be chosen carefully, 72MHz(8x) or 144MHz(16x) should work in theory.
We tried both 72 and 144 but the ADC max frequency is 125MHz and 72MHz seemed to slow for it to work properly. In the end 118MHz or 91MHz seemed good compromises, both resulted in very slow DC drifts in phase when imaging the 9 and 45. Over a few seconds though we did not find this was an issue. The DC phase in the phase camera image isn't that interesting anyway, it just has to stay stable enough over the averaging period. The 91MHz has the benefit that the 45 is a factor of two exactly so it locks very well, 9 drifts a bit but it is manageable.
Ideally I wanted to just be able to feed the RF from the racks straight into the FPGA for locking, however it did not like the signal and the internal PLL would not lock on to it, I'm not sure why. To get this working we had to go through a convoluted process of locking a separate dual channel signal generator to the 91 MHz, one channel for IQ mixing and the other feeding straight into the FPGA. The IQ then fed into a servo and then into the signal generators modulator port to shift the frequency of both outputs for lcoking. Our best guess is that there are some reflections when connecting the 91MHz signal straight into the FPGA which distort the signal. Driving it directly from the sig gen works fine though with the same frequency and amplitude.
Marc also asked me to mention that I am using the balun in the CER with serial number 44.
Keita, Dripta, Georgia
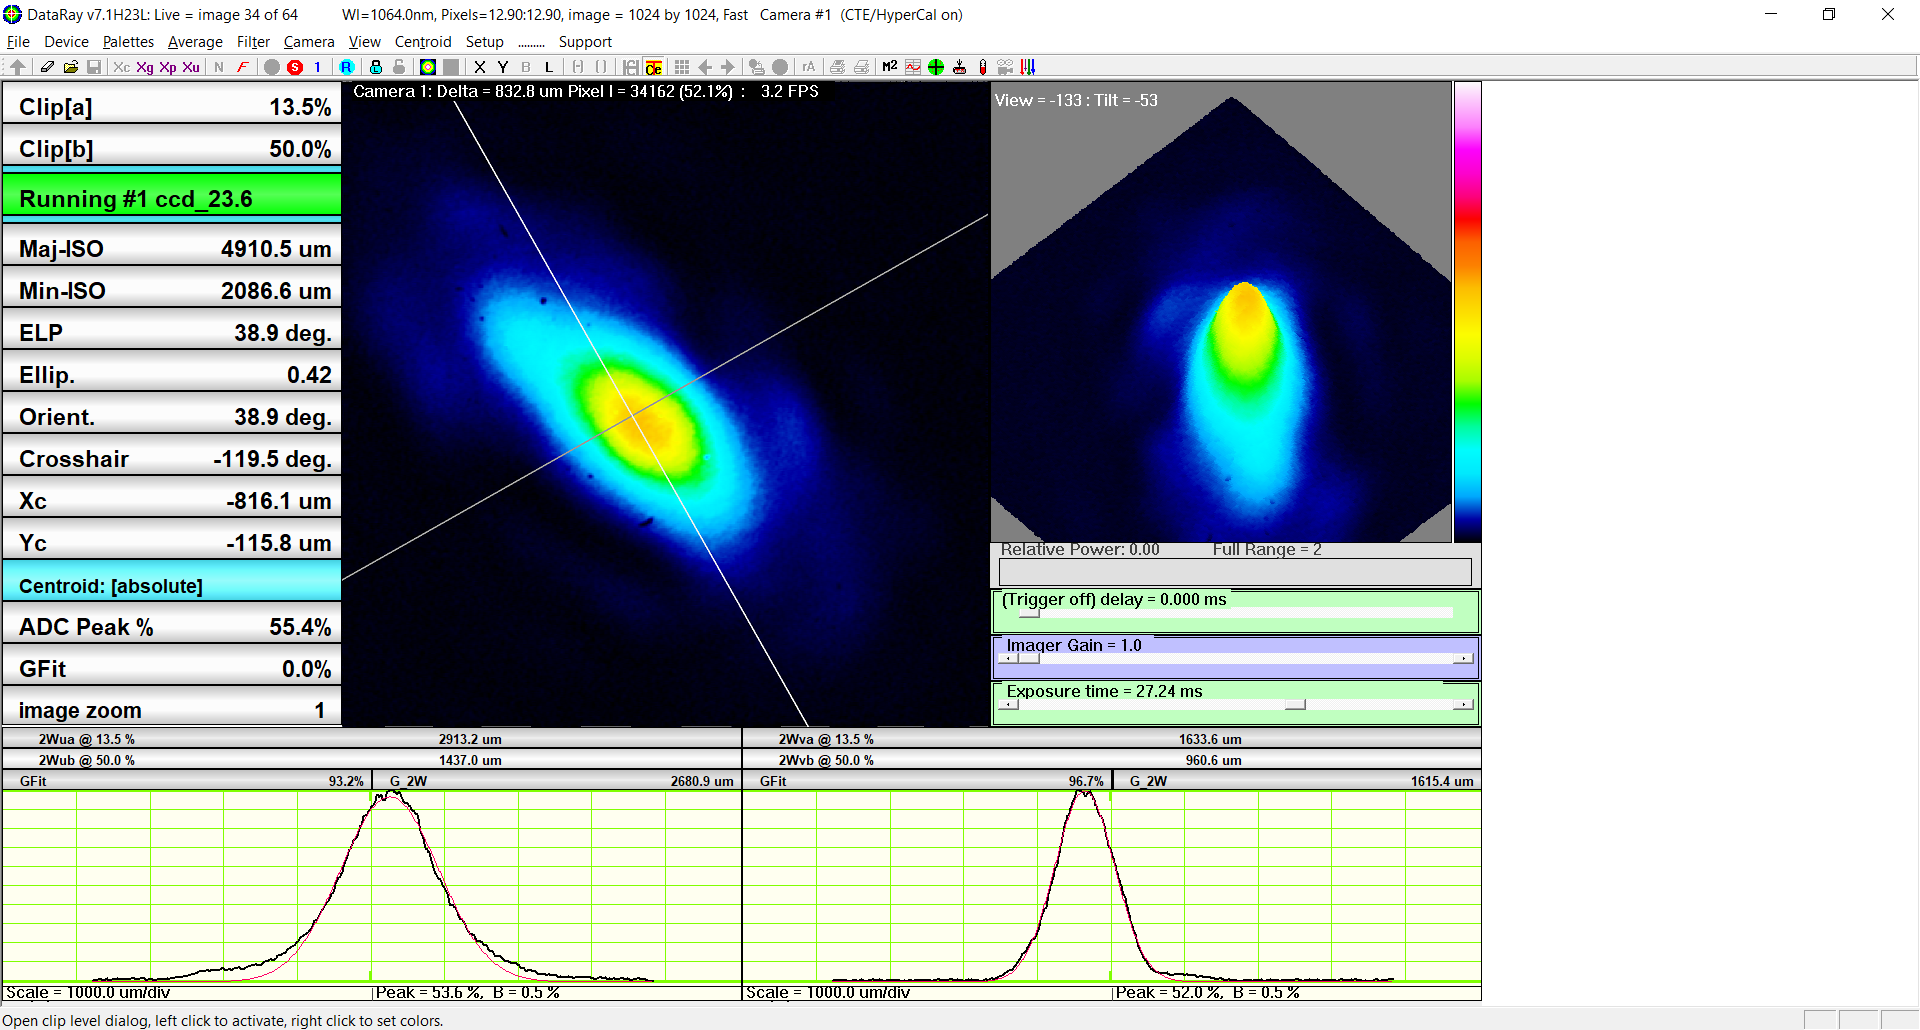
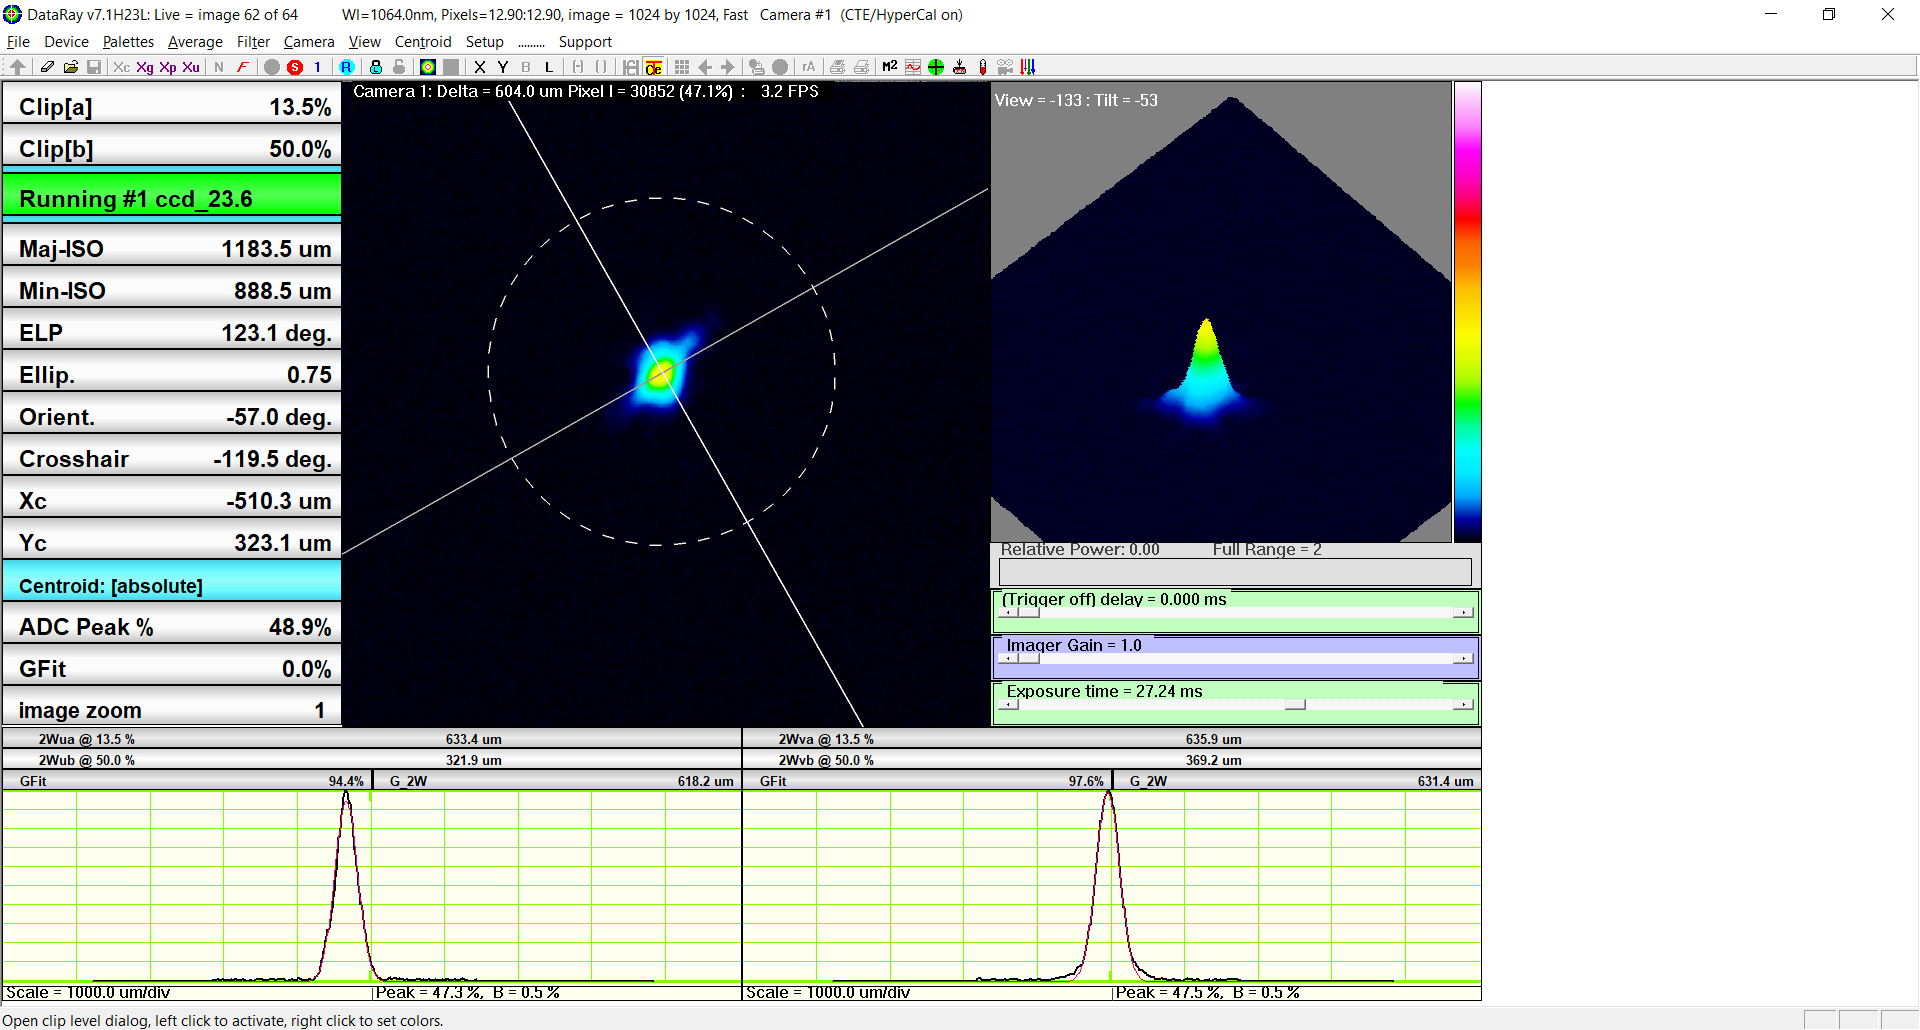
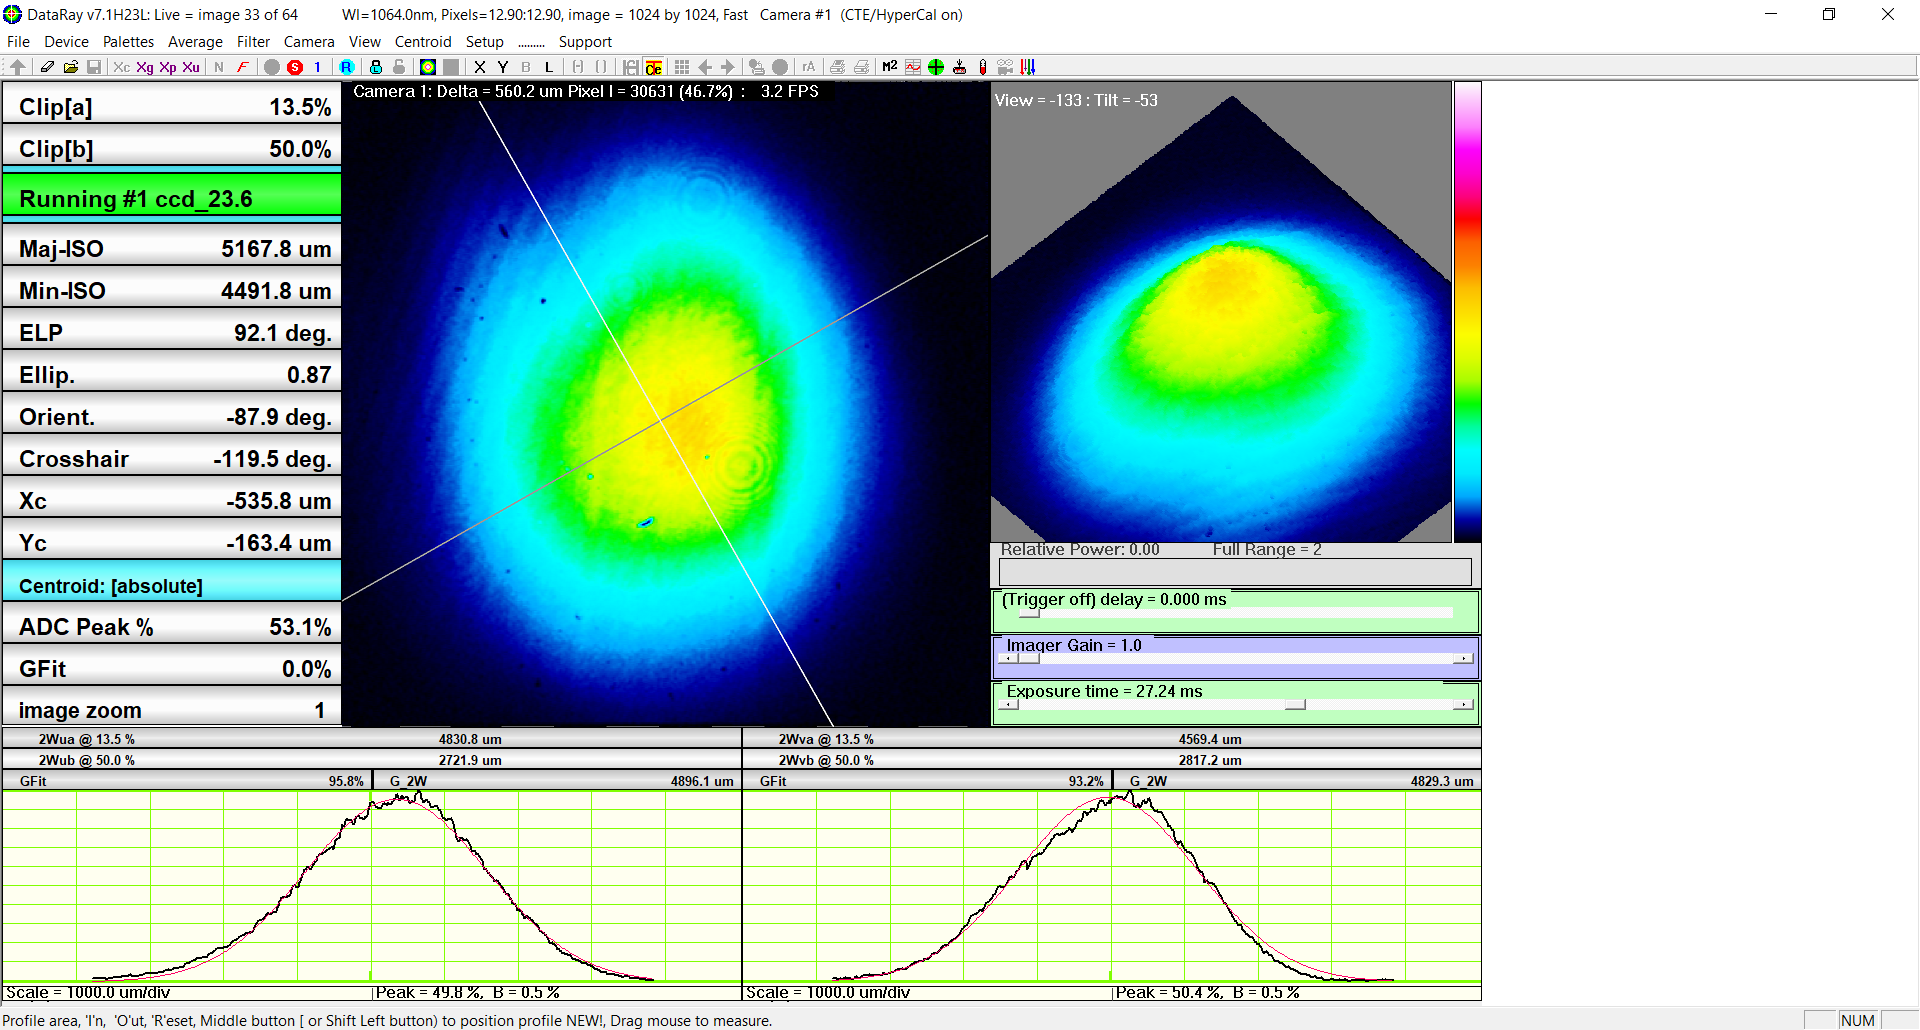
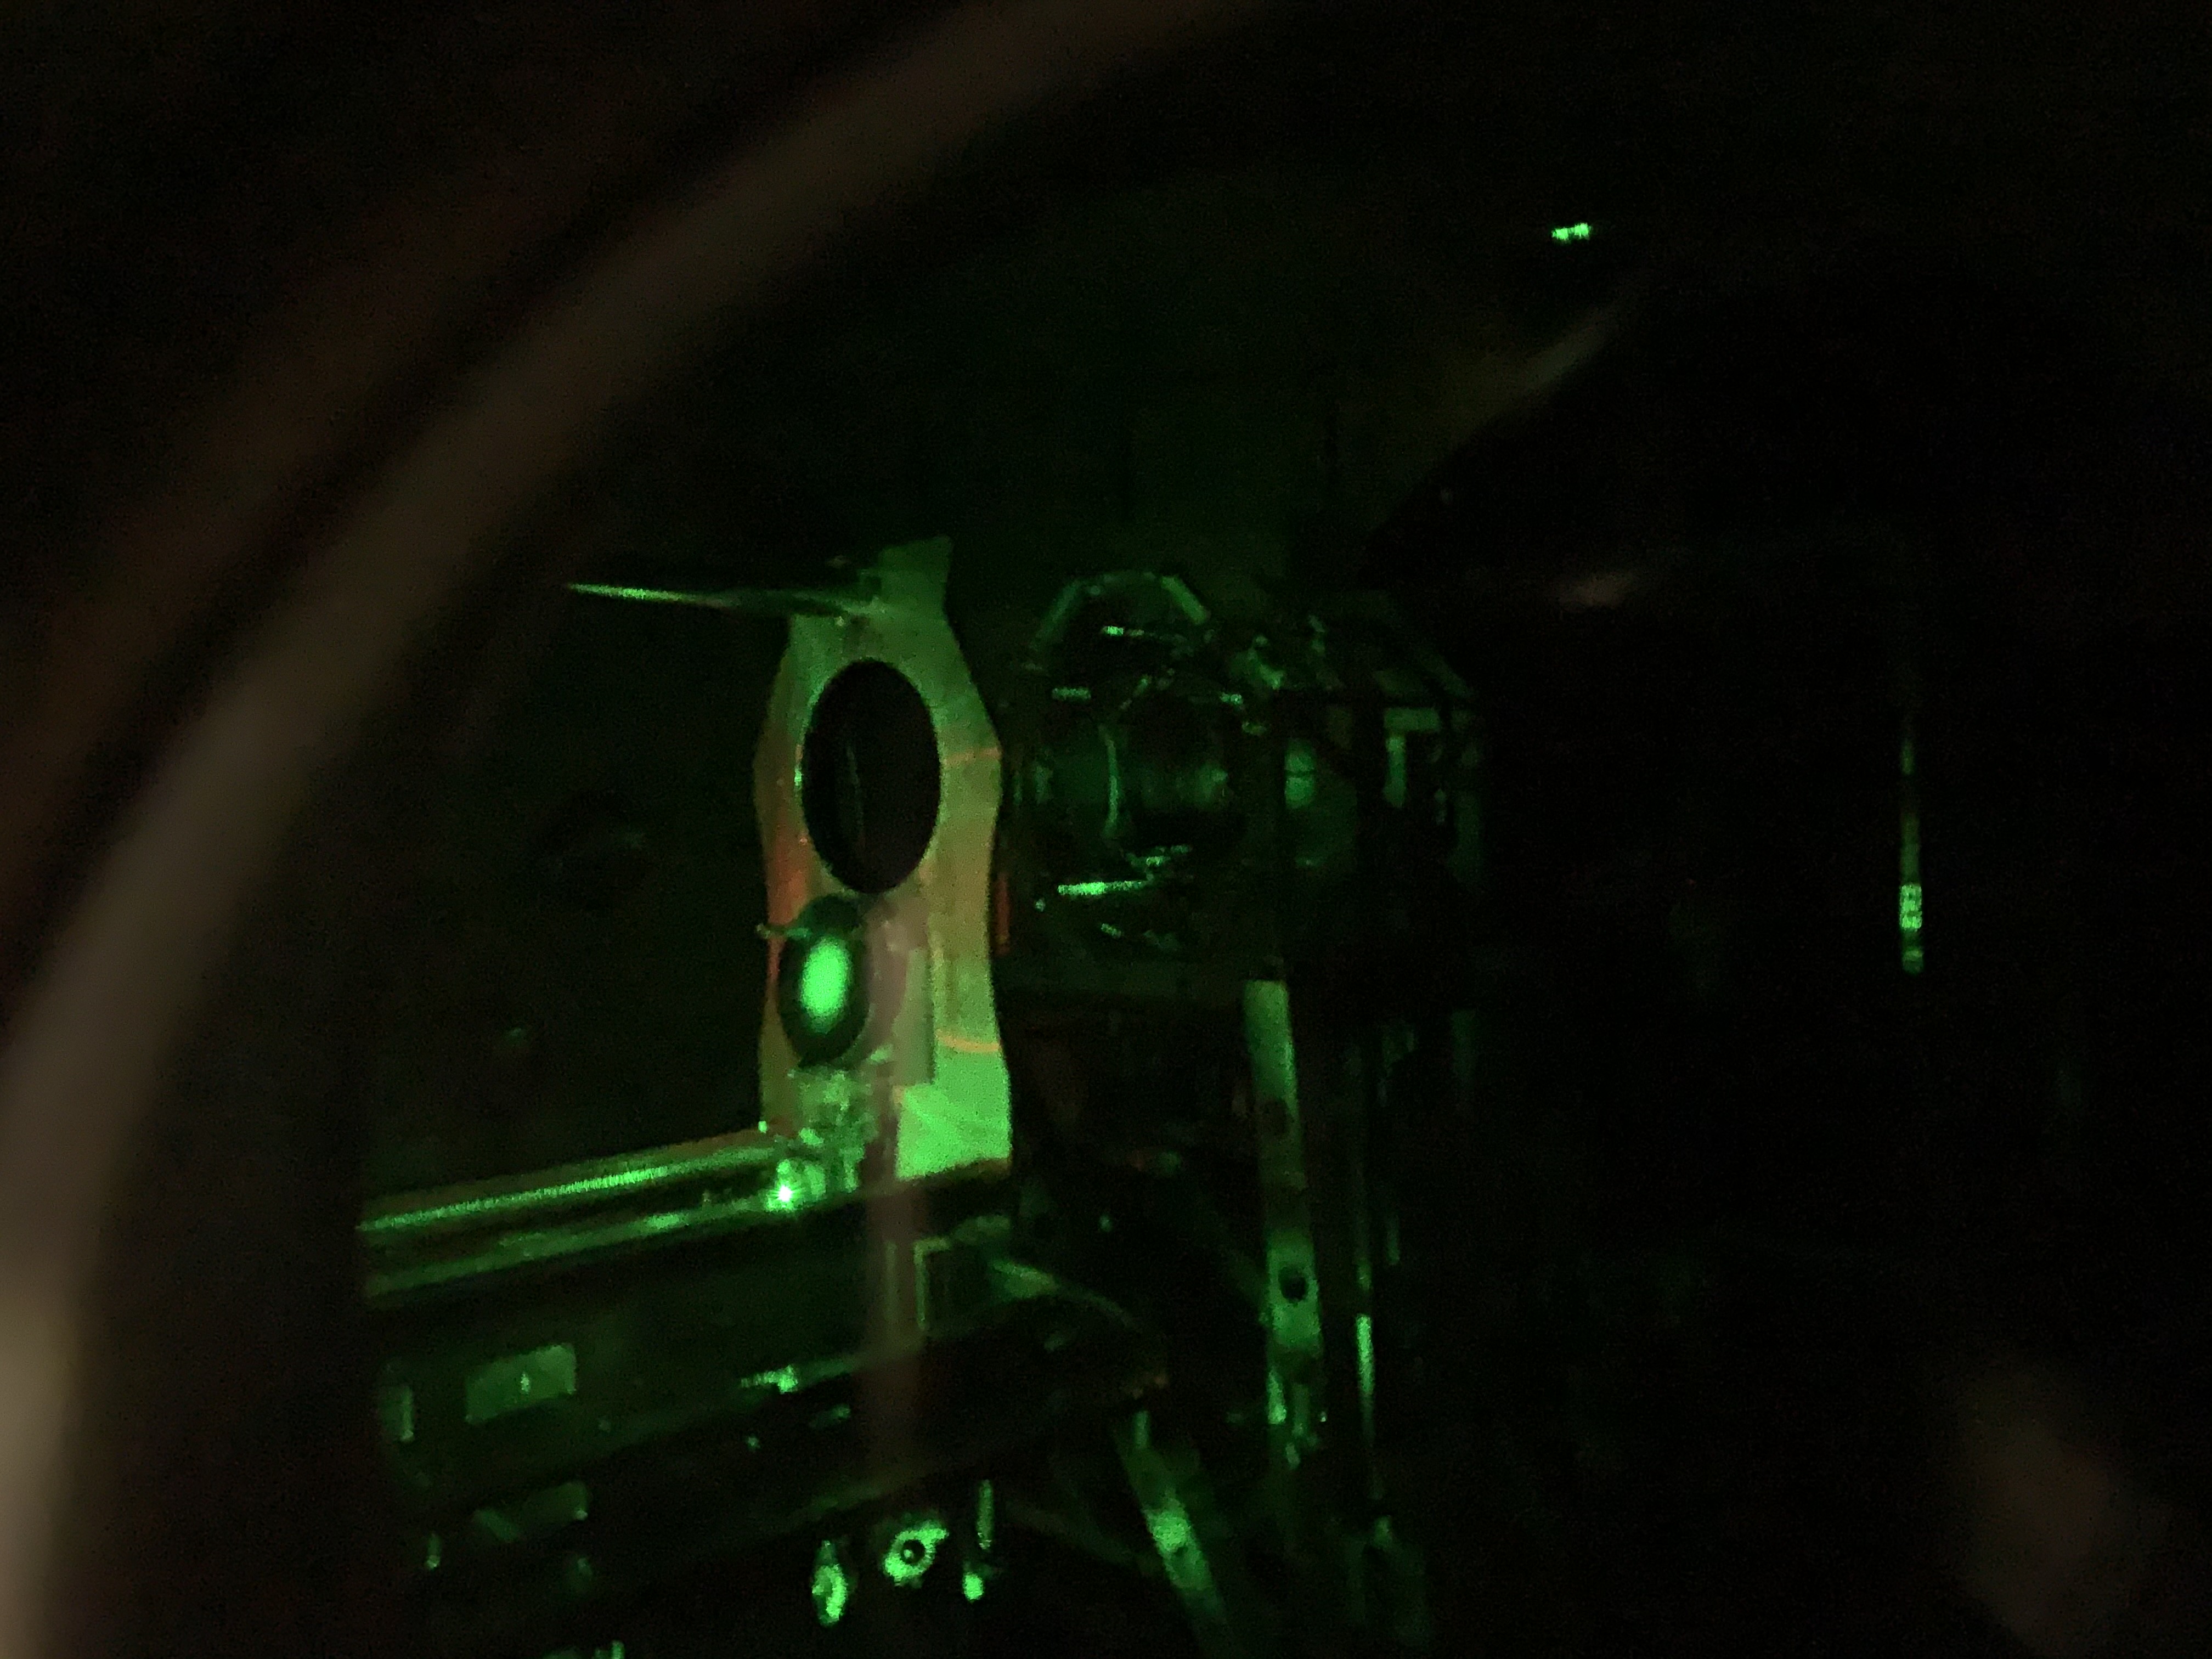
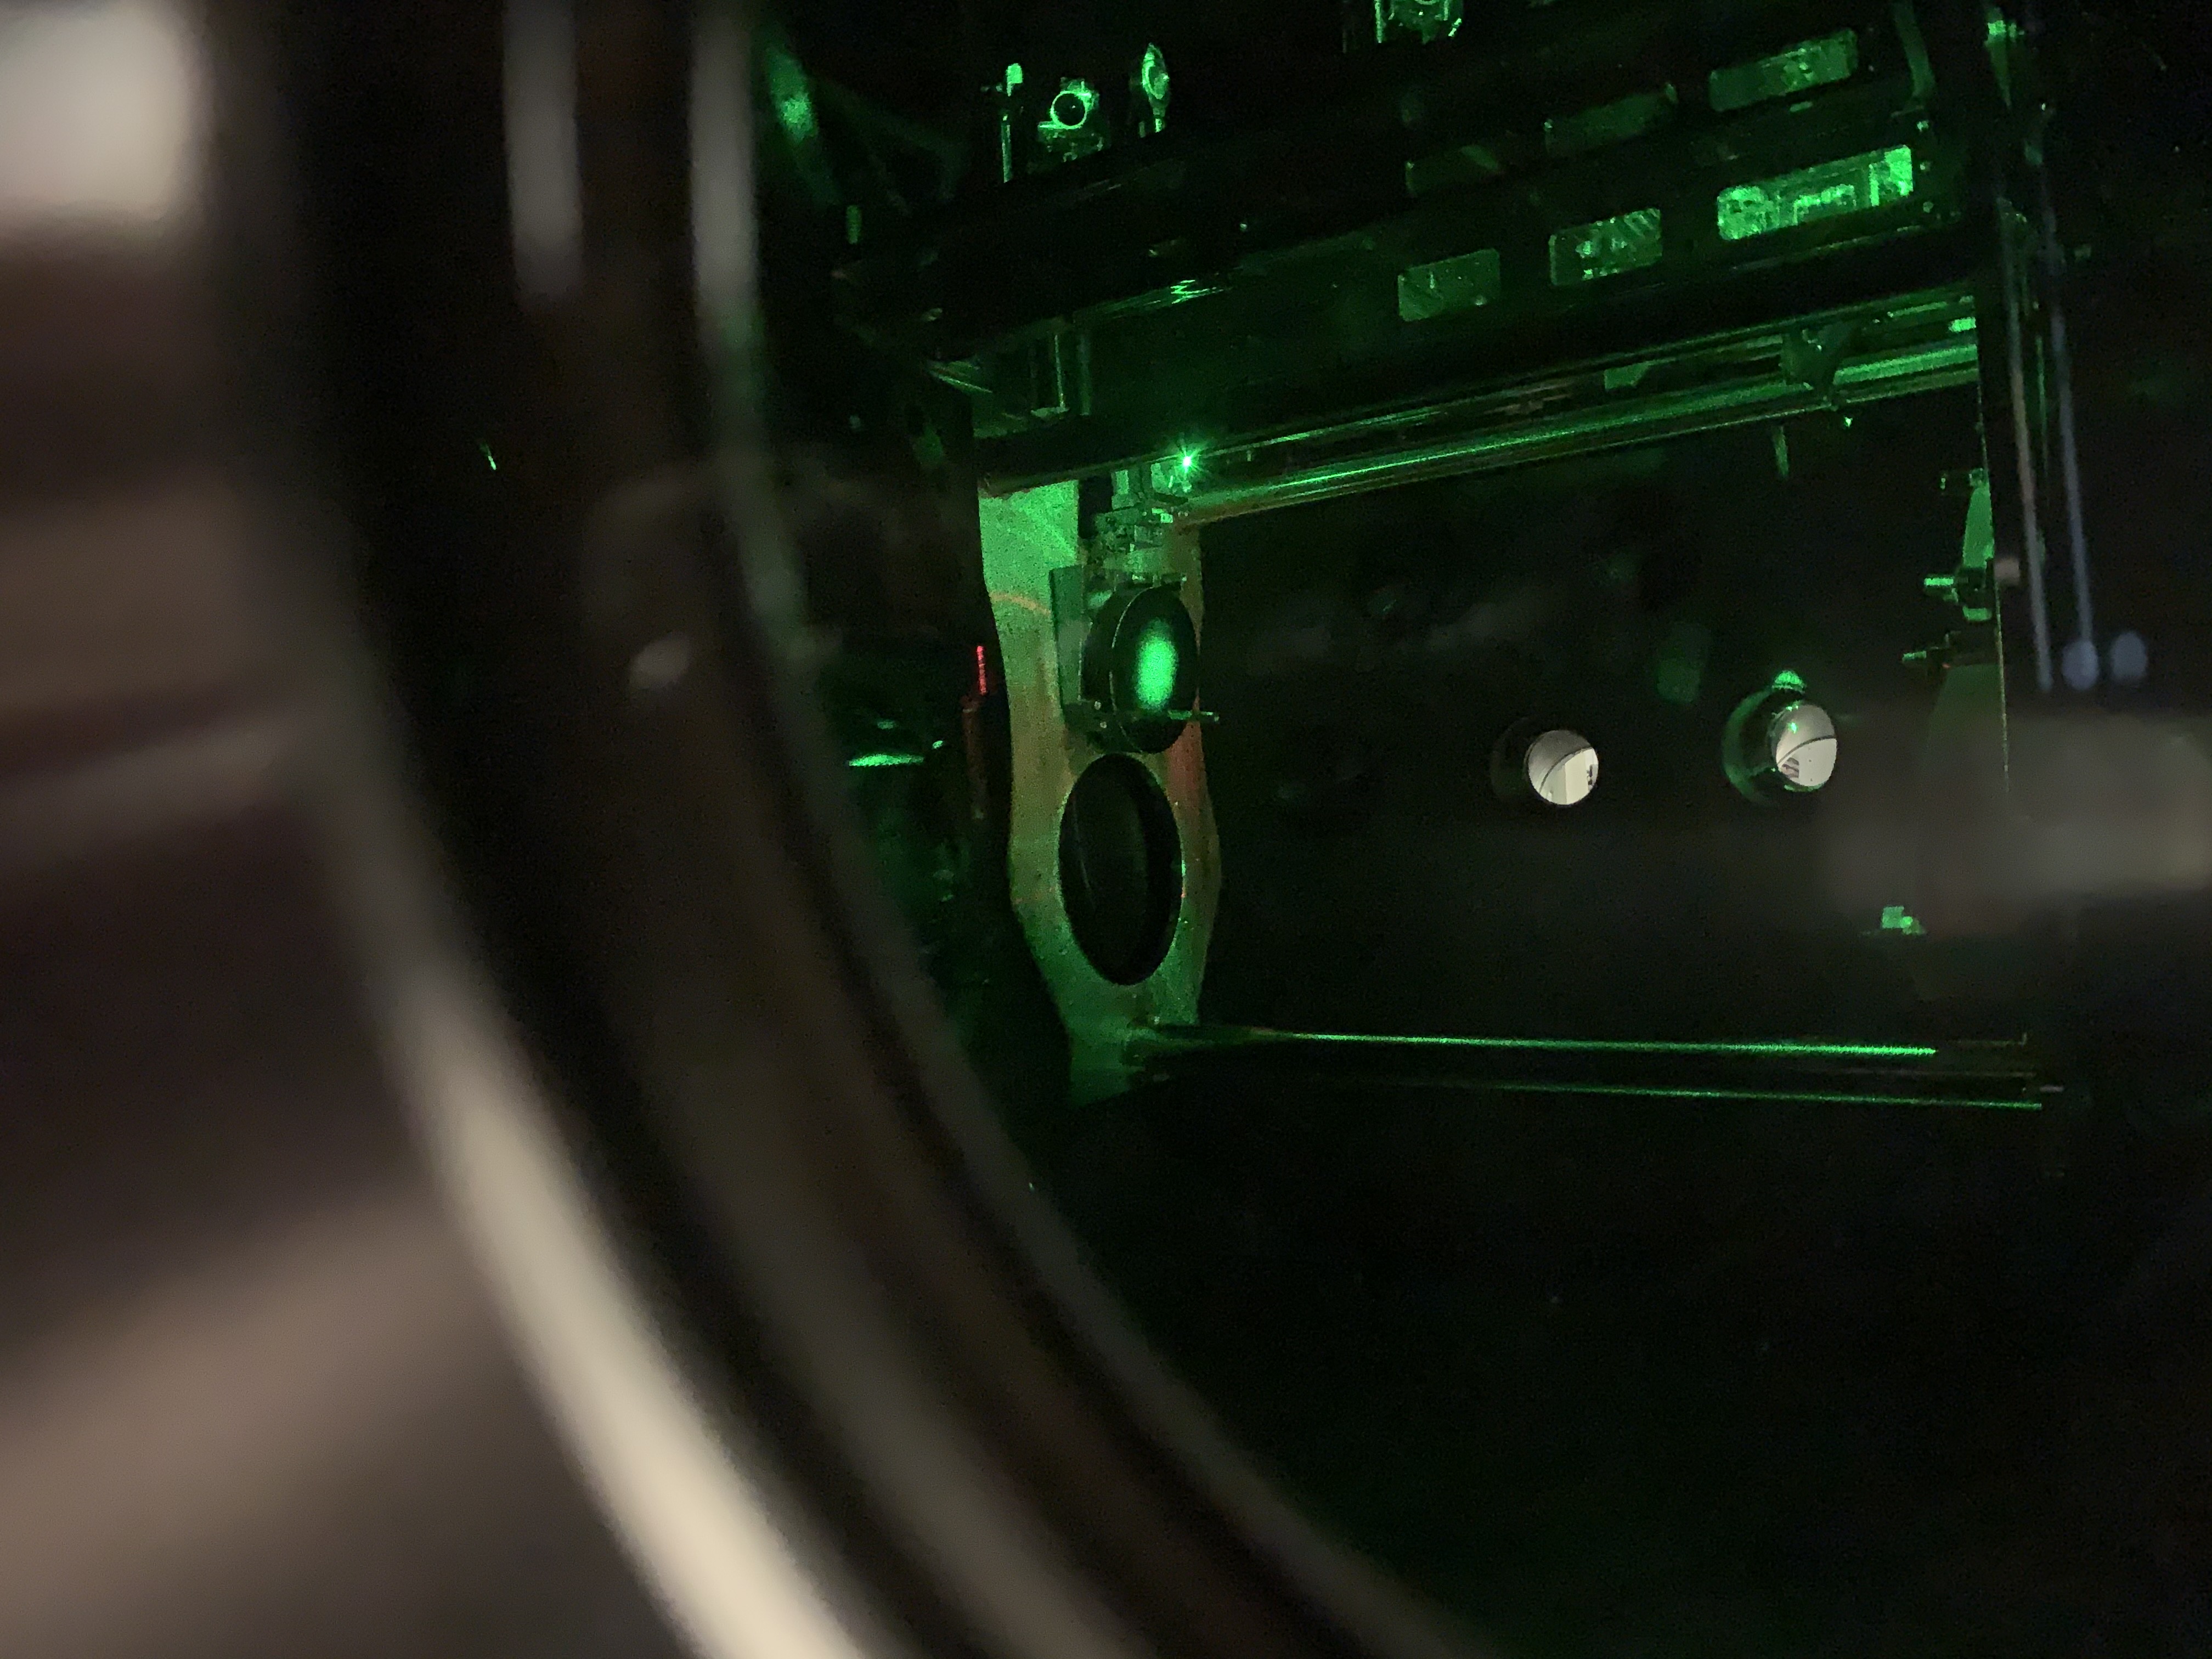
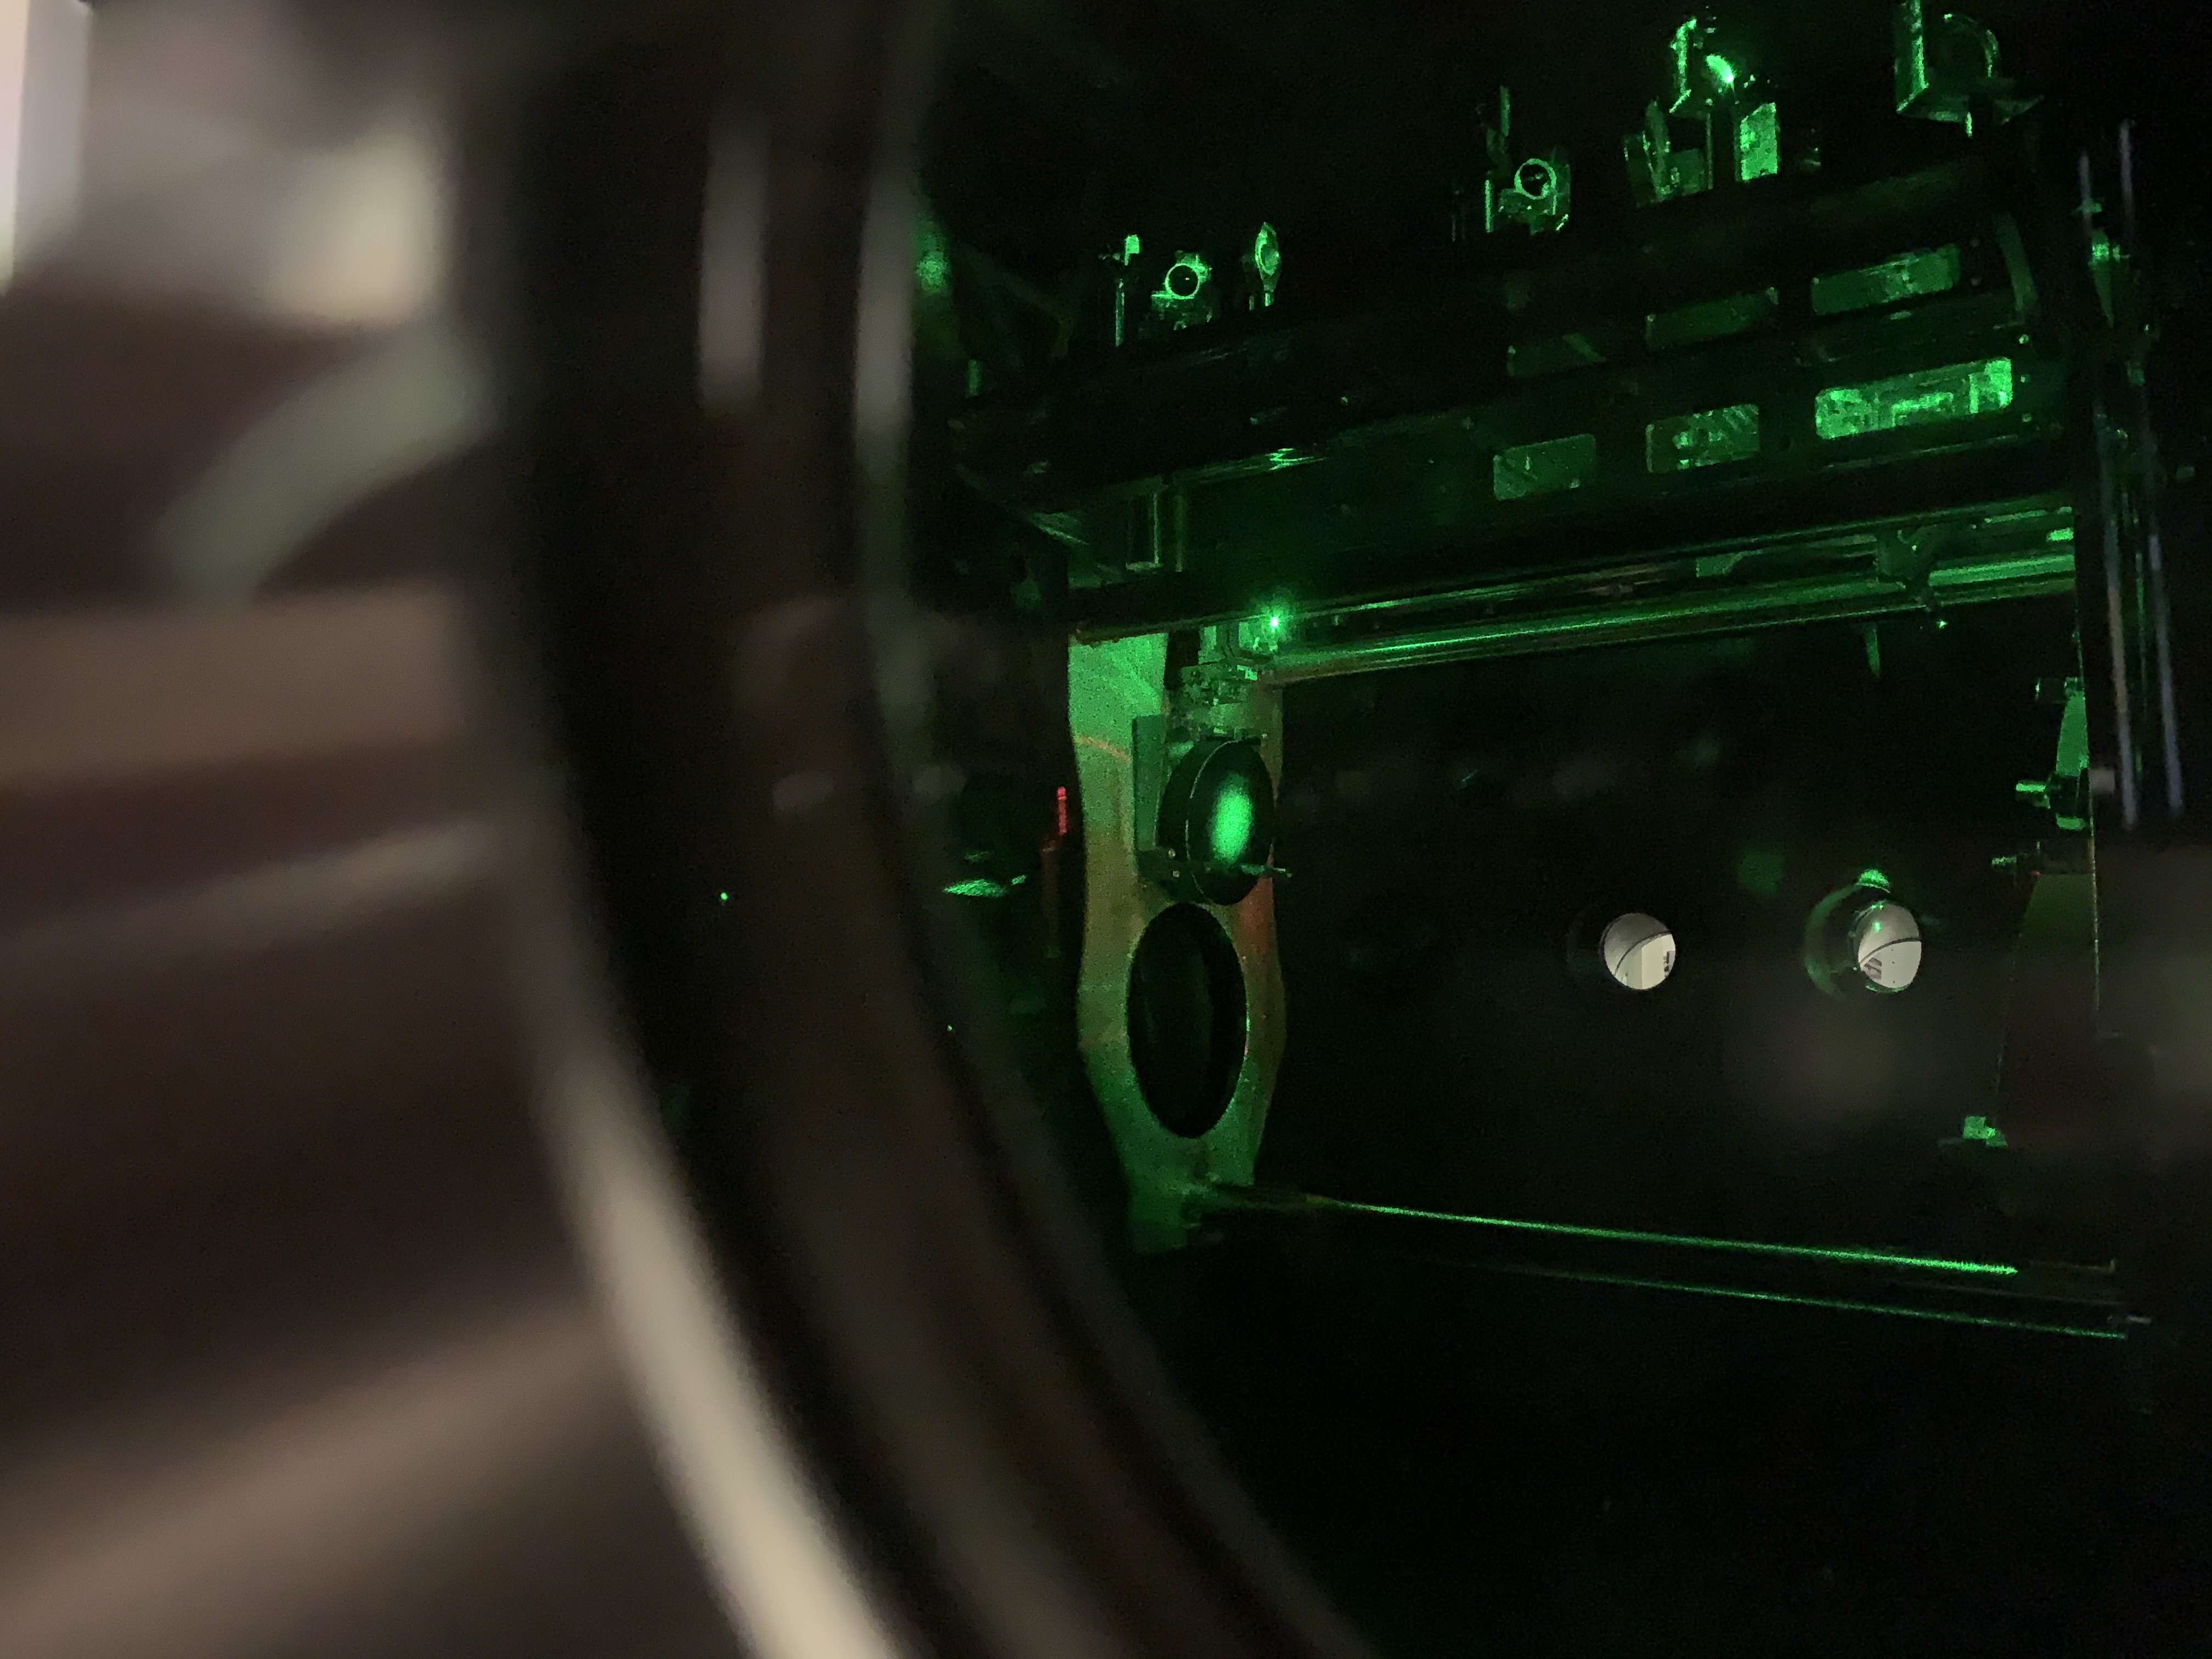
Today we continued investigating the poor mode matching of the ALS-Y green beam, following on from work eariler in the year. We took some new photos and used the wincam camera profiler to look at the beam. We haven't solved the problem but we noted that:
Next week we might monitor the profile of the reflected beam while adding offsets to the QPD servo, which will change the beam position on the transmon optics, to see if there is some clipping.
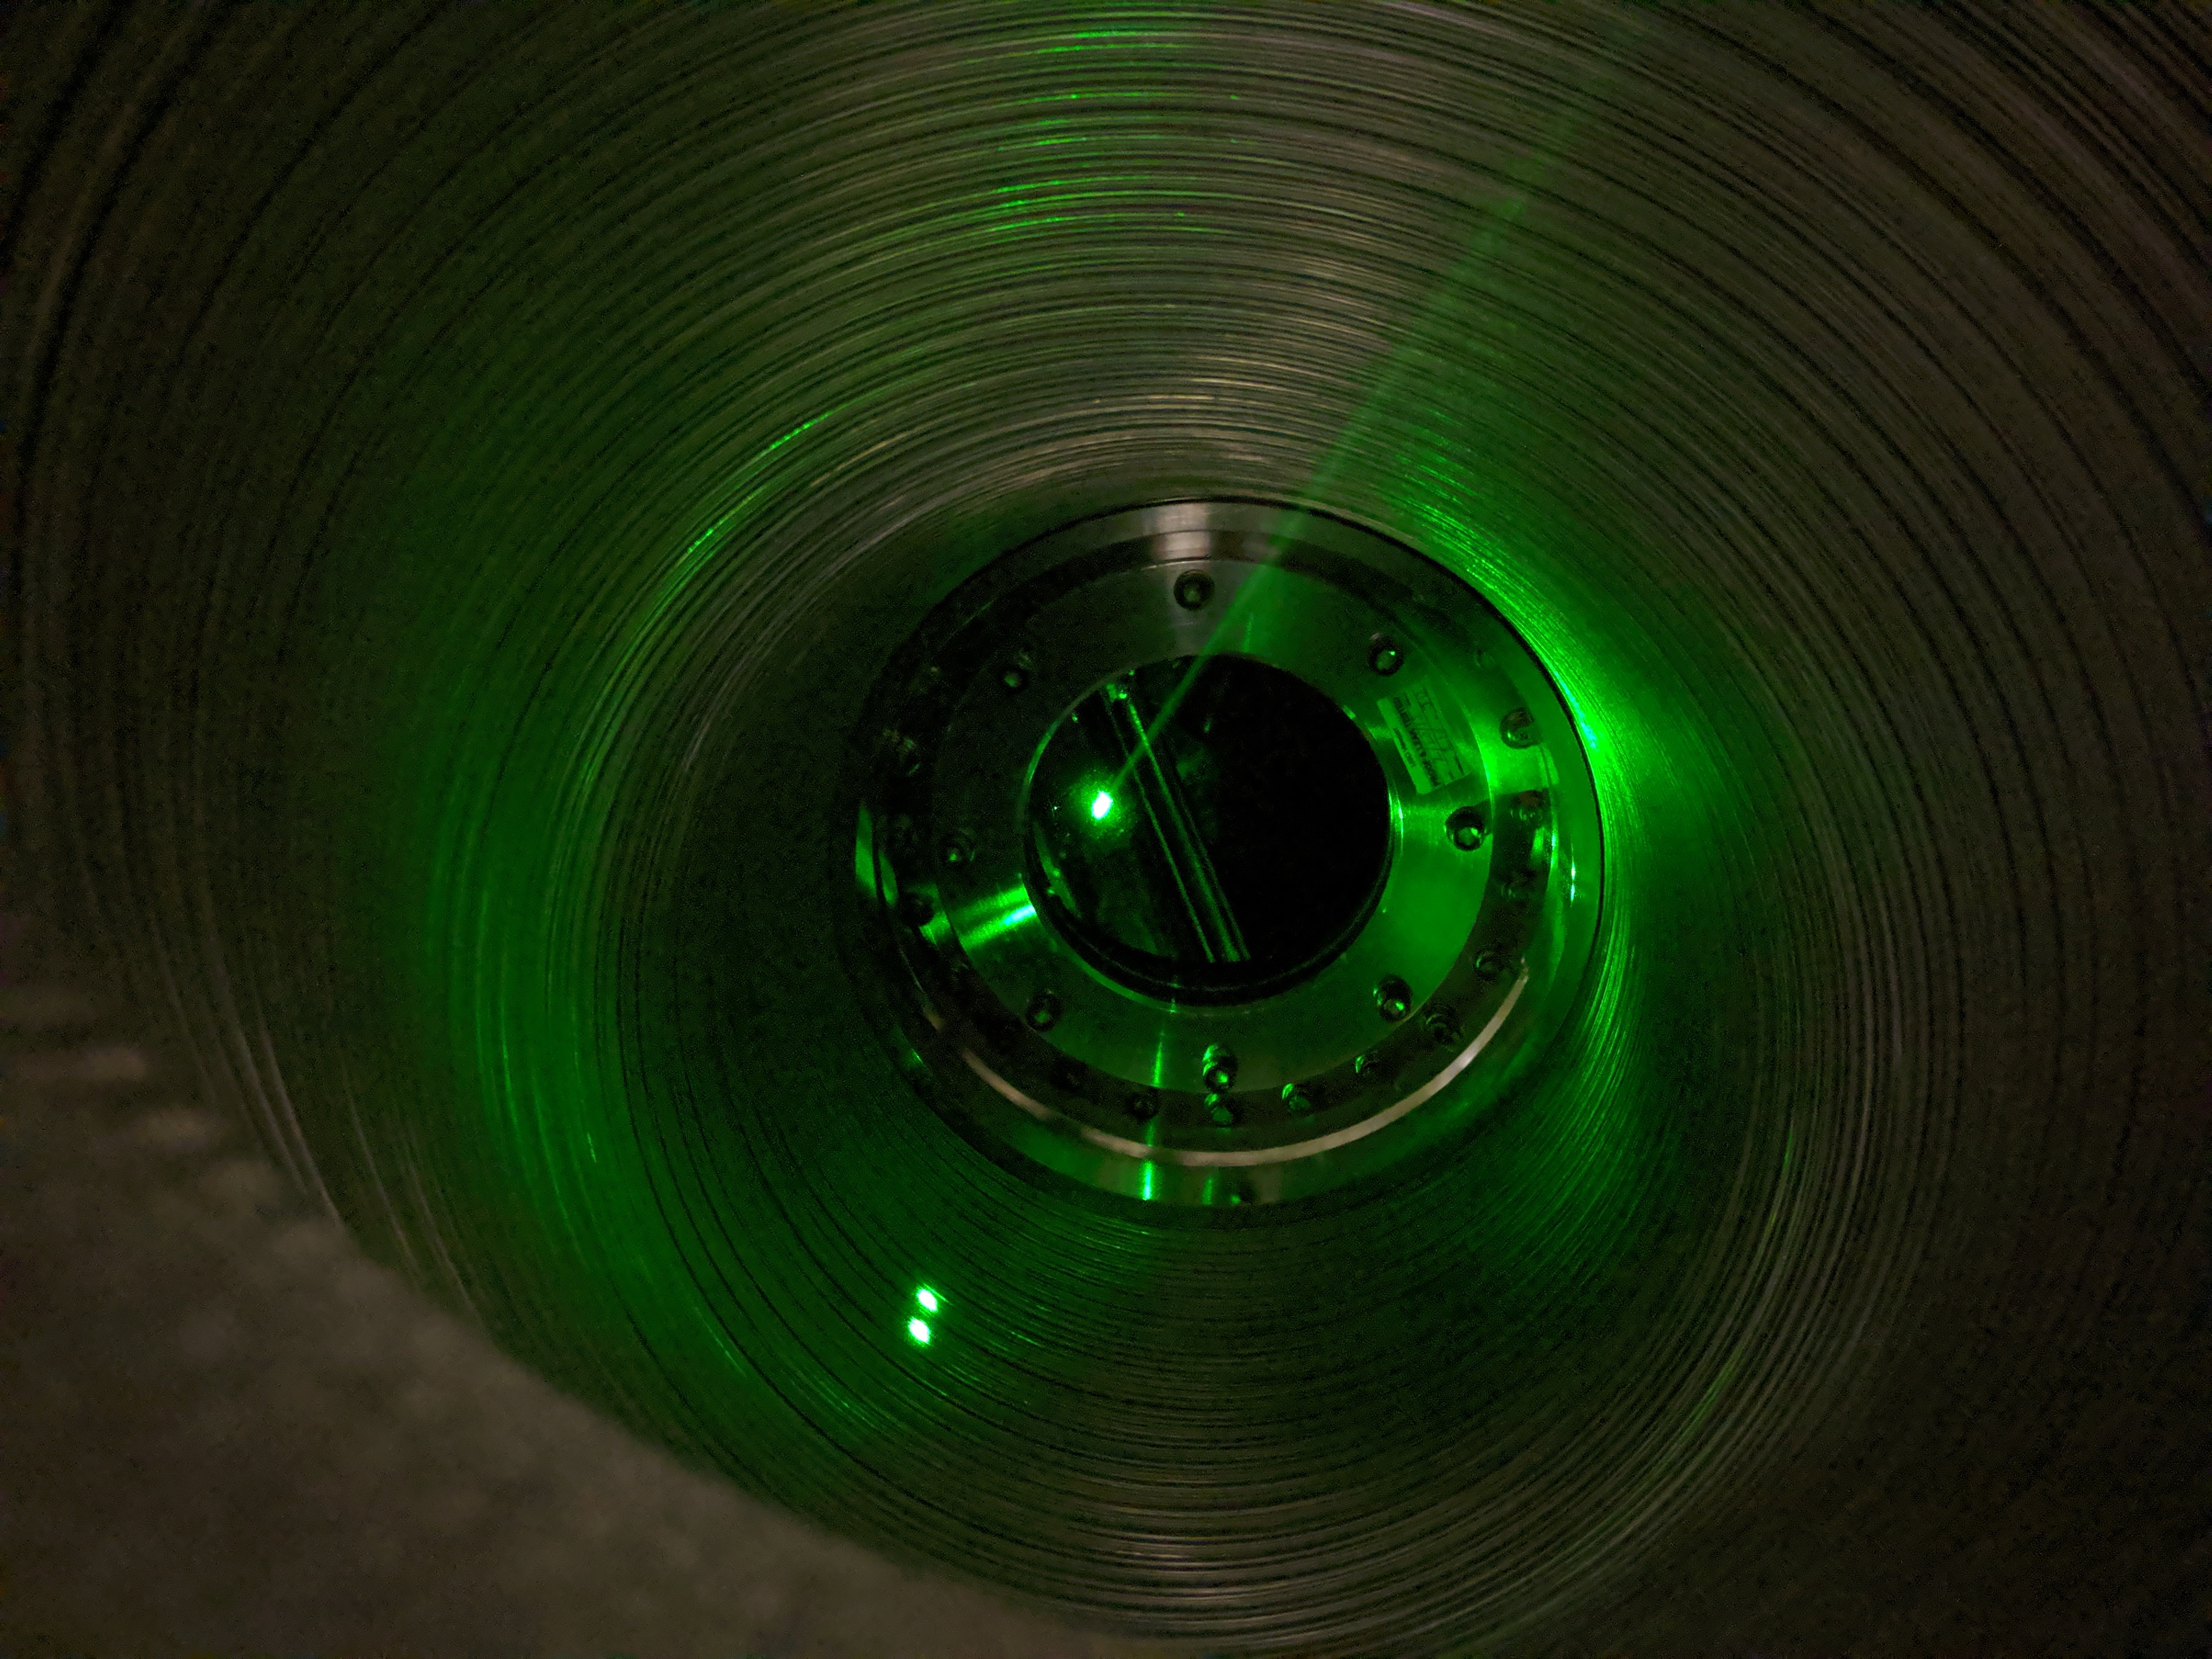
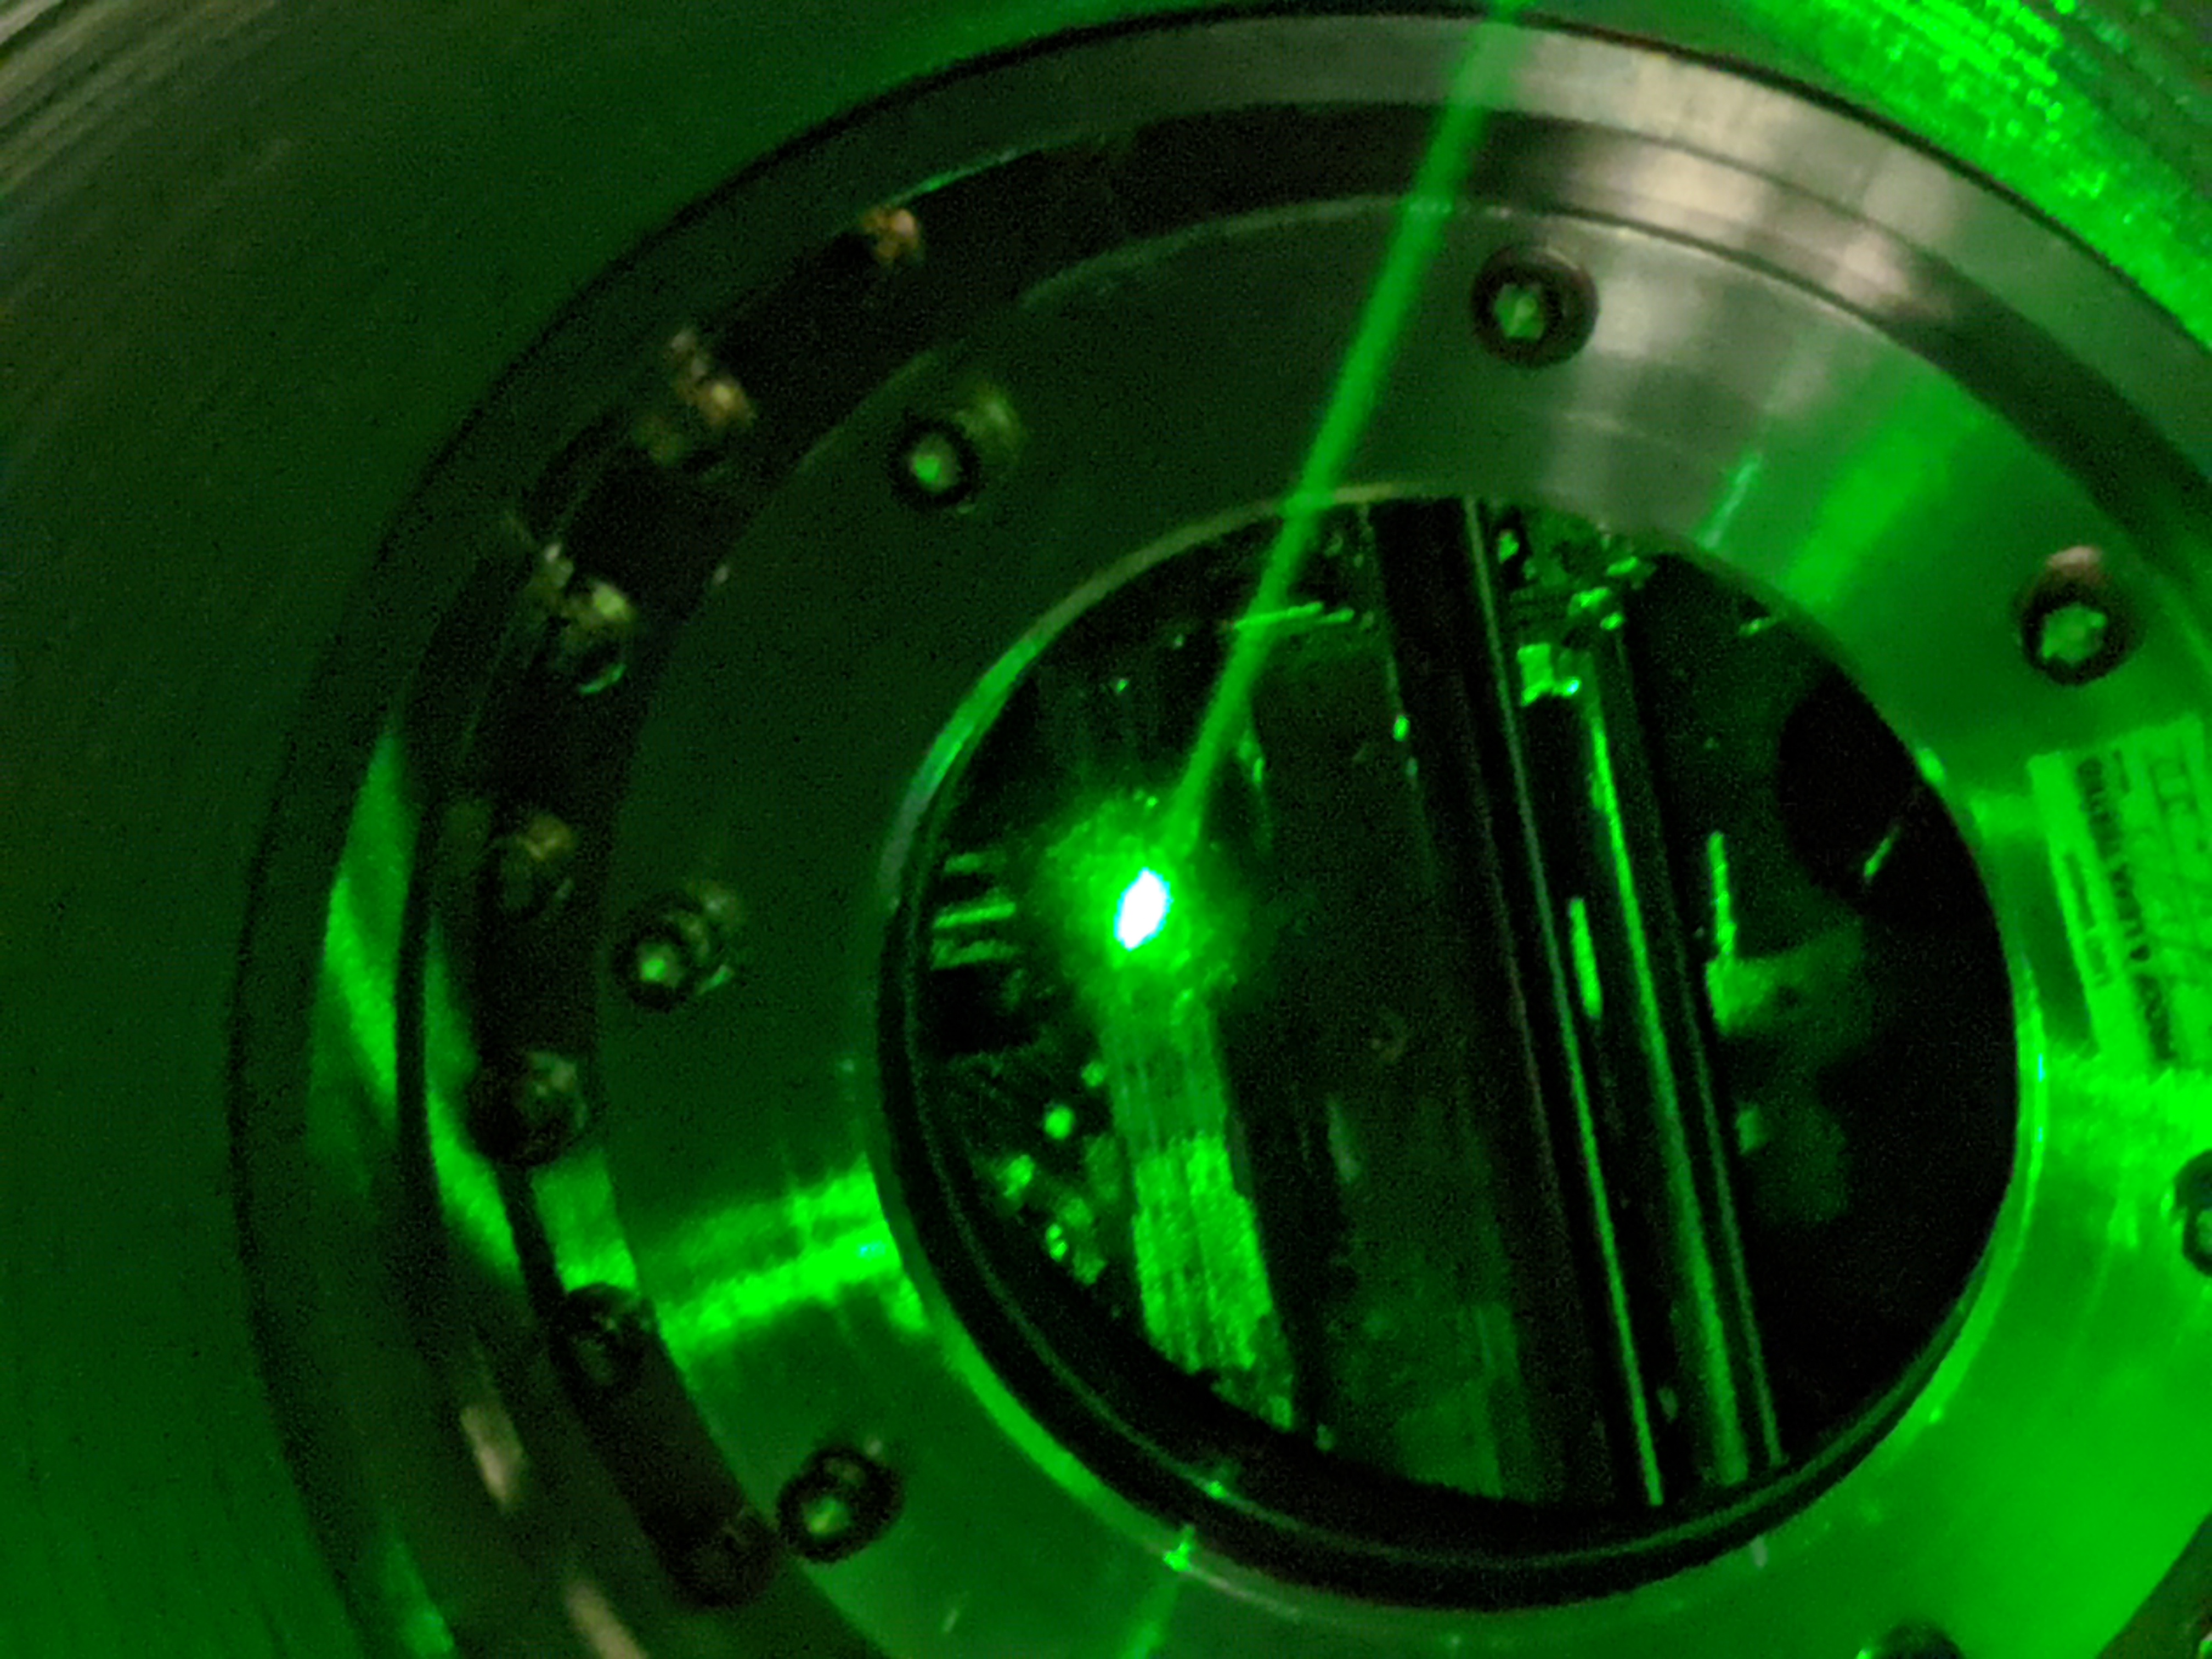
1. Viewport beam spot position
1st and 2nd picture show the beam position on the viewport. In the first picture you can also see the two AR ghost beams hitting the inside of the duct material.
That the beam is close to the edge of the viewport will NOT affect the polarization but could affect the beam shape as the edge of the viewport is not really flat and could act as an irregular lens. We don't know how much the effect is at the current beam position, though.
(In the past, Pcal team found that excessive amount of aberration observed in ITM pictures taken with large aperture telescope (see e.g. the last page of https://alog.ligo-wa.caltech.edu/aLOG/uploads/35327_20170404172516_IrLowPower_reduced.pdf for example) is not observed in their tests outside of the vacuum chamber, and that it is mitigated/eliminated by simply limiting the input aperture of the telescope, which means that the viewport surface is not flat at the edge.)
2. In-chamber TMS optics spot position
See this one VID_20191018_170216.mp4 on G1902047 showing the primary (big mirror at the bottom) and a flat mirror above the primary. Centering on flat mirrors doesn't matter that much. Anyway, it may be a bit low on the primary but I don't call this bad.
3. Green Polarization
It's only a minor problem for capturing the beam shape of the return beam (and a minor problem for ALS in general), and the first picture of Georgia's entry is entirely valid, but it might be somewhat interesting to think about the cause of wrong polarization.
When we placed a HWP upstream of ALS-M11 in D1400241 to minimize the transmission of the incoming beam on ALS-M11 (i.e. wrong polarization), the brightness of the return beam (i.e. coming back from the chamber) transmitted through ALS-M11 was still much brighter than that of the wrong-polarization incoming beam (and it didn't change much when we rotated the HWP because ALS-M11 is a PBS and we're not changing the polarization of the beam going into the chamber, just the power).
That the return beam in wrong polarization is brighter than the input beam in the wrong pol cannot be explained by geometric rotation of the polarization axes alone. If it's just geometric rotation, what is sent in comes back with the exact same polarization because ETM is retroreflecting and the return beam exactly follows the incoming path, cancelling the rotation effect.
It could however be explained by a combination of geometric rotation and polarization-dependent optics in chamber. For example dichroic mirrors are spec'ed for green S but not P (see e.g. E1000669). Green BSs seem to be spec'ed for P and S (e.g. E1000870), but no test data is supplied for P. Even though the ALS periscope on the ISCTEY (and ISCTEX) is designed to elliminate the geometric rotation such that S pol on ICST stays S pol on TMS, it cannot be perfect.
Attached are the pictures Dripta took of the transmon viewed from the camera viewport. There is a lot of scattered green light.
From alog 51458 we know that the 00 mode is only about 70% of the total power.
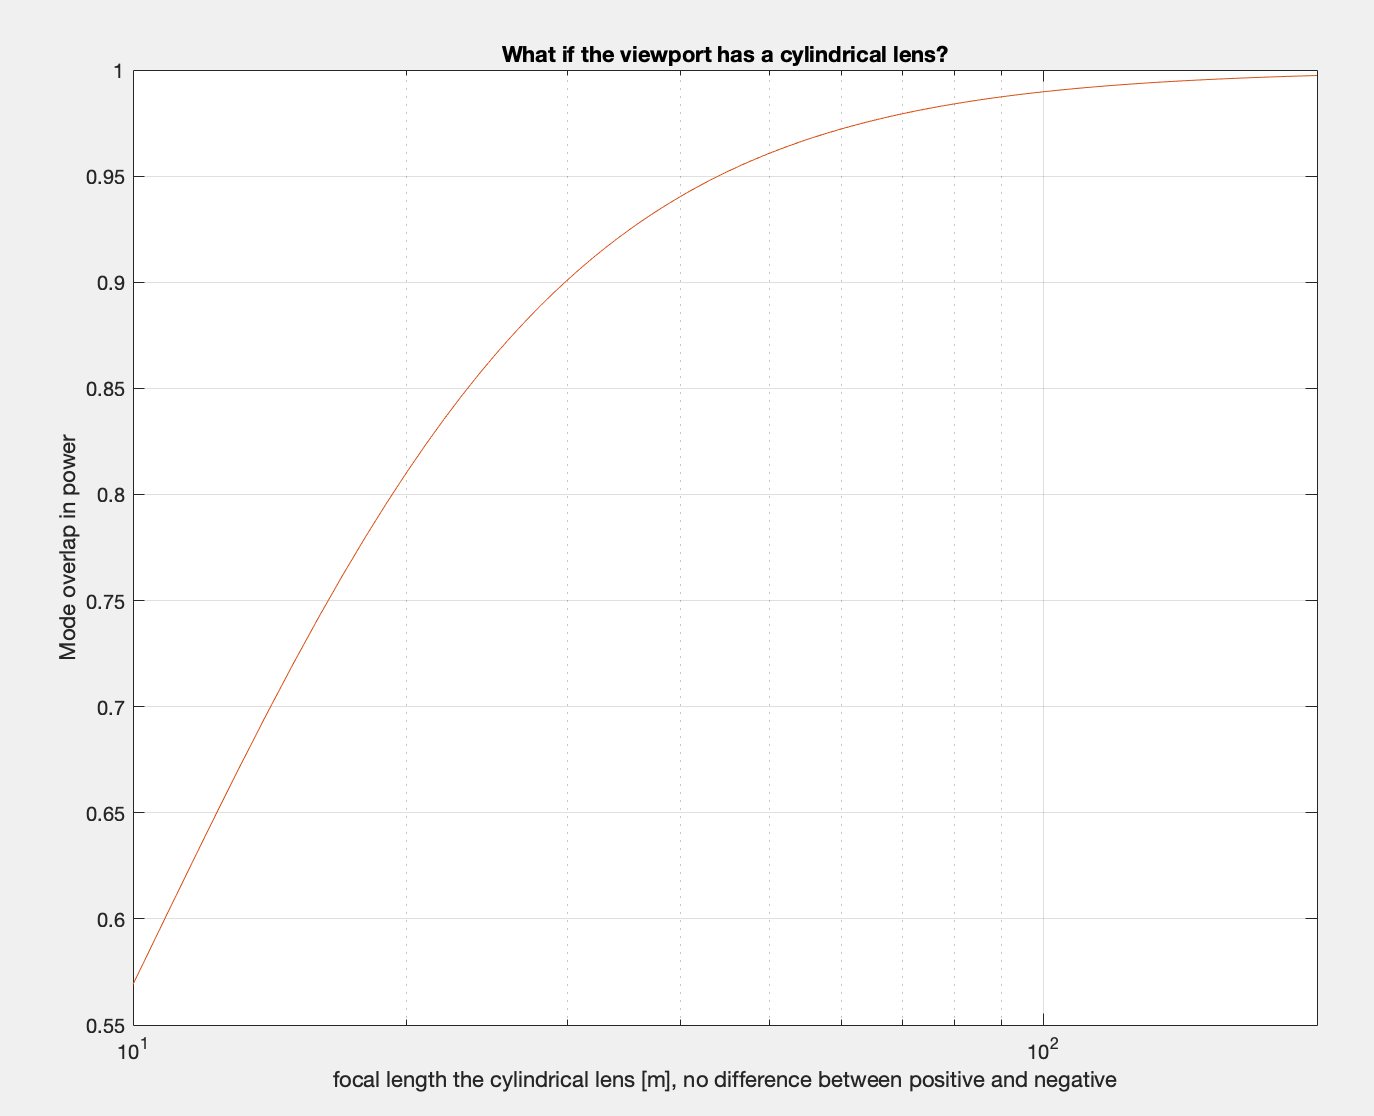
If we want to explain this using some kind of weird lensing on ISCTEY of on the viewport, the lensing needs to be large. Just to have some understanding of how large, here's a calculation of the effect of the elliptic lensing of the viewport.
I assumed that the lens is cylindrical so the mode shape is only altered in one direction, and plotted the mode overlap of the lensed beam and an ideal beam in power, not amplitude, as a function of the lens focal length.
To degrade the power coupling to 70% just by using a cylindrical lens, you need the focal length of about 14 meters. That's a huge effect, unlikely to come from high quality viewport D1101006/E1100267 as the transmission wavefront error is specified to be within lambda/10 for 633nm over the clear aperture of 5.2".
00:30 (17:30) Phillippe, Ian, Keita and I are all back from End-Y. We transitioned the VEA back to laser safe.
J. Kissel, for Lots of People I heard mention of a big corner station seismic platform trip this morning, so I wanted to follow up and make sure it (a) got in the aLOG, and (b) we had a rough understanding of what happened. Our conclusion (though it is still a "yeah, that's probably what happened") is that while the EE team was yanking around cables in the beer garden (removing old obsolete iLIGO cabling; aLOG pending), they jostled the STS2 on the ground. Now that we're feeding one STS to all platforms in the corner station via the common mode sensor correction, and "hit" to that one seismometer means that it's gunna make all the platforms angry. This appears to have been a kick primarily in the Y direction, and thus -- because we feed X Y from this STS to ALL ISI platforms, with Z going directly to the HAM ISIs but fed to HEPI for the BSCs -- only the ISIs tripped. I attach corroborating evidence: (1) Time series trend of ground STS signals in X, Y, and Z. The timeseries should be in units of [nm/s]. One can see Y DOF goes bonkers at 2019-10-18_1612 UTC. (2) Time series detail of when each ISI platform tripped. 0 is good, 1 is tripped. (3) Time series detail of all HPI watchdogs. 0 is good, 1 is tripped, and this is just to confirm that no HEPIs tripped. (4-6) Time series trend of the input to the MATCH filter bank for X Y and Z for all chambers (to the appropriate stage, be it HEPI or ISI). This is the last filter bank (which is just a "passthrough," empty filter bank with a gain of 1.0) before the sensor correction signal is added to each platform's displacement sensors (aka the CPS). Clearly, the Y direction gets it the worst (where the calibration should now be in [nm], since it's about to get subtracted from the CPS), and this is what sends the then sensor "corrected" CPS signal in the blend with feedback inertial sensors, and drives the feedback loop error signal in to the weeds, and thus a trip. Lesson learned: As we're now in that stage of every commissioning period where we're both trying to use the interferometer "at night" (or during various parts of the day, for activity like e.g. LHO aLOG 52528) -- or running tests of new sensor correction techniques, e.g. LHO aLOG 52560 -- AND we're also still trying to do heavy lifting / craning / electrical work in-and-around the beer garden (e.g. today's work that we believe caused the event), we need to be extra conscious of turning ON and OFF sensor correction, and whom needs the sensor correction in what state. Typically, the commissioning team wants sensor correction ON (and currently, due to state of construction, that's in a convoluted custom state created by the seismic team), and typically, when there is heavy activity in the LVEA, it's good practice to turn the sensor correction OFF. As far as I can tell, today, the state we want the site wide sensor correction in - when we need to use the IFO: TEST_SWARM. - when there will be heavy activity near the beer garden STS: SC_OFF_NOBRSXY
Bubba, Chris, Tyler The remaining doors on HAM 11 and 12 (north and south) have been removed. We have put C3 covers in their place while we await shipping covers. Additionally, the thru holes in septum that separates the two volumes is now capped using the 3 blanks Gerardo located for us. All HAM 11/12 doors are now hanging on the door caddy near the large equipment access roll-up door.
Tagging vacuum (VE).
Philippe, Ian, Corey
We completed the winding of the EY magnetic injection coil (NE corner) within a couple of hours thanks to all the practice at EX; photo attached of the finished product. Electronics setup/testing soon to come.
J. Kissel, R. Kumar
Rahul and I are performing the standard follow-up with the dynamical assessment of the suspensions now that HAM6 is sufficiently pumped down to count as "in vacuum" (the current pressure is 2e-6 Torr, standard "has been pumped down for months" level is ~2e-7 Torr). I've tested the H1SUSOMC (an OMCS) and H1SUSOPO (an OPOS), and can confirm that they remain free after pump down. Plots comparing the results against the previous time that they were at vacuum and a corresponding L1 suspension are attached!
As the actuation strength and the cross coupling of DOFs of the OPOS suspension continues to be problematic during characterization, I took some DOFs with the non-diagonal damping loops ON and some with them OFF. This is why you may see that some "major" resonances in some tranfer functions have different Qs that in previous measurements.
Templates for each SUS live here:
/ligo/svncommon/SusSVN/sus/trunk/OMCS/H1/OMC/SAGM1/Data/
2019-10-18_1839_H1SUSOMC_M1_WhiteNoise_*_0p02to50Hz.xml
/ligo/svncommon/SusSVN/sus/trunk/OPOS/H1/OPO/SAGM1/Data/
2019-10-18_1840_H1SUSOPO_M1_WhiteNoise_L_0p02to50Hz.xml
Rahul will attach OM3 and ZM1 data shortly. We still need to gather data for OM1 and OM2; they're currently in use.
Attached below are the transfer function results for the following four (in addition to what Jeff. Kissel posted in his alog) suspensions in HAM6,
OM1, OM2, OM3, ZM1
The results show that the suspensions are doing fine under vacuum and are consistent with previous measurements.
The files (four in total) with names (2019.-10-18...) gives a comparison between the current measurement and sus model. The other four files (OM1, OM2...) gives a comparison between sus model and measurement data taken at different times (example in vacuum/air etc).
The transfer function templates (.xml file for running the diaggui and .txt file for matlab plotting), matlab tools and the result files are stored at the following locations,
/ligo/svncommon/SusSVN/sus/trunk/HTTS/H1/ZM1/SAGM1/Data/
/ligo/svncommon/SusSVN/sus/trunk/HTTS/H1/ZM1/SAGM1/Results/
/ligo/svncommon/SusSVN/sus/trunk/HTTS/H1/OM1/SAGM1/Data/
/ligo/svncommon/SusSVN/sus/trunk/HTTS/H1/OM1/SAGM1/Results/
/ligo/svncommon/SusSVN/sus/trunk/HTTS/H1/OM2/SAGM1/Data/
/ligo/svncommon/SusSVN/sus/trunk/HTTS/H1/OM2/SAGM1/Results/
/ligo/svncommon/SusSVN/sus/trunk/HTTS/H1/OM3/SAGM1/Data/
/ligo/svncommon/SusSVN/sus/trunk/HTTS/H1/OM3/SAGM1/Results/
/ligo/svncommon/SusSVN/sus/trunk/HTTS/Common/MatlabTools/ (plotHTTS_dtttfs_M1.m and plotallhtts_tfs_M1.m)
I attach a few more plots from this data set (the last data set the H1 SUS OPO has had without faults in the measurement):
There has been interest / curiosity in the V to L, and T, as well as V to Y coupling, given the OPOS's blades are flat when unloaded and curved when loaded (rather than the typical design of flat when loaded). The only other "suspension" for which this blade design is true, in LIGO, are the BSC-ISIs, where there is non-negligible V to RZ (Yaw) cross-coupling.
I've also updated the
/ligo/svncommon/SusSVN/sus/trunk/OPOS/Common/MatlabTools/
plotOPOS_dtttfs_M1.m
for several reasons:
- The legend in the cross-coupled euler basis degrees of freedom have been incorrectly legended for *years*. The *plot* was showing, for example, the V to R transfer function but it was labeled as the R to V transfer function and vice versa. Whoops and Yikes! This is *definitely* my fault.
- to show these new vertical to all Euler basis DOF plots every time an individual measurement is processed.
- Fixed the call to pdfmerge so that it references the copy of the merging function in the SusSVN rather than relying on it being in the operating system path.
IM2 pitch did not return to previous value. Corrected with +100 on pitch slider, saved in SDF.
WP8431 ASC AS_C_NSUM IPC and LSC Matrix
Sheila, Dave:
Sheila created new h1lsc and h1asc models, adding a new PCIE IPC sender on h1asc (H1:ASC_LSC_AS_C_NSUM) and corresponding receiver on h1lsc plus a trigger matrix. A new h1lsc PCIE sender was also added (TRIG_SEI_PCIE) for a future receiver.
h1lsc, h1asc models were restarted, followed by a DAQ restart.