Relocked the IFO 3.5 hours ago. Now at 116.5Mpc of range. Since environmental conditions are improving. All OK at this time.
TITLE: 08/22 Day Shift: 15:00-23:00 UTC (08:00-16:00 PST), all times posted in UTC STATE of H1: Earthquake INCOMING OPERATOR: Jeff SHIFT SUMMARY: Robert spent an hour commissioning. One unknown lock loss. One lock loss from an earthquake in the United States. Currently reacquiring lock. Jeff is covering the last hour of my shift. LOG: 16:39 UTC Chris opening OSB receiving rollup door 16:48 UTC Lock loss 16:50 - 17:07 UTC Robert and company to LVEA 16:55 UTC GRB E347936 (IFO unlocked) 17:18 - 17:33 UTC Matt to LVEA 17:20 - 17:30 UTC Cheryl to LVEA to turn off breaker for PSL AC 17:24 UTC Having trouble locking PRMI, starting initial alignment 17:48 - 17:58 UTC Richard and Gerardo to optics lab Lock loss from START_TR_CARM 18:23 UTC Chris opening OSB receiving rollup door 19:01 UTC NLN. Set observatory mode to commissioning for PEM work 19:20 UTC Robert to LVEA 19:37 UTC SEI_CONF to EARTH_QUAKE for eq from Wallis_and_Futuna 19:59 UTC Observing UTC Lock loss. Probably from eq in United States 21:04 UTC SEI_CONF to WINDY 21:22 UTC CHECK_MICH_FRINGES not staying locked 21:24 - 21:44 UTC Jason to optics lab Lock loss from ENGAGE_ASC_FOR_FULL_IFO Had to take guardian to manual to go from ACQUIRE_DRMI_1F to ACQUIRE_PRMI
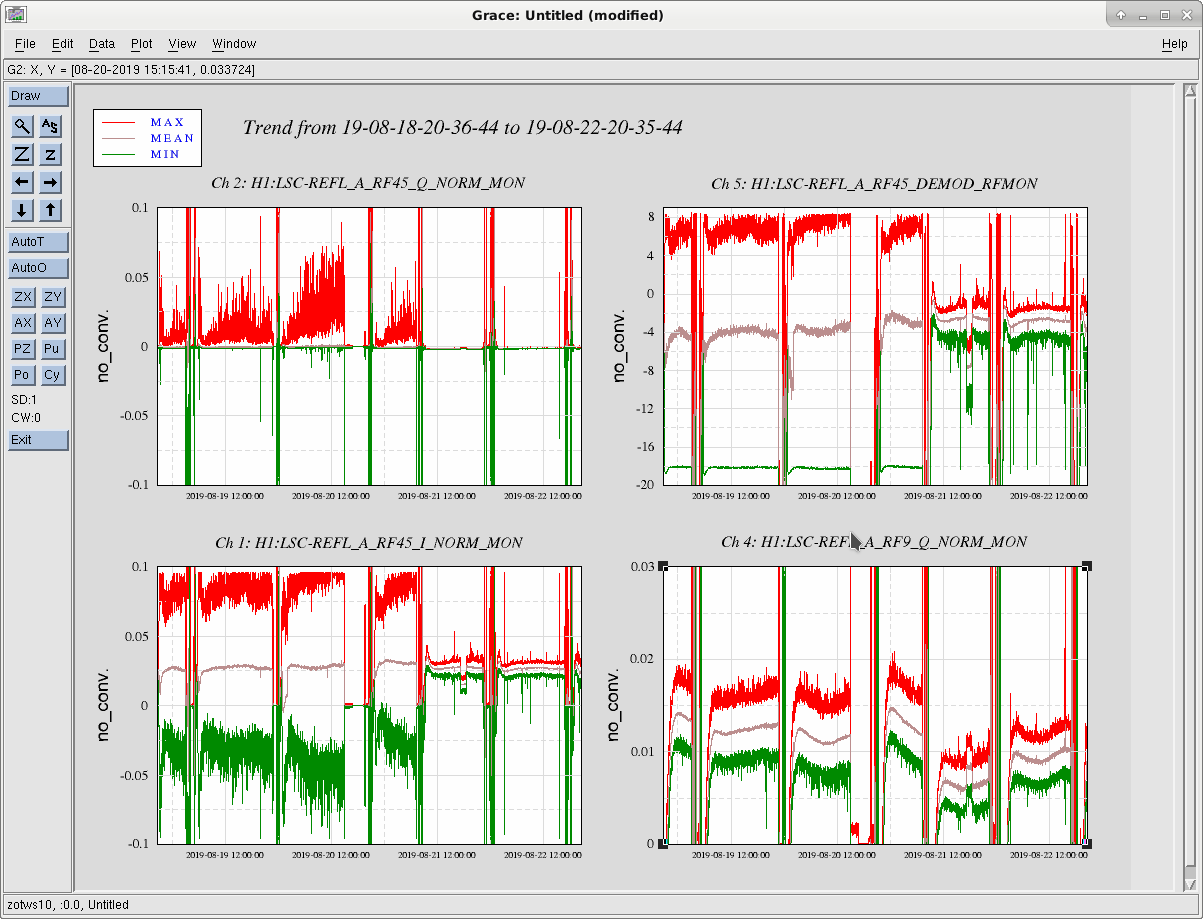
After the spots moved back the RF power in reflection has quiet down, and fluctuations are back at their old values.
Old alog 51175.
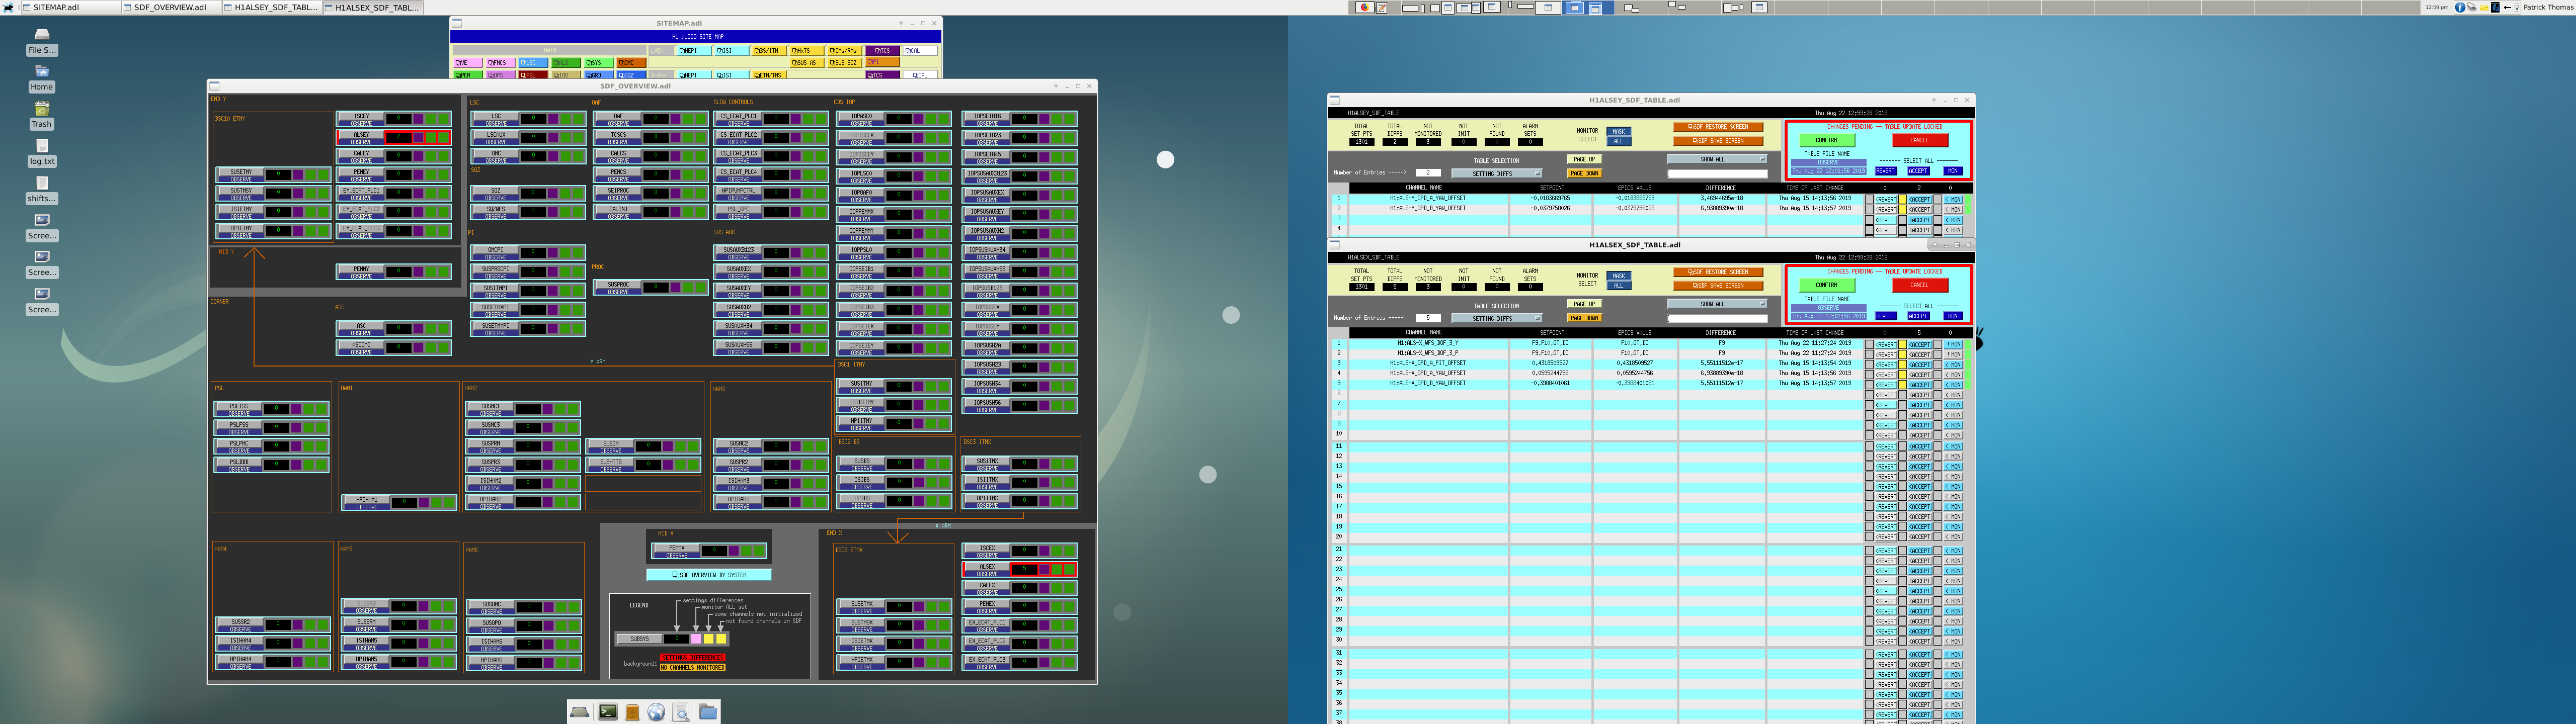
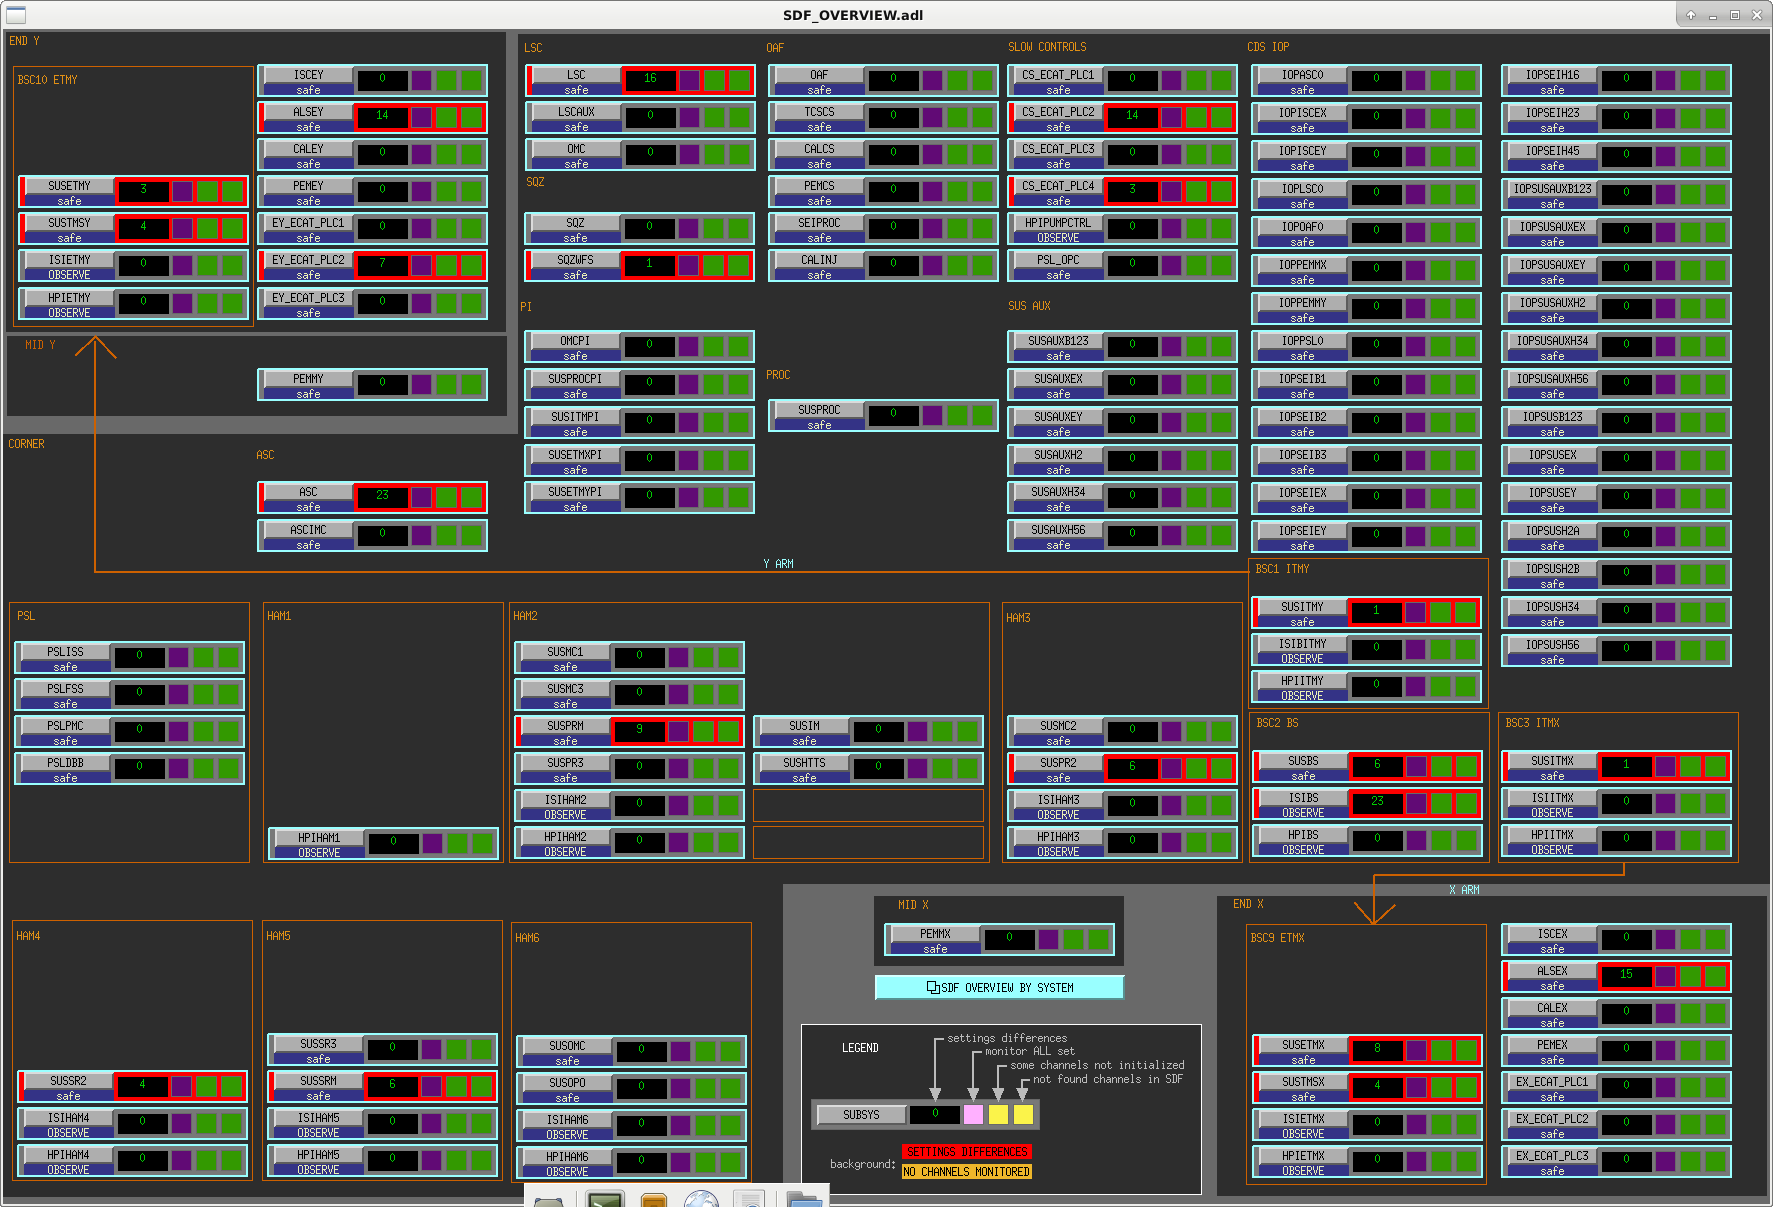
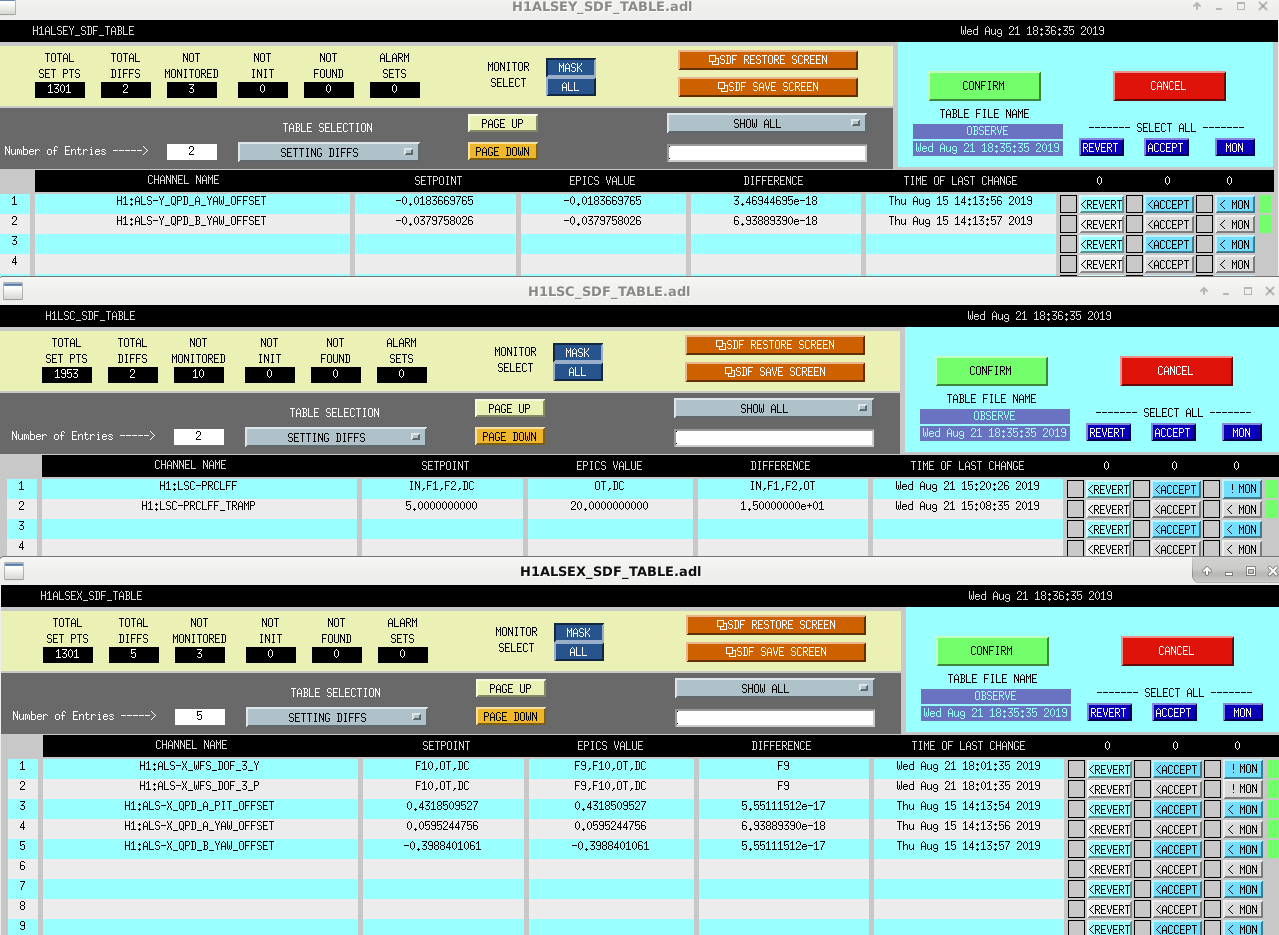
19:59 UTC Accepted attached SDF differences.
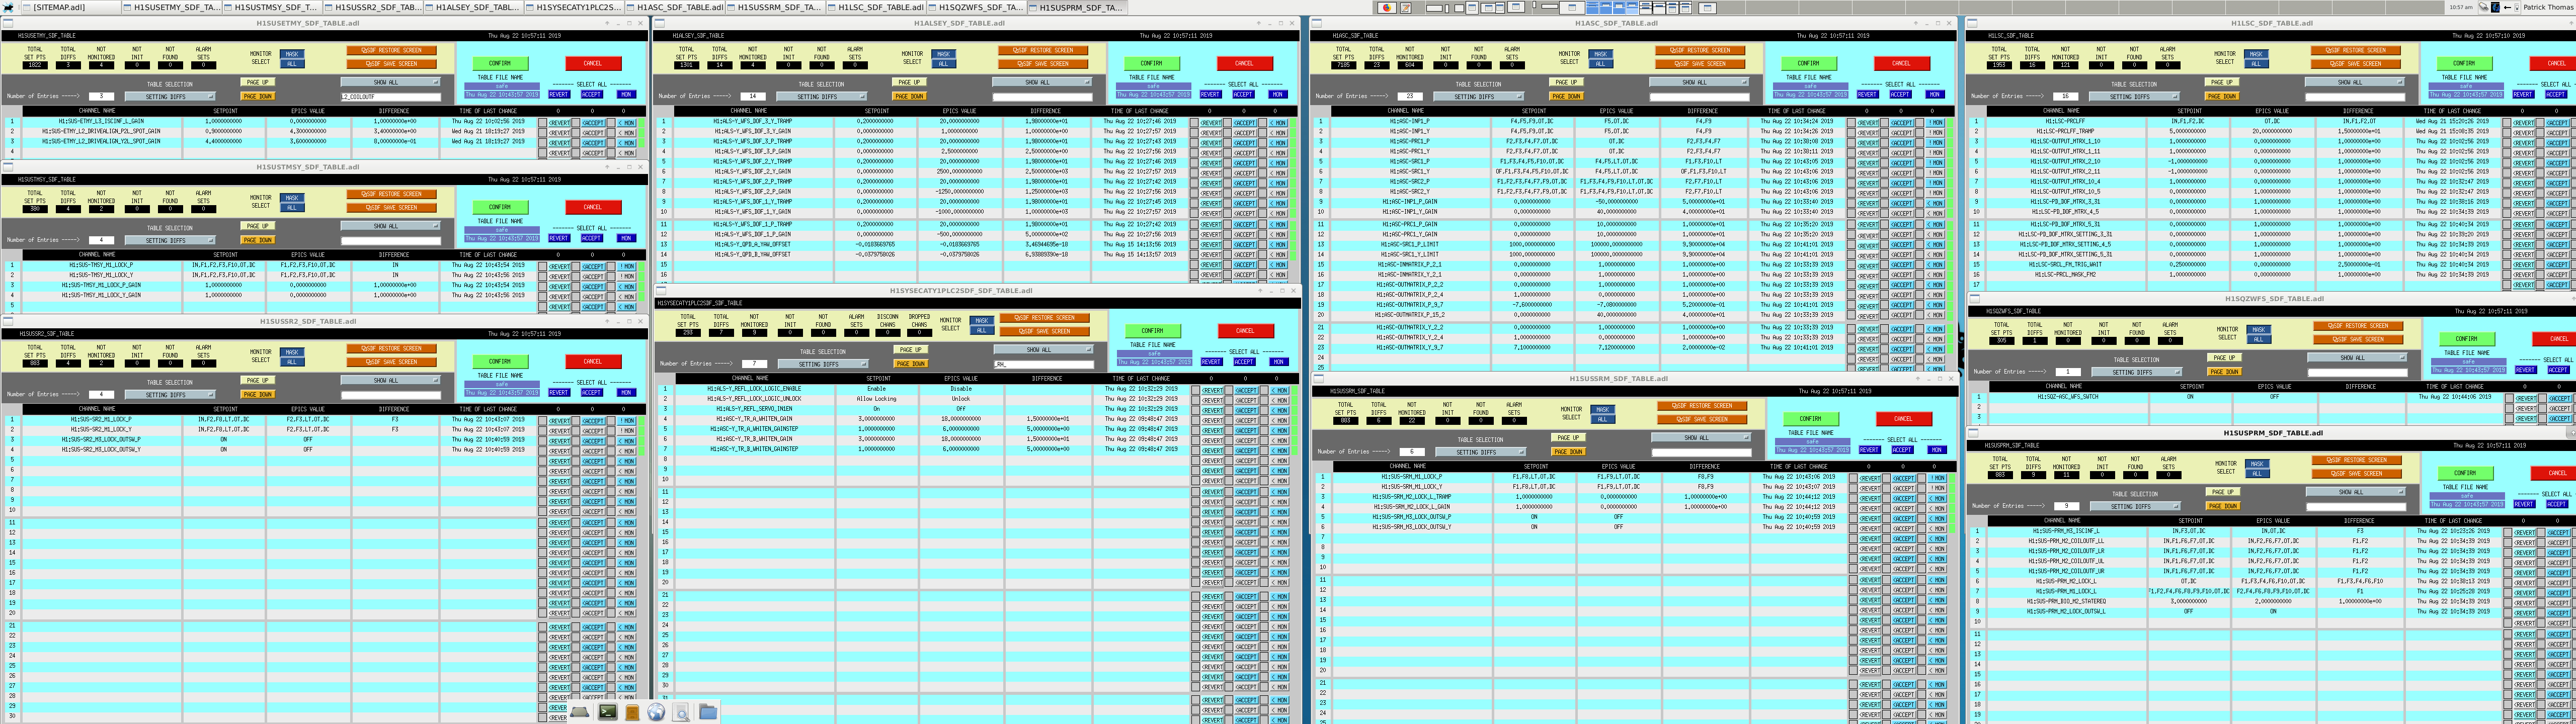
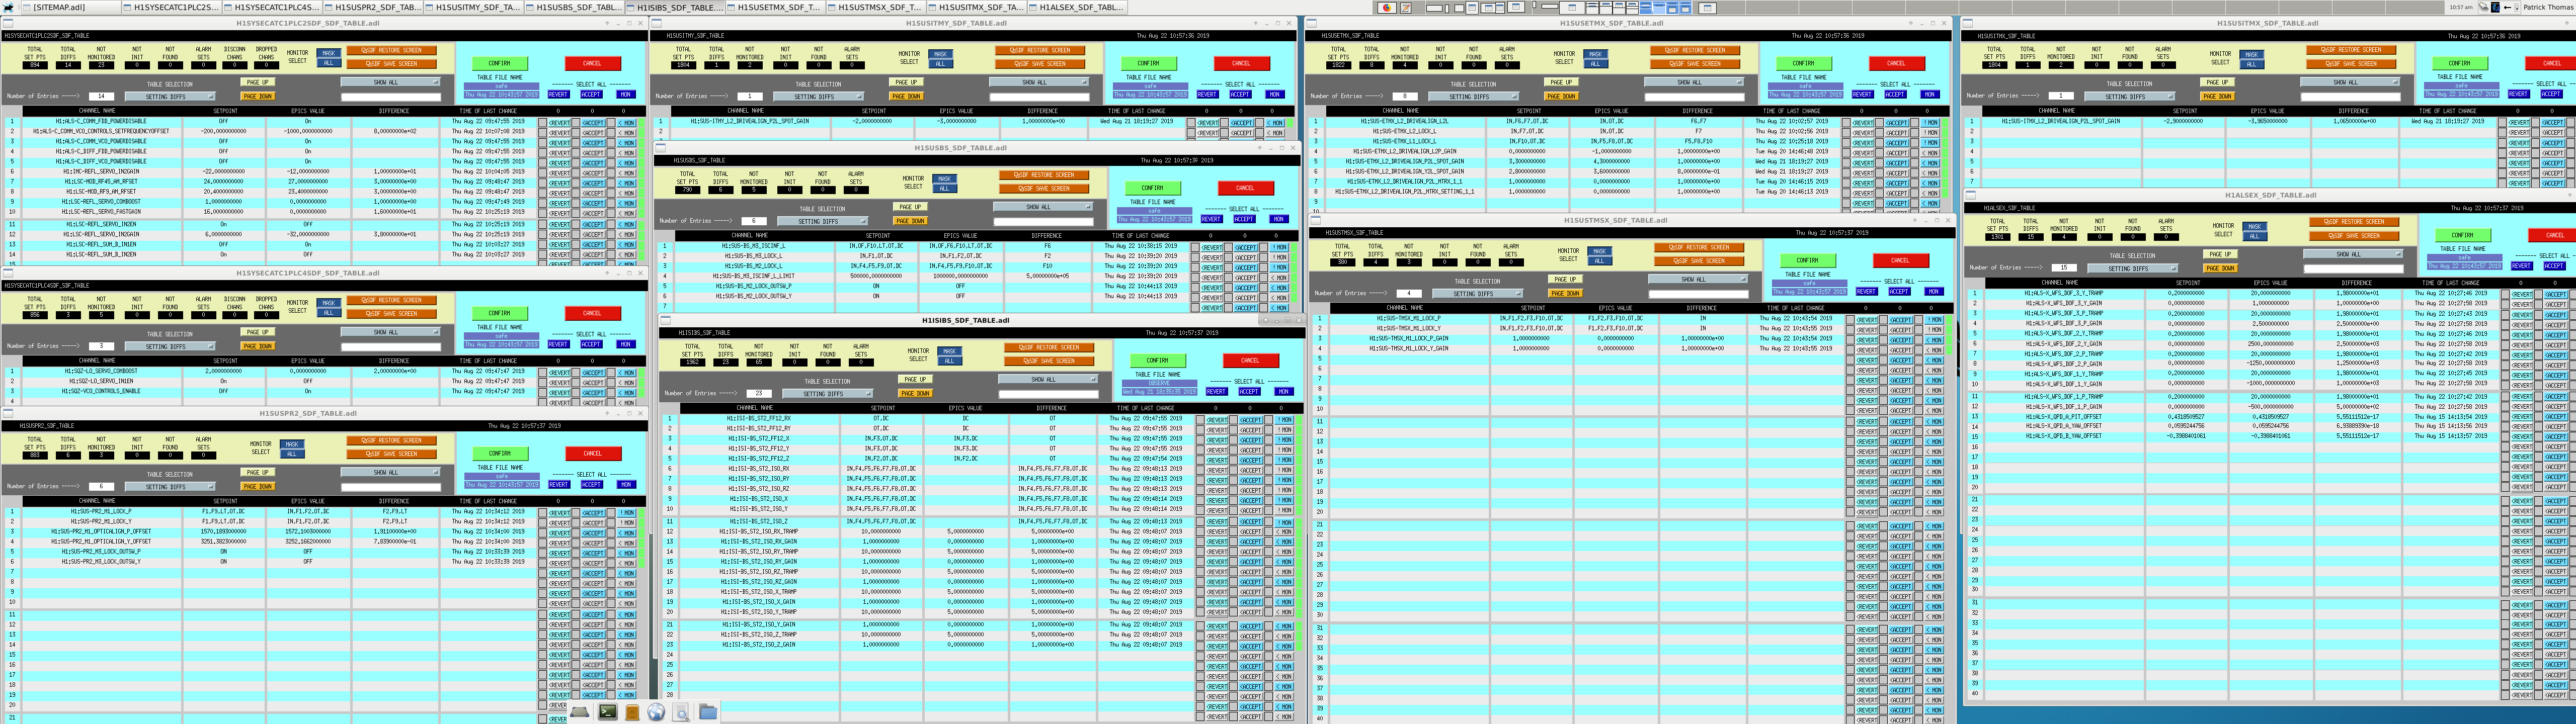
Per Sheila's request these are attached.
Thank you Patrick. I had asked for this hoping to find a clue about why we loose lock in the TR_CARM steps each time we first attempt after running intial alignment. I actually don't see anything that looks like a clue here for an incorrect setting. I actually don't see anything here that looks suspicous. It is odd that the TMS QPDs show up in SDF, but the settings look correct for starting the acquisition sequence.
Daniel, Nutsinee
Following up alog51313 and alog51270 we went out and quickly investigated the cause of CLF power jump last Tuesday. Daniel tightened up all the relevant cables but that didn't seem to fix the problem.
TITLE: 08/22 Day Shift: 15:00-23:00 UTC (08:00-16:00 PST), all times posted in UTC
STATE of H1: Observing at 115Mpc
OUTGOING OPERATOR: Niko
CURRENT ENVIRONMENT:
SEI_CONF state: WINDY
Wind: 3mph Gusts, 1mph 5min avg
Primary useism: 0.01 μm/s
Secondary useism: 0.13 μm/s
QUICK SUMMARY: H1:GRD-ISC_LOCK_USERMSG ALS_COMM: STOLEN (by: USER)
TITLE: 08/22 Owl Shift 07:00 – 15:00 (00:00-08:00), all times posted in UTC
STATE of H1: Observing
INCOMING OPERATOR: Patrick
SHIFT SUMMARY: Very quiet shift, microseism/wind down from earlier. Locked/Observing for 13.5 hours.
LOG:
07:00 (00:00) Start of shift
10:51 (03:51) Dropped out of Observing, SQZ unlocked
10:53 (03:53) SQZ locked, back to Observing
15:00 (08:00) End of shift
Ops Shift Transition: 08/22/2019, Owl Shift 07:00 – 15:00 (00:00-08:00) - UTC (PT)
State of H1: Locked
Intent Bit: Observing
Weather: 0-15 mph wind
Primary 0.03 – 0.1Hz: 0.01 um/s
Secondary 0.1 – 0.3Hz: 0.1 um/s
Outgoing Operator: Jeff
Quick Summary: Locked and Observing for 5.5 hours. Microseism slowly decreasing
Ran Initial alignment, before attempting to relock. Initial Alignment went fine. While trying to relock, we had a storm system move across the site. Winds were gusting to over 40mph; primary microseism was up to 0.9um/s. Although it took a few tries the IFO was relocked and back into Observing at 01:38utc (18:38). Winds have dropped down to the teens and 20mph range. The IFO range is 116.7Mpc.
After relocking, acepted the SDF diffs listed below in the attachment. Back into Observing.
M. Ball
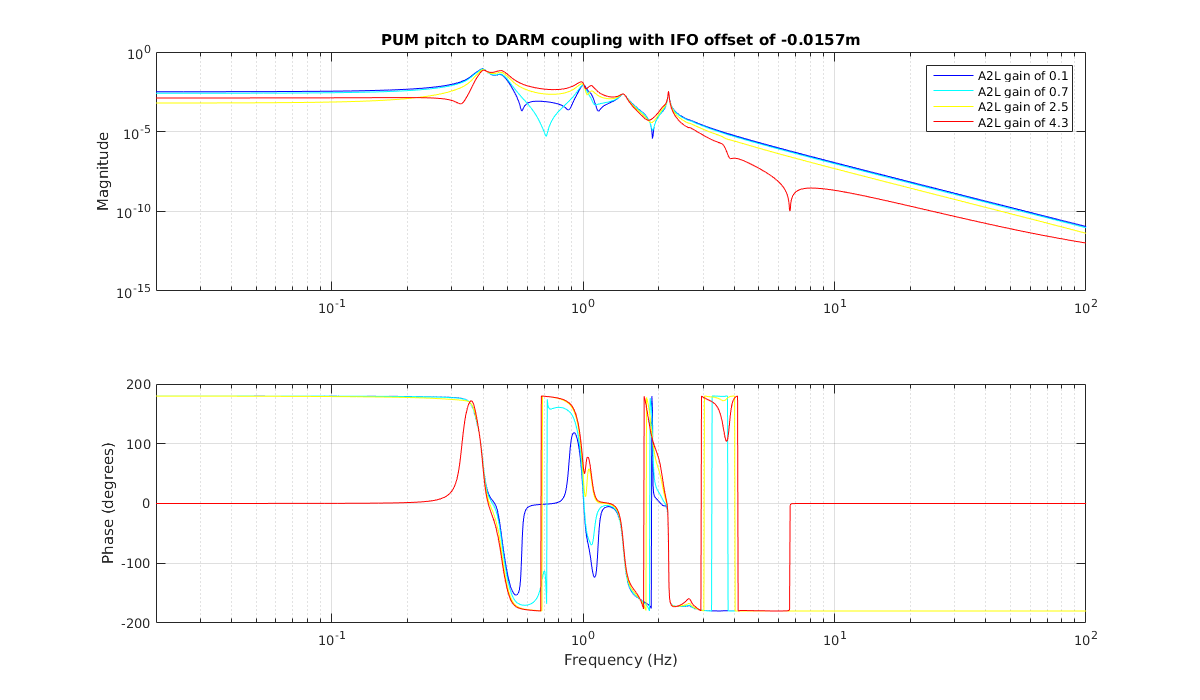
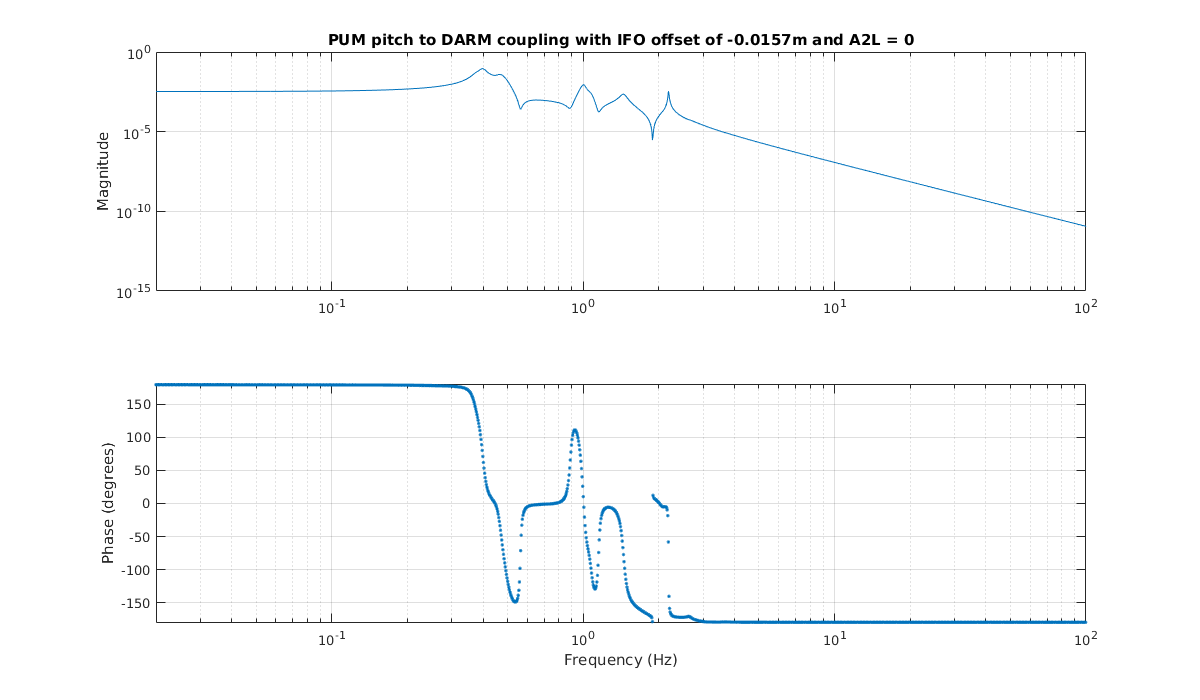
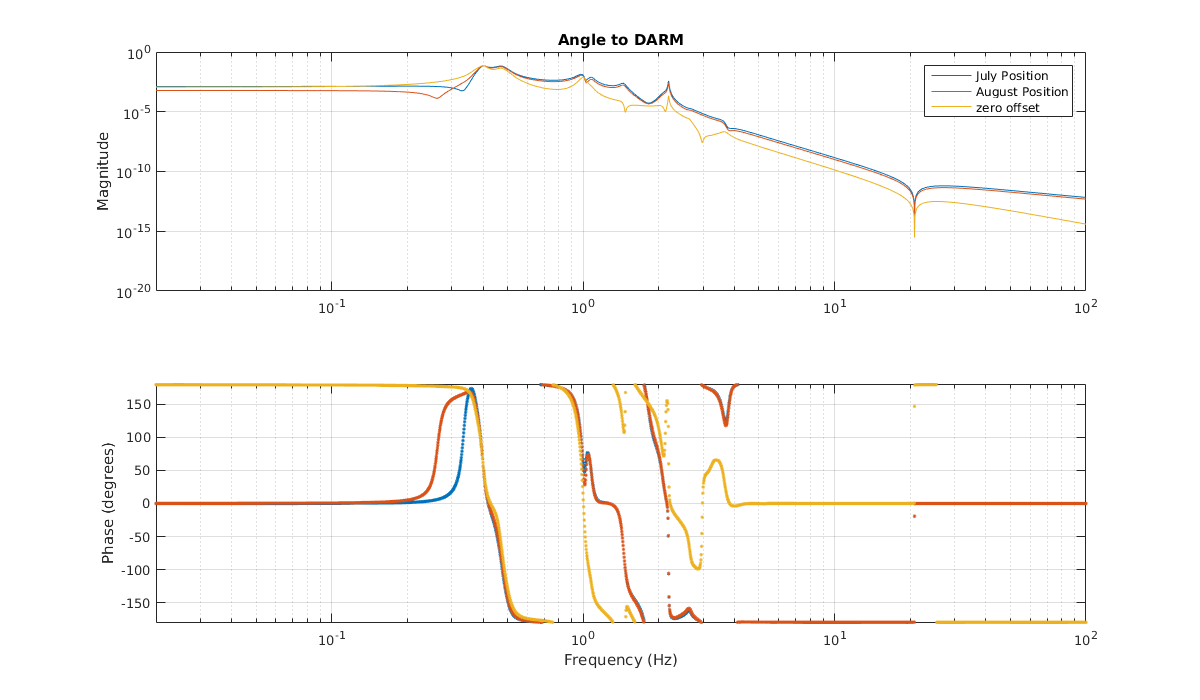
I have been modeling cross-coupling between PUM pitch motion and DARM with different decoupling filters (LHO alog 51111) and wanted to investigate the effects of different scalar pitch to length (A2L) decoupling filters.
Figure 1 shows this coupling for a few different A2L gain values with a consistent beam pitch offset. We then wanted to look at how this behaved when the A2L gain is zero/off, as is currently in use (Figure 2). We then asked how this coupling looked for the different spot positions we have been using recently and how those compare to a centered beam (Figure 3).
L. Sun
The hourly C01 uncertainty budget plots and txt files are stored here https://ldas-jobs.ligo.caltech.edu/~ling.sun/Calibration/Uncertainty/O3C01/LHO/
LHO: from 1237827584 == Mar 28 2019 16:59:26 UTC to 1244307456 == Jun 11 2019 16:57:18 UTC
Note: If the detector is not locked or the calibration line uncertainty > 0.005, the results are not produced for that given time. (Results cover 71% of the whole duration.)
The attachment demonstrates that the variation of the envelopes is negligible.
- White dashed curve: median of the median values from all the hourly data
- White solid curve: median of the +/- 1 sigma values from all the hourly data
- Color: percentiles of the +/- 1 sigma curves (i.e., variation of the envelope)
L. Sun,
I've fixed the RRNom.py code to exclude kappa_U and kappa_P correction before 0416 in LHO. On the other hand, I found that some jobs unexpectedly failed due to cluster issues in the previous run. Some of the hourly data were missing. I've regenerated C01 statistics for the whole period. Now the coverage is 77% for LHO.
The updated percentile plot and the max mag/phase bound curves are attached. In the percentile plot, we see larger variation at low freq because kappa_U and kappa_P were not corrected before 0416.
The plots are generated using the script ^/trunk/Common/pyDARM/RRNomStat.py
Sample command: python3 RRNomStat.py --statDir=/home/ling.sun/public_html/Calibration/Uncertainty/O3C01/LHO/ --IFO=LHO --nameTag=O3_C01
L. Sun
The max bound plot in the previous comment shows the max of all statistics. Now it's updated to show the max bounds of different percentiles.
The variation in the uncertainty percentiles seen in the 95th ("2 sigma") and 99th ("3 sigma") from the 68th ("1 sigma") are a result of H1's h(t) not correcting for \kappa_P and \kappa_U during the observational stretched before April 16th, when we didn't trust them enough (see details in FRS Ticket 12997 and associated dependencies).
Why didn't we trust them? In short:
Because ETMX calibration lines used to determine \kappa_U and \kappa_P were too far apart from the PCAL absolute reference line -- and the time-dependent sensing function was varying enough (see 51115 and FRS Ticket 13012) that the approximation that "the calibration lines are close enough that the time variance of the ratio of C/(1+G) at PCAL frequency and each ETMX line is negligible" [see section 2.4 in T1700106] breaks down).
Thus, the (yes, still untrustworthy) measured values of \kappa_P and \kappa_U are applied as a *systematic error* in the uncertainty and error budget, and thus that budget is time-variant, and increasing the 95th and 99th percentile values. This creates an *over-estimate* of the systematic error, as PUM and UIM actuation strengths as measured with frequency dependent sweeps have remained entirely static over the run thus far -- see LHO aLOG 50992 and G1901479. However, we accept this poor assessment as of the time-dependence actuator systematic error as a "conservative" estimate of what it could be (where the GPR covers the unknown static frequency dependence).
After April 16th, we moved all actuator calibration line frequencies lower and much closer to each other (see LHO aLOG 48551).
Attached is supplemental material from Lilli showing what the percentiles look like if O3 uncertainty and systematic error estimates prior to April 16th are *excluded.*
One can see much less variance, and the 95th and 99th percentile curves lie right on top of the 68th percentile curve, as expected.
[Editor's note -- these were sent to calibration mailing list on Aug 27 2019, under thread "To Use or Not to Use: TDCFs for H1 until Apr 16th" -- 2019-08/msg00166.html. Unclear if they were yet put in the repo, but I've committed them to /ligo/svncommon/CalSVN/aligocalibration/trunk/Runs/O3/H1/Results/Uncertainty/, perhaps redundantly, and will remove and delete once I find out if /where they were committed elsewhere .
TITLE: 08/21 Day Shift: 15:00-23:00 UTC (08:00-16:00 PST), all times posted in UTC
STATE of H1: Observing at 114Mpc
INCOMING OPERATOR: Jeff
SHIFT SUMMARY:
H1's been at NLN since 9:16utc (2:16am) this morning with a couple of non-Observing breaks:
TOMORROW: Tenative plans for planned out-of-OBSERVING work for H1 & L1 (assuming V1 is Observing) is slated for 11amPDT (PEM team for ~60min).
LOG:
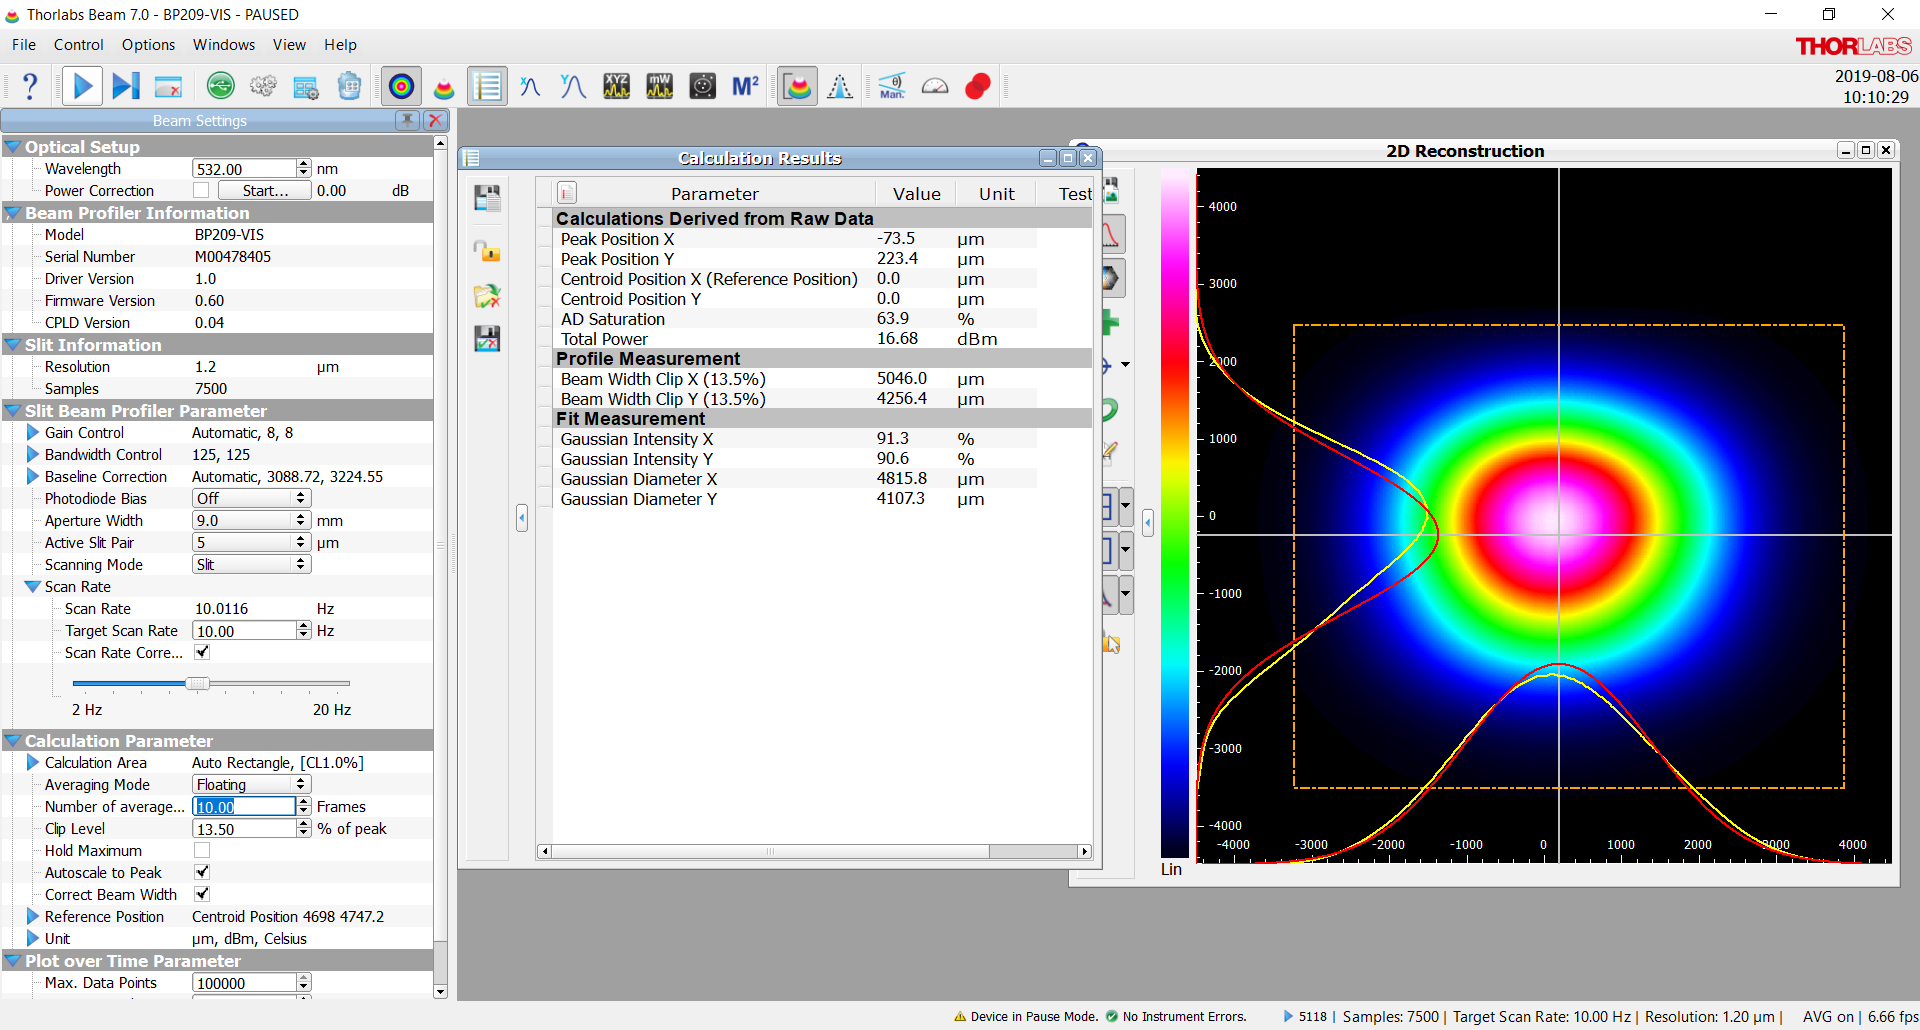
Following on from last week's Round 2, at Keita's request I took a series of beam profiles between ALS_M11 and ALS_M12 (ALS_M12 is the bottom periscope mirror, so this is the green beam as it goes into WBSC10 (as close as I can get to it, at least)). Using the ALS_M11 mirror as the reference point, I took 4 profiles along the path; the profiler sensor was at 0° for these measurements, and the distances are from ALS_M11 to the profiler's sensor:
| Distance from M11 (mm) | Horizontal Beam Diameter (mm) | Vertical Beam Diameter (mm) |
| 96.5 | 5.05 | 4.26 |
| 121.9 | 5.09 | 4.28 |
| 147.3 | 5.03 | 4.28 |
| 169.5 | 5.05 | 4.26 |
I've attached a beam profile of the beam at the farthest extent from ALS_M11 that I could get the profiler without bumping ALS_M12 (this is the final data point in the above table). All of the profiles taken had this shape to it. To my eye it looks like the top half of the profile is compressed versus the bottom half.
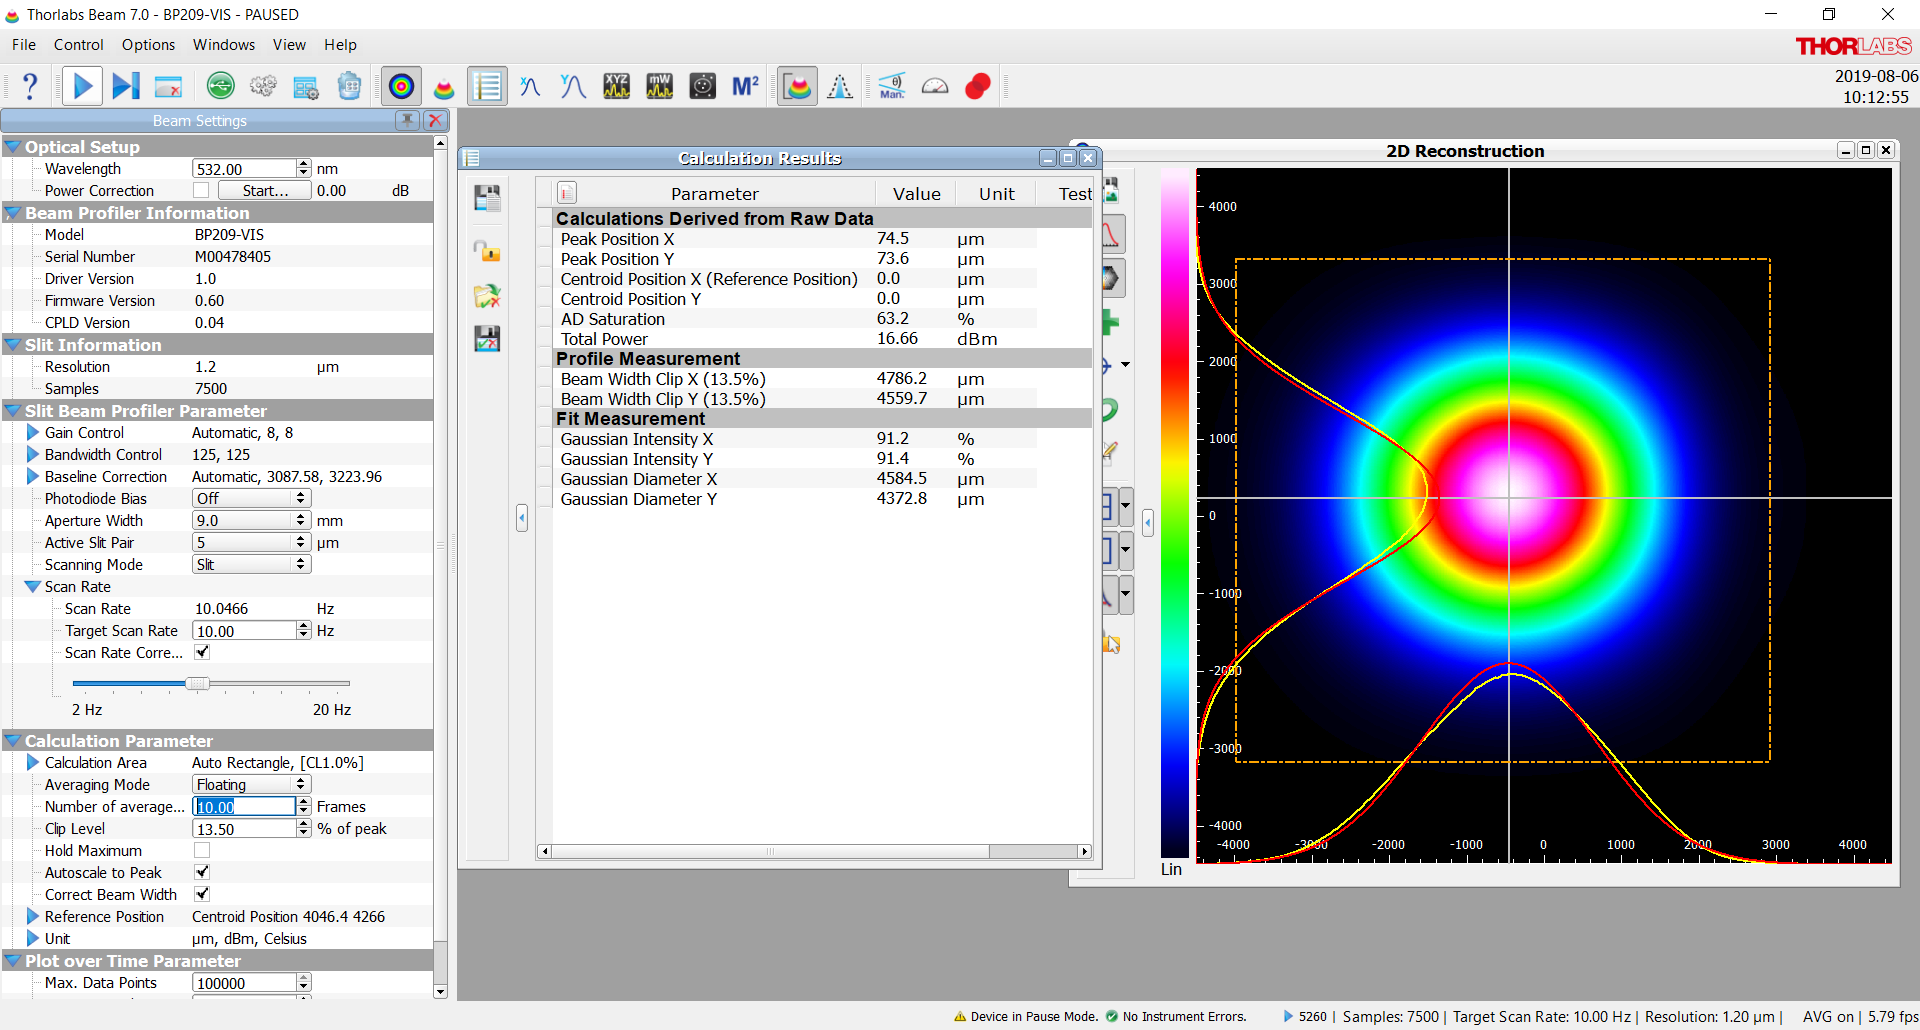
In addition, I rotated the profiler sensor by +45° at each data point to check for any gross off-axis ellipticity. I've attached an example of this, taken at the same location as the first attachment. The beam gets more round when the sensor is rotated, showing no gross off-axis ellipticity; all sensor-rotated profiles showed this shape.
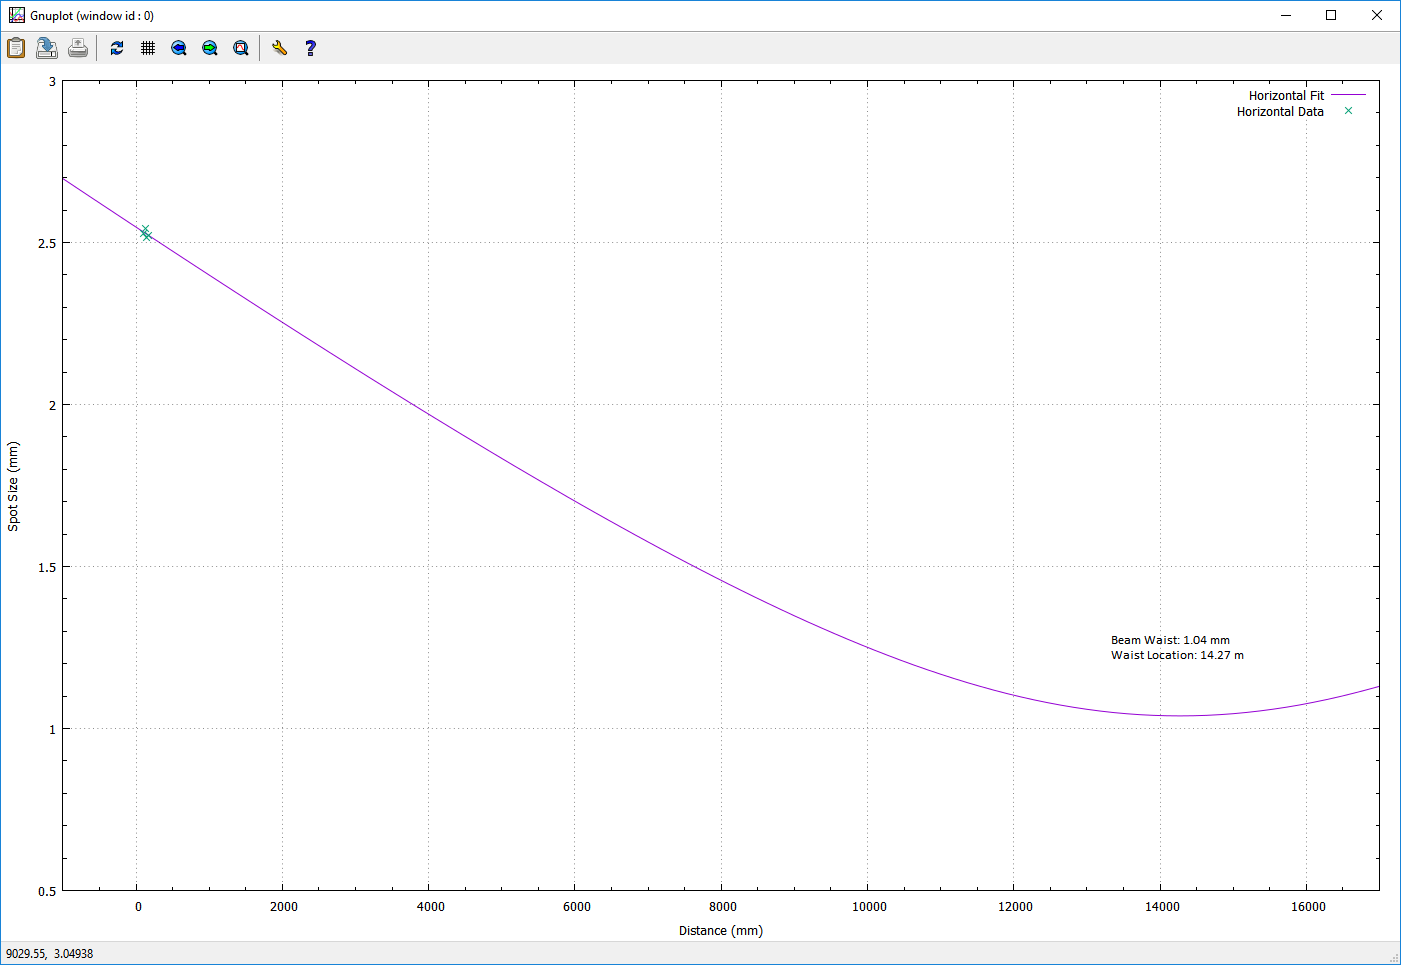
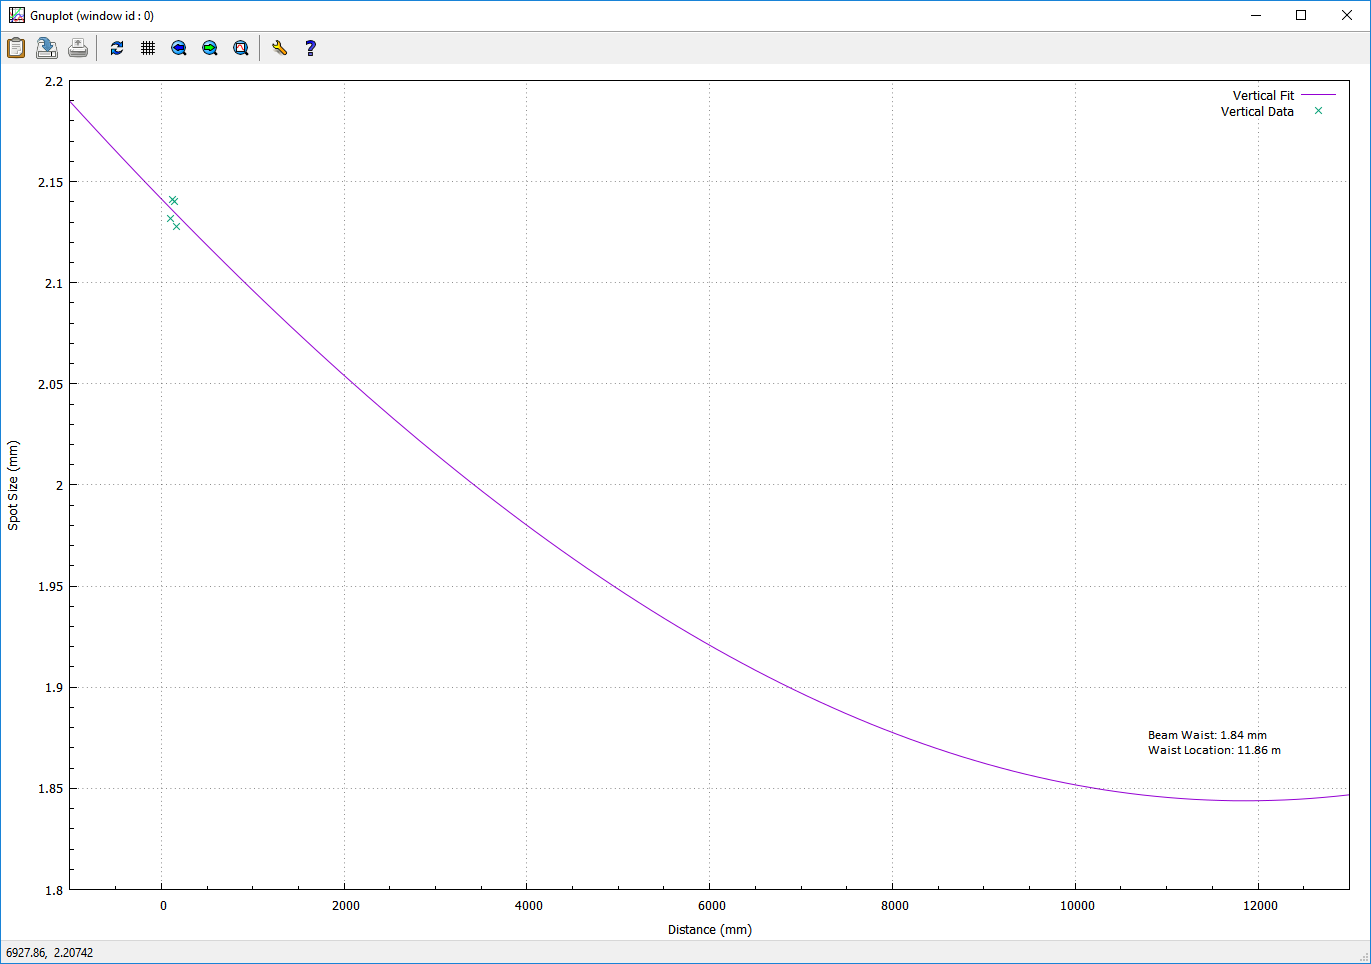
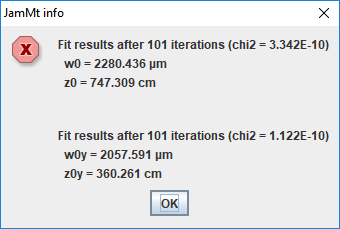
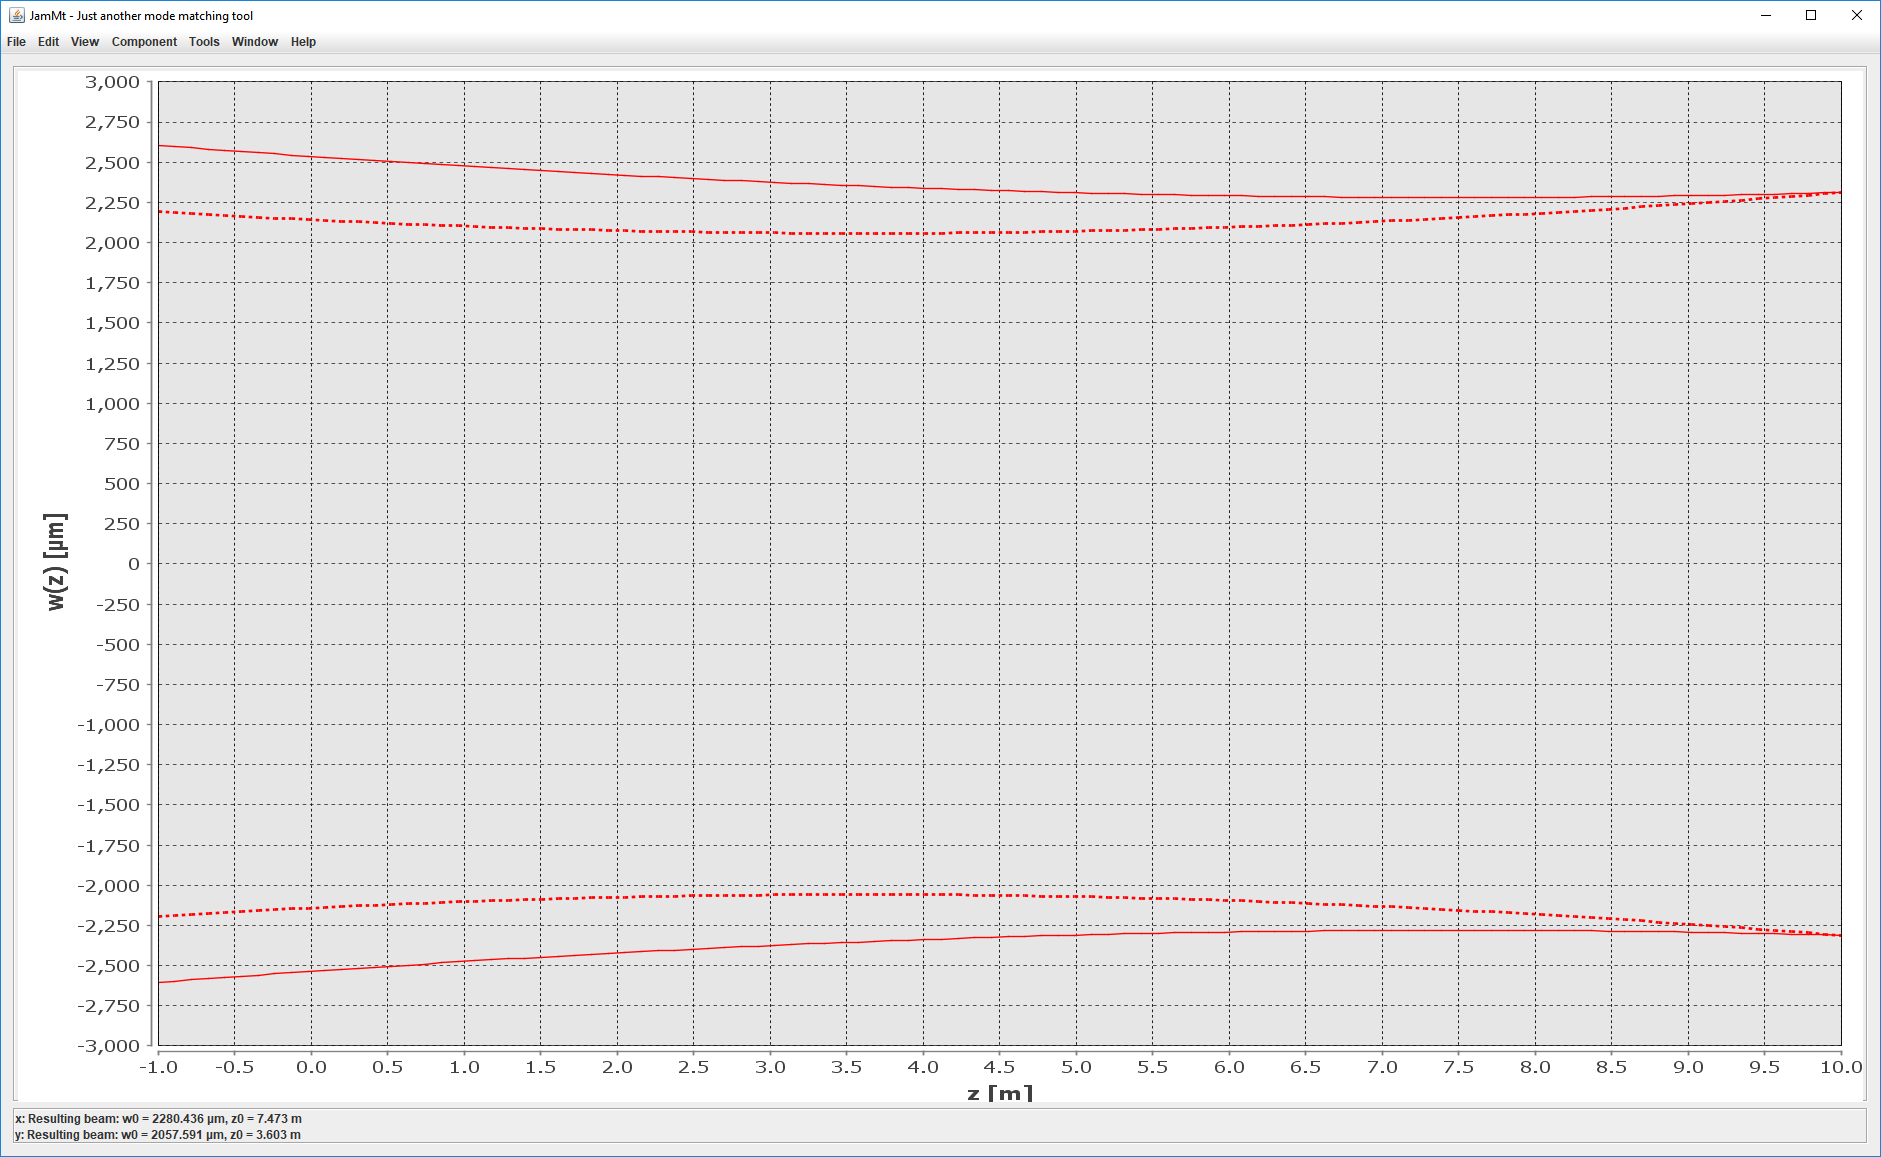
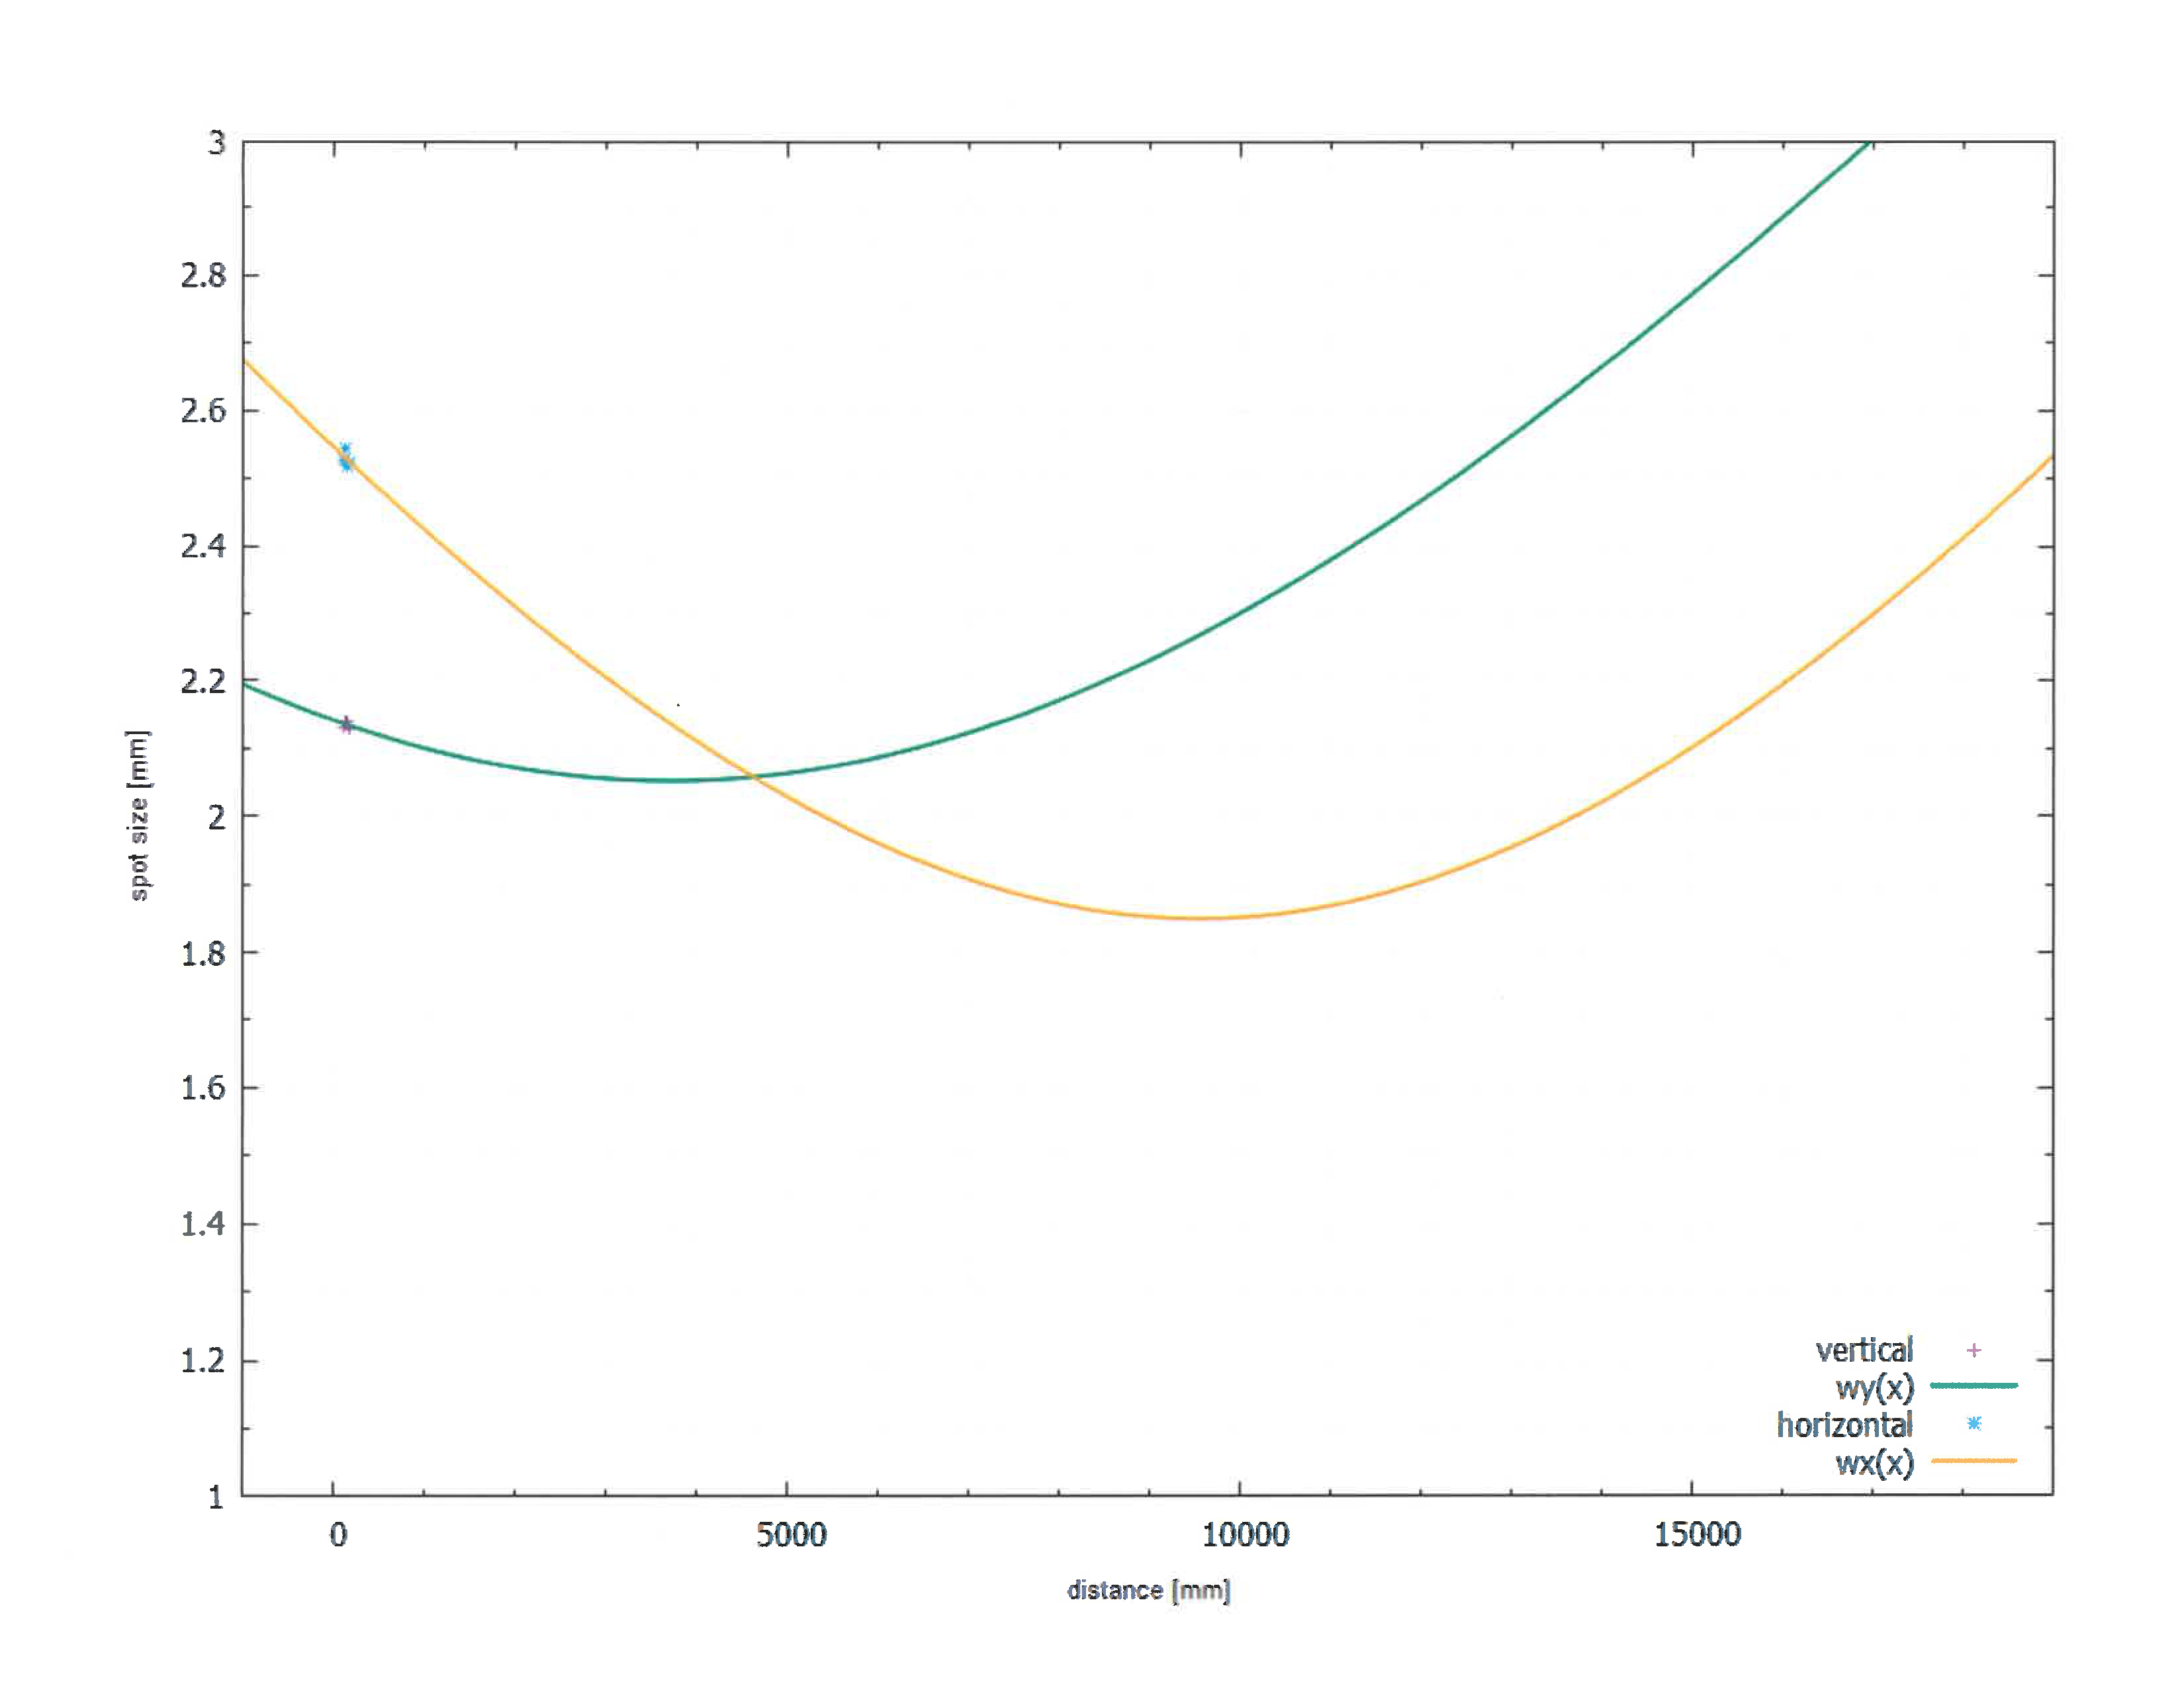
Performed a fit using 2 different programs: manual fit in gnuplot and an automatic fit included with JamMt. Results are attached (0 is the front face of ALS_M11). JamMt and gnuplot generally agree very well, but as can be seen there is absolutely no agreement here. As a back check, I asked Peter to perform a fit using a script he's written (also in gnuplot), see the final attachment. Once again, no agreement. That's 3 different fits, 3 different results. The only conclusion I can come to here is there aren't enough data points to get an accurate fit (remember, only 4 were taken due to space constraints between ALS_M11 and ALS_M12, the requested area for the measurement). We can get some more data if ALS_M10 is used as the reference, but there is an additional problem: the Rayleigh range of the green beam after ALS_L7 is very large (desired spot size of 2.2mm with a 532nm wavelength gives a zr ~= 28.5m). This means that over the ~24 inches we have available to take a beam propagation measurement after ALS_L7 (can't fit the profiler between ALS_L7 and ALS_M10, so we have to go after M10) the spot size is not going to change very much. This is a potential issue for any fit to a beam propagation measurement performed here, and something to be considered should we move forward with additional ALSy green beam propagation measurements.
Somehow I forgot to post this, but I looked at the ISCTEX to see if the lexan plate is on the viewport, and there was none (good).
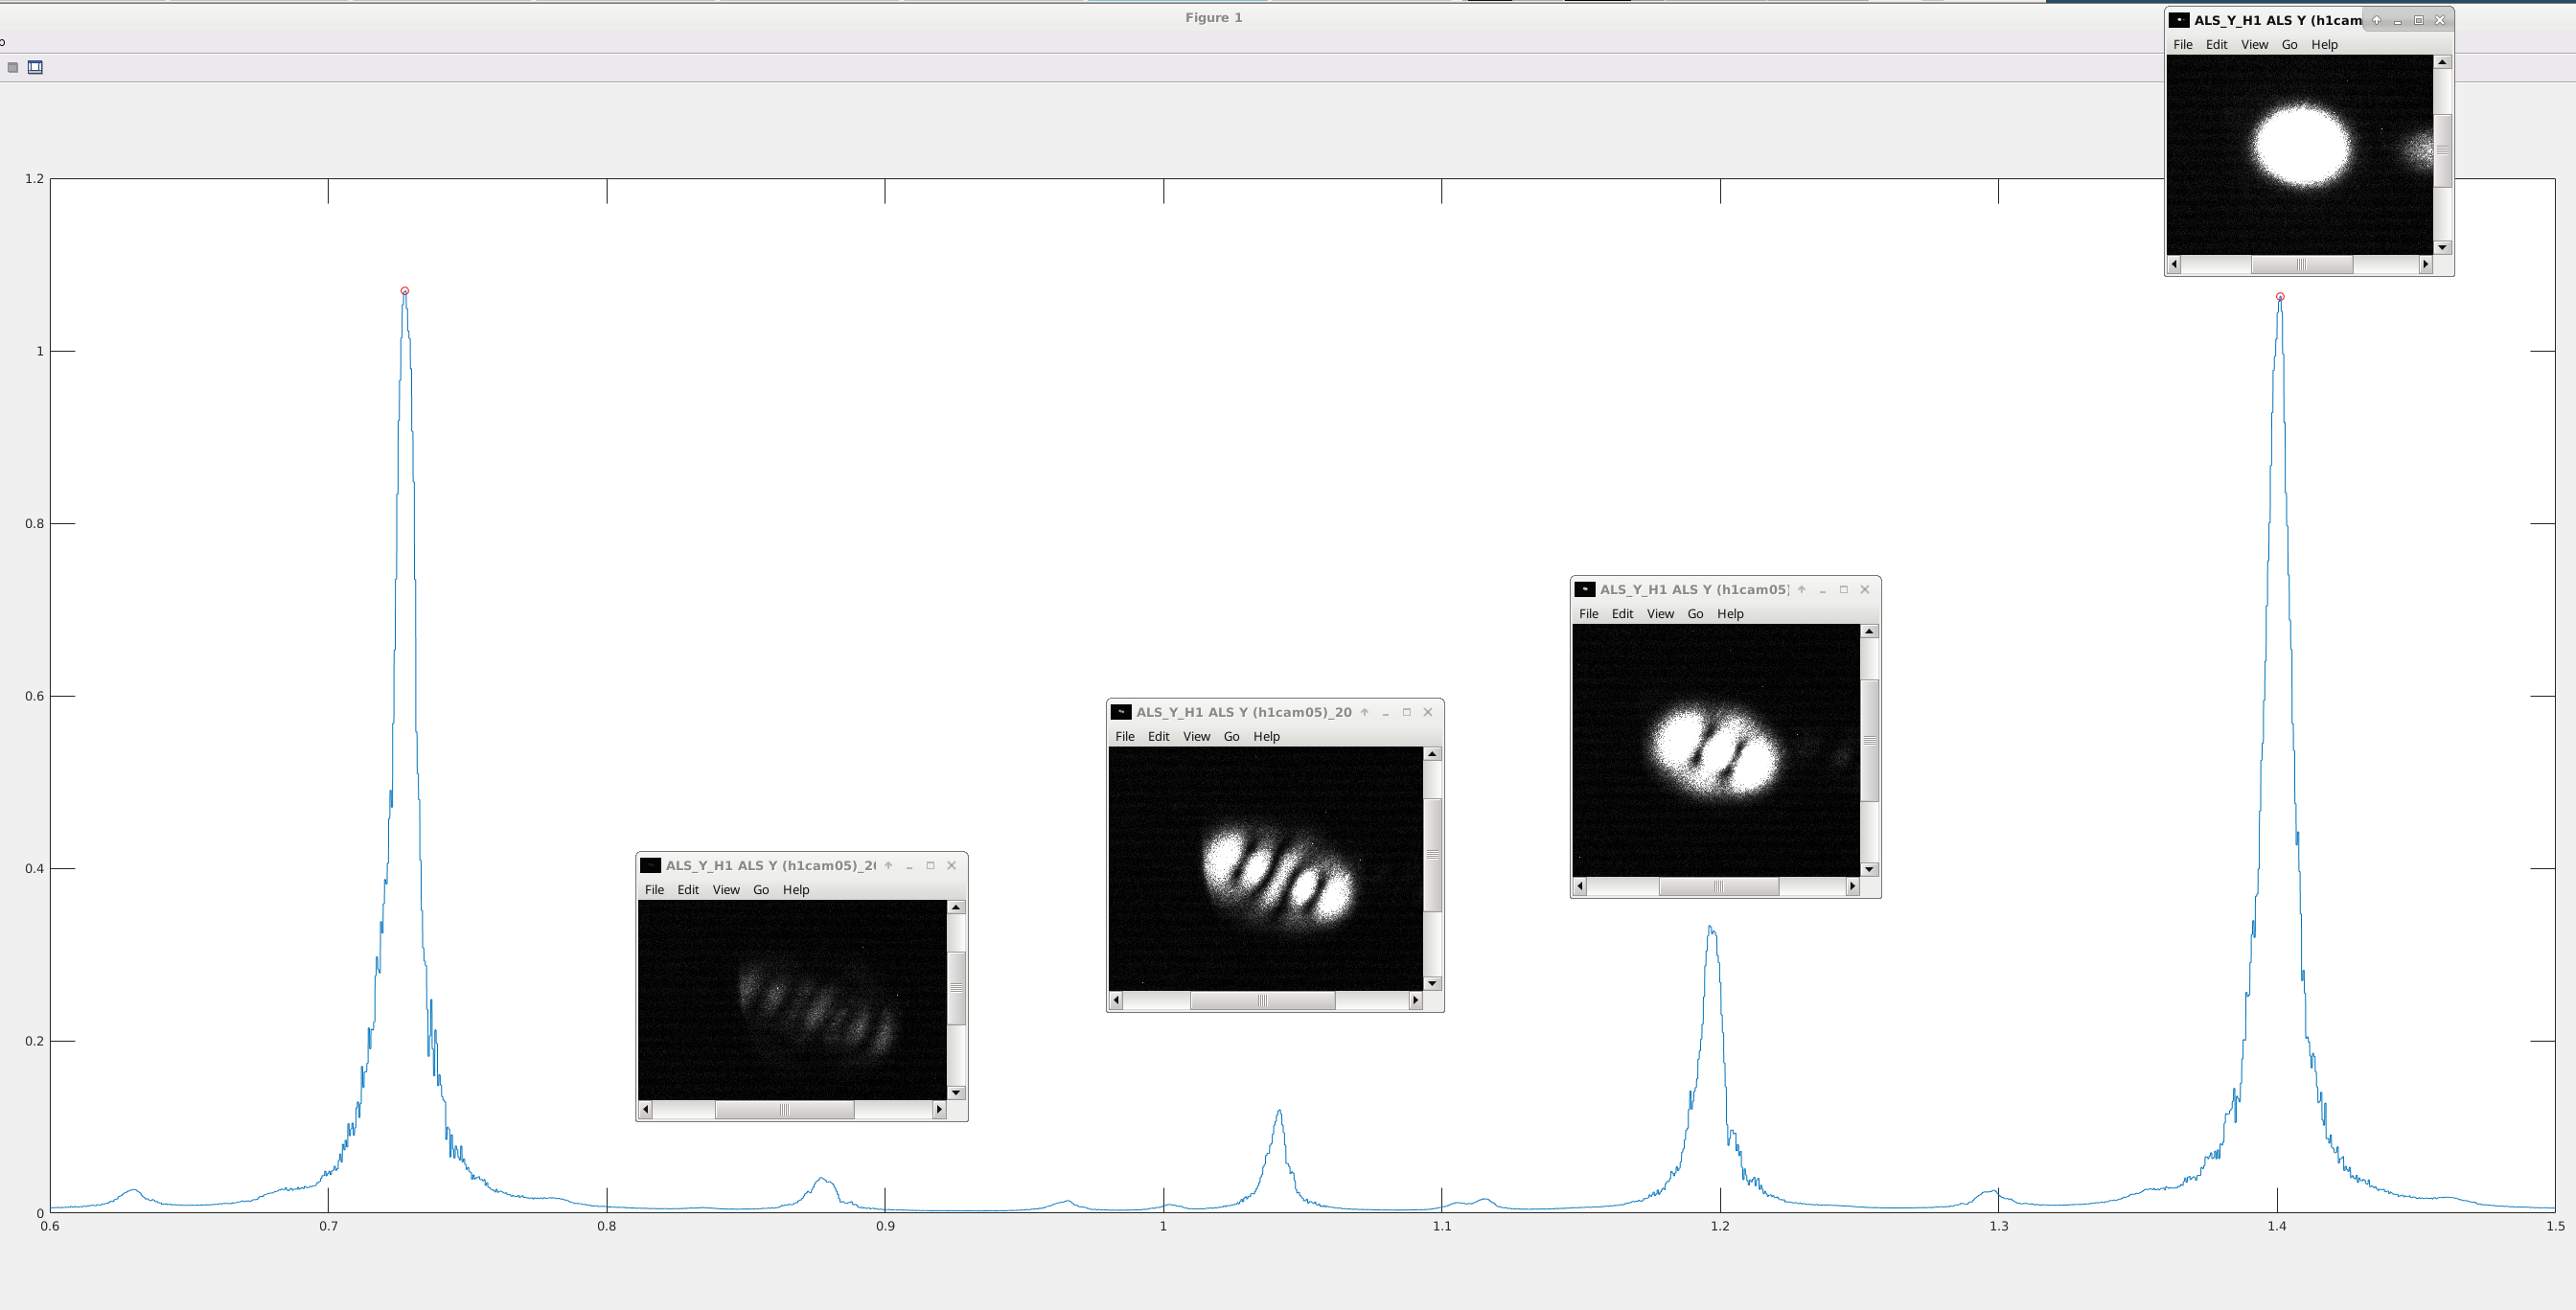
Then I let the X arm freely swing after the green WFS converged, and look at the arm transmission peaks. Attached is the screen shot when the arm was moving with a reasonably constant velocity, together with the video camera image of each of the modes.
There's a very clean mode mismatch signature with 2nd, 4th and 6th order modes present, and the total power in 00 mode seems to be only about 70% of the total.
Jason's measurement shows that the beam size on the table is OK, and even though it might be clipped on the table it cannot explain the mismatch of this magnitude.
We might have to measure the return beam profile from ETMX.