Displaying reports 40761-40780 of 88905.Go to page Start 2035 2036 2037 2038 2039 2040 2041 2042 2043 End
Reports until 16:00, Monday 03 June 2019
LHO General
thomas.shaffer@LIGO.ORG - posted 16:00, Monday 03 June 2019 (49616)
Ops Day Shift Summary

TITLE: 06/03 Day Shift: 15:00-23:00 UTC (08:00-16:00 PST), all times posted in UTC
STATE of H1: Observing at 87Mpc
INCOMING OPERATOR: Cheryl
SHIFT SUMMARY: One drop out of Observing from the squeezer losing lock.

LOG:

H1 SQZ
daniel.sigg@LIGO.ORG - posted 14:16, Monday 03 June 2019 - last comment - 11:32, Thursday 20 June 2019(49619)
Not Enough Power for the SQZ SHG

After the laser power was reduced, there is no longer enough power coming out of SHG to deliver 20 mW into the fiber. This problem was compounded a few days ago when the offset to the power servo was reset to the wrong sign. Compared to the past, we currently run with about 70% of the power into the OPO (or ~14 mW into the fiber). The SHG output power currently reads about 26 mW when it was up 50 mW in the past. HW9 on ISCT6 needs to be adjusted.

Comments related to this report
rahul.kumar@LIGO.ORG - 11:32, Thursday 20 June 2019 (50088)

FRS ticket 13109,

https://services.ligo-la.caltech.edu/FRS/show_bug.cgi?id=13109

H1 General
thomas.shaffer@LIGO.ORG - posted 13:13, Monday 03 June 2019 (49618)
Out of Observing 2000 - 2009 UTC

Squeezer lost lock, had to take the SQZ_MAANGER to DOWN and then back up to SQUEEZING.

LHO General
thomas.shaffer@LIGO.ORG - posted 11:14, Monday 03 June 2019 (49617)
Morning Meeting Minutes

Maintenance planned so far:

H1 PSL
edmond.merilh@LIGO.ORG - posted 08:19, Monday 03 June 2019 (49614)
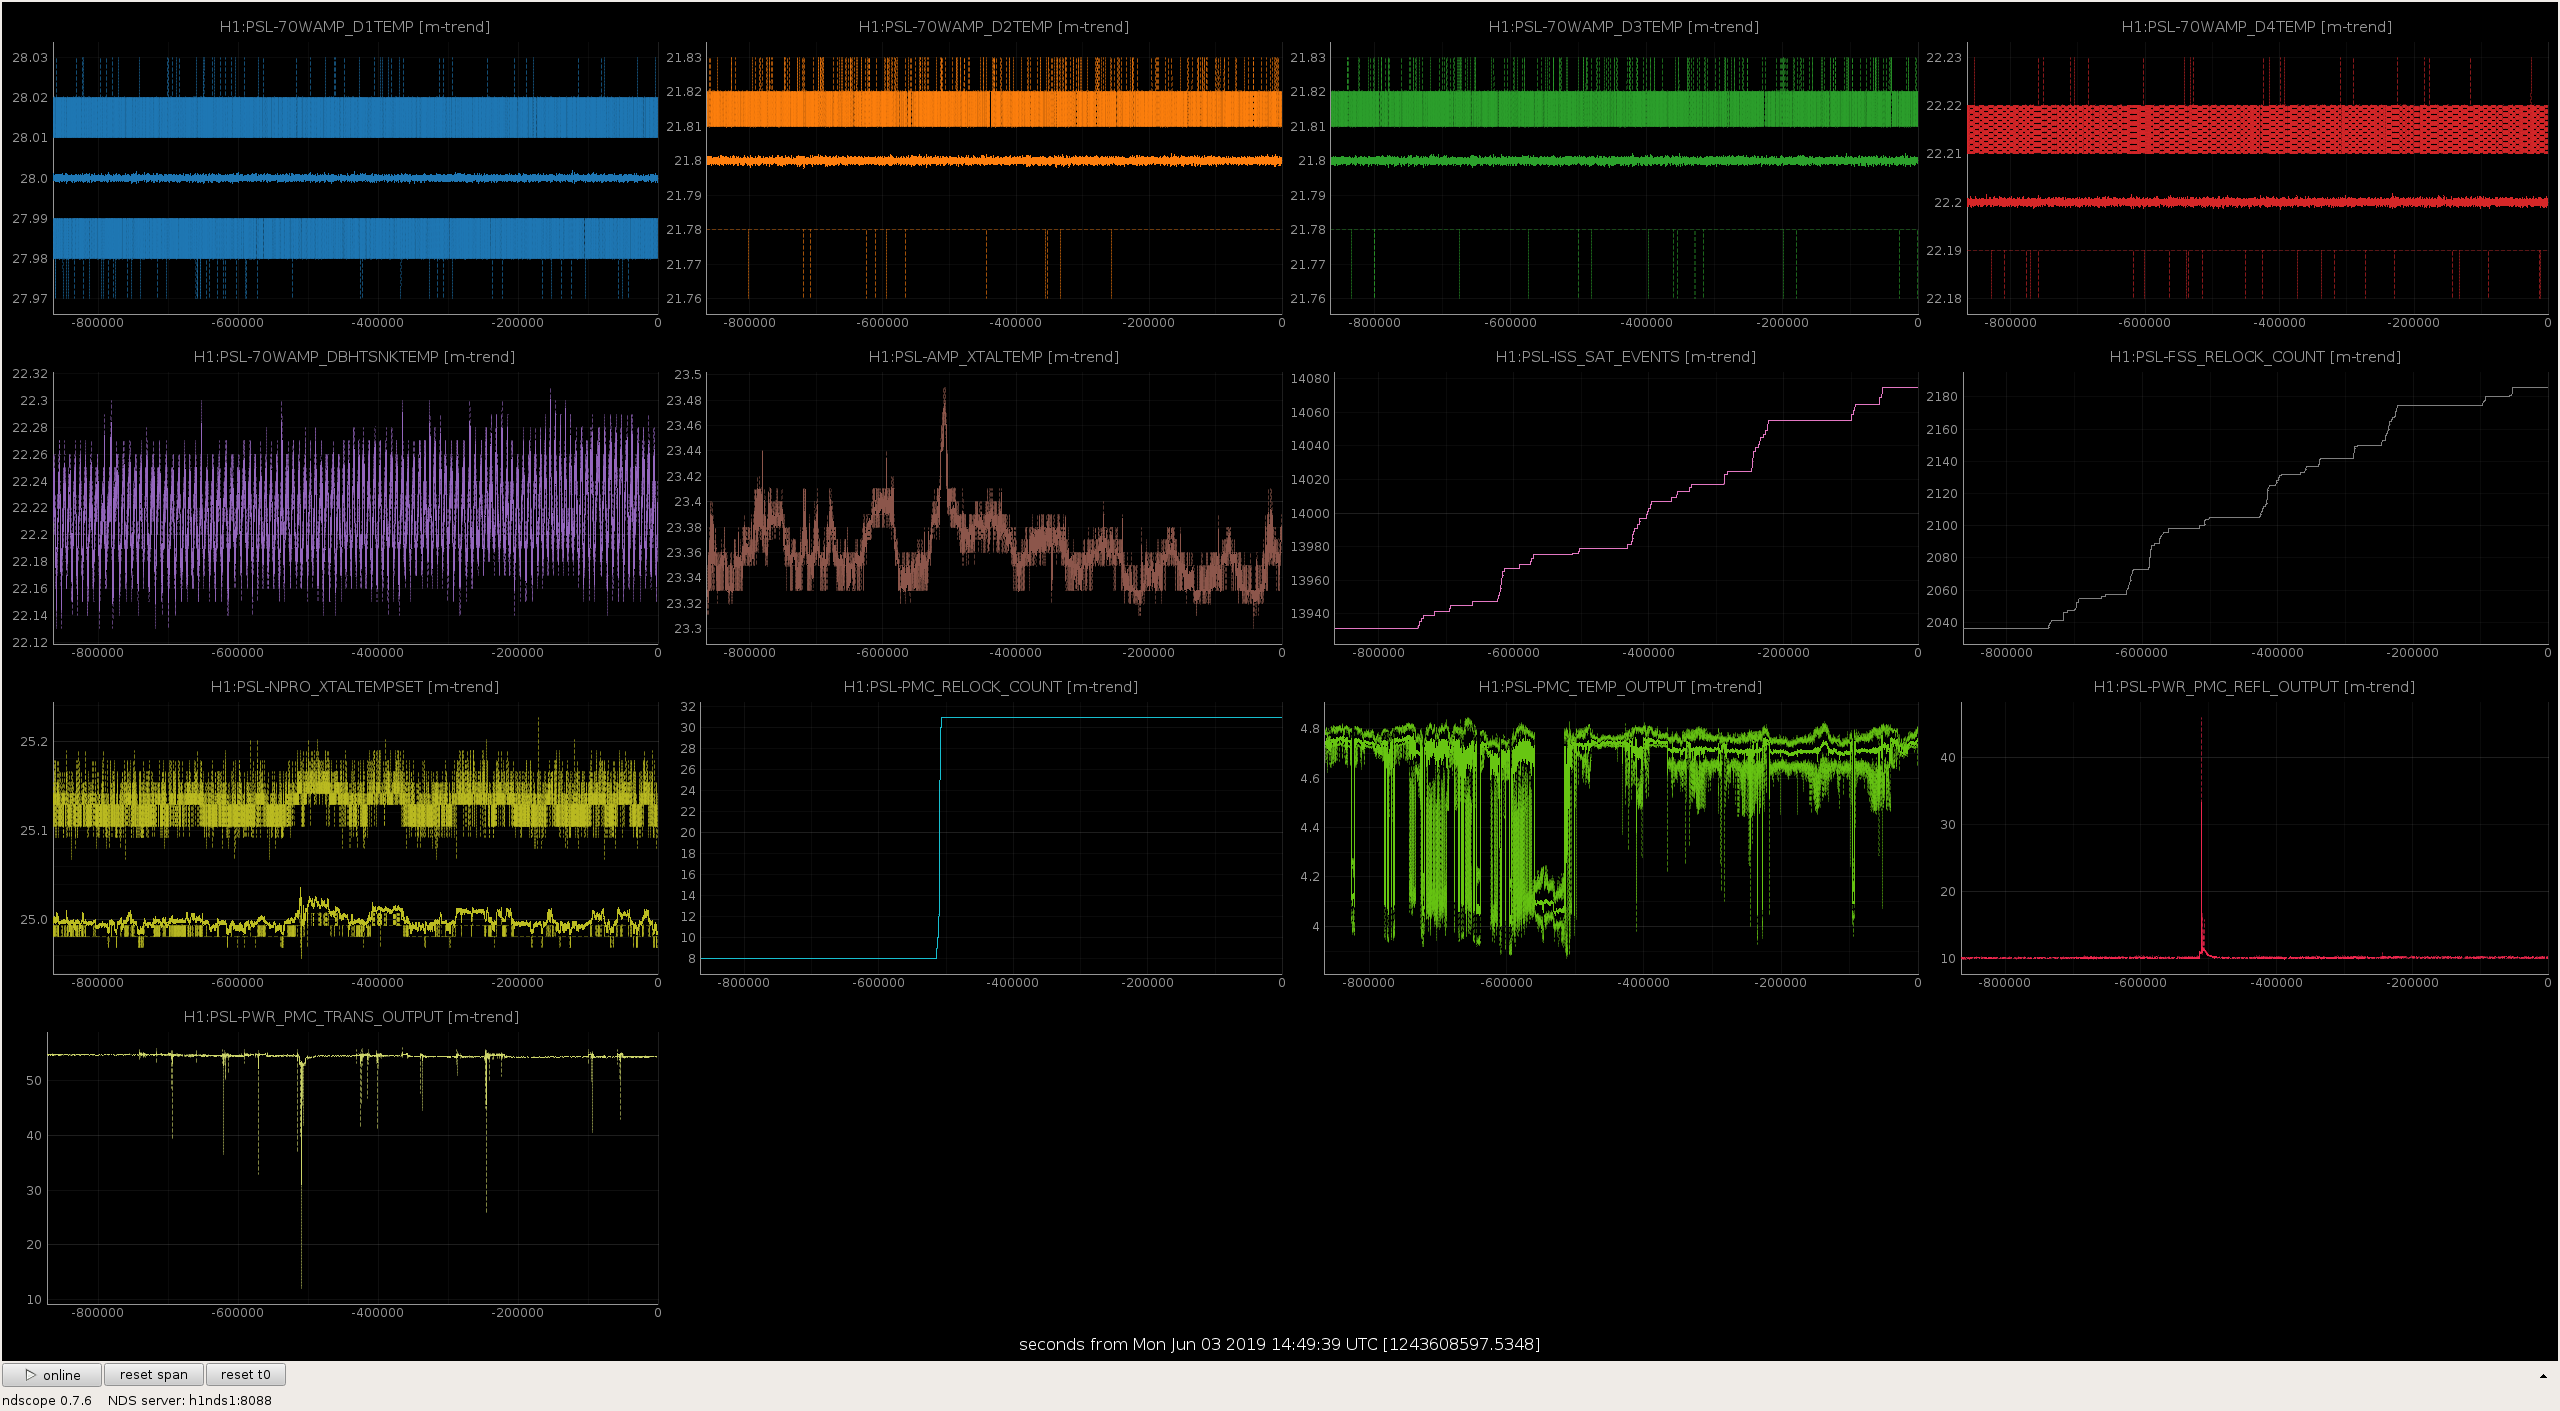
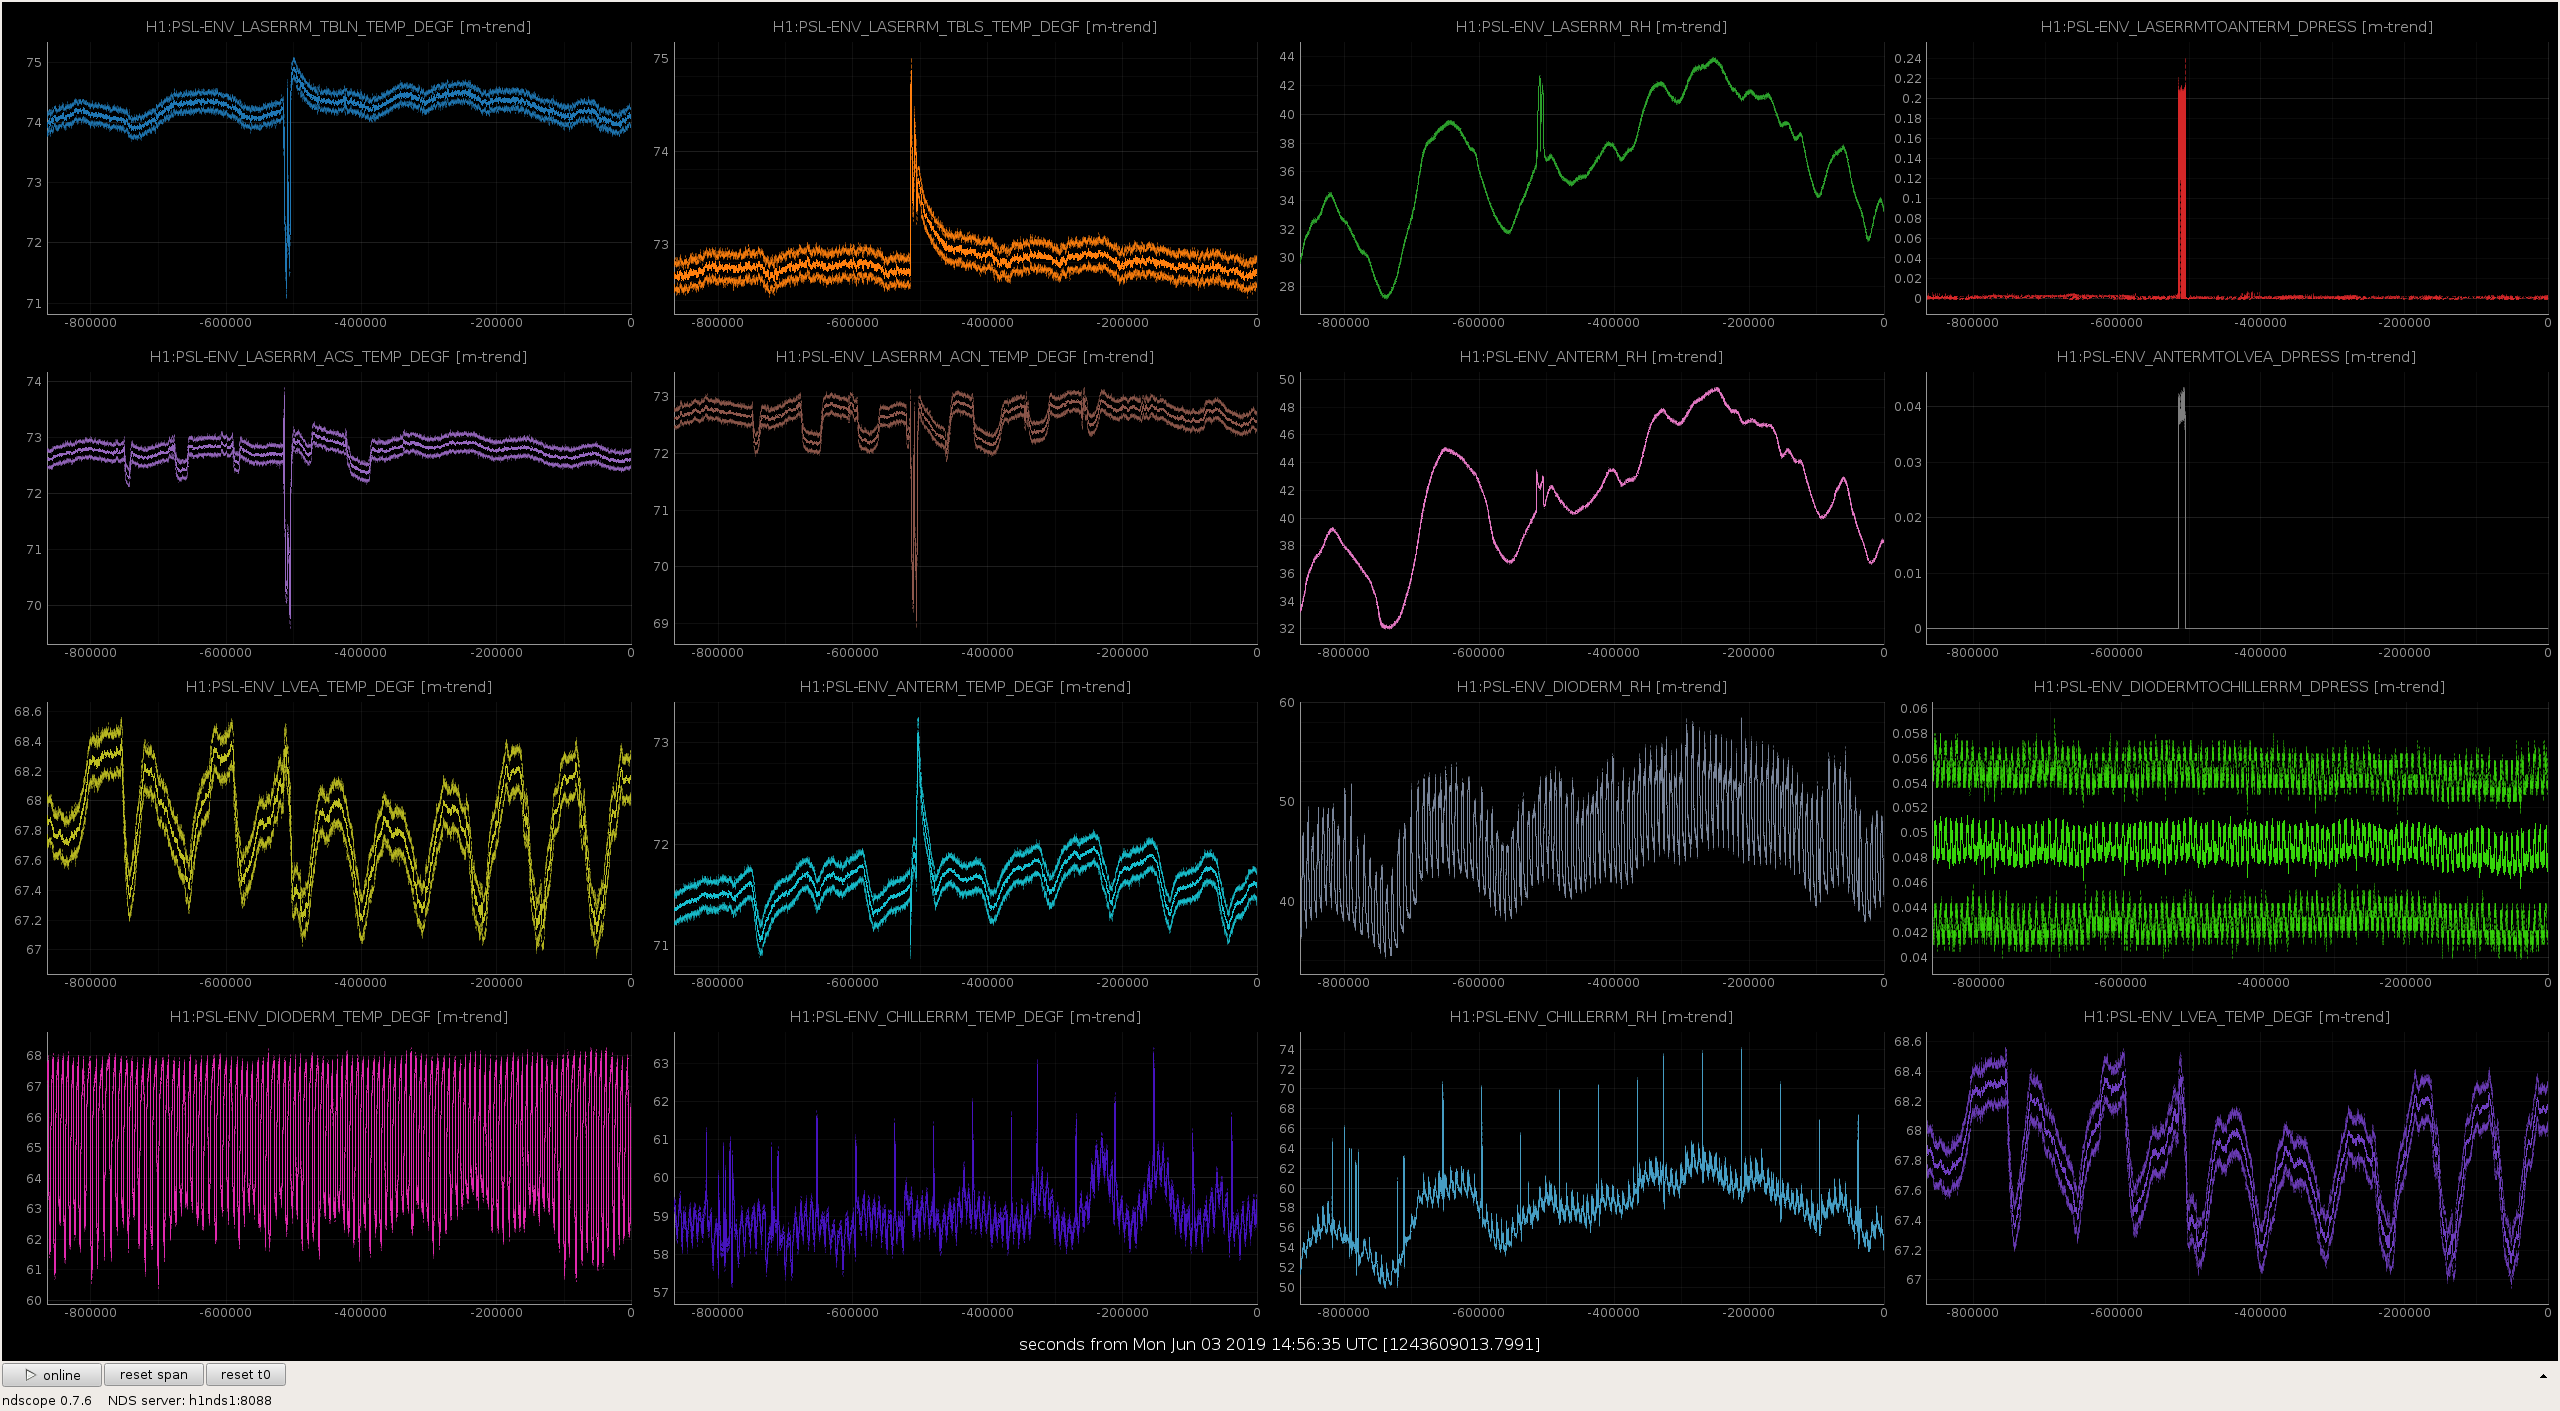
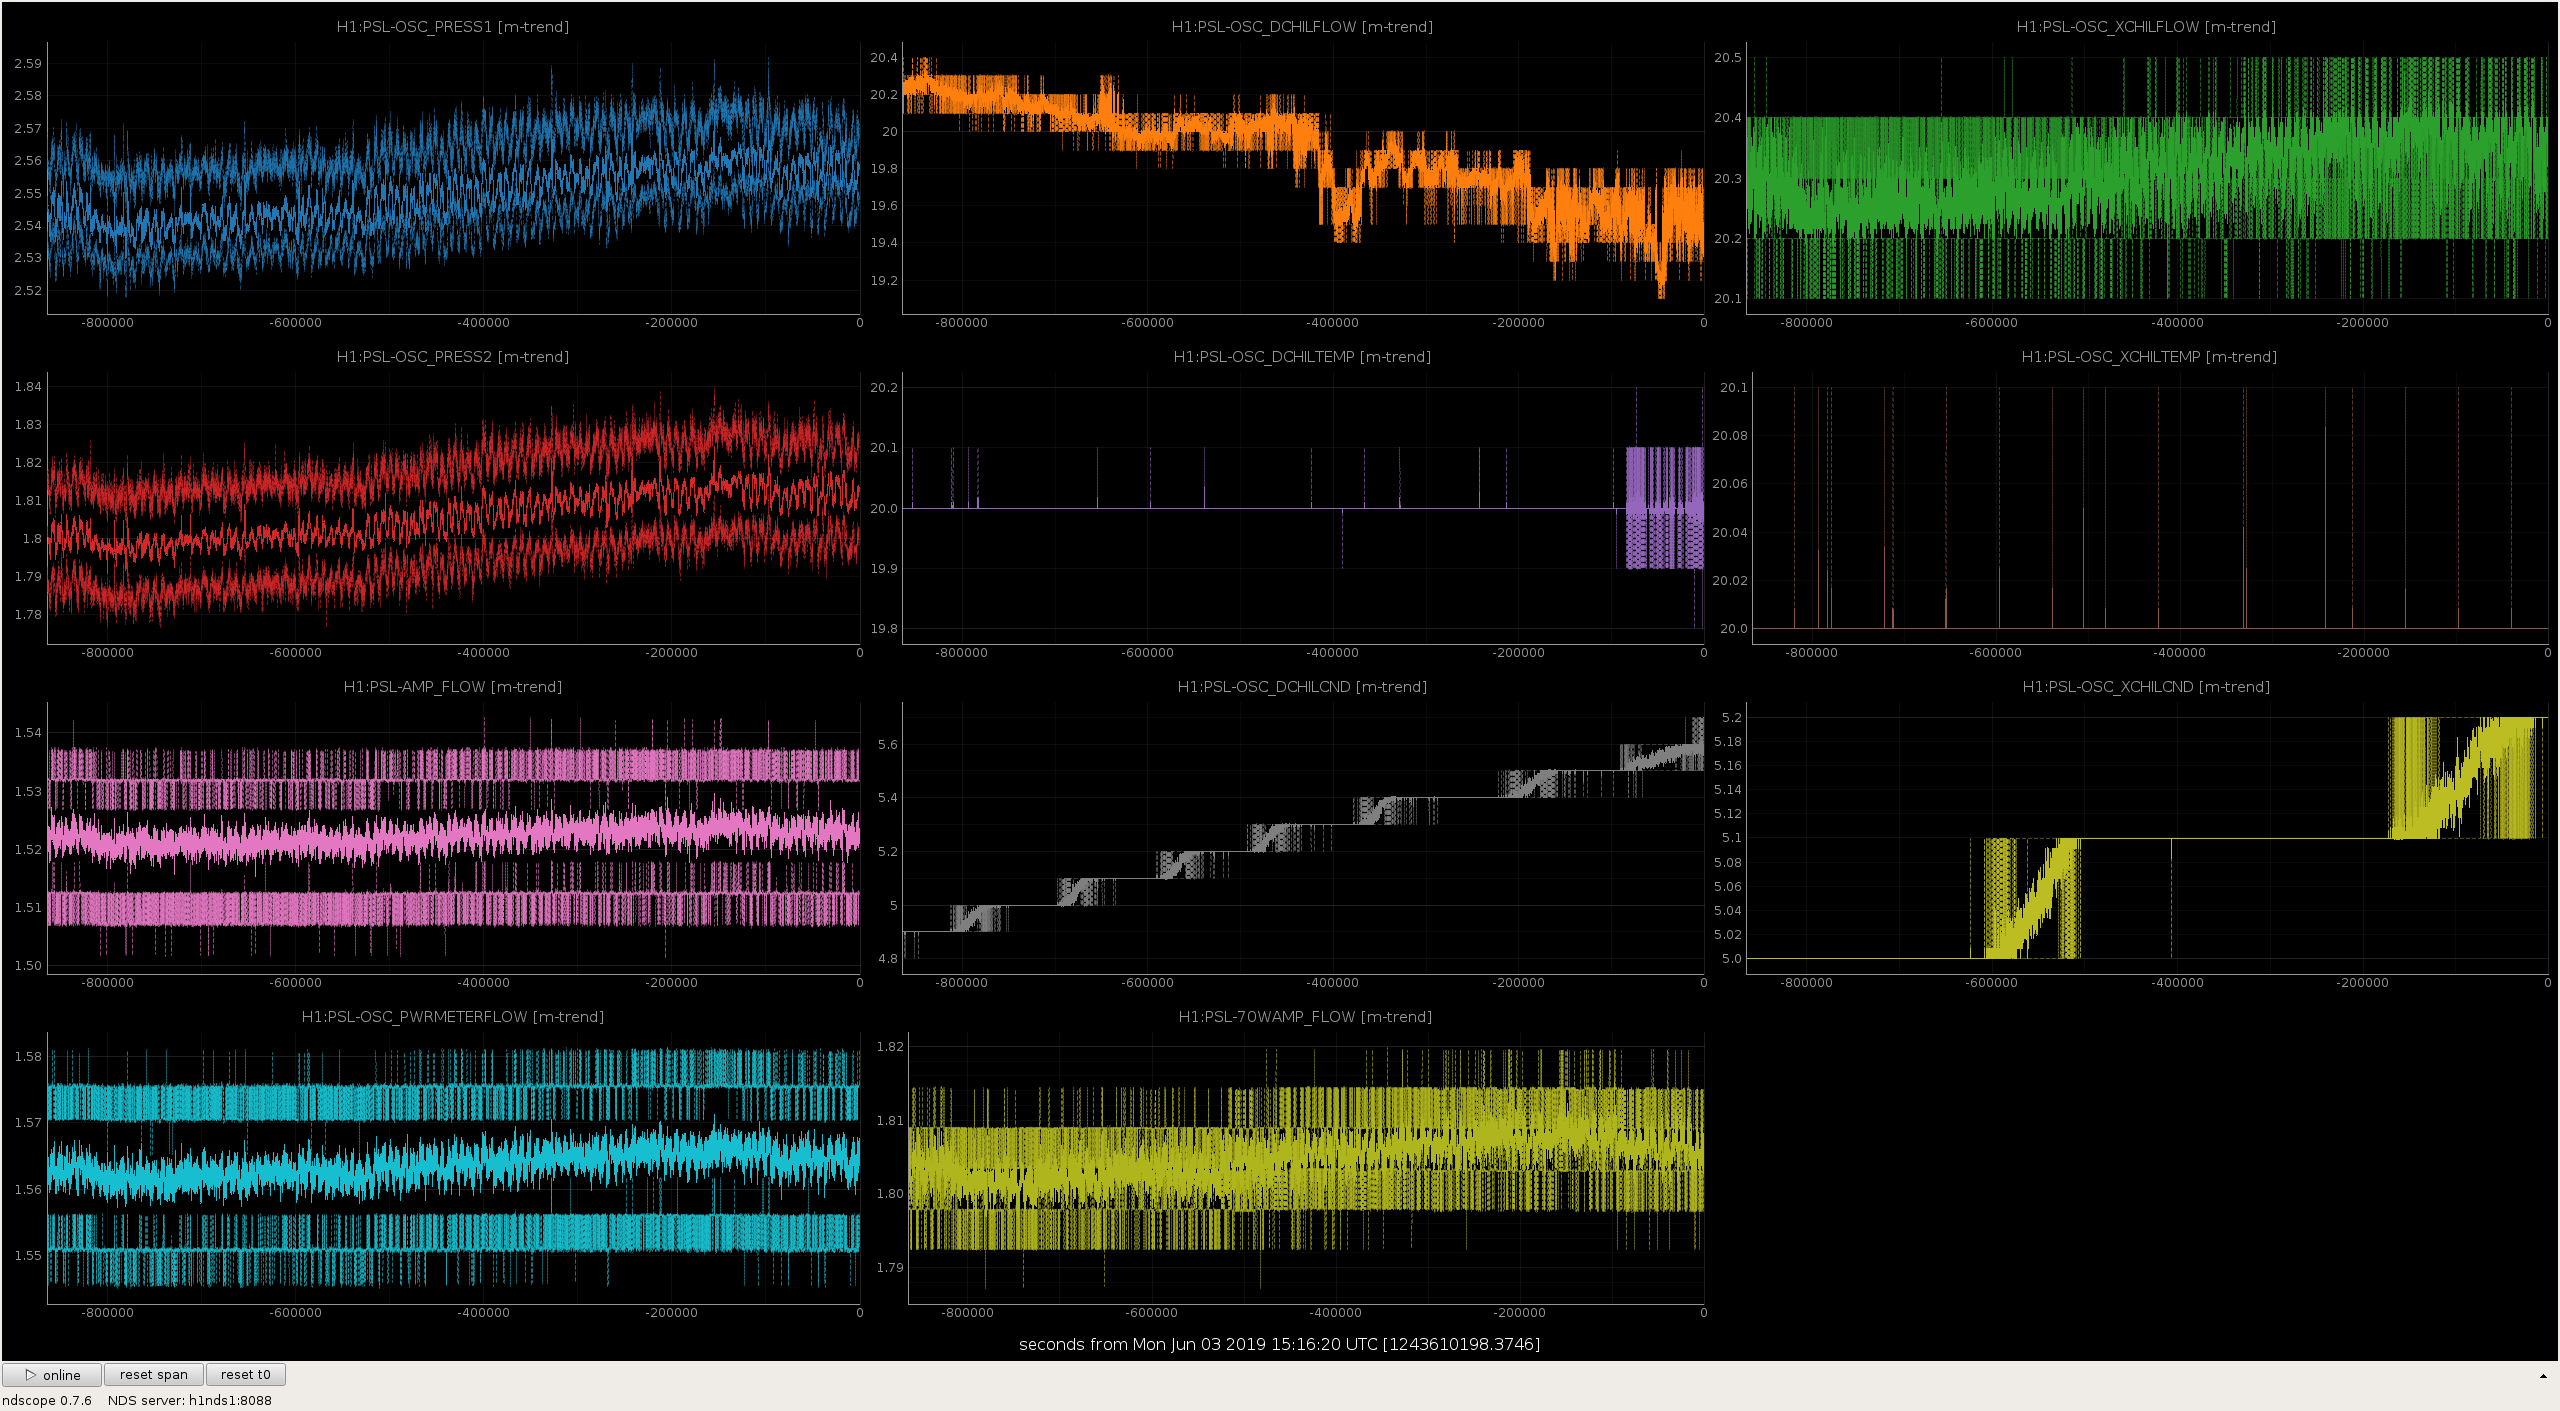
PSL Weekly Report - 10 Day Trends FAMIS #10612

All plots seem nominally ok.

Images attached to this report
LHO General
corey.gray@LIGO.ORG - posted 08:11, Monday 03 June 2019 (49608)
OWL Operator Summary

TITLE: 06/03 Owl Shift: 07:00-15:00 UTC (00:00-08:00 PST), all times posted in UTC
STATE of H1: Observing at 108Mpc
INCOMING OPERATOR: TJ
SHIFT SUMMARY:

Nice shift which started a little shaky with an EQ and winds are beginning to pick up a little.  Currently, we are at 13.75hrs (for locking & observing).
LOG:

LHO General
thomas.shaffer@LIGO.ORG - posted 08:11, Monday 03 June 2019 (49613)
Ops Day Shift Transition

TITLE: 06/03 Day Shift: 15:00-23:00 UTC (08:00-16:00 PST), all times posted in UTC
STATE of H1: Observing at 109Mpc
OUTGOING OPERATOR: Corey
CURRENT ENVIRONMENT:
    Wind: 22mph Gusts, 17mph 5min avg
    Primary useism: 0.09 μm/s
    Secondary useism: 0.08 μm/s
QUICK SUMMARY: 13.5 hr lock wind is picking up a bit.

H1 AOS (AOS, SUS)
corey.gray@LIGO.ORG - posted 04:50, Monday 03 June 2019 (49612)
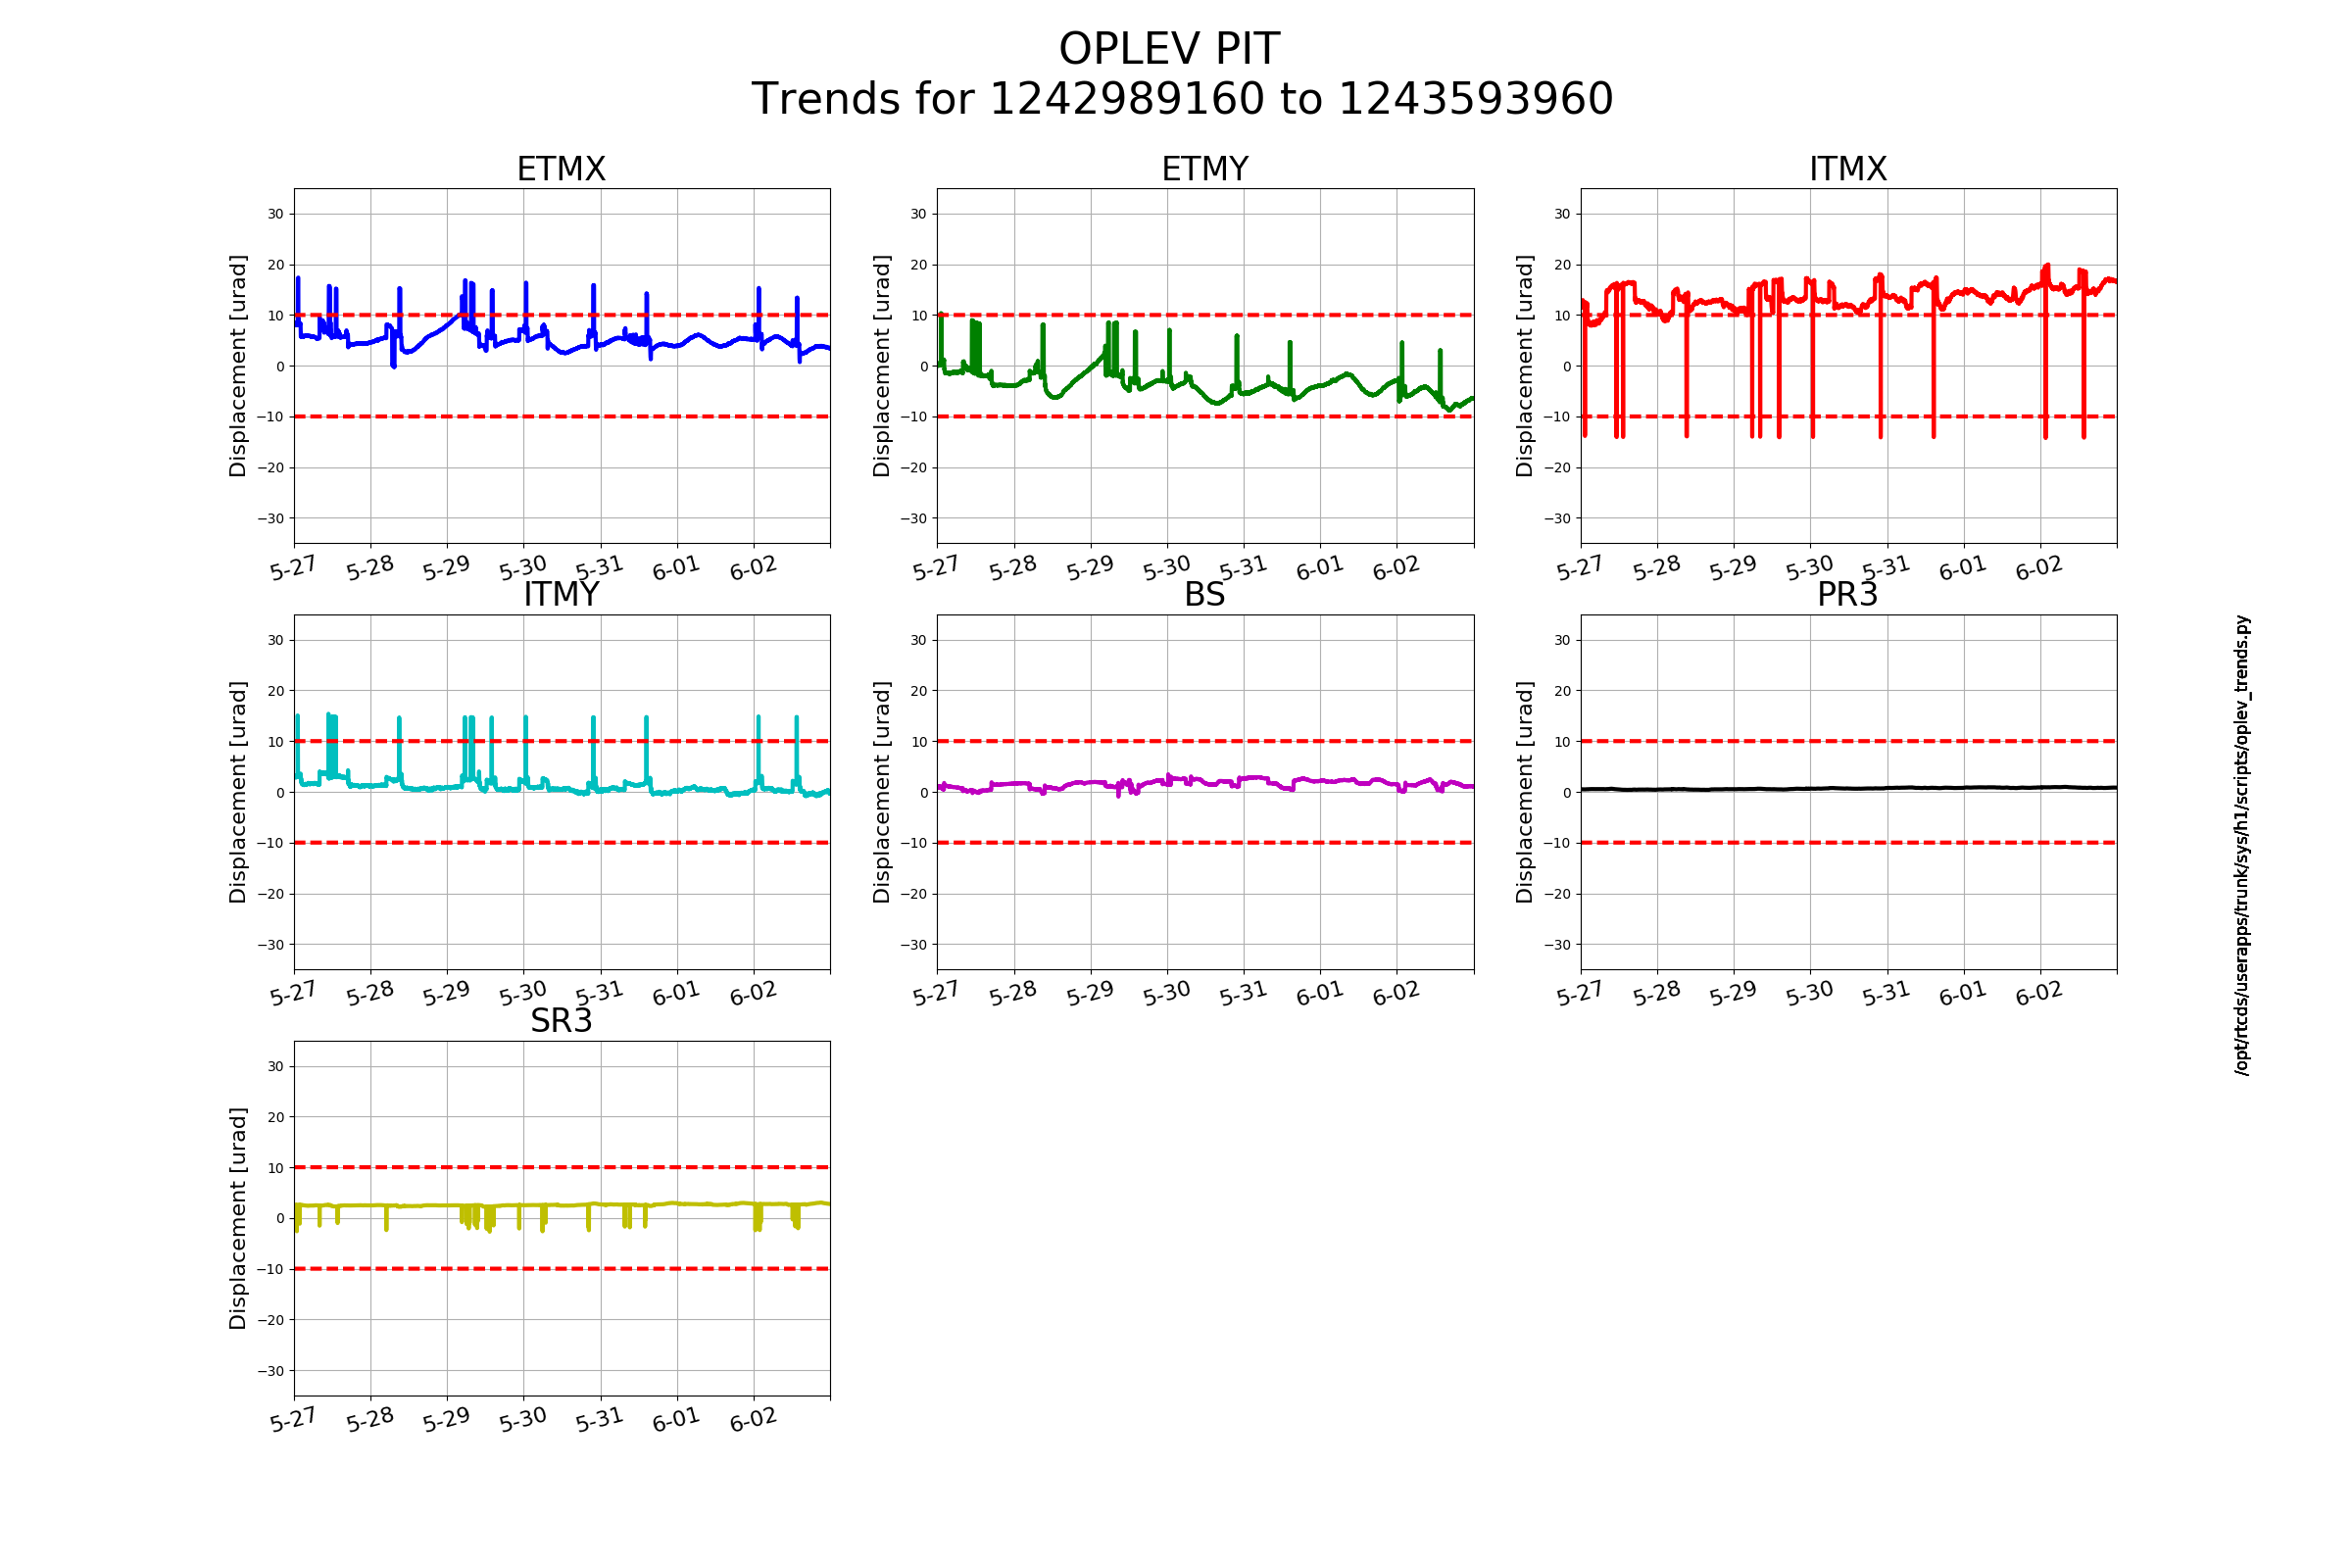
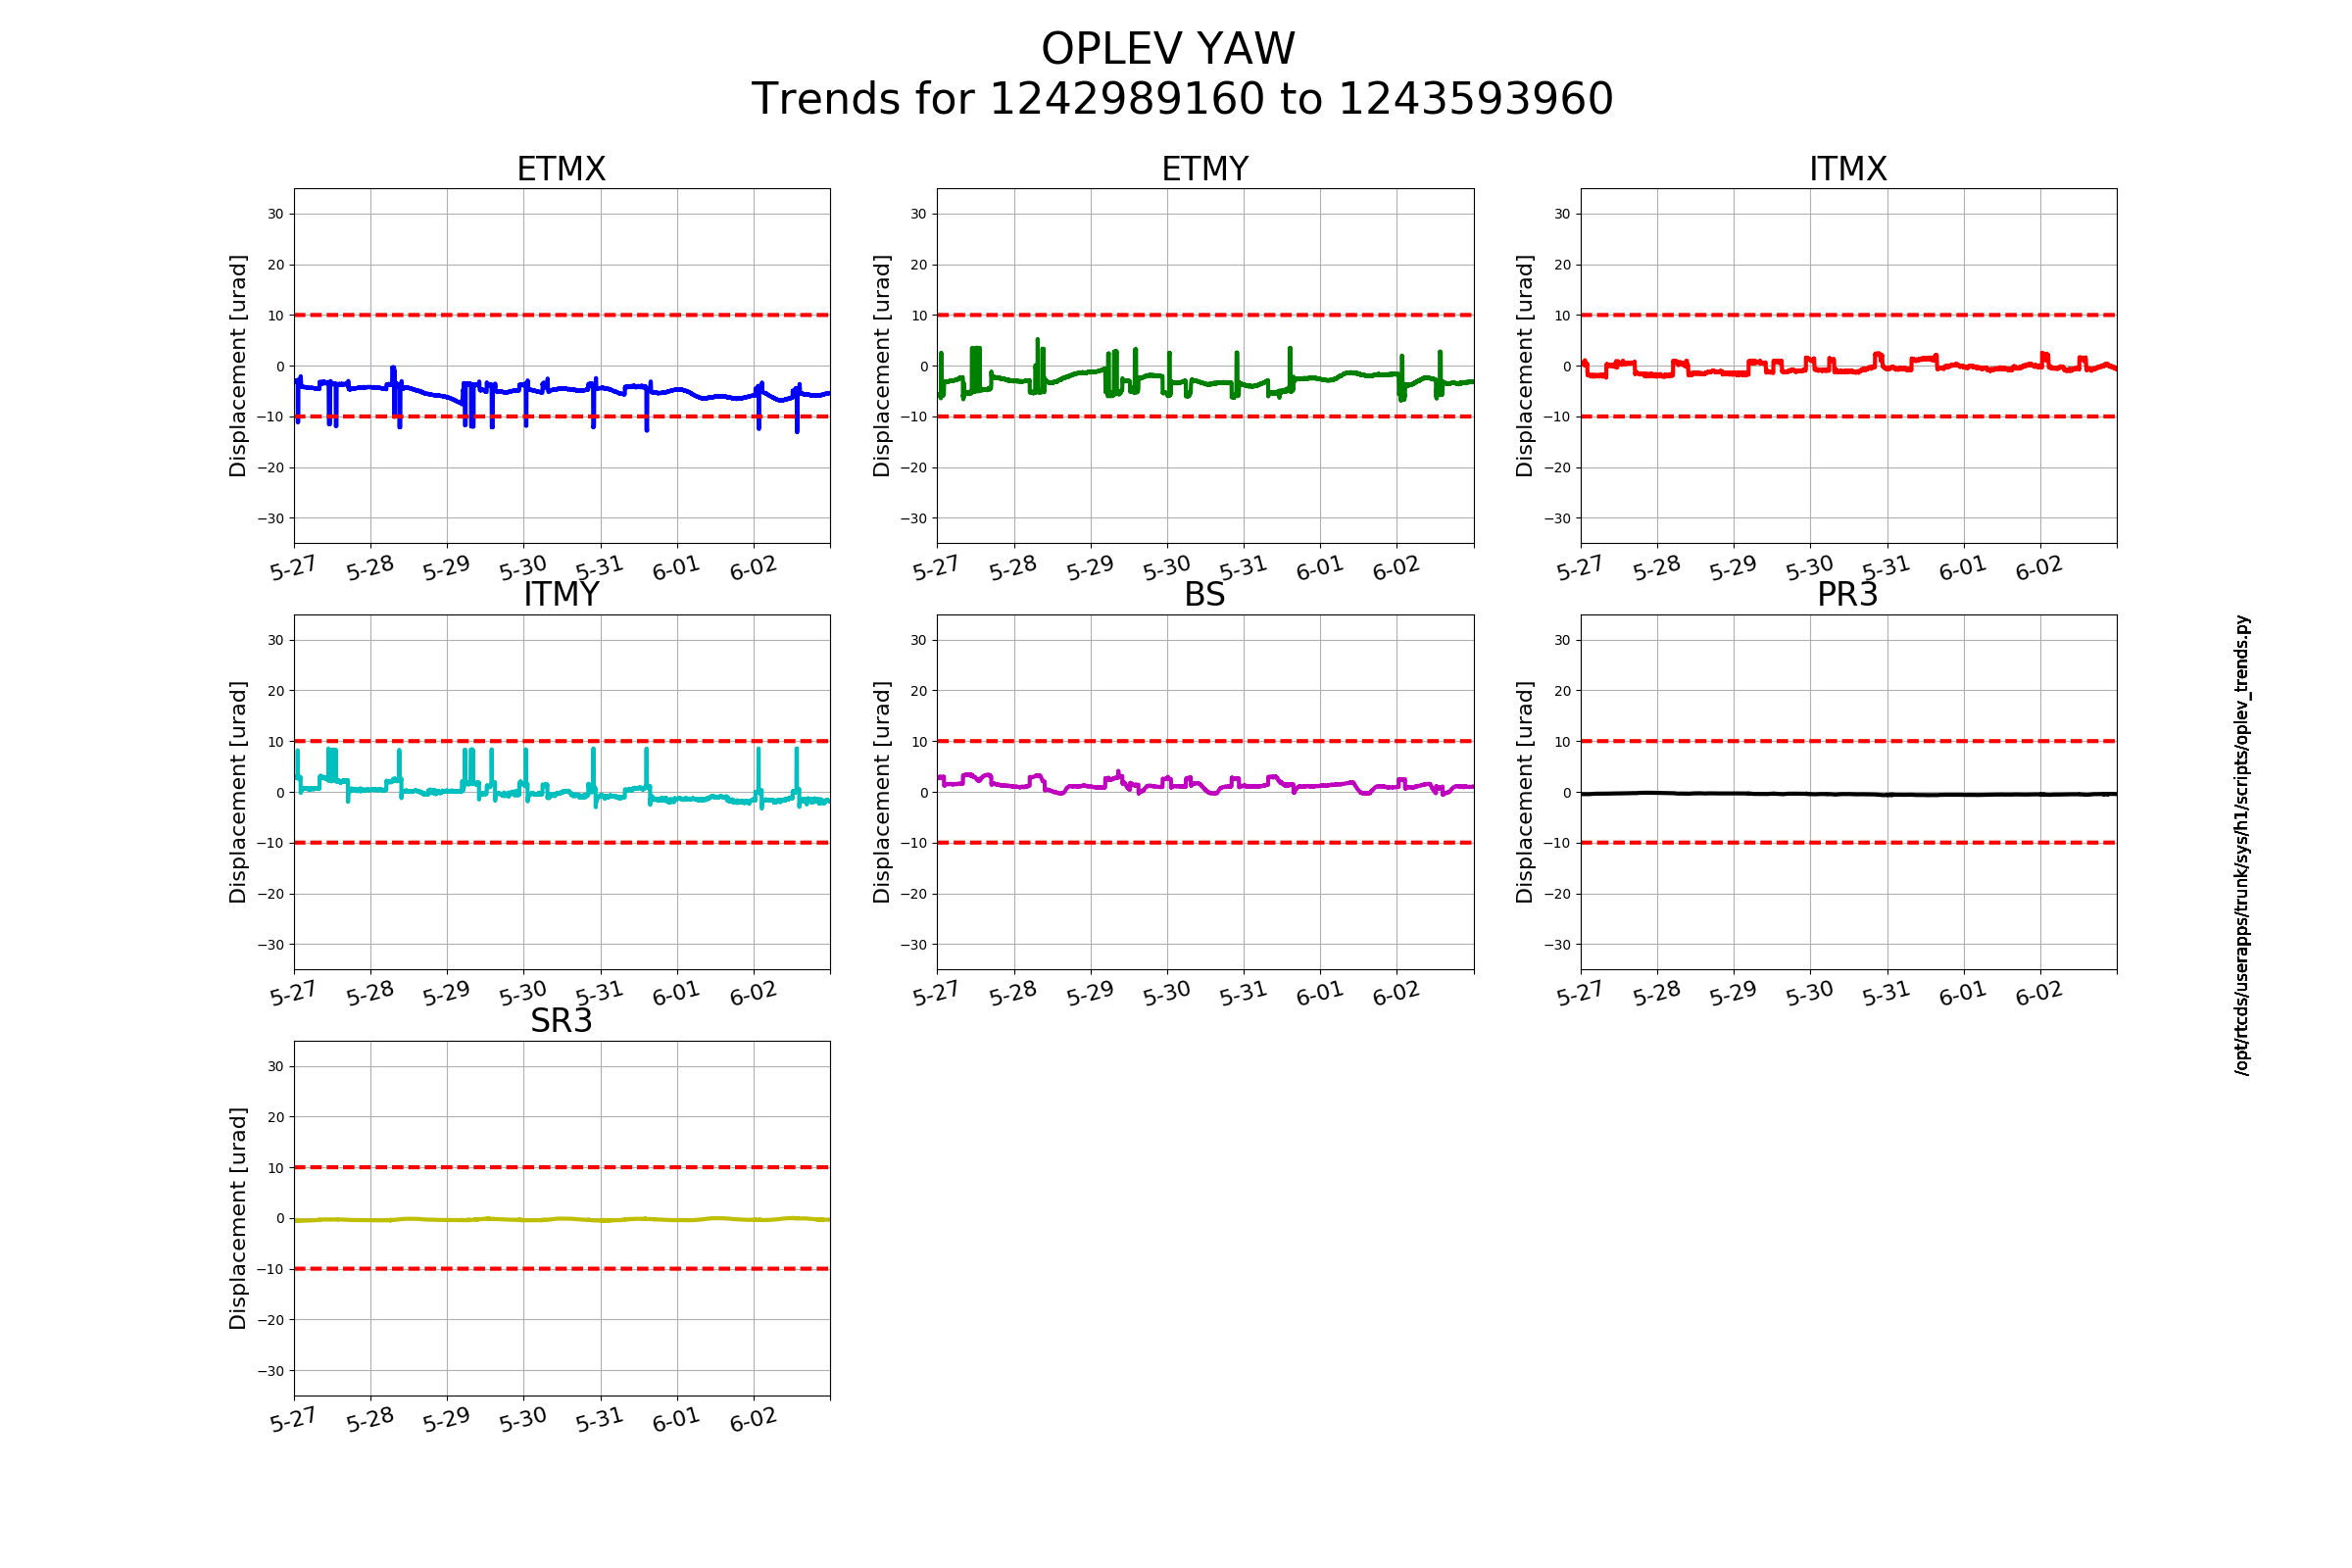
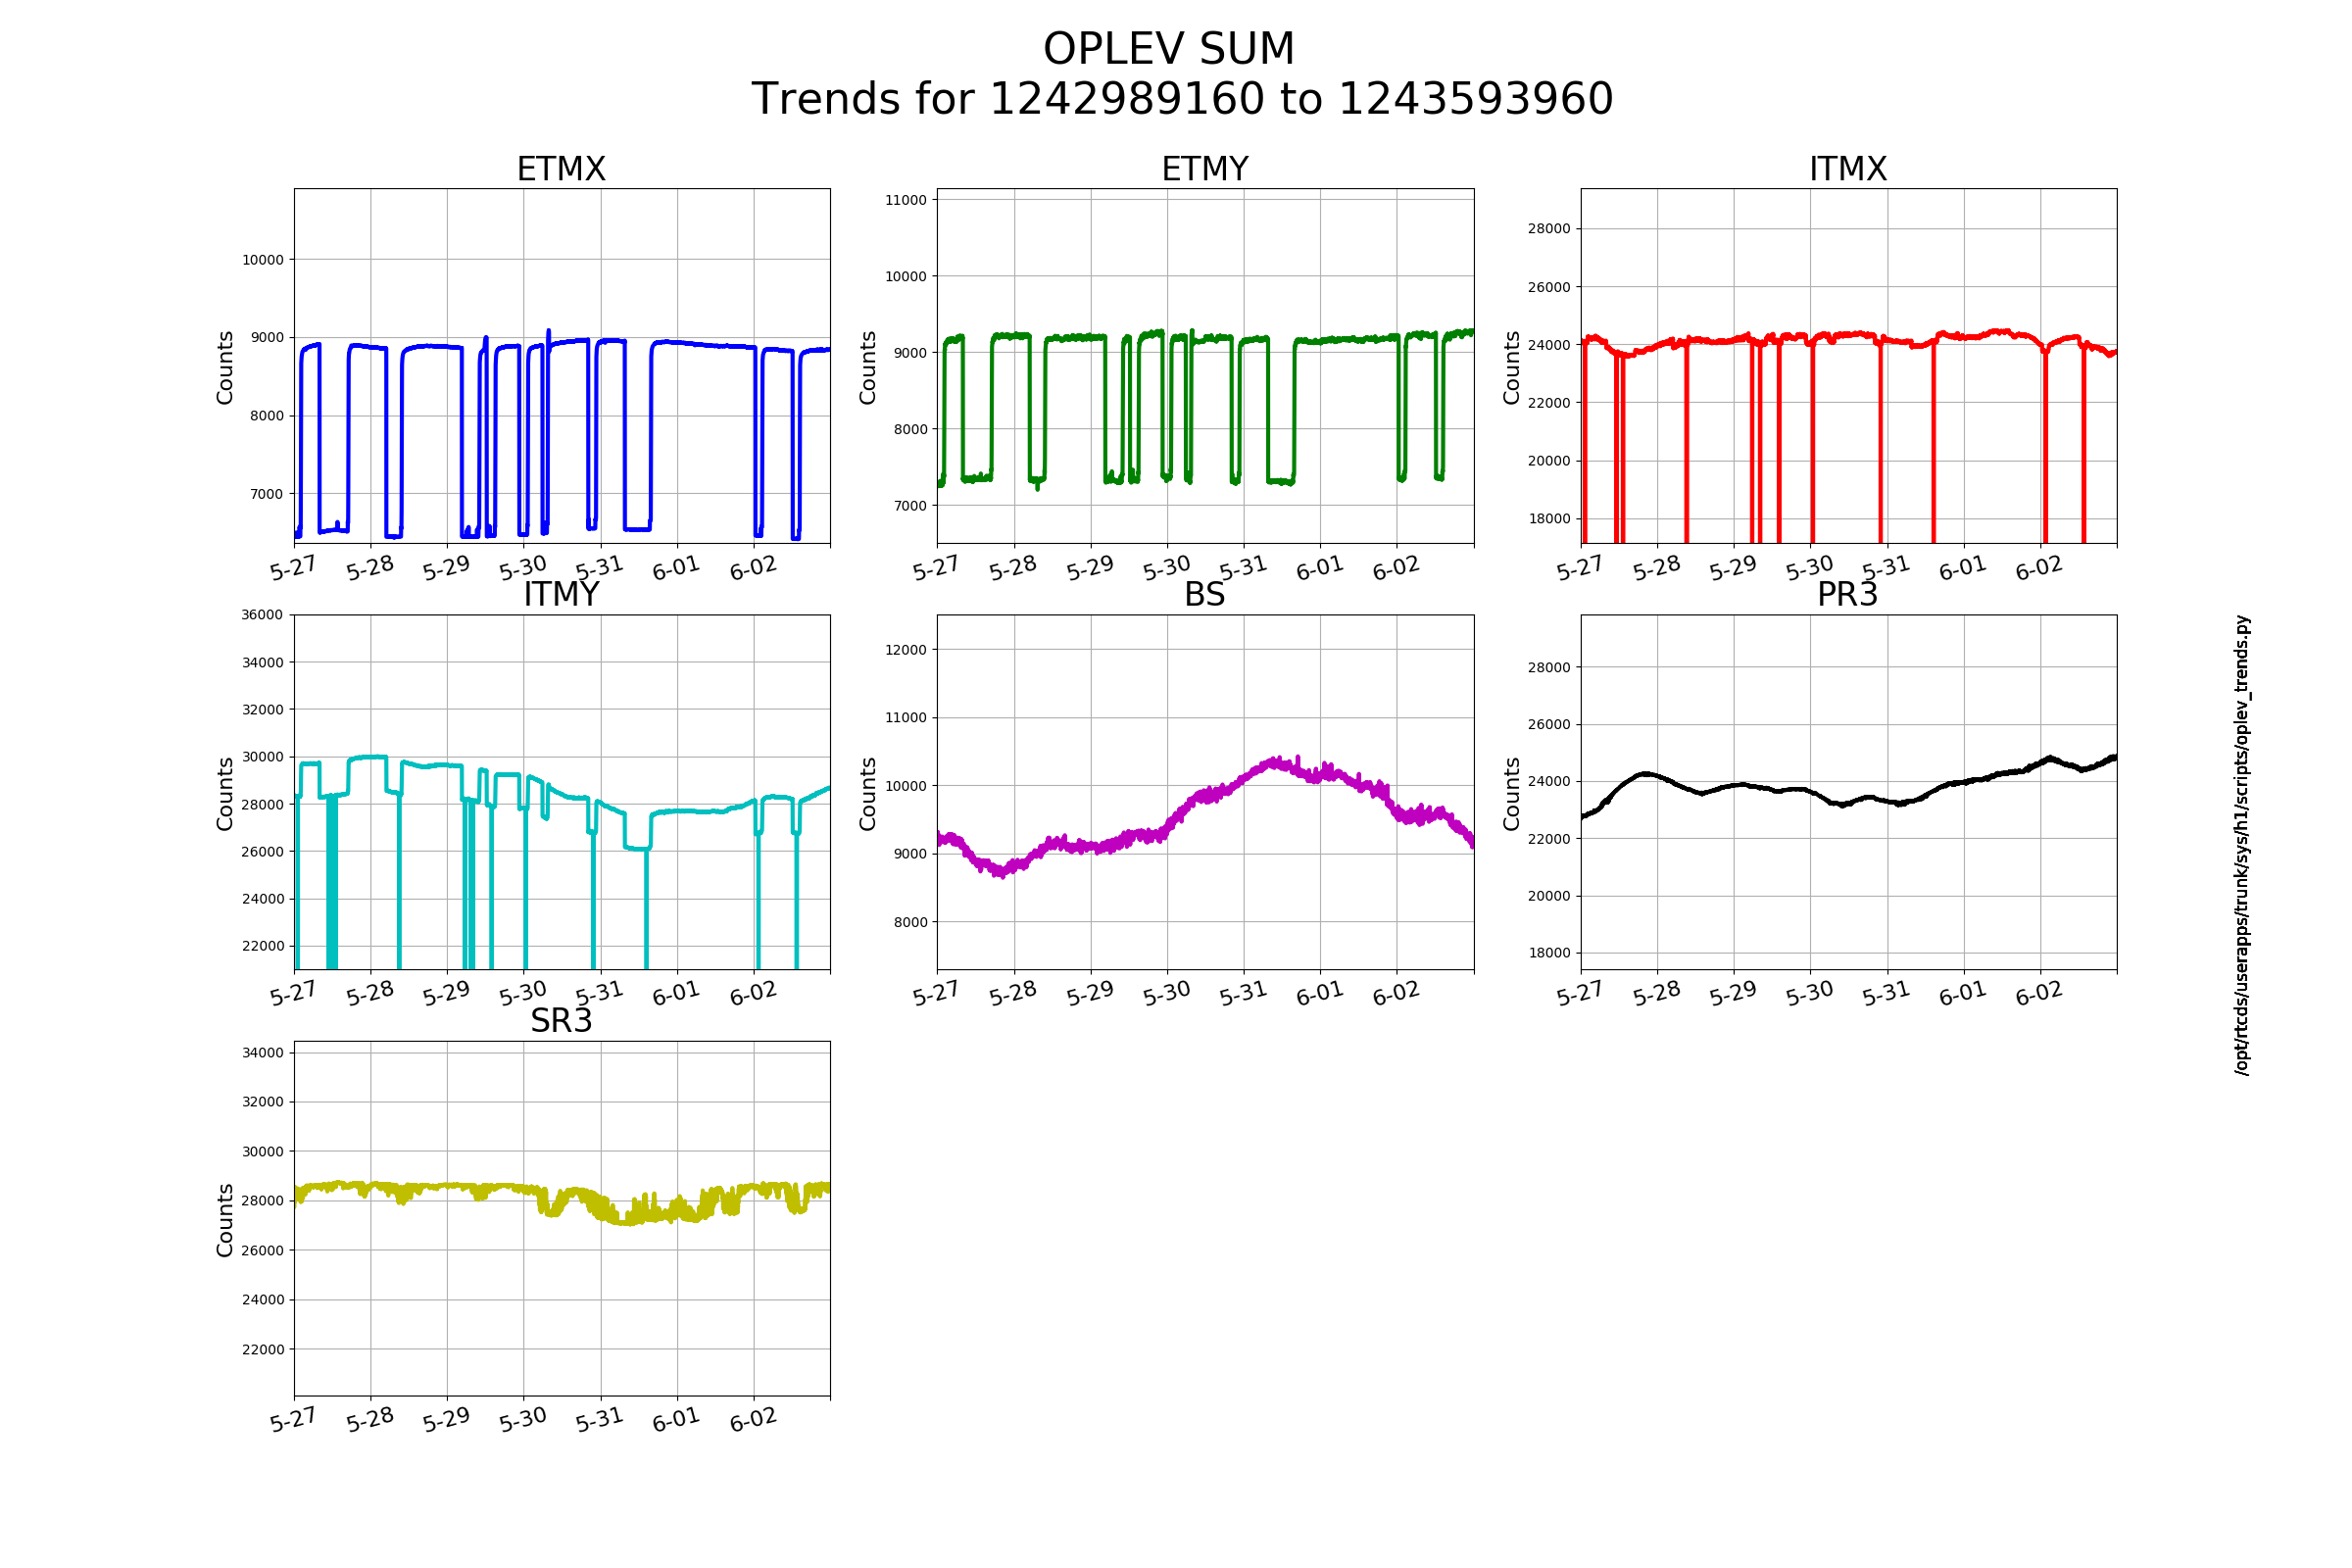
Optical Lever 7 Day Trends (FAMIS #11220)

Attached are trends for oplevs.

NOTE:

Images attached to this report
H1 PSL (PSL)
corey.gray@LIGO.ORG - posted 04:43, Monday 03 June 2019 (49611)
PSL Weekly Report (FAMIS #11015)

No issues to report.
    Laser Status:
    Front End Power is 31.83W (should be around 30 W)
    70W Output Power is 70.84W
    Front End Watch is GREEN
    70W Watch is GREEN

    PMC:
    It has been locked 5 days, 17 hr 22 minutes (should be days/weeks)
    Reflected power = 10.15Watts
    Transmitted power = 54.39Watts
    PowerSum = 64.54Watts.

    FSS:
    It has been locked for 0 days 11 hr and 23 min (should be days/weeks)
    TPD[V] = 5.056V (min 0.9V)

    ISS:
    The diffracted power is around 2.2%
    Last saturation event was 0 days 11 hours and 23 minutes ago (should be days/weeks)

H1 SEI (SEI)
corey.gray@LIGO.ORG - posted 04:39, Monday 03 June 2019 - last comment - 12:27, Thursday 20 June 2019(49610)
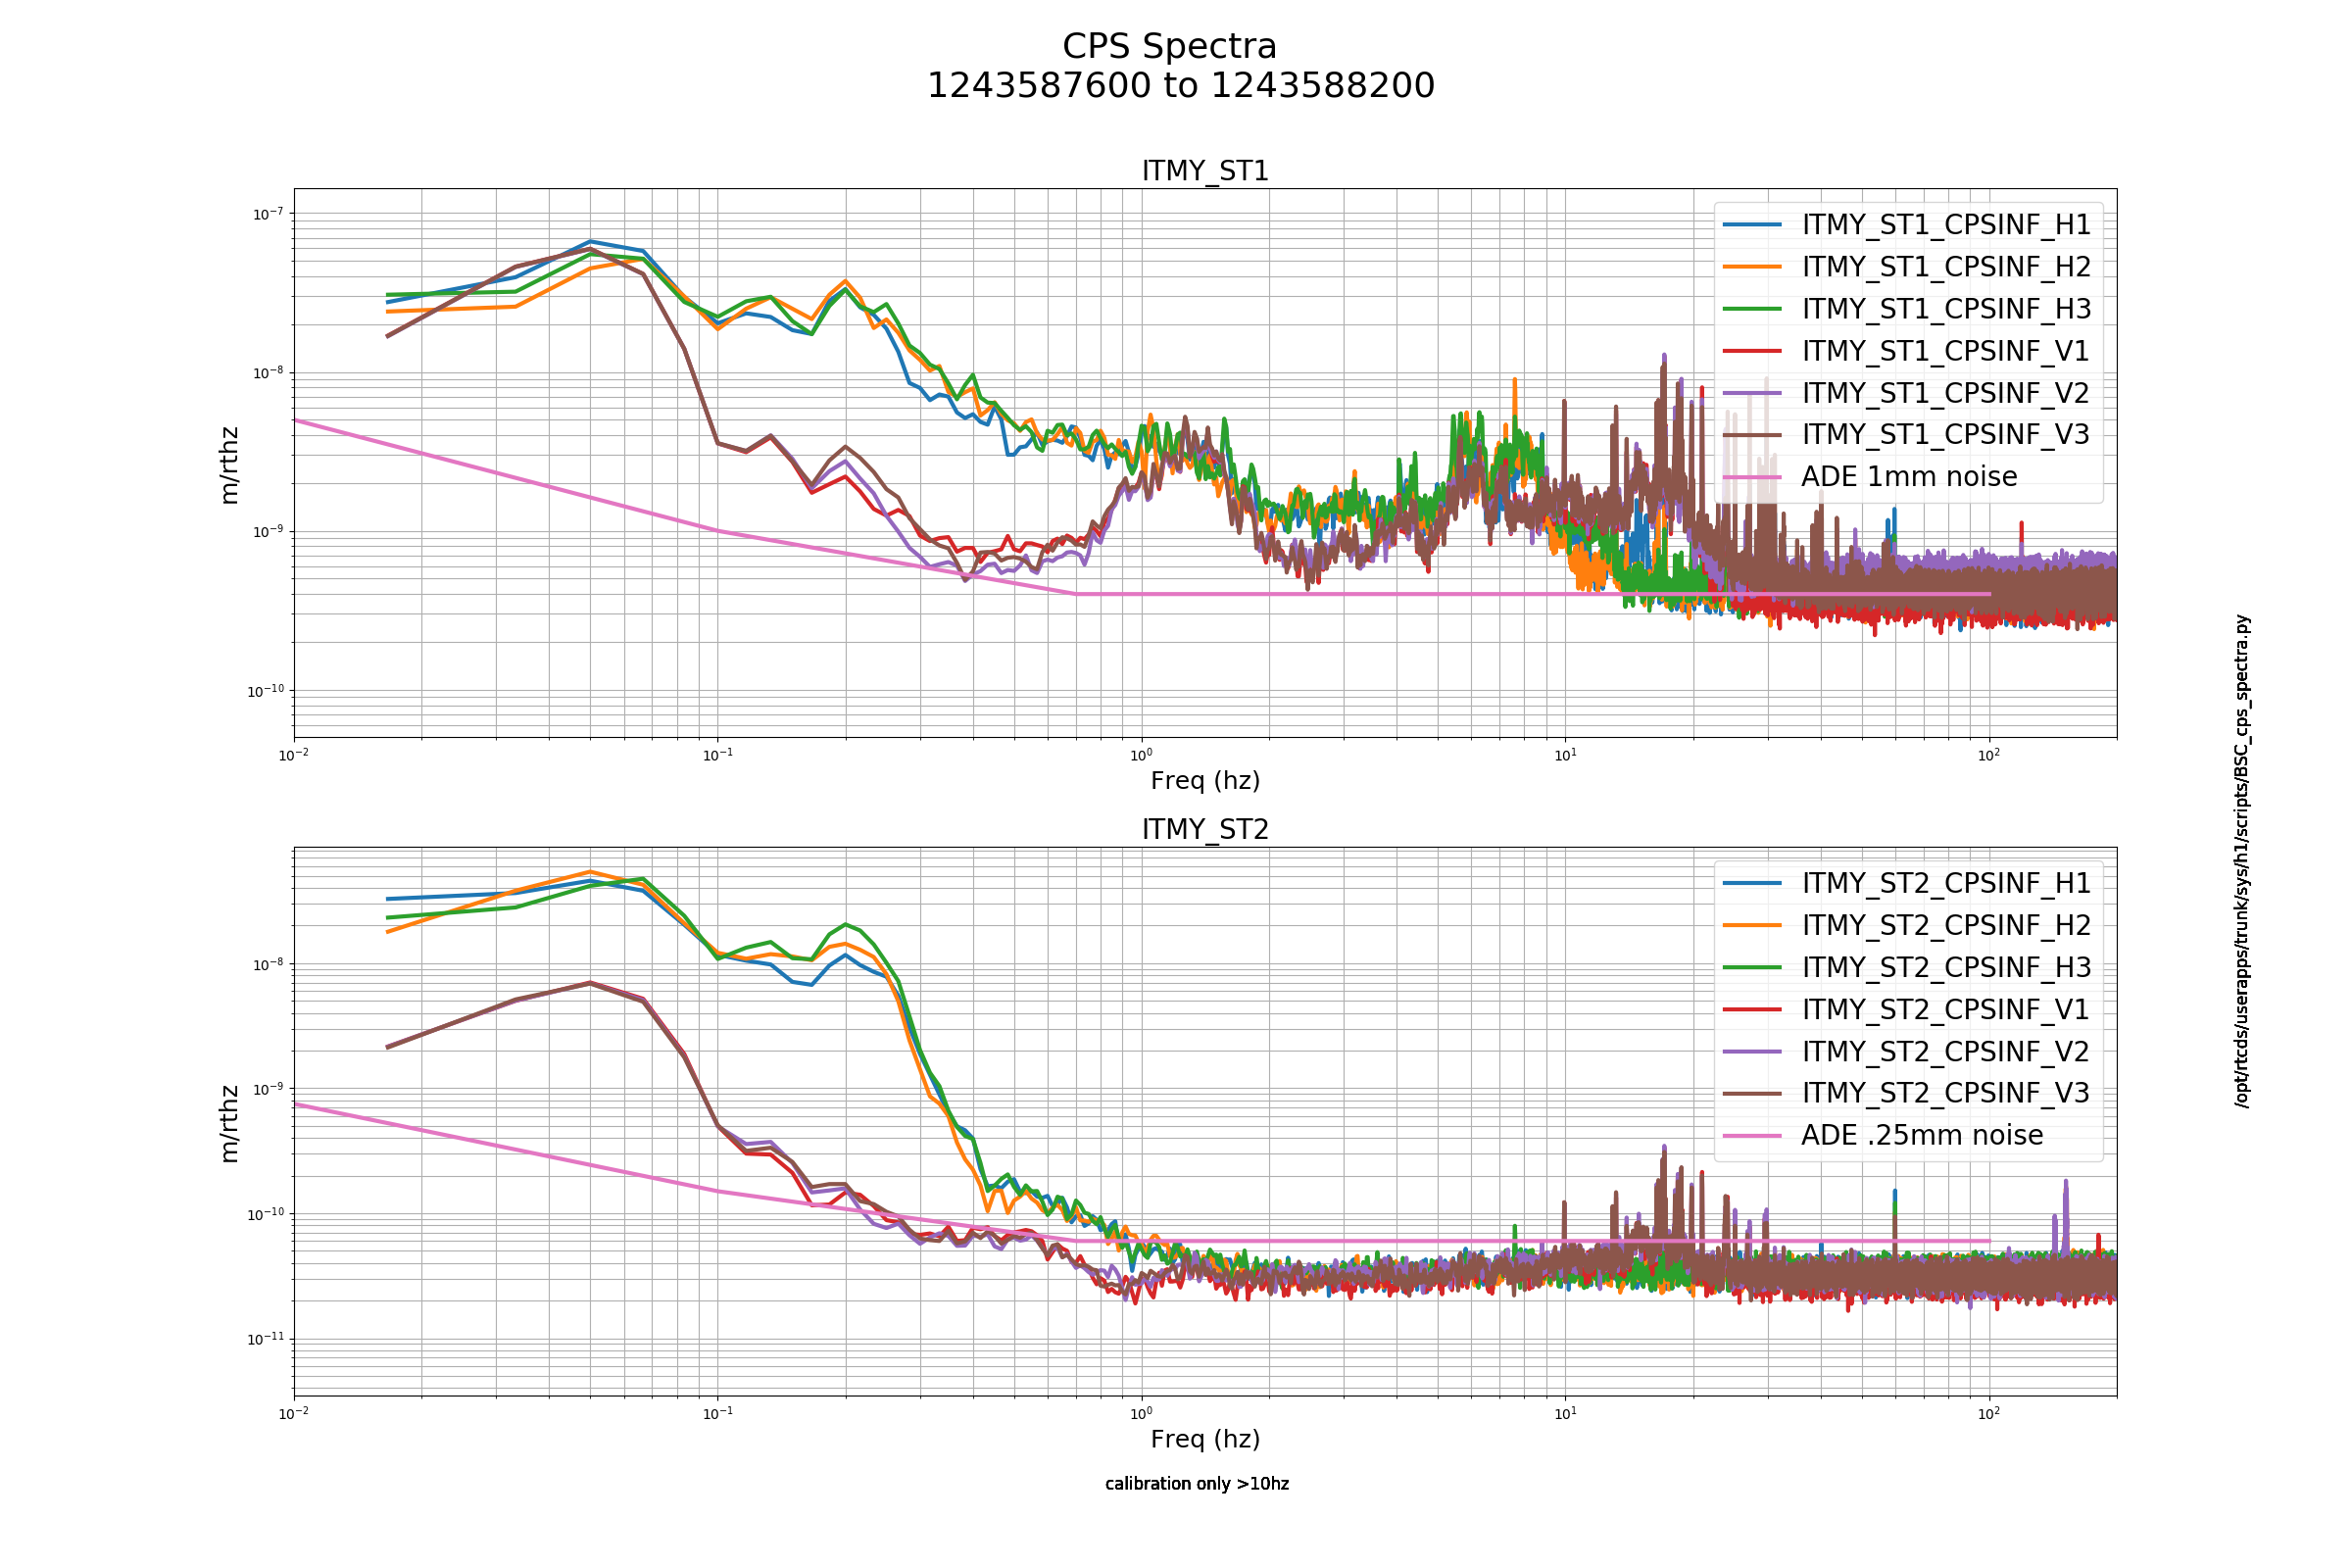
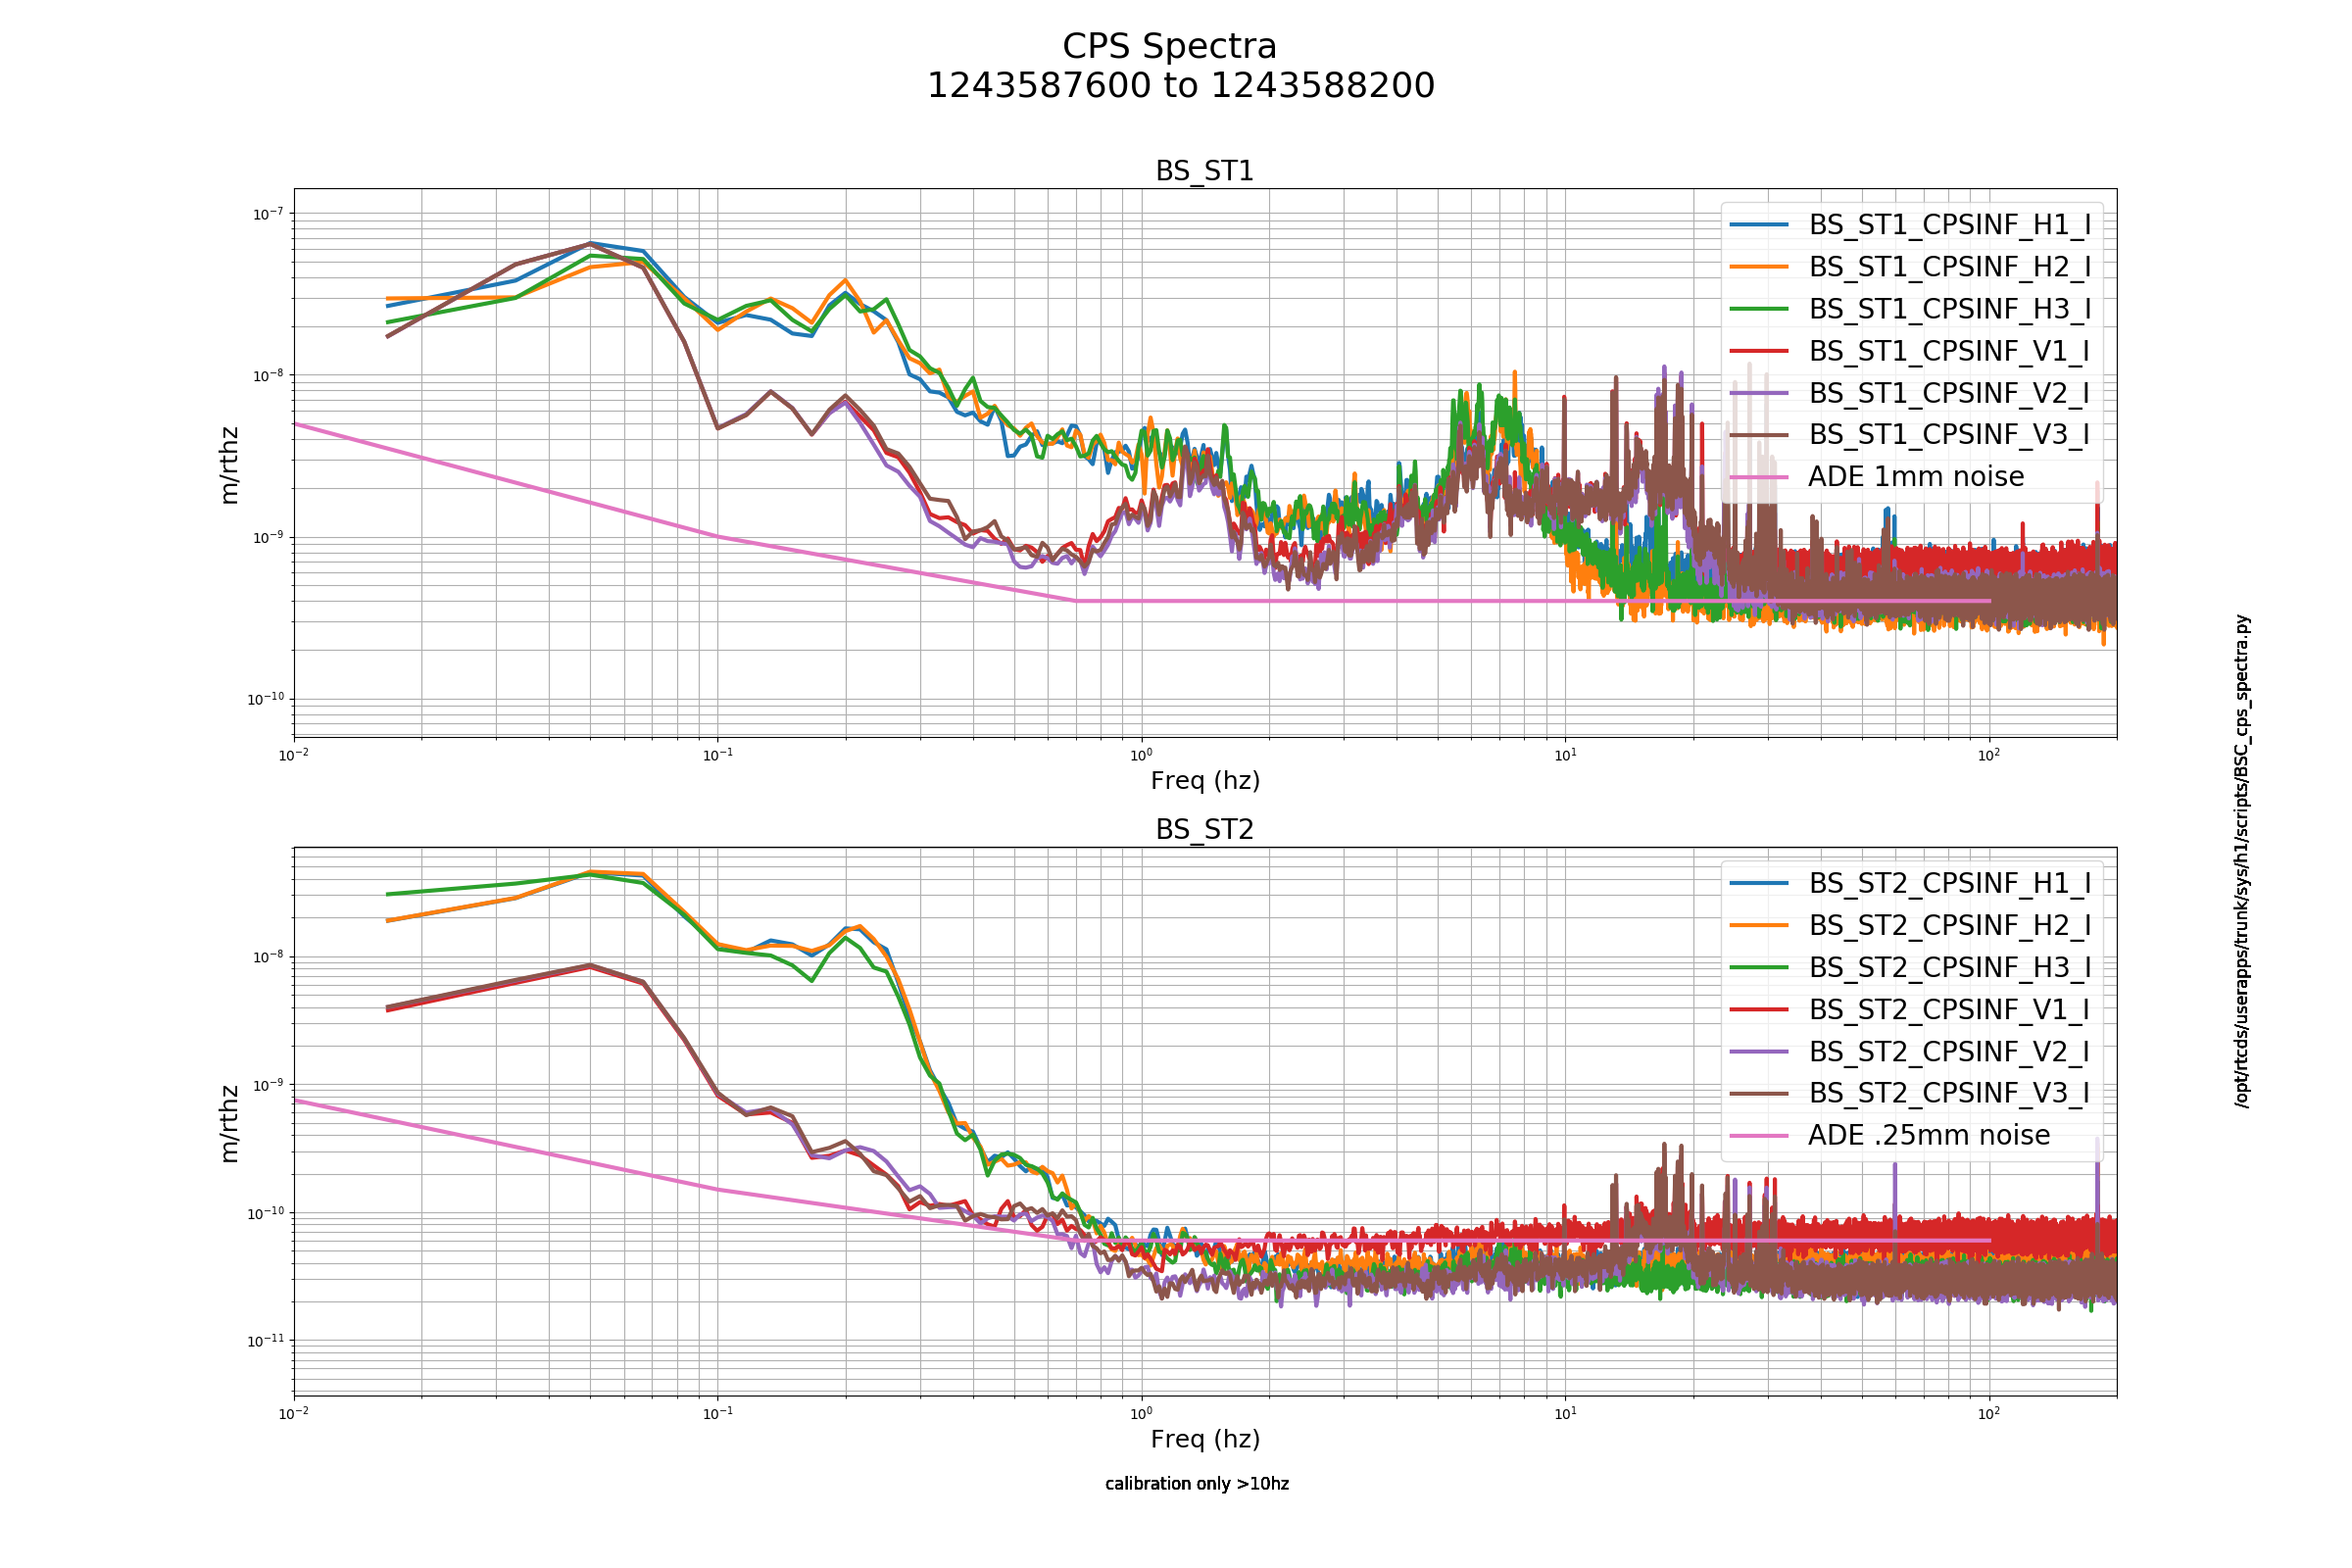
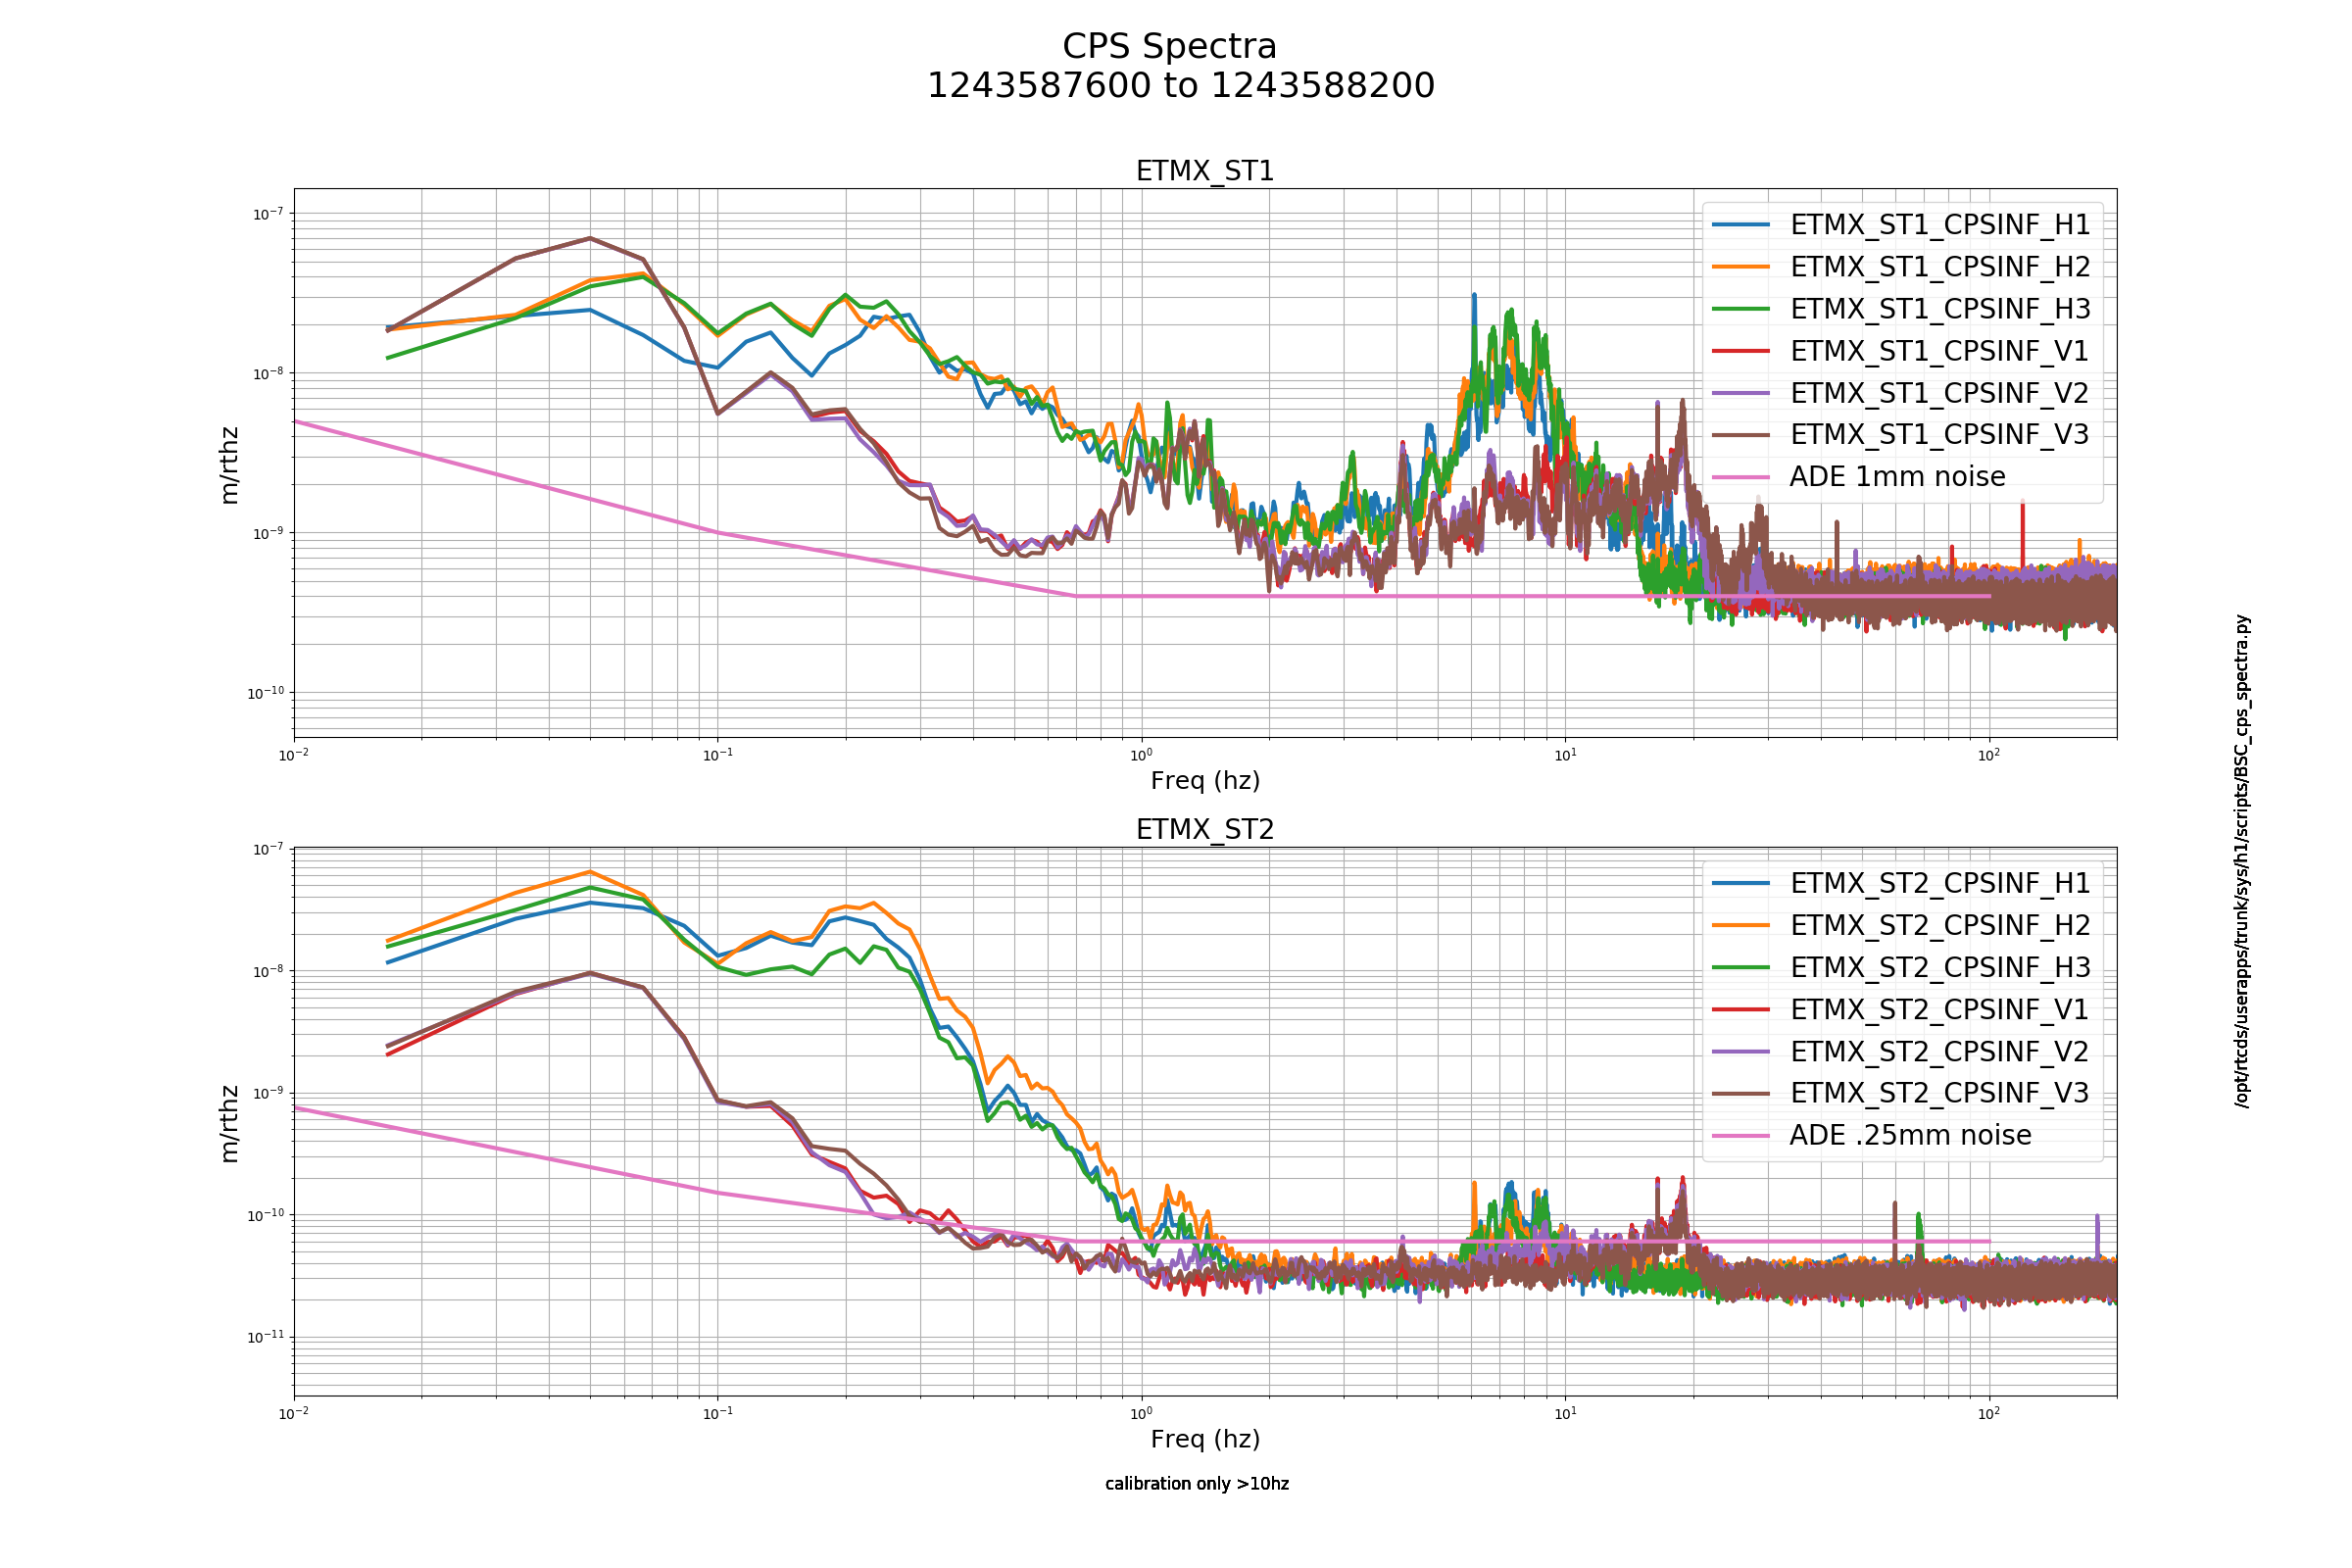
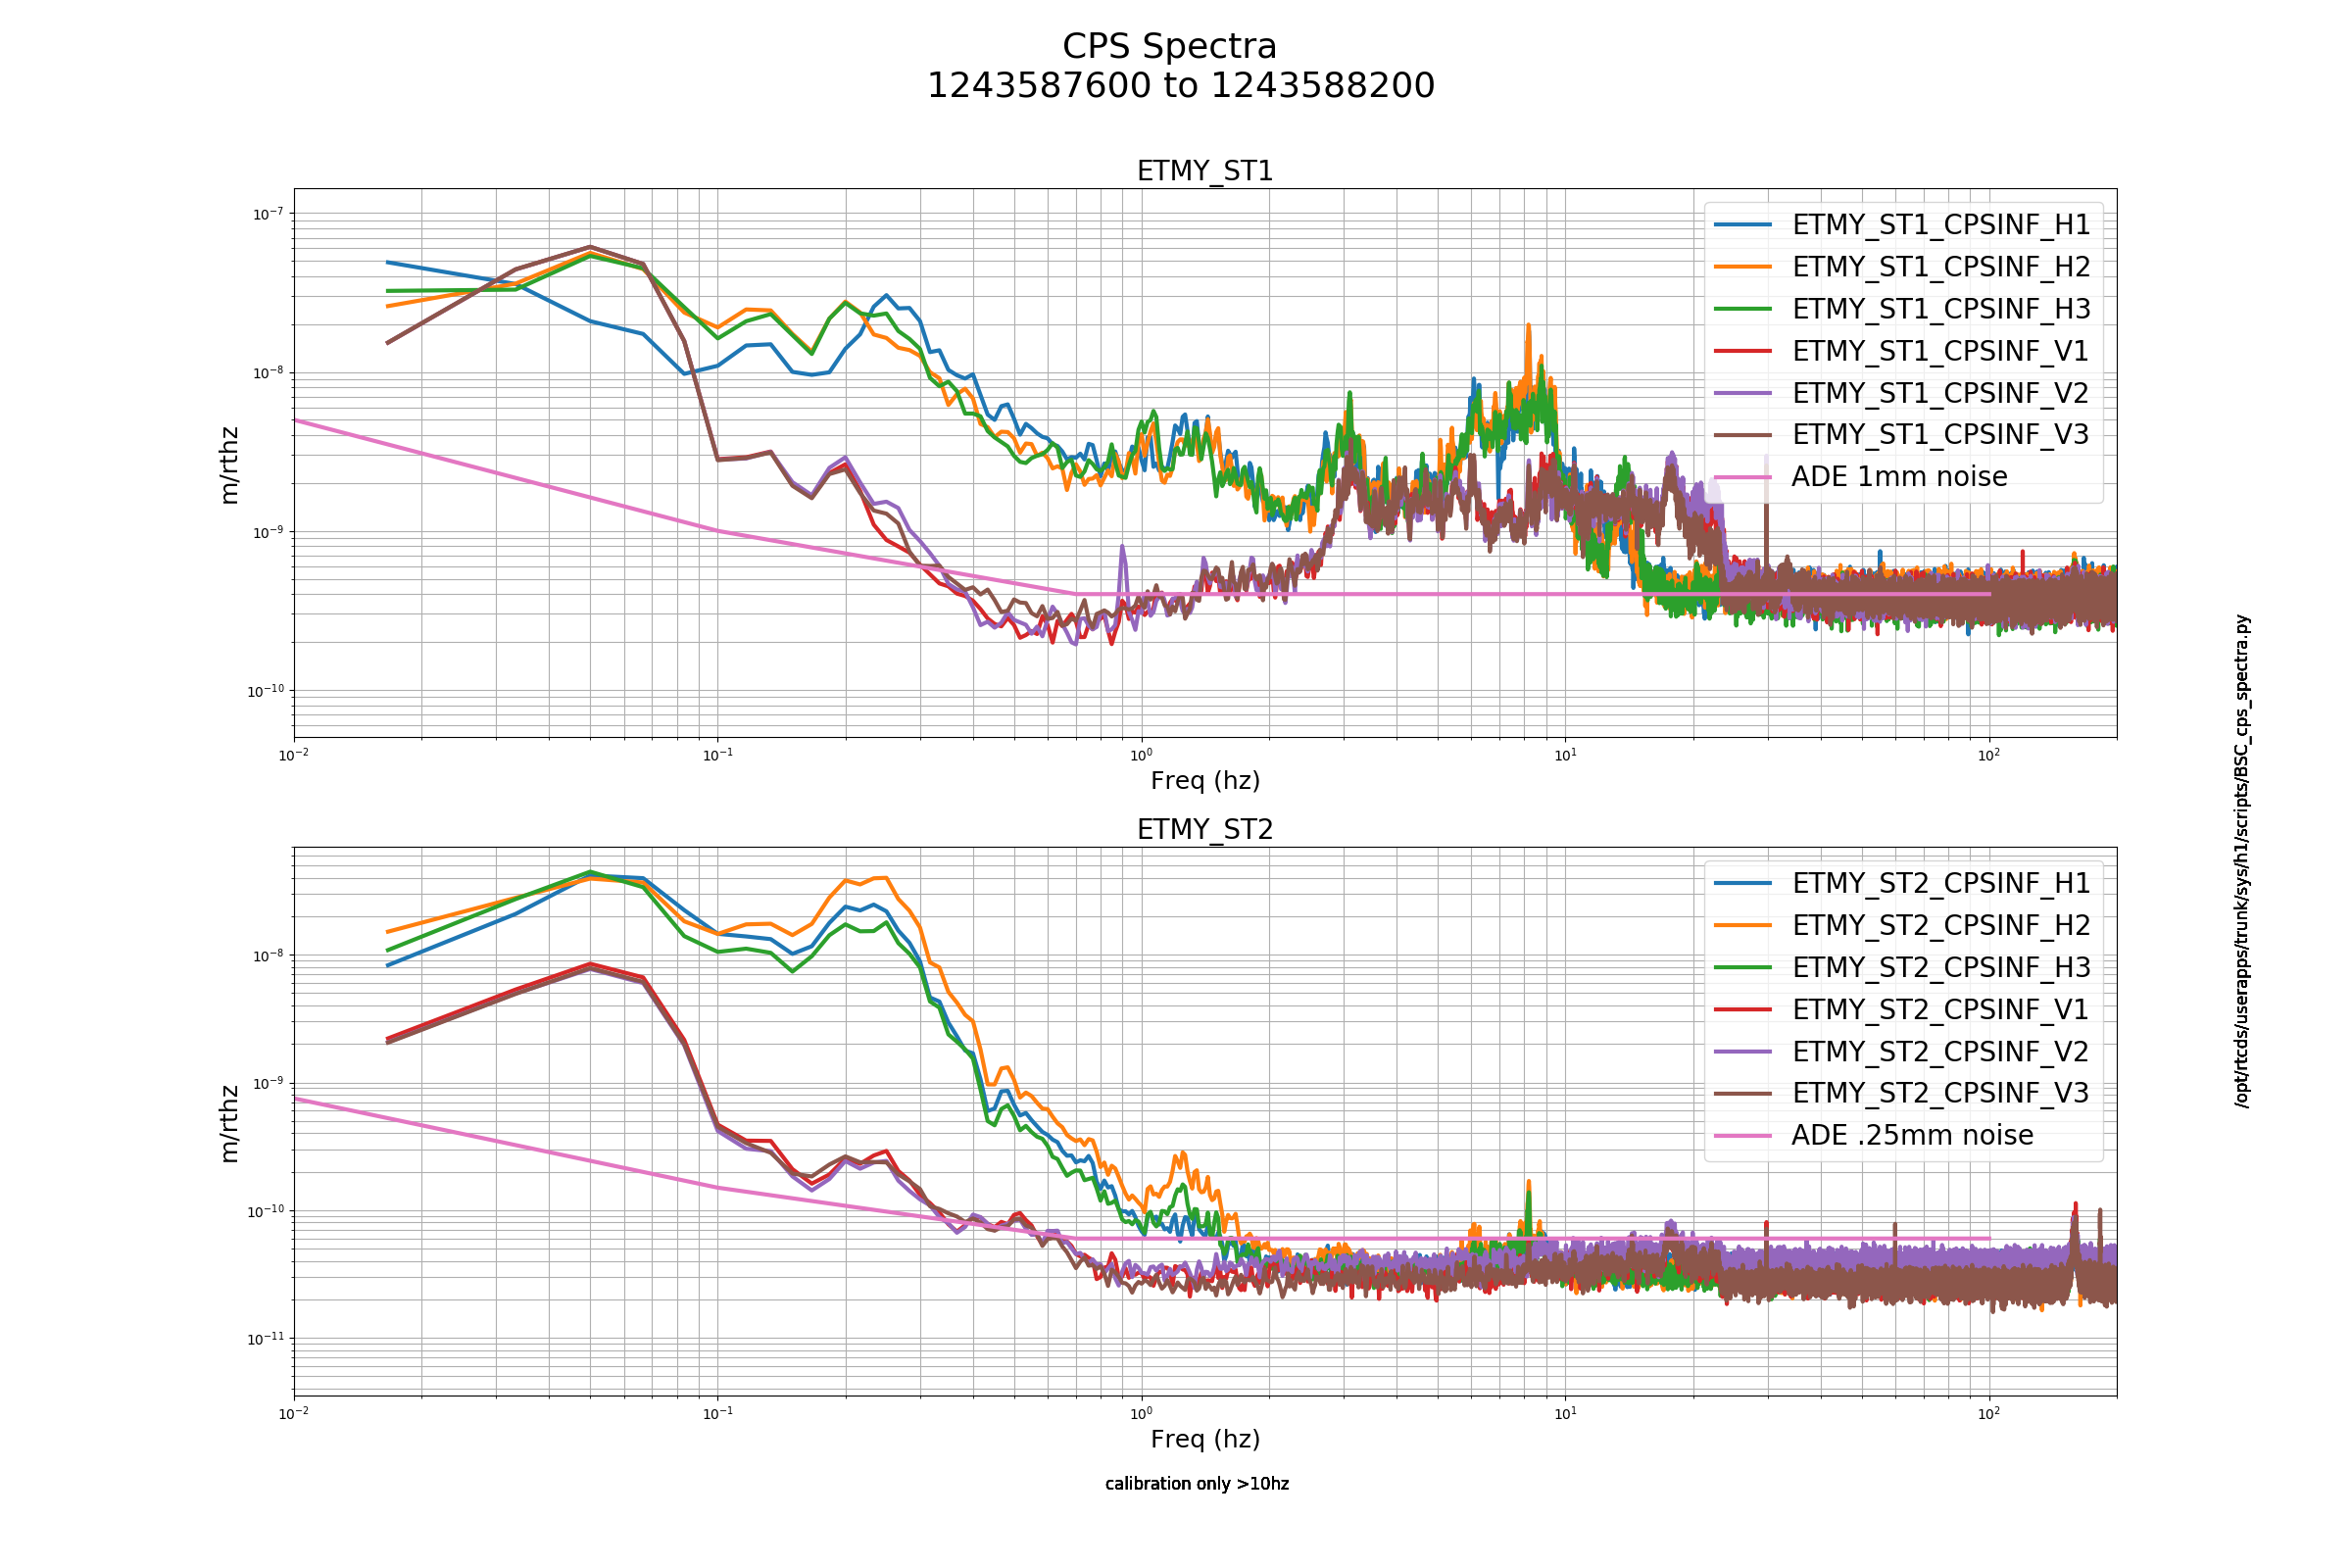
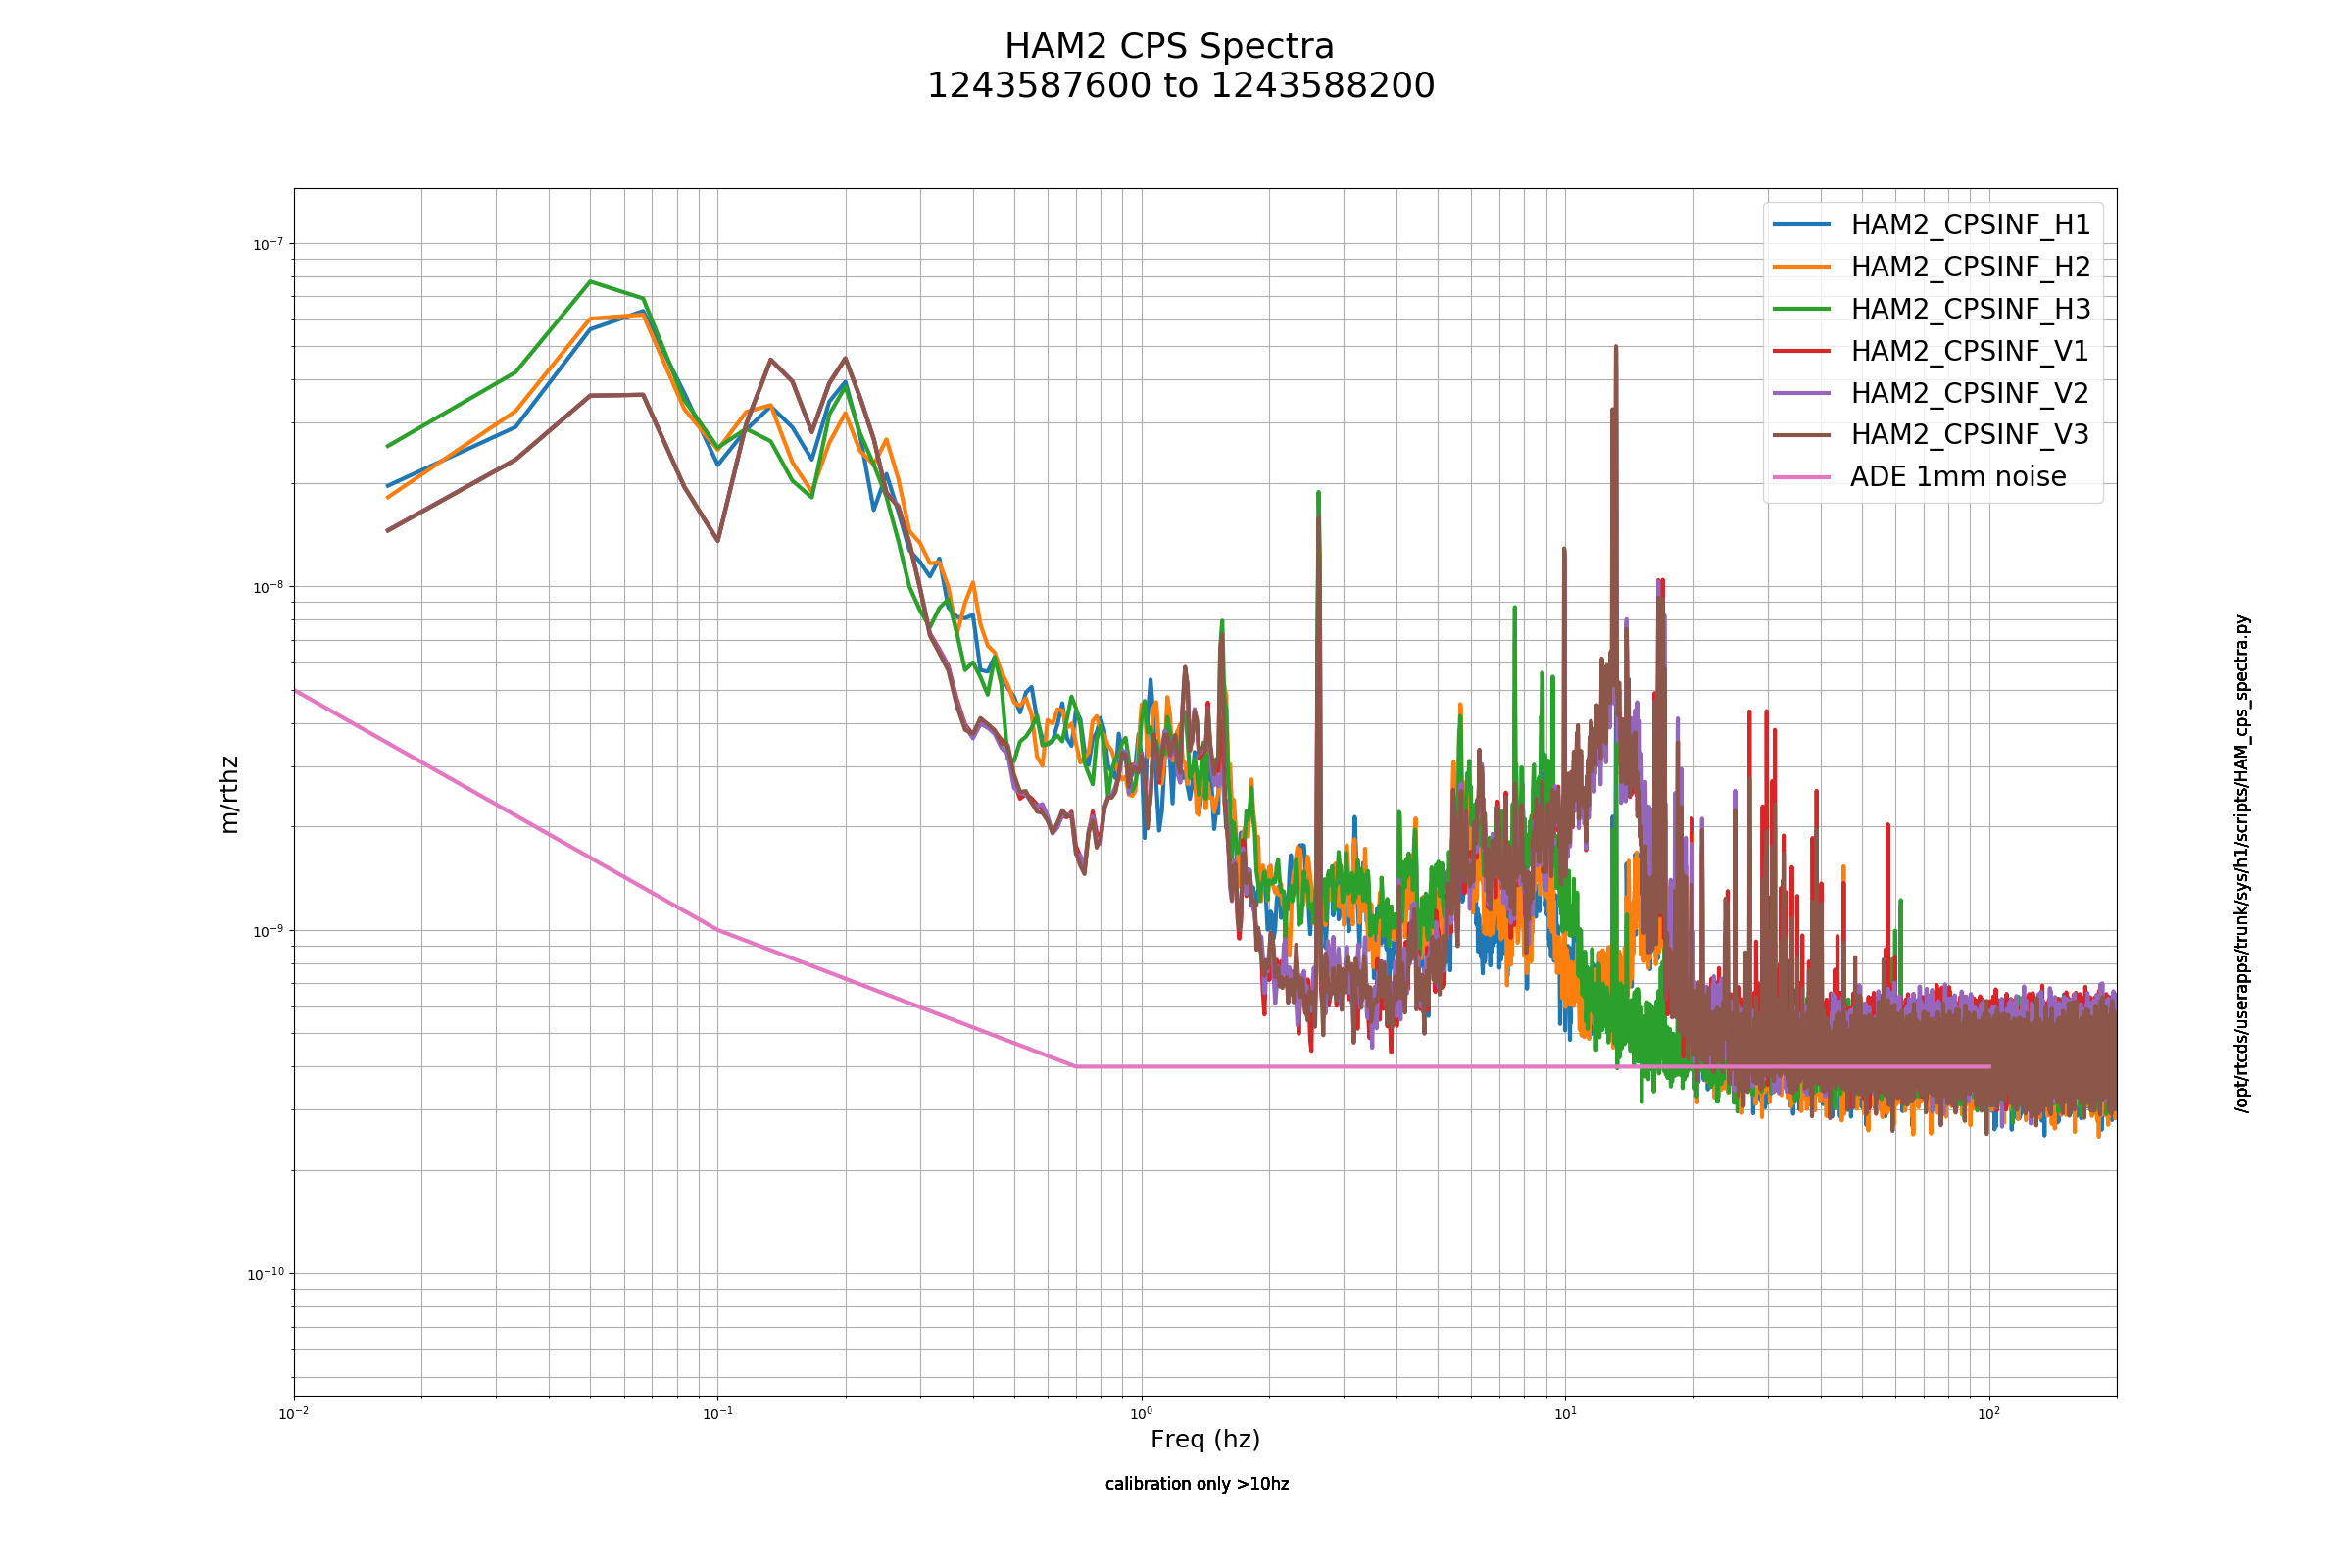
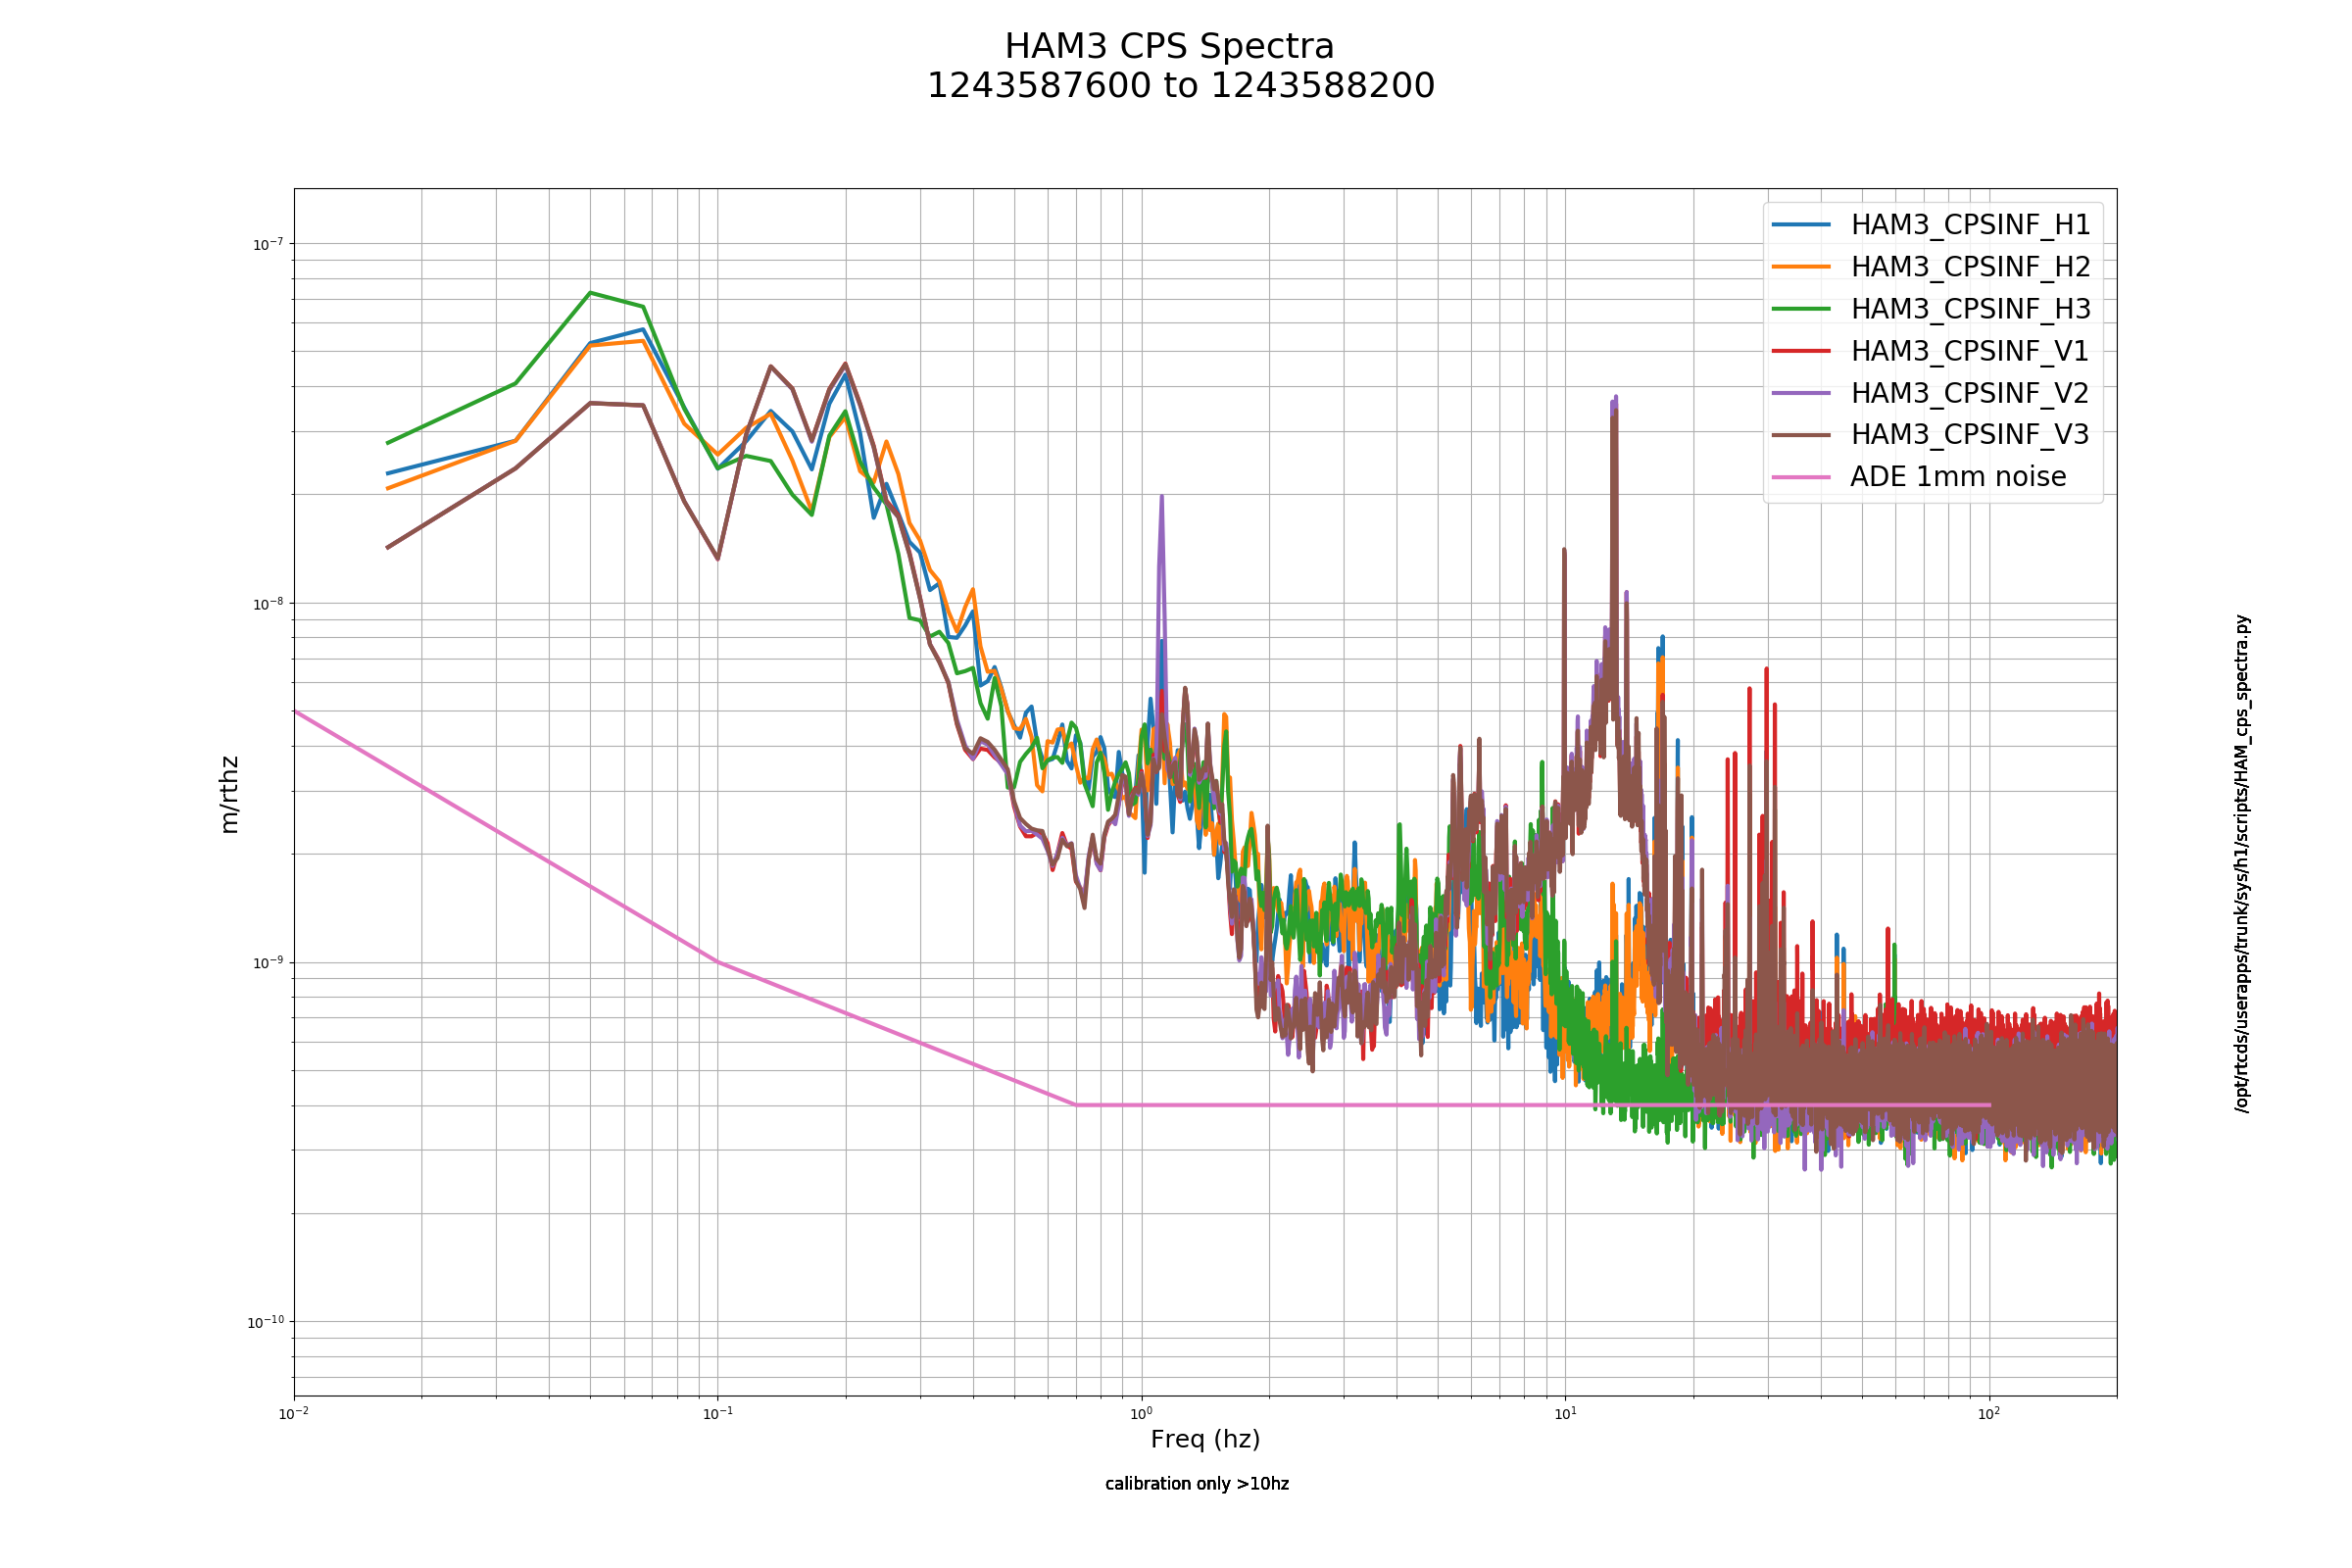
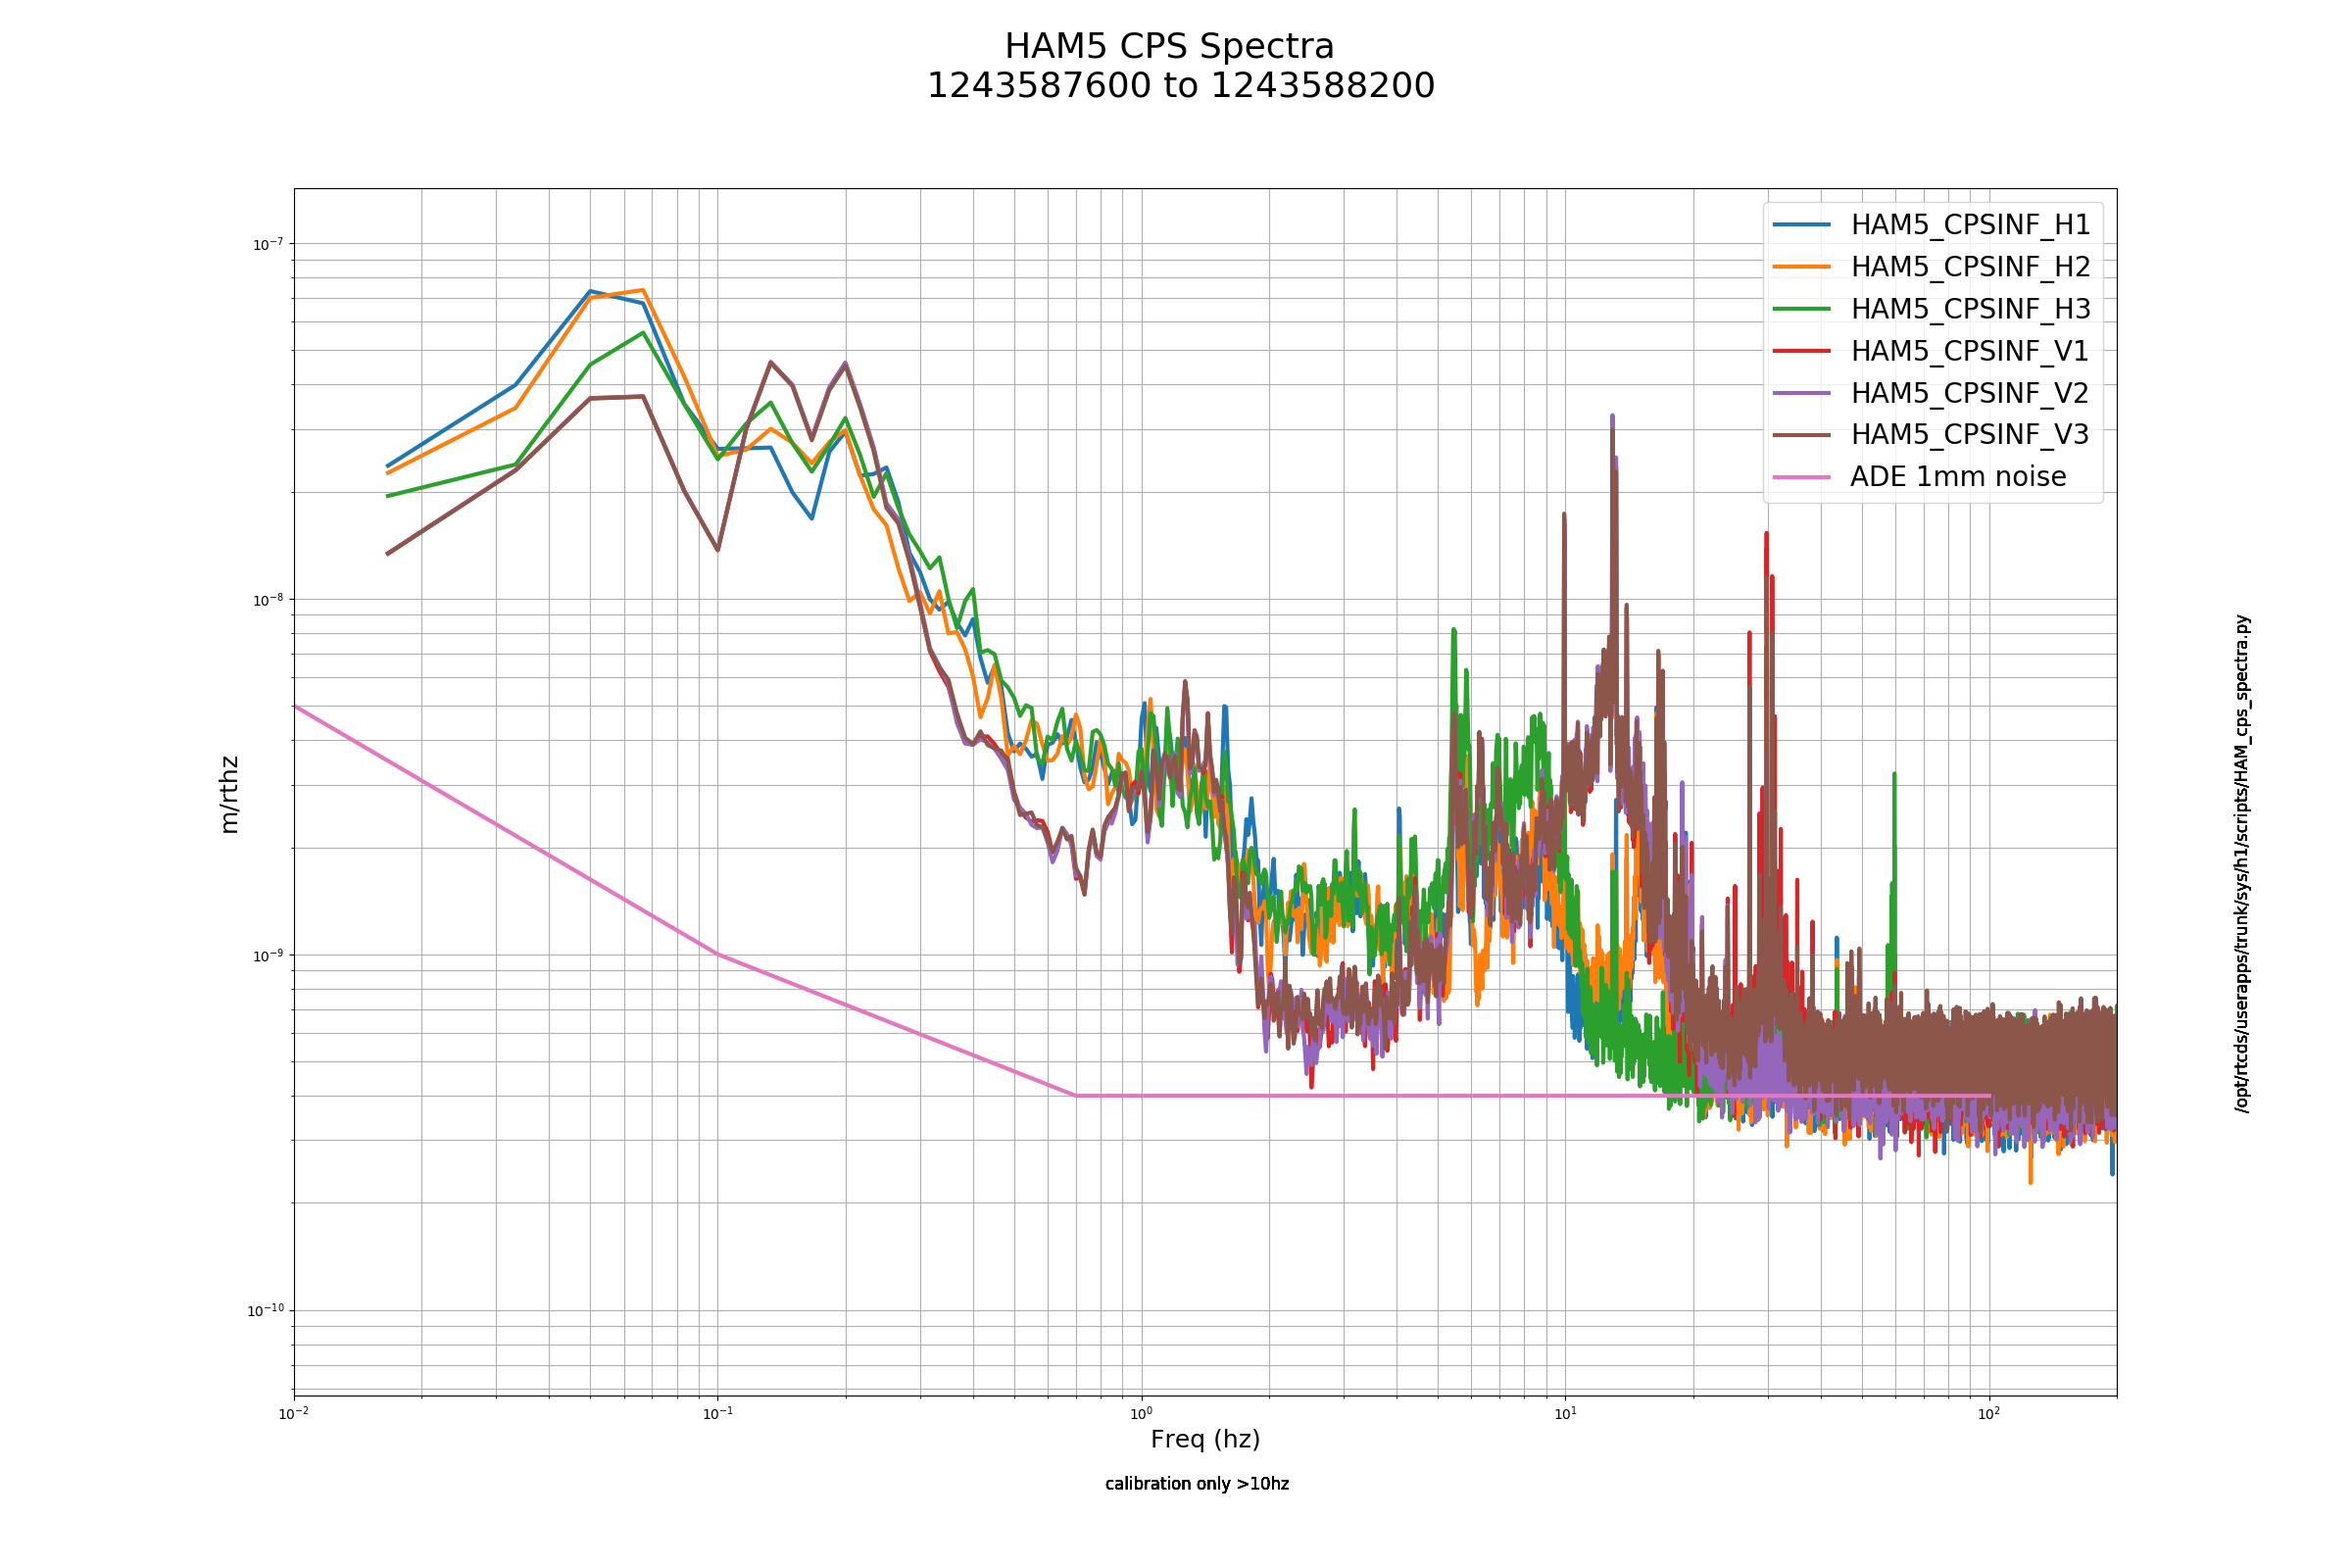
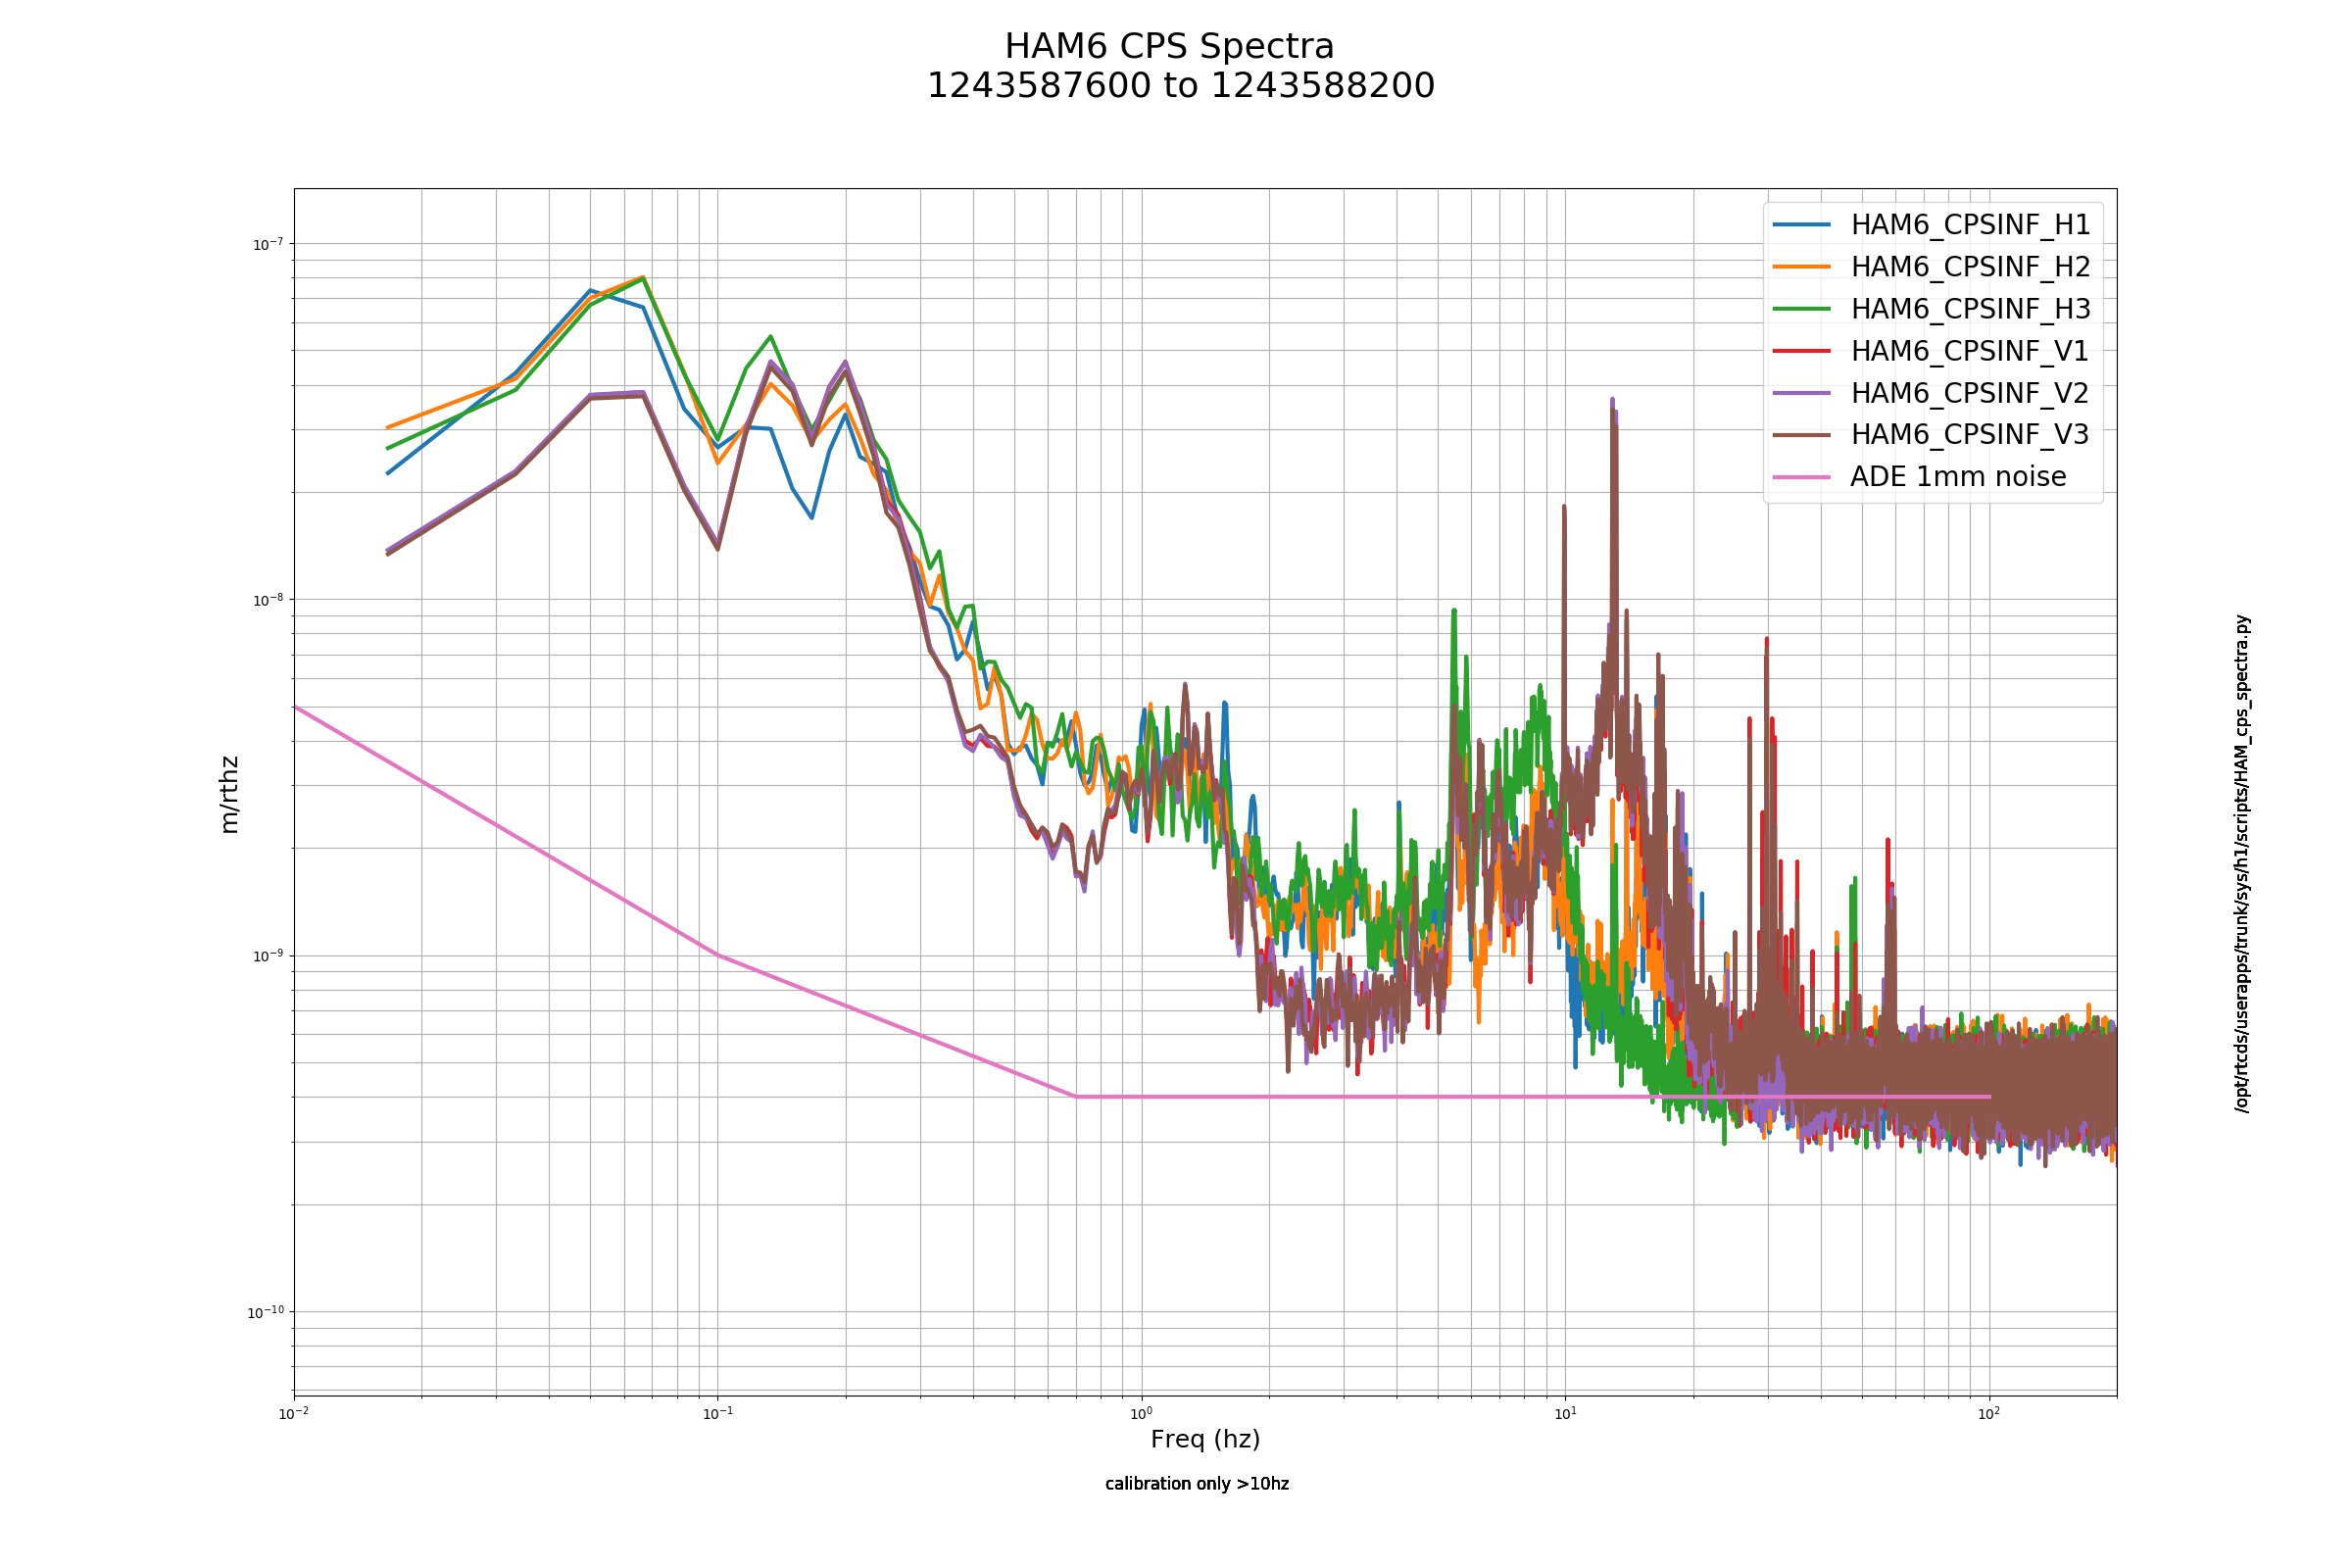
H1 BSC/HAM ISI CPS Sensor Noise Spectra Check (FAMIS task, #12850)

Following CPS are over threshold:

Images attached to this report
Comments related to this report
hugh.radkins@LIGO.ORG - 15:41, Monday 17 June 2019 (50006)

FRS 13075

hugh.radkins@LIGO.ORG - 12:27, Thursday 20 June 2019 (50097)

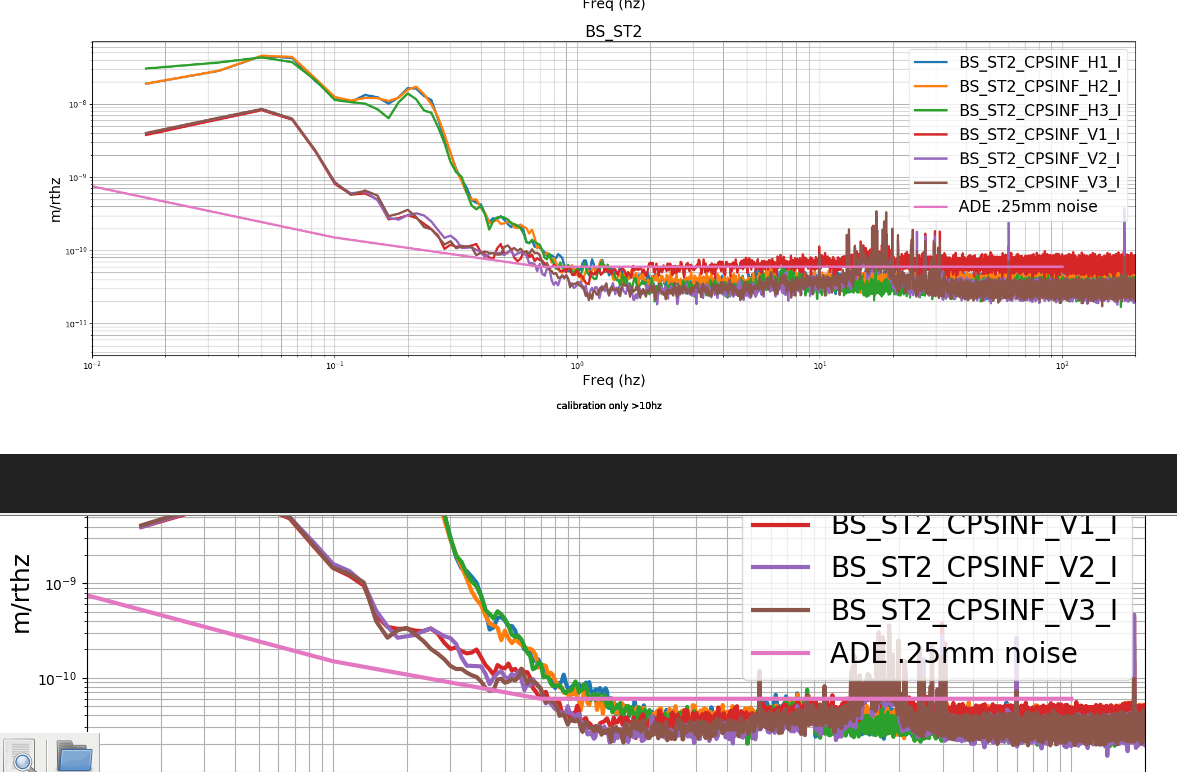
During Tuesday Maintenance, the BS was taken to DAMPED and the CPS Interface chassis was power cycled in the CER.  This power cycled the satellite racks as well.  I did not un- & re-seat the gauge board cards in the satellite rack which is one thing we do to mitigate the elevated noise on a CPS.

Attached is a comparison of the BS Stage2 CPS between the spectrum Corey alogged here from June 3 and one taken this morning at 2am. This noise wasn't really too elevated but it sure looks much quieter now or this morning at least.  Will update/close the FRS.

Images attached to this comment
LHO General
corey.gray@LIGO.ORG - posted 04:13, Monday 03 June 2019 (49609)
Mid Shift Status

Smooth running with lock/observing approaching 10hrs in a few minutes.  

H1 SEI
corey.gray@LIGO.ORG - posted 01:37, Monday 03 June 2019 (49607)
H1's SEI_CONF Back to "WINDY" State at 8:36utc

Once again during a shift change, there was some interferometer action!  

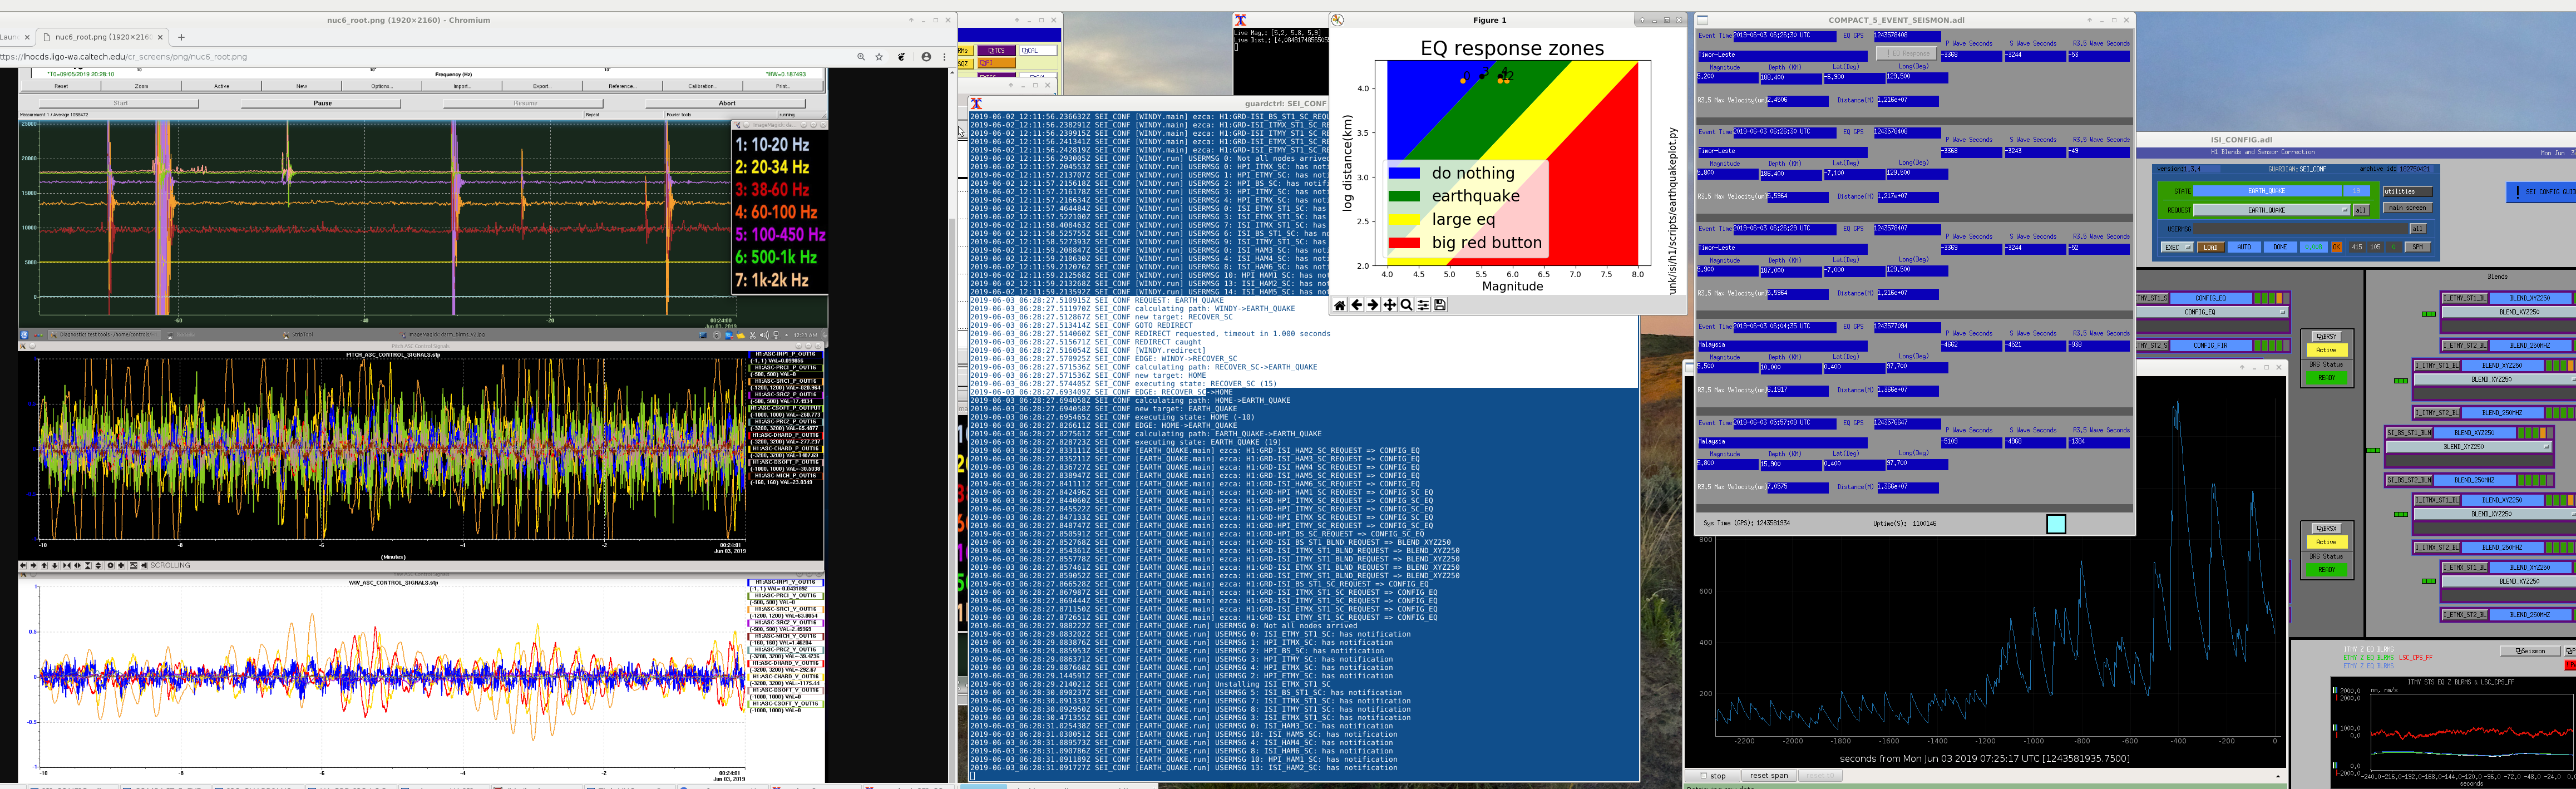
30min before the shift change, Jim proactively transitioned us (at 6:30utc) to the EARTHQUAKE state since he started seeing seismic motion via the Tidal striptool.  As we were chatting (about 10-15min after midnight or ~710utc) we later watched the STS ndscope begin to increase, SEI blrms peak, and also a visible oscillation on the ASC SRC1 pit signal.  Attached is a screenshot of relevant monitors at about 725utc.

8:36utc Started transition back to WINDY (nominal) state for SEI_CONF guardian node.  Completed transition at 8:38utc.

Images attached to this report
LHO General
corey.gray@LIGO.ORG - posted 00:34, Monday 03 June 2019 (49606)
Transition to OWL Log

TITLE: 06/03 Owl Shift: 07:00-15:00 UTC (00:00-08:00 PST), all times posted in UTC
STATE of H1: Observing at 8Mpc
OUTGOING OPERATOR: Jim
CURRENT ENVIRONMENT:
    Wind: 8mph Gusts, 5mph 5min avg
    Primary useism: 0.25 μm/s
    Secondary useism: 0.07 μm/s

Walked into Control Room as Jim was monitoring H1 ride through a flurry of earthquakes.  Other than that, very low microseism & winds have died down.
QUICK SUMMARY:

Currently have H1 OBSERVING for just over 6hrs & have it with a recently-transitioned SEI_CONF in the EARTHQUAKE state due to some south pacific EQs (5.5-5.9magnitude).  Will hang out in this EARTHQUAKE state until signals return to quiet values.

H1 General
jim.warner@LIGO.ORG - posted 00:01, Monday 03 June 2019 (49604)
Shift Summary

TITLE: 06/03 Eve Shift: 23:00-07:00 UTC (16:00-00:00 PST), all times posted in UTC
STATE of H1: Observing at 106Mpc
INCOMING OPERATOR: Corey
SHIFT SUMMARY:
LOG:
23:00 Lockloss as soon as I arrive, on reacquiring, DRMI is bad, so I struggle with that for a while before starting initial alignment, back to observing at 1:30

6:15 There are a couple eqs in Malayasia, there were no verbal notifications

6:30 Low frequency ground starts picking up, I transition to SEI_CONF EQ state

H1 OpsInfo (OpsInfo)
jim.warner@LIGO.ORG - posted 00:00, Monday 03 June 2019 - last comment - 04:51, Tuesday 04 June 2019(49605)
EQ verbal notifications aren't working

About 45 minutes ago SEISMON picked up a couple earthquakes in Malayasia, some of which were reported over 6 magnitude, but I didn't get a notification. I know TJ was working on using the lines from my response plot to trigger the verbal notification, but I can't tell if that's in yet.

Comments related to this report
thomas.shaffer@LIGO.ORG - 09:52, Monday 03 June 2019 (49615)

Gah! I used the wrong line on your graph. Fixed now. It will notify for any EQ in your green, yellow, or red areas.

Unfortunately, I cannot import your script to get the lines because the alarm handler computer does not have matplotlib installed. So if you make any changes to the lines, we will also need to change them in Verbal.

corey.gray@LIGO.ORG - 04:51, Tuesday 04 June 2019 (49636)

FYI:  I do not believe the EQ during Cheryl's shift had a verbal (when I scroll back I don't see anything listed).  And I had a smaller EQ tonight (but it was in the GREEN area) and I did not receive a verbal for that.

H1 AOS (PEM)
kara.merfeld@LIGO.ORG - posted 21:46, Sunday 02 June 2019 (49603)
ALS glitches and rain uncoorelated
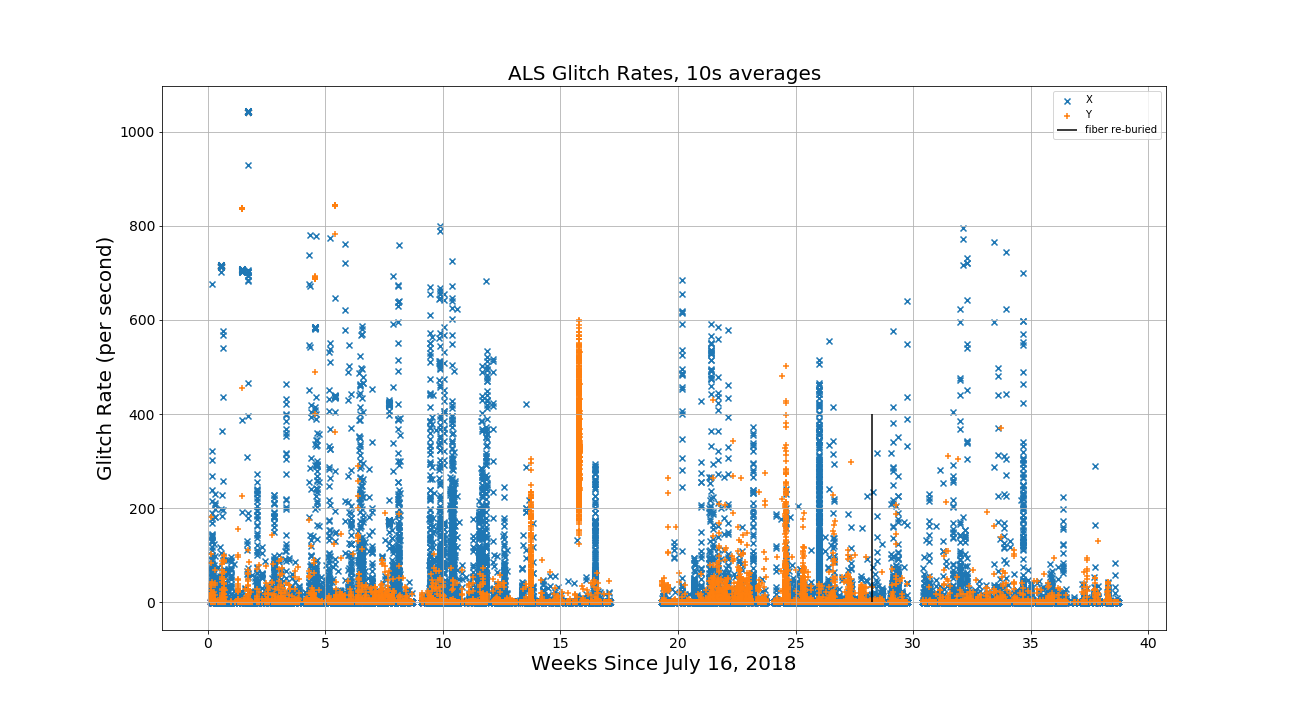
In an attempt to identify the source of the ALS glitches, I calculated the glitch rates over several months of time, and plotted them in Figure 1.  The glitches were identified by first high-passing the raw data from channels H1:ALS-C_TRX_A_LF_OUT_DQ and H1:ALS-C_TRY_A_LF_OUT_DQ, and then counting the number of times the high-passed signals exceed .1.  The glitch rates are per second, and each data point is an average glitch rate over a 10s time interval.  Only times when we were locking the interferometer were taken into account.

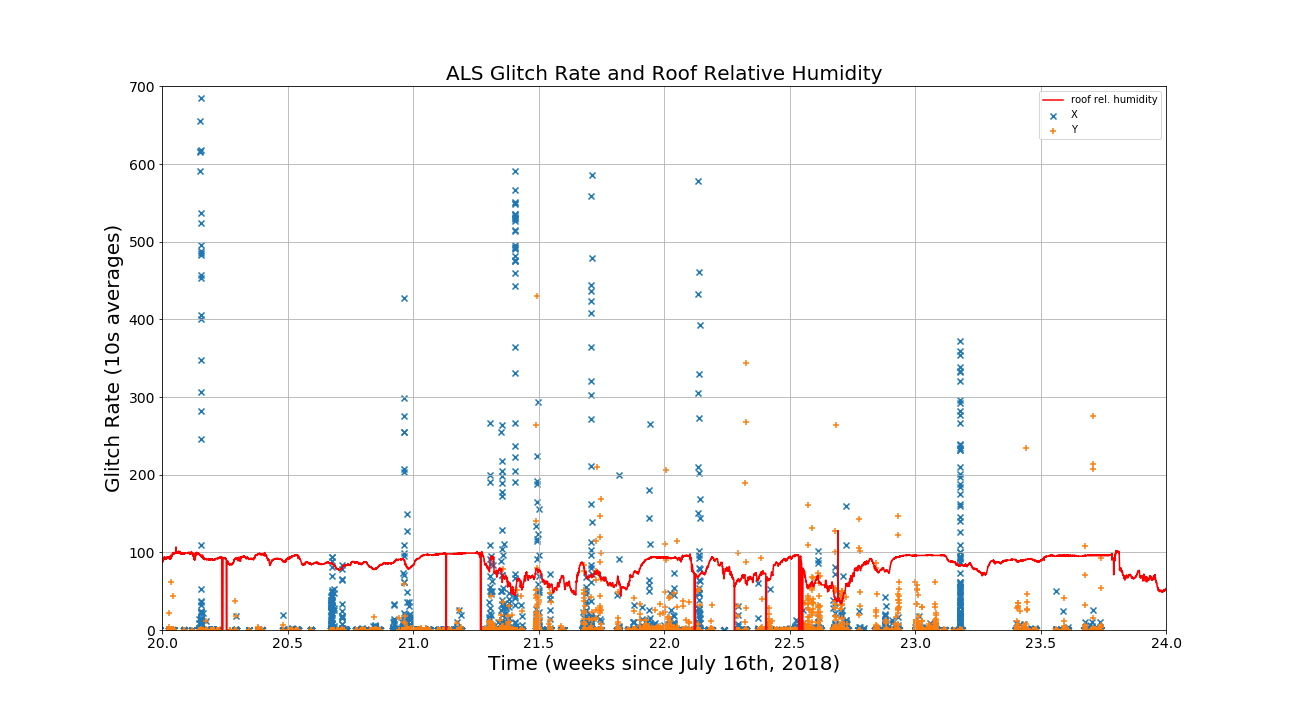
It has been hypothesized that the glitches could be connected to rainy days.  So I chose a month of time when there were both rainy and dry spells, and overlayed my glitch rate plot with the data from the relative humidity sensor on the roof.  This is displayed in Figure 2.  There does not appear to be any strong correlation between the glitch rates and the outside humidity.
Images attached to this report
H1 SQZ
sheila.dwyer@LIGO.ORG - posted 18:14, Wednesday 29 May 2019 - last comment - 15:22, Monday 03 June 2019(49544)
squeezer non linear gain checks

In the last lock, while the calibration measurements were happening and while the IFO was thermalizing before the calibration measurements, we took the squeezer offline to check some things that would ideally be checked after the laser current is changed.

The SHG temperature didn't need to be changed, but its conversion efficiency has dropped, so I reset the minimum conversion efficency threshold. 

I adjusted the half wave plate to bring the green power into the fiber closer to 20mW, according to the launch diode.  I would like to double check the calibration of the two SHG power monitor diodes.  I added a parameter file for the squeezer guardians, so hat we would not have the TEC temperature hard coded in multiple places and can update it more easily.  (I also changed the temperature to 33.32 degrees).

I then tried to measure the nonlinear gain at a couple of different green powers, to make this easier I also added parameters that would change with green power to the parameter file.  I will plot and post the data soon. 

We still need to double check the squeezing angle next time we are locked. 

Comments related to this report
sheila.dwyer@LIGO.ORG - 15:22, Monday 03 June 2019 (49621)

The message of these non linear gain checks is that we get consistent enough results for different green powers and different methods of measuring the nonlinear gain. 

Looking at the SHG power launch diode and the OPO reflected diode at a time when the OPO was unlocked earlier today, the transmission from the launched green power to incident power on the OPO is 15.8%.  I measured the powers using the launch diode for these measurements, but have multiplied everything by 15.8% to make the plots in terms of green power incident on the OPO. 

We have wondered if there is something wrong with our estimation of the nonlinear gains, in part because our estimates of losses and phase noise depend on them, and in part because we have had discrepancies when using different methods to measure the nonlinear gain.  We measure the nonlinear gain by locking the OPO with green light, and injecting a low power IR seed beam through the path used for the CLF.  We measure the IR power on a diode in the homodyne path, while using a PZT to modulate the phase of the seed between amplification and deamplification.  One method for estimating the nonlinear gain is to measure the maximum and minimum of the transmitted IR, and use these to derive the nonlinear gain.  Another method is to first measure the unamplified seed by slowly scanning the OPO with no green power. 

Here the normalized non linear interaction strength is x = sqrt(P/P thresh) and the maximum amplification (nonlinear gain) = 1/(1-x)^2 while the minimum from deamplification is 1/(1+x)^2.   In order to estimate x from the ratio of the max/min we get x = (sqrt(max/min)-1)/(sqrt(max/min)+1)

The first plot shows the amplification and deamplification measured for different green powers, with the expectation for a threshold of 31mW plotted for reference.  This seems fairly consistent with expectations. The second attached plot is intended to help compare the three possible methods of estimating the normalized non-linear interaction strength (or the threshold) from each of these measurements. (Based on the ratio of maximum over minimum, or max/ unamplified or minimum / unamplified) The upper subplot shows x, while the lower plot shows the infered threshold based on each measurement.  While there is a systematic error between the different techniques, as is most clear from the threshold power plot, it is not large enough to really have much of an impact on the estimated interaction strength.  

Note: I measured the dark offset on the diode used to measure the amplified seed while the OPO was scanning, and treated this as a dark offset which is subtracted from all measurements.  If I ignore this (set it to 0), I do get large discrepancies between these methods. 


Non-image files attached to this comment
H1 CAL
madeline.wade@LIGO.ORG - posted 21:38, Wednesday 22 May 2019 - last comment - 14:58, Monday 03 June 2019(49407)
DCS calibration filters for C01 h(t) frame production: GPS 1239472998 - present

M. Wade, A. Viets

I have finished creating DCS calibration filters files for the C01 h(t) frame production.  The first epoch for C01 h(t) frames will use filters file

aligocalibration/trunk/Runs/O3/GDSFilters/H1DCS_C01_1239472998.npz

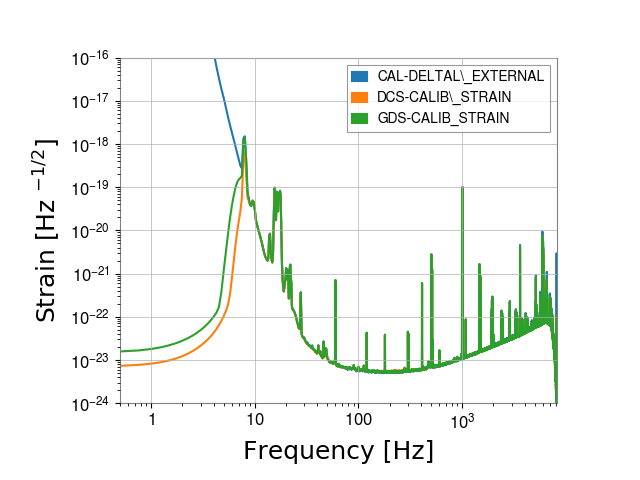
I have attached plots from sanity checks run using this filters file on data from GPS times 1239720596-1239723372.  The first attached plot is an ASD comparison of data calibrated with this filters file (expected C01 data), the corresponding C00 data, and the corresponding CAL-CS data.  The second plot is the ASD ratio of these three strain products.  The third plot is the response function as derived from the expected C01 data and the CAL-CS data compared to the pyDARM model response, and the fourth plot is a zoom-in on the ratio of this response function comparison.  All of these tests indicate that this filters file is ready for use on C01 data, giving the expected level of agreement in each comparison.

Images attached to this report
Comments related to this report
aaron.viets@LIGO.ORG - 18:15, Saturday 25 May 2019 (49440)

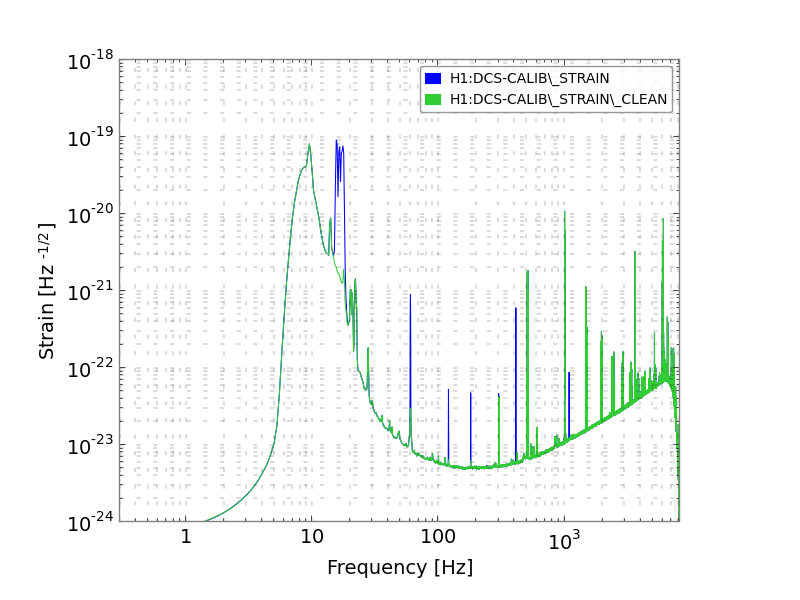
I've made a few more plots to test these filters.  The first three show the filters' effect on real data, compared to the frequency-domain model.  The actuation filters show some apparent deviation at low frequencies, but this is likely due the the large dynamic range spanned in that frequency range, as it does not show up in the response function plot.  The fourth plot shows the response function produced by the filters, compared to the frequency-domain model (same type of plot as in the above aLOG, but uses a different transfer function algorithm in an effort to reduce noisiness).  The fifth plot shows ratios of DeltaL / Pcal at the calibration line frequencies.  The points labeled "DCS" include compensation for all time dependence except for that of the SRC.  The points labeled "+SRC" additionally include compensation for time dependence of the SRC.  A significant improvement is seen at the 17.1 Hz line.  The sixth plot shows comparisons of h(t) to the cleaned data, to show that it is working.

Images attached to this comment
aaron.viets@LIGO.ORG - 14:58, Monday 03 June 2019 (49620)

I analyzed some longer stretches of data to assess the impact of SRC tine-dependence on calibration accuracy.  Unfortunately, it has been difficult to analyze more than a day at a time, for two reasons:

  1. There are frequent dropouts in the C00 data
  2. Compensating for SRC detuning time dependence requires re-calibrating the data, which takes a while to do.

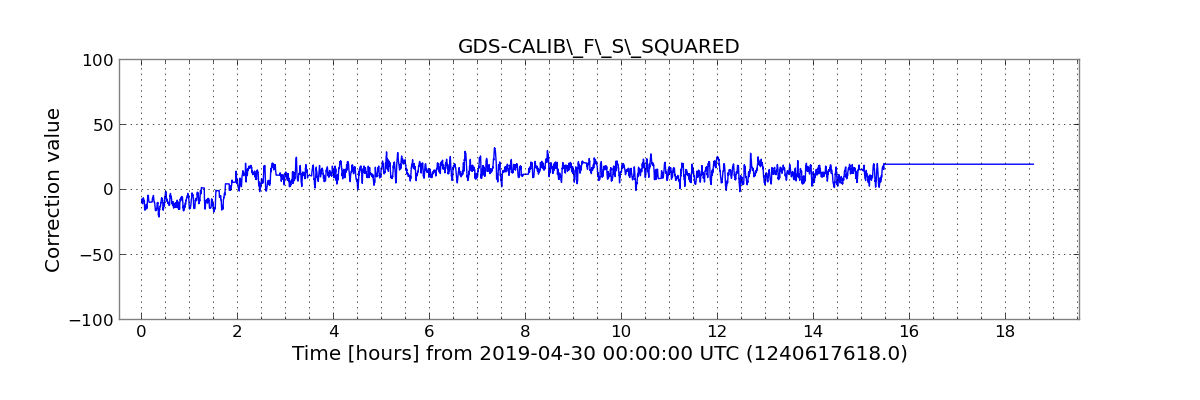
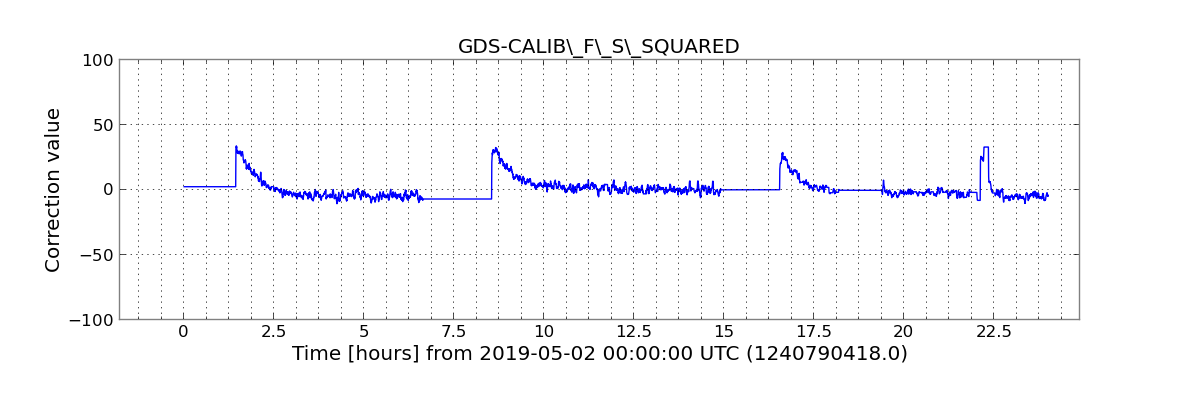
I chose 2 days to use, due to interesting features apparent on the summary pages.  The first three plots are from April 30, where a well defined change occurs in the SRC's optical spring frequency, which appears to change from a pro-spring (fs2 < 0) to an anti-spring (fs2 > 0) early in the day.  The next three plots are from May 2, where there are multiple lock losses and lock stretches.  The spring frequency changes significantly in the first ~hour of each lock stretch.

The plots show time series of fs2 and 1/Q for roughly a day, as well and trends of DeltaL / Pcal at the Pcal line frequencies.  For this data, compensating for all time dependence consistently leads to a significant improvement in calibration accuracy relative to Pcal at the Pcal line frequencies.  Note that compensation for fs and Q time dependence is not the only distinction between the two data sets being compared.  The C00 data at the time did not include compensation for kappa_PUM or kappa_UIM either.  A check of the summary pages from those days, however, suggests that the impact of kappa_PUM and kappa_UIM may be less significant than the time dependence of the SRC.
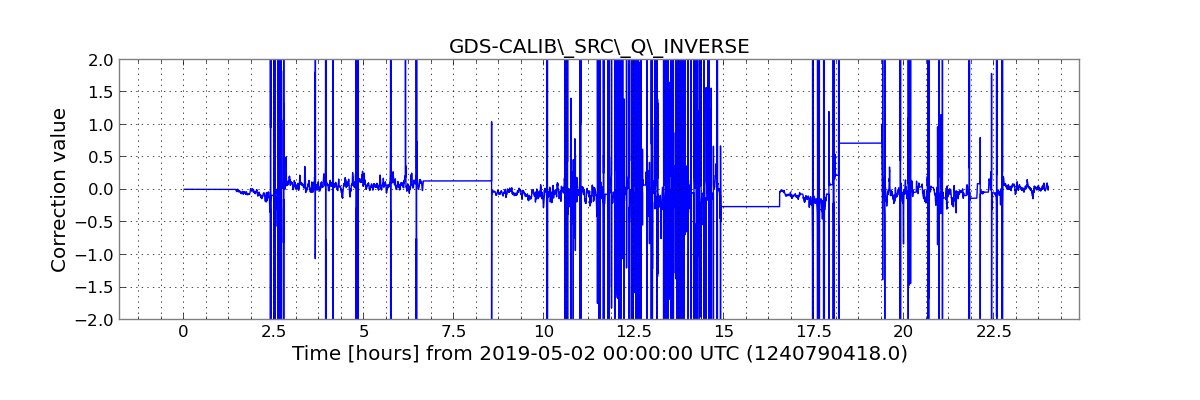
The wildly fluctuating behavior of 1/Q is expected and not cause for concern.  At times when fs is close to zero, the effect of Q on the calibration is small, and it is therefore difficult to measure and has very little impact in such cases.

Images attached to this comment
H1 ISC
daniel.sigg@LIGO.ORG - posted 11:43, Thursday 09 May 2019 - last comment - 15:47, Monday 03 June 2019(49150)
Updated calibration for IMC-I and LSC-REFL_SERVO_CTRL

The IMC-I and the LSC-REFL_SERVO_CTRL readback channels have calibration factors in Hz, which need to account for the optical gain in the IMC REFL path. They were outdated even before the recent increase in optical gain. The new value is 4.4 times smaller than the previous calibration factor.

The REFL_SERVO_CTRL filter banks also contains a filter labeled aogain. This needs to be the exact same value as the IMC-REFL_SERVO_IN2GAIN. It has been changed to -22dB from -24dB.

Comments related to this report
daniel.sigg@LIGO.ORG - 16:49, Thursday 09 May 2019 (49163)

Here is an updated plot of frequency noise spectra related to the IMC. The horizontal magenta line corresponds to the shot noise in the IMC REFL PD. The IMC servo suppresses the frequency noise from the laser below sensing noise at frequencies below 4kHz. There are coherent peaks in REFL_SERVO_CTRL and IMC_F which are not laser frequency noise but acoustic jitter peaks. Not sure the frequency noise spectrum deduced from PRCL makes sense.

Compare this with alog 31554. Back in October 2016, we had 4.1mW on the IMC REFL PD in full lock. One thing to notice is that the laser frequency noise above 3kHz into the IMC was a tad bit smaller in the past.

Non-image files attached to this comment
daniel.sigg@LIGO.ORG - 15:47, Monday 03 June 2019 (49622)

Here is a plot showing the noise at frequencies above 7kHz. Above 3kHz IMC-F actually got worse since O2 (the two ~15kHz poles that were recently added to the readback are not compensated). Unclear where this noise comes from.

Non-image files attached to this comment
Displaying reports 40761-40780 of 88905.Go to page Start 2035 2036 2037 2038 2039 2040 2041 2042 2043 End