TITLE: 05/27 Day Shift: 15:00-23:00 UTC (08:00-16:00 PST), all times posted in UTC
STATE of H1: Corrective Maintenance
INCOMING OPERATOR: Corey
SHIFT SUMMARY: locked most of the shift, issues listed below
LOG:
IM Shift & Restoring Pre-EQ
After antoher SQZ unlocking followed by a close H1 Lockloss, took this opportunity to take the IMs to their pre-Peru-EQ values (Cheryl did this...most notable change was Pitch for IM2 & IM3)---this is mainly because the last lock was not great & we're hoping that fixing the IM shifts will help H1.
ALS PDH Errors
On a seperate note, after H1 lost lock, noticed that we do not have any light for ALS x & y (green). On the ALS Overview both X & Y have "ERROR 4 PDH" errors.
This is is what I'm going to look into next. Once through ALS issue, will run a new INITIAL ALIGNMENT to the new IM pointing & see how H1 likes that.
ALS PDH issue is being traced down to GREEN Refl A for both arms having "Power To Low".
So at this point, I'm guessing this is alignment-related. So with Cheryl's help, I'm going to check alignment for TMS', ETMs', ITMs for their alignment pre-EQ.
Earlier today Cheryl and I noted that the ref cav tranmission PD has dropped since the earthquake (now sitting at 1.9V).
Maybe, since the ALS problems are in both arms, this is related? I can start looking into it remotely.
ALS Issue Solved!
My dumb mistake. For some reason both Shutters were closed for ISCTEX/Y green beams---OPENing this gave us light! So, now waiting for signals to converge so I can OFFLOAD and then move on with INITIAL_ALIGNMENT. (Thanks, Georgia & Cheryl for helping!)
TITLE: 05/26 Eve Shift: 23:00-07:00 UTC (16:00-00:00 PST), all times posted in UTC
STATE of H1: Observing at 104Mpc
OUTGOING OPERATOR: Cheryl
CURRENT ENVIRONMENT:
Wind: 26mph Gusts, 18mph 5min avg
Primary useism: 0.17 μm/s
Secondary useism: 0.13 μm/s
QUICK SUMMARY:
H1 was out of OBSERVING when I walked in. Cheryl let me know this was due to the SQZ being unlocked; she was giving it time to INIT to a LOCKED state, and we saw it get back there. We waited a few minutes to go back to OBSERVING in case it was going to drop back out again.
(while waiting I closed/reopened the medm for video2 because the OPS_OVERVIEW was froze giving impression we had still been in OBSERVING.)
23:09 H1 back to OBSERVING (it dropped out due to the SQZ at 22:47).
H1 has been locked for almost 7hrs post-Peru-EQ with Ed & Cheryl recovering here and Sheila/Georgia helping over the phone. Cheryl is investigating the IMs to see if the shift they had from EQ is better/worse/no change.
Winds have picked up to just under 20mph over the last 2hrs.
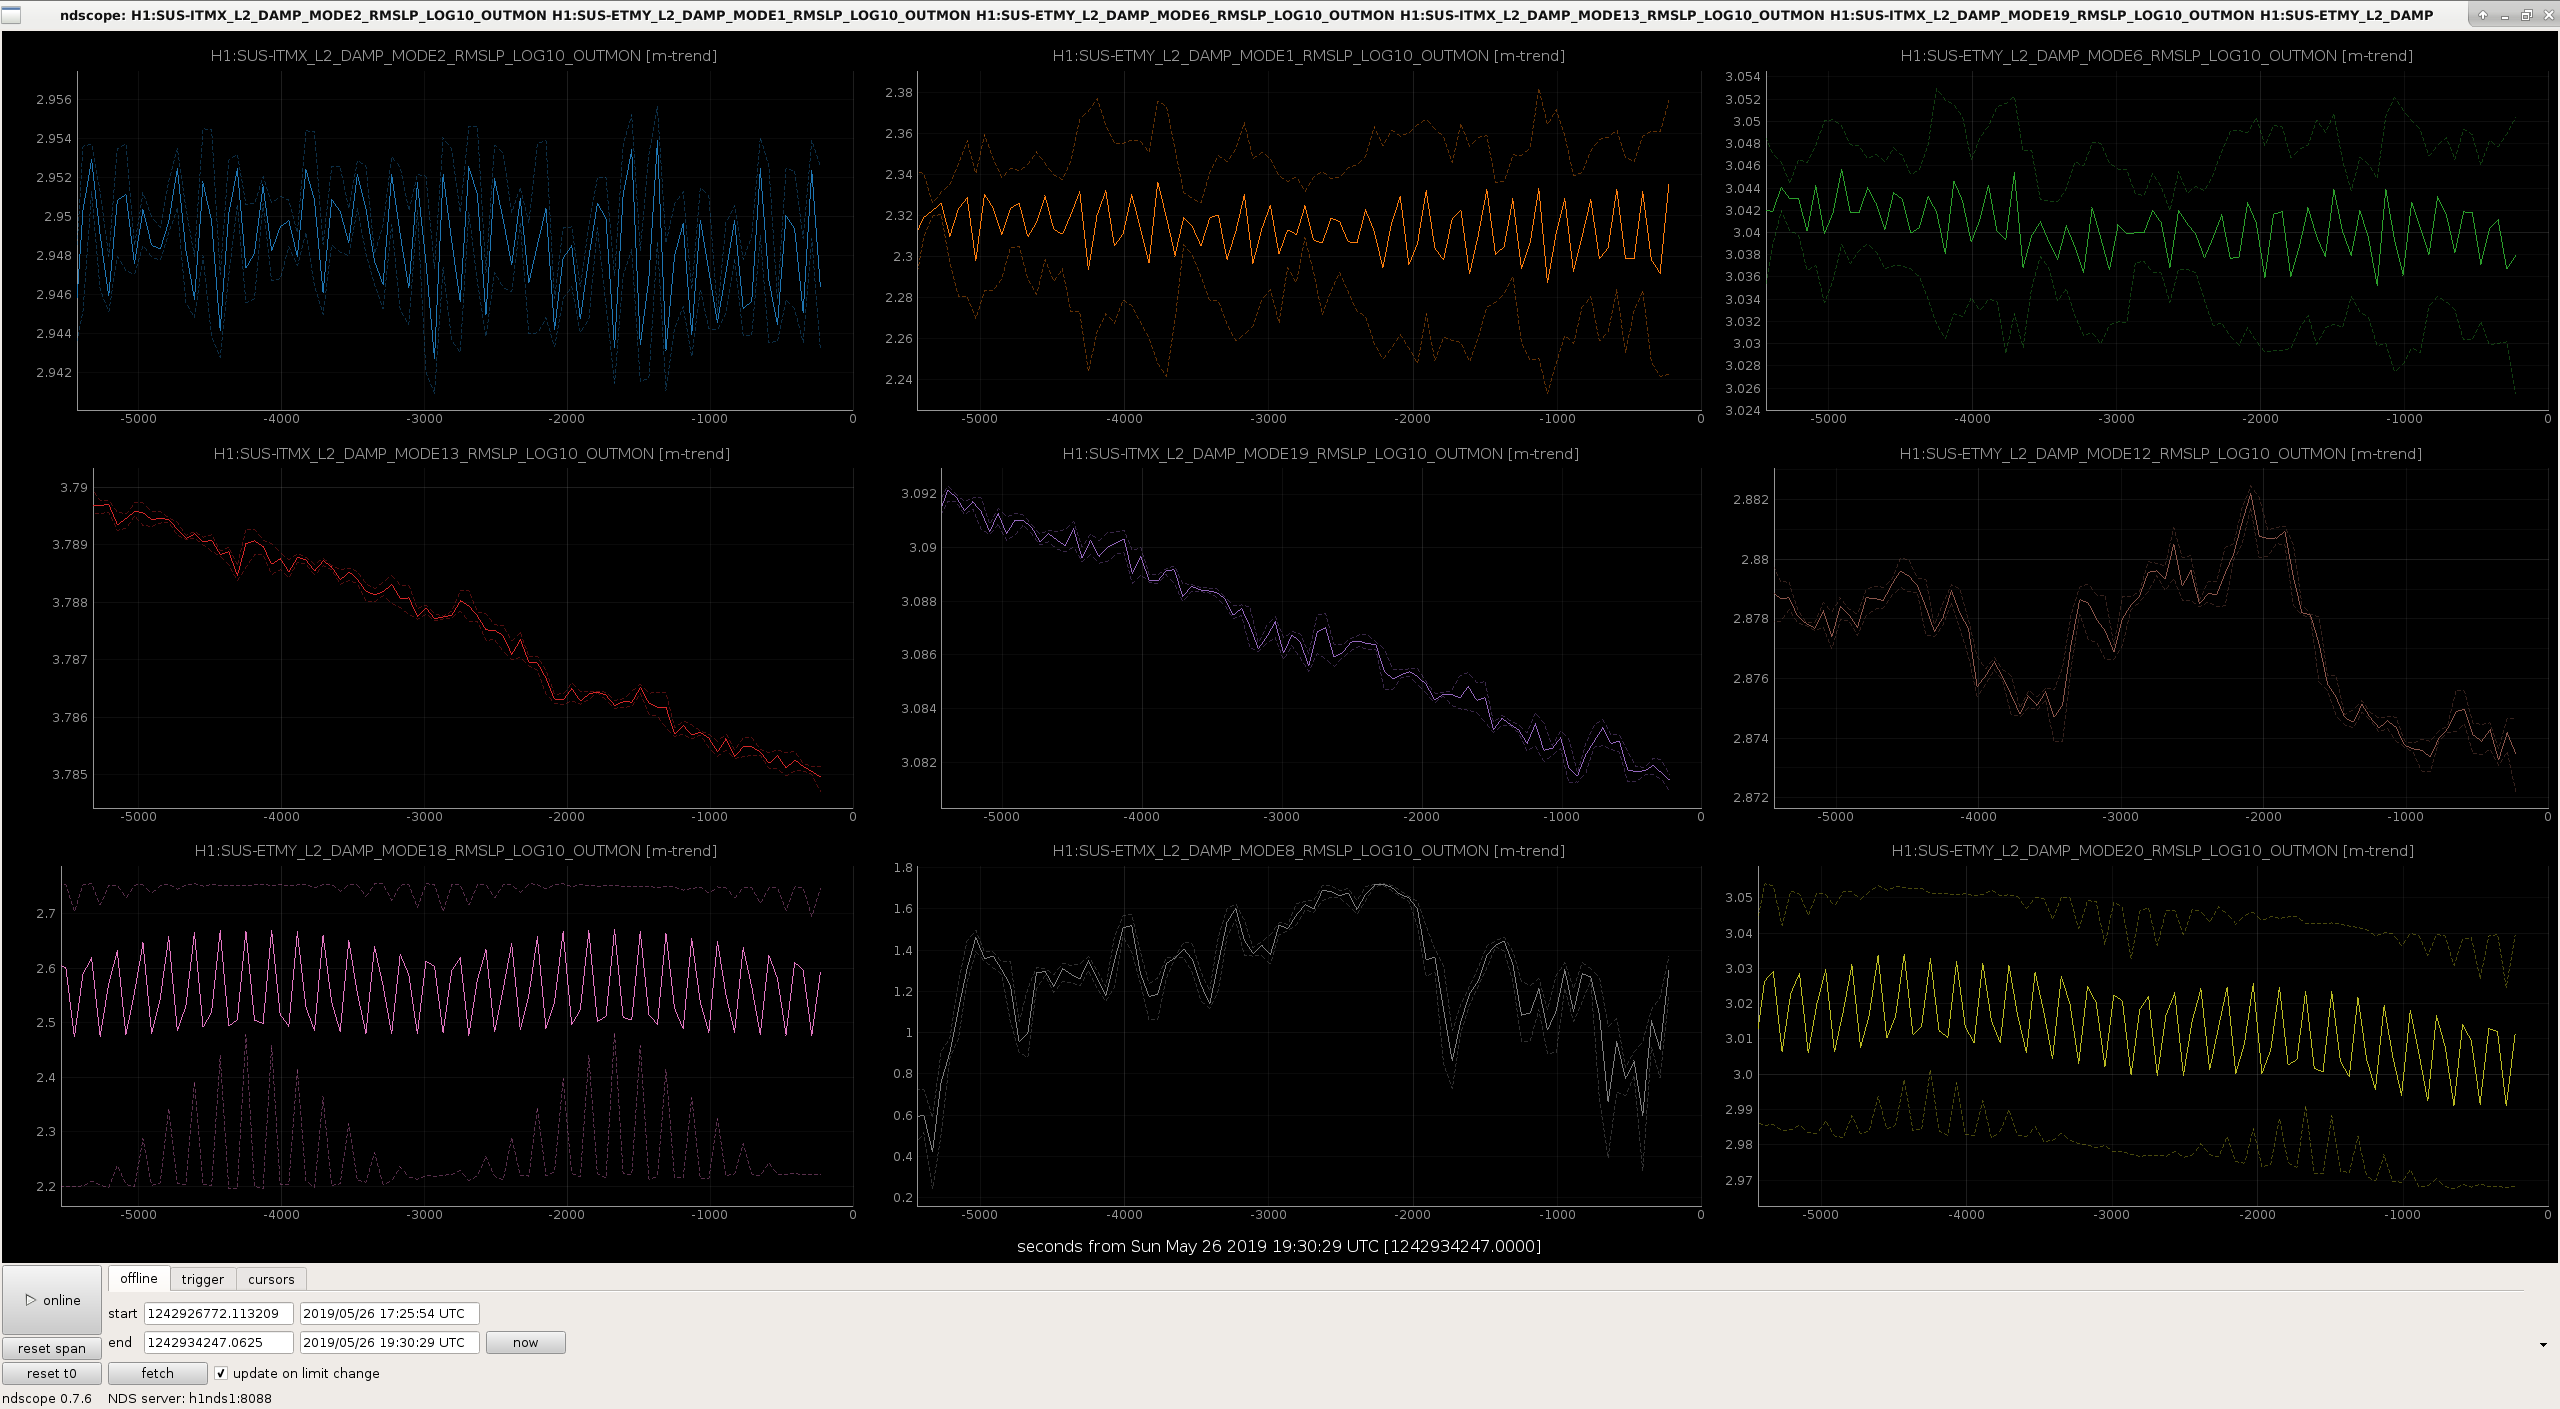
I plotted the violin modes that have the highest RMS - some are slowly coming down, others, holding steady, none are ringing up at this time.
TITLE: 05/26 Day Shift: 15:00-23:00 UTC (08:00-16:00 PST), all times posted in UTC
STATE of H1: Earthquake
OUTGOING OPERATOR: Ed
CURRENT ENVIRONMENT:
Wind: 11mph Gusts, 9mph 5min avg
Primary useism: 0.03 μm/s
Secondary useism: 0.14 μm/s
QUICK SUMMARY:
TITLE: 05/26 Owl Shift: 07:00-15:00 UTC (00:00-08:00 PST), all times posted in UTC
STATE of H1: Earthquake
INCOMING OPERATOR: Cheryl
SHIFT SUMMARY:
LOG:
9:35 Begin resetting Watchdogs -
9:57 BLRMS below 1um/s - AS spot is low and right
10:07 Everything un-tripped. Everything re-aligned - AS Spot still low and right
11:40 Just got off the phone with Sheila (she called in to check on the quads). I didn't push the big green RECOVER EQ button!!!!!! -_-
11:45 Begin Initial Alignment
12:10 Raine from LLO called to let me know that ALSY tripped and requires a trip to the end station - phone buddy system in effect
12:33 Raine reported back at the corner station.
12:52 begin re-locking H1
14:00 Lock failed at INCREASE POWER
14:23 Lock failed at INCREASE POWER (again)
15:00 Handing off to Cheryl
Cheryl, Sheila
Here are links for the two locklosses from increase power that Ed logged: 1242914440 and 1242915786
In both cases the DSOFT P and CSOFT P control signals became large right after we entered the INCREASE POWER (504) state. About a week ago we were having trouble suppressing the radiation pressure instability in the X arm because the beams were falling off the QPD. As a temporary solution we introduced an offset on TMSX TEST P before we increase the power, which is turned off again for lock acquisition so that we do not loose our green alignment references. We set the ramp time on the offset to 30 seconds, but this must have been reset to 2 seconds this morning either by the suspension guardian when recovering from a watchdog trip or by the dither alignment script.
We set the ramp time to 30 seconds again, and I added a line to the guardian that sets the ramp time to 30 seconds before turning on the offset in INCREASE_POWER. Cheryl loaded this and was able to get through the first few steps of the power increase.
Both the lockloss tool and the new remote access made it much easier than it might have been to diagnose and solve this issue remotely than it would have been in O2.
So we don't think this was simply a symptom of ETMY Modes 1 and 6 being rung up after a very large seismic event? I can say that I hadn't noticed them until the third attempt.
Tagging @DetChar and SEI for data in seismic's sensor correction configuration transition studies.
07:51:52UTC Lockloss - StripTool showed no wavering or oscillations prior. Dropped from stable ~109Mpc to 0 instantly.
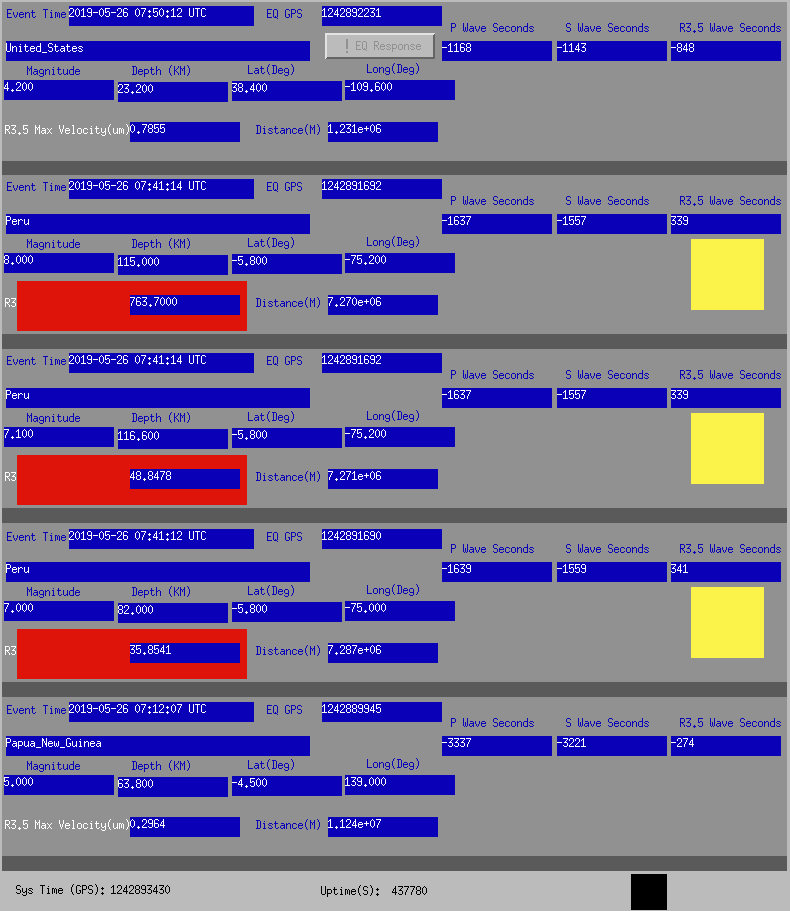
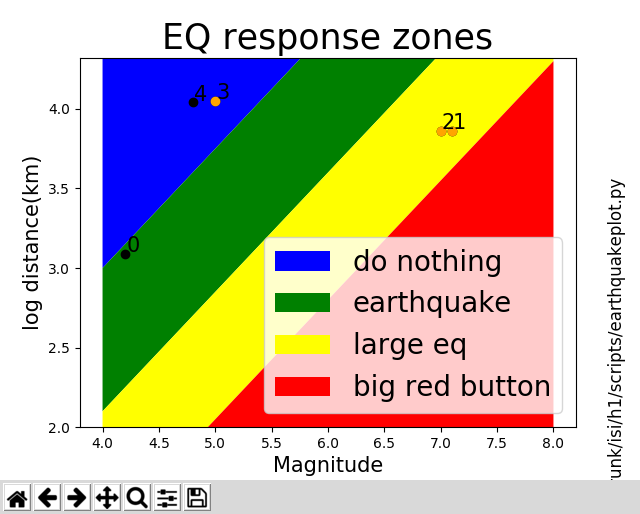
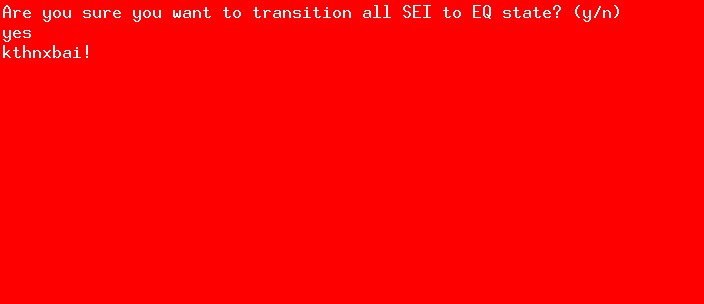
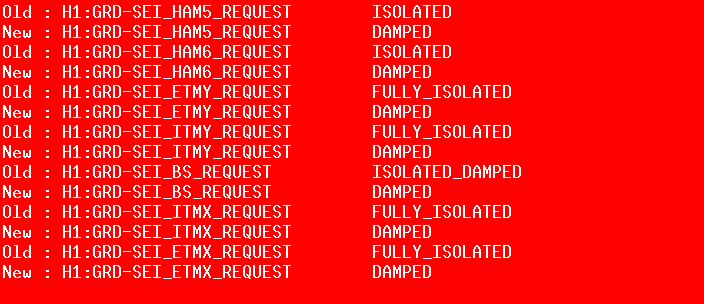
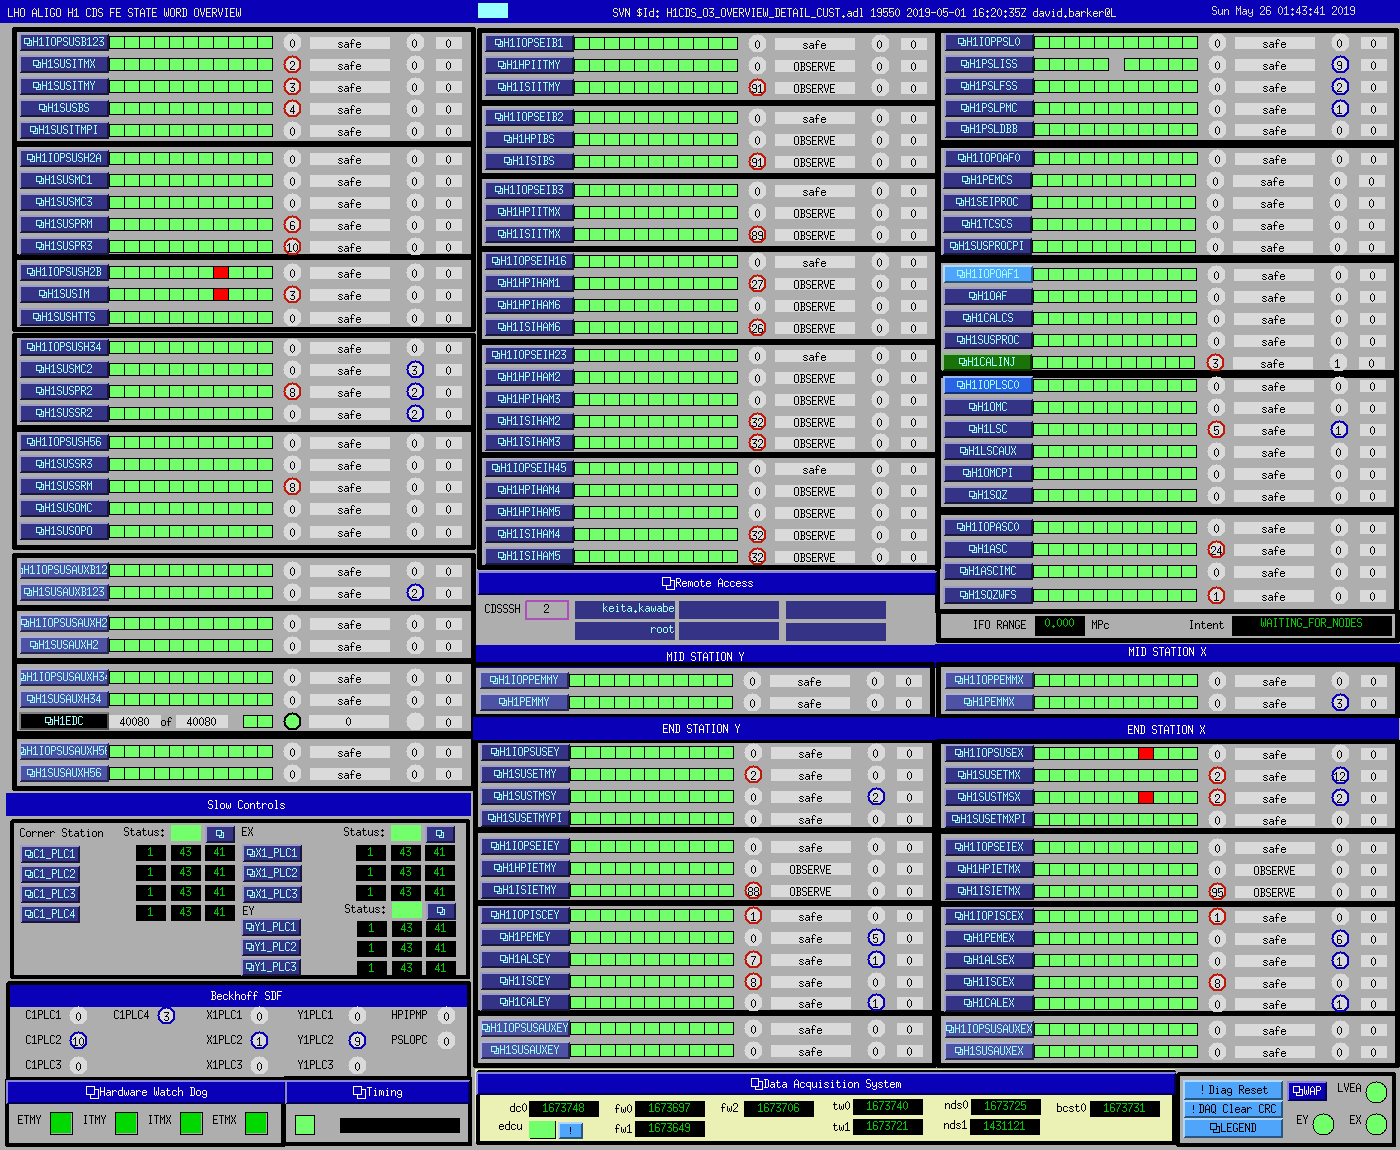
This is a huge quake. I no sooner saw the spot on USGS and started to examine the state of the ISIs when the lock fell off with out any Verbal Alarm warning of an incoming. The S&P waves rolled in faster than I could even react. As I type this (08:00 UTC), the incoming EQ Verbal came in with 910 seconds to R3.5 wave arrival . BLRMS are already off scale. By this time, most of the ISIs had tripped upon P & S wave arrival and then the rest, with some of the smaller suspensions, tripped (r3.5 countdown not even completed yet). Also, prior to the second wave of trips I pressed the big red VERY LARGE EQ button. I entered "yes" in the confirmation window and wasn't sure that any changes had actually been effected as tripping continued. I understand that it takes time for the damping but when I pressed it again and entered "y" i got feedback from the script confirming damping and isolations effected. I temporarily changed the BLRMS upper Y-axis limits (both graphs) so I could see the max velocities (default limits were: .03-.1Hz = 30um/s & .1-.3Hz = 3um/s). EX hit 50u; EY hit 40+u; CSZ hit 30u+. CDS Overview also showing IM, TMSX, and associated IOP DAC KILLS. No aftershocks reported at this time. Curious ISC_LOCK items appearing on Verbal Alarms screen. I don't recall them being announced audibly. Guardian will remain in DOWN/READY and trips will remain safely tripped until sufficient "ringdown". time out 8:56UTC.
Also notable: It doesn't seem that this huge quake showed up in the RED area of Jim's "rasta flag". ??
TITLE: 05/26 Owl Shift: 07:00-15:00 UTC (00:00-08:00 PST), all times posted in UTC
STATE of H1: Observing at 110Mpc
OUTGOING OPERATOR: Corey
CURRENT ENVIRONMENT:
Wind: 10mph Gusts, 7mph 5min avg
Primary useism: 0.03 μm/s
Secondary useism: 0.16 μm/s
QUICK SUMMARY:
TITLE: 05/26 Eve Shift: 23:00-07:00 UTC (16:00-00:00 PST), all times posted in UTC
STATE of H1: Observing at 113Mpc
INCOMING OPERATOR: Ed
SHIFT SUMMARY:
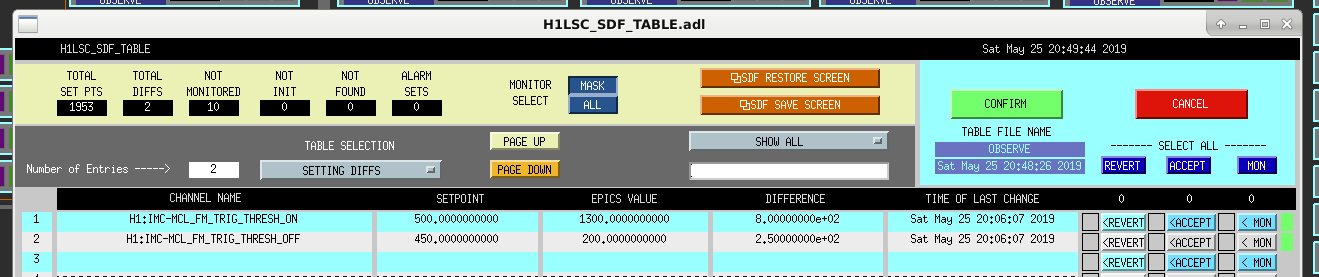
H1 currently has 3+hrs of observing/lock under its belt. Be mindful of the IMC MCL threshold diffs I had (noted in earlier alog).
Microseism has been trending down and has returned to the 50th percentile. Ed reported some heavy rain on parts of his drive in.
LOG:
At 1:04utc (5:04pm), H1 had a lockloss after 51+hrs of lock.
3:50utc: Back To OBSERVING (Have had a couple of large/long glitches in the first 15min so far.)
4:10: Time to make lunch.
Trying to relock H1 after 2+day lock. Ran an alignment, but have had a few failed attempts thus far. Contemplating another alignment after a few more locking attempts now.
Tried relocking immediately afterward, but DRMI took a while & after it did lock, broke lock at SHUTTER_ALS. (POP18 only got up to about 55 with PRM/SRM touch ups at OFFLOAD_DRMI_ASC).
Ran an alignment.
Now back to locking. DRMI took about 7min to lock. (POP18 only got up to about 59 with PRM/SRM touch ups at OFFLOAD_DRMI_ASC).
SUMMARY so far:
1:04 H1 lockloss after 51hrs 44min!
TITLE: 05/25 Day Shift: 15:00-23:00 UTC (08:00-16:00 PST), all times posted in UTC
STATE of H1: Observing at 111Mpc
OUTGOING OPERATOR: Ed
CURRENT ENVIRONMENT:
Wind: 8mph Gusts, 5mph 5min avg
Primary useism: 0.02 μm/s
Secondary useism: 0.23 μm/s
Microseism has been taking slight dip down and now is touching the 50th percentile. Higher winds from Cheryl's shift seem to be dying down
QUICK SUMMARY:
H1 has been running for almost of 51hrs (as of 0:15utc); with Observing currently at 25+hrs.
I had a a tour group here from roughly 2pm-4:15pm & Cheryl covered me as I escorted the group back to the LSB parking lot. Amber is now in here with another group (there will also be a public lecture in the LSB at 6pm).
Forgot to mention: While Cheryl & Robert were here, I ran off to check on the TCSy Chiller.
It looked fine & has maintained the same level since yesterday. So I did not add any water.
M. Wade, A. Viets
I have finished creating DCS calibration filters files for the C01 h(t) frame production. The first epoch for C01 h(t) frames will use filters file
aligocalibration/trunk/Runs/O3/GDSFilters/H1DCS_C01_1239472998.npz
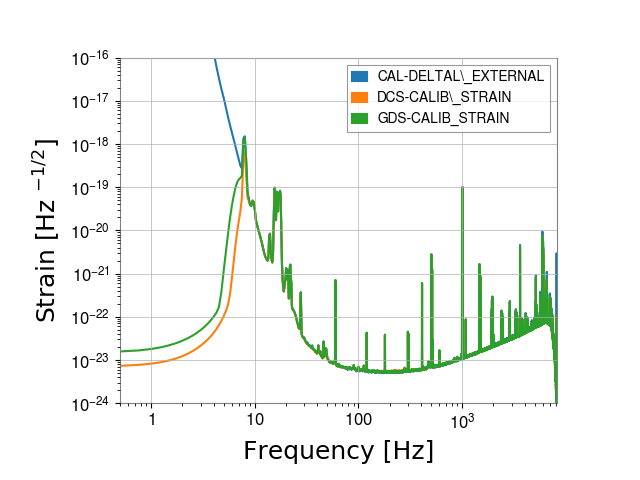
I have attached plots from sanity checks run using this filters file on data from GPS times 1239720596-1239723372. The first attached plot is an ASD comparison of data calibrated with this filters file (expected C01 data), the corresponding C00 data, and the corresponding CAL-CS data. The second plot is the ASD ratio of these three strain products. The third plot is the response function as derived from the expected C01 data and the CAL-CS data compared to the pyDARM model response, and the fourth plot is a zoom-in on the ratio of this response function comparison. All of these tests indicate that this filters file is ready for use on C01 data, giving the expected level of agreement in each comparison.
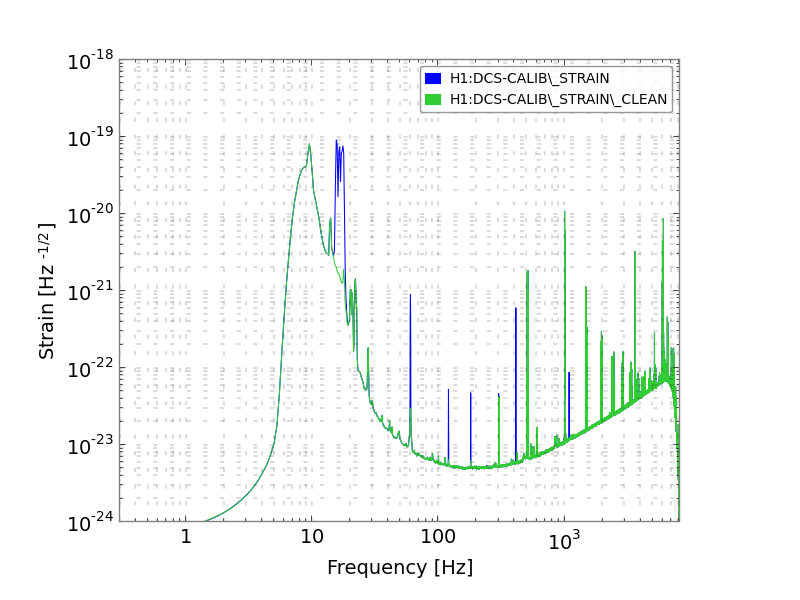
I've made a few more plots to test these filters. The first three show the filters' effect on real data, compared to the frequency-domain model. The actuation filters show some apparent deviation at low frequencies, but this is likely due the the large dynamic range spanned in that frequency range, as it does not show up in the response function plot. The fourth plot shows the response function produced by the filters, compared to the frequency-domain model (same type of plot as in the above aLOG, but uses a different transfer function algorithm in an effort to reduce noisiness). The fifth plot shows ratios of DeltaL / Pcal at the calibration line frequencies. The points labeled "DCS" include compensation for all time dependence except for that of the SRC. The points labeled "+SRC" additionally include compensation for time dependence of the SRC. A significant improvement is seen at the 17.1 Hz line. The sixth plot shows comparisons of h(t) to the cleaned data, to show that it is working.
I analyzed some longer stretches of data to assess the impact of SRC tine-dependence on calibration accuracy. Unfortunately, it has been difficult to analyze more than a day at a time, for two reasons:
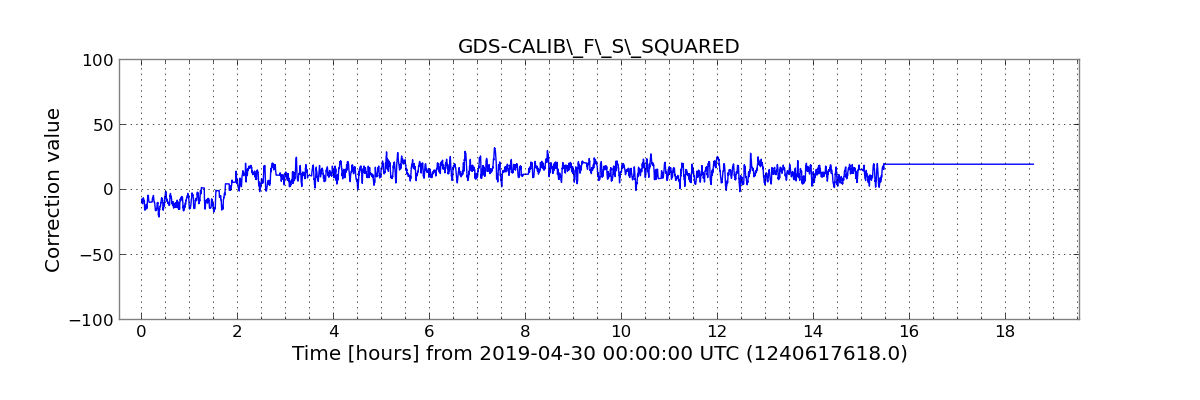
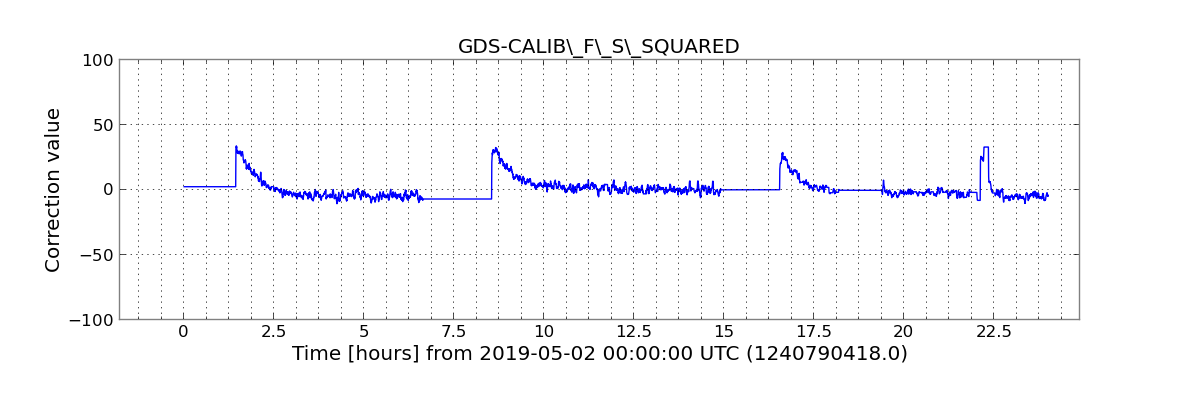
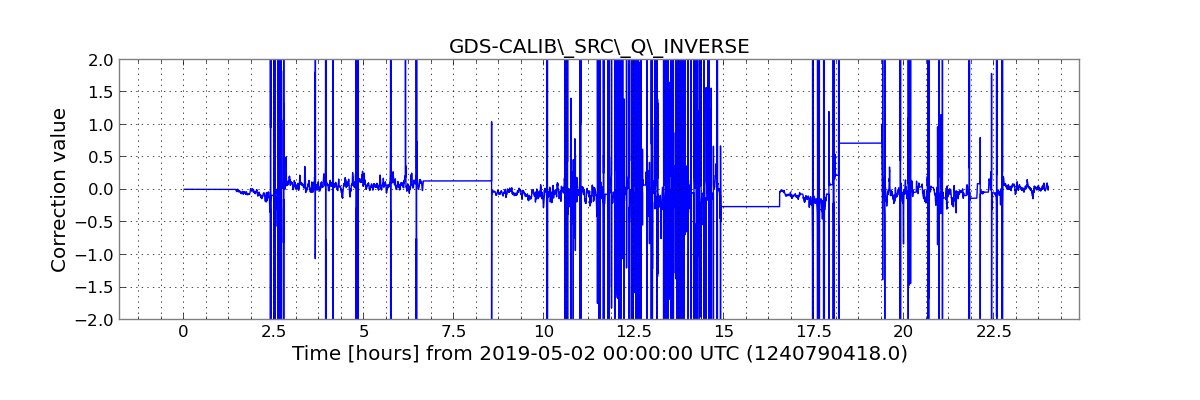
I chose 2 days to use, due to interesting features apparent on the summary pages. The first three plots are from April 30, where a well defined change occurs in the SRC's optical spring frequency, which appears to change from a pro-spring (fs2 < 0) to an anti-spring (fs2 > 0) early in the day. The next three plots are from May 2, where there are multiple lock losses and lock stretches. The spring frequency changes significantly in the first ~hour of each lock stretch.
The plots show time series of fs2 and 1/Q for roughly a day, as well and trends of DeltaL / Pcal at the Pcal line frequencies. For this data, compensating for all time dependence consistently leads to a significant improvement in calibration accuracy relative to Pcal at the Pcal line frequencies. Note that compensation for fs and Q time dependence is not the only distinction between the two data sets being compared. The C00 data at the time did not include compensation for kappa_PUM or kappa_UIM either. A check of the summary pages from those days, however, suggests that the impact of kappa_PUM and kappa_UIM may be less significant than the time dependence of the SRC.
The wildly fluctuating behavior of 1/Q is expected and not cause for concern. At times when fs is close to zero, the effect of Q on the calibration is small, and it is therefore difficult to measure and has very little impact in such cases.
M. Wade, A. Viets
I have finished creating DCS calibration filters files for the C01 h(t) frame production. The first epoch for C01 h(t) frames will use filters file
aligocalibration/trunk/Runs/O3/GDSFilters/H1DCS_C01_1237831461.npz
I have attached plots from sanity checks run using this filters file on data from GPS times 1239036564-1239039340. The first attached plot is an ASD comparison of data calibrated with this filters file (expected C01 data), the corresponding C00 data, and the corresponding CAL-CS data. The second plot is the ASD ratio of these three strain products. The third plot is the response function as derived from the expected C01 data and the CAL-CS data compared to the pyDARM model response, and the fourth plot is a zoom-in on the ratio of this response function comparison. All of these tests indicate that this filters file is ready for use on C01 data, giving the expected level of agreement in each comparison.
I've made a few more plots to test these filters. The first three show the filters' effect on real data, compared to the frequency-domain model. The actuation filters show some apparent deviation at low frequencies, but this is likely due the the large dynamic range spanned in that frequency range, as it does not show up in the response function plot. The fourth plot shows the response function produced by the filters, compared to the frequency-domain model (same type of plot as in the above aLOG, but uses a different transfer function algorithm in an effort to reduce noisiness). The fifth plot shows ratios of DeltaL / Pcal at the calibration line frequencies. The sixth plot shows comparisons of h(t) to the cleaned data, to show that it is working.
changes in IM alignment shown in the attached plot: largest changes were IM2 pitch, delta -30 urad, and IM3 pitch, delta -10 urad
I was interested in what, if any, conferences changed between DARM and POP and REFL. I used skinny list of channels, and have included REFL in the first plot. Interestingly, the coherence with DARM today, in the lock after the EQ, are smaller than two days ago. The second plot is my first look at IMs to arms.