TITLE: 05/24 Owl Shift: 07:00-15:00 UTC (00:00-08:00 PST), all times posted in UTC
STATE of H1: Observing at 109Mpc
OUTGOING OPERATOR: Travis
CURRENT ENVIRONMENT:
Wind: 15mph Gusts, 12mph 5min avg
Primary useism: 0.04 μm/s
Secondary useism: 0.16 μm/s
QUICK SUMMARY:
H1 locked and Observing.
TITLE: 05/24 Eve Shift: 23:00-07:00 UTC (16:00-00:00 PST), all times posted in UTC
STATE of H1: Observing at 109Mpc
INCOMING OPERATOR: Ed
SHIFT SUMMARY: Lock is 9.5 hours old. No issues to report.
LOG:
Porcupine spotted on back patio. We also saw it last evening.
TITLE: 05/23 Eve Shift: 23:00-07:00 UTC (16:00-00:00 PST), all times posted in UTC
STATE of H1: Observing at 114Mpc
OUTGOING OPERATOR: Jim
CURRENT ENVIRONMENT:
Wind: 15mph Gusts, 13mph 5min avg
Primary useism: 0.03 μm/s
Secondary useism: 0.18 μm/s
QUICK SUMMARY: Lock is 1.5 hours old. No issues were conveyed.
TITLE: 05/23 Day Shift: 15:00-23:00 UTC (08:00-16:00 PST), all times posted in UTC
STATE of H1: Observing at 112Mpc
INCOMING OPERATOR: Travis
SHIFT SUMMARY: Difficult locking today
LOG:
15:50 lockloss becaue I went to LARGE_EQ, instead of EARTHQUAKE
The rest of the day was spent trying to relock, ASC was difficult for no identifiable reason
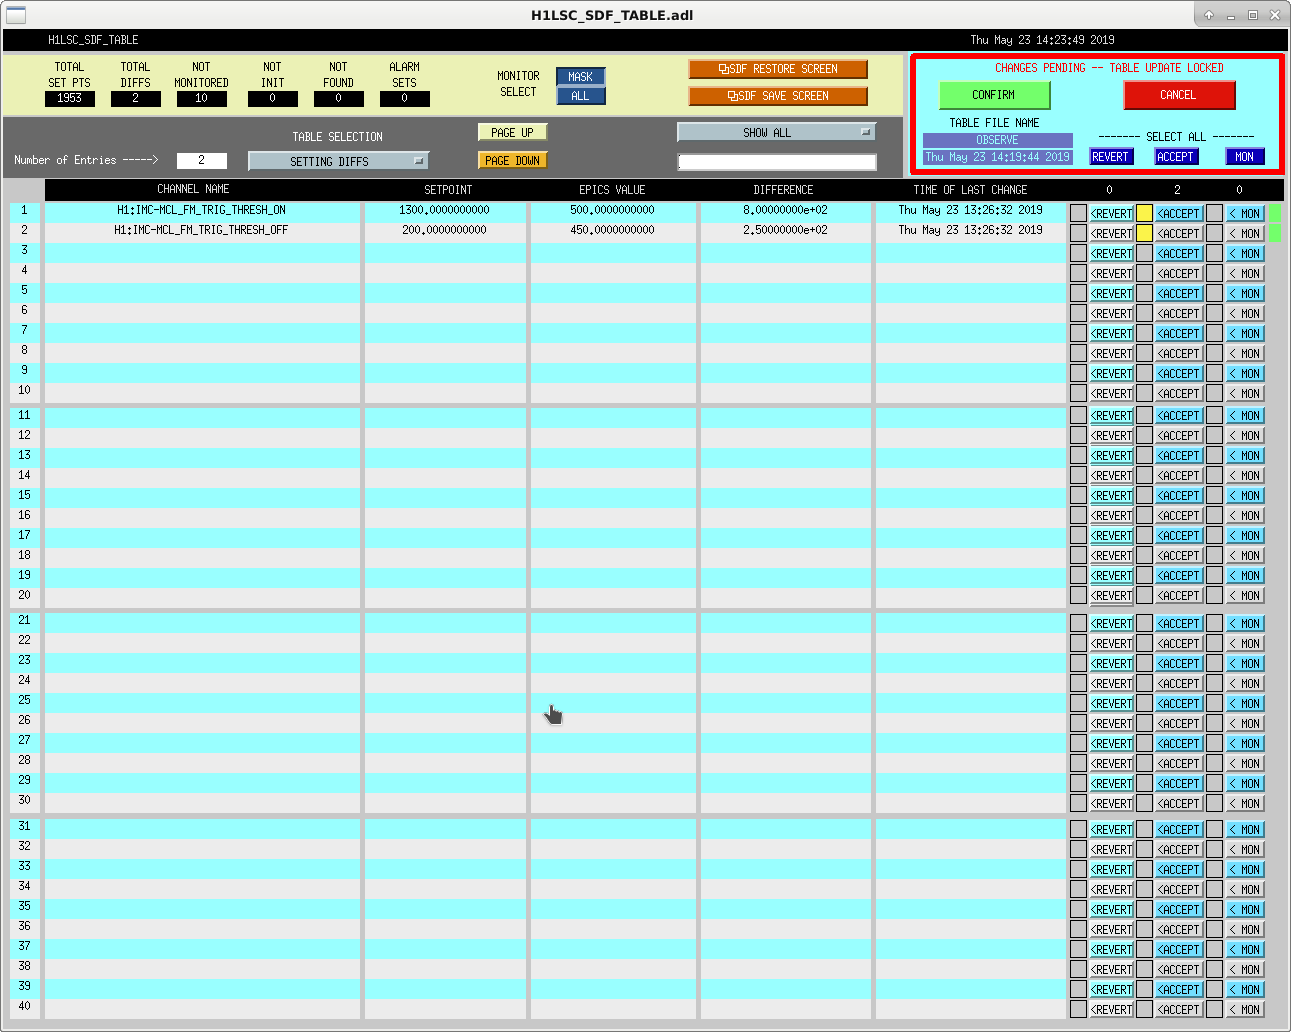
Just had some unexplained sdf diffs show up after the last re-locking. 2 trigger thresholds in IMC MCL, which were changed about the time of the last lock loss, which did not have an obvious cause. No idea if these are relevant or what caused the change.
I think these are triggers for turning on the IMC MCL boost. They're set in the IMC_LOCK down state, and the thresholds are set depending on the input power into the IMC. For some reason we're stuck with the 2W trigger thresholds, probably when we lock again we'll have another SDF difference undoing this.
I don't think this is a problem, or related to our locklosses, since the IMC is controlled by LSC-MCL (not IMC-MCL) for everything after the LOCKING_ALS state.
[Gabriele, Marek]
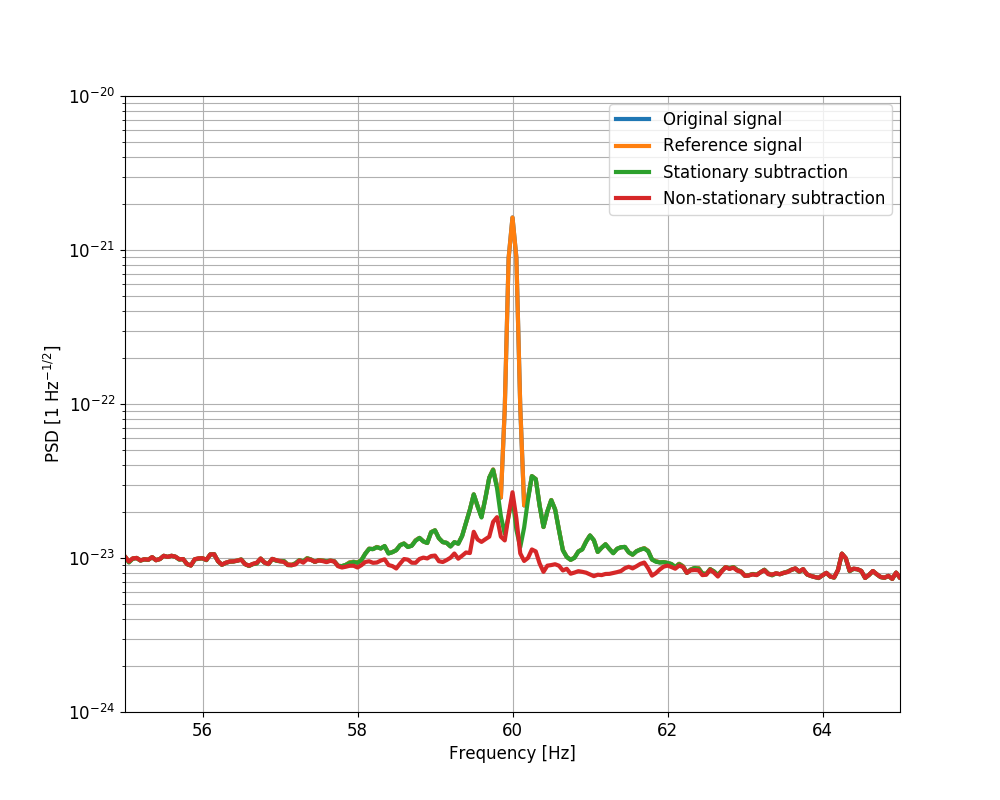
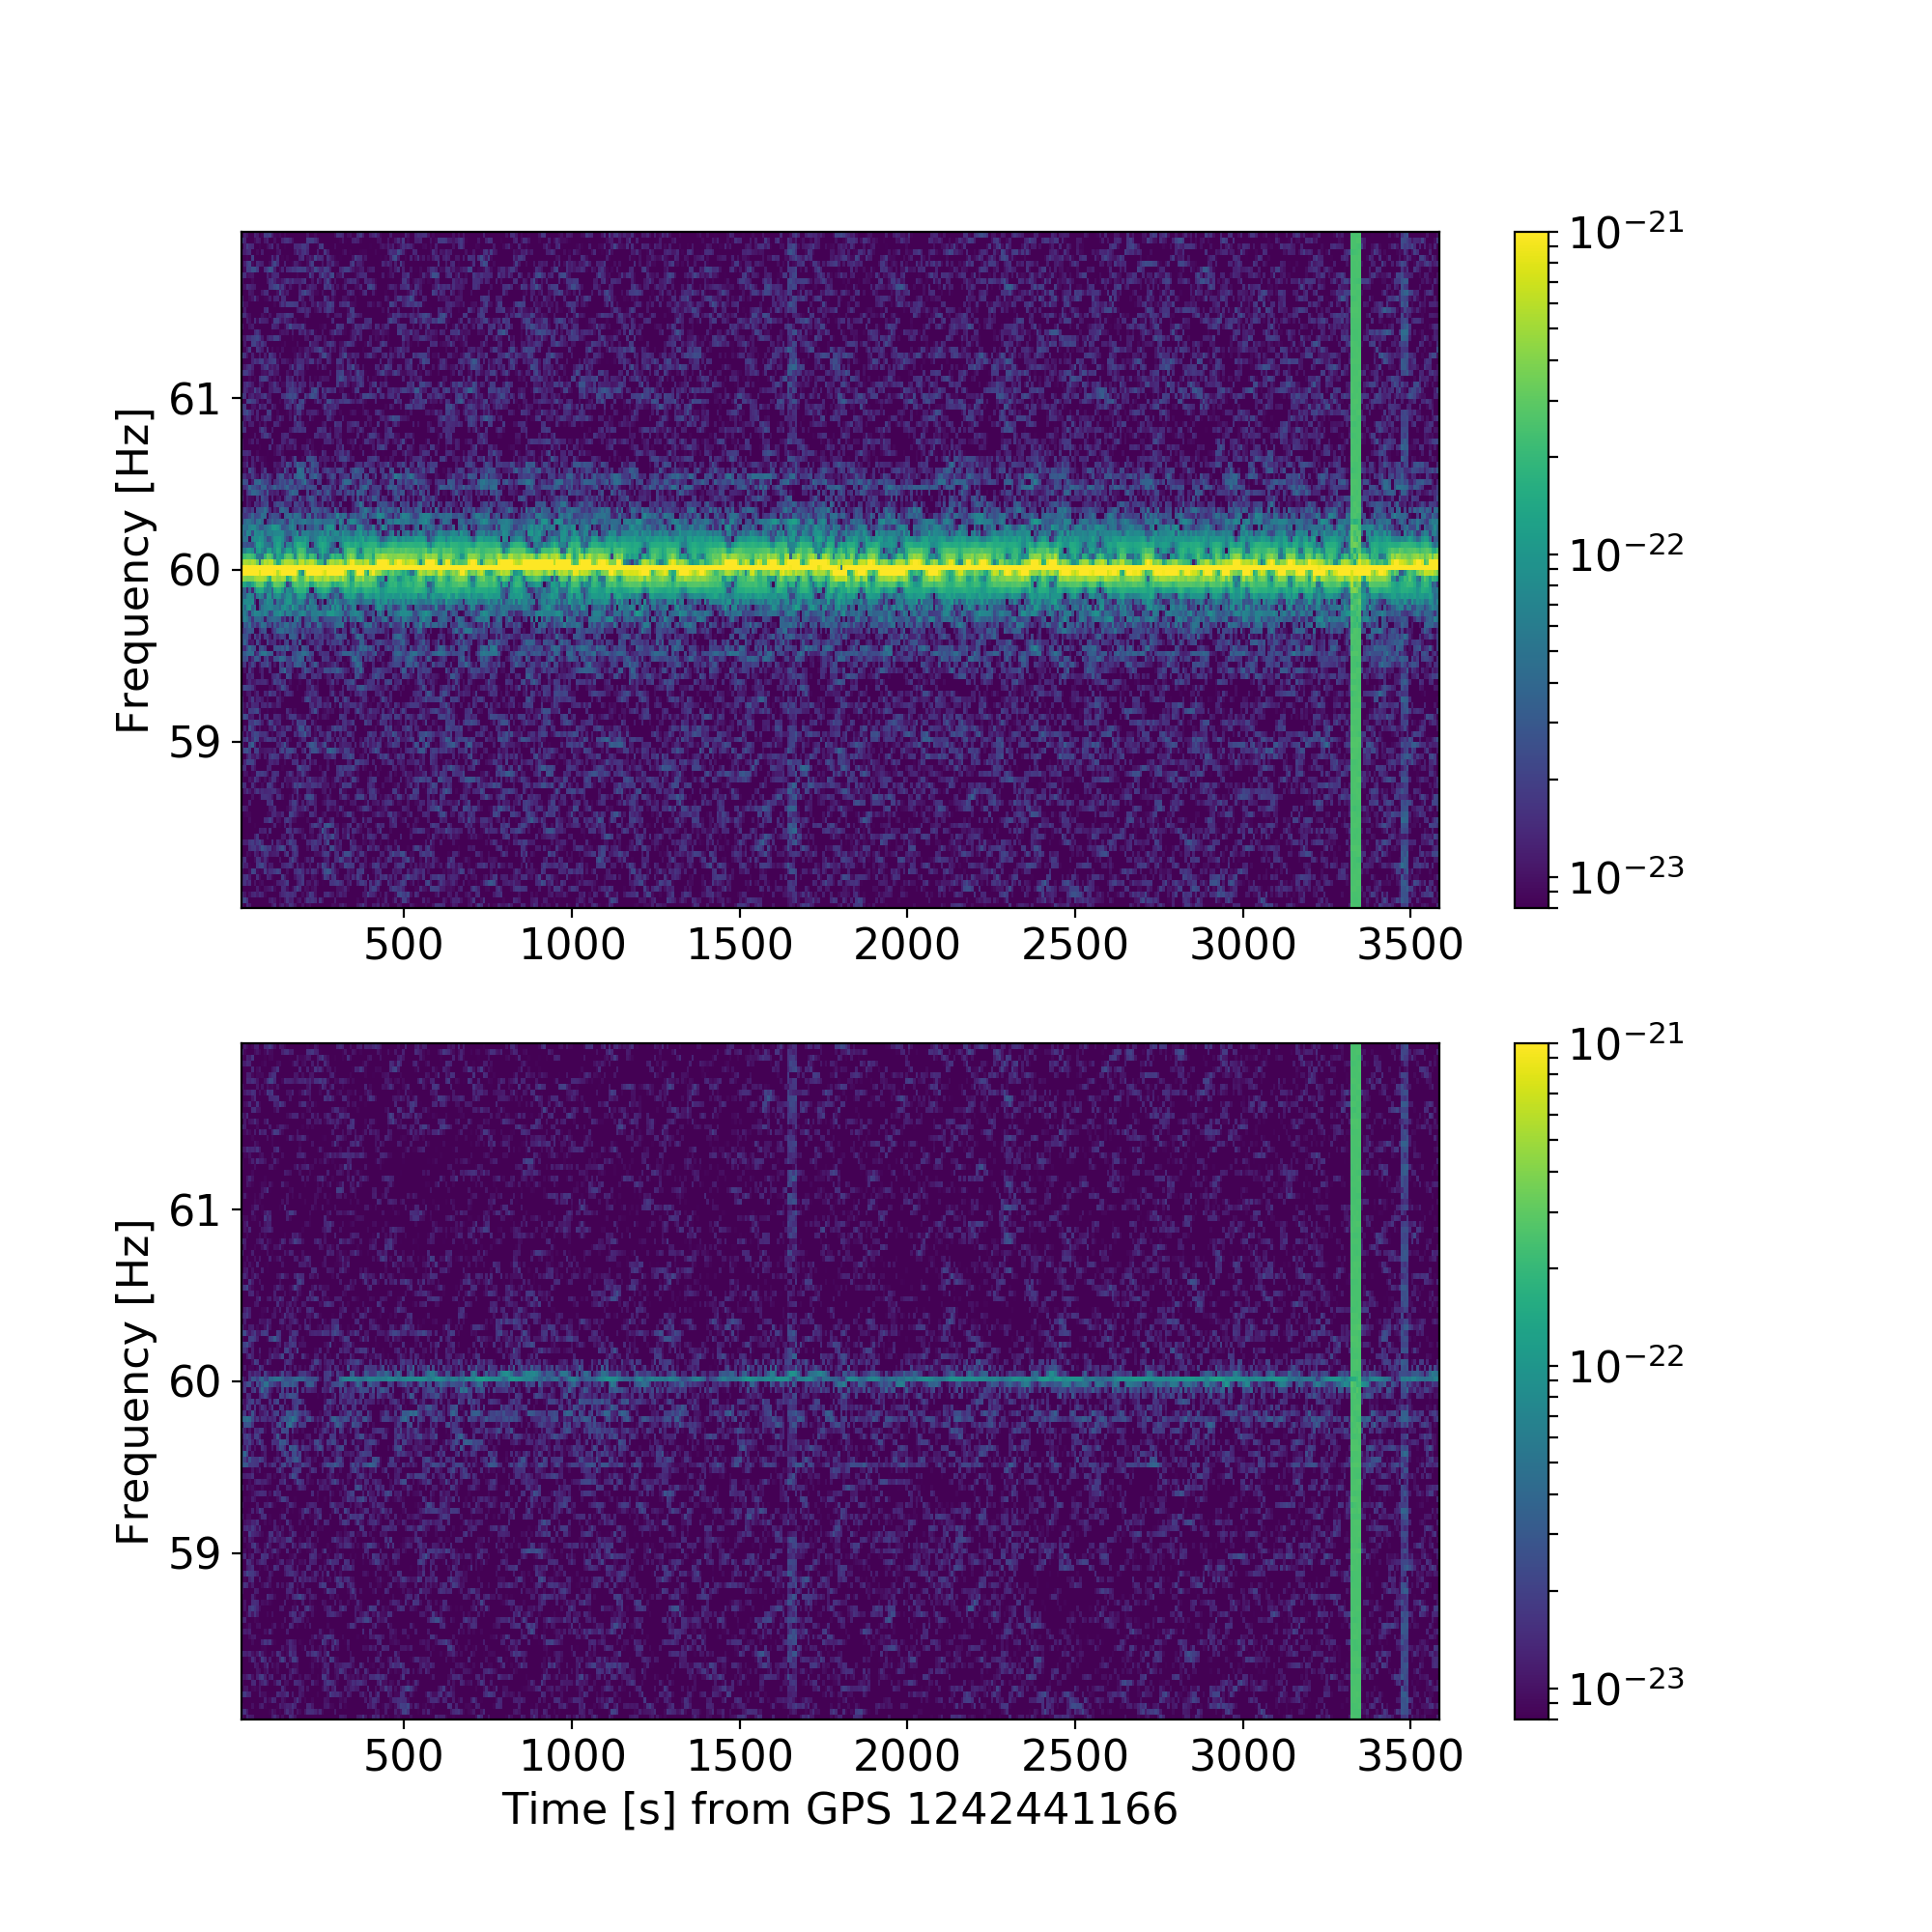
The 60 Hz line is quite large and accompanied by sidebands that spread over a 4 Hz band around the line. Those sidebands look like modulation of the 60 Hz line by IFO motion.
We used the machinery of non-stationary noise subtraction to see if we could subract the broad noise around the line. Details in the links below [1-3].
We used H1:GDS-CALIB_STRAIN for the sensitivity and H1:PEM-CS_MAINSMON_EBAY_1_DQ to measure the 60 Hz line. Then we used all ASC input error signals to describe the modulation.
The algorithm builds a parametric description of the modulations. The result is shown in the first plot attached below (blue and orange are equal and are the h(t) signal before subtraction, green is the best subtraction with only the linear coupling of the PEM mains monitor, red is the best subtraction when including non-stationary modulation due to ASC signals).
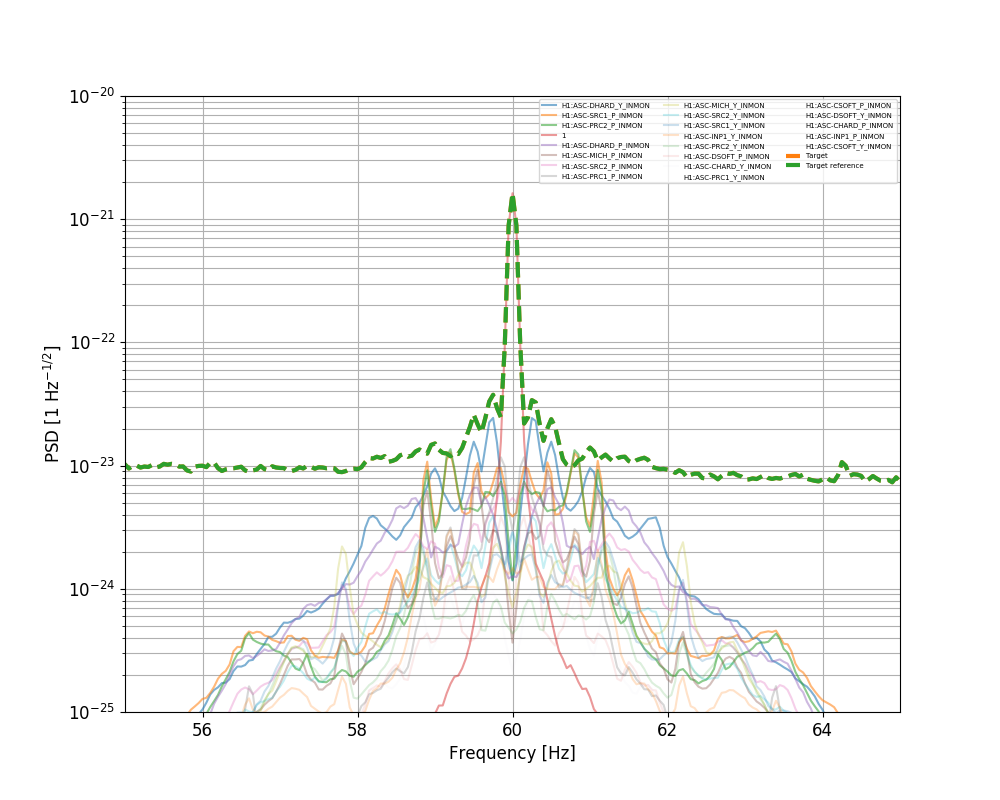
The second attached plot shows each contribution: apart for the reference signal, each trace corresponds to the PEM mains monitor modulated with one of the ASC signals with optimal time-domain filter.
[1] NonSENS code https://git.ligo.org/gabriele-vajente/nonsens
[2] Subtraction of non-stationary noise couplings https://dcc.ligo.org/LIGO-T1800525
[3] Non-stationary / non-linear noise subtraction https://dcc.ligo.org/LIGO-G1900397
TITLE: 05/23 Owl Shift: 07:00-15:00 UTC (00:00-08:00 PST), all times posted in UTC
STATE of H1: Observing at 110Mpc
INCOMING OPERATOR: Jim
SHIFT SUMMARY:
LOG:
9:56 Just noticing that 45Mhz Amp Mod seems a bit noisy/glitchy in LF at times.
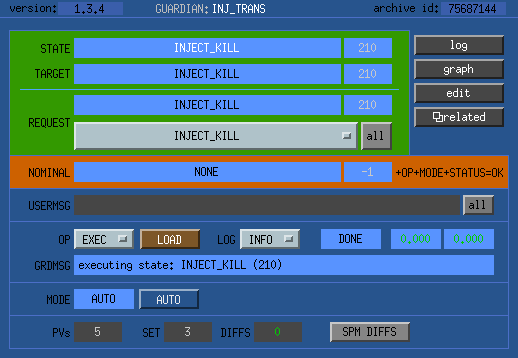
1 hour standown on site activity in effect. INJ_TRANS active.
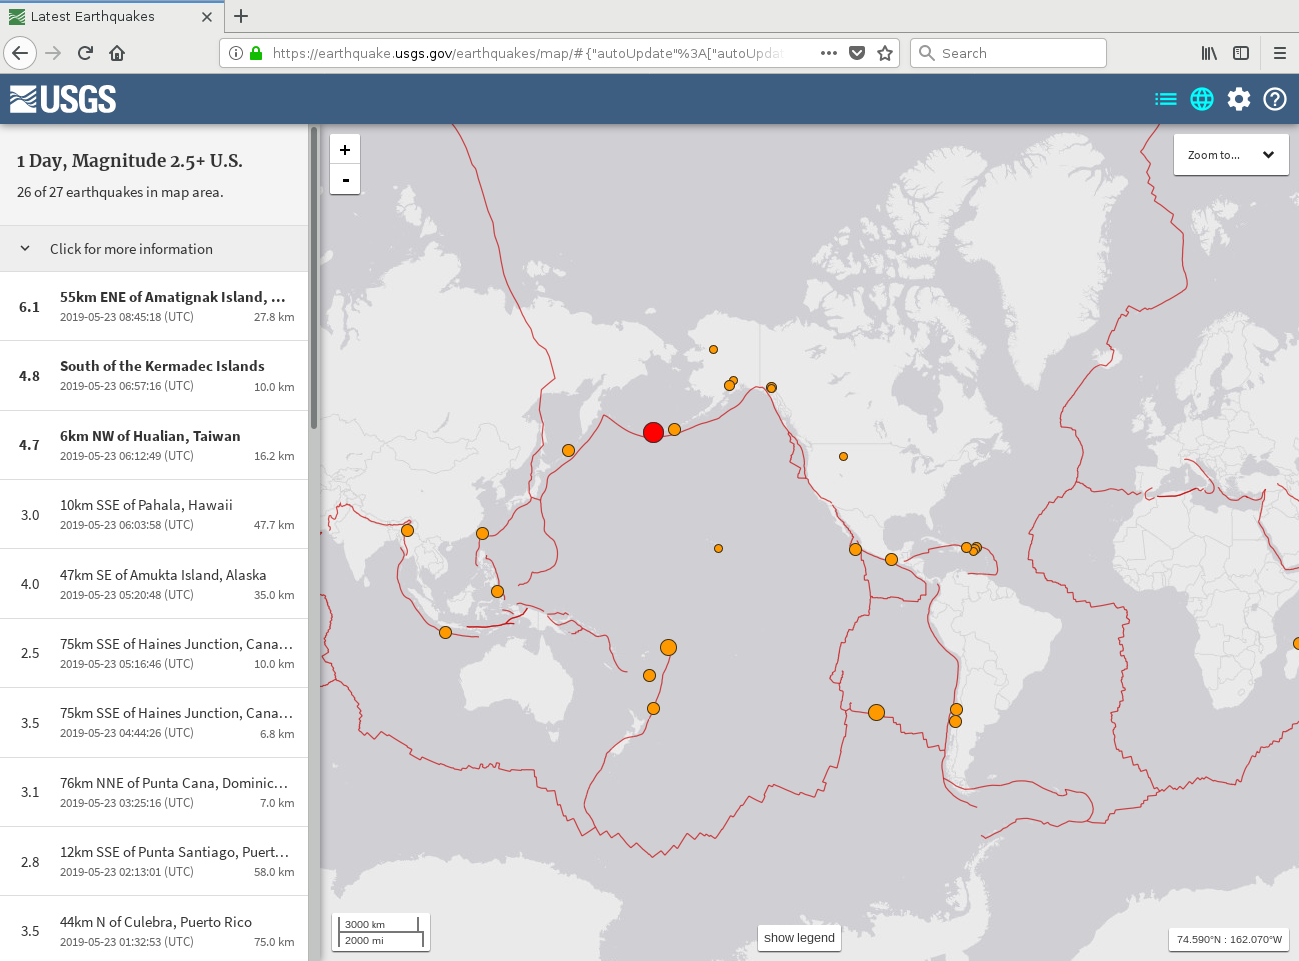
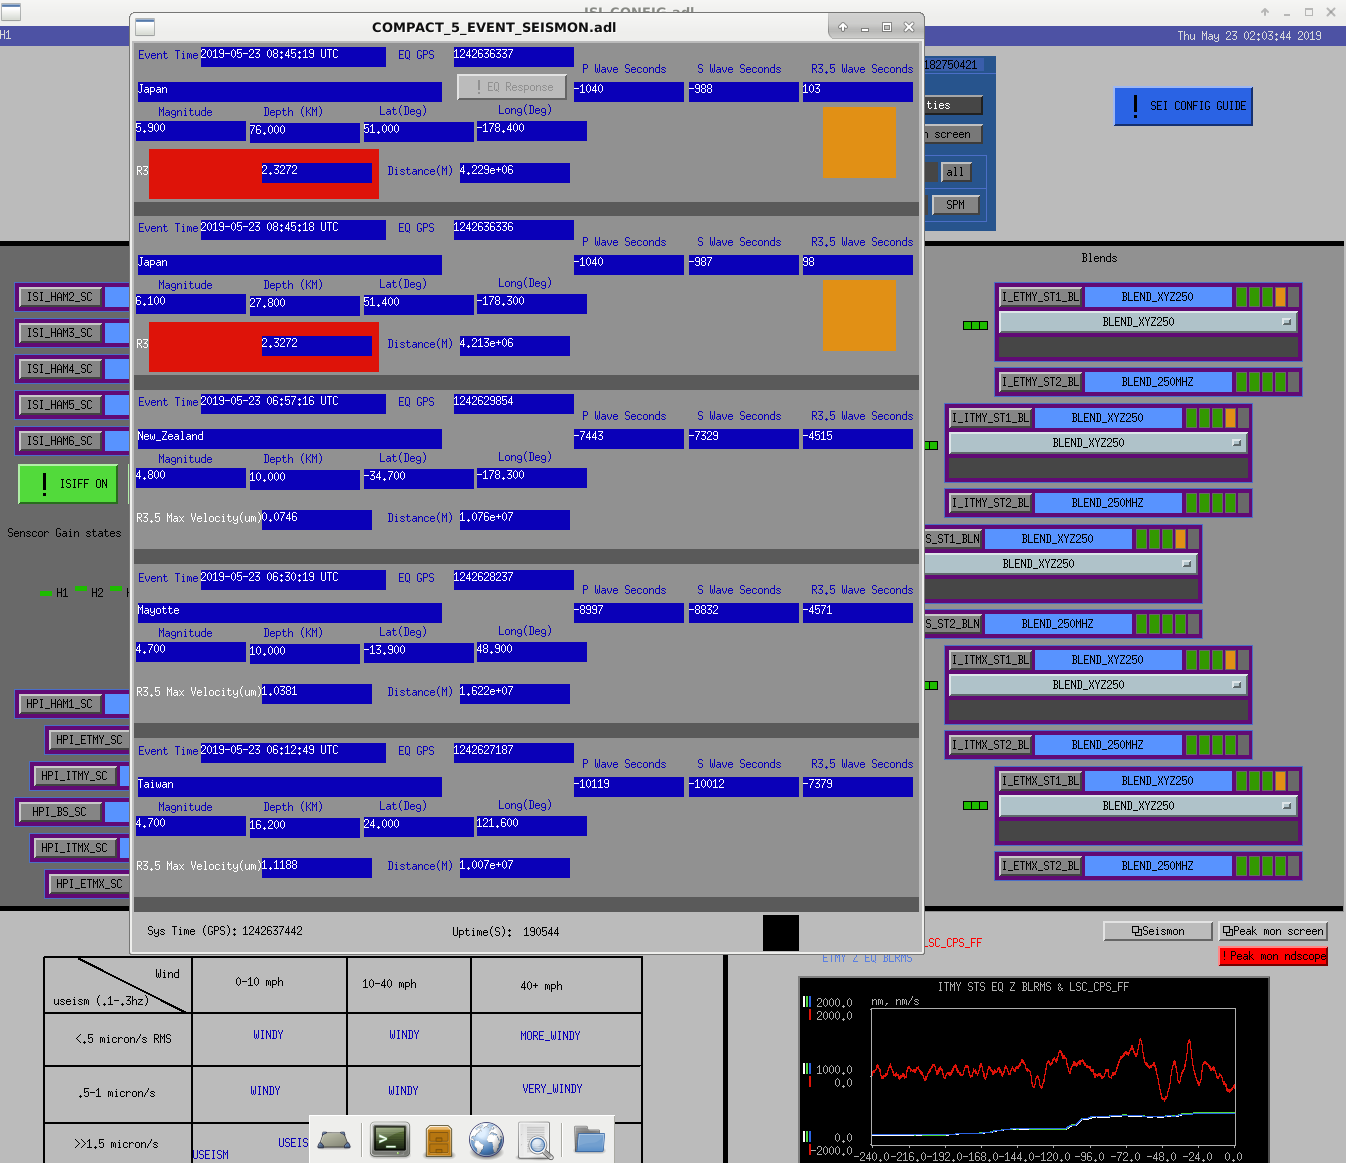
8:59 Moved ISI_CONFIG to EARTH_QUAKE in preparation for incoming 6.1 from the Aleutian area. BLRMS are already approaching .6um/s and still waiting on R3.5, according to SEISMON
9:03 Verbal Alarms announced Incoming Earthquake from Japan
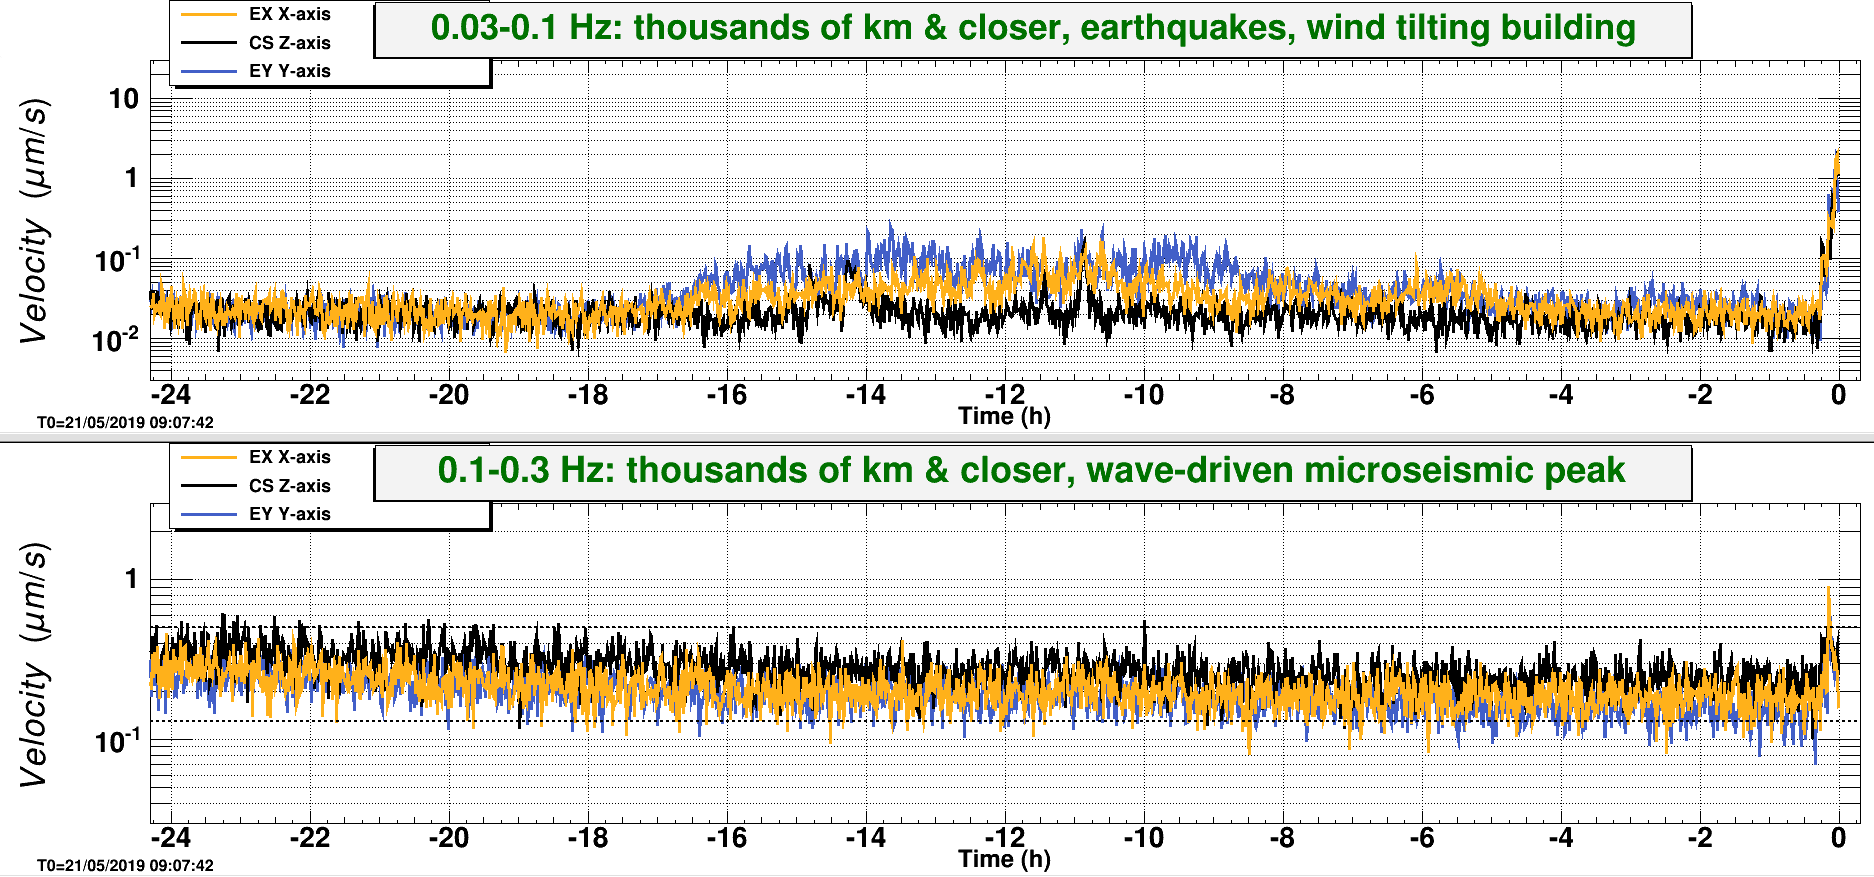
9:10 BLRMS showing ~2um/s & H1 standing tough! Will stay in current ISI configuration until the situation settles back down.
9:50UTC SEI_CONF returned to WINDY
TITLE: 05/23 Owl Shift: 07:00-15:00 UTC (00:00-08:00 PST), all times posted in UTC
STATE of H1: Lock Acquisition
OUTGOING OPERATOR: Travis
CURRENT ENVIRONMENT:
Wind: 10mph Gusts, 8mph 5min avg
Primary useism: 0.02 μm/s
Secondary useism: 0.24 μm/s
QUICK SUMMARY:
Travis re-locking H1 upon my arrival. I was informed about some code changes he and Georgia effected via telephone. I re-loaded the ISC_LOCK Guardian node as instructed as per the aforementioned changes.
07:09 H1 back to Observing - 111.26 Mpc
TITLE: 05/23 Eve Shift: 23:00-07:00 UTC (16:00-00:00 PST), all times posted in UTC
STATE of H1: Lock Acquisition
INCOMING OPERATOR: Ed
SHIFT SUMMARY: Lockloss late in the shift. Currently approaching NLN.
LOG:
23:02 Betsy and Peter out of optics lab
23:07 Kyle back from MY
5:32 Lockloss. The lockloss tool shows a small glitch on ETMx L3 as the probable cause. Environment was calm otherwise.
6:50 Georgia called the CR just as I was looking for her number. ISC_LOCK went into error due to an earlier code change. This issue should now be resolved.
M. Wade, A. Viets
I have finished creating DCS calibration filters files for the C01 h(t) frame production. The first epoch for C01 h(t) frames will use filters file
aligocalibration/trunk/Runs/O3/GDSFilters/H1DCS_C01_1239472998.npz
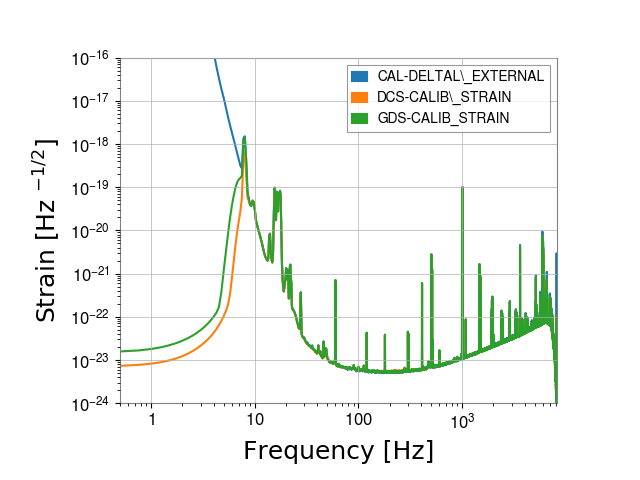
I have attached plots from sanity checks run using this filters file on data from GPS times 1239720596-1239723372. The first attached plot is an ASD comparison of data calibrated with this filters file (expected C01 data), the corresponding C00 data, and the corresponding CAL-CS data. The second plot is the ASD ratio of these three strain products. The third plot is the response function as derived from the expected C01 data and the CAL-CS data compared to the pyDARM model response, and the fourth plot is a zoom-in on the ratio of this response function comparison. All of these tests indicate that this filters file is ready for use on C01 data, giving the expected level of agreement in each comparison.
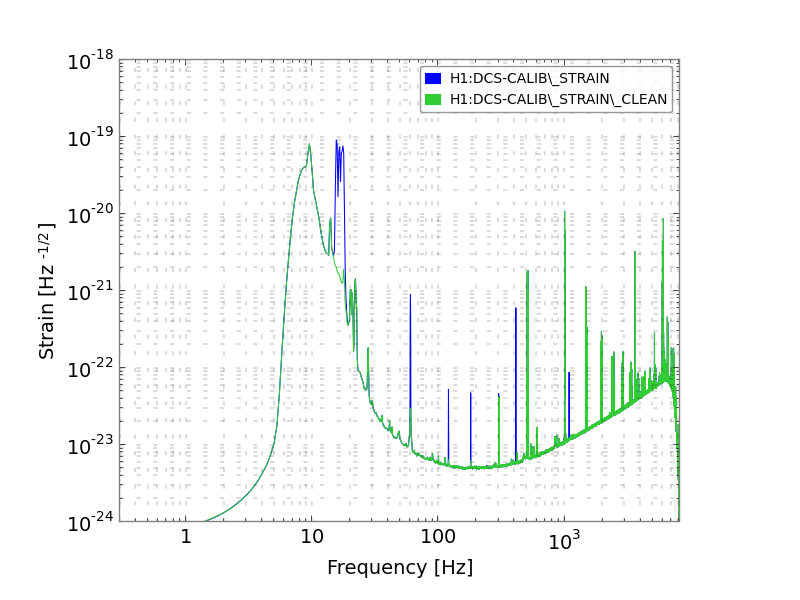
I've made a few more plots to test these filters. The first three show the filters' effect on real data, compared to the frequency-domain model. The actuation filters show some apparent deviation at low frequencies, but this is likely due the the large dynamic range spanned in that frequency range, as it does not show up in the response function plot. The fourth plot shows the response function produced by the filters, compared to the frequency-domain model (same type of plot as in the above aLOG, but uses a different transfer function algorithm in an effort to reduce noisiness). The fifth plot shows ratios of DeltaL / Pcal at the calibration line frequencies. The points labeled "DCS" include compensation for all time dependence except for that of the SRC. The points labeled "+SRC" additionally include compensation for time dependence of the SRC. A significant improvement is seen at the 17.1 Hz line. The sixth plot shows comparisons of h(t) to the cleaned data, to show that it is working.
I analyzed some longer stretches of data to assess the impact of SRC tine-dependence on calibration accuracy. Unfortunately, it has been difficult to analyze more than a day at a time, for two reasons:
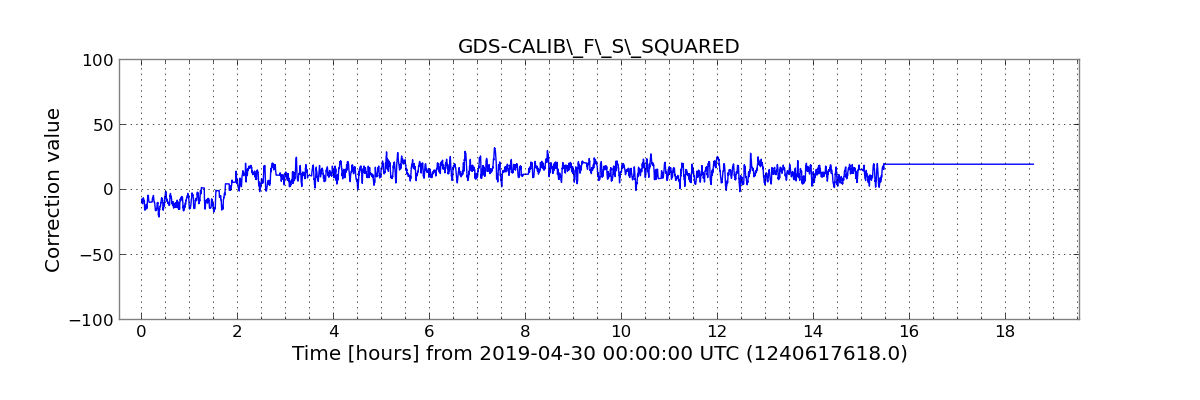
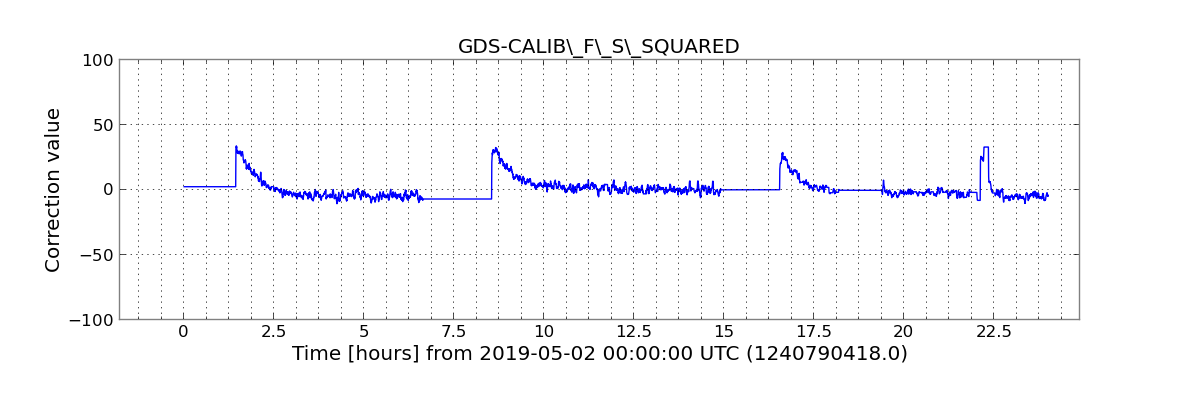
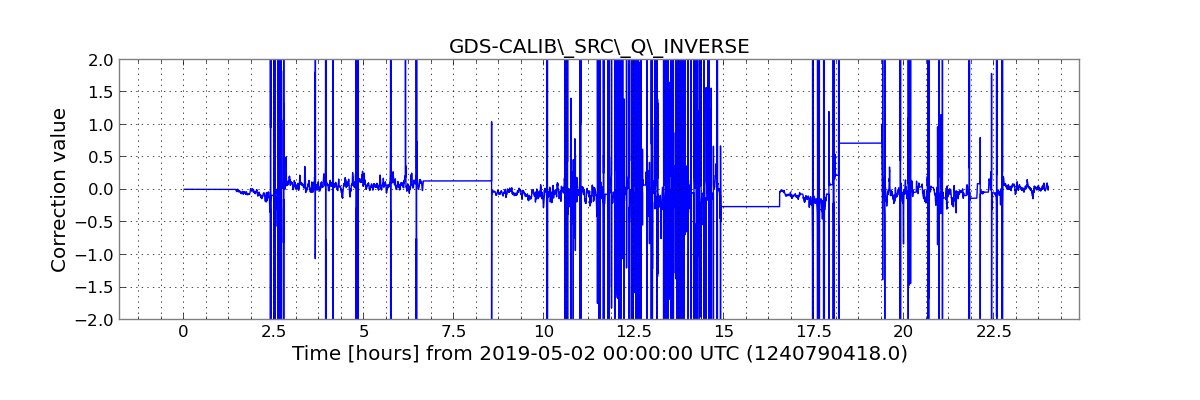
I chose 2 days to use, due to interesting features apparent on the summary pages. The first three plots are from April 30, where a well defined change occurs in the SRC's optical spring frequency, which appears to change from a pro-spring (fs2 < 0) to an anti-spring (fs2 > 0) early in the day. The next three plots are from May 2, where there are multiple lock losses and lock stretches. The spring frequency changes significantly in the first ~hour of each lock stretch.
The plots show time series of fs2 and 1/Q for roughly a day, as well and trends of DeltaL / Pcal at the Pcal line frequencies. For this data, compensating for all time dependence consistently leads to a significant improvement in calibration accuracy relative to Pcal at the Pcal line frequencies. Note that compensation for fs and Q time dependence is not the only distinction between the two data sets being compared. The C00 data at the time did not include compensation for kappa_PUM or kappa_UIM either. A check of the summary pages from those days, however, suggests that the impact of kappa_PUM and kappa_UIM may be less significant than the time dependence of the SRC.
The wildly fluctuating behavior of 1/Q is expected and not cause for concern. At times when fs is close to zero, the effect of Q on the calibration is small, and it is therefore difficult to measure and has very little impact in such cases.
M. Wade, A. Viets
I have finished creating DCS calibration filters files for the C01 h(t) frame production. The first epoch for C01 h(t) frames will use filters file
aligocalibration/trunk/Runs/O3/GDSFilters/H1DCS_C01_1237831461.npz
I have attached plots from sanity checks run using this filters file on data from GPS times 1239036564-1239039340. The first attached plot is an ASD comparison of data calibrated with this filters file (expected C01 data), the corresponding C00 data, and the corresponding CAL-CS data. The second plot is the ASD ratio of these three strain products. The third plot is the response function as derived from the expected C01 data and the CAL-CS data compared to the pyDARM model response, and the fourth plot is a zoom-in on the ratio of this response function comparison. All of these tests indicate that this filters file is ready for use on C01 data, giving the expected level of agreement in each comparison.
I've made a few more plots to test these filters. The first three show the filters' effect on real data, compared to the frequency-domain model. The actuation filters show some apparent deviation at low frequencies, but this is likely due the the large dynamic range spanned in that frequency range, as it does not show up in the response function plot. The fourth plot shows the response function produced by the filters, compared to the frequency-domain model (same type of plot as in the above aLOG, but uses a different transfer function algorithm in an effort to reduce noisiness). The fifth plot shows ratios of DeltaL / Pcal at the calibration line frequencies. The sixth plot shows comparisons of h(t) to the cleaned data, to show that it is working.
TITLE: 05/22 Eve Shift: 23:00-07:00 UTC (16:00-00:00 PST), all times posted in UTC
STATE of H1: Observing at 107Mpc
OUTGOING OPERATOR: Jim
CURRENT ENVIRONMENT:
Wind: 24mph Gusts, 19mph 5min avg
Primary useism: 0.05 μm/s
Secondary useism: 0.32 μm/s
QUICK SUMMARY: Lock is 2 hours old (actually 23 hours, but the state was set to NLN_CAL_MEAS earlier). No issues to report.
TITLE: 05/22 Day Shift: 15:00-23:00 UTC (08:00-16:00 PST), all times posted in UTC
STATE of H1: Observing at 104Mpc
INCOMING OPERATOR: Travis
SHIFT SUMMARY:
LOG:
20:30 Out of OBSERVE for calibration
22:30 Betsy and Peter to optics lab to move table out
Peter and I rolled a large flow bench out of the OSB optics lab (which is adjascent to the LVEA) and into the clean high-bay next door (also adjascent to the LVEA). We were moving it from 3:35-3:46pm local time.
With help from Stuart Aston at LLO and RahulK, BetsyW, JeffK, and EdM at LHO, this entry documents our current best understanding of the suspended masses of the ETMs.
Note that the Photon Calibrators generate calibrated forces on the ETMs via radiation pressure. The overall uncertainty of the actuation forces is below 1%, closer to 0.5% for the observing run.
To accurately translate these calibration forces into calibrated displacements, we require accurate masses of the suspended ETMs. A 0.1% error in the suspended mass directly couples into a 1% error in the calibrated displacements.
Here is what we know:
LHOx - 39611 grams
LHOy - 39538 grams
LLOx - 39508 grams
LLOy- 39642 grams
44 grams (2 x 22 grams)
The total mass of AMD1, 2, 3 and 4 is 0.80gm, 0.54gm and 0.39gm and 0.32gm respectively.
Total: 2.05 g
Rahul looking into this issue.
So our current best guesses for the masses are (neglecting the fibers for now):
LHO EX: 39611 + 44 + 2.05 = 39657 g
LHO EY: 39538 + 44 +2.05 = 39584 g
LLO EX: 39508 + 44 +2.05 = 39554 g
LLO EY: 39642 + 44 + 1.78 = 39688 g (Missing one AMD)
h1etmx.m
pend.m3 = 39.603+ear_mass_total; % 39.647 = 39.603 + ear_mass_total; Updated on 7 Aug 2015 by K.Izumi, ETM 08 on https://galaxy.ligo.caltech.edu/optics/. +0.044 from Betsy to include ear weight.
h1etmy.m
pend.m3 = 39.597 + ear_mass_total; % 39.641 = 39.597 + ear_mass_total; Updated on 12 feb 2014 by Brett Shapiro, ETM 12 (H1ETMY) on https://galaxy.ligo.caltech.edu/optics/.
l1etmx.m
pend.m3 = 39.508 + ear_mass_total; % 39.552 = 39.508 + ear_mass_total; Updated on 15 Feb 2019 by Stuart Aston, old ETM 07 new ETM 10 (L1ETMX) on https://galaxy.ligo.caltech.edu/optics/.
L1etmy
pend.m3 = 39.642 + ear_mass_total; % 39.686 = 39.642 + ear_mass_total; Updated on 15 Feb 2019 by Stuart Aston, old ETM 09 new ETM 15 (L1ETMY) on https://galaxy.ligo.caltech.edu/optics/.
Thus the masses in the suspension models as of May 22, 2019 seem to be (models may not be including the 2 g from the AMDs):
LHO EX: 39603 + 44 + 2.05 = 39649 g
LHO EY: 39597 + 44 +2.05 = 39643 g
LLO EX: 39508 + 44 +2.05 = 39554 g (was 39552 +46 = 39598 until 2/15/2019)
LLO EY: 39642+ 44 +1.78 = 39688 g (was 39686+46 = 39732 until 2/15/2019)
Summary
H1ETMX
Current model value 39649 g, should be 39657 g, error: model 8 g lighter than actual (0.02%)
H1ETMY
Current model value 39643 g, should be 39584 g, error: model 60 g heavier than actual (0.15%)
L1ETMX
Current model value 39554 g (correct value)
L1ETMY
Current model value 39688 g, was 39732 g until Feb 15, 2019, error: model 44 g lighter than actual (0.11%)
Theoretically, I estimated that each fused silica fibres should have a mass of about 0.494 grams, however if we consider around half of the fibre bending (when pendulum swings) then it should be around 0.247grams. Making a total of 0.988 grams for all four fibres.
If we want more precision, then it is better to take into account the actual bending length (which should around 20 mm from the top of the fibre). This should be around 0.172 grams (0.688 grams for all 4 fibres).
Seems there is a typo in what I wrote earlier.
"A 0.1% error in the suspended mass directly couples into a 1% error in the calibrated displacements." should have been "A 0.1% error in the suspended mass directly couples into a 0.1% error in the calibrated displacements."
with Madeline Wade.
The DMT computers have been patched and rebooted. The GDS calibration has been restarted with the time varying calibration factors turned on. This complete WP 8214.
All (non-SRC) time-dependent correction factors were turned in the GDS calibration pipeline at approximately GPS time 1242497475. The new configuration file for this update is
aligocalibration/trunk/Runs/O3/GDSFilters/H1GDS_1242497475.ini
We have been running with the new calibration lines for several weeks and the stability of the time-dependent correction factors during this time warranted this configuraiton change.