ETM-X violin mode13 had been ringing up all evening and was up approaching 4.7 this morning. Took advantage of LLO being down to suppress this mode.
16:20 (09:20) Dropped out of Observing to Commissioning
Set VIOLIN_DAMPING to DAMPING_ON_SIMPLE
Applied +30 gain to H1SUS-ETMX_L2_DAMP_MODE13
Confirmed the mode had turned down
Set VIOLIN_DAMPING back to DAMPING_ON_DC
16:25 (09:25) Back into Observing
TITLE: 04/19 Owl Shift: 07:00-15:00 UTC (00:00-08:00 PST), all times posted in UTC
STATE of H1: Observing at 109Mpc
INCOMING OPERATOR: Jeff
SHIFT SUMMARY: 21 hour lock. The only issue I had was when the squeezer lost lock, The SQZ_LO_LR node was stuck in LOCKING_OMC state because the beam diverter was closed. It looks like the manager is supposed to open it, but it wasn't doing anything. I manually opened it and then it advanced on.
LOG:
Still locked and observing, no issues to report.
TITLE: 04/18 Eve Shift: 23:00-07:00 UTC (16:00-00:00 PST), all times posted in UTC STATE of H1: Observing at 76Mpc INCOMING OPERATOR: TJ SHIFT SUMMARY: Remained in observing since end of PEM work except for: 1. Squeezer guardian. It relocked on its own. 2. Had to change the violin mode damping state to turn back on the gain for ETMY mode 2. I got an email from Dave that the cell phone alarms are not working. This probably means that if you get an alarm, do not assume anyone else is aware of it. LOG: 00:07 UTC Closed terminal behind DARM spectrum, control room screenshot was blank 00:43 UTC LLO called to inform that they are back in observing 01:21 UTC PEM work done, set to observing 04:05 UTC Email notification from Dave that cell phone alarm messages are not getting out 05:10 UTC Out of observing to damp ETMY mode 2 05:12 UTC Back to observing 05:40 UTC Knocked out of observing by squeezer 05:42 UTC Squeezer reacquired on its own. Put back to observing.
Cell phone alarms are working.
I just restarted the cell phone alarms system to verify it is able to send cell phone texts. It was most probably working overnight and last night a single keep-alive message to my cell phone somehow got lost. Also I have been getting my hourly keep-alive emails throughout.
TITLE: 04/19 Owl Shift: 07:00-15:00 UTC (00:00-08:00 PST), all times posted in UTC
STATE of H1: Observing at 109Mpc
OUTGOING OPERATOR: Patrick
CURRENT ENVIRONMENT:
Wind: 4mph Gusts, 3mph 5min avg
Primary useism: 0.02 μm/s
Secondary useism: 0.28 μm/s
QUICK SUMMARY: 13hr lock, useism is trending down.
PEM work has been suspended and we are locked and in observing.
Philippe Nguyen, Sharan Banagiri, Robert Schofield
We made acoustic, magnetic, shaker and impulse injections in the LVEA today, mainly while LLO was down for inclement weather. Im not sure how it couples, but we traced the 115 Hz magnetic coupling resonance to HAM3. We saw some shaker coupling at the manifold reduction flange near the ITMY optical levers, and when we shook the BSC2 walls. We did not see shaker coupling at either of the gate valves that we tested. Impulse injections showed strongest coupling at HAM5/6, supporting shaker measurements.
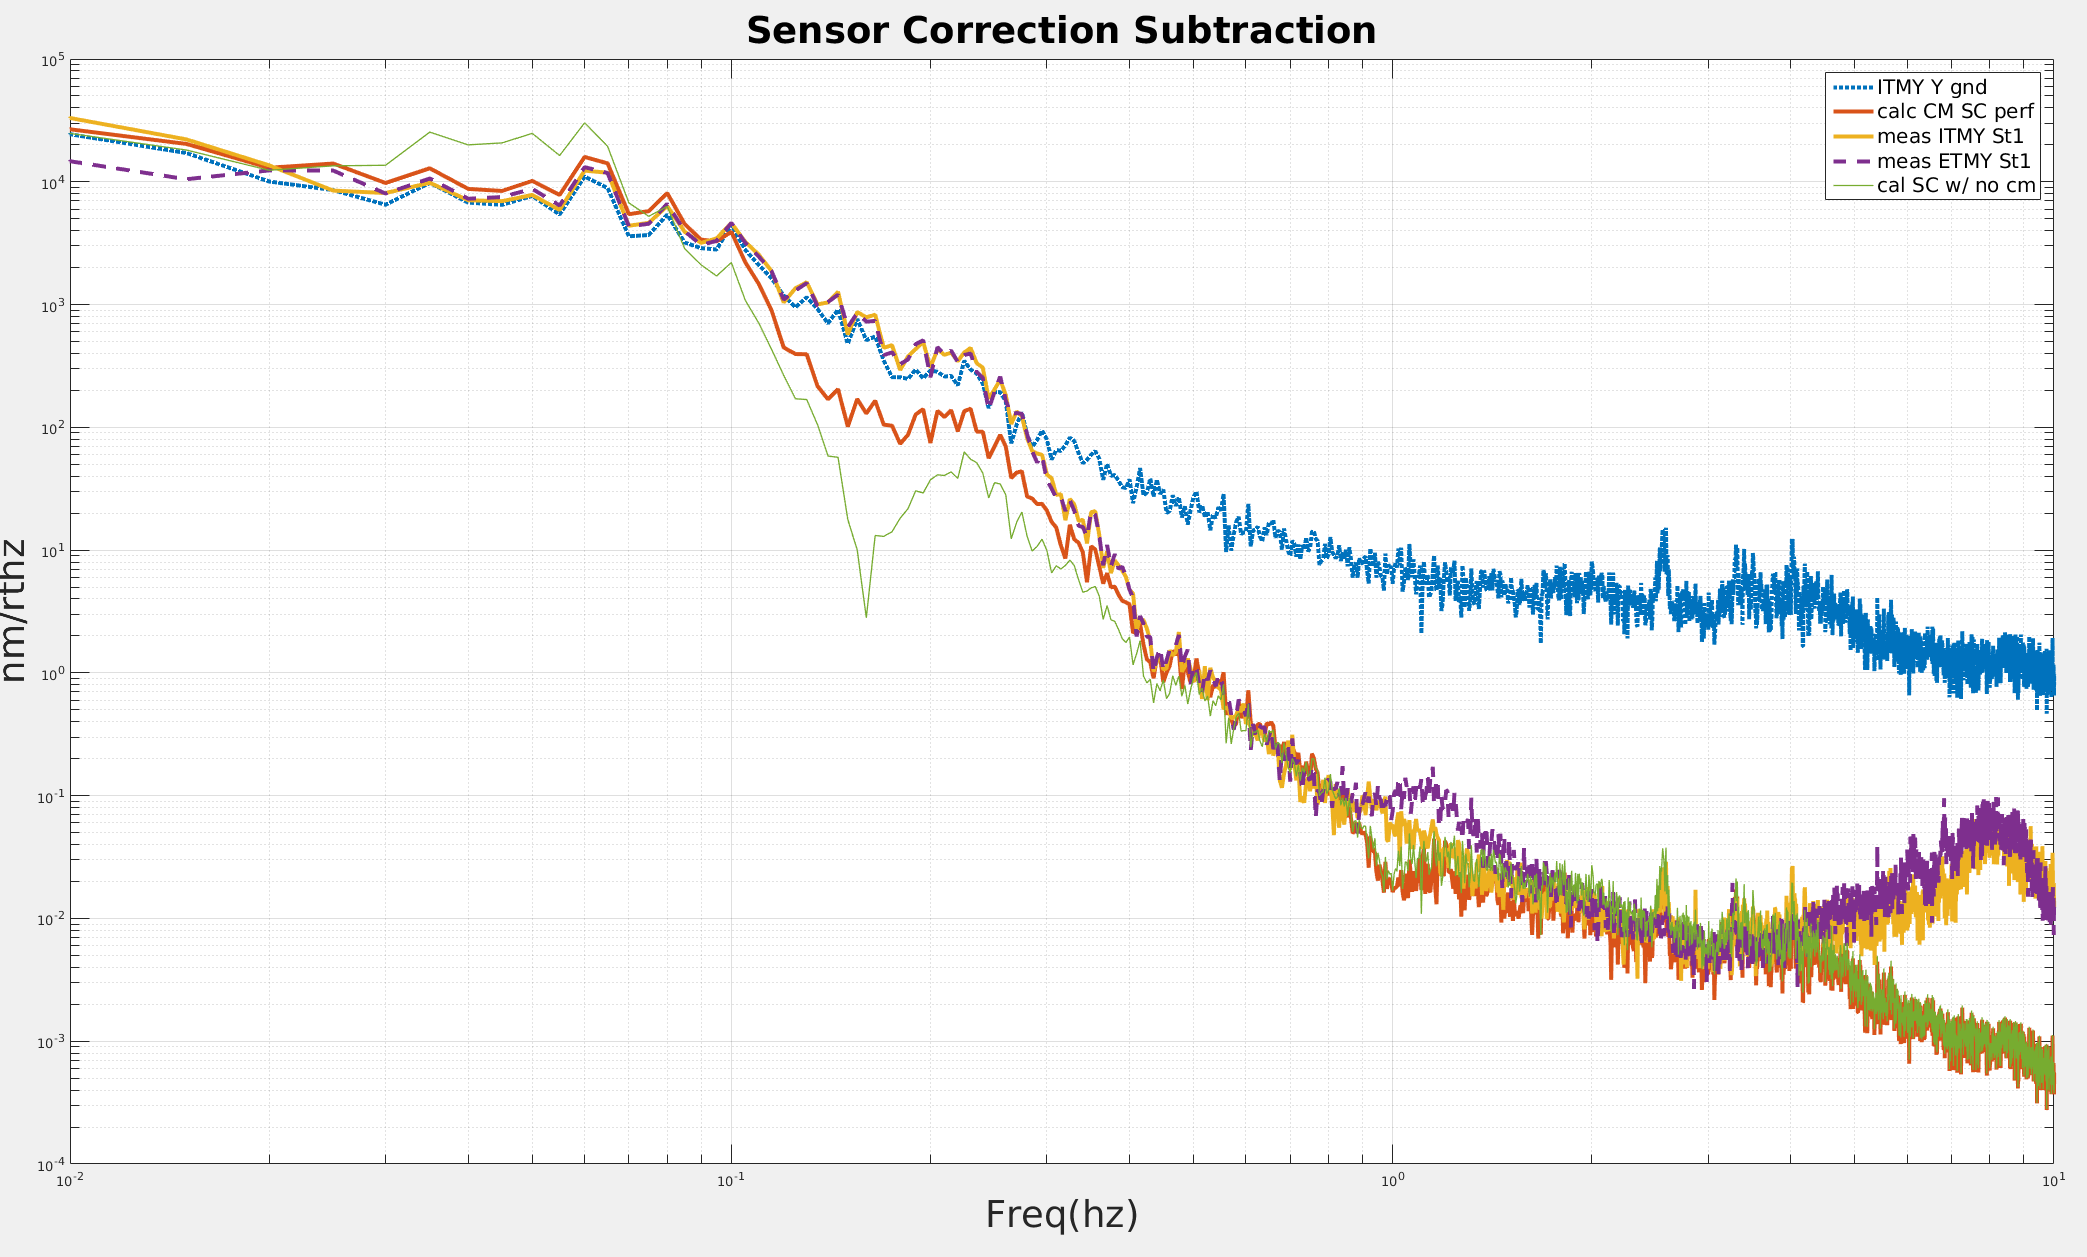
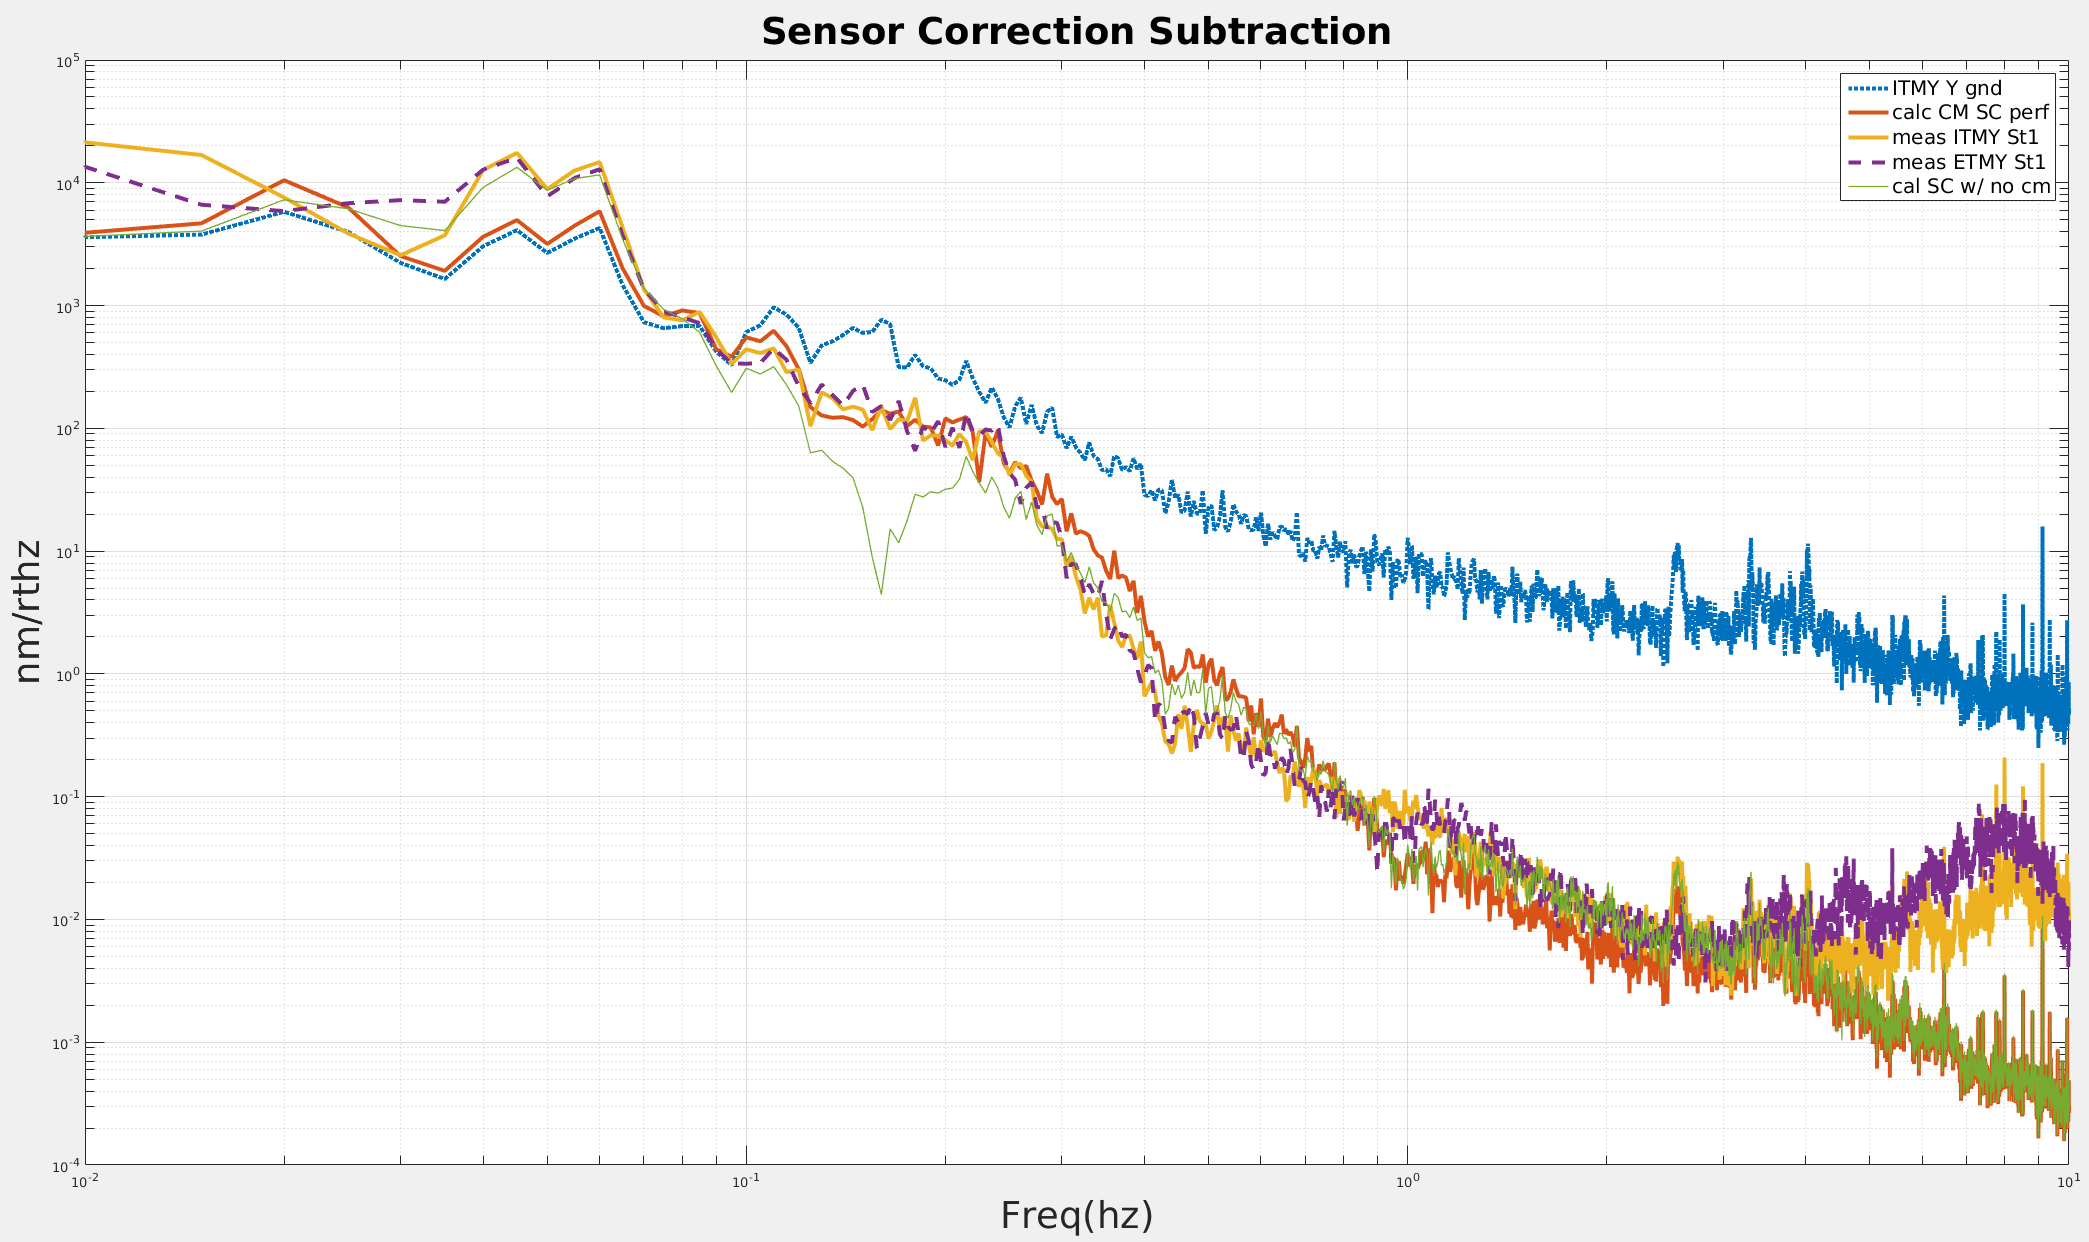
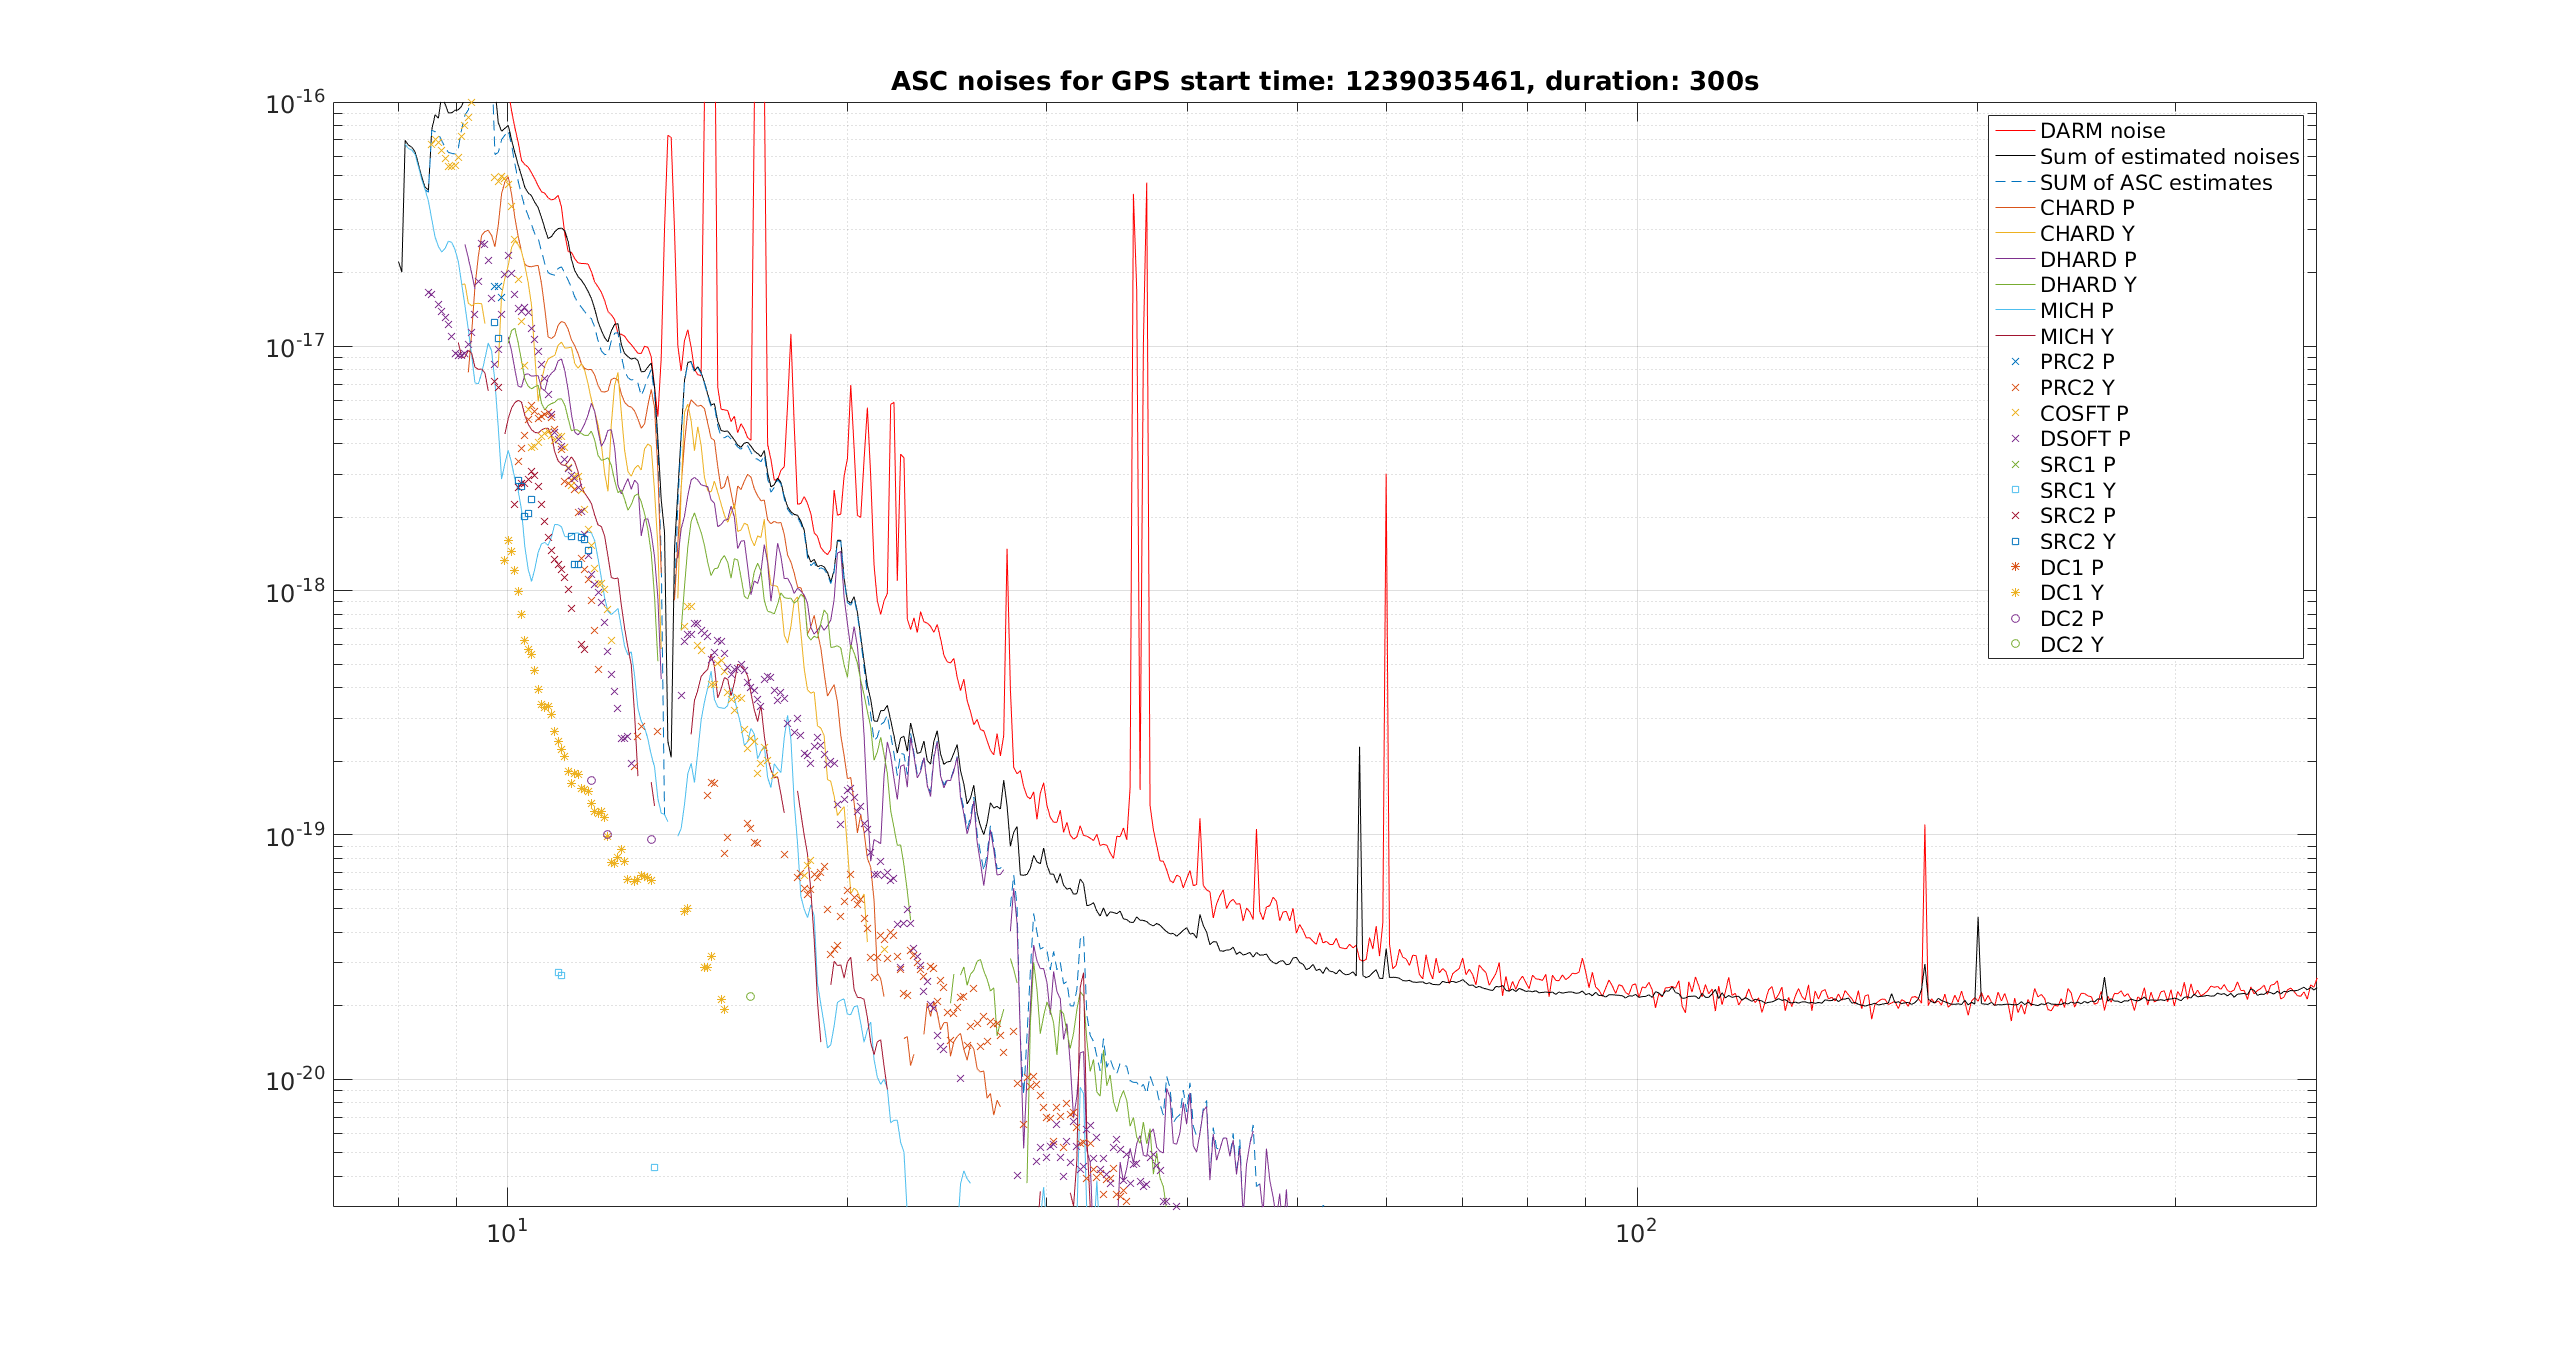
We have noticed during the transition to the earthquake state for the seismic systems that a lot of IFO signals get worse at microseismic frequencies. I've done a little modelling of this and I think that this can be improved by changing the filter used for the common mode subtration. The earthquake mode uses the average of the seismometers for all the VEAs to as a common ground signal, this average is then low passed and subtracted from the local ground sensor to get a local differential sensor correction signal.
I've been modeling the effects of different low passes by reconstructing the local differential sensor correction signals and seeing how that differential control signal subtracts the local ground. I forgot to attach the plot where I compare my calculated performance with the original filter, but it does a very good job up to about 1 hz. The original low pass filter was just a .3hz pole, so it's pretty simple, but using this model, I've come up with an elliptical filter that I think is a little better. The first attached plot compares the calculated performance of my new filter to the actual performance of the original .3hz pole during an earthquake on March 28. During this earthquake, SEI_CONF was in EARTHQUAKE. The dotted blue line is the ITMY Y ground, the gold and dashed darker blue (purple?) lines are St1 motions seen by the ITMY and ETMY St1 T240s, the red line is the calculated performance given by my new eq mode low pass. You can see that both ITMY and ETMY are getting no isolation relative to the local ground motion up to about .3 hz. The new low pass gives some isolation starting at .1hz, so this should be better, and the motion isn't really worse below .1hz (the region we are winning by using the common ground subtraction). The thin green (?) line is the performance given by using the normal sensor correction path and filter. The suppression of the microseism is good, but the amplification of the low frequency ( < .1hz ) motion is pretty bad.
The second plot is a repeat of the first, but for an earthquake on March 30th, where SEI_CONF was left in the nominal, WINDY configuration. Comparing the red line to the dashed dark blue and gold lines shows that the new eq mode low pass should give similar microseismic performance to the nominal seismic configuration. Note also that the .030 - .070 hz motion should be better than the motion seen with the nominal configuration. The largely good agreement between the thin green line and gold and dashed blue line shows this is a relatively good model to predict st1 motion. The gap from .1-.3 hz is because I'm not including St1 RX tilt.
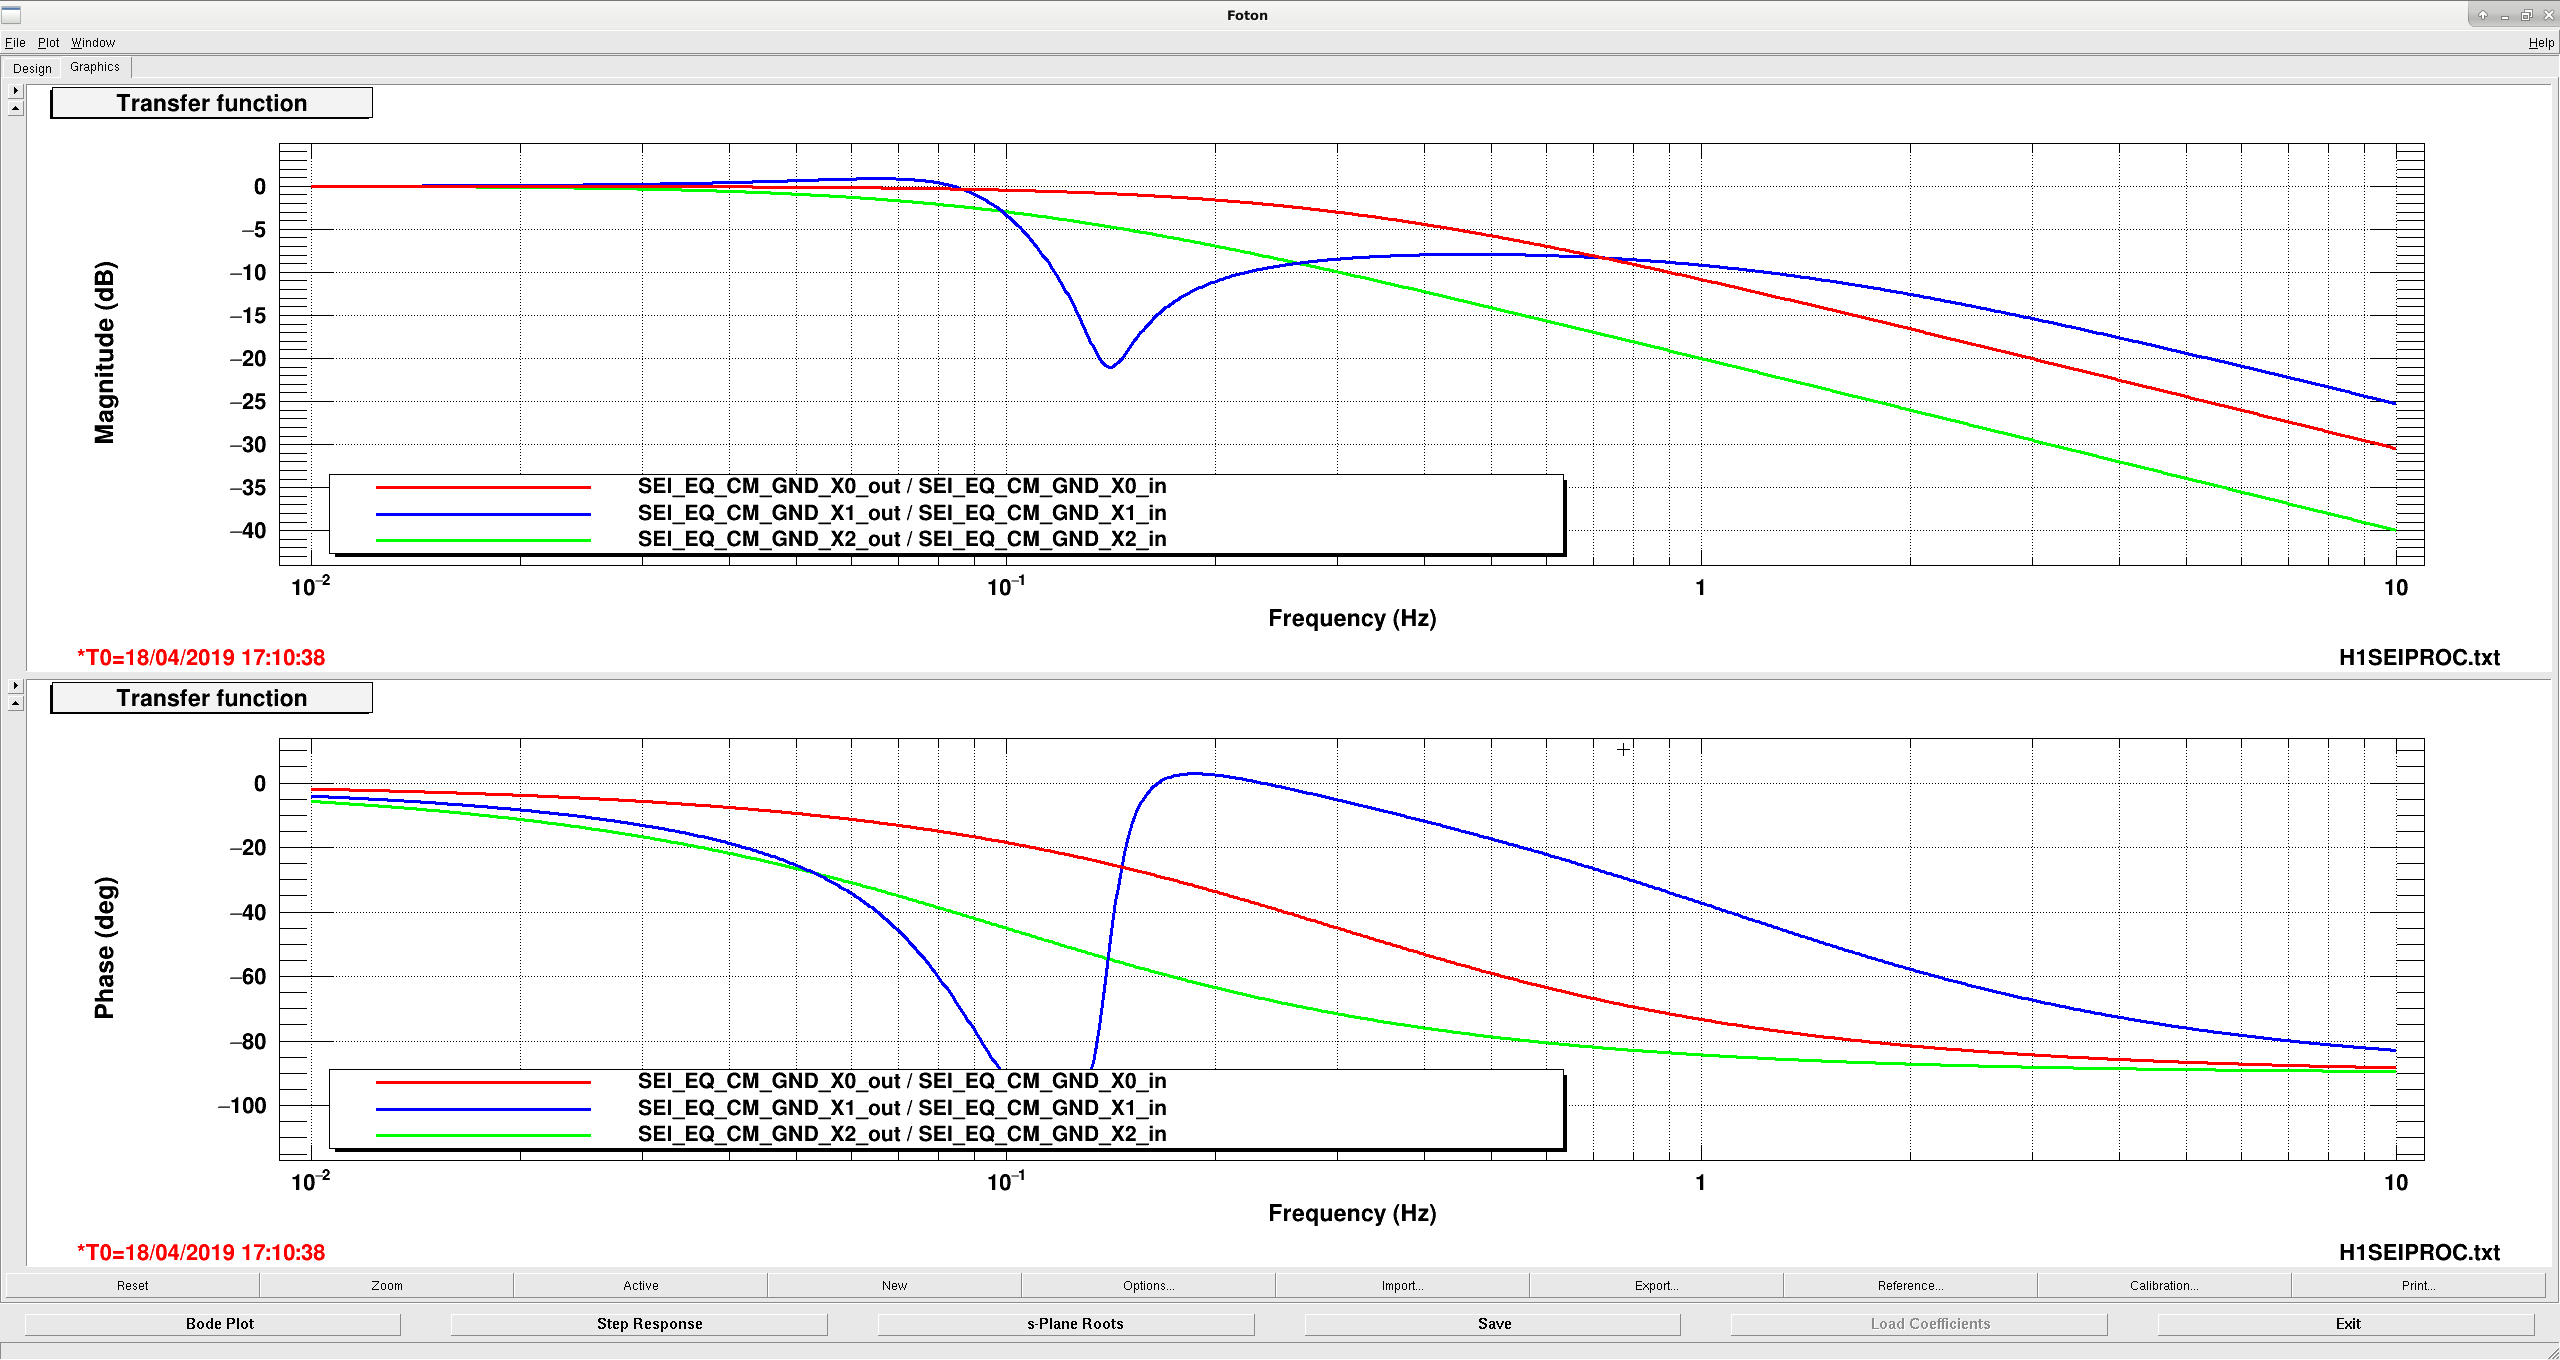
The third plot shows bode plot of some of the low passes I've looked at. The red line is the original .3hz plot low pass. The blue line is the new ellptical filter that I think we should try. The green line is just as .1hz pole, one of the first improvements I looked at, but I think the ellipse is better. I've installed the ellipse and turned it on, we'll see if it works any better for the next couple earthquakes.
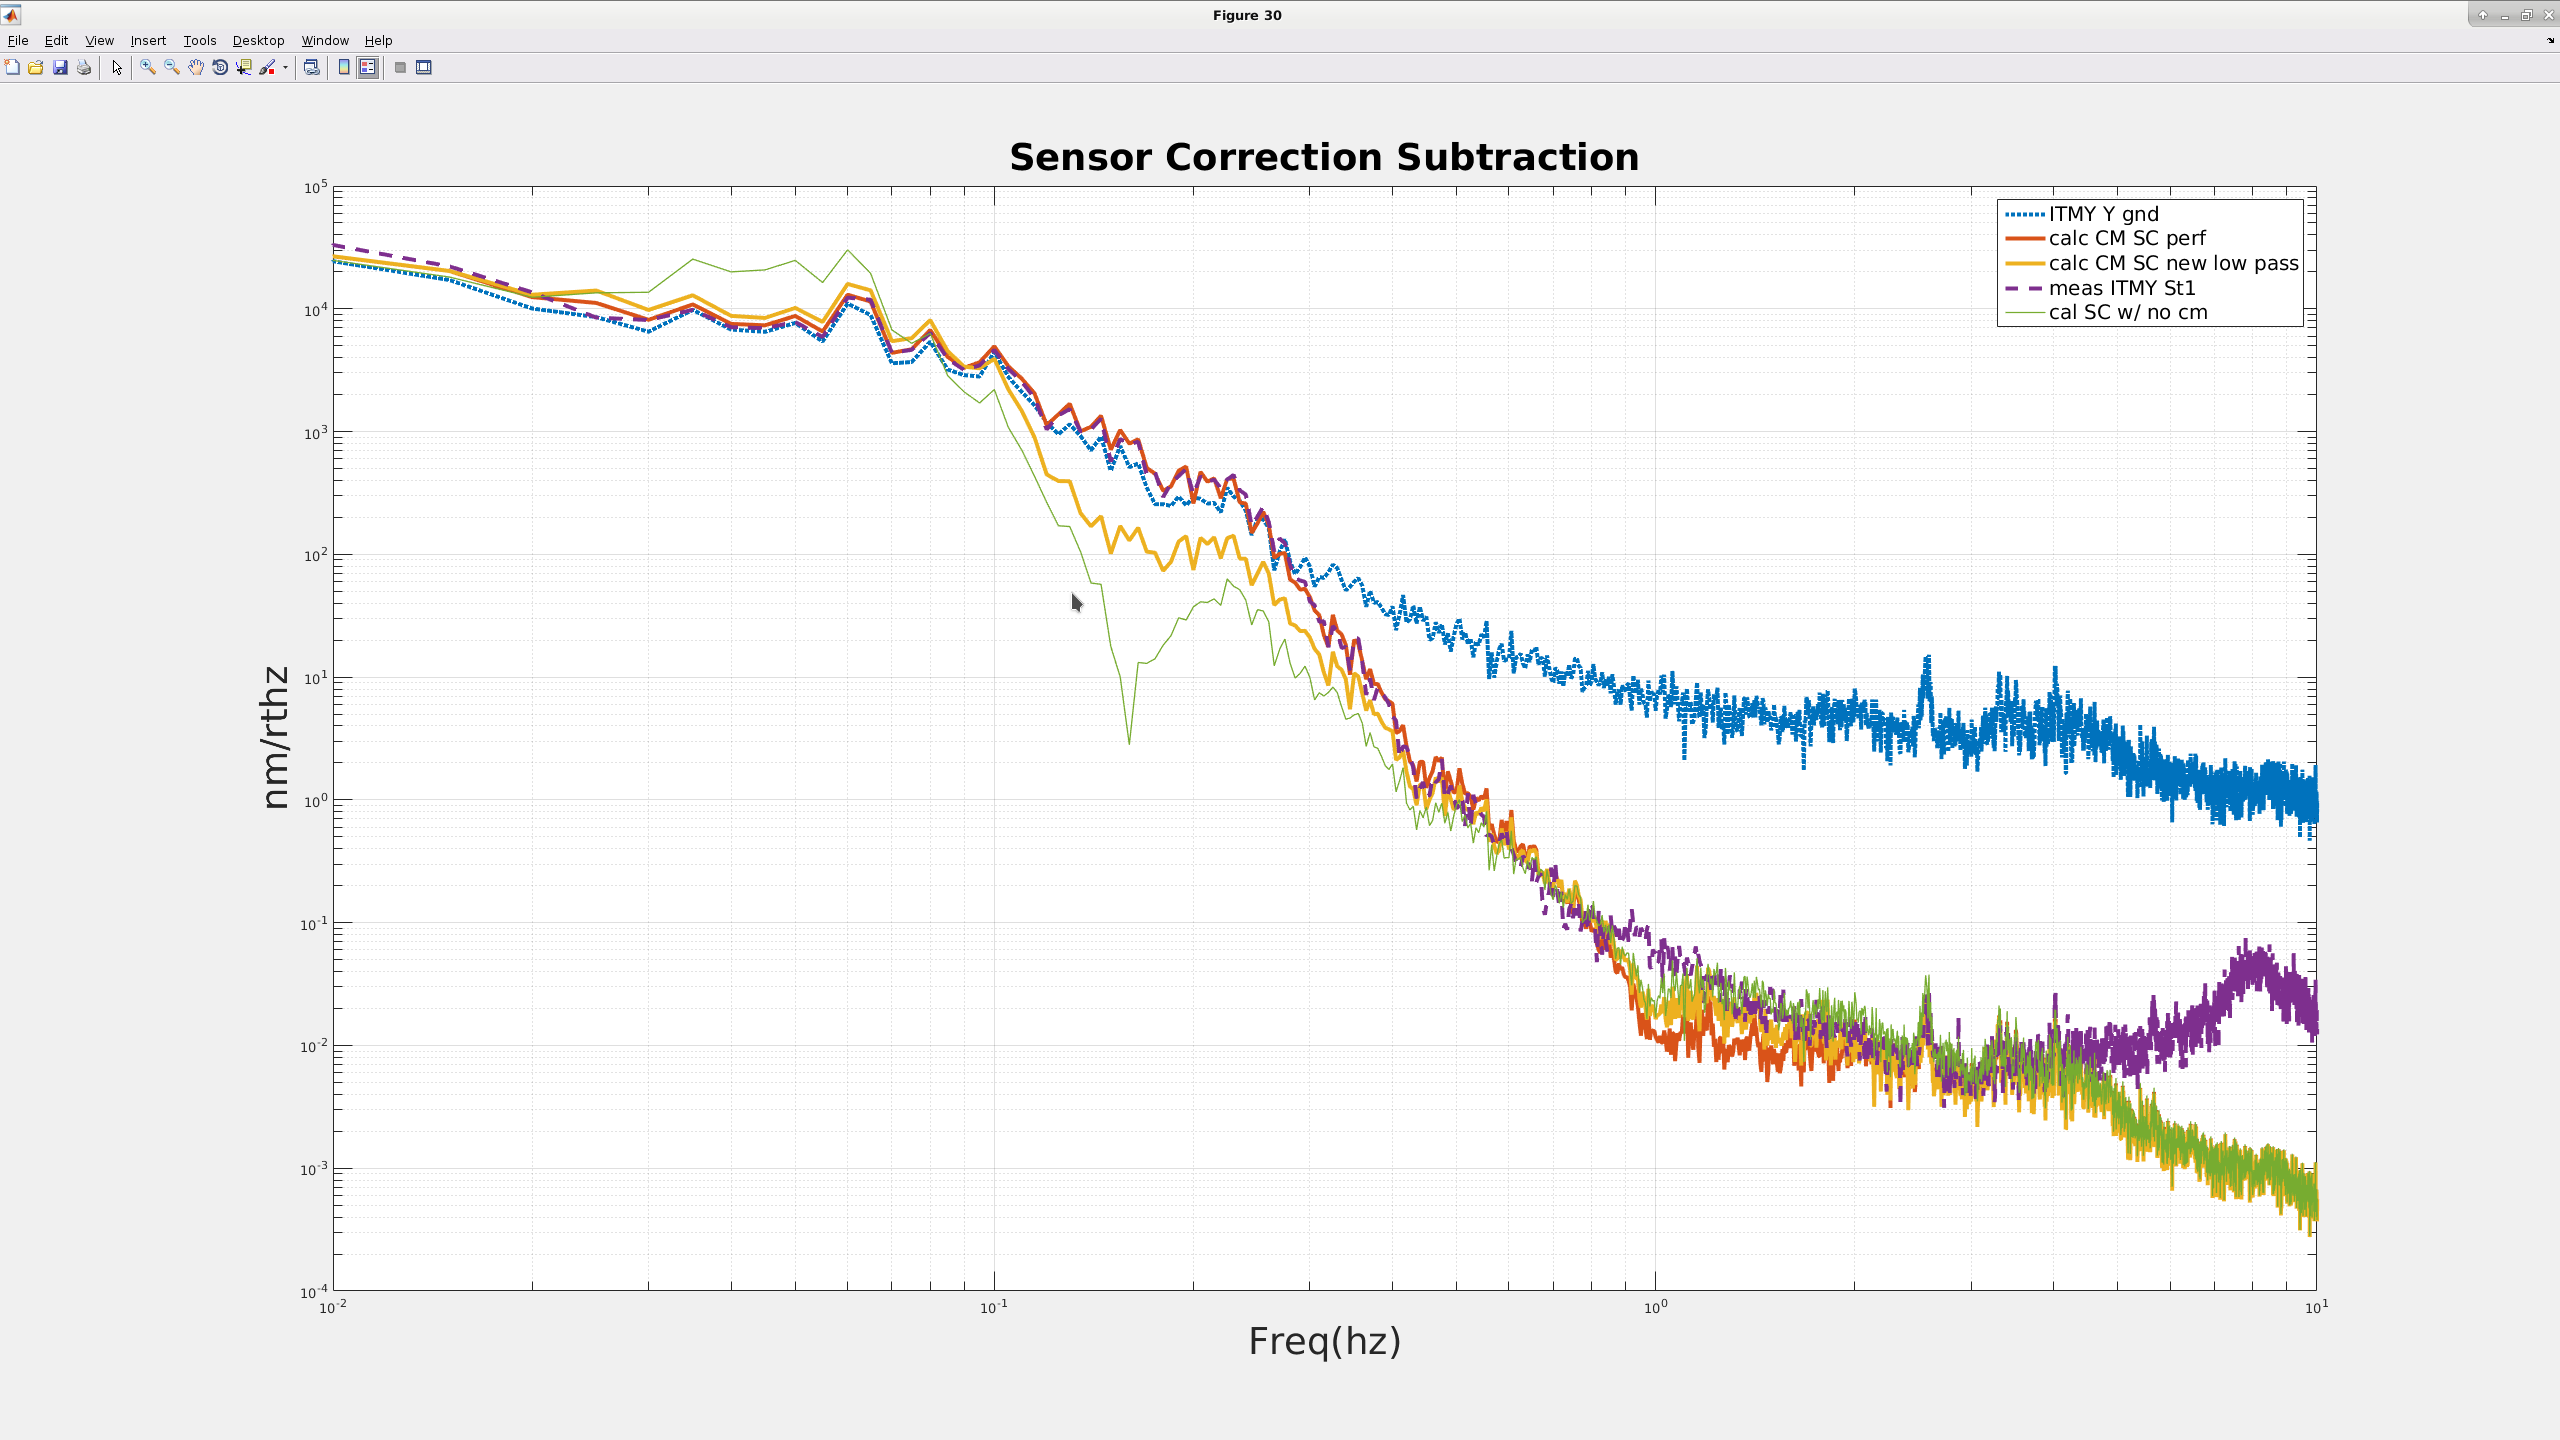
I'm attaching a plot comparing the expected performance of the new low pass versus the expected and measured performance of the old low pass during the March 28th earthquake that we rode out. For this earthquake SEI_CONF was in the EARTHQUAKE state. The dotted blue line is the ground, the red is the calculated subtraction of the old low pass, the dashed darker blue (purple?) line is the measure St1 T240, the gold is the calculated new low pass and the thin line is the calculated subtraction of the nominal configuration.
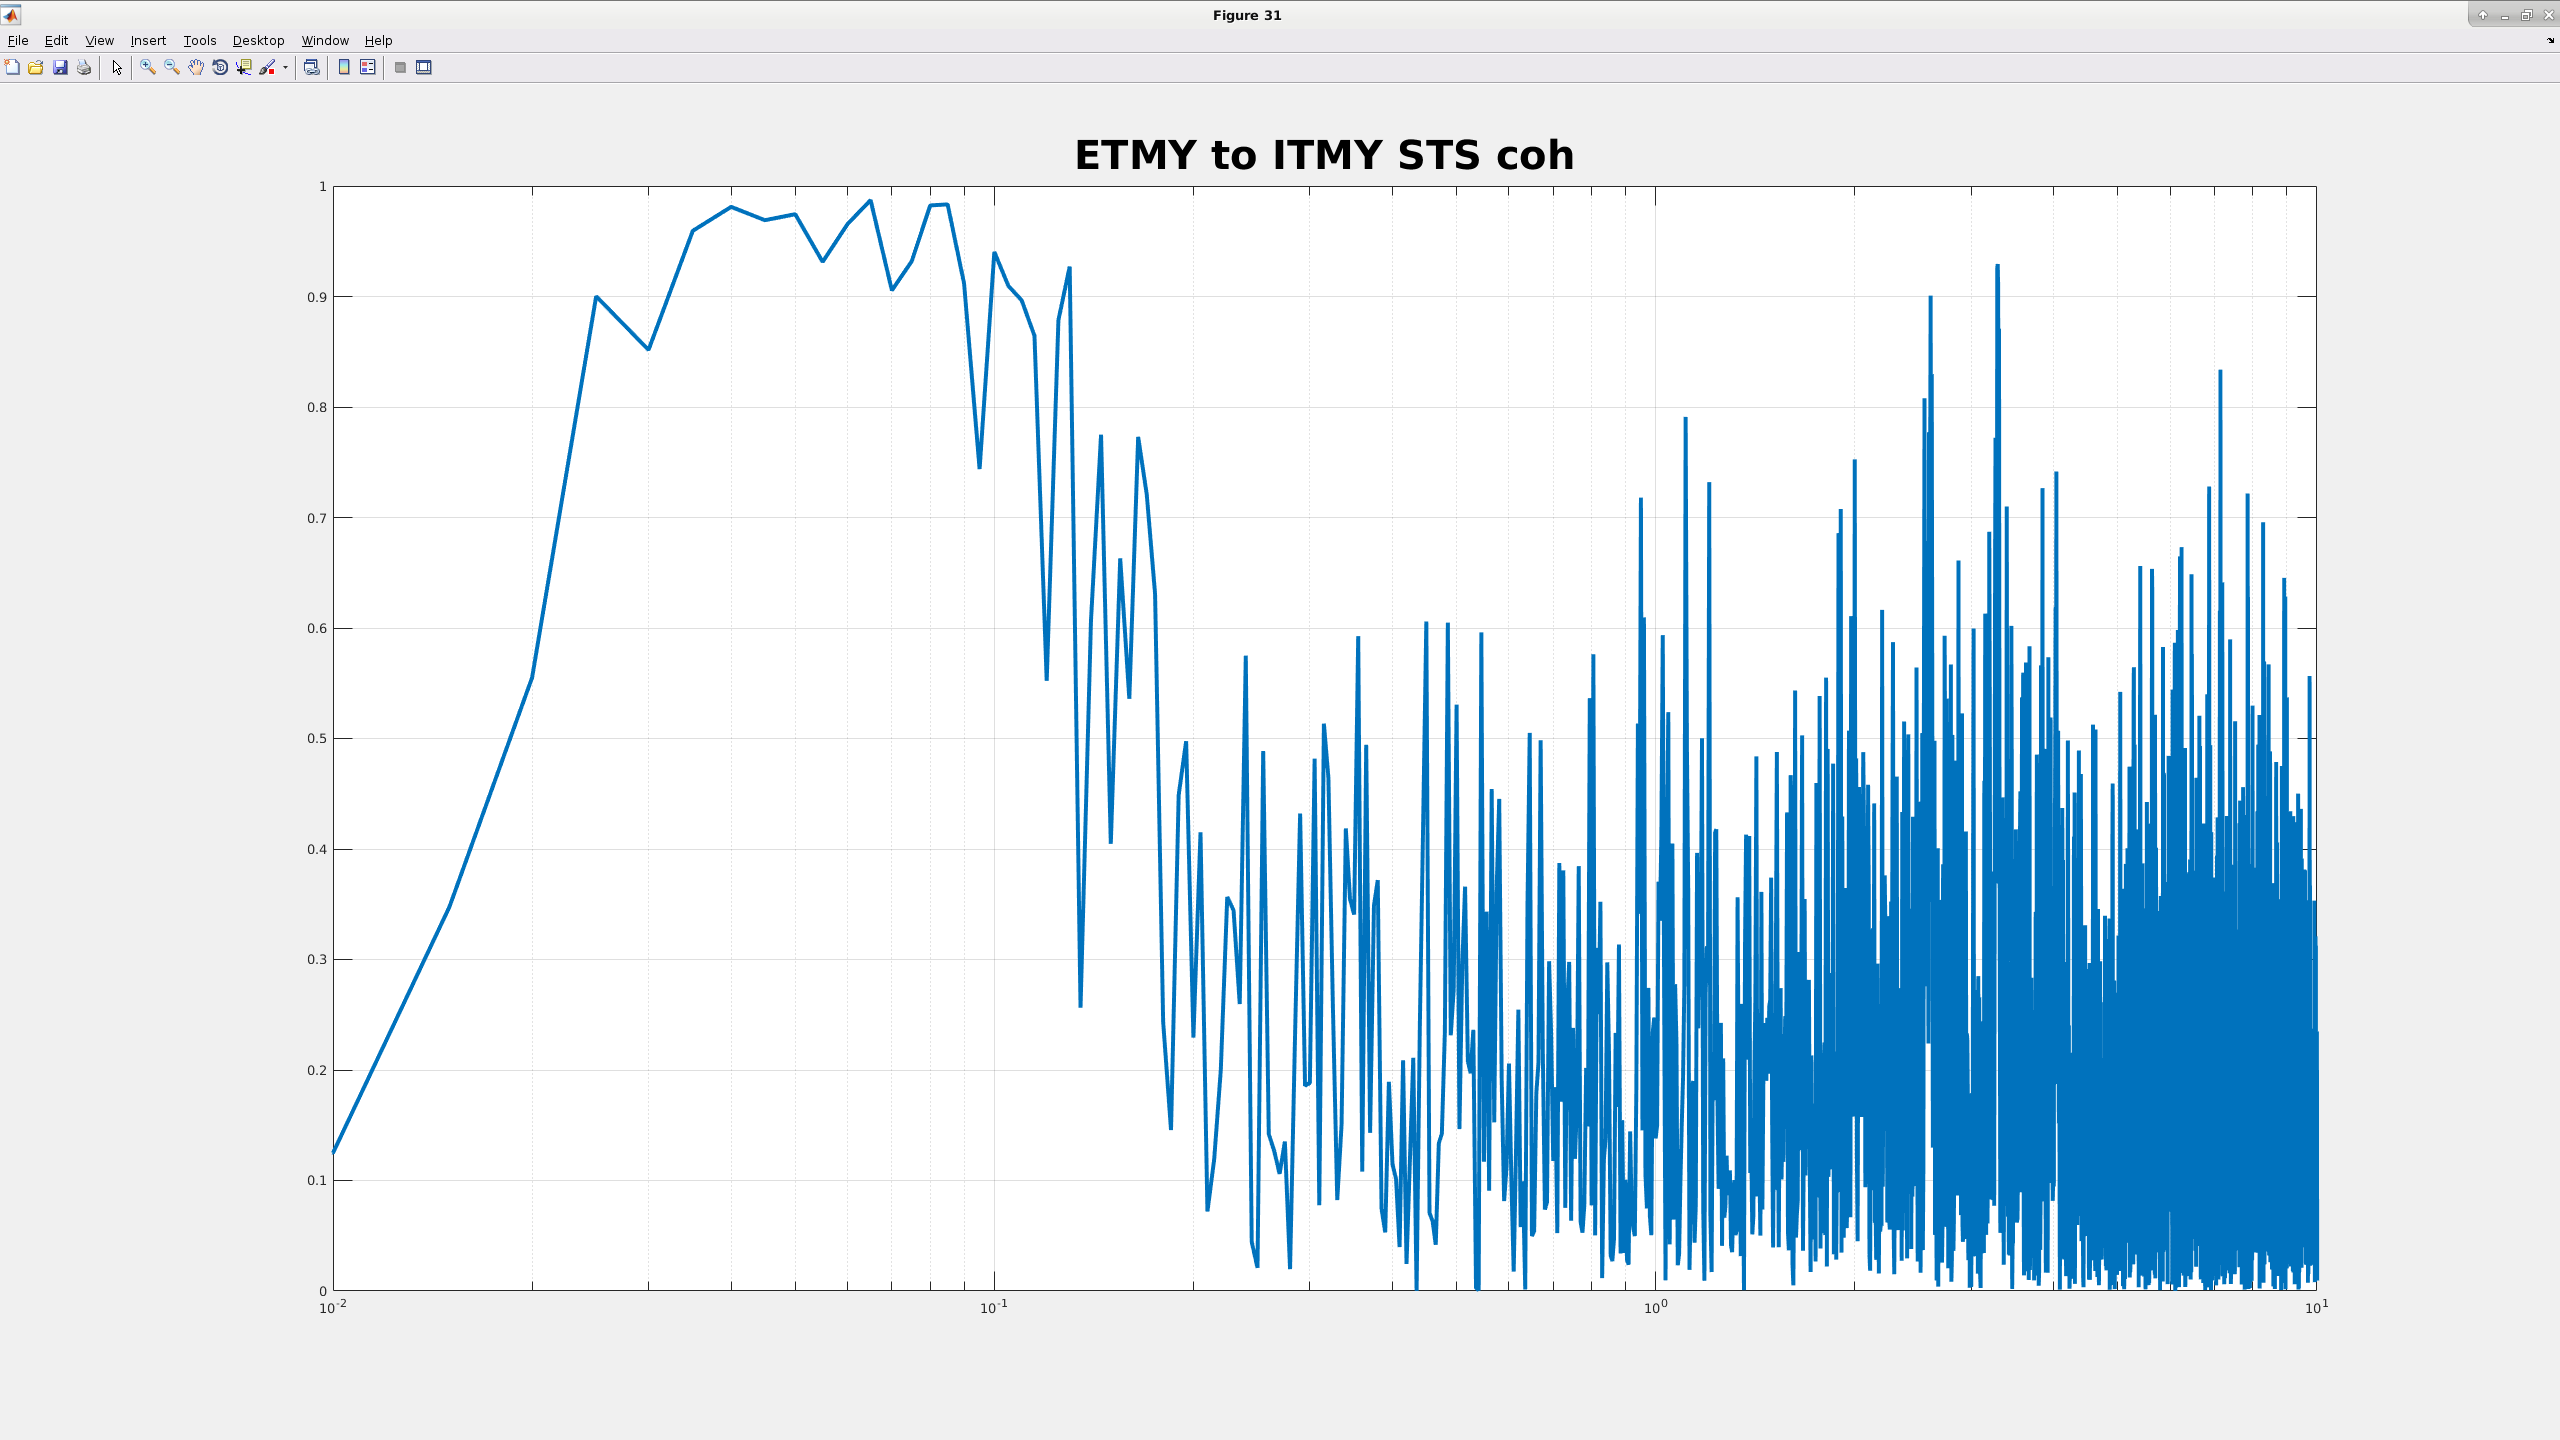
Second plot is the coherence between the ETMY BRS/STS and ITMY STS during this earthquake.
Tagging @DetChar and SEI for data in seismic's sensor correction configuration transition studies.
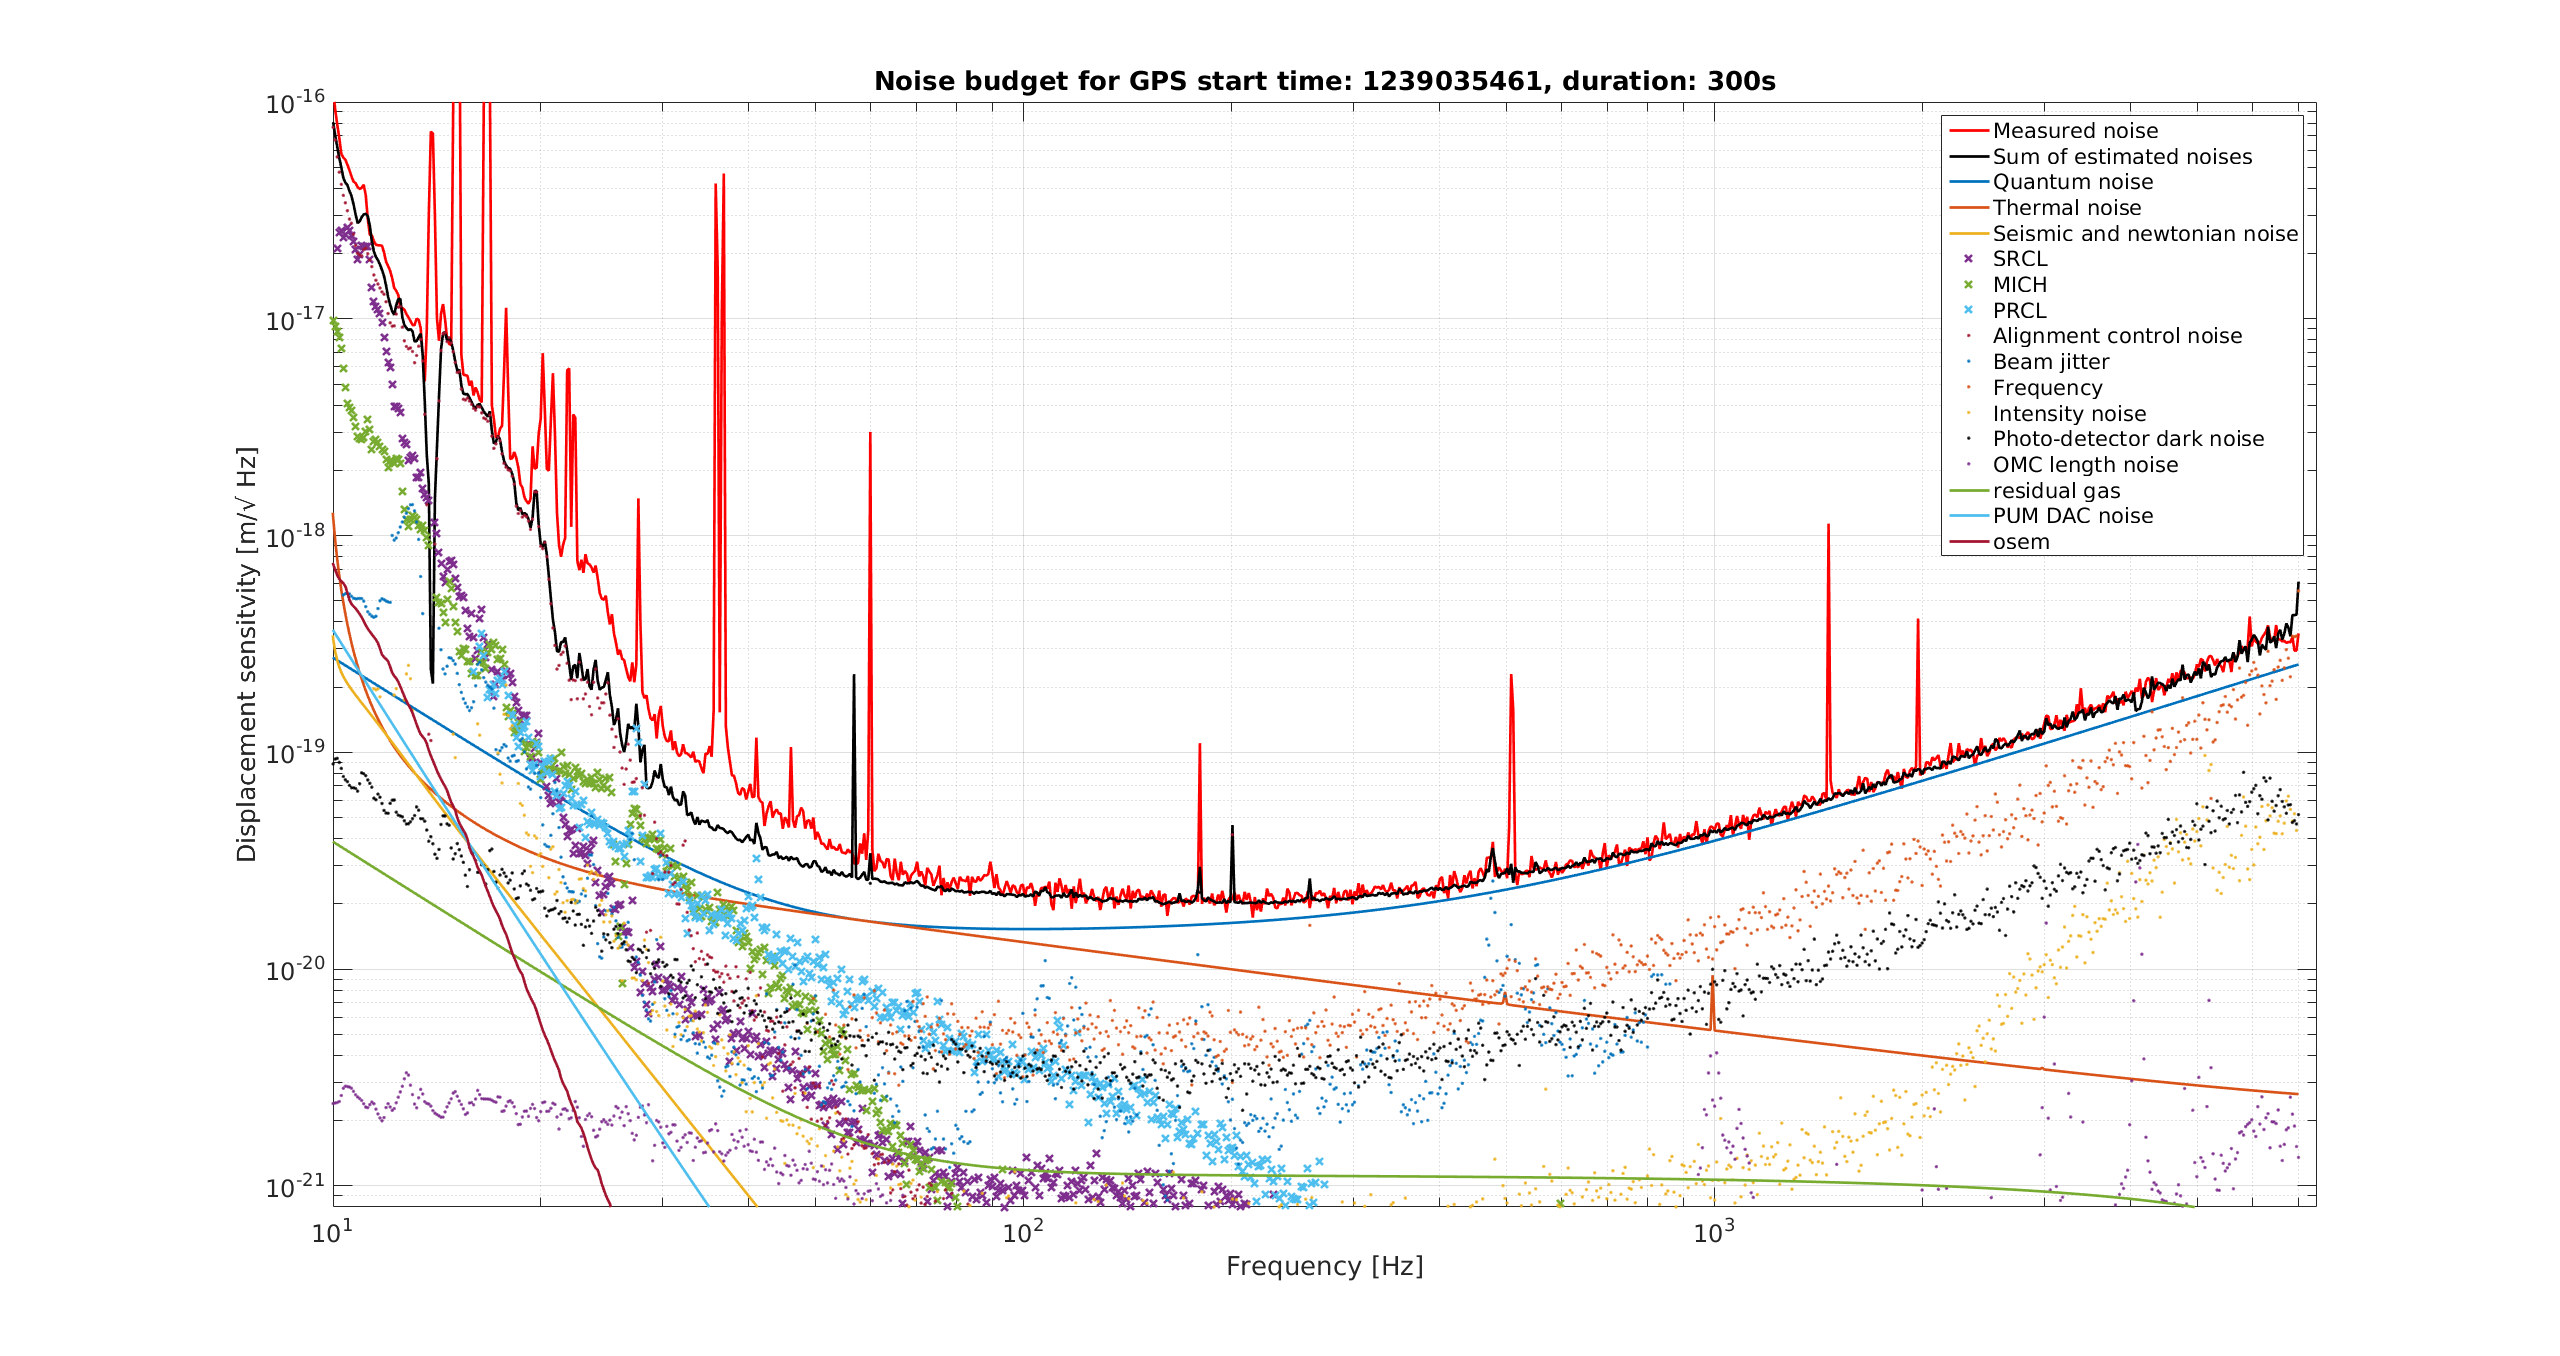
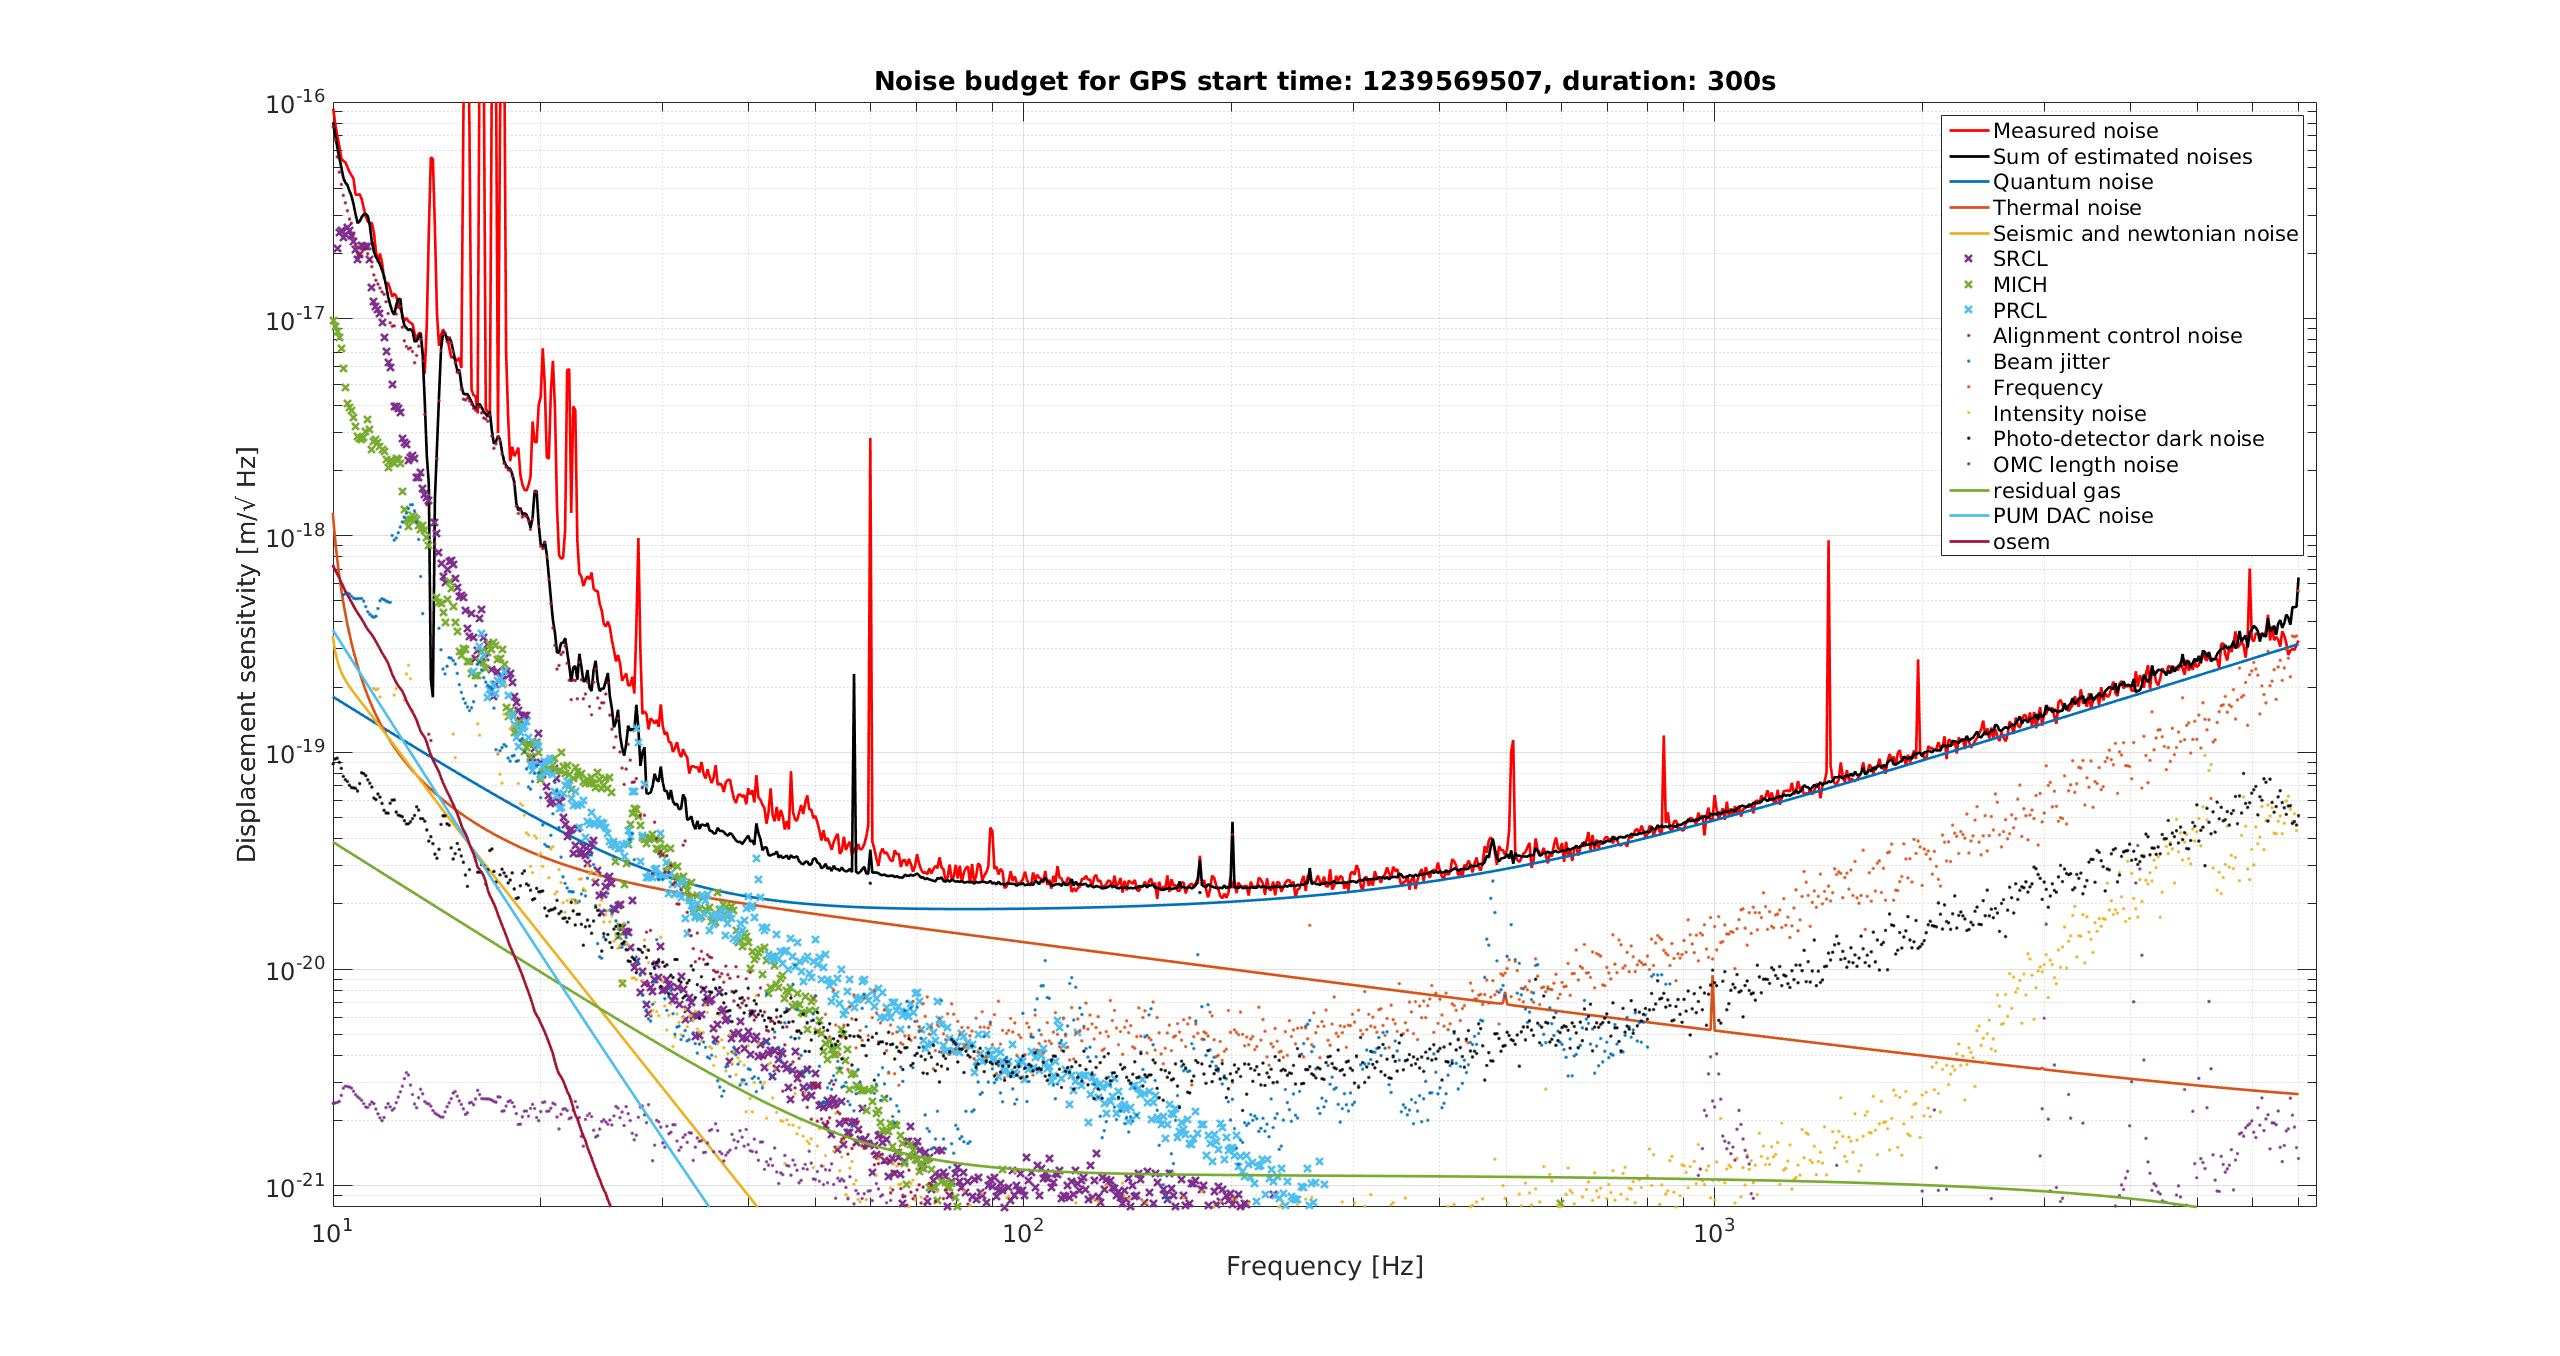
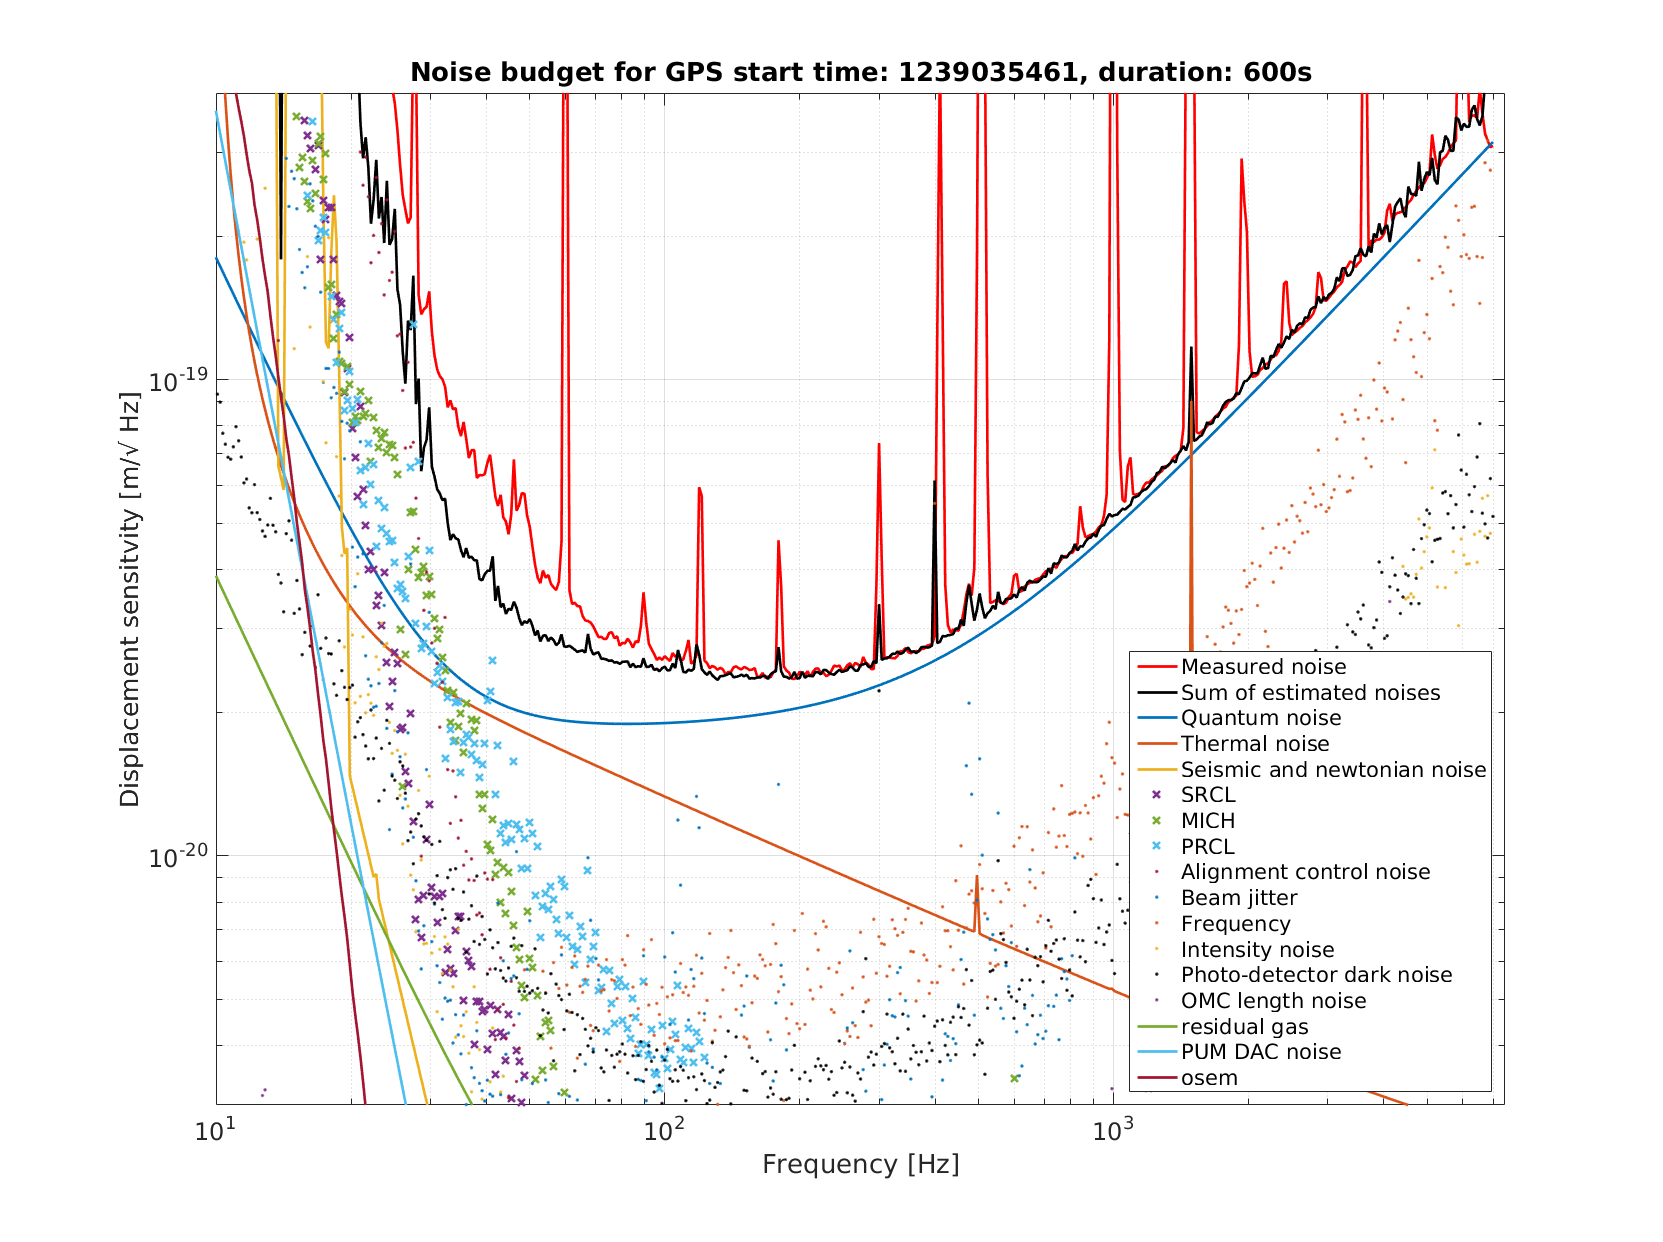
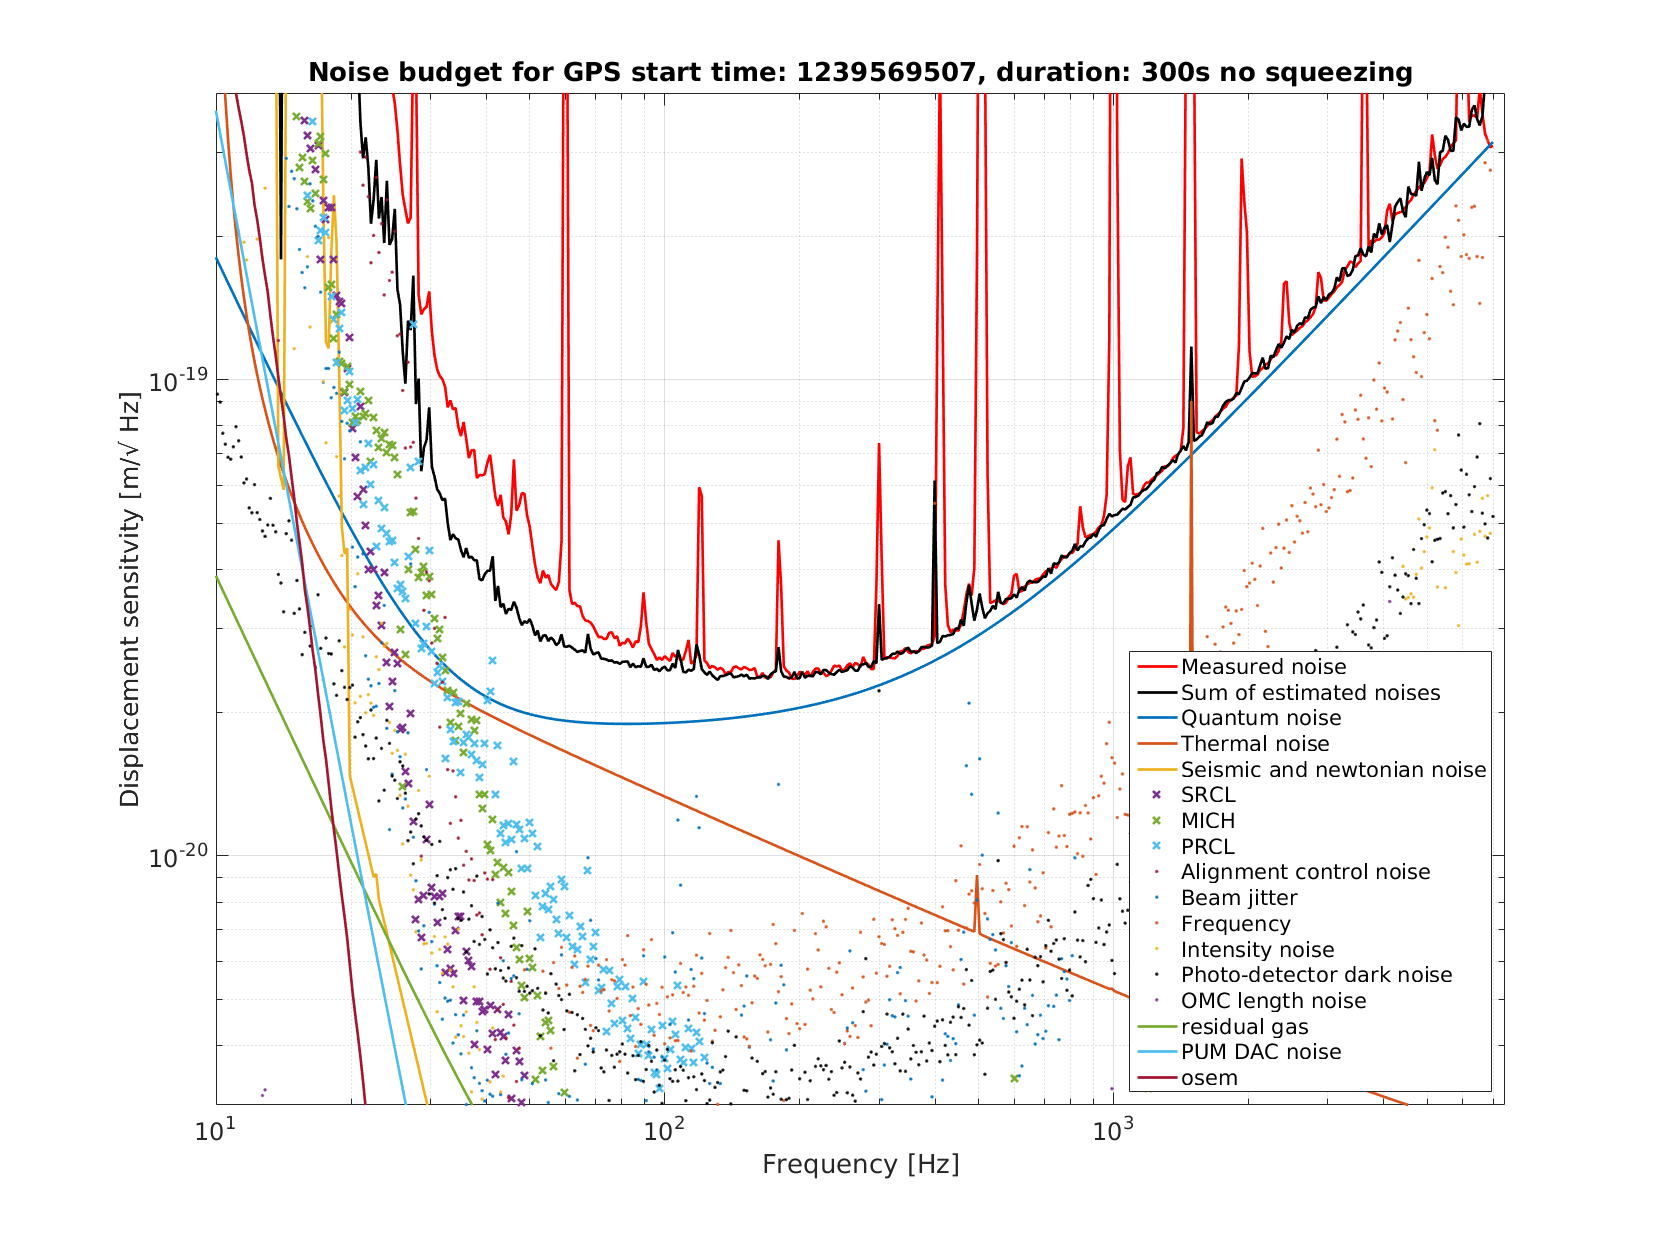
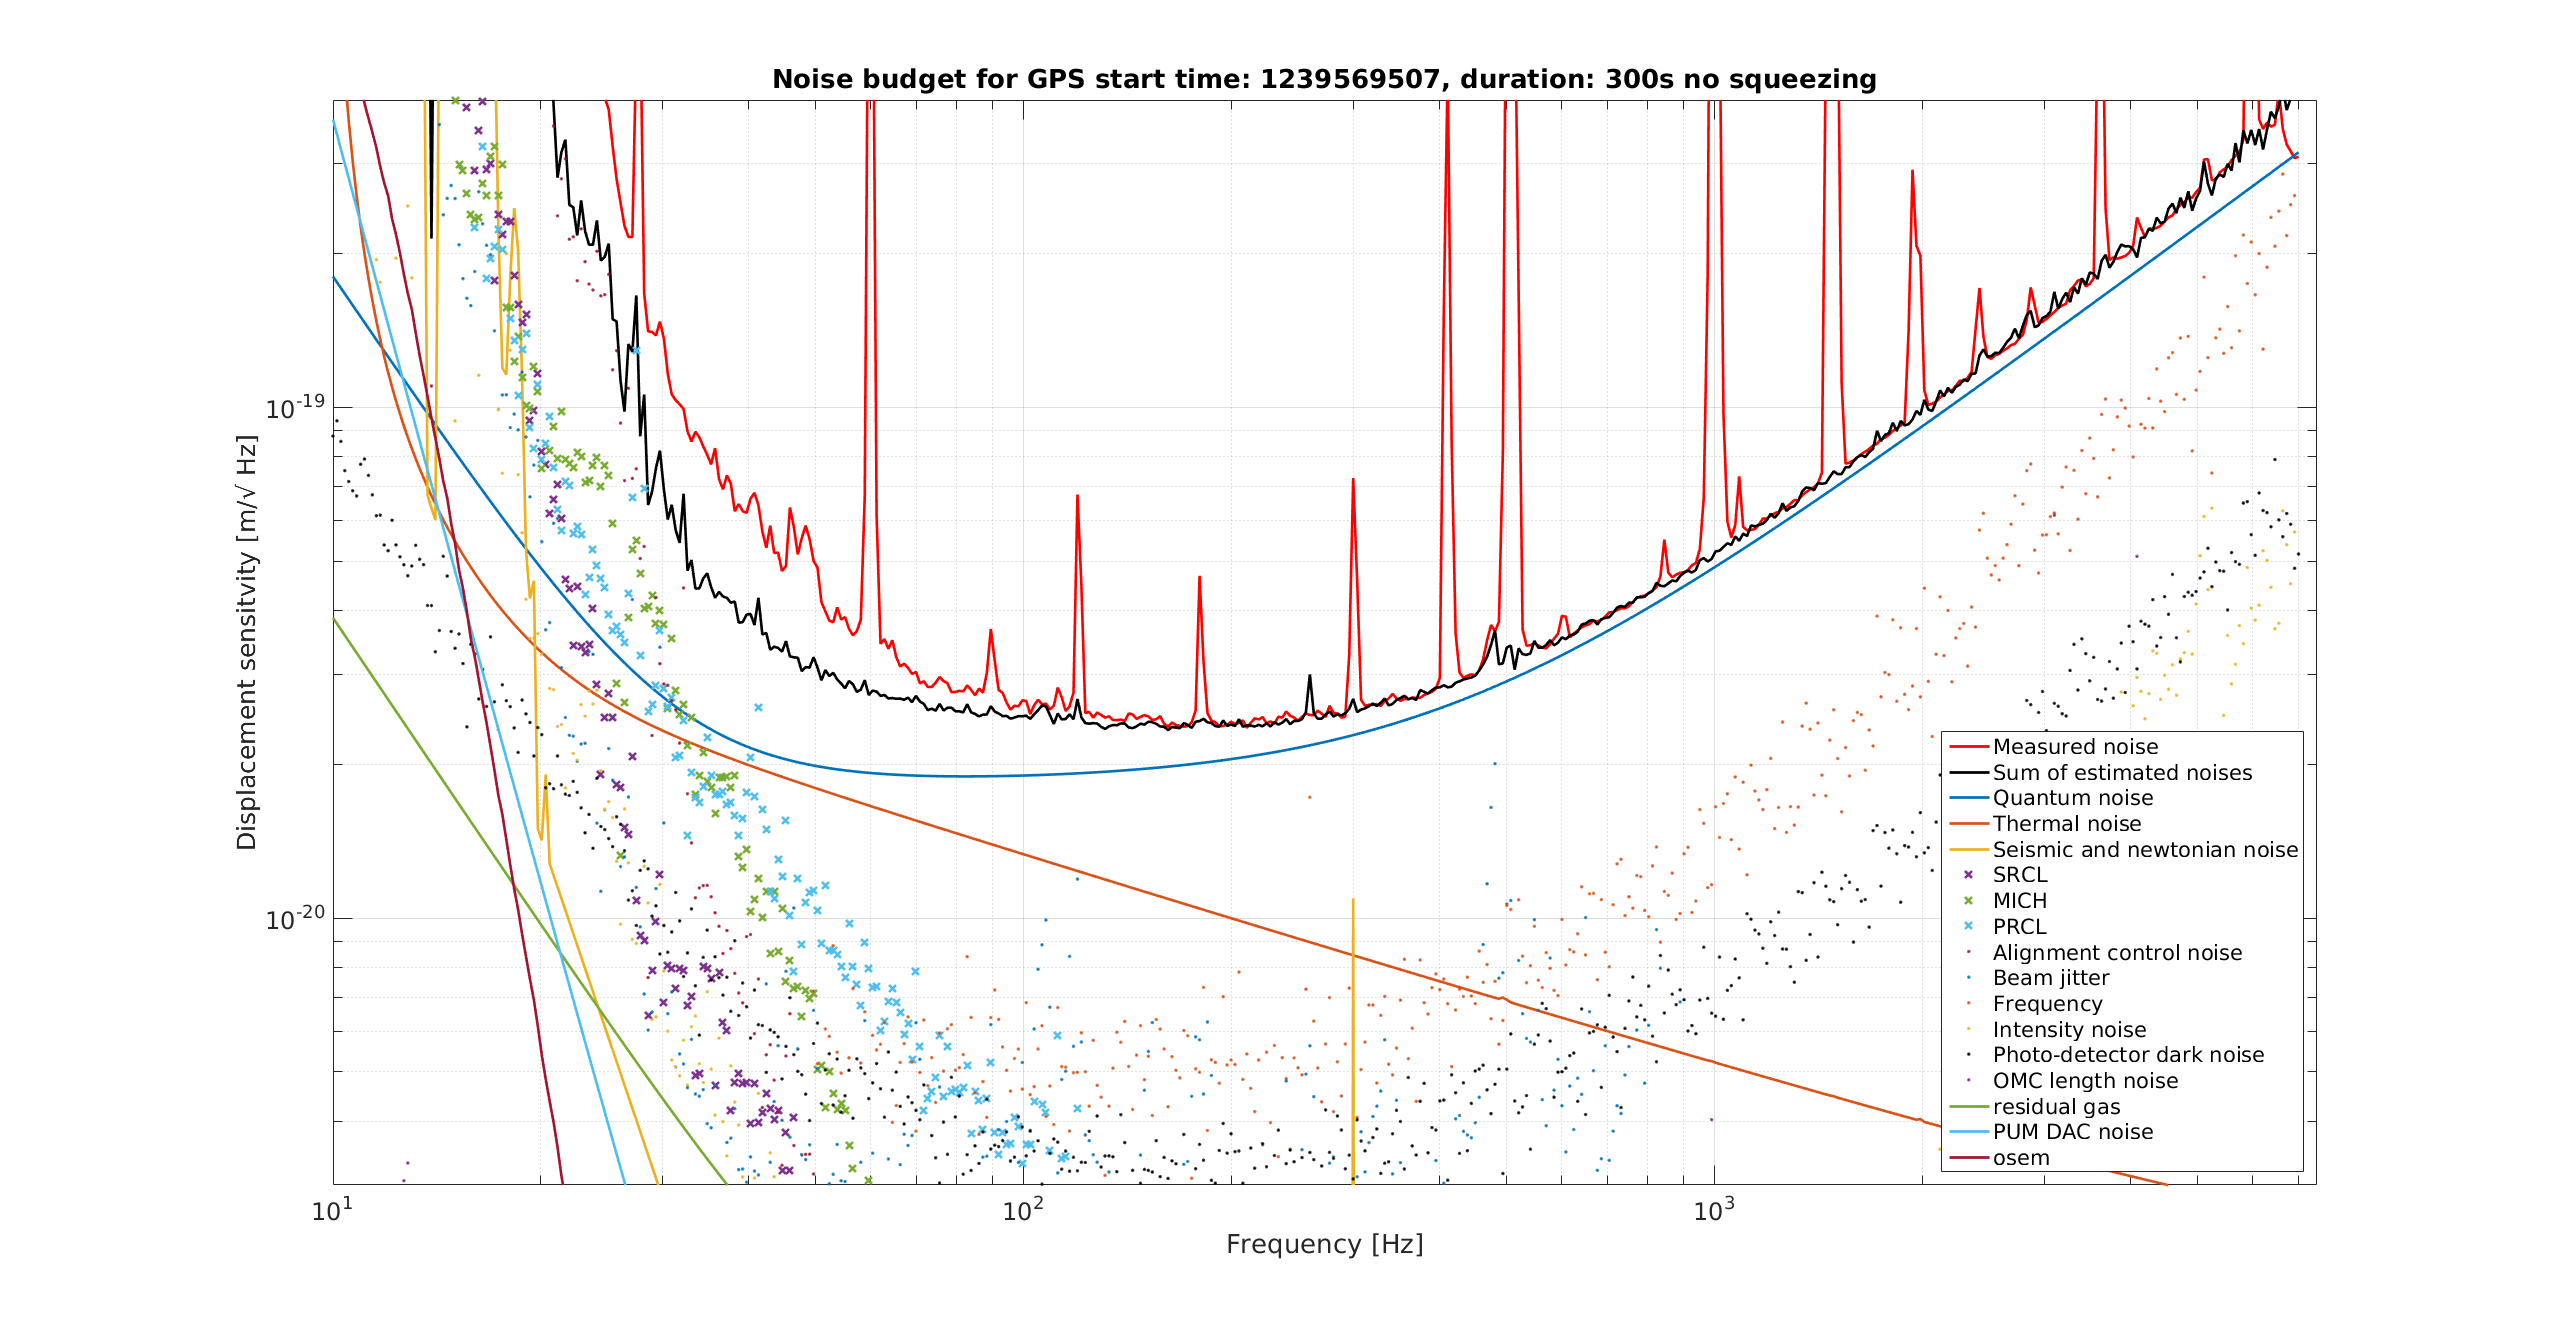
This is a quick update on the noise budget injections that we did last week. The first attachment is the noise budget for a time with squeezing, the second attachment is for a time without.
Some things that can still be improved in this noise budget:
I used the noise budget to look a little more closely at the quantum noise.
The first two attachments are the noise budgets with and without squeezing (same data as above, logarithmic binning fixed using some code from Tobin Fricke).
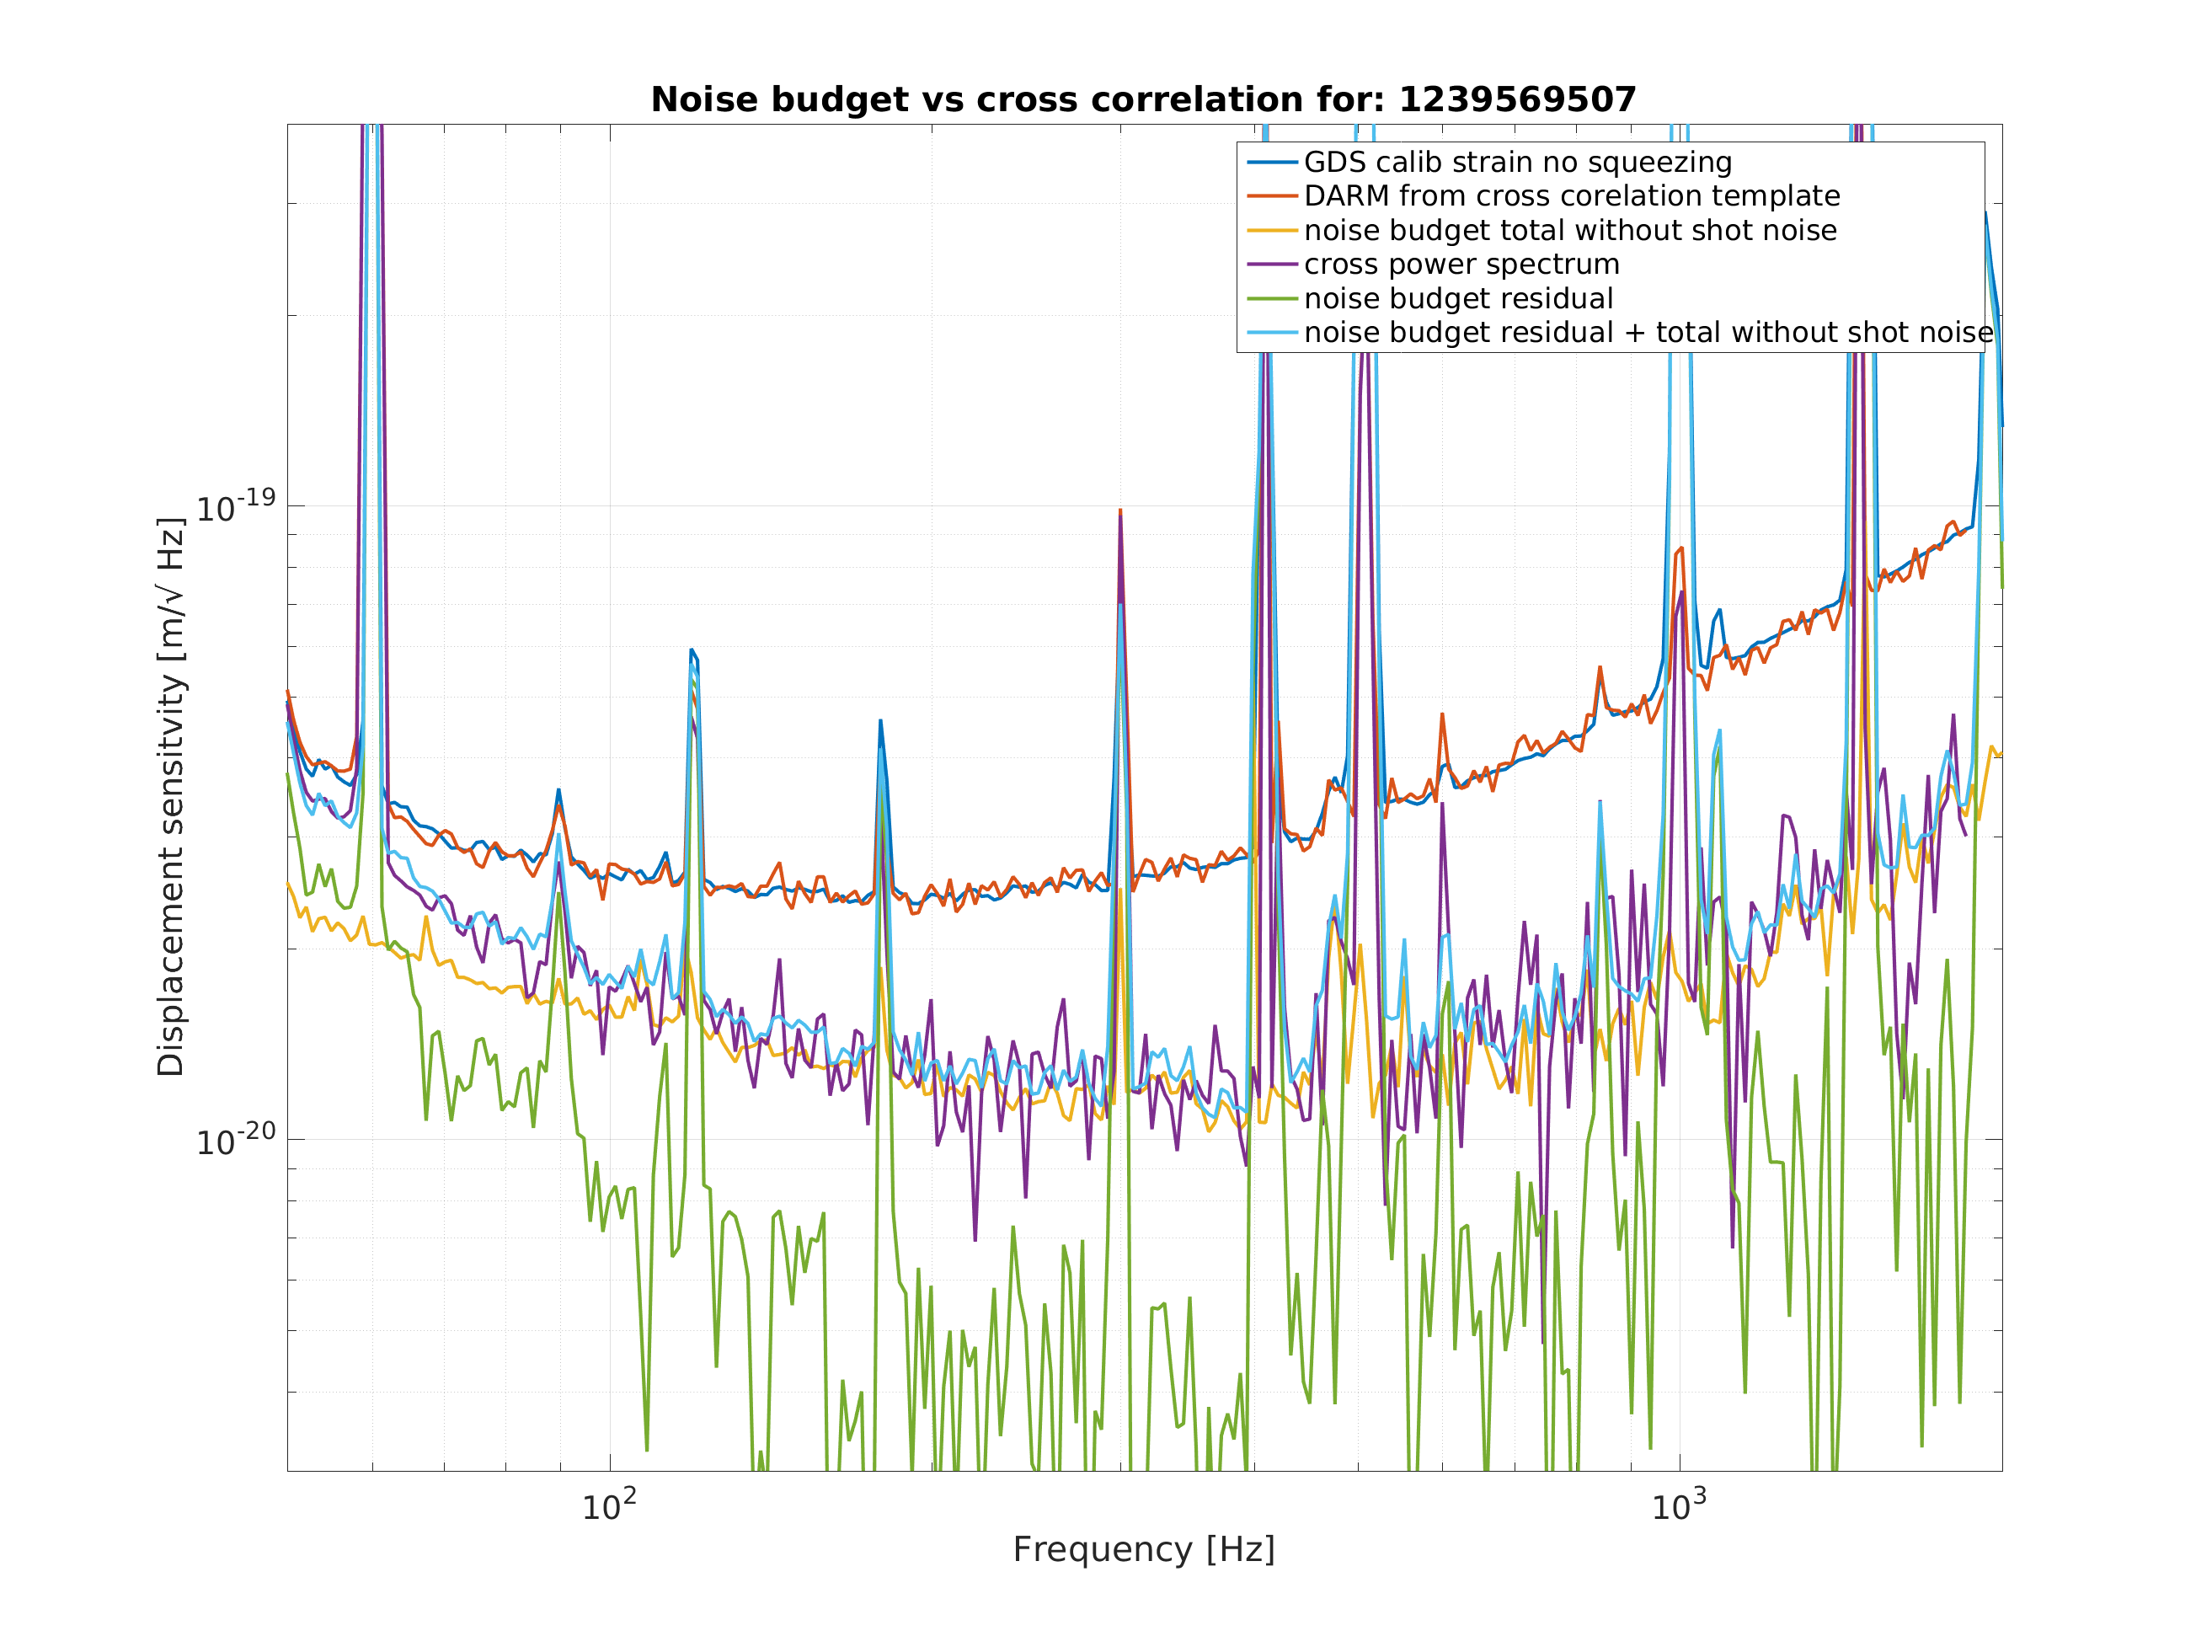
The next attachment is a comparison of the cross correlation (produced by the front end) for the no squeezing time to the noise budget. The main message here is that the cross correlation is in rough agreement with the noise budget above 150Hz, and the noise budget residual below 150 Hz is due to noise that is correlated between the two detectors.
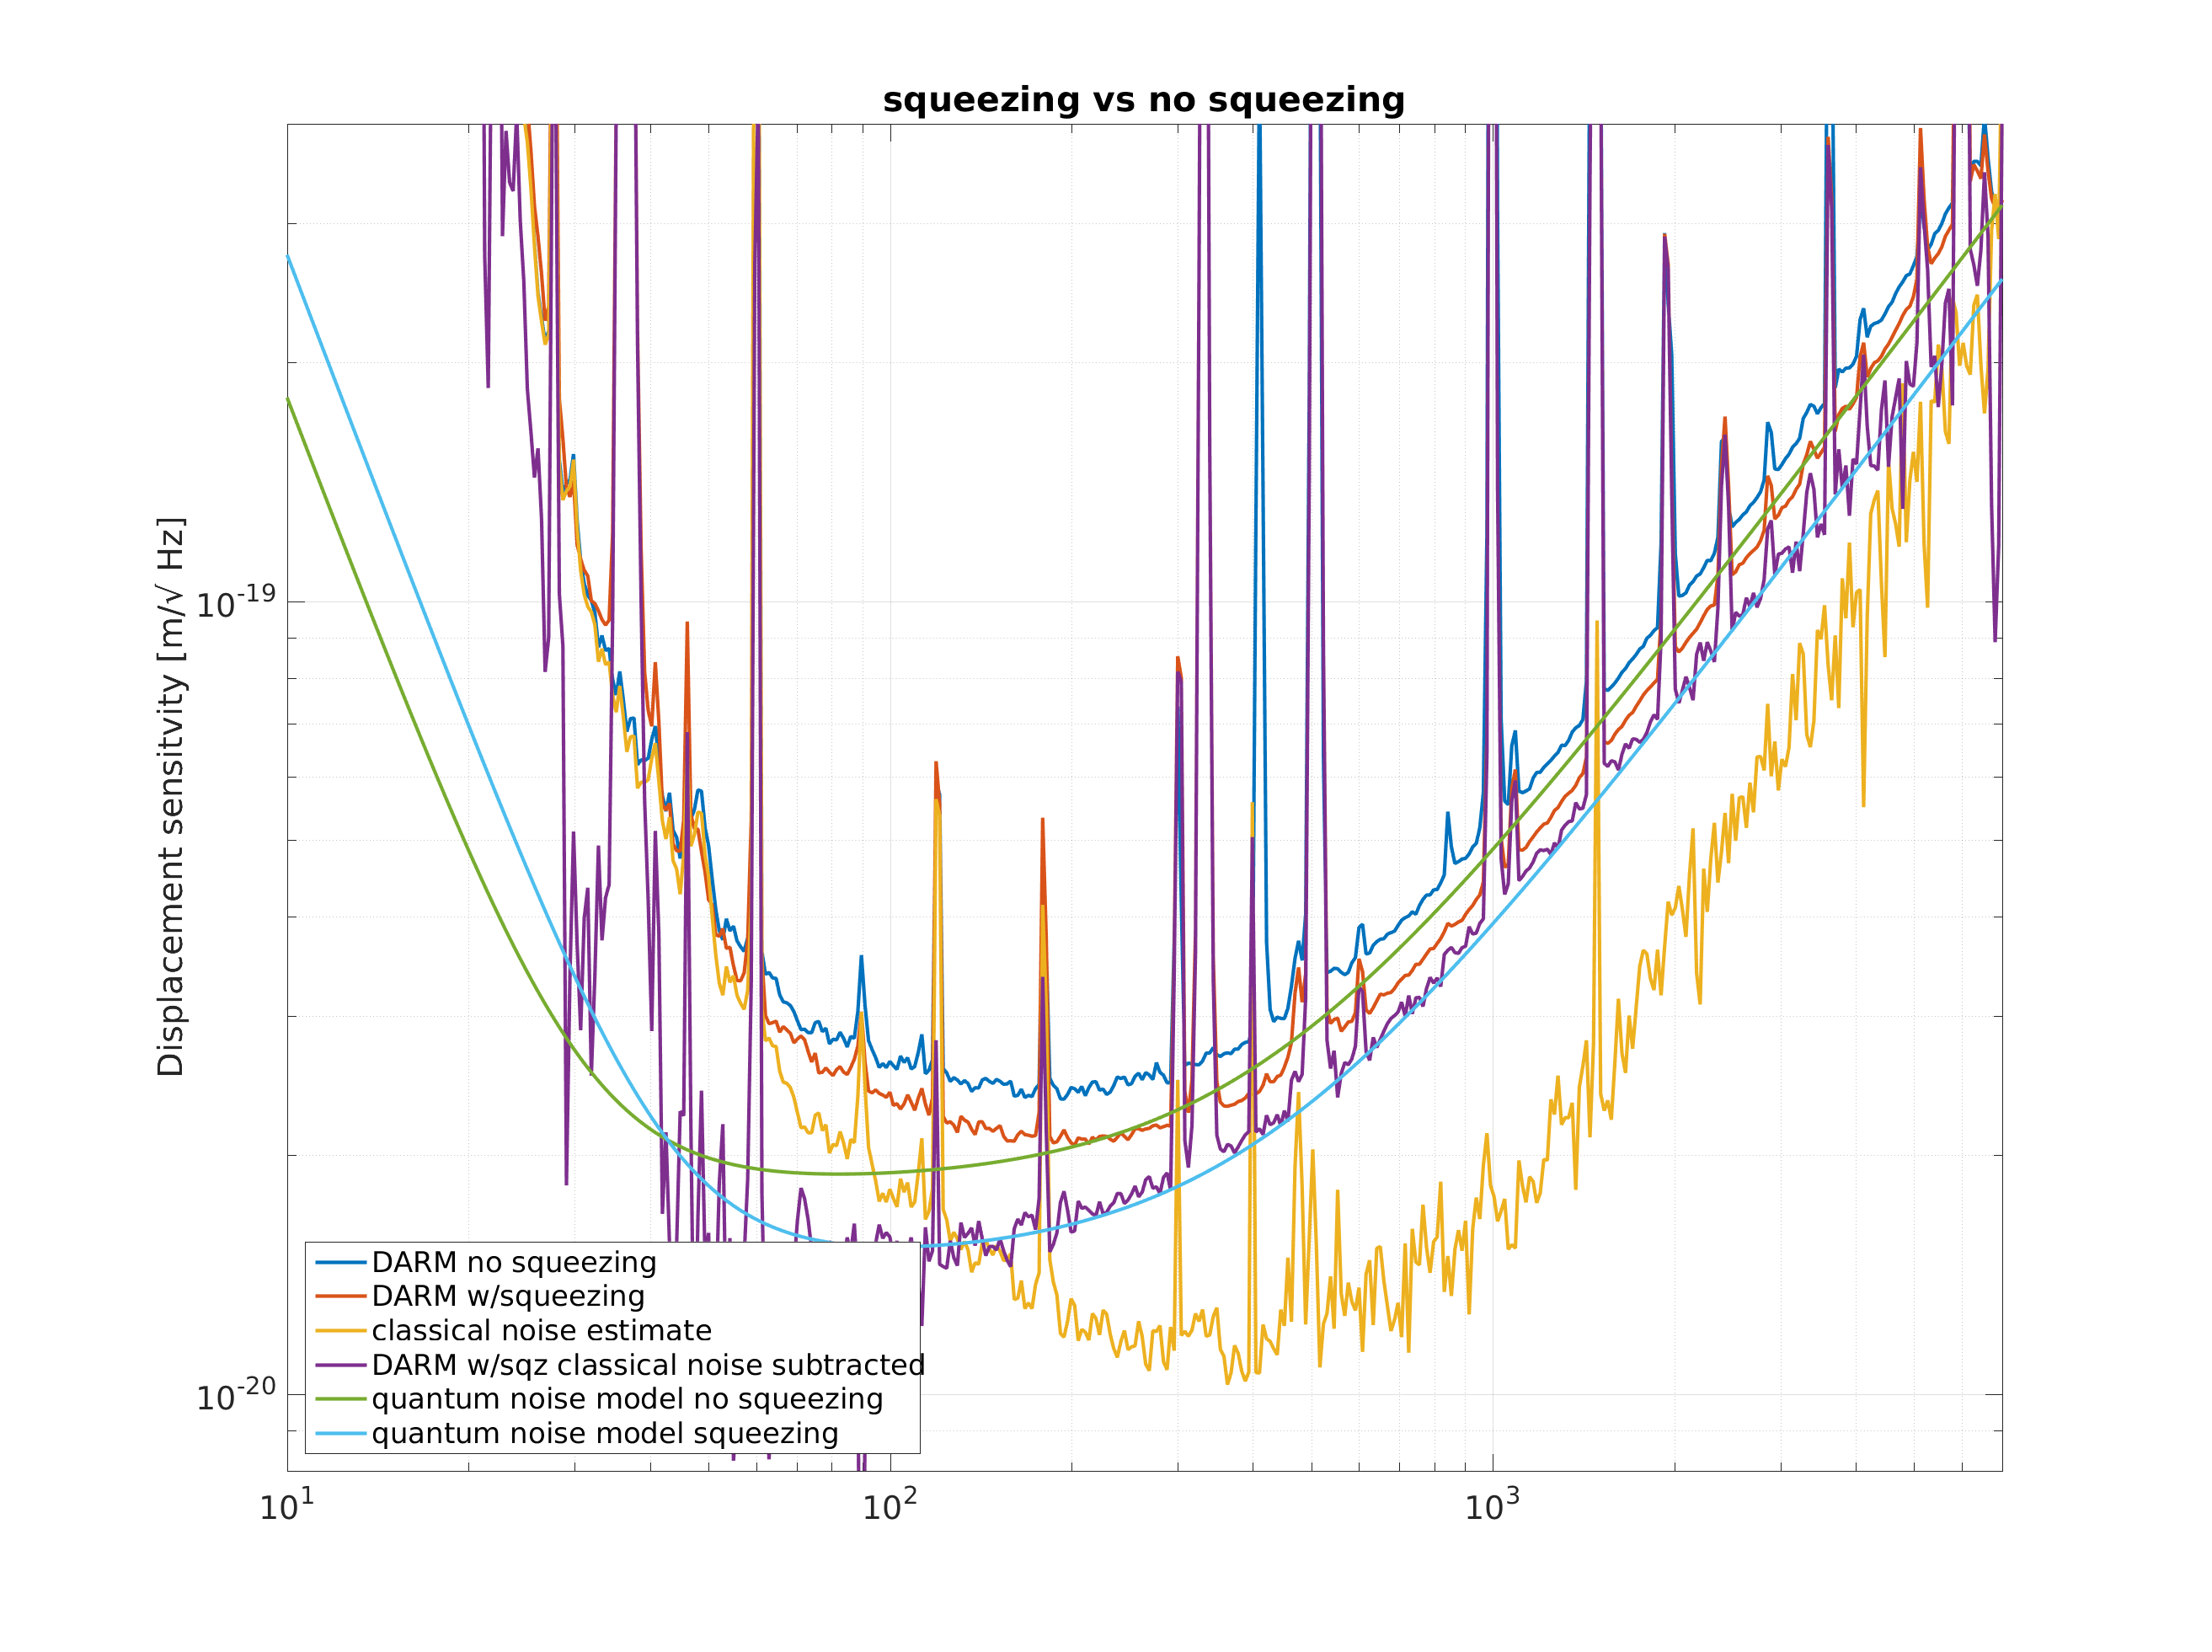
The fourth attachment shows a comparison of the DARM sensitivity with and without squeezing, and the modeled quantum noise in each case.
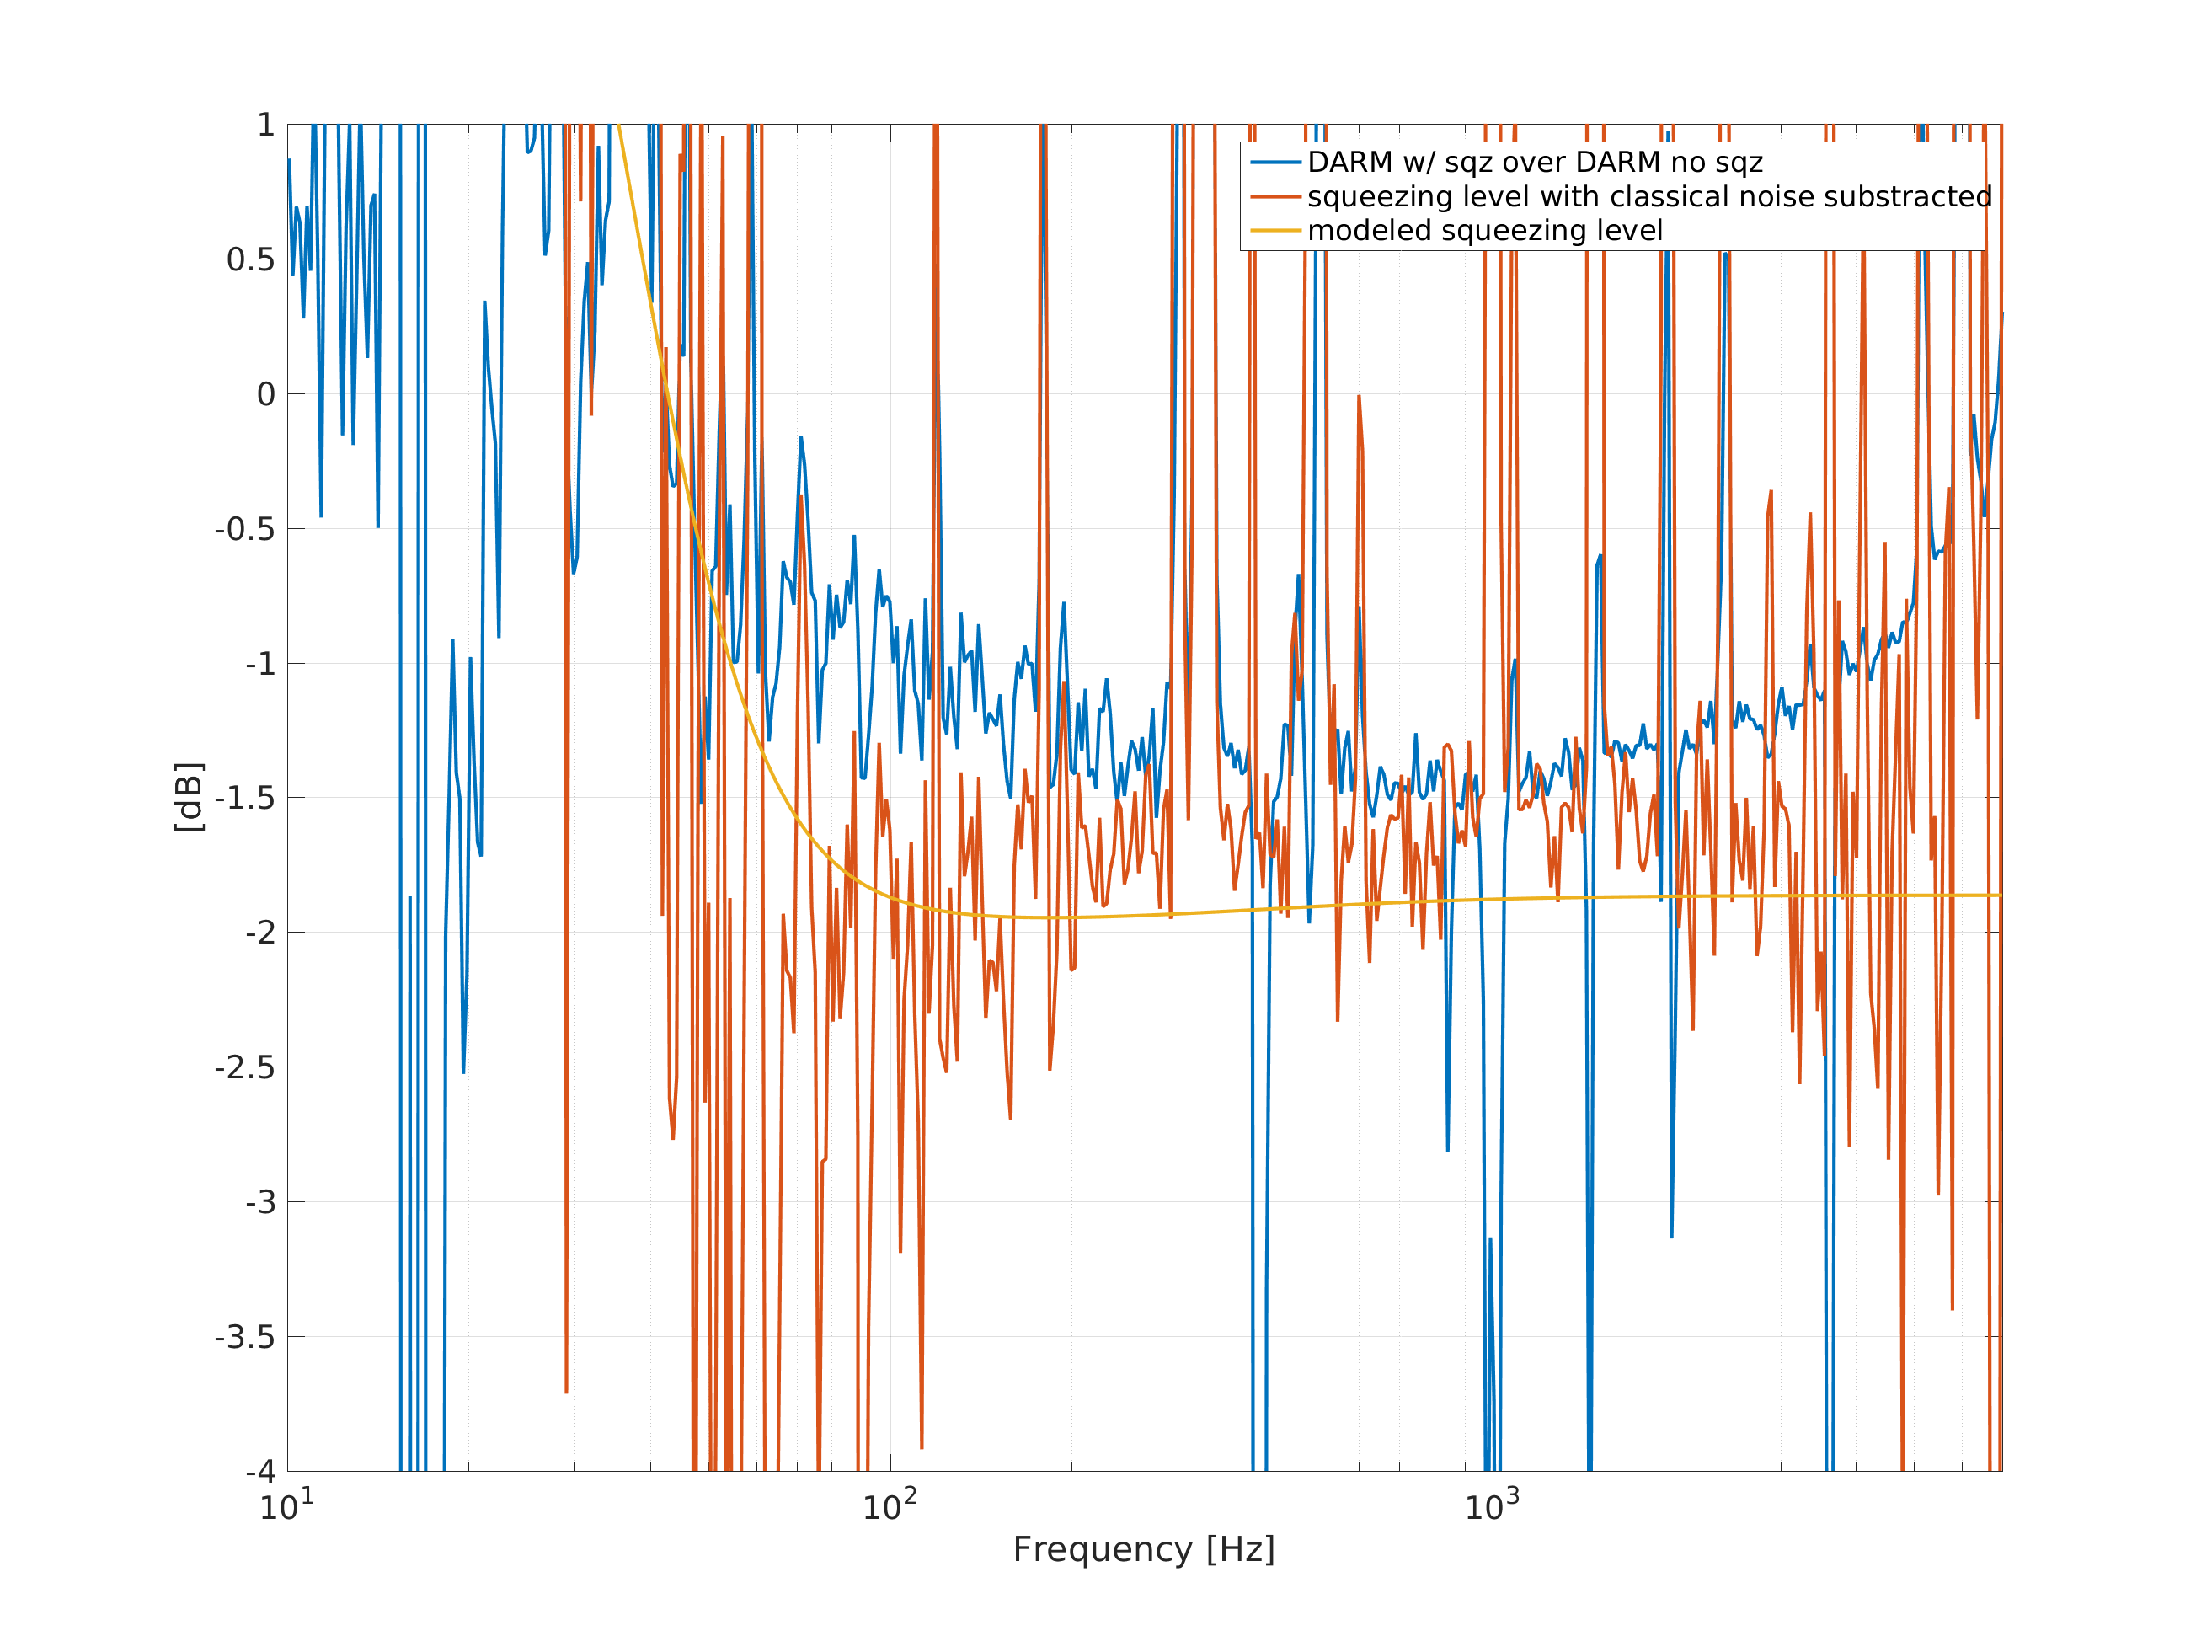
The 5th attachment shows the squeezing level based on the estimates used to make the 4th attachment.
The first two plots in the comment above were mixed up, the correct plots are attached here.
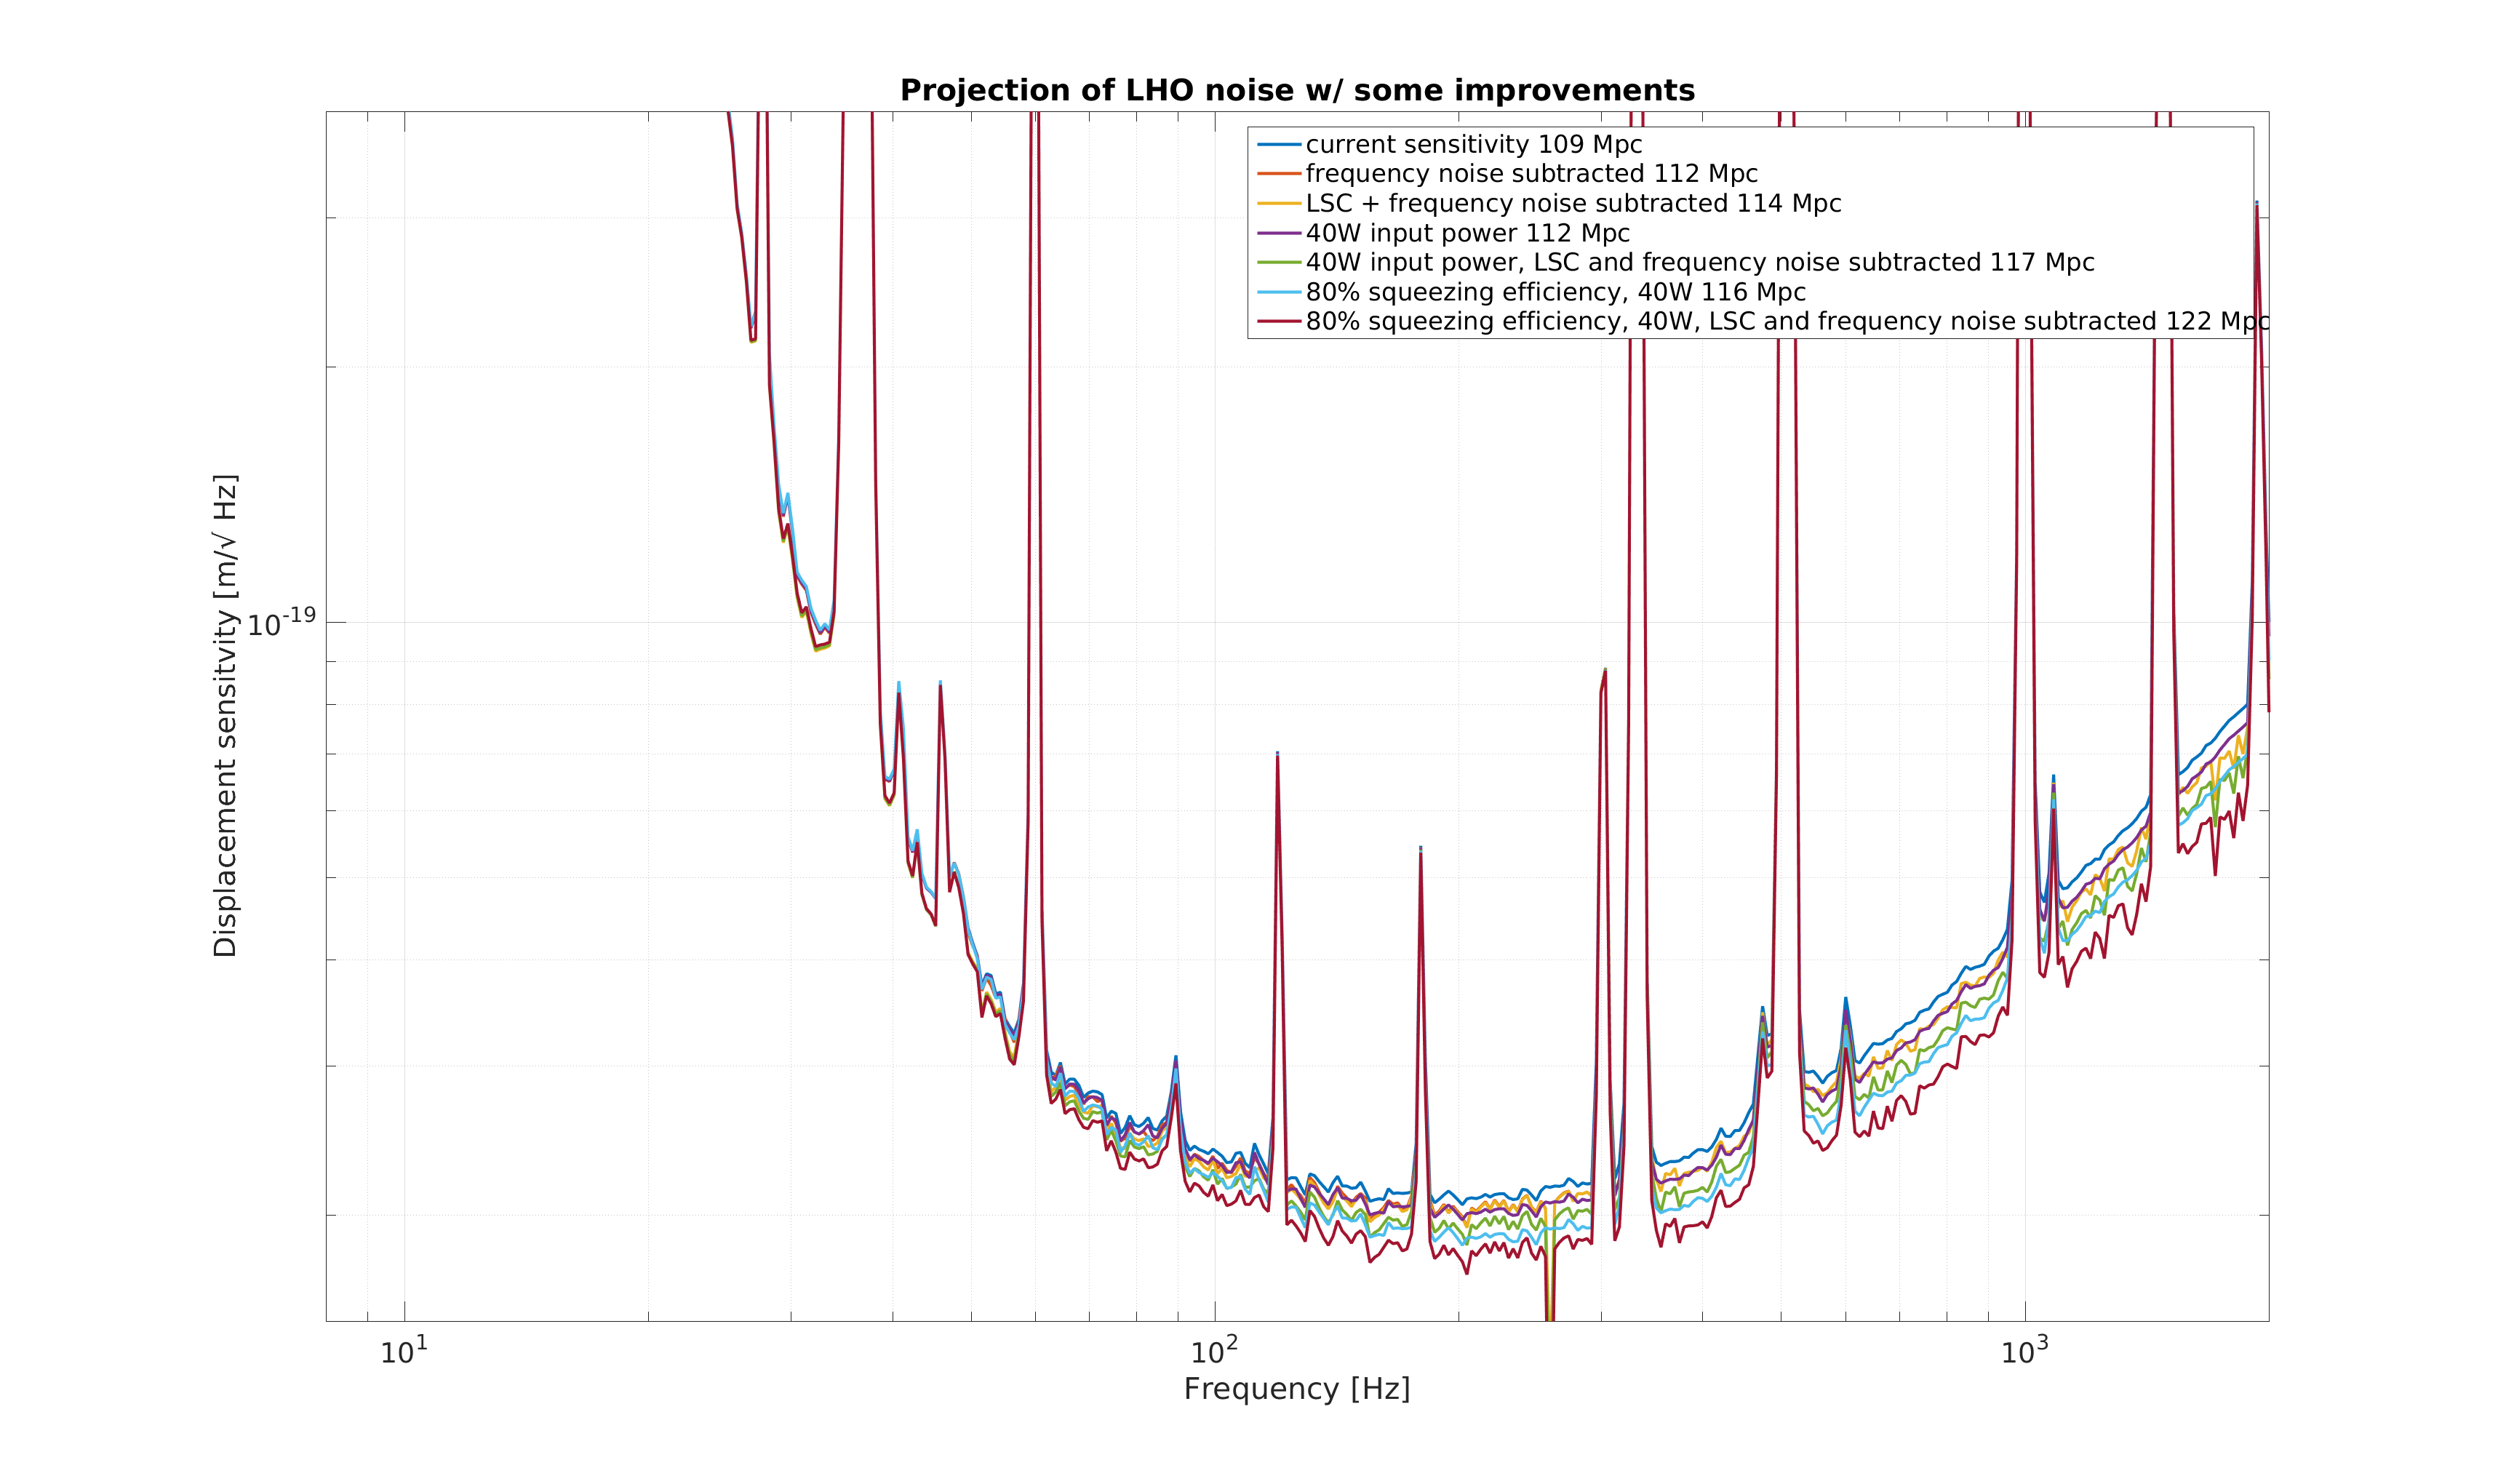
I estimated some of the improvements that we might be able to make to DARM in the third attachment, estimated ranges are in the legend.
We would gain a couple of Mpc each from improving our LSC feedforward (including PRCL which we aren't doing right now), and from reducing the frequency noise. The projection of 5MPc total for both of these is assuming that we can get rid of them totally, which is optimistic. We can get a similar improvement by increasing the power into the IMC to 40W, assuming that the circulating power continues to scale with the input power. Combining an increase in the input power and improvements in LSC and frequency noise, we can start to approach 120 Mpc.
I also estimated what we would get if we had 3dB of squeezing. I estimated this as an improvement in the losses, with our current nonlinear gain and phase noise of 150 mrad, we would need about 78% efficiency to reach 3dB of squeezing. This could also be achieved by a different route, which would result in slightly different anti squeezing levels. This would indicate that with 3dB of squeezing, 40W power into the IMC, improved LSC feedforward, and reduced frequency noise, we could reach just above 120 Mpc.
While at Hanford I developed some python software that can make a series of injections automatically.
This was useful for taking measurements overnight, or running the same series of injections over and over with small adjustments (like bandlimited frequency noise injections over five bandlimits).
Jenne has asked for some documentation, so I'm writing it up in the git.ligo.org README below. This will only be useful for front-end machines at LHO in it's current state, but only small modifications would make it work at LLO or CIT.
Step-by-step instructions on git.ligo.org
Only one example plotting calibrated ASDs and TFs as of now, April 18 2019, but will be adding more soon, including writing injection suites like the one in MCL_injection_caller.py
[Jenne, Georgia, Sheila]
We were bothered that the SRC2 Pit output on the front wall TV was wandering away from zero - it doesn't seem like it should need to do that. After some looking around, we realized that the SR3 cage servo (which is currently configured as a DC oplev servo) has been running since the SR3 heater test last week. It looks like the SR3 laser must have had a glitch or something (Sheila reminds us that it's been a problem and showing up in Hveto occasionally), and the cage servo was wandering off. The SRC ASC loops were moving in order to compensate for this movement of SR3.
Since we are out of Observe anyway for PEM injections, we turned off the SR3 cage servo. It should remain off unless there is an explicit need to turn it on for an SR3 heater test.
I've updated its nominal state to be CAGE_SERVO_OFF.
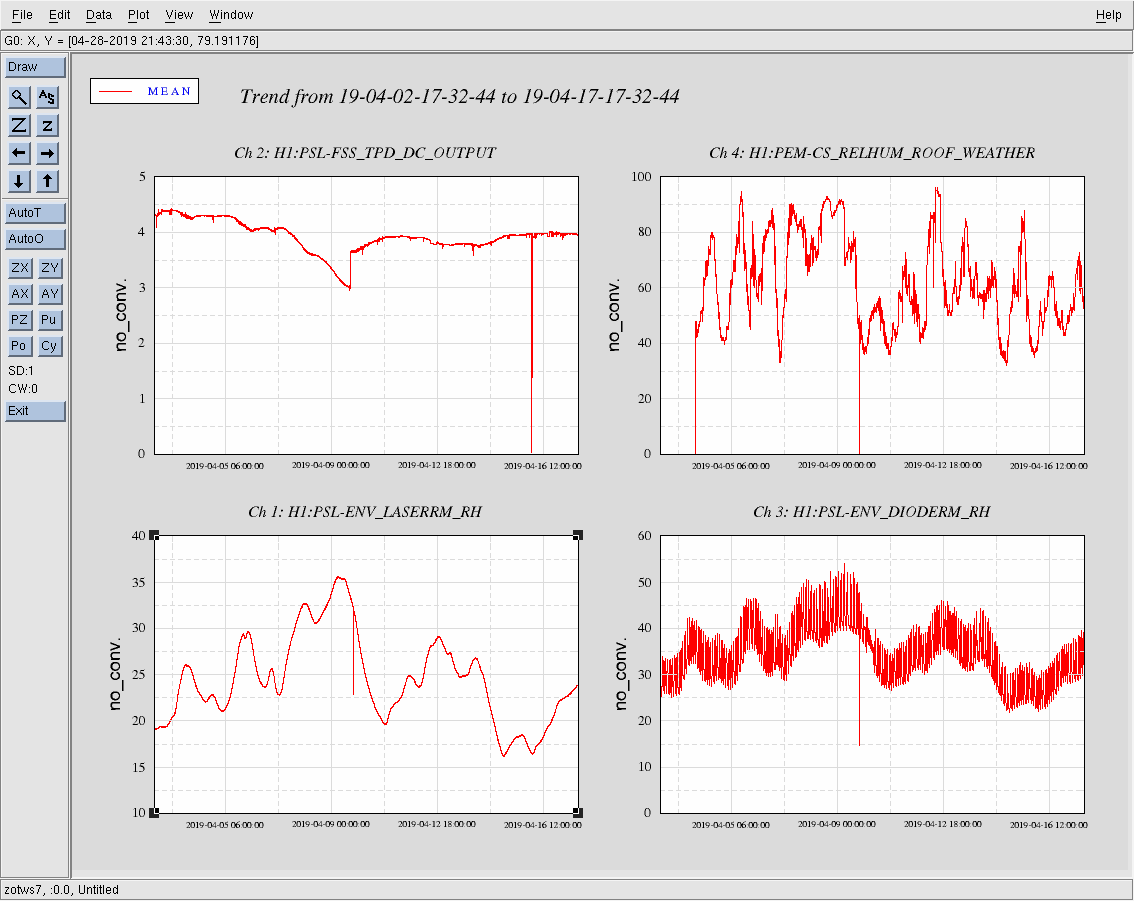
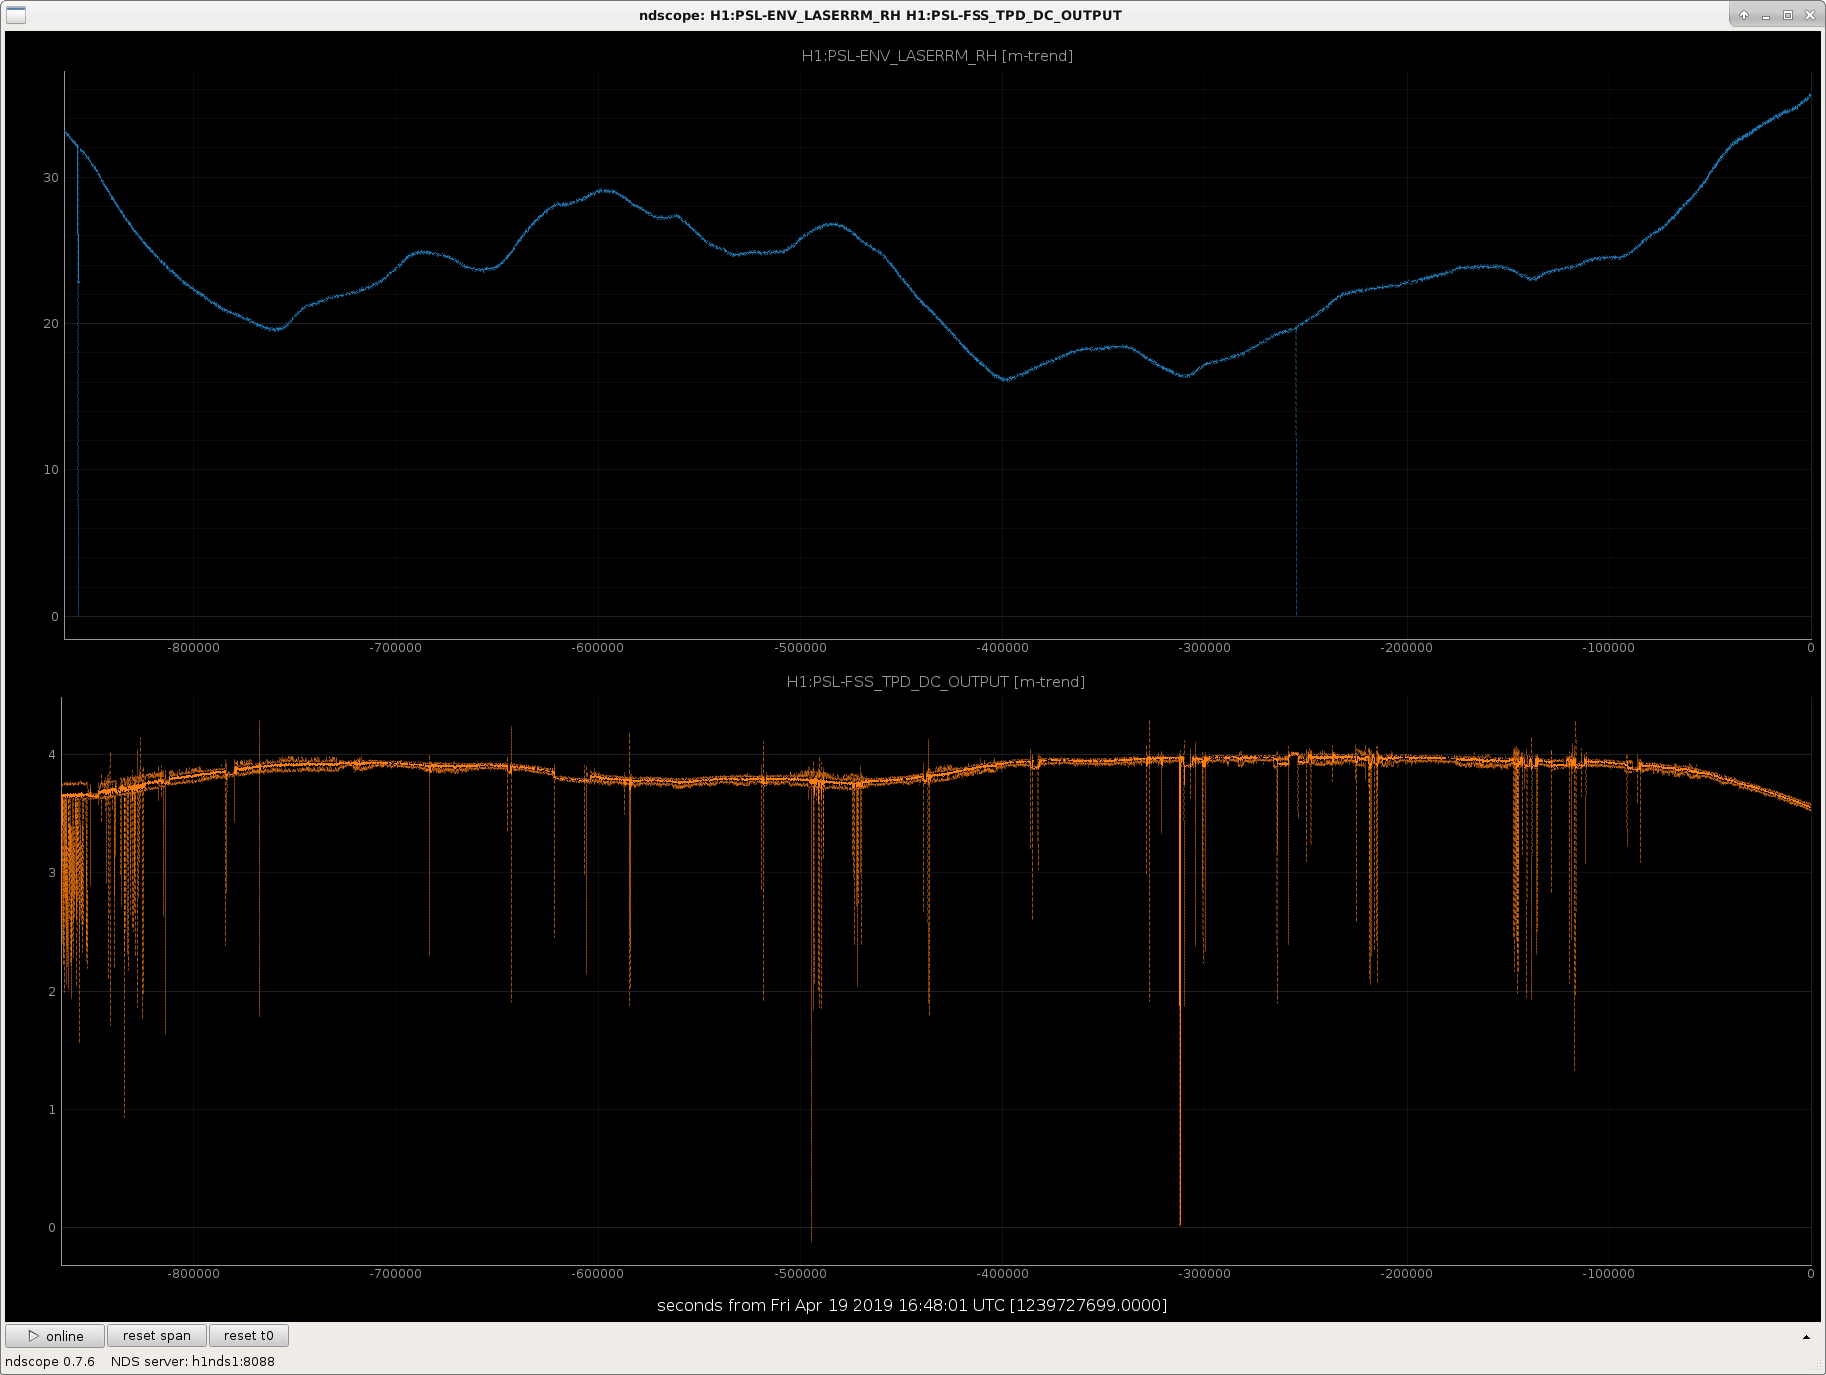
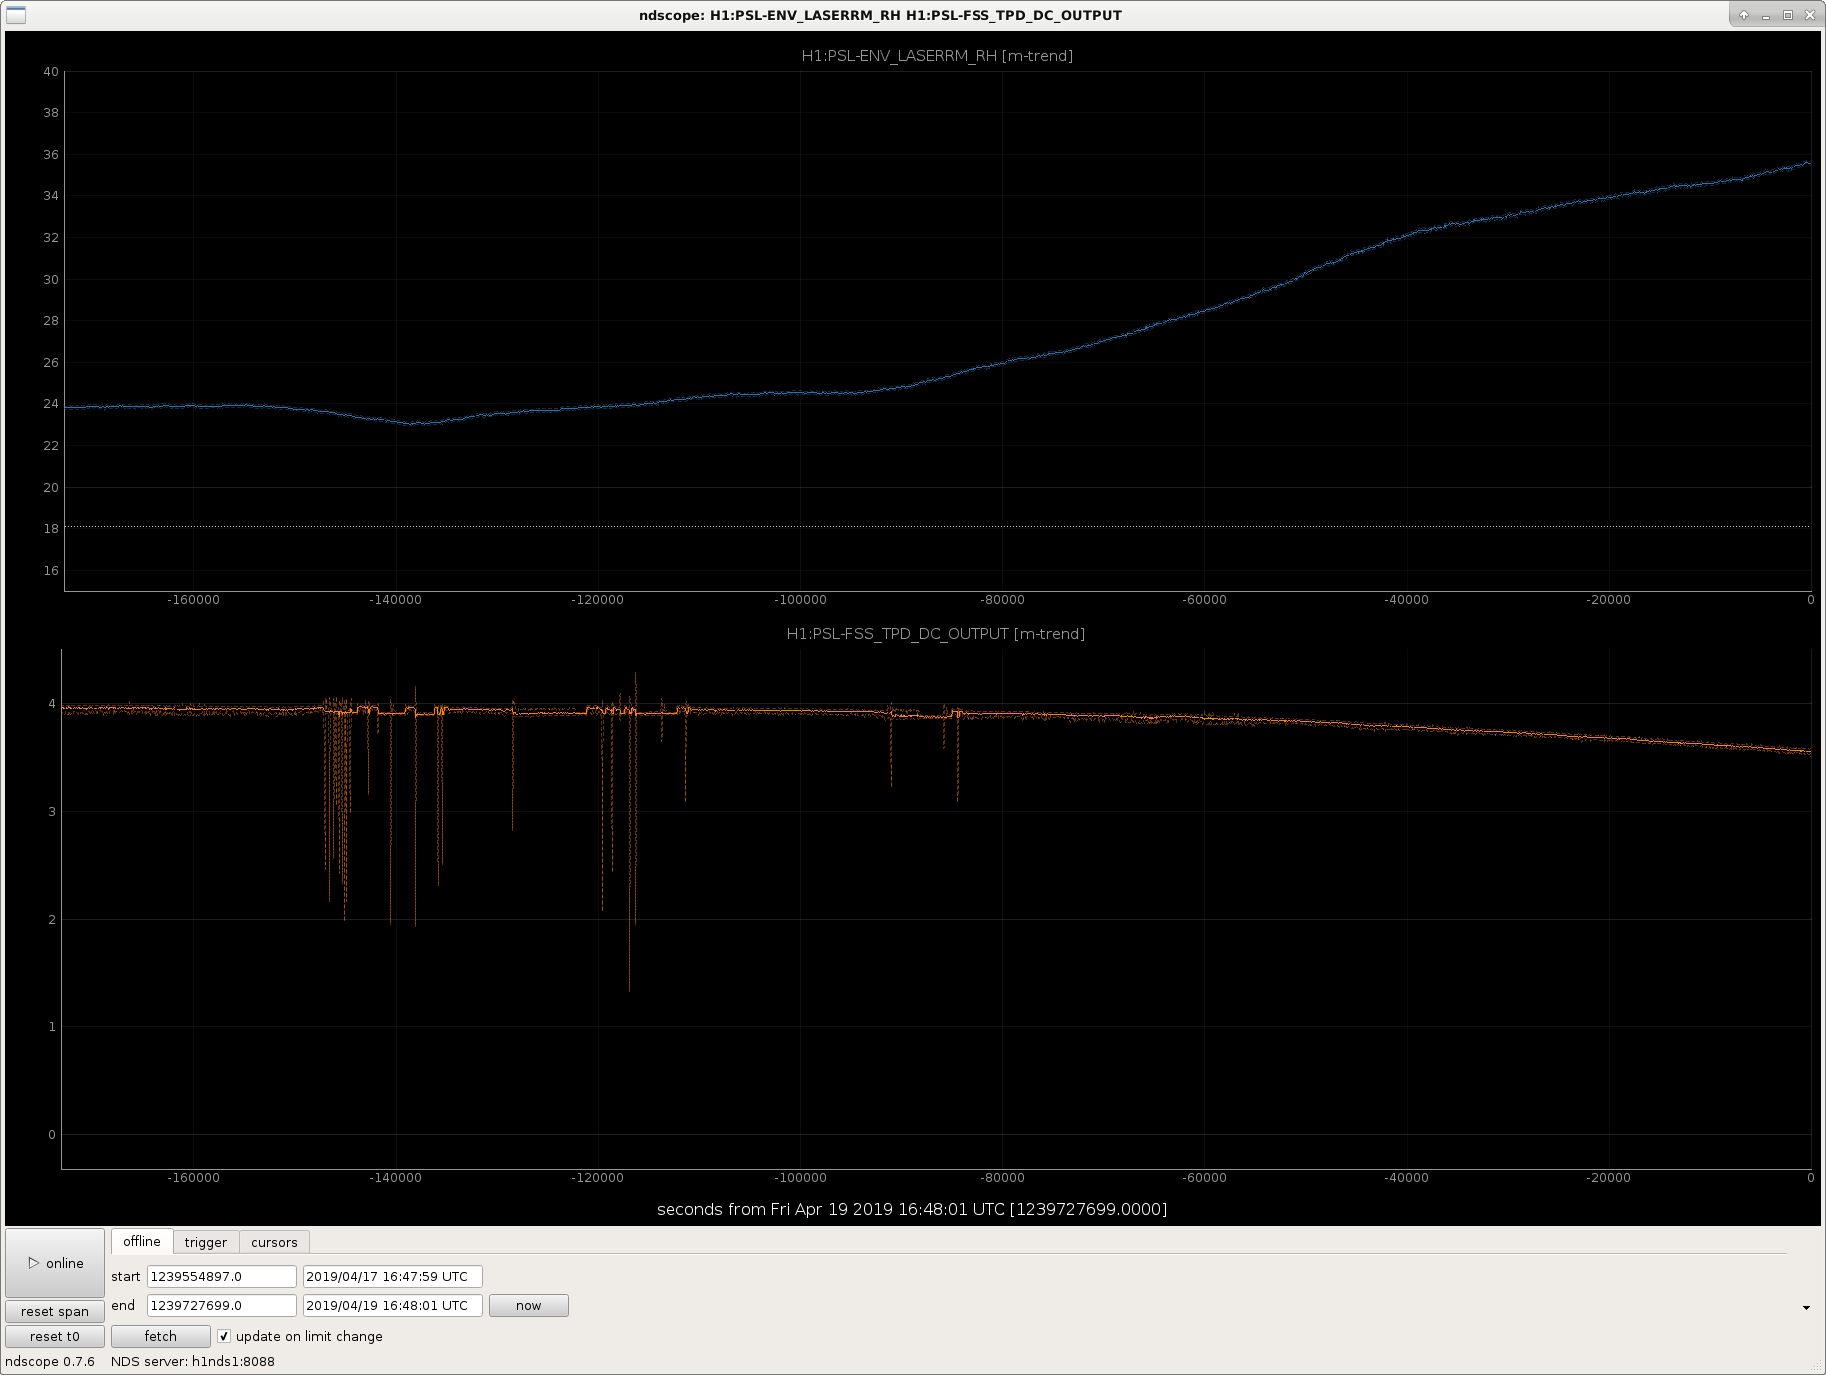
Maybe, there is some correlation between laser/diode room humidity levels and the FSS tpd movement?
I've attached a 10-day minute trend and a 2-day minute trend. On the 2-day trend, it can be seen that the PSL enclosure humidity begins rising at ~15:00 UTC (8:00 PDT) yesterday, 4/18/2019, with no real change in the FSS TPD. Once the humidity gets to ~30%, the FSS RefCav TPD begins to decrease. Conversely, near the start of the 10-day trend it can be seen that the FSS RefCav TPD begins to increase once the enclosure humidity drops below ~30%. Also on the 10-day trend, while the humidity varies between 20% and 30% the FSS RefCav TPD appears to follow the changes, but with some delay. We're continuing to monitor this.
BrianL has been working on new code to make it easier to see when earthquakes are actually arriving on site. I won't go into details of the new code, but the idea is to take the CS STS Z ground velocity and do some more clever band-passing of it to get a better real-time measure of peak velocity in the earthquake frequency band. If anyone is interested, Brian's install document T1900149 gives a more complete story, the approved ECR is E1900108. This morning I installed the part in SEIPROC and it is running now.
The problem with the already existing ground STS BLRMS on the wall FOMs we have been using is that the rise time of the .03-.1hz bandpass filter is on the order of 2 minutes, which means that often the earthquake has passed before we see anything on the wall. This new code should only lag by a few seconds at most. Brian's document covers a few example earthquakes.
I have added some links to the ISI_CONFIG screen to access the filters and some displays for this new code. In the bottom right corner of the ISI_CONFIG screen there are 3 new buttons: the SEISMON overview, a screen that Brian made for this peak ground velocity monitor code and an ndscope template for the eq band peak velocities. The ndscope should be sufficient for most control room uses, and is more flexible than the MEDM.
Having just installed this, I don't have any real guidance yet, but I would expect that when Seismon or verbal gives notification of an incoming earthquake, it would be useful to have the ndscope up to see if this peak velocity monitor gives better early warning of the earthquake than, say, IFO control signals.
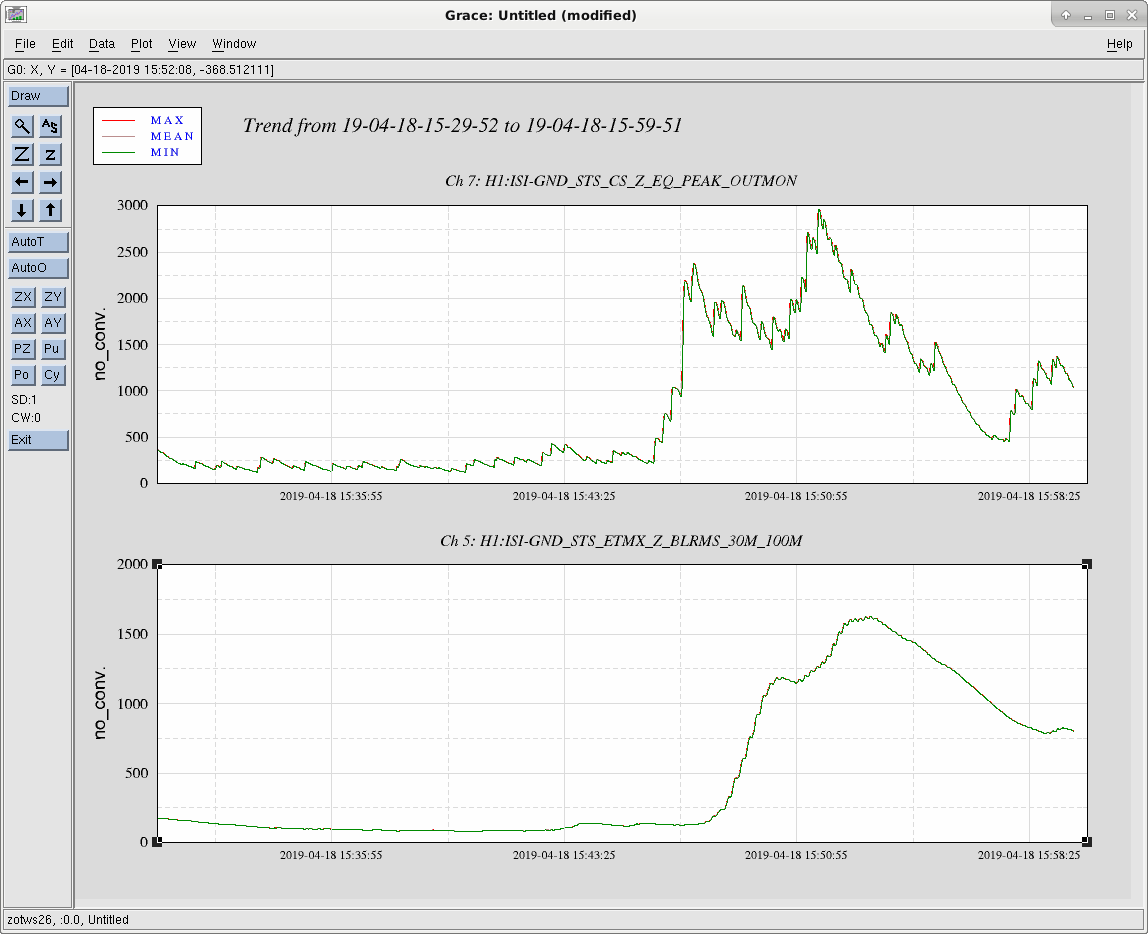
This is a comparison between the eq band blrms and the new eq velocity monitor for the 6.5 from "Australia" yesterday. The new monitor gives a better indication that the earthquake is actually starting to shake the site, as it starts moving up about 2 minutes before the blrms really shows any difference. It would be worth comparing this to some IFO channels,. but I think Jeff had already switched SEI_CONF at this point, so things were already noisier.
[Sheila, Jenne]
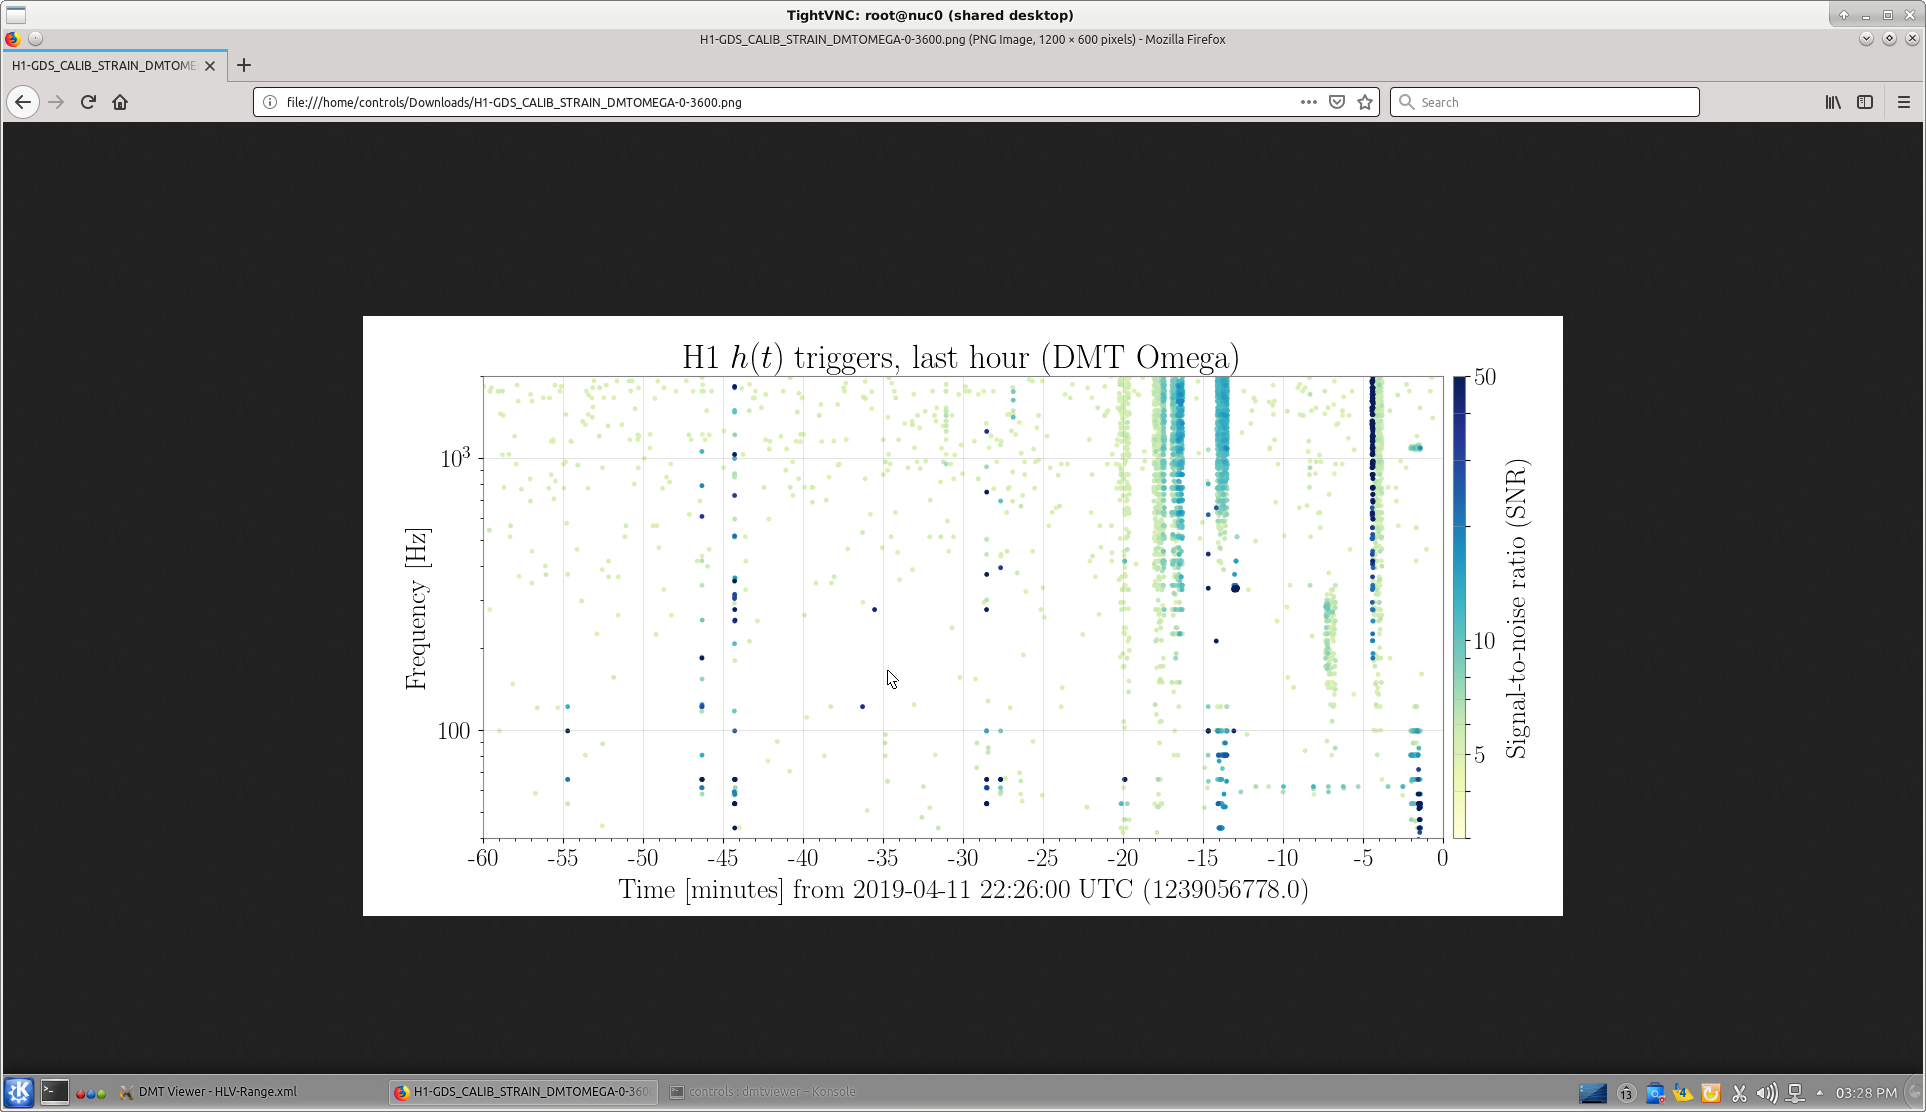
Usually when we are doing calibration-type measurements, we go to our NLN_CAL_MEAS state, which turns off the calibration lines as well as the ADS lines and loops. Sheila had noted in the past that when we go to this state, our 60 Hz glitches seem to go away. That was again true today.
I wanted to look at some calibration things while Sheila was doing her measurements, so I took us back to NomLowNoise (which turned all the lines back on) then I hand-turned off the ADS lines and loops. With this situation (cal lines on, ADS lines off) we see our little train of 60Hz glitches. We don't know right now which line is causing them, but this does narrow it down to being related to the cal lines.
In the attached figure, I turned the cal lines back on around -14 min, and you can see the 60Hz glitches present after that time.
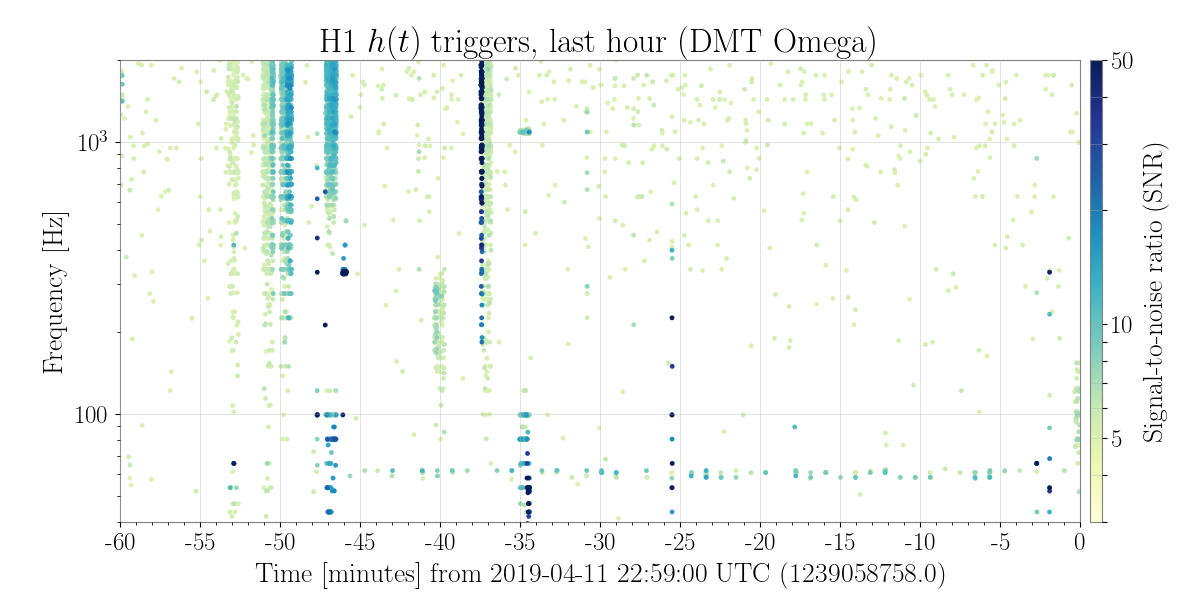
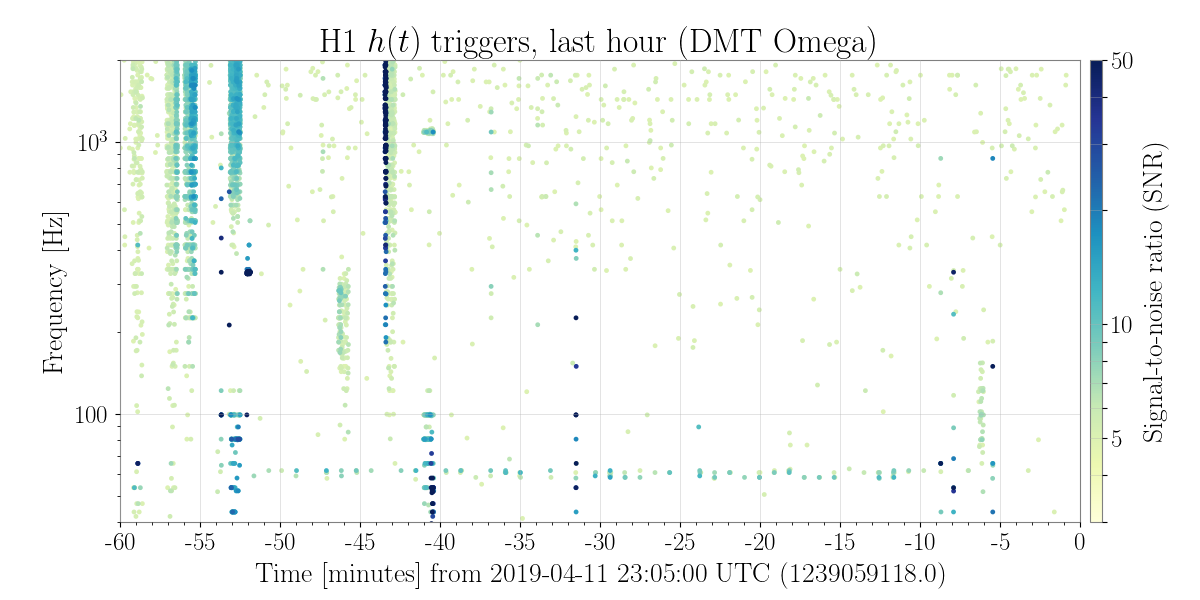
22:40 UTC, turned off PCalX line at 2.5kHz, to see what the 60Hz glitches do. Note that we are still in commissioning mode for scheduled noise budget injections.
With just PcalX off, the glitches are still present. At 22:57 I turned off the PcalY lines.
23:05, turning both PcalX and PcalY lines back on.
With all of the PcalY lines off, the glitches seem to be gone. So, I think this exonerates the suspension calibration lines, and we could in the future try to determine if it is any one specific PcalY line, and decide what to do about it.
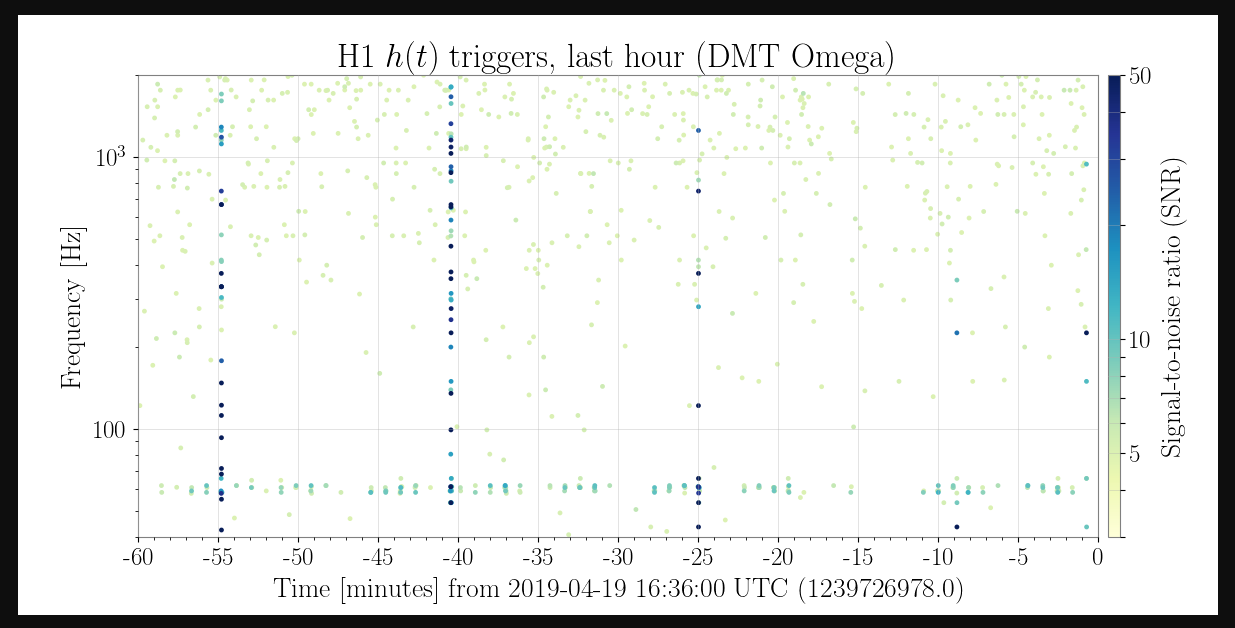
While Jeff B took us out of observing to deal with a violin mode quickly, Jenne and I turned off the excitation for the 7.93 Hz pcal Y line for 4 minutes from 16:21:20 to 16:25:30 UTC April 19th. The glitches around 60Hz seemed to be gone when this was off.
Also, to note, moving the frequencies of lines 1+2 48551 doesn't seem to have had much of an impact on these glitches, you can compare dmt omega plots from the summary pages before and after the change.
I have attached 2 plots which shows the ndscope of the monitor levels and power spectrum (for 2nd harmonics). Mode 13 (1010.30 Hz) was rising for several hours (after Guardian decided to switch off damping), following which Jeff applied damping_on_simple, the excitation level fell off sharply - in the power spectrum plot, one can see the peak droping from 10^-15 m/sqrtHz to 10^-19m/sqrtHz level.