TITLE: 04/17 Eve Shift: 23:00-07:00 UTC (16:00-00:00 PST), all times posted in UTC
STATE of H1: Commissioning
OUTGOING OPERATOR: Jeff
CURRENT ENVIRONMENT:
Wind: 12mph Gusts, 9mph 5min avg
Primary useism: 0.04 μm/s
Secondary useism: 0.31 μm/s
QUICK SUMMARY:
Locked at NLN. PEM injections ongoing.
A follow up on the occasional h1calcs CPU_MAX warnings when the model's processing time exceeds 63uS:
To confirm that when this happens the number of cycles which exceed this value is very small, I have analyzed the cpu histogram information available in the kernel /proc/model-name/status file.
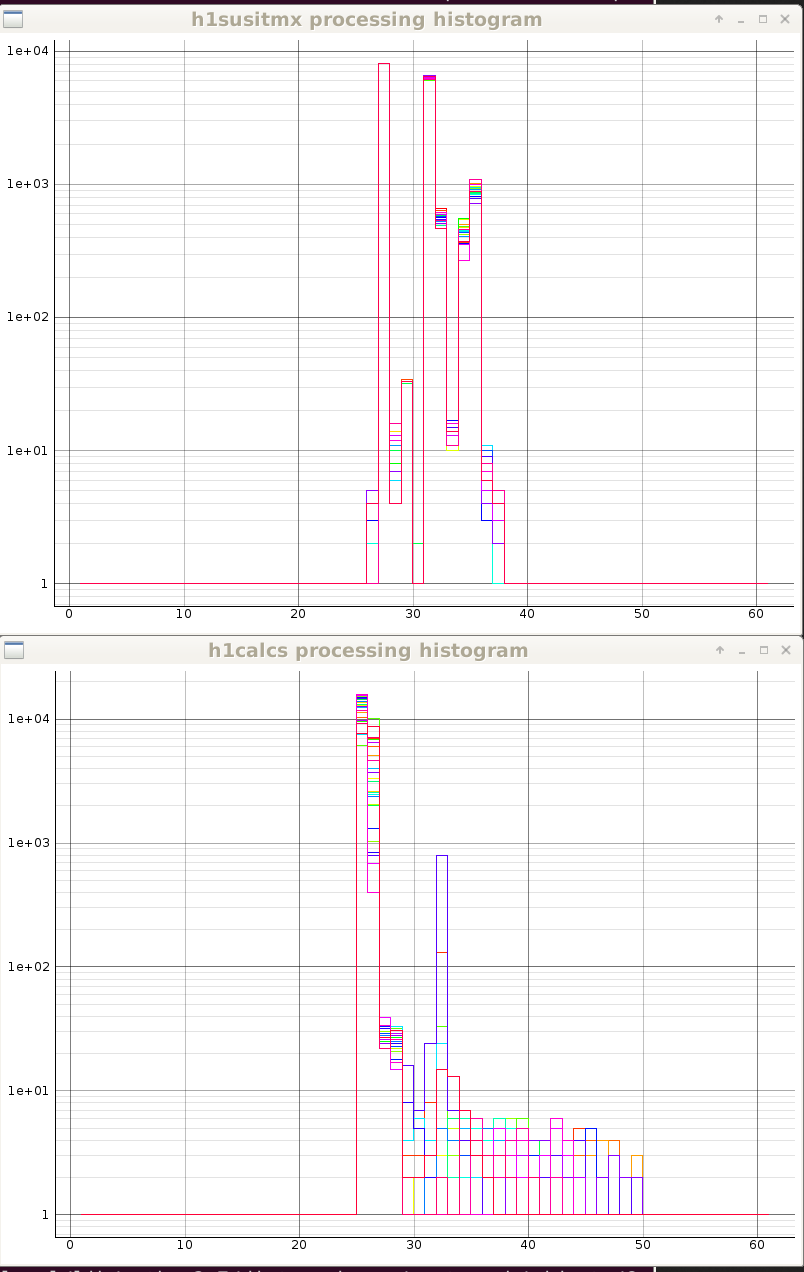
Each model writes a /proc/model-name/status file on the front end computer, the last line of which is a histogram of the cycle-histogram giving cycle processing time and number of cycles with this processing time (only non-zero instances are shown). I have written a pyqtgraph python program to analyze one or more histogram lines and plot them as a graphical histogram. Attached image shows h1calcs (lower histogram, 29 data sets) and for comparison h1susitmx (upper histogram, 21 data sets). Y-axis is number of cycles with the processing time, X-axis is the processing time bins (1uS - 60uS)
The plot shows that h1calcs spends most of its cycles in the 25uS-26uS region, with only one or two cycles in each of the 40+ bins. When CPU_MAX exceeds 62uS we can confidently say that only one or two cycles have exceeded that value out of the 16,384 cycles from that second. This happens about once or twice a week now, my cronjob on h1fescript0 clears the error within a minute.
(Note that the y-axis is logarithmic which necessitated adding one to the count values)
IFO is locked at NLN and Observing for the past 13 hours. Range is around 107.0Mpc. The wind has come a bit since morning and is between 6 to 12mph, with microseism elevated in X and Y. No other issues or concerns at this time.
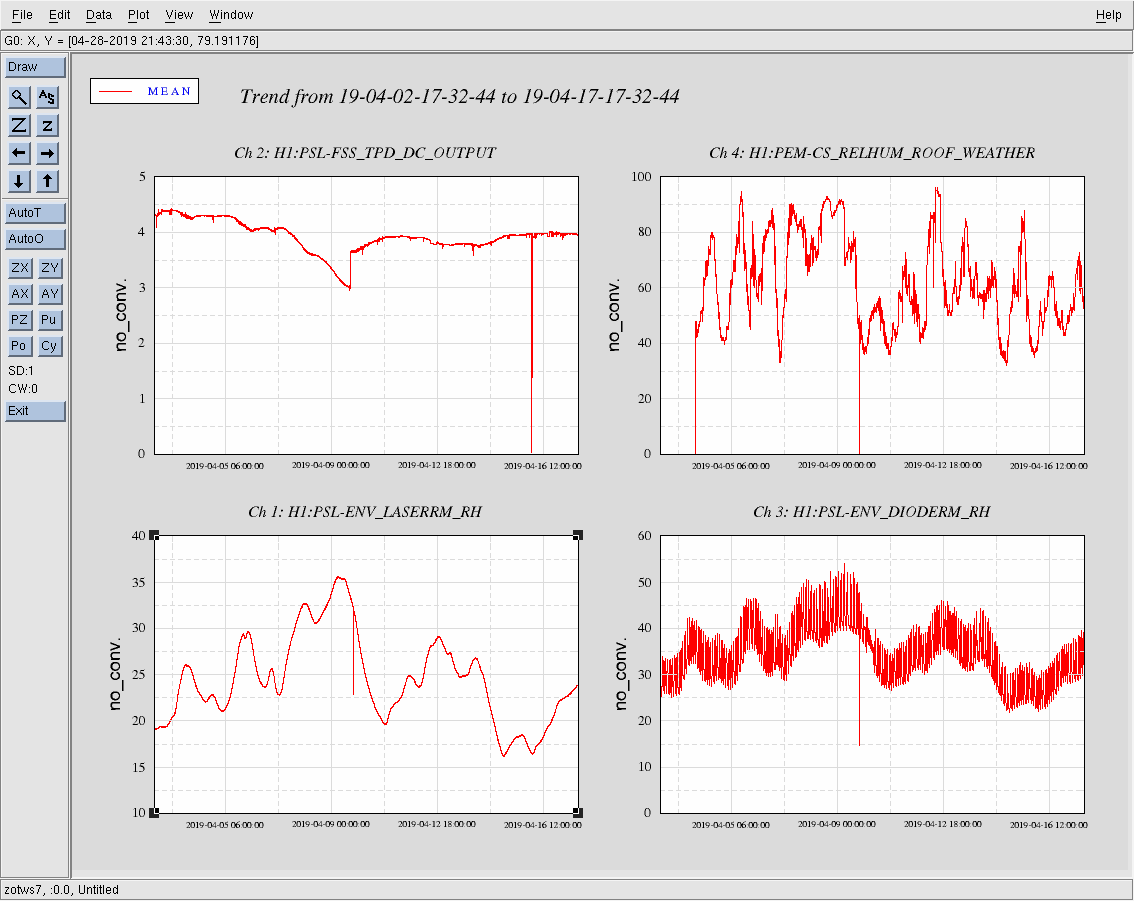
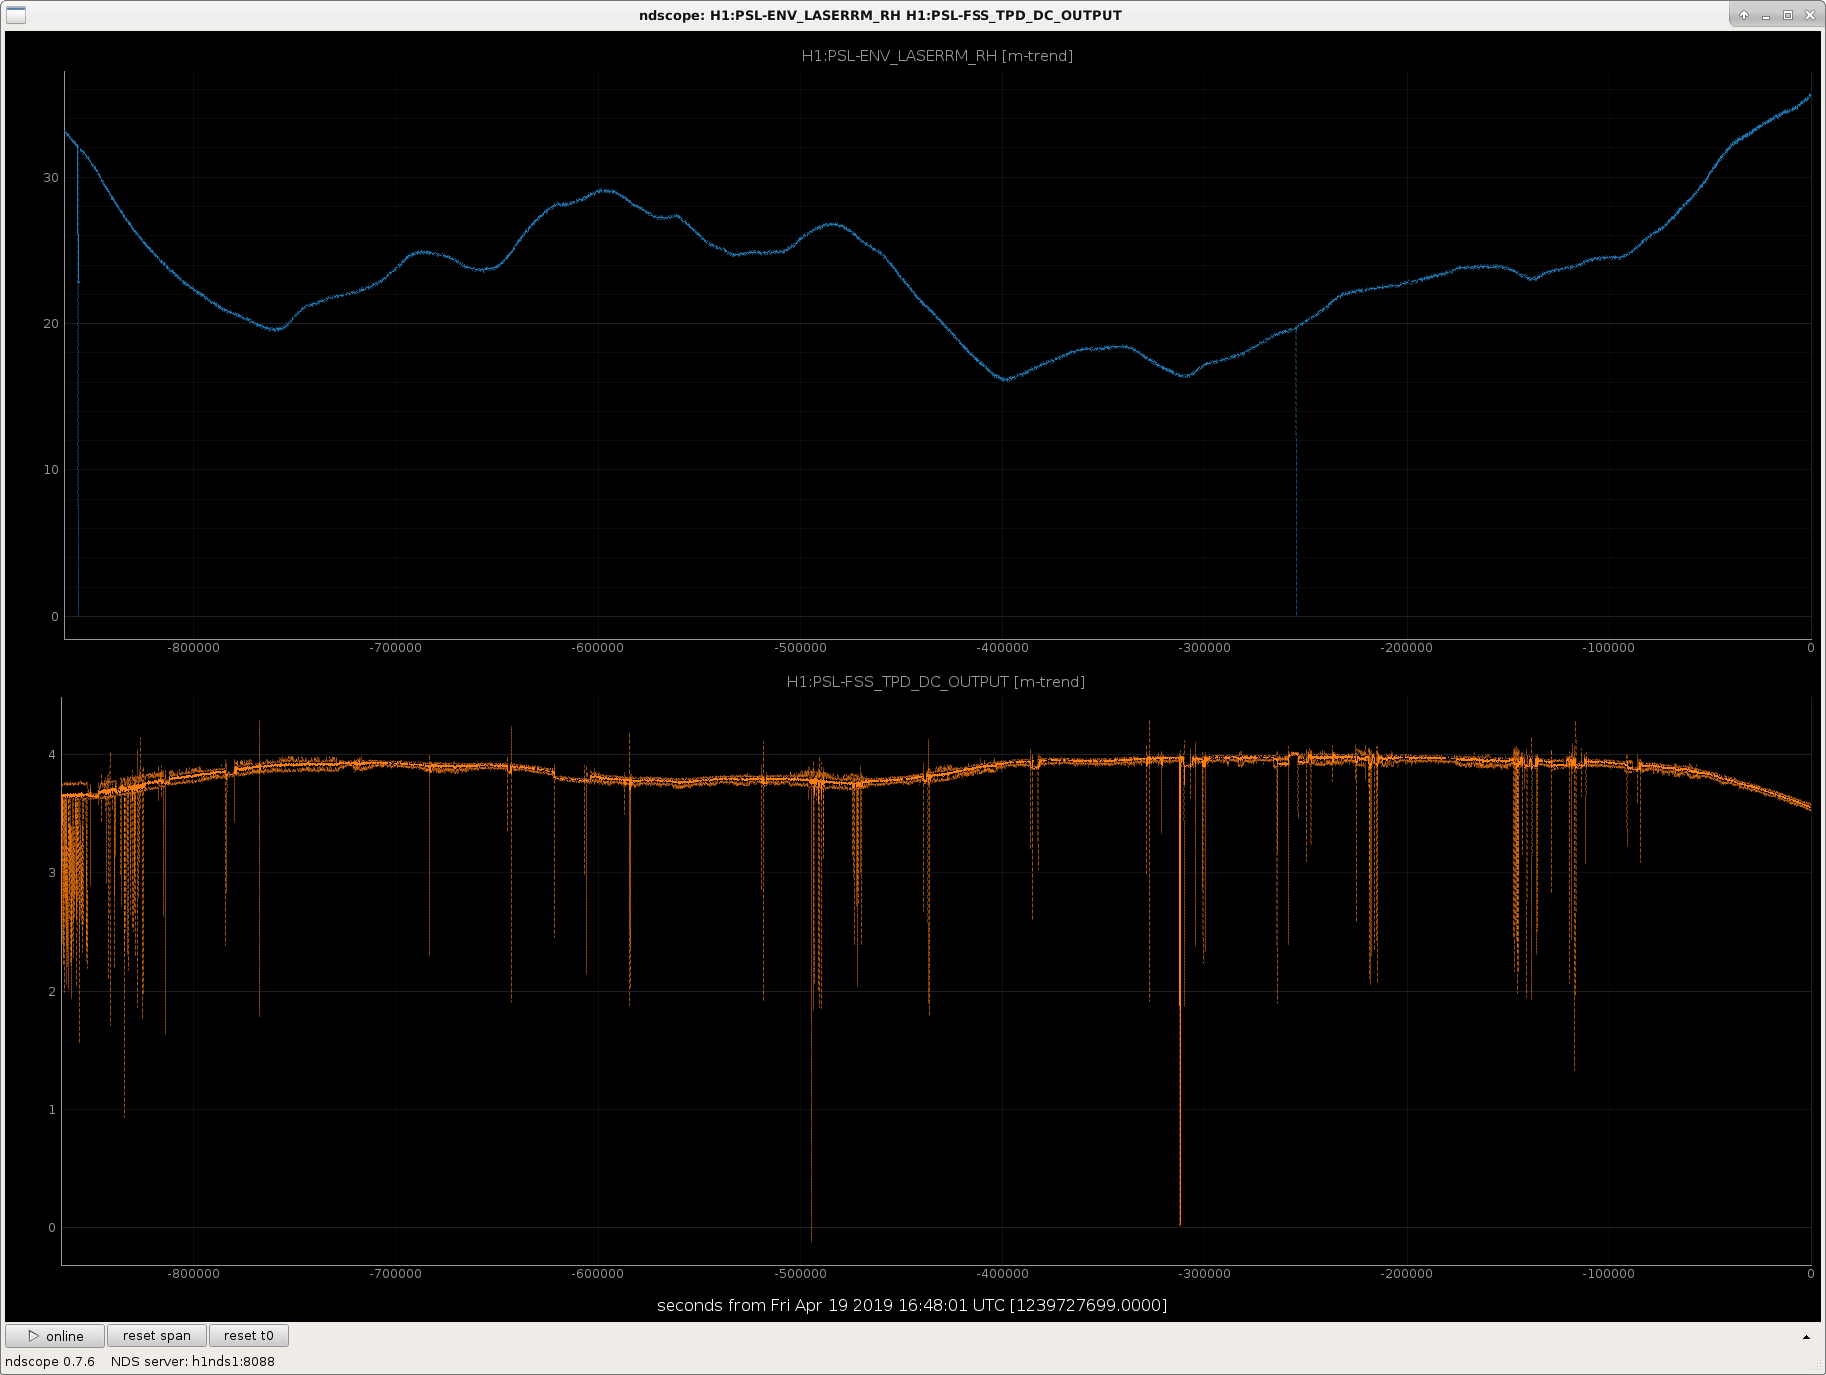
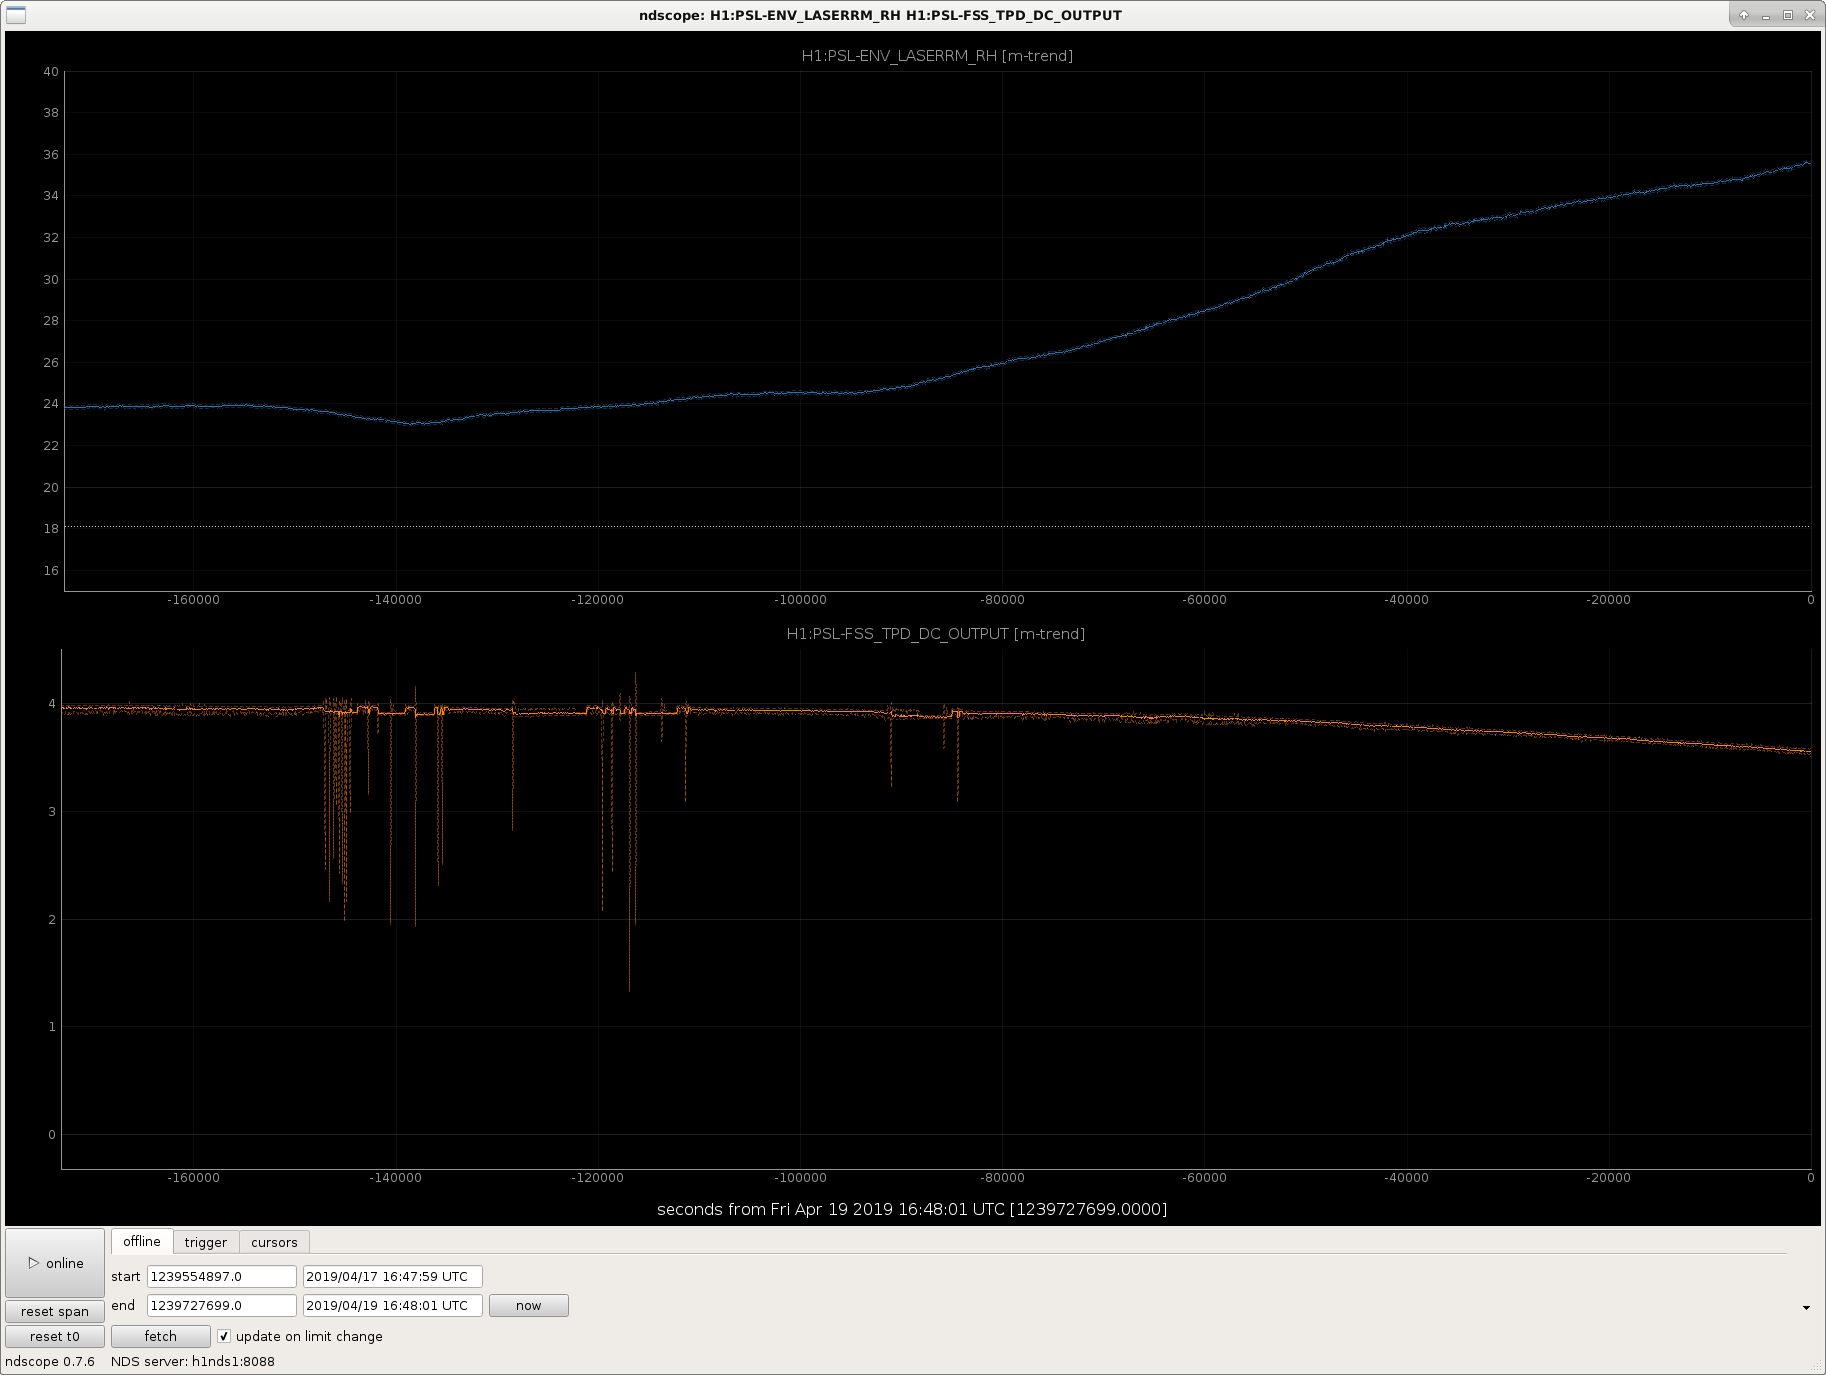
Maybe, there is some correlation between laser/diode room humidity levels and the FSS tpd movement?
I've attached a 10-day minute trend and a 2-day minute trend. On the 2-day trend, it can be seen that the PSL enclosure humidity begins rising at ~15:00 UTC (8:00 PDT) yesterday, 4/18/2019, with no real change in the FSS TPD. Once the humidity gets to ~30%, the FSS RefCav TPD begins to decrease. Conversely, near the start of the 10-day trend it can be seen that the FSS RefCav TPD begins to increase once the enclosure humidity drops below ~30%. Also on the 10-day trend, while the humidity varies between 20% and 30% the FSS RefCav TPD appears to follow the changes, but with some delay. We're continuing to monitor this.
Received permission from the run coordinator for Chris to test run the propane forklift parked just outside the OSB rollup door. At 16:32 (09:32) started the propane forklift. There was strong coupling into DARM around 20Hz to 80Hz, and a drop of about 5.5Mpc,while the forklift was running. The forklift was shutdown at 16:43 (09:43); DARM and the range returned to normal. The conclusion: NO idling or running the propane forklift during Observing. Will update the NOT Acceptable document to exclude operation of the propane forklift.
Tag aLOG for DetChar.
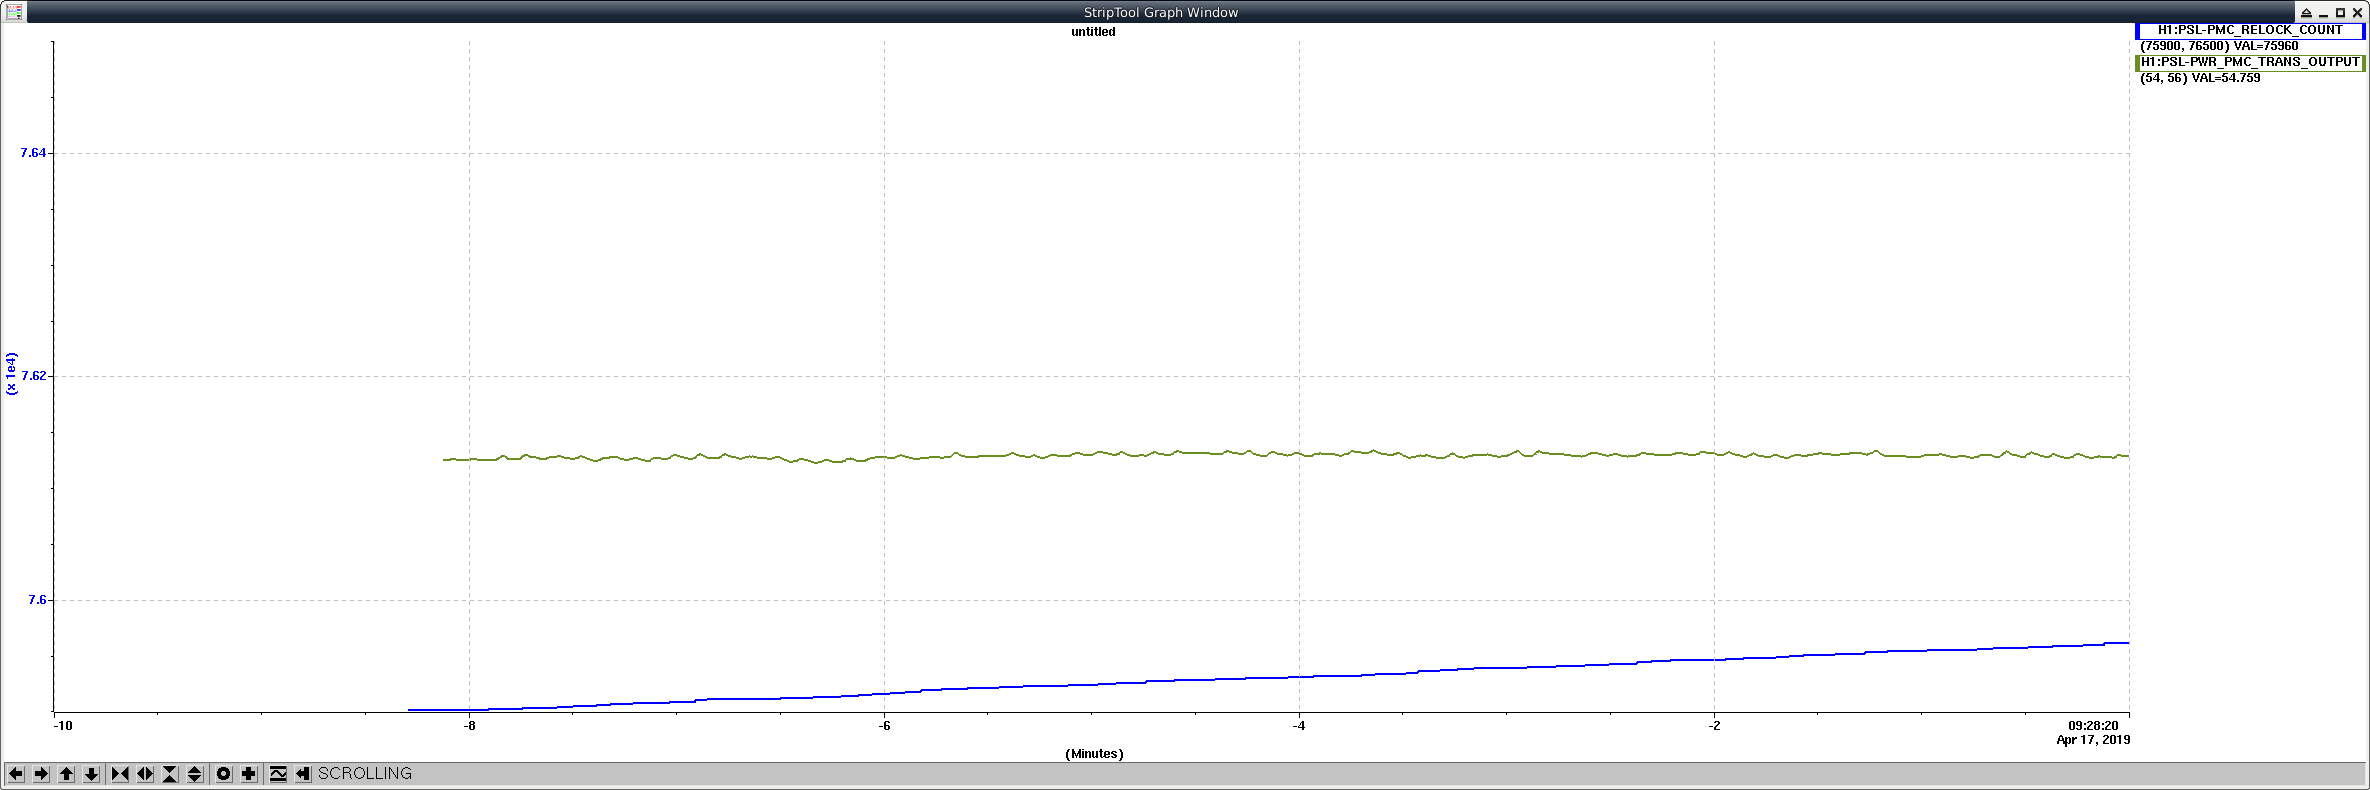
After commenting on the lock durations reported by the PSL weekly script the other day, this morning JeffB and I
happened to be looking at the PMC relock counter and noticed that it was slowly increasing whilst the PMC
seemingly remained locked (see image PMCRelockCounter.png).
I don't know why this would be the case.
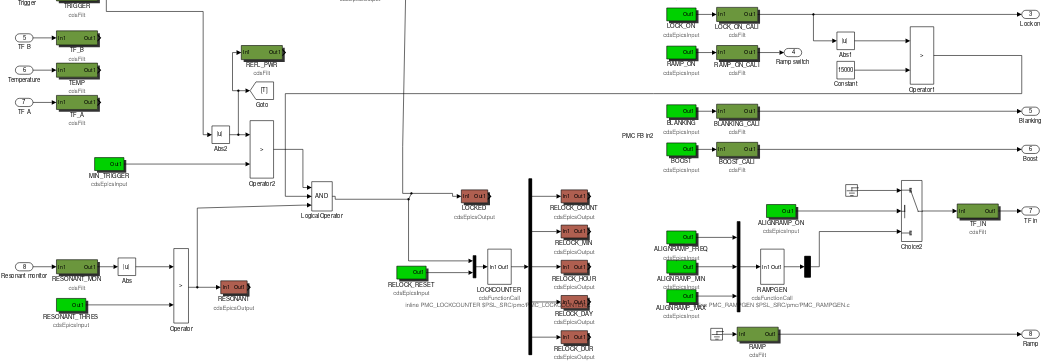
Took a quick look at this. According to the model, the relock counter reads the channel H1:PSL-PMC_LOCKED, which is a logical AND between the channels H1:PSL-PMC_LOCK_ON, H1:PSL-PMC_RESONANT, and the result of a Greater Than operation between the channels H1:PSL-PMC_TRIGGER_OUTPUT and H1:PSL-PMC_TRIGGER_MIN (no channel exists for the output of this operation); see 1st attachment for a picture of the relevant portion of the model.
I fired up both available channels from the AND operation, in addition to H1:PSL-PMC_RELOCK_COUNT and H1:PSL-PMC_LOCKED, in ndscope and watched the real-time data for a bit. H1:PSL-PMC_RELOCK_COUNT was steadily increasing at a rate of approximately 1 increment every 3-10 seconds; there was no change in the other channels. I then added H1:PSL-PMC-TRIGGER-OUTPUT to the plot to see if the relock counter increments were coinciding with a momentary drop of the trigger output causing the Greater Than operation in the model to fail; upon looking at several of the increments, at no point did the trigger output fall below the minimum trigger set point (0.005V). Even when it got close to the min trigger, there was no corresponding increment in the relock counter.
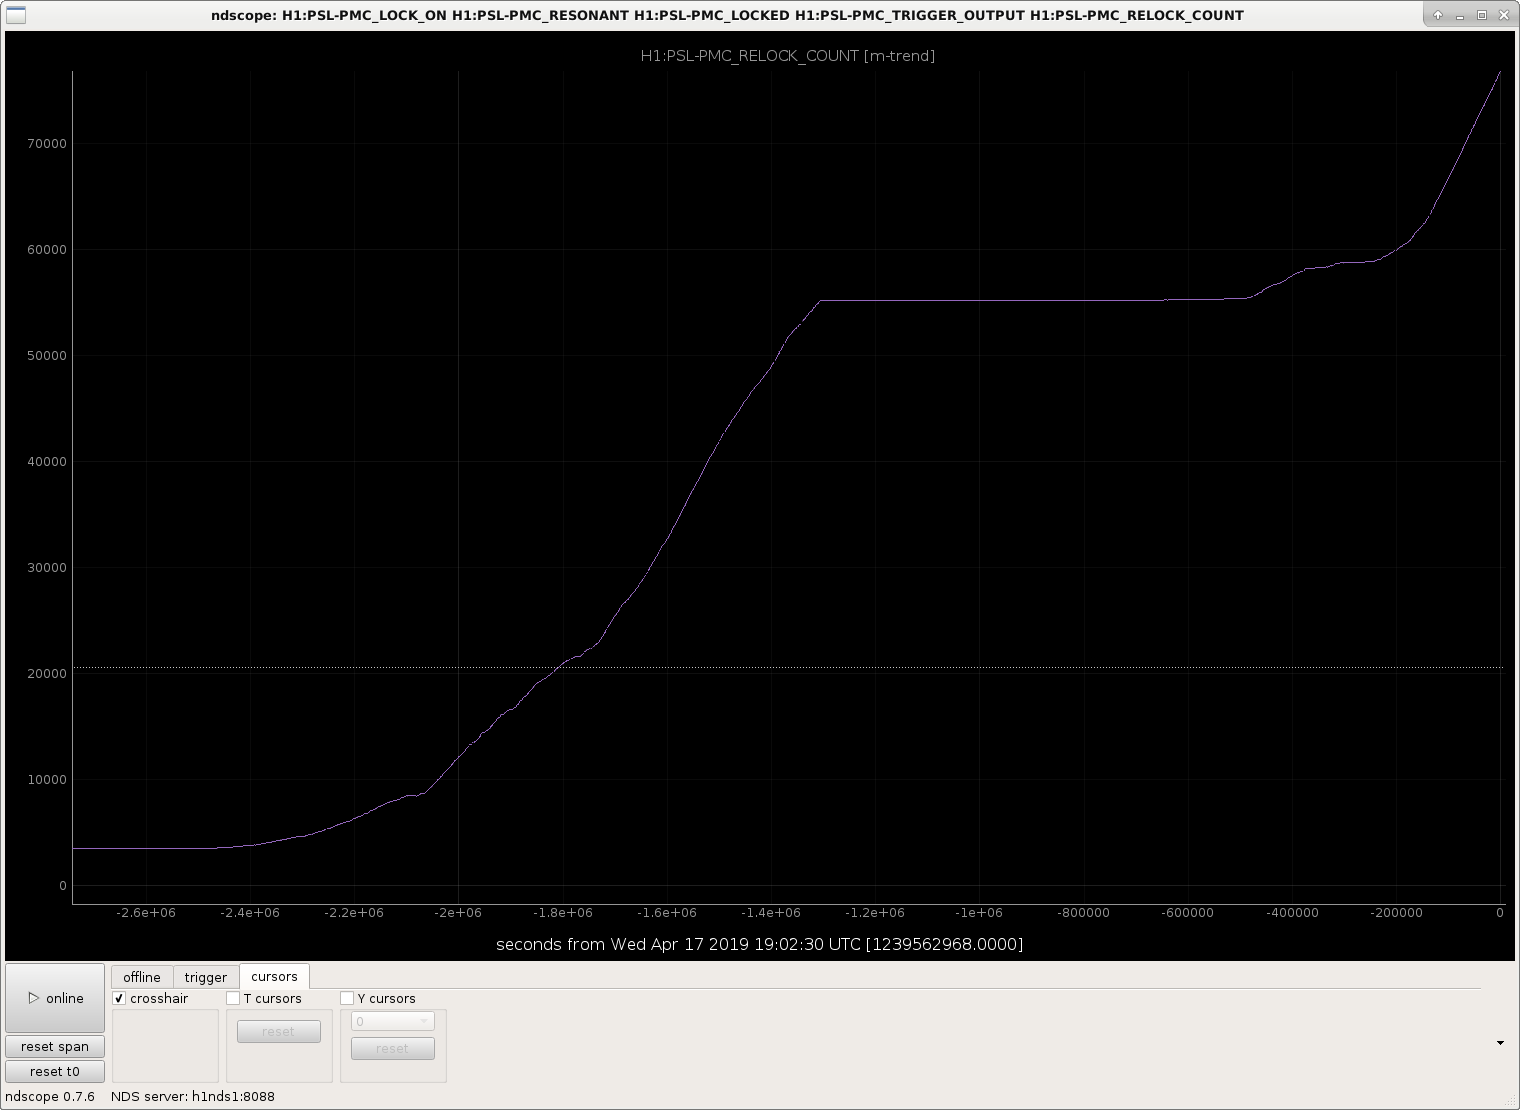
Taking a more long-term look, I took ndscope out to approximately 30 days (see 2nd attachment), and it appears this increase in relock counts began sometime around 2019-03-20. This continued until sometime on 2019-04-02, where the counter increments stopped. The counter stayed relatively flat until 2019-04-12, when it began increasing again; the increments really took off sometime on 2019-04-15 and have been increasing steadily ever since.
So far I have found no reason for the counter to be increasing like this. It may be worth looking at the code that handles the PMC relock counter, PMC_LOCKCOUNTER.c. Investigation continues.
Filed FRS 12753 for this issue.
I took a quick cursory glance at the PMC_LOCKCOUNTER.c code and did not see anything obviously out of place,
although I had some questions which were subsequently answered by both Dave and Jonathan.
Dave later looked at the combination of the front end model and the code. From trend data it was concluded
that the code behaved properly. The question became why was it that the trigger level fell below the minimum
trigger level?
The trigger level is the DC output of the locking photodiode. The minimum trigger level is, typically,
set to be a little lower than the DC level when the PMC is resonant. Currently this is set to a level which
is close to the dark level output of the locking photodiode. This was done to allow changing the overall
loop gain on the PMC servo electronically, via the AD603 variable gain amplifier. The question remains why
is the output of the photodiode varying, and my guess is that the output offset voltage is varying due to
either fluctuations in temperature or scattered light level. A number of the changes seem to coincide with
an excursion into the PSL Enclosure. The remedy for this would be to increase the light level on the locking
photodiode and reduce the servo gain electronically.
DaveB / Peter
TITLE: 04/17 Owl Shift 07:00 – 15:00 (00:00 -08:00), all times posted in UTC
STATE of H1: Observing
INCOMING OPERATOR: Jeff
SHIFT SUMMARY: Locked at ~109 Mpc when I arrived, stayed locked throughout the night. Got a GRB alert at both sites at 11:08 UTC, aside from that it was a quiet night.
LOG:
07:00 (00:00) Start of shift
11:08 (04:08) GRB Alert E329931
15:00 (08:00) End of shift
Locked at ~109 Mpc for 6 hours. Received GRB alert at both sites at 11:08 UTC.
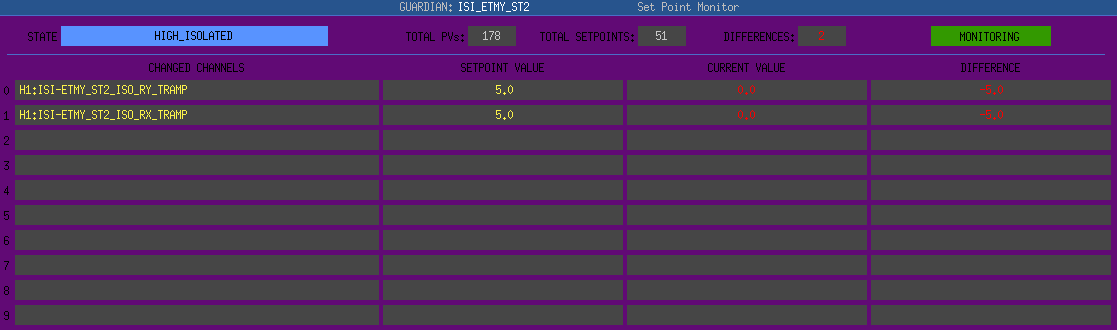
I noticed that the Guardian overview was displaying an SPM diff notification for ISI_ETMY_ST2.
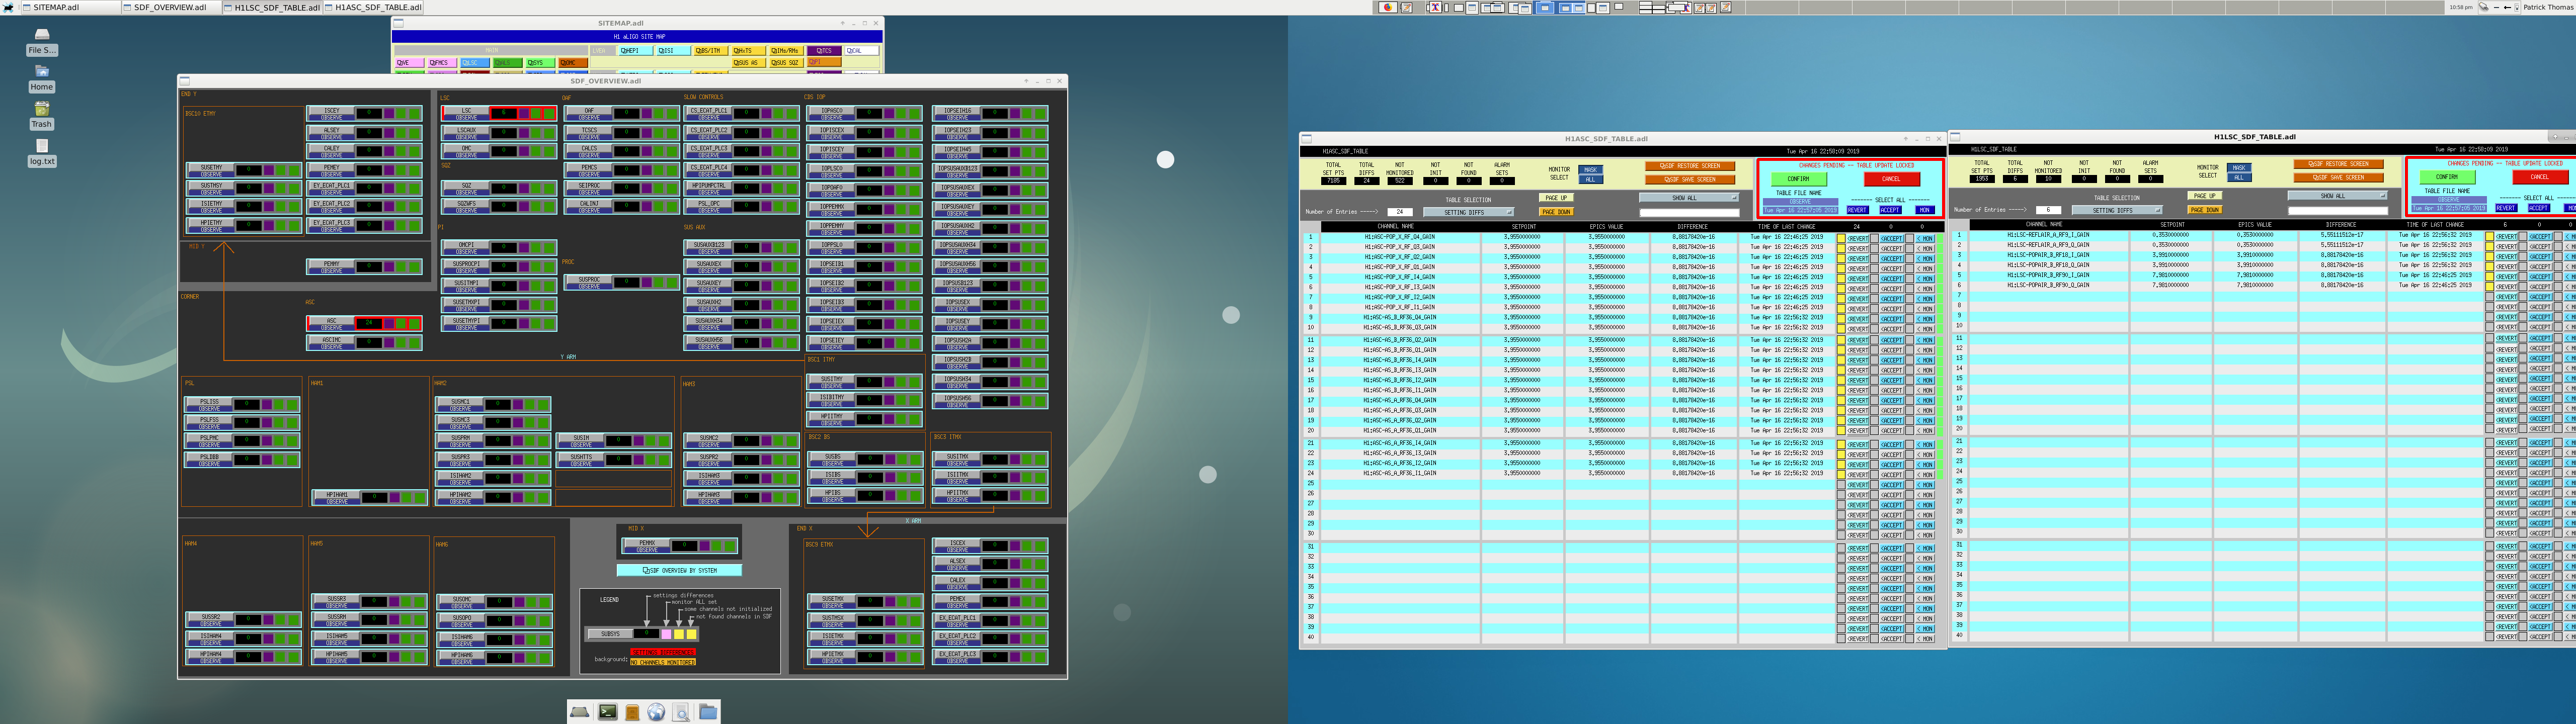
ISI_ETMY_ST2_ISO_RY_TRAMP and ISI_ETMY_ST2_ISO_RX_TRAMP are at 0 while their setpoint value is 5.0 (see attached image for SPM screen).
Ops Shift Transition: 04/17/2019, Owl Shift 07:00 – 15:00 (00:00 -08:00) - UTC (PT)
State of H1: NLN
Intent Bit: Observing
Weather: 10-25 mph wind
Primary 0.03 – 0.1Hz: 0.02 um/s
Secondary 0.1 – 0.3Hz: 0.15 um/s
Outgoing Operator: Patrick
Quick Summary: In Observing for about an hour. Microseism has leveled off.
TITLE: 04/16 Eve Shift: 23:00-07:00 UTC (16:00-00:00 PST), all times posted in UTC STATE of H1: Observing at 106Mpc INCOMING OPERATOR: Niko SHIFT SUMMARY: Another rough night for locking. I could not get to PRC_ALIGN at all in initial alignment, despite being able to lock PRMI in the regular lock sequence with little trouble. I tried twice. I also had quite a lot of trouble locking DRMI, despite stopping at LOCK_PRMI and moving the BS and PRM. LOG: 23:04 UTC Lock loss 23:26 - 23:33 UTC Robert to LVEA to turn on amp 23:50 - 23:55 UTC Sheila to LVEA to check that phone is unplugged 23:51 UTC NLN PEM running injections 00:46 UTC PEM injections done 00:56 UTC Observing 02:14 UTC Lock loss PEM group moving equipment during relocking 03:13 UTC NLN Reverted SDF differences PEM group running excitations 03:38 UTC Lock loss Starting initial alignment 04:26 UTC Can't get PRC to lock. Giving up on rest of initial alignment. 04:46 UTC DRMI not locking, despite locking and improving PRMI. Trying initial alignment again 05:11 UTC Still can't get PRC to lock. 05:15 UTC Giving up on initial alignment again. 05:58 UTC Observing.
The reason that Patrick had trouble locking PRX (for PRC alignment) last night is that I calibrated the REFL A 9I signal inot volts thinking that it was not used anywhere for feedback, but it is used in PRX.
I've changed the gain for PRX in lscparams to compensate for the calibration change I made last night.
Apologies, and thank you to Patrick for following up.
05:58 UTC Reverted attached SDF differences.
Philippe Nguyen, Sharan Banagiri, Robert Schofield
We used time between losses of lock and observation mode this evening to make acoustic injections in the LVEA and acoustic and magnetic injections in the ebay.
Times (UTC): 4/17 00:10 - 00:45, 3:15 - 3:40
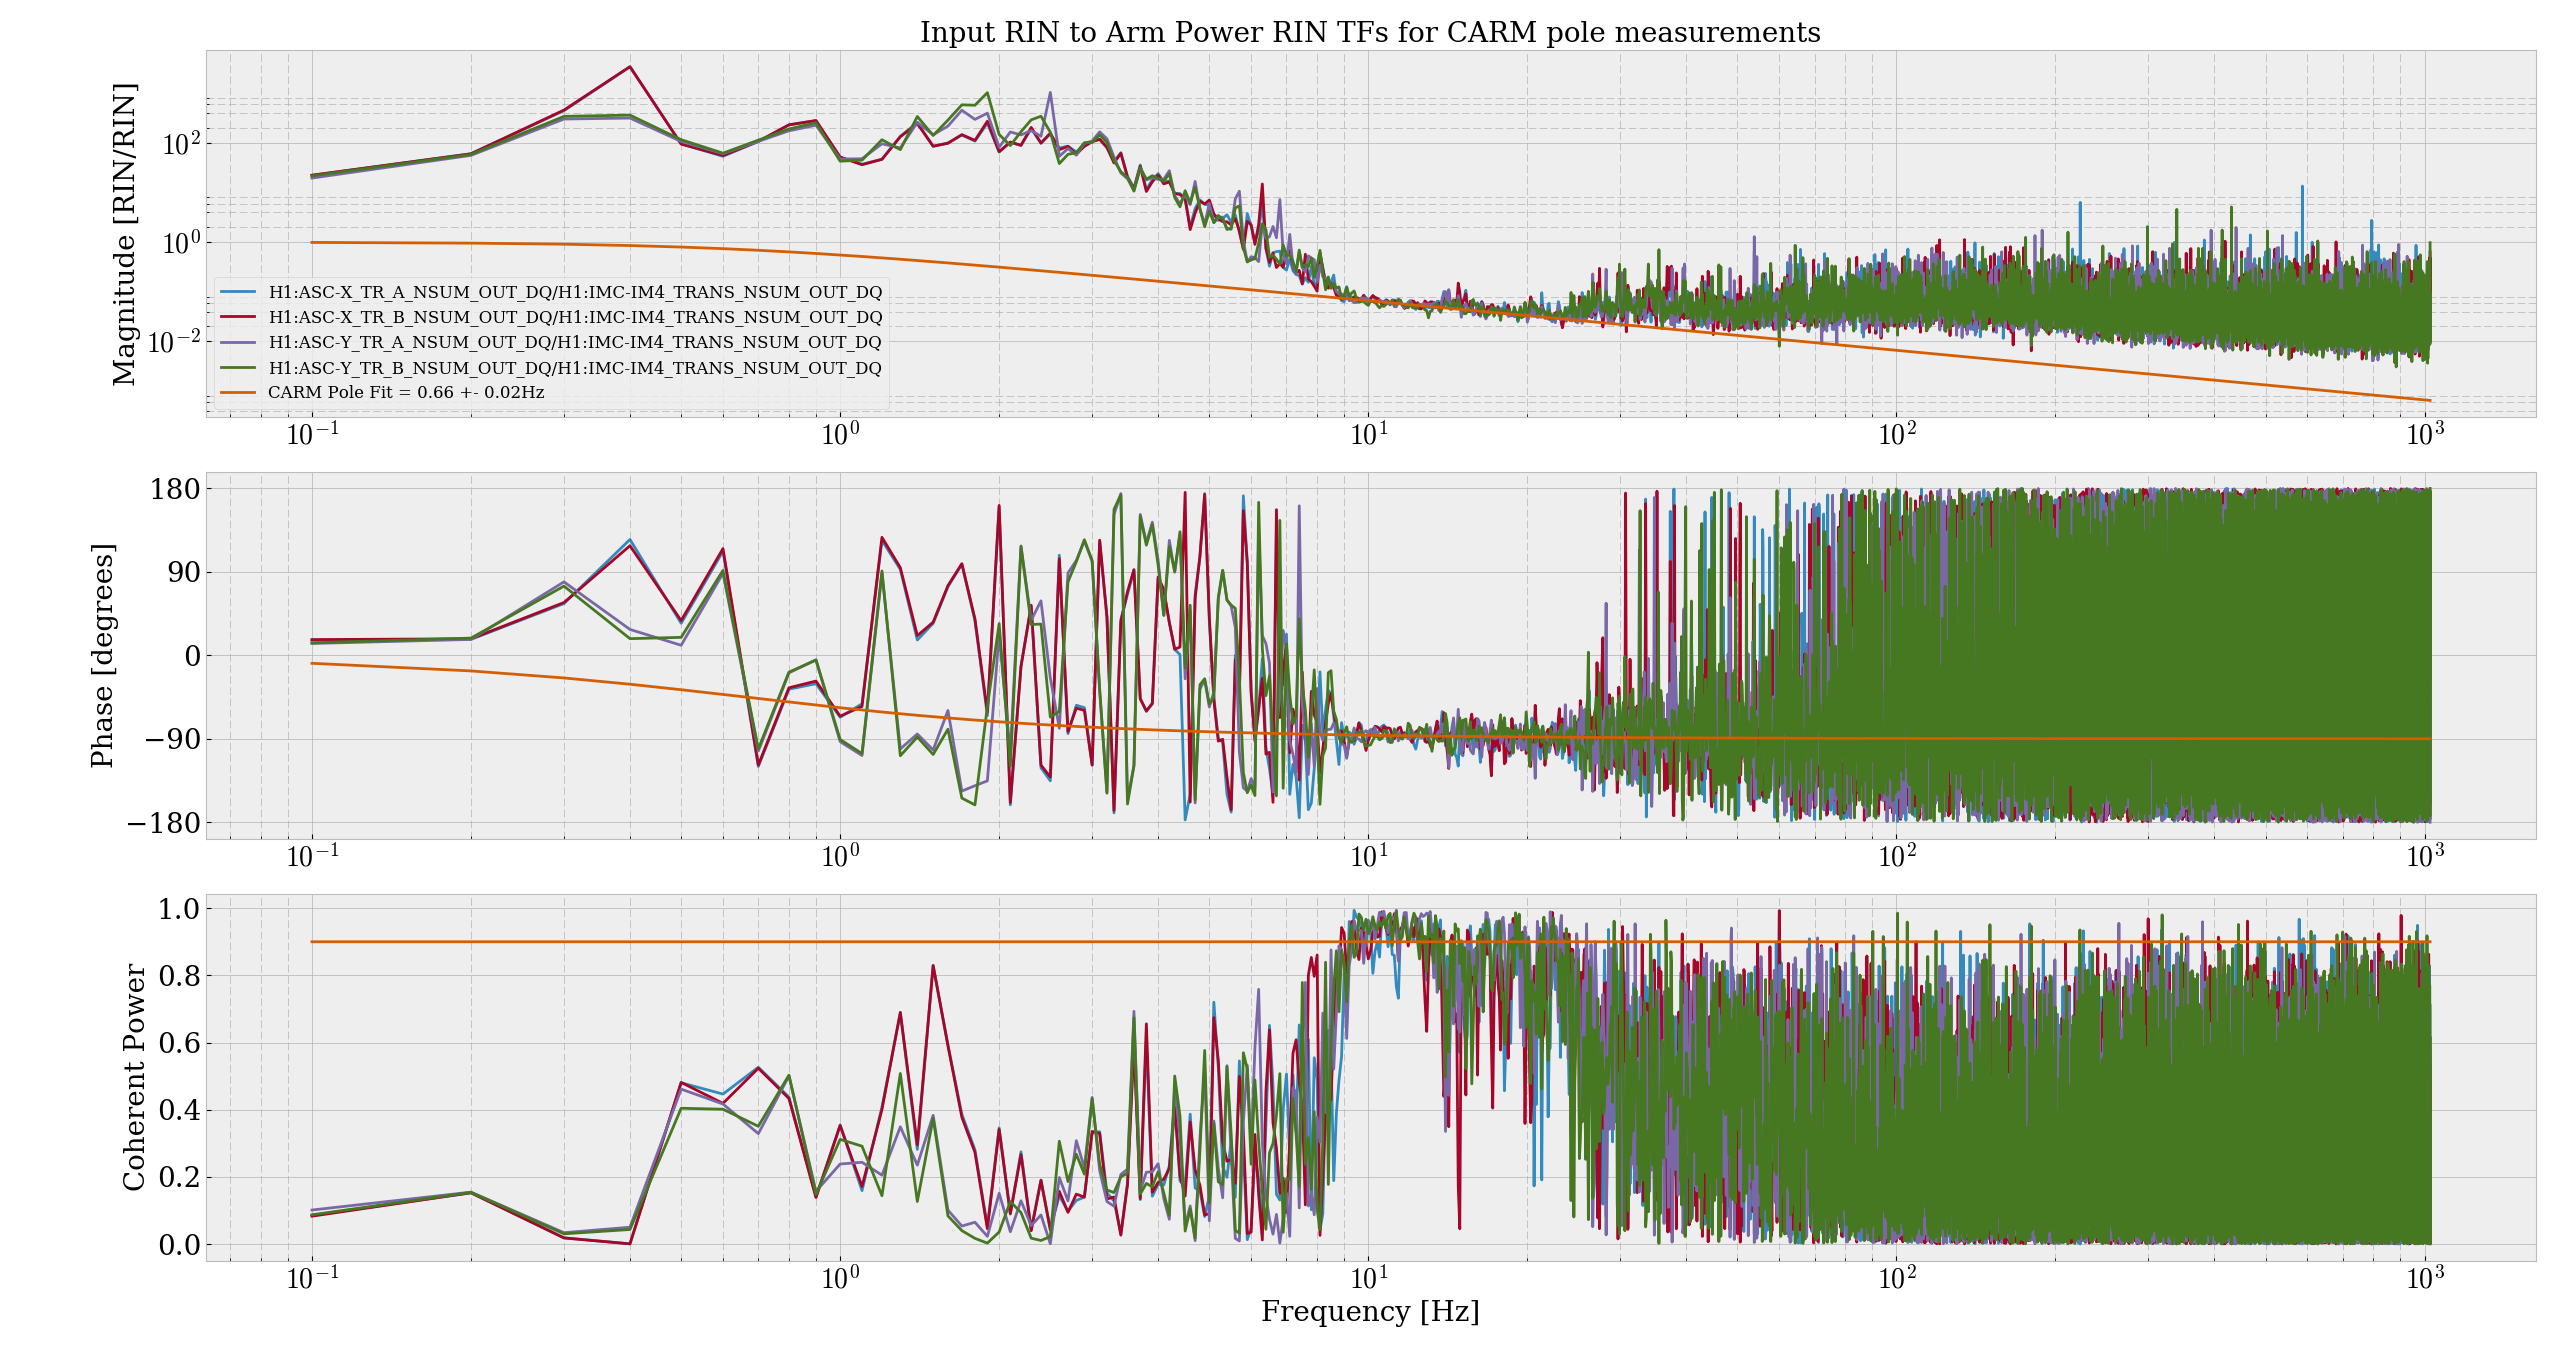
We repeated Evan's old CARM pole measurement via Input RIN to Arm RIN at the time of an intensity noise injection at '11 April 2019 22:09:03 UTC'
CARM pole = 0.66 +-0.02 Hz
I fit only to points with coherence > 0.9. We didn't have great coherence for Arm RIN/Input RIN during this intensity injection, but it was enough to get an idea of the CARM pole.
We will run stronger intensity noise injections in the near future, at that time we can rerun this script which lives at /ligo/home/craig.cahillane/Git/IFO/FrequencyNoise/scripts/CARMpoleMeasurement.py.
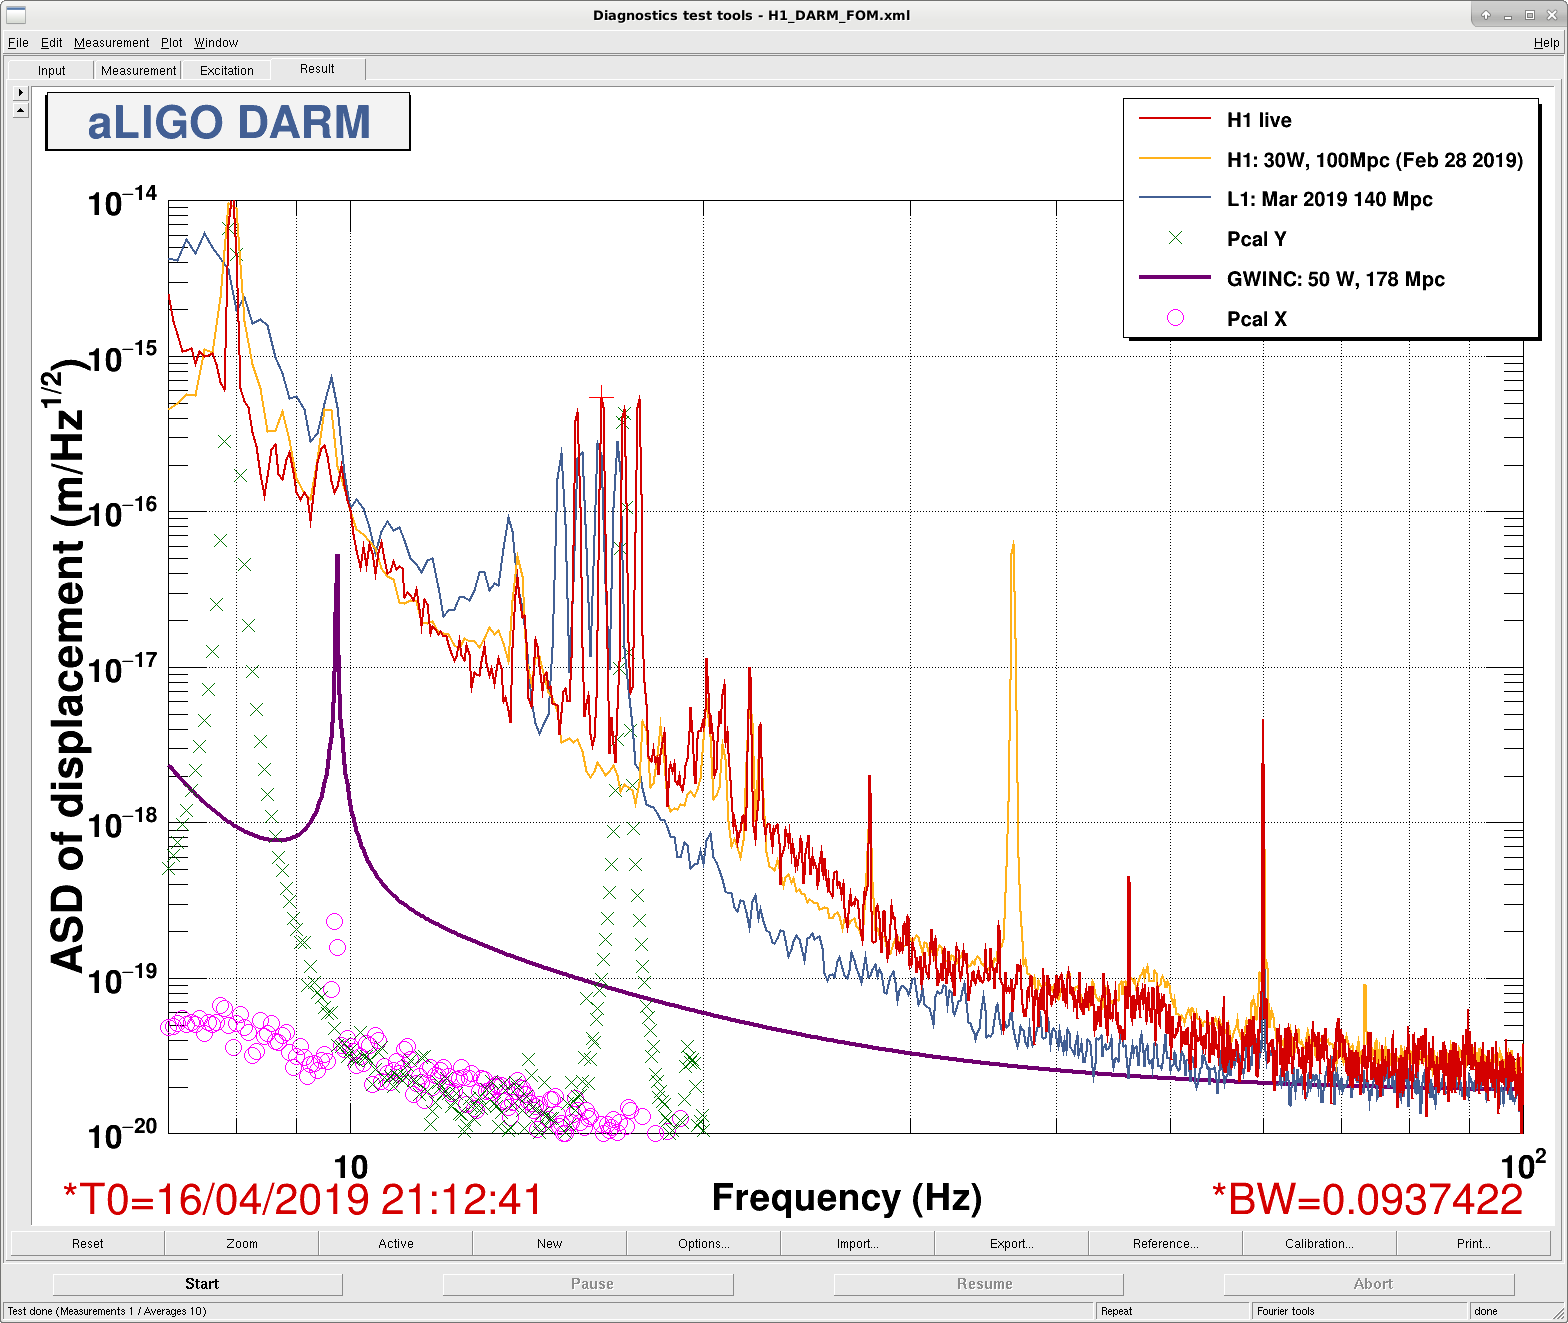
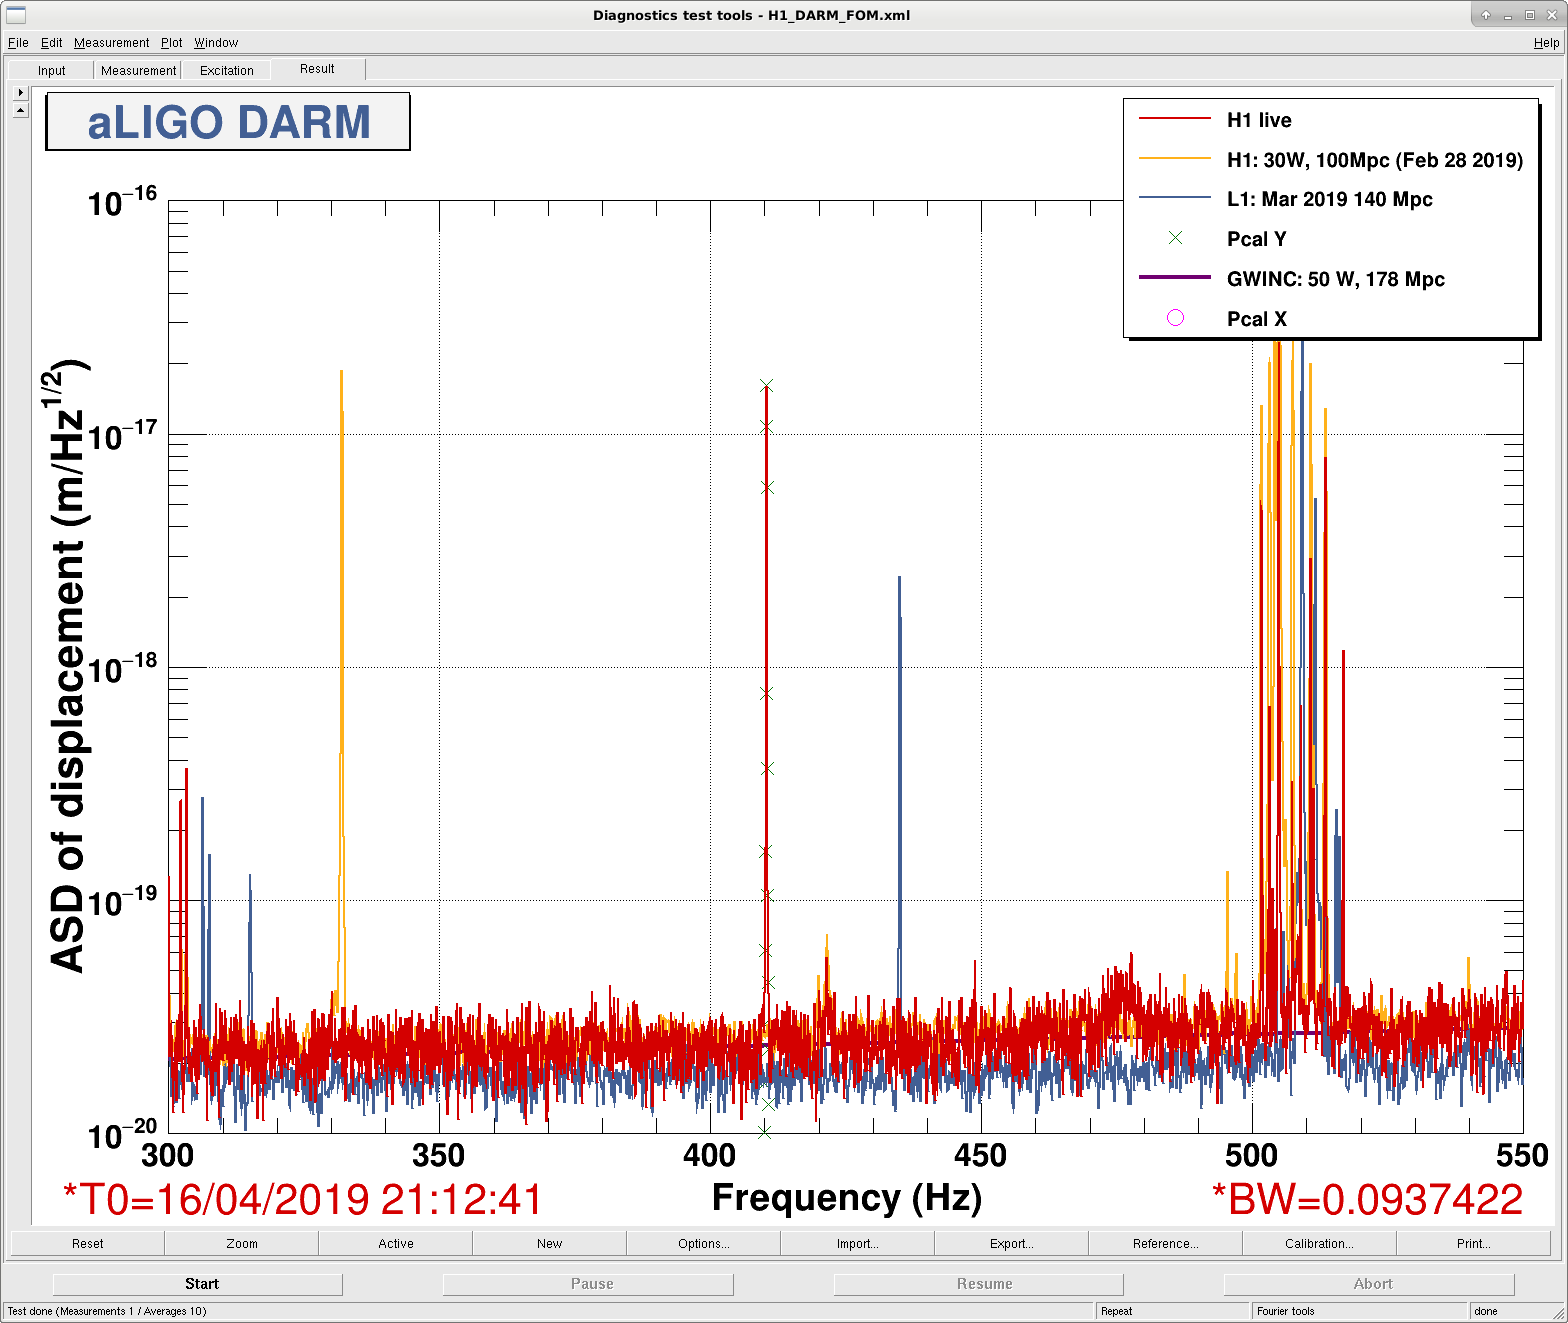
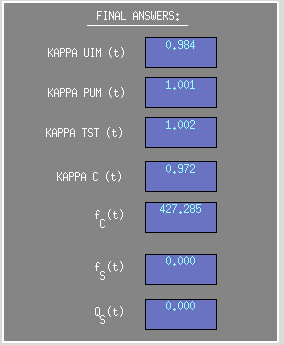
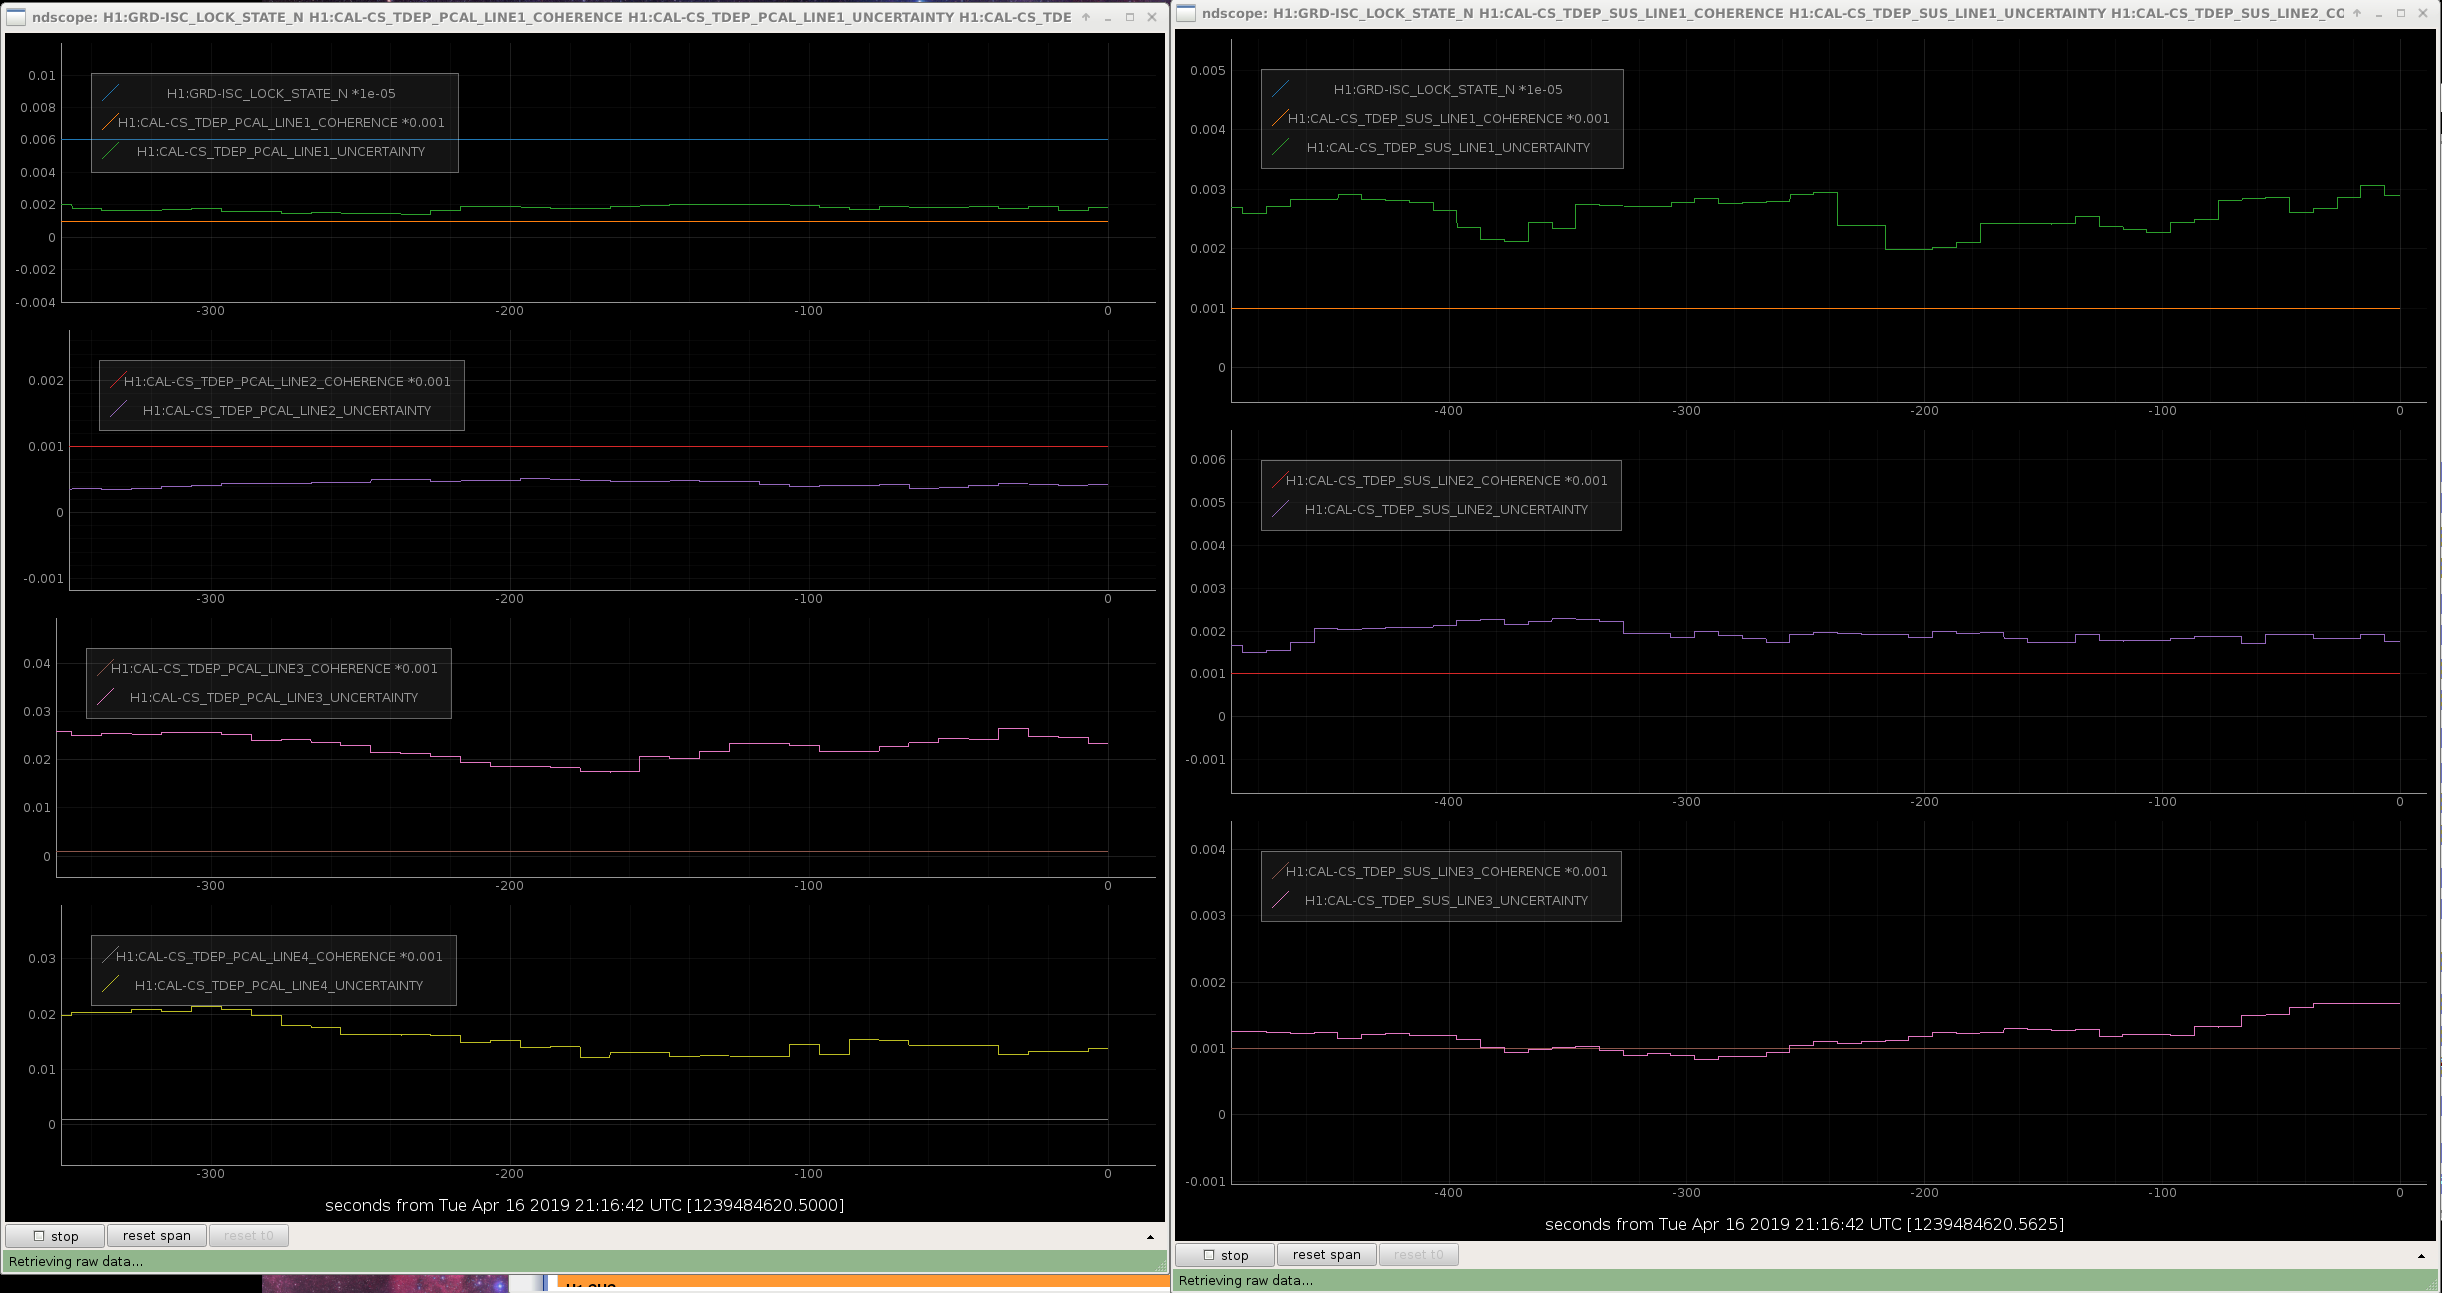
J. Driggers, J. Kissel, A. Viets After a ton of work this morning (see LHO aLOGs 48534, 48530, 48499, 48546, and 48512) - we are now in observation with the newly moved calibration line frequencies, - the interferometer is stable, - the time dependent correction factors calculated from them are reasonable, - the line uncertainties is low, - the GDS-CALIB_STRAIN channel remains corrected for optical gain, cavity pole change, and TST stage actuation strength (but NOT for PUM, UIM, or any optical spring parameters) - the subtraction pipeline has been updated to subtract out these new frequencies. Attached are some relevant screenshots showing the success. - 2019-04-16_H1CALCS_CalibrationLineMove_Success_7to100Hz.png shows the actuator calibration lines at low frequency, now at 15.6 Hz (driven by UIM, L1), 16.4 Hz (driven by PUM, L2), 17.1 Hz (driven by PCALY), and 17.6 Hz (driven by TST, L3) - 2019-04-16_H1CALCS_CalibrationLineMove_Success_300to550Hz.png shows the sensing calibration line, now at 410.3 Hz (driven by PCAL) - 2019-04-16_H1CALCS_CalibrationLineMove_Success_FinalAnswers.png shows the values of the time-dependent correction factors (note that the spring parameters are still bogus) - 2019-04-16_H1CALCS_CalibrationLineMove_Success_Uncertainty.png shows the current levels of uncertainty in the calibration lines. Great work team, and at lightning speed! Later today, while out of observation mode and the PEM team is working on their injections, we intend to further reduce the amplitude of the lines to better compromise uncertainty and noise impact.
[M. Wade, J. Driggers, J. Kissel, A. Viets]
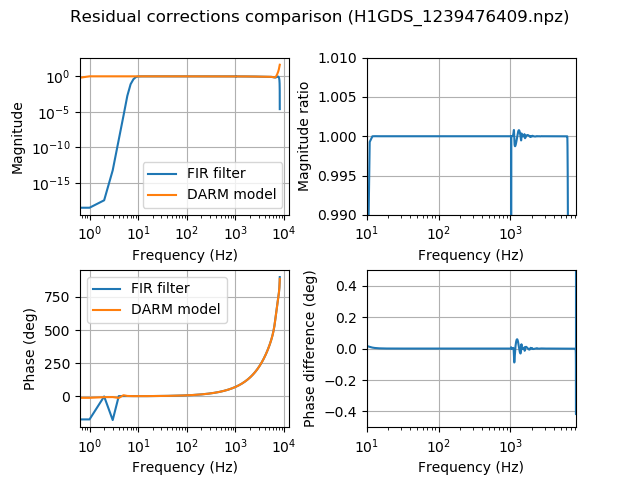
I've produced new filters for the GDS calibration pipeline based on the calibration model made earlier today (see LHO aLOG 48534). The main changes were:
The filters were produced in SVN revision 7252, and can be found here:
aligocalibration/trunk/Runs/O3/GDSFilters/H1GDS_1239476409.npz
They were produced using the script
/ligo/svncommon/CalSVN/aligocalibration/trunk/Runs/O3/H1/Scripts/TDfilters/H1_run_td_filters_1239476409.sh
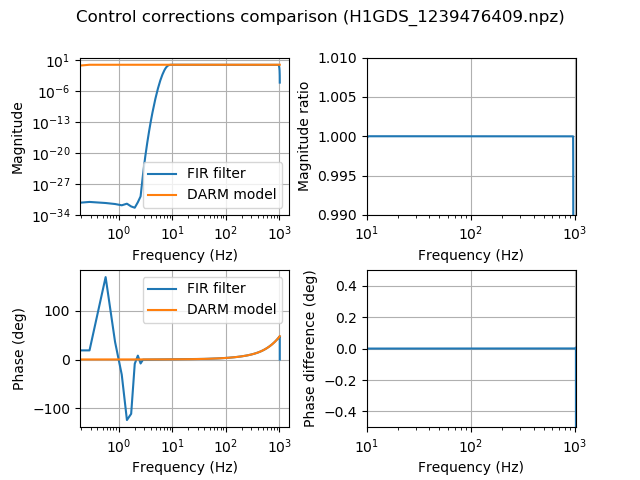
Bode plots of the correction filters for the inverse sensing path and actuation path are attached. They agree with the model to the expected level. More plots will be added soon, once we have some low-noise data after the update to work with.
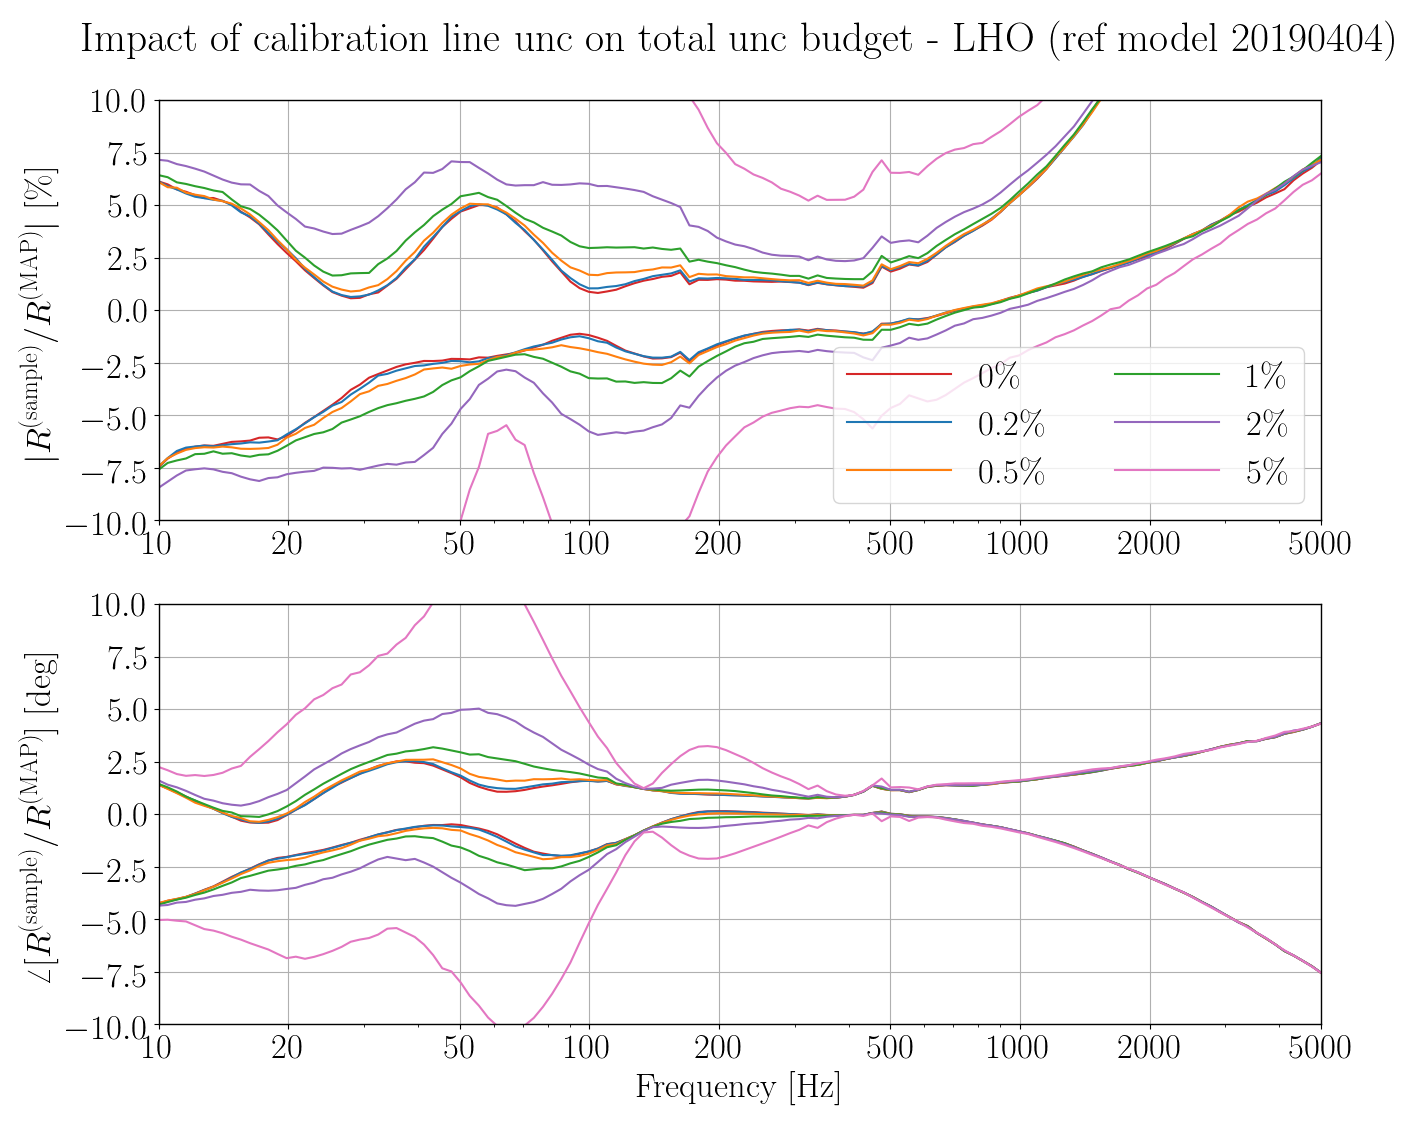
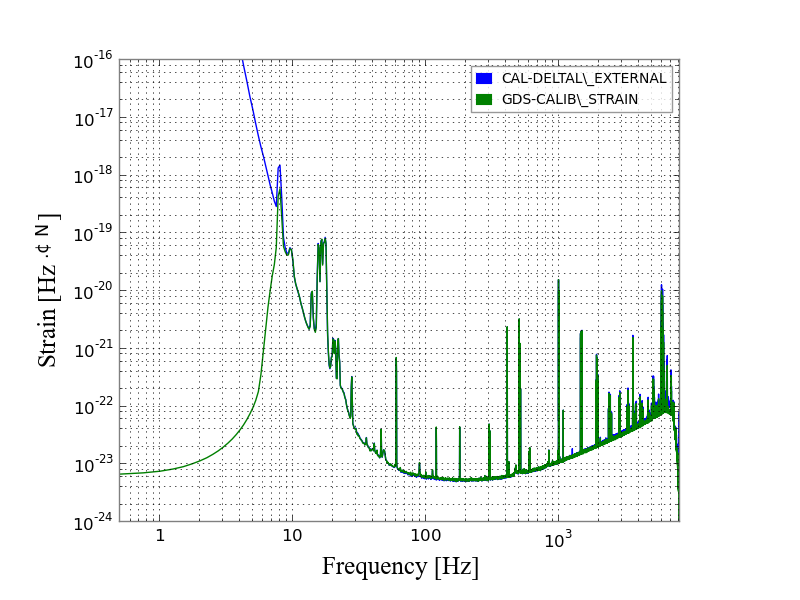
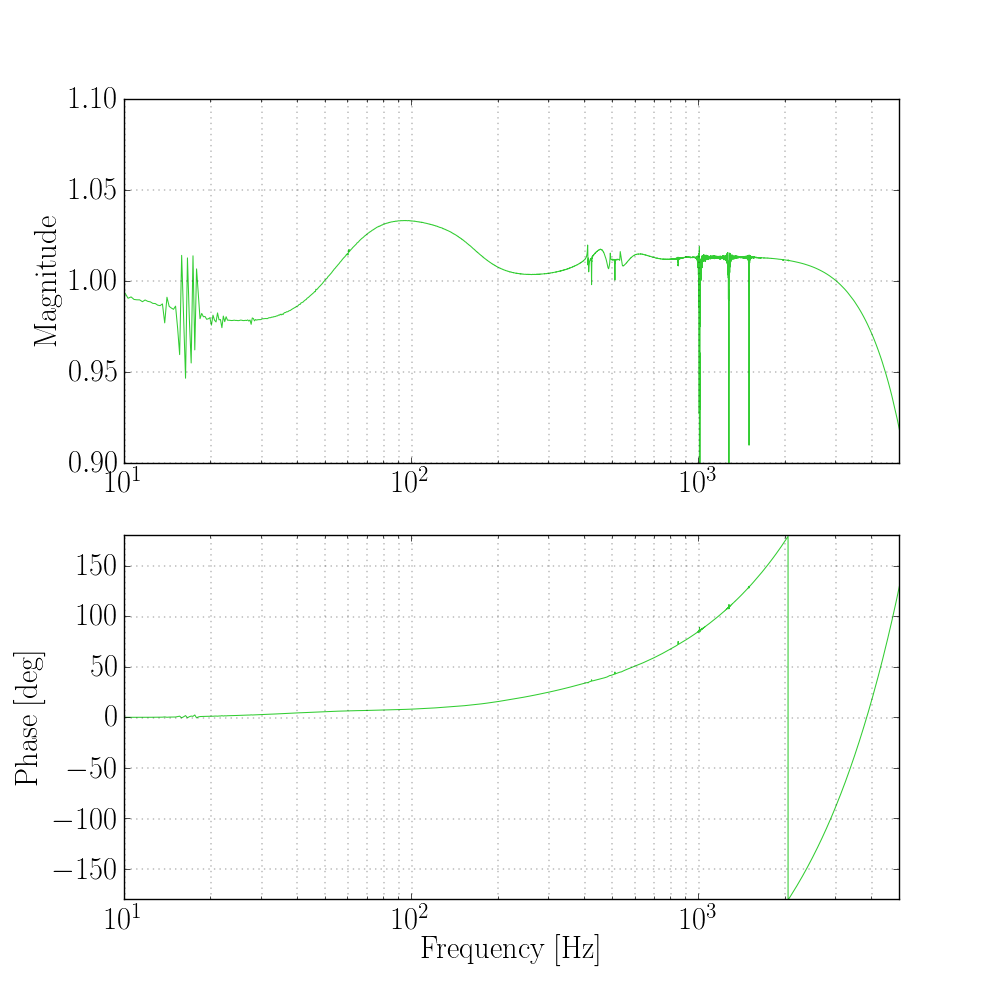
Using data from the first lock stretch after the calibration model and line frequencies were updated, I have made several more diagnostic plots: