Sheila, Dan, Dave:
h1nds1 restarted itself at 20:38 PDT, and again at 21:39 PDT. On the second restart the computer locked up. Dan is resetting via the front panel button.
Danny, Craig, Alexei, Dan
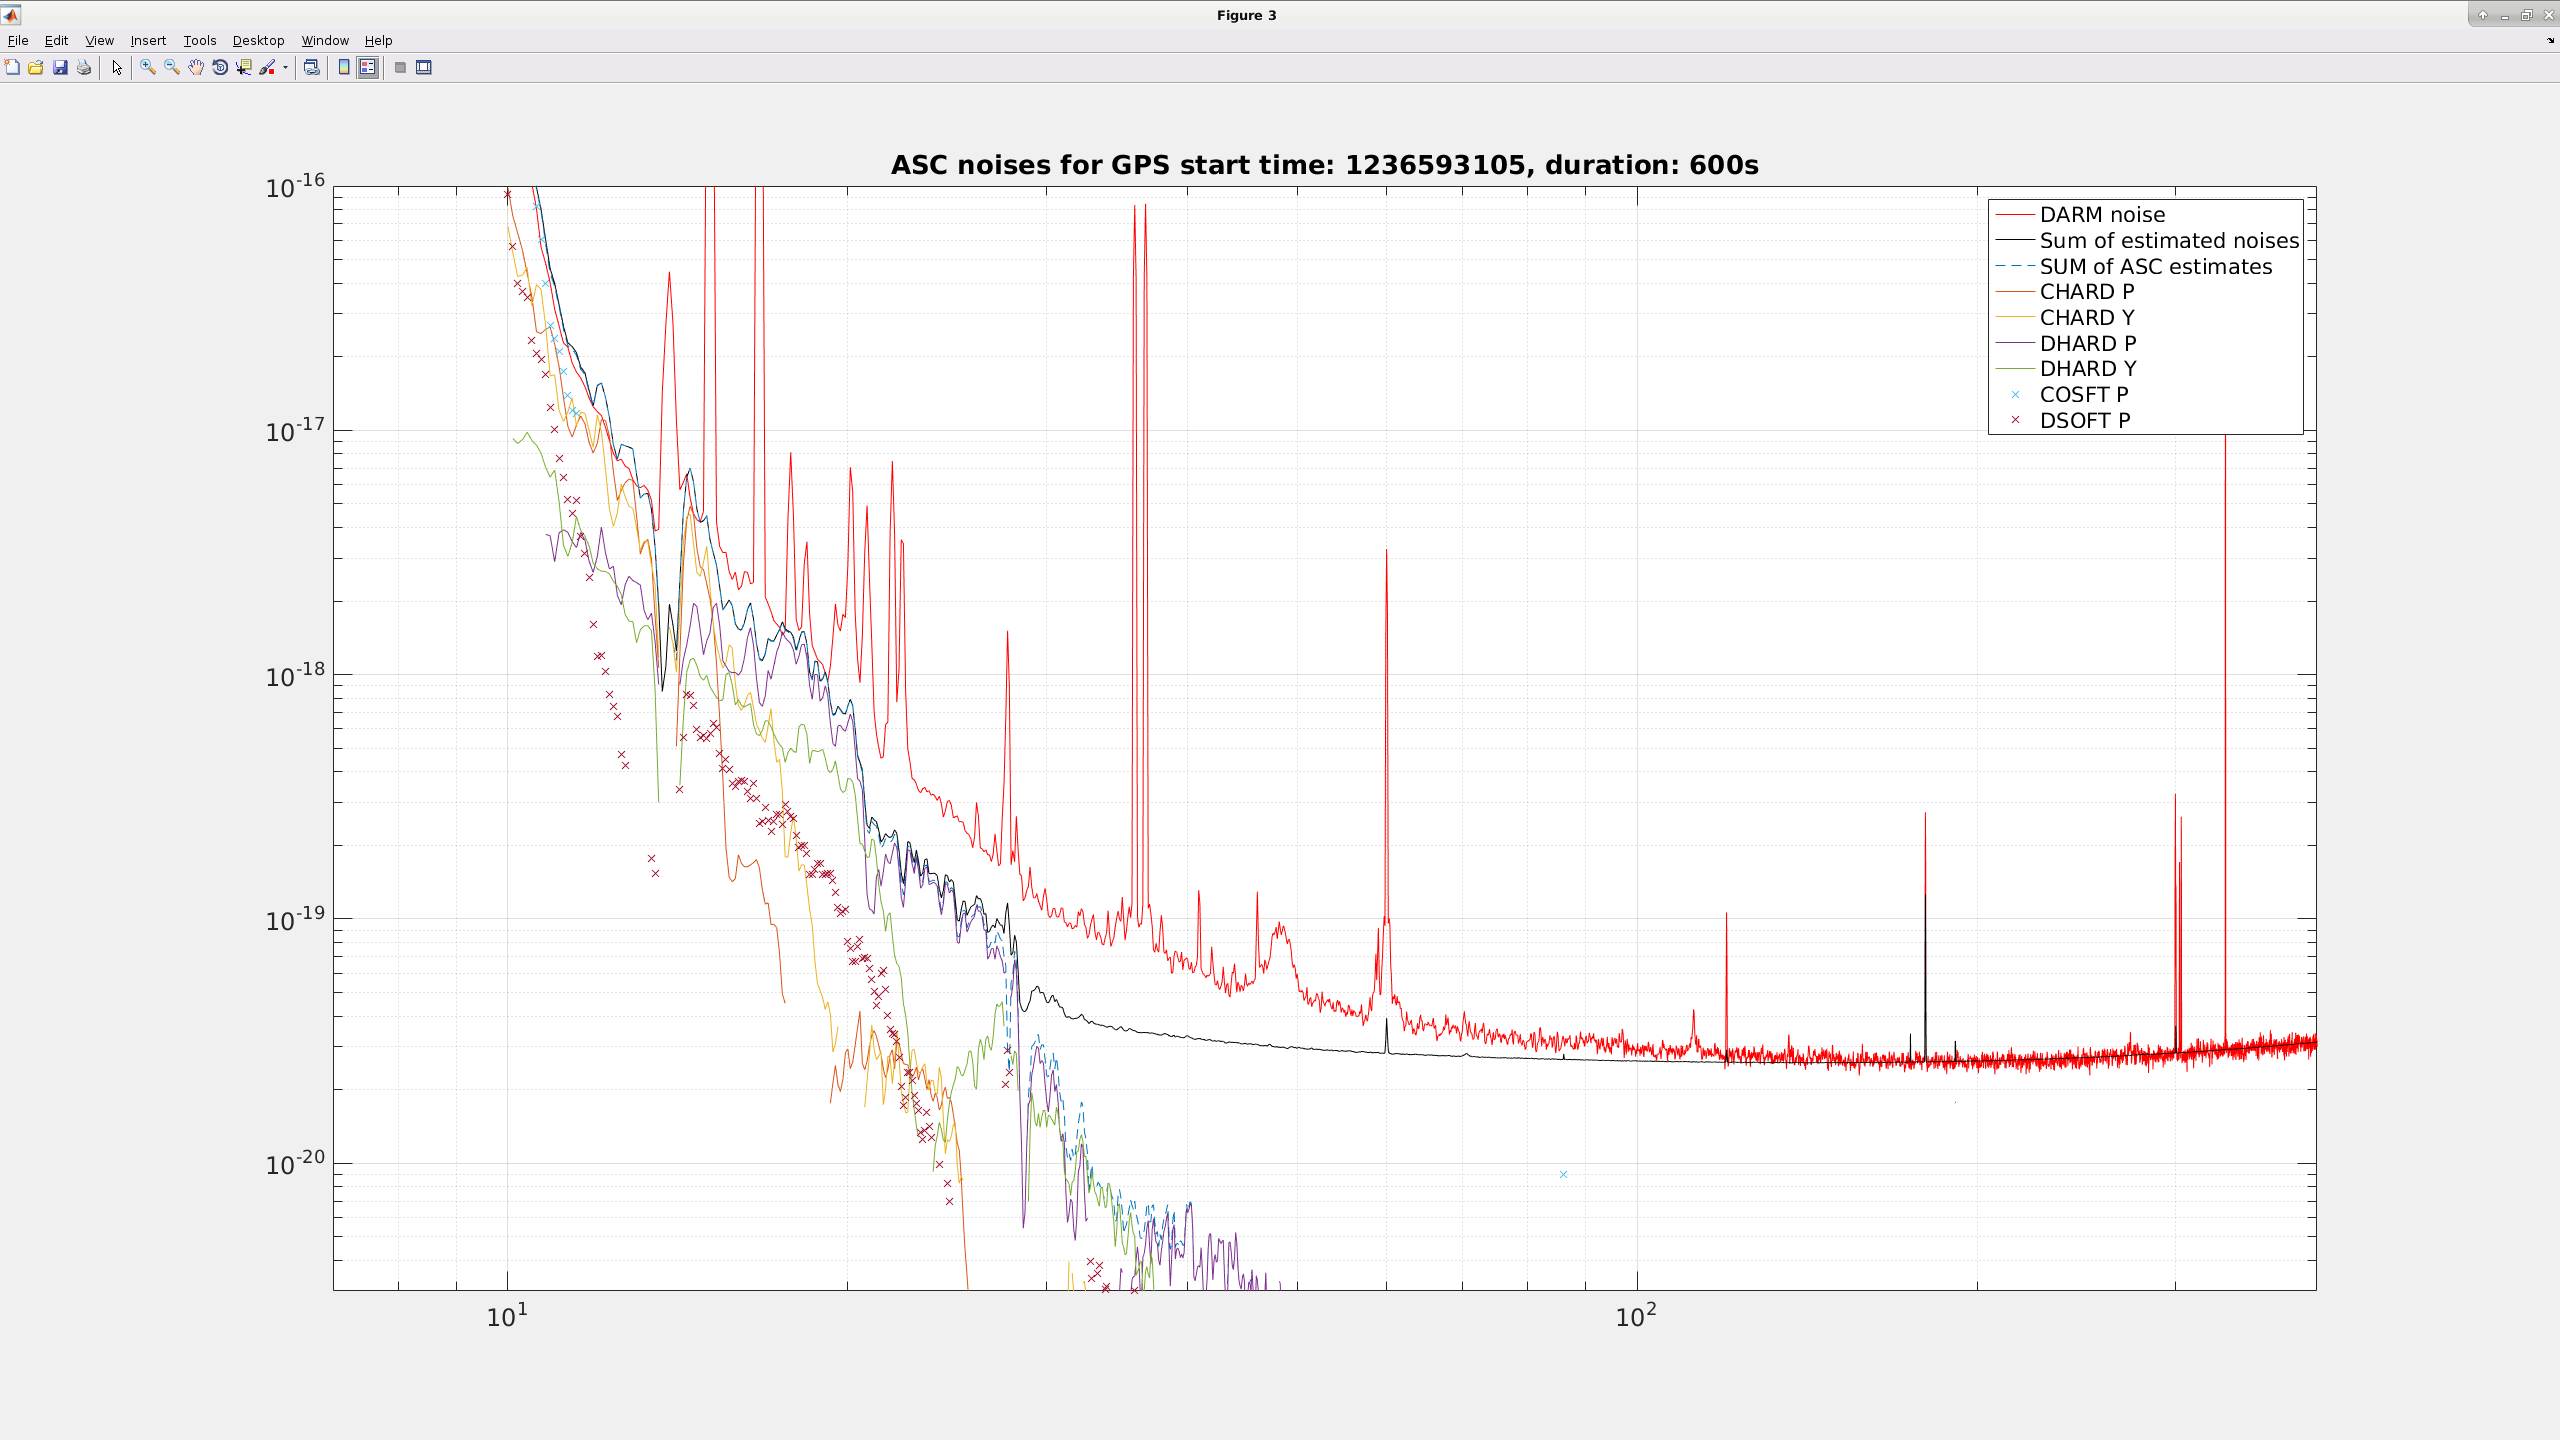
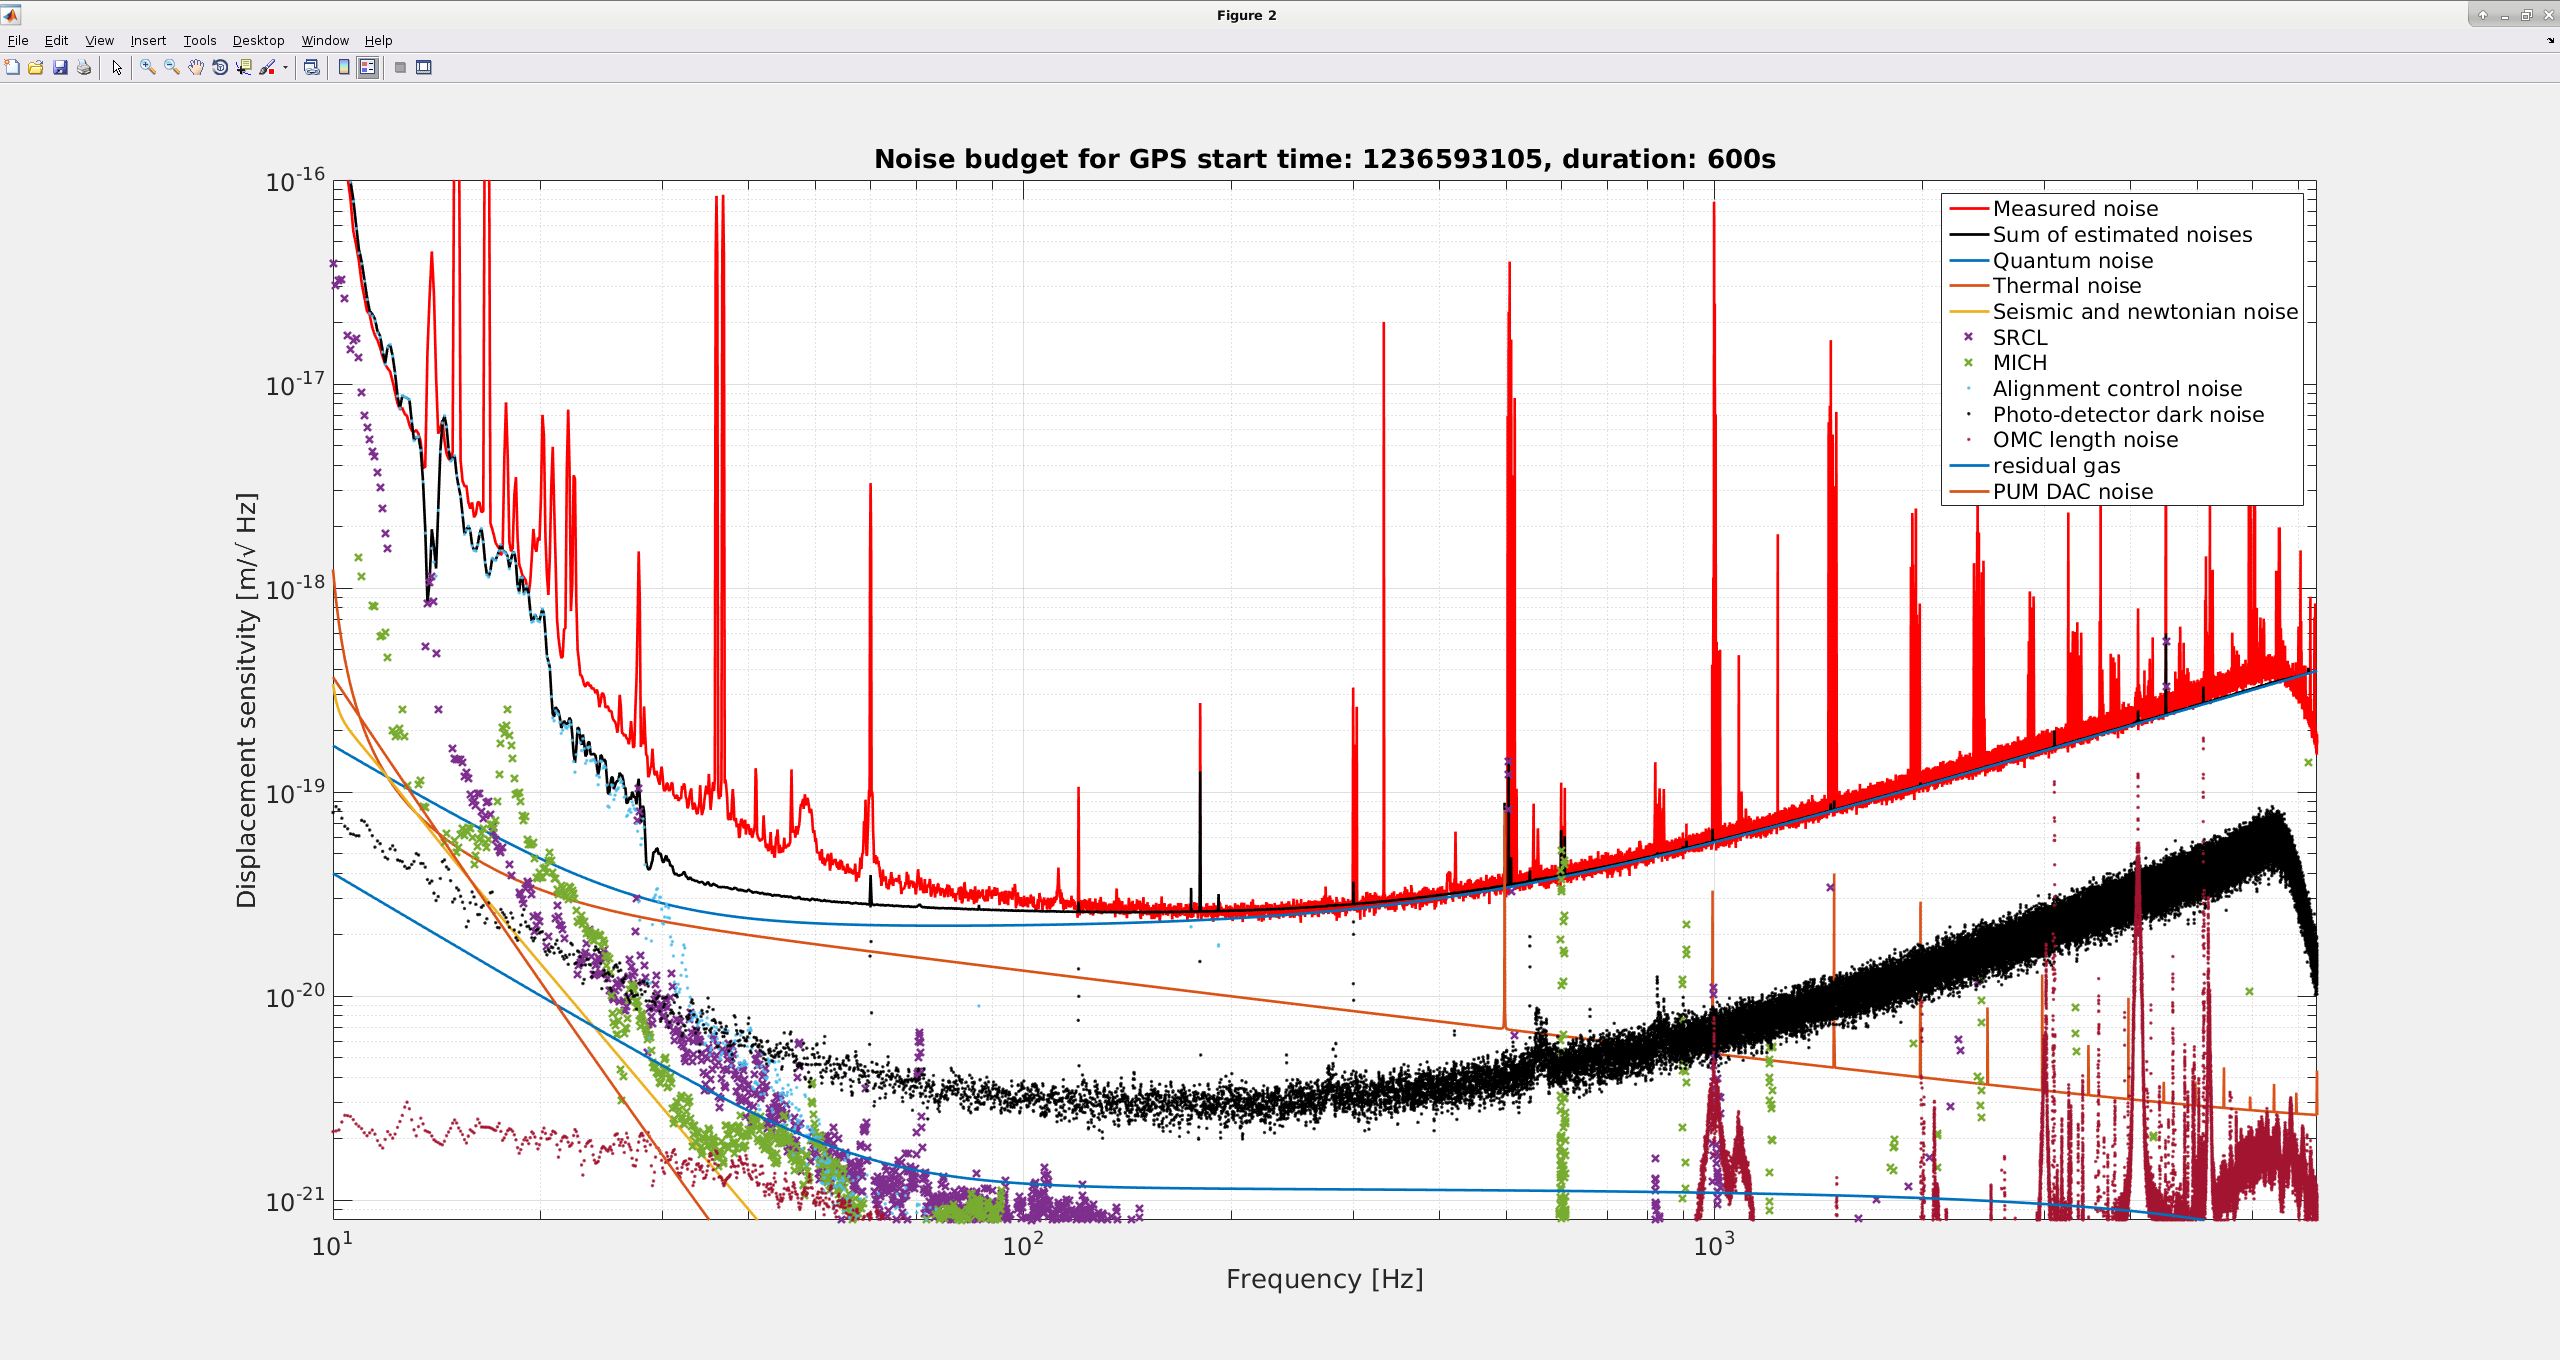
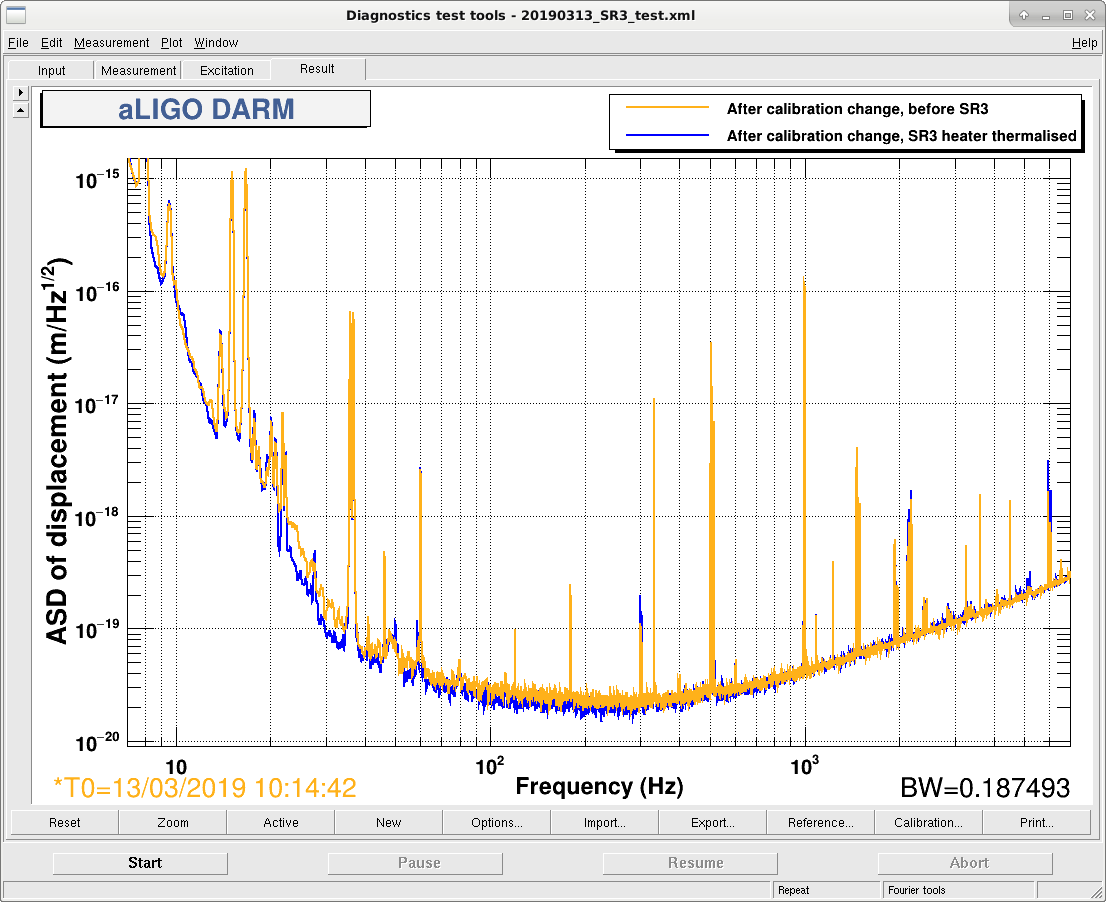
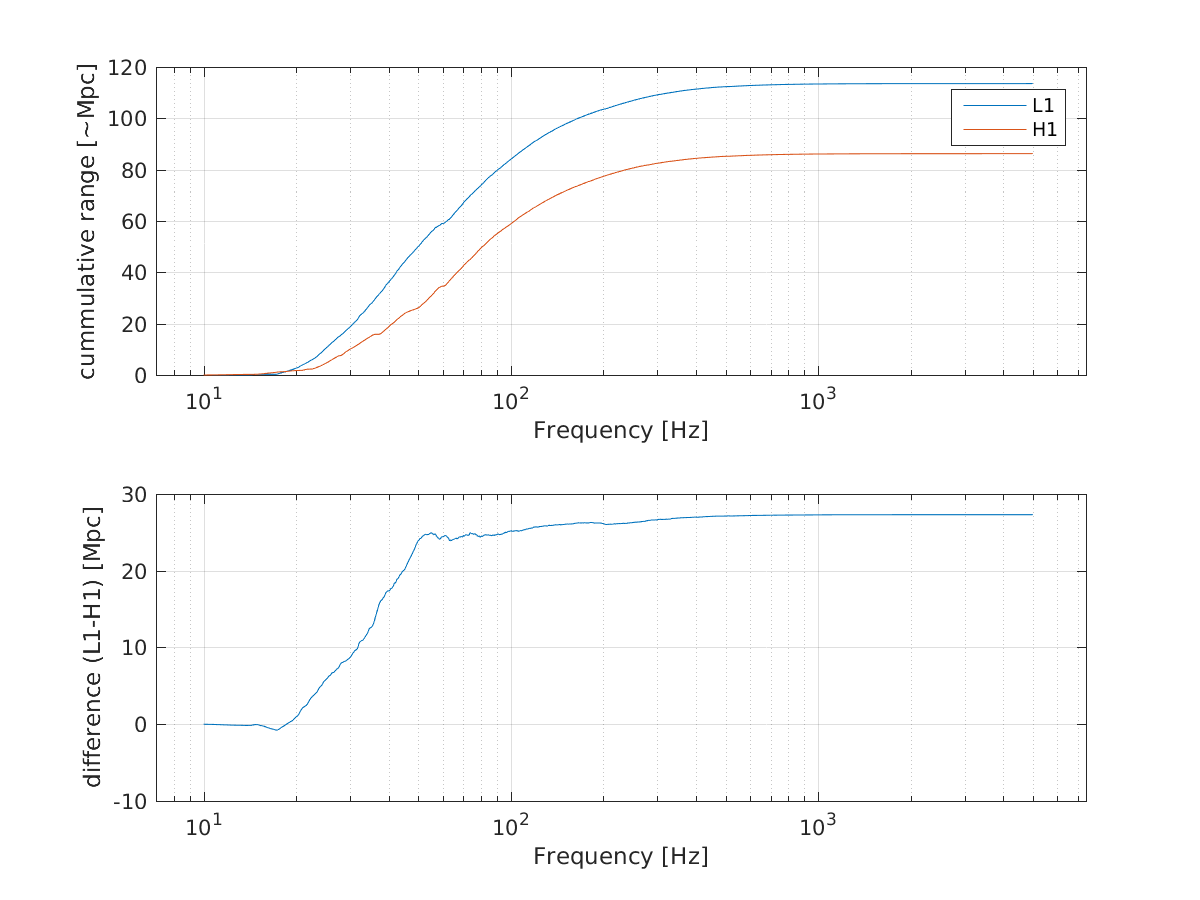
We did another SR3 test tonight and saw the same ~5 Mpc improvement. I did a very quick noise budget to see how it has changed from alog 47351, pictures attached. Looking at DARM the improvement is mostly coming from around 25Hz now, last night it seemed like the improvement was broader. Looking at the ASC breakdown it looks like DHARD_P/Y got reduced? CHARD_Y seems noisier now at low frequency. It might be worth remeasuring the ASCs before heating up SR3 again and seeing if it is actually them reducing in the same lock and not some other noise. I saved the DTT templates in the restructured noise budget section with the tag '_SR3HTR.xml'. I had to finangle the shot noise in the budget too.
With squeezer injected and no calibration lines we peaked about 105 Mpc with the new more accurate calibration.
Frequency noise was very high tonight, but that's for another log. We have switched the SR3 heater off at 5:00PST and left the squeezer on. If SR3 is helping DHARD Y/P then some common ITM TCS could also help so that would be worth trying next.
EDIT: fixing legend in second SR3 heater test plot
Jenne reduced the DHARD P gain the other day which is why I was seeing a change in the ASC noise projection: 47509
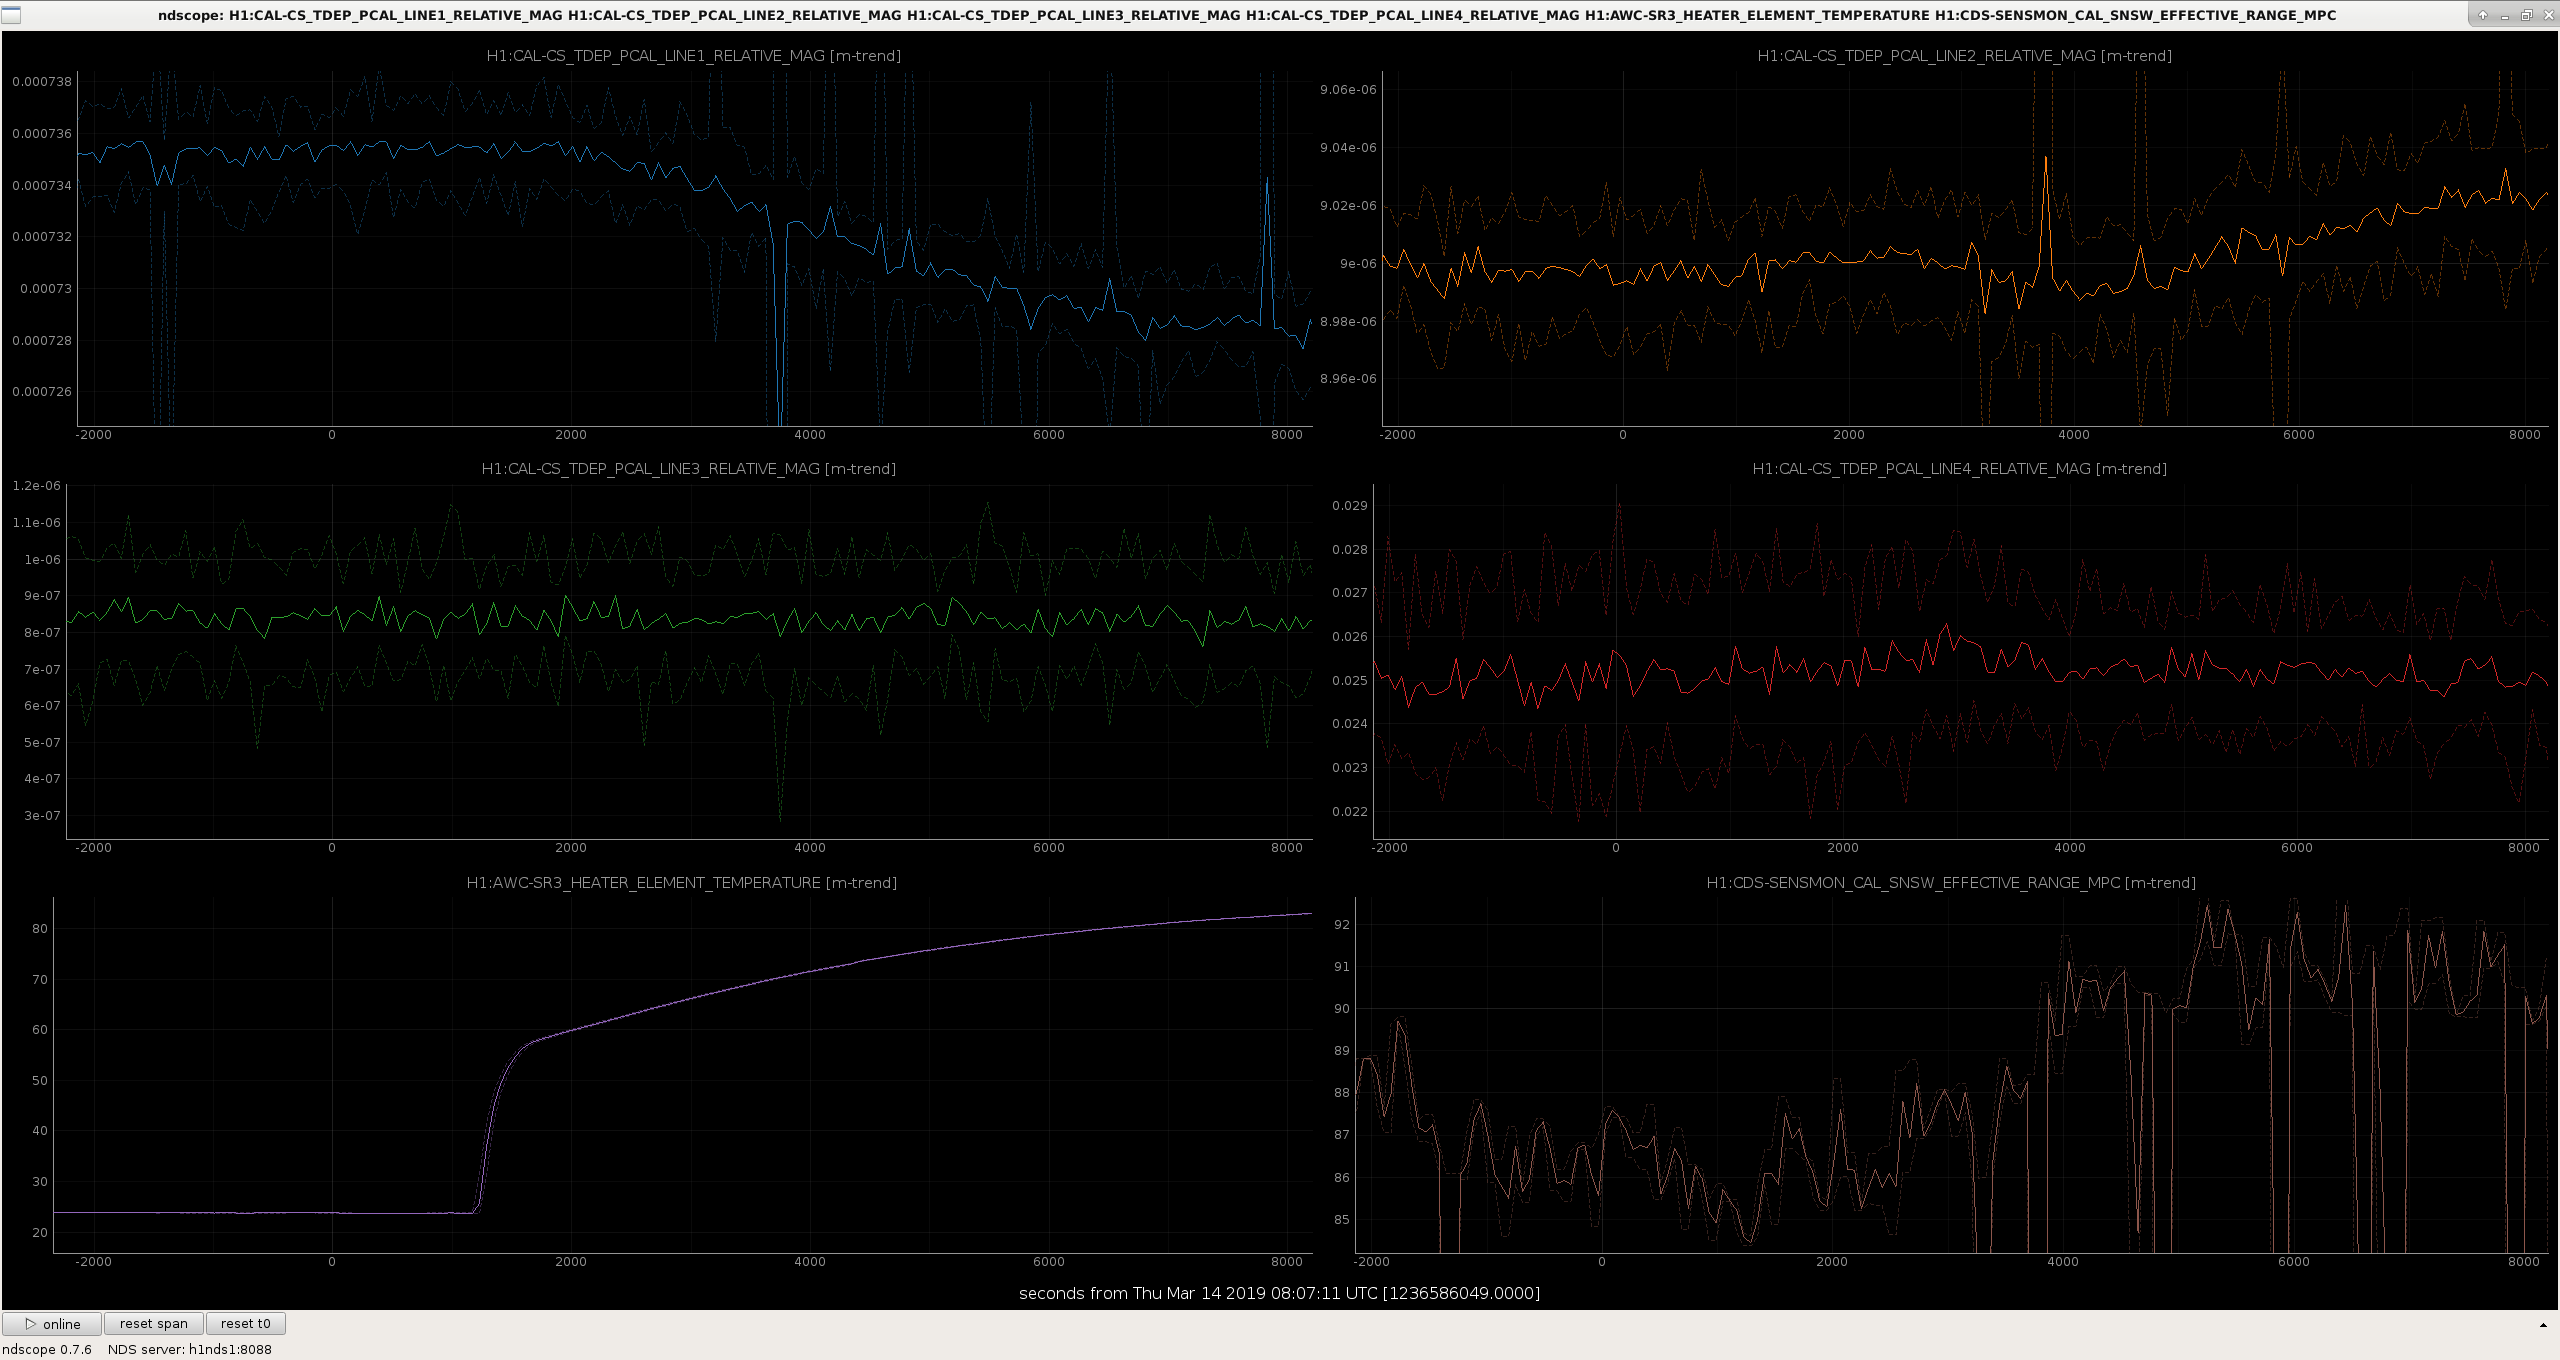
People were asking if the calibration changed much when the SR3 heater was turned on. We didn't do any pcal sweeps at the time but here is a plot showing the pcal line magnitude as the heater is switched on. I don't know if this is the best channel to use, H1:CAL-CS_TDEP_PCAL_LINE*_RELATIVE_MAG, someone please correct me if there is a better one to use.
Line frequencies are 37, 330, 1080, 8 for lines 1-4. The 37Hz line reduced by ~1% from this metric.
Dan Brown, Craig We are injecting lines into the DARM spectrum as follows: Intensity: 76.4 and 3250 Hz Frequency: 74.7 and 4500 Hz 9 MHz AM: 72.3 Hz
The Frequency line made it impossible to lock :(
I disabled the common mode board excitation input, and we're back on track, almost locked. I still see a giganto line from the other 2 excitations however.
Keita, Anamaria
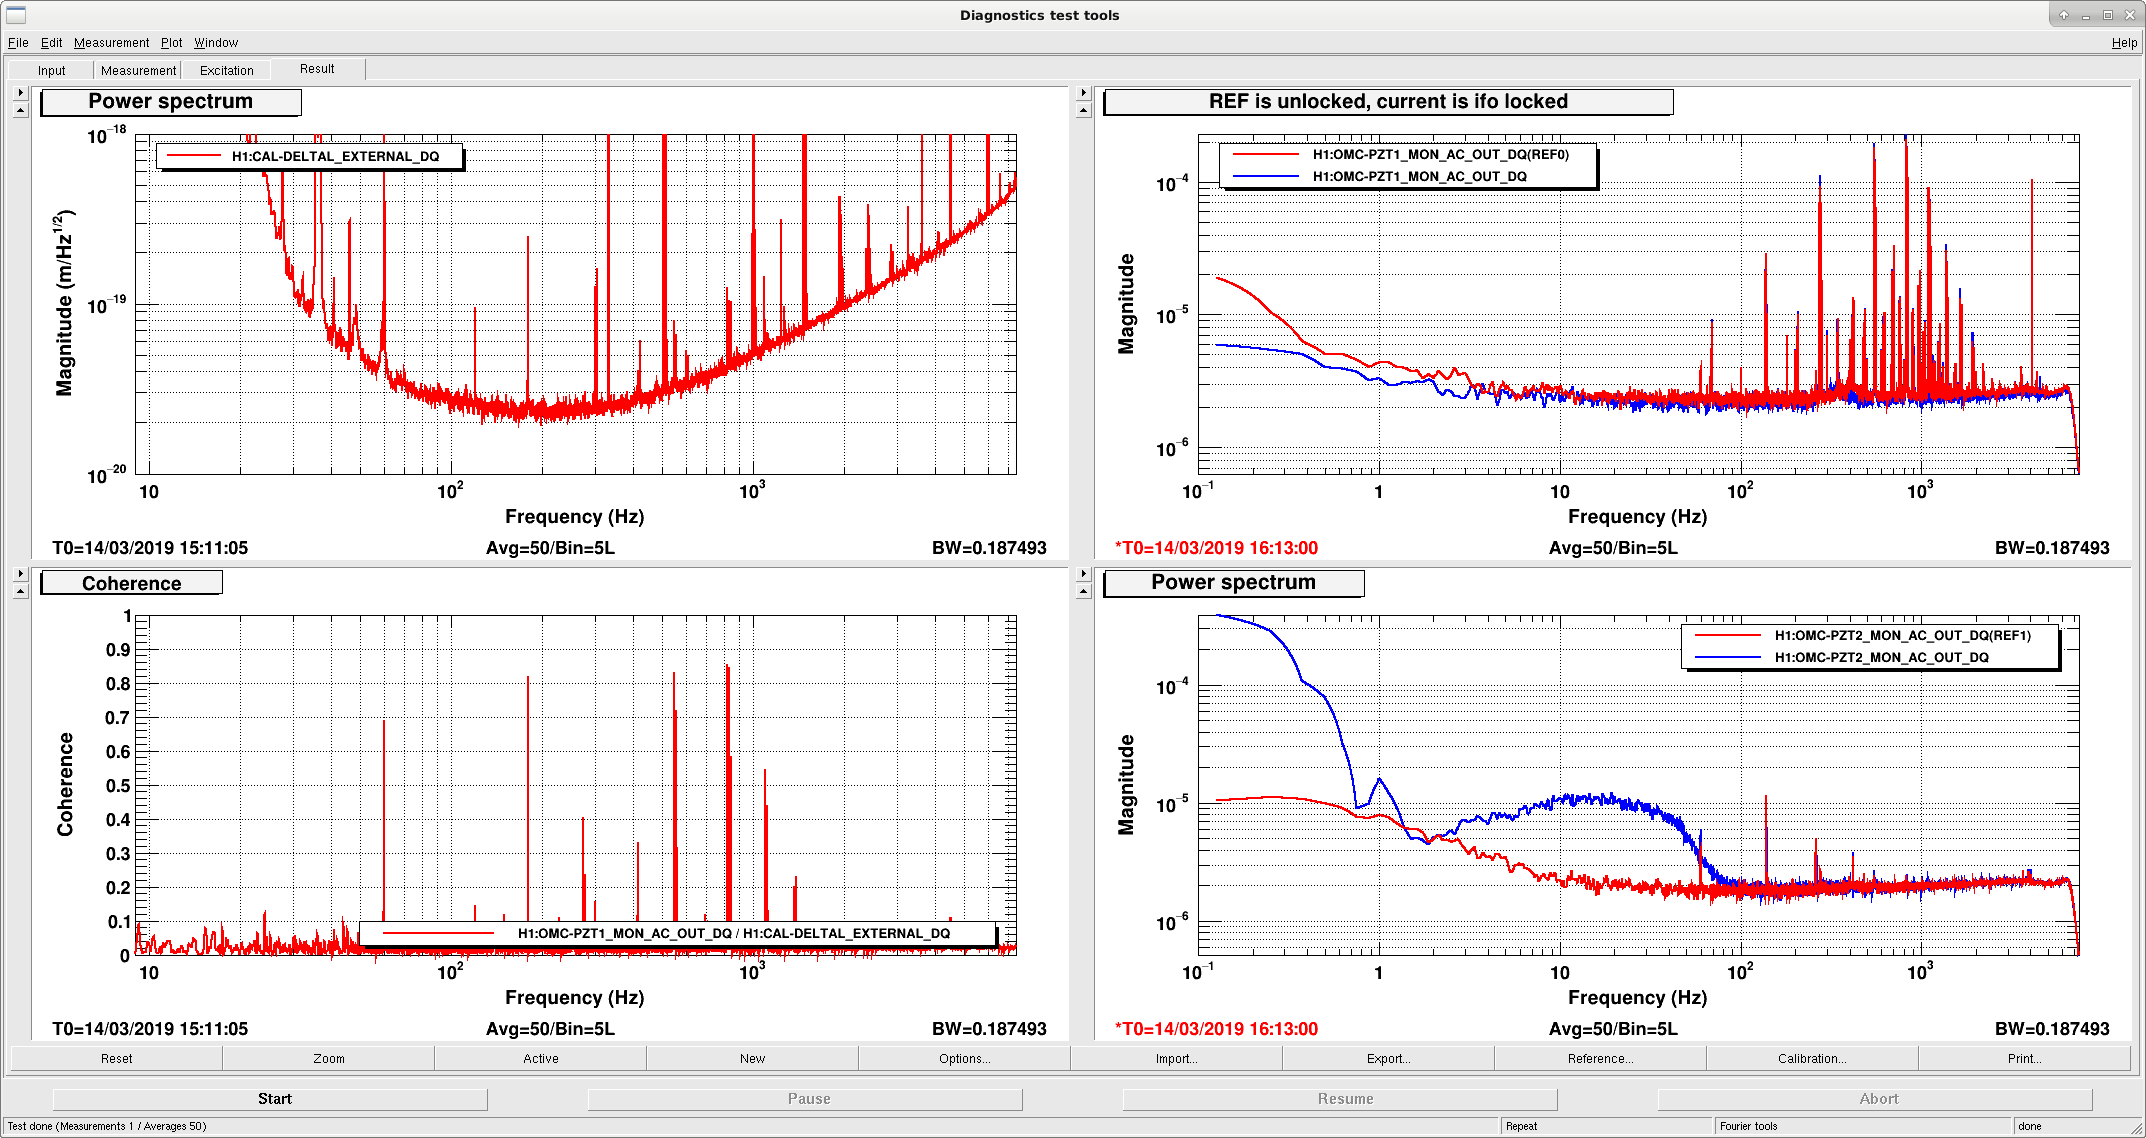
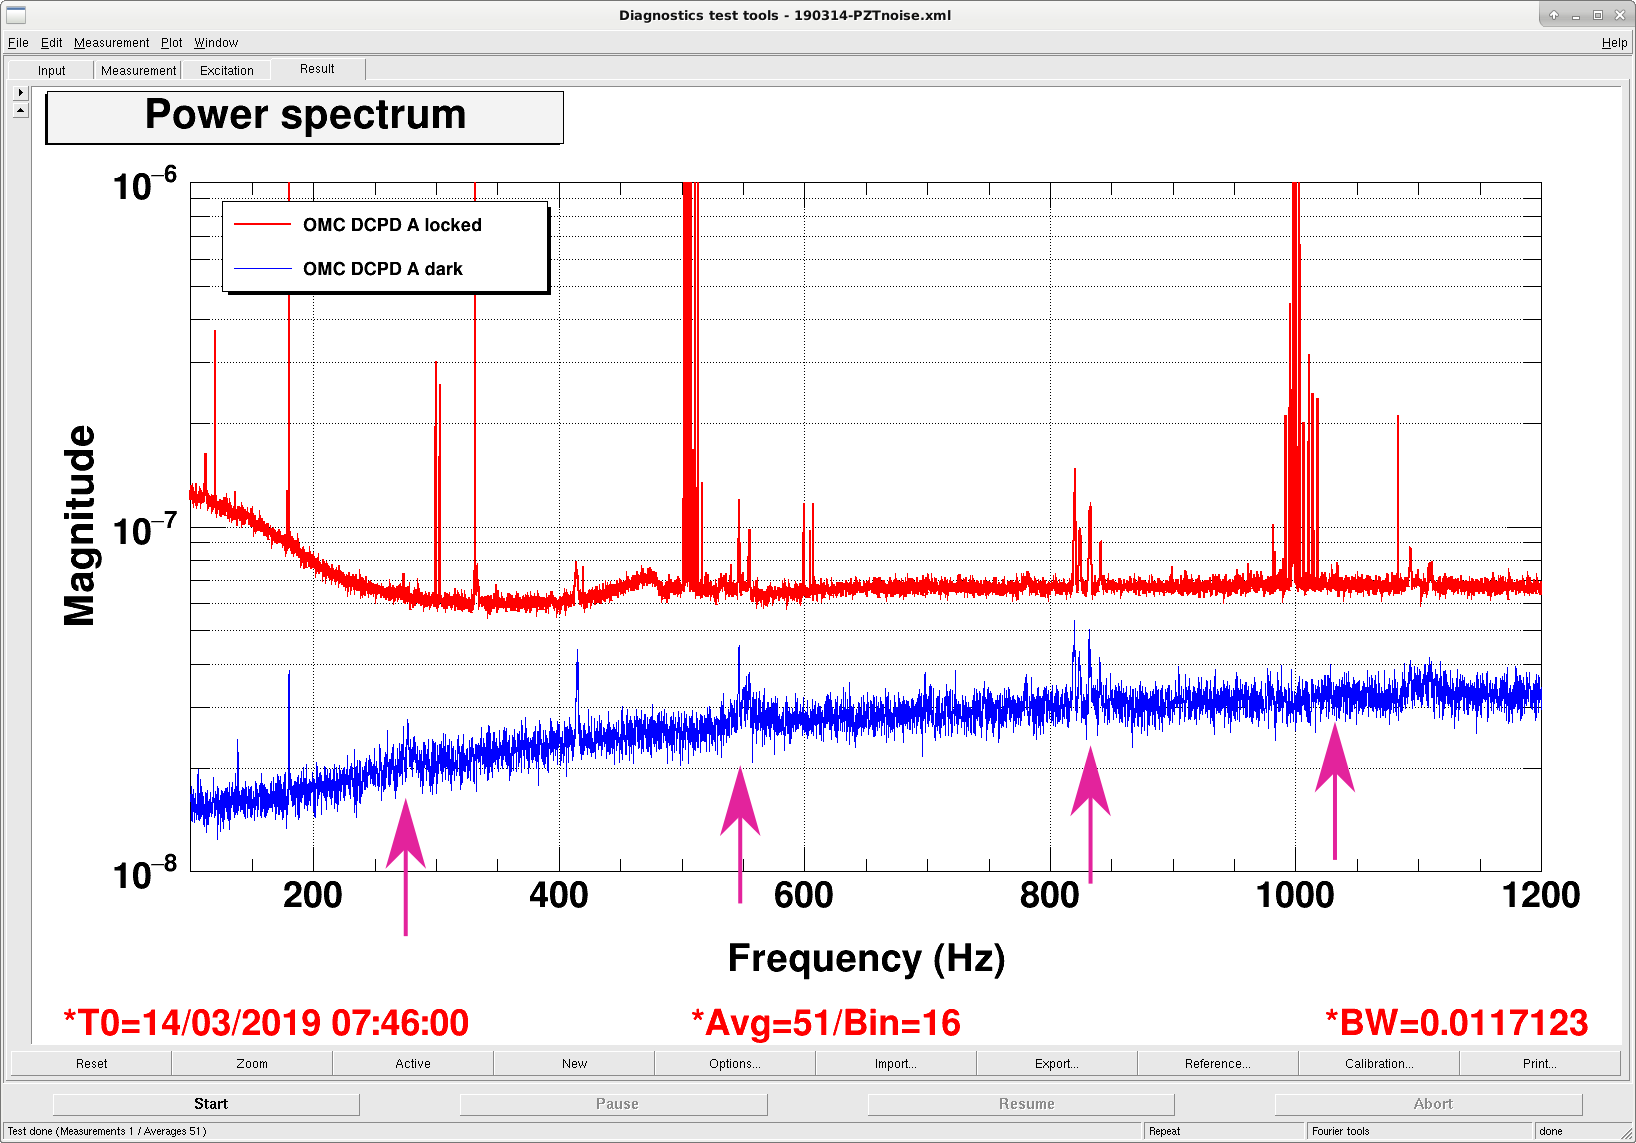
Following the work on pick-up on the PZT electronics at LLO, we find that there is coherence between PZT1 MON and DARM at various peaks! And PZT1 MON is so noisy that the noise is larger that the dither peak at 4.1k.
We would like to add toroids to these signals as soon as possible and will carefully check tightening of cables.
We have been discussing the relative merit of a ground isolation process for the OMC similar to that done in the end ESD system. Up-votes for such an activity would bolster our case.
Craig, Anamaria
We looked around at the HAM6 rack, we saw nothing amiss. We turned off the pico driver while we were there.
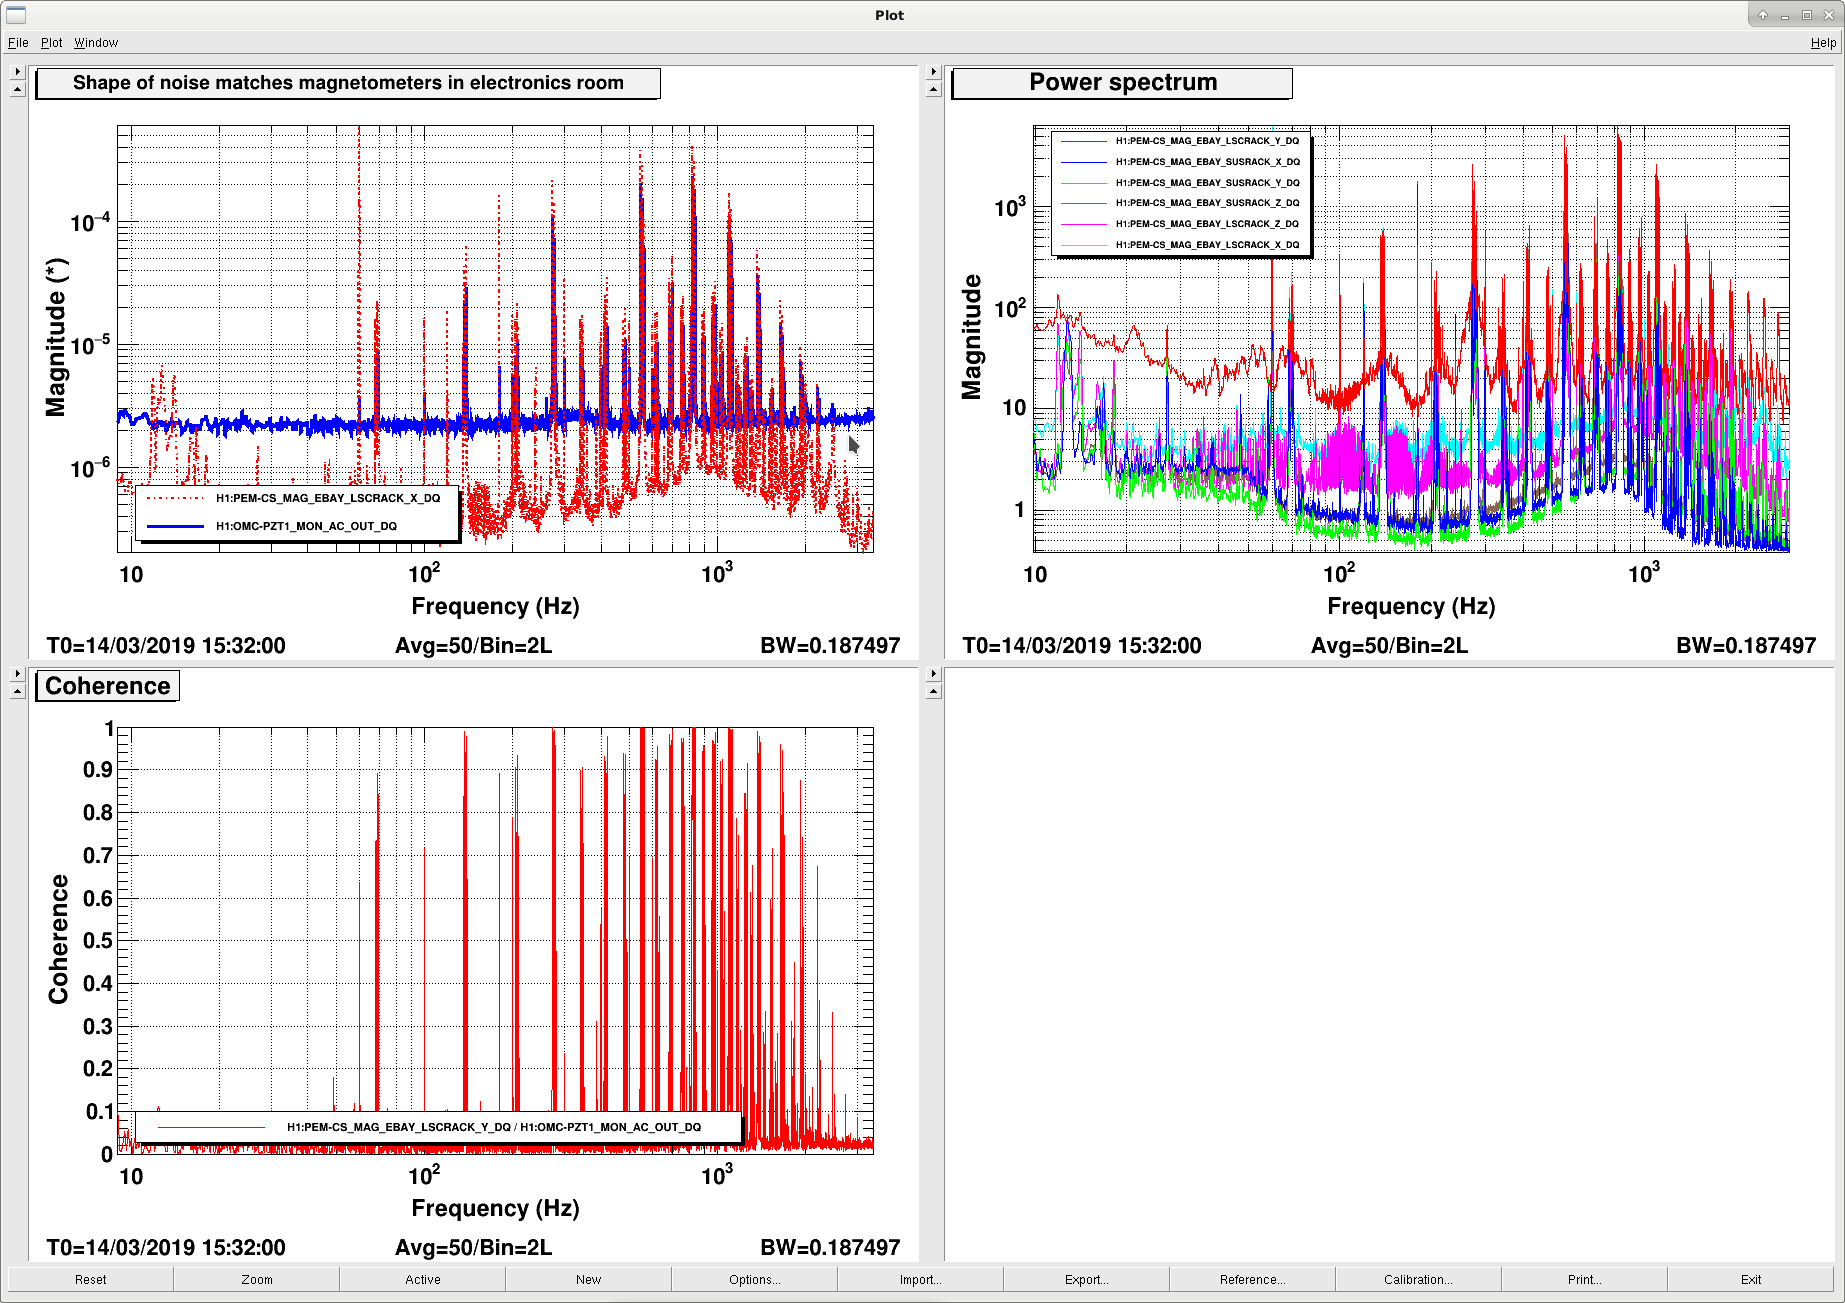
The OMC PZT signal is coherent with magnetometers, especially the ones in the electronics room (EBAY). This noise dominates all the EBAY magnetometers. We should be able to find the source in there.
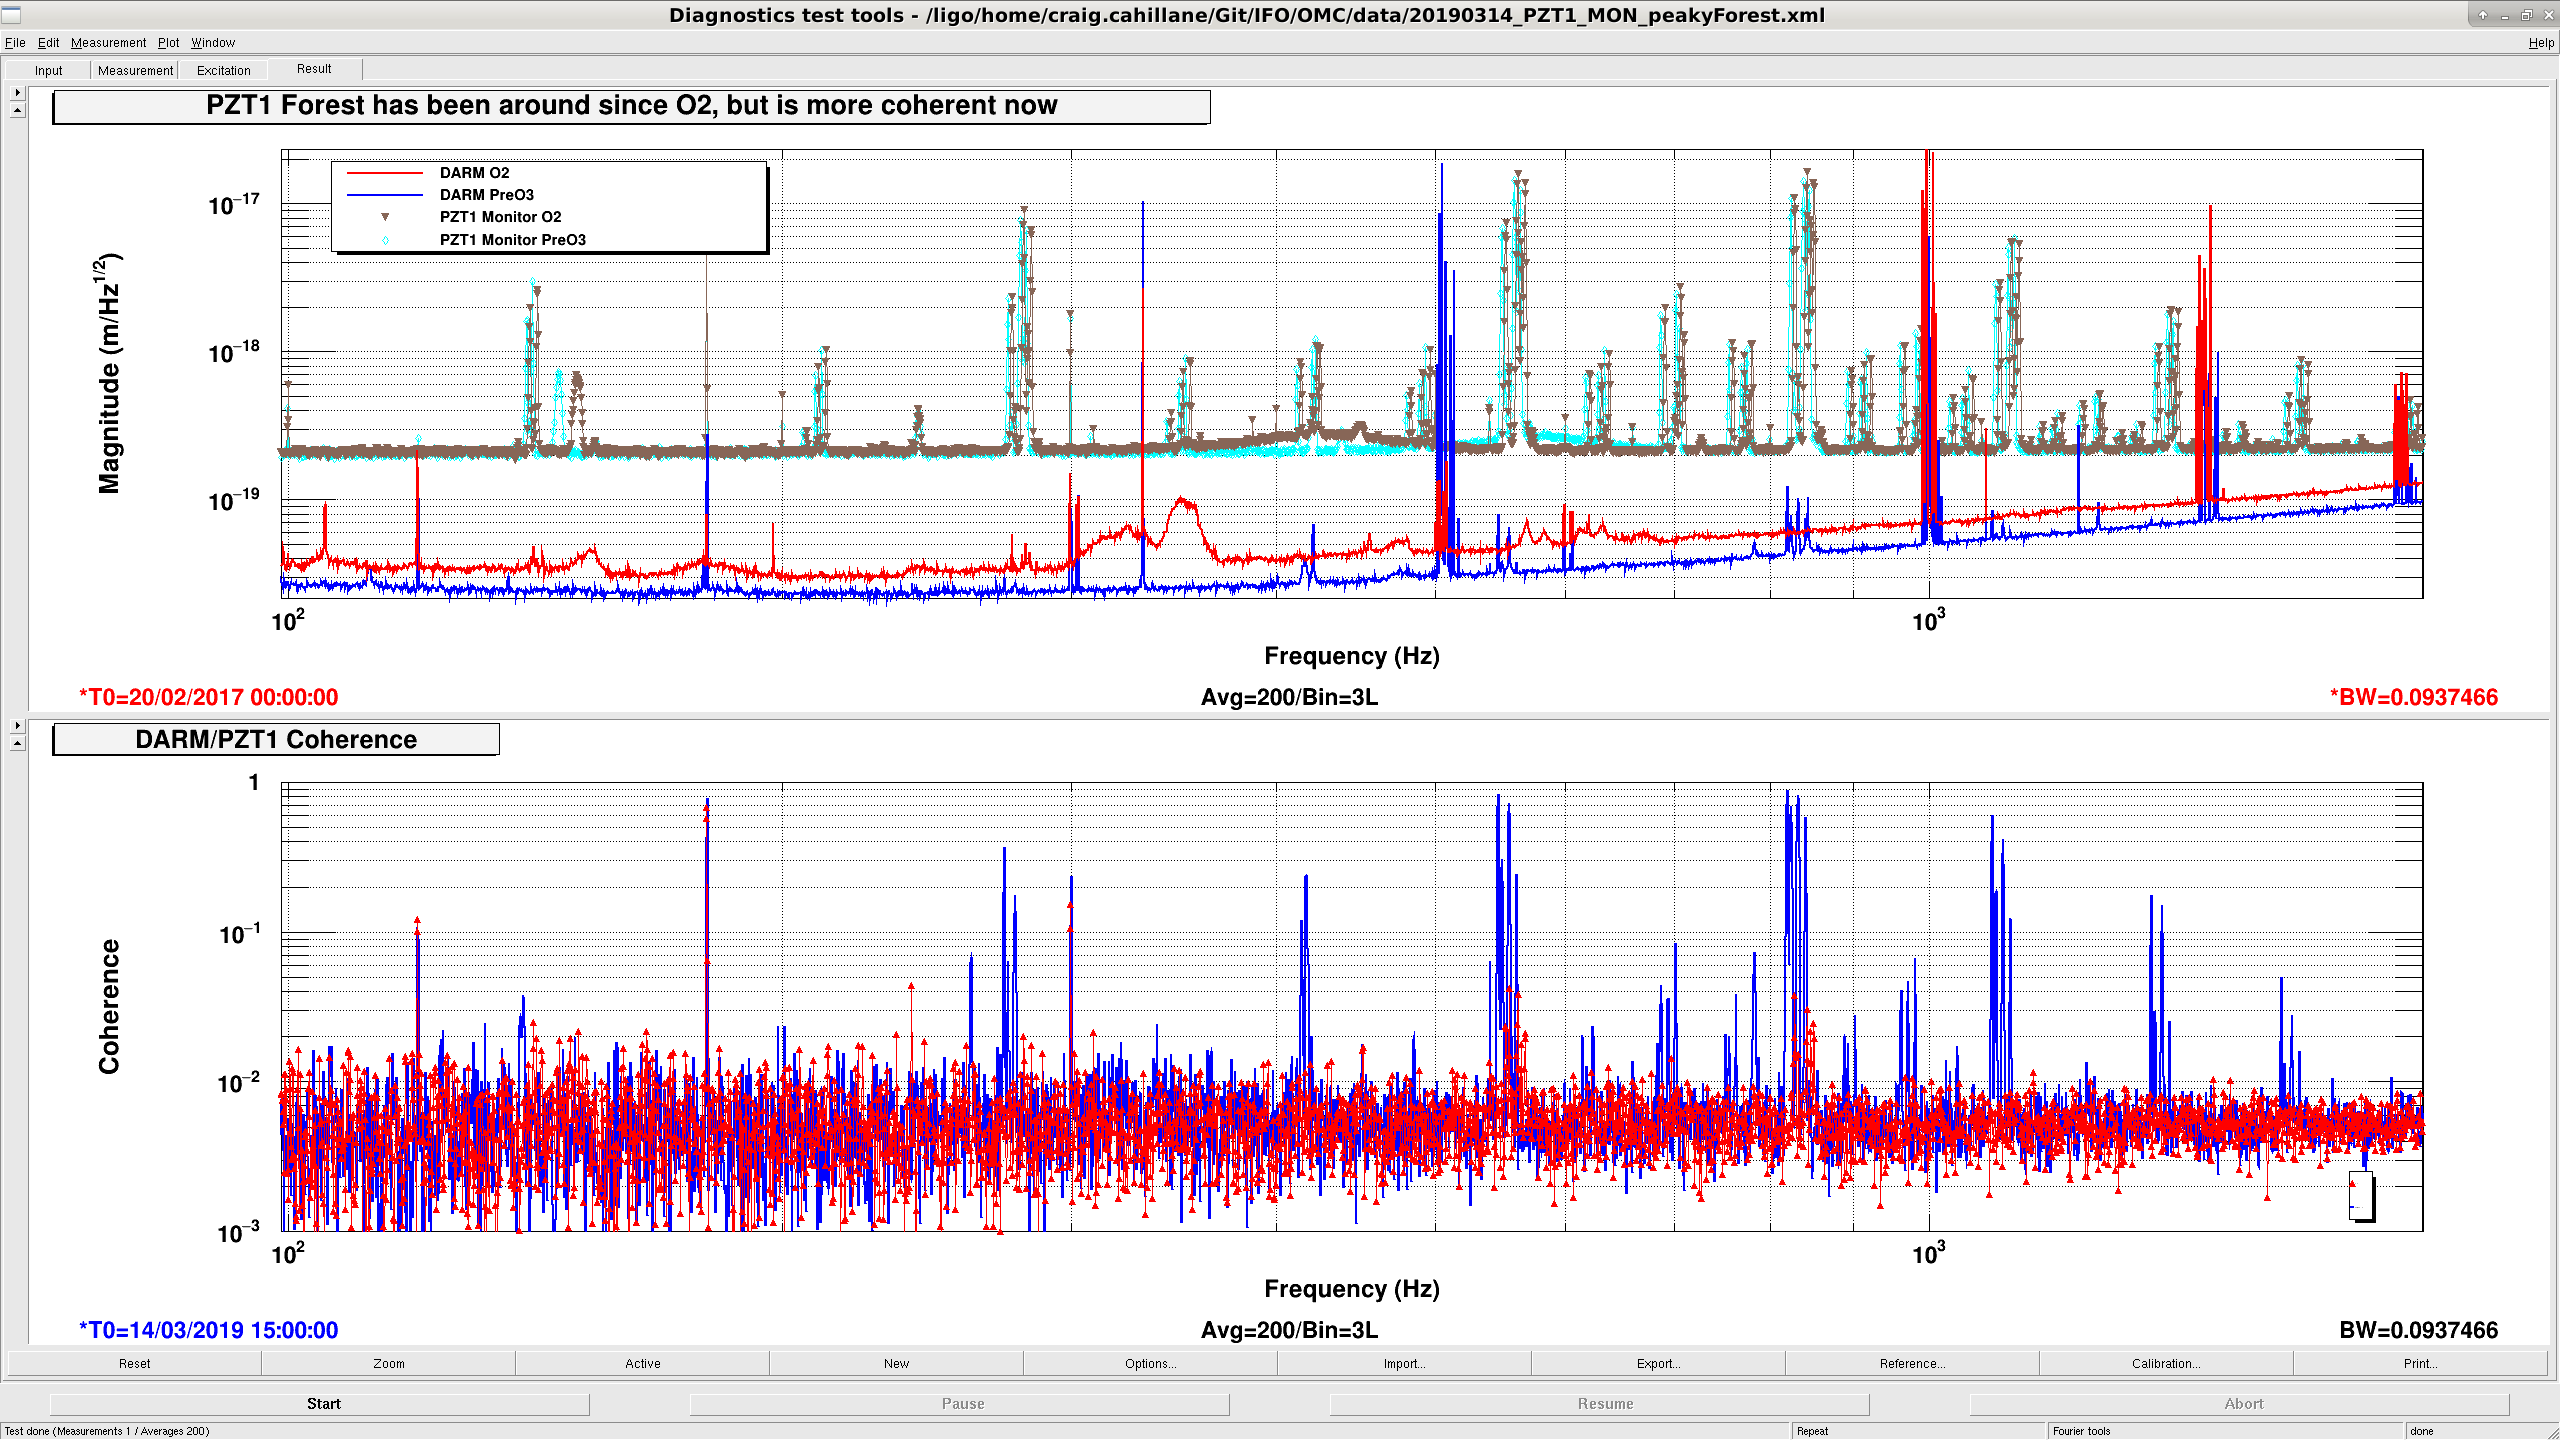
The coupling seems to come and go from lock to lock, but the PZT noise has been there since at least O2 (Craig will post a plot).
It would be good if someone could look at the behavior of these peaks (the coherent ones from the main post plot) in DARM over the past few weeks/months.
As Anamaria says, the PZT1 monitor forest of peaks has been there since O2. The noise in PZT1 MON has not changed levels very much, but somehow the coupling is worse now: we see strong coherence with DARM and PZT1 in some locks. We do not understand the nature of the coupling. Today we flipped some switches on the fast shutter chassis to with no changes apparent in the PZT1 noise.
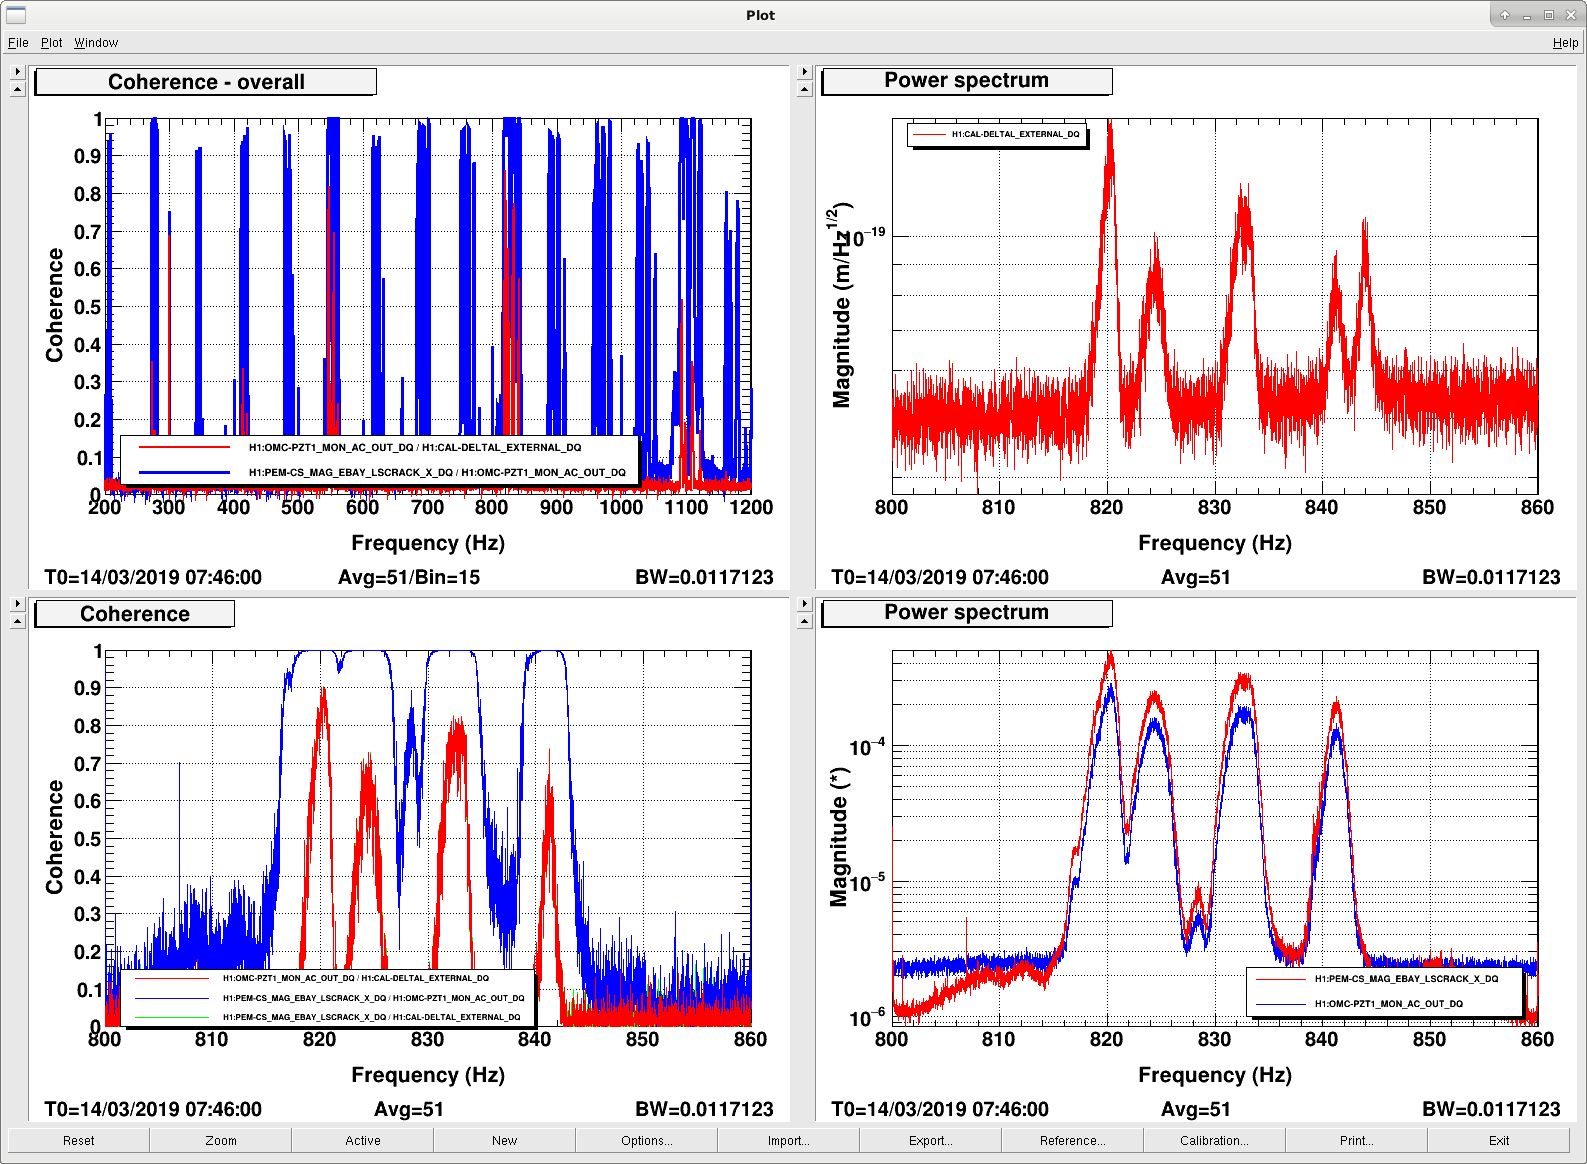
To clarify, there is noise in DARM at approximately 70 Hz harmonics, and they are coherent. I zoom in here on the top 3 coherences around 550, 820 and 1100 Hz. But sometimes there's a bit of coherence as low as 280 Hz.
A second observation is that some of the peaks are visible in the DCPDs when unlocked.
Sheila pointed out that the violin mode damping filters were set to zero history - immediately in the switching settings in Foton. This was leading to large transients when making changes to the filters while they are ON. I went through all the filter banks and made changes to them (Bank1 and Bank2 for the 1st and second harmonics) for the ETMs and ITMs. In the new settings the input is Always ON and the output is Ramped, the ramp time has been set to 2 secs.
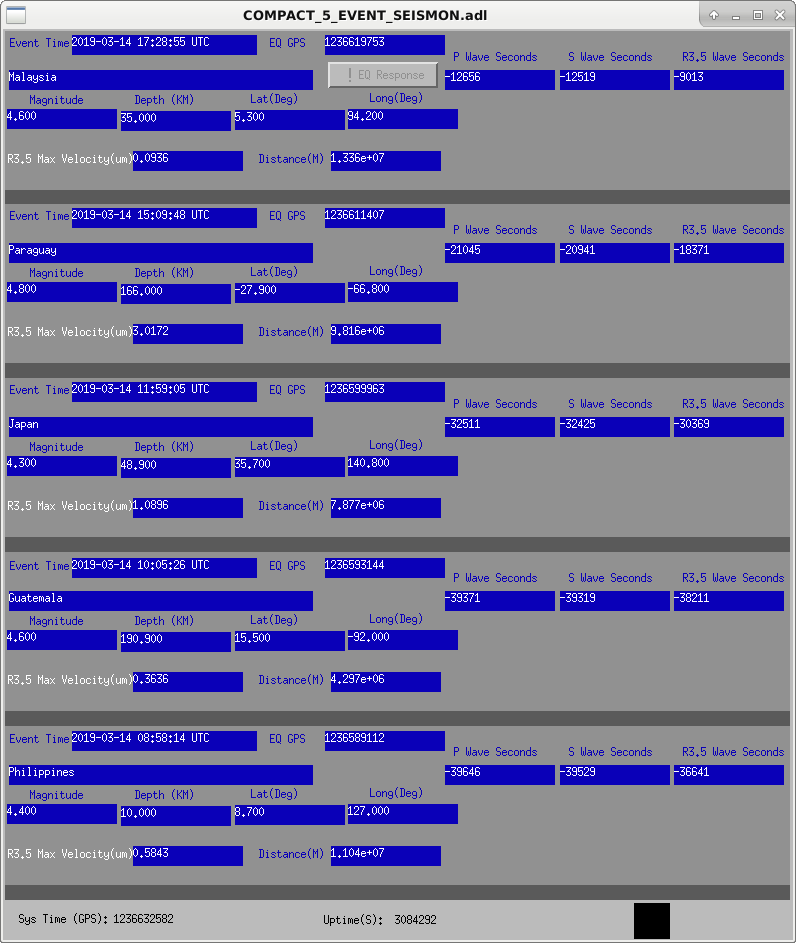
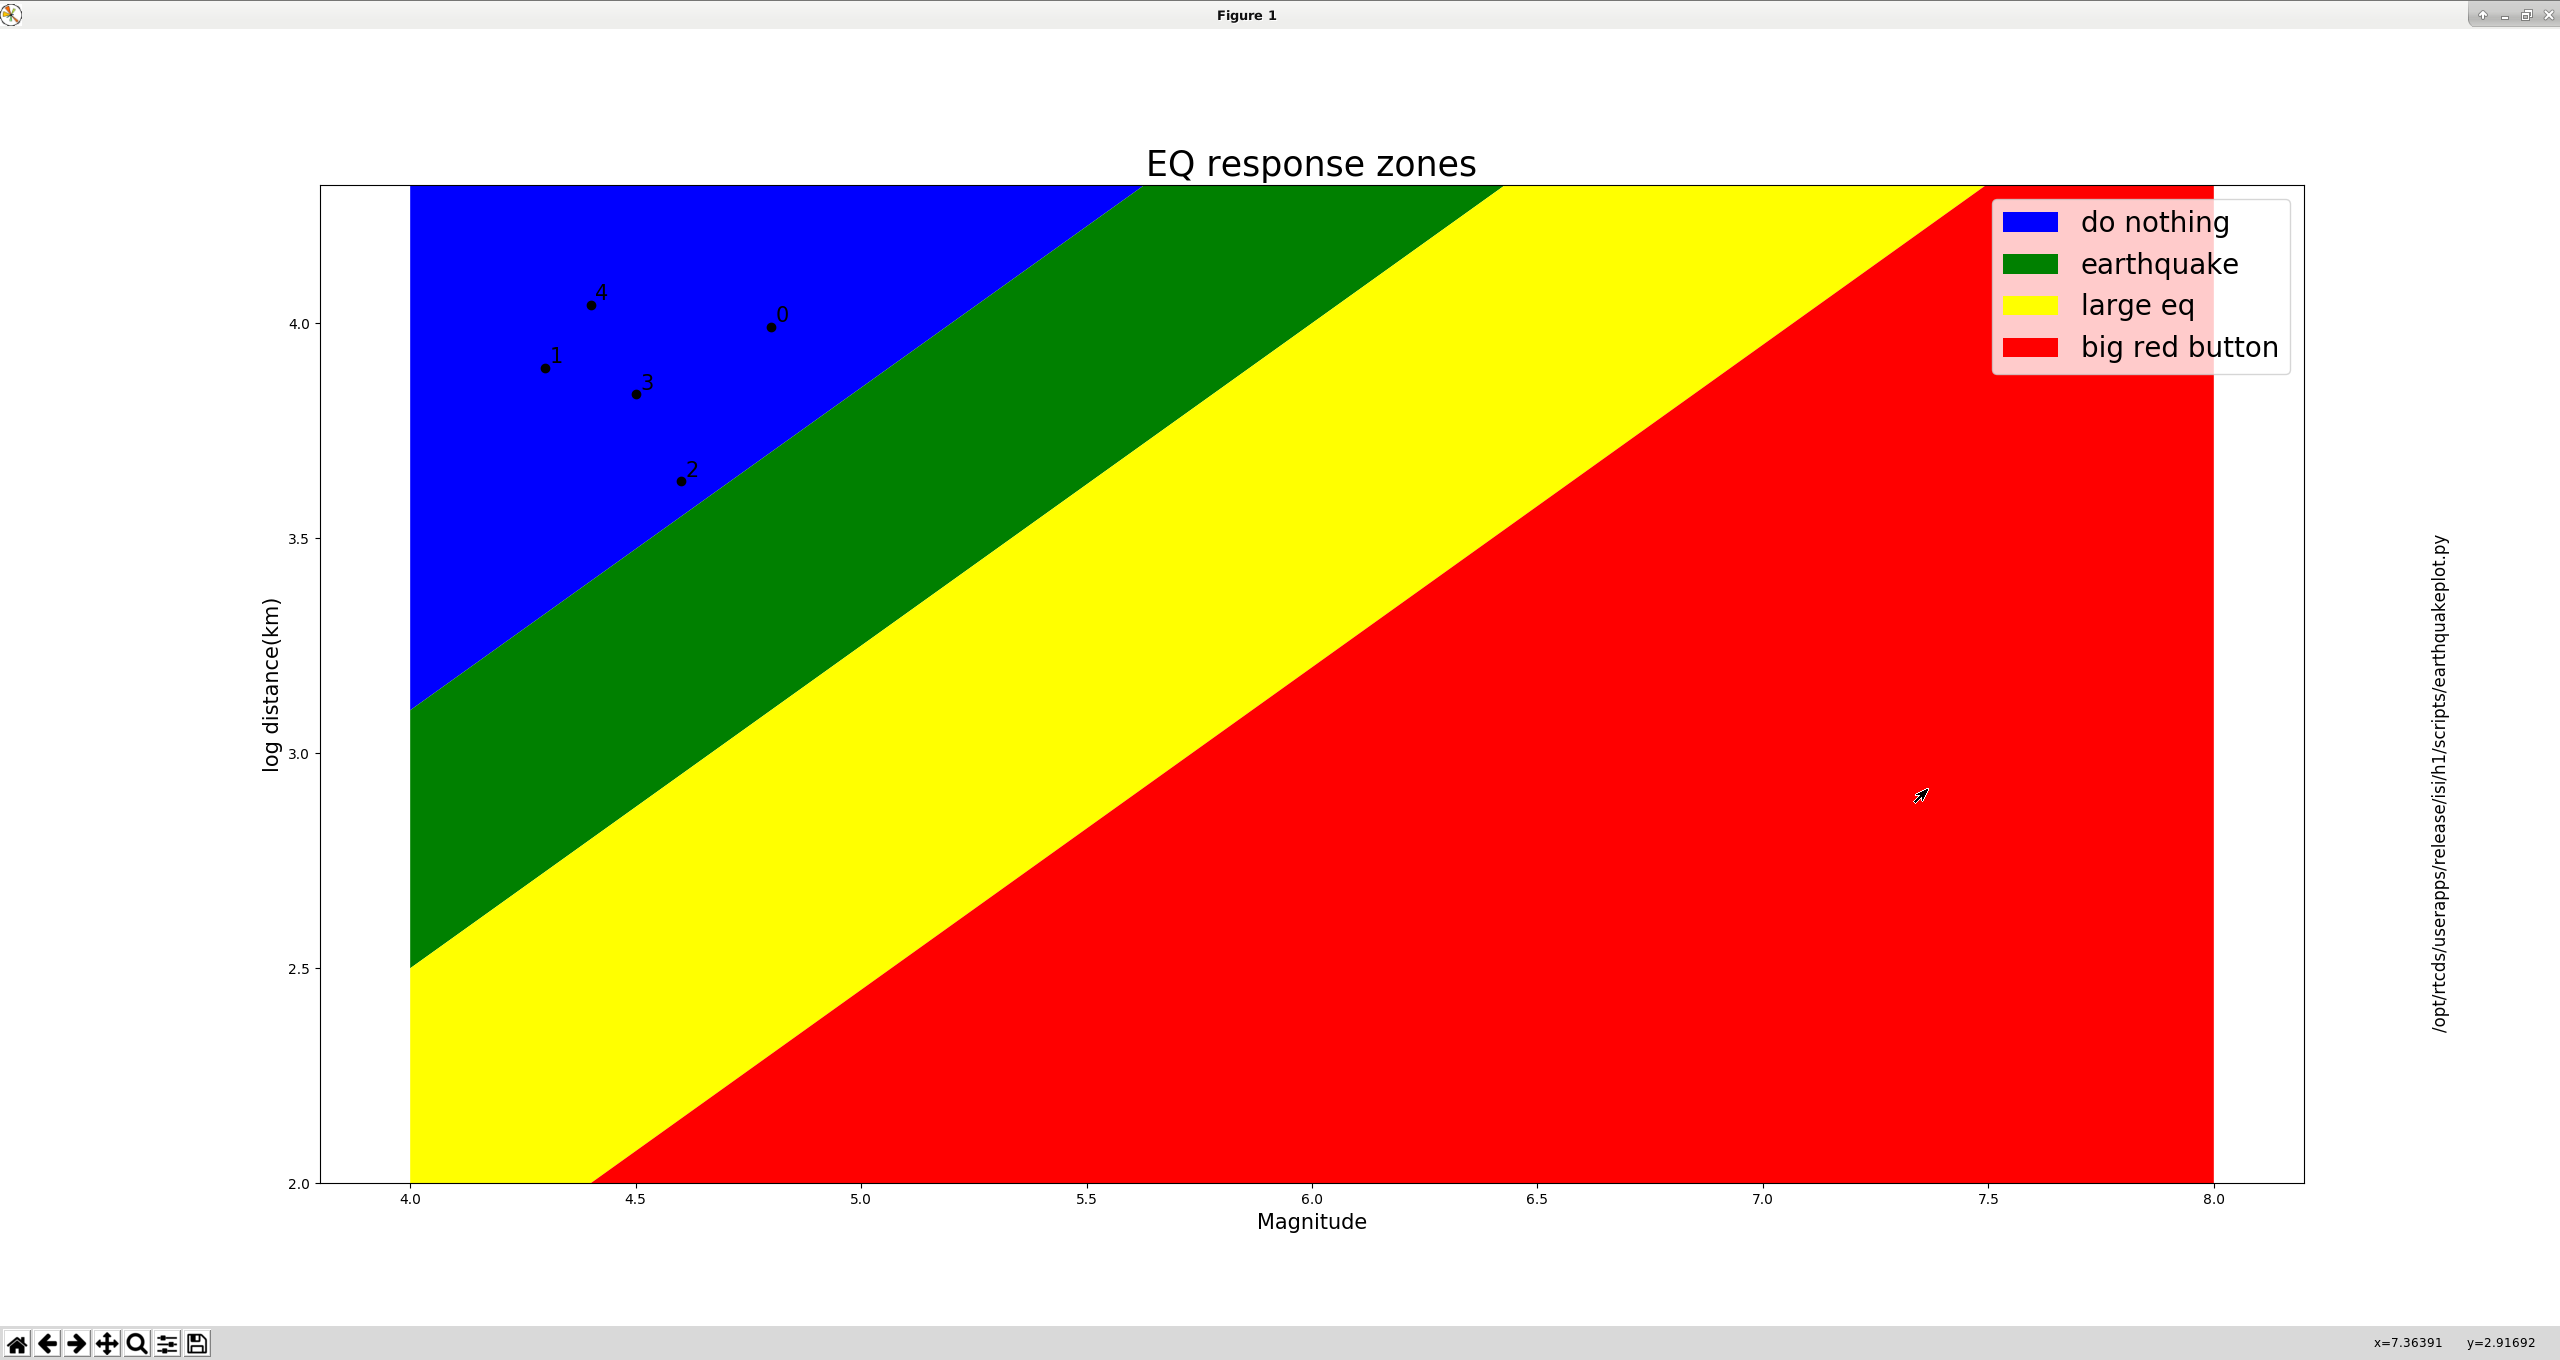
Based on my alog from a couple weeks ago about LHO earthquake responses ( here ) I've written a python script to give some rough guidance on how we should respond to an incoming earthquake. On the top middle of the Seismon screen there is now a new button that says "!EQ response" (grey button on the top middle of the first screenshot). This launches a python script that plots all of the earthquakes as on the seismon currently shows by log10(distance) from LHO and magnitude, and places each earthquake in one of 4 different response zones, second attached plot. Each earthquake is represented as a point, labeled by the seismon channel number (0-4), any earthquake that is still incoming will show up as orange. On this plot the regions are labeled blue for "do nothing", green for putting SEI_CONF in "EARTHQUAKE", yellow for put SEI_CONF in "LARGE_EQ" , and red is push the big red button.
This plot still needs adjustment, as distance and magnitude only give a very, very rough idea of how disruptive any earthquake is going to be, but I suspect all of my regions need to move a bit southeast. It's disastrously far off, as I don't think we even saw any of the 5 eqs on that plot in the site seismometers, and they all fall appropriately in the blue "do nothing" region. There are other factors this plot doesn't account for like depth, for instance, a shallow earthquake (10 km is the minimum), I think, will be worse than a deeper ( on order of hundreds of km). I didn't want to try doing a 4d plot, so the user will have to do some discounting for depth on their own. The path the earthquake takes also matters, a 6.0 in Alaska will generally be worse that a 6.0 in South America, at least for LHO.
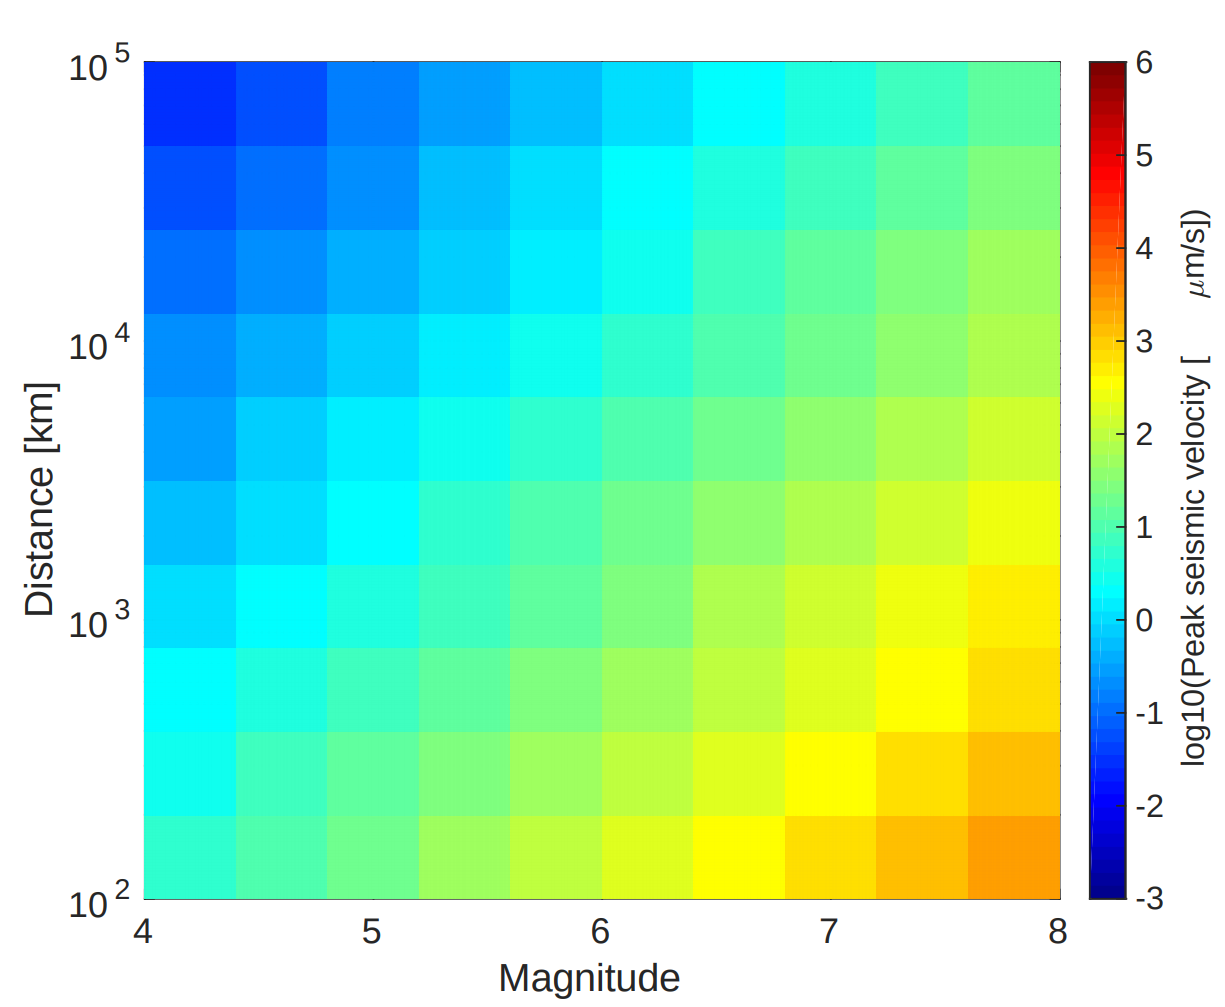
The plot my script makes is a rough fit by eye to a plot from one of seismon papers that Michael Coughlin pointed me towards, third attached image. The x axis on this plot is magnitude, y axis is the distance, and the heat scale is the log of the expected peak surface velocity. I don't have their data for that plot, so I haven't been to throw our data on top of it to see how it compares, but the general trend of closer and/or bigger is worse for us, is obviously true.
Sharan Banagiri, Kara Merfeld, Anamaria Effler, Robert Schofield
A large line appeared just below 80 Hz on Tuesday (visible in Mar. 13 summary), that went away when the squeezer beam diverter was closed. We noticed a similar, though not coherent, line in the ISCT6 accelerometer, and tracked it down to the squeezer laser controller fan. Figure 1 shows that the 80 Hz line and a line at the fifth harmonic, ~398 Hz, appeared and disappeared several times as we moved the laser controller (on top of ISCT6) on and off of ¾ inch rubber legs. The seismic isolation provided by the rubber legs reduced the amplitude of the 80 Hz peak in the table accelerometer by more than an order of magnitude. We have left it on these legs.
We are not sure why the peak seemed to suddenly appear, I checked back in time a little more than a month and the fan peak at 80 Hz has not increased in the ISCT6 accelerometer signal, so I think the difference is coupling, such as an alignment change, rather than an increase in the source that might indicate imminent fan failure.
Figure 2 shows results of injection with a speaker placed right on the table, we moved the speaker to HAM6 and SQZT 6 and the coupling was lower, so, for this speaker location, we think the coupling at ISCT6 is dominating. The accuracy of the prediction can be assessed by comparing the prediction from the injection on either side of the 80 and 400 Hz peaks to the no-injection level of the 80 and 400 Hz peaks in DARM. So, we are fairly confident that the coupling at ISCT6 is within a factor of a couple of DARM in bands around 400 Hz and possibly other bands.
If the appearance of the peaks is an indication of increased coupling, we may be able to reduce it, there are a couple of other investigations we could do.
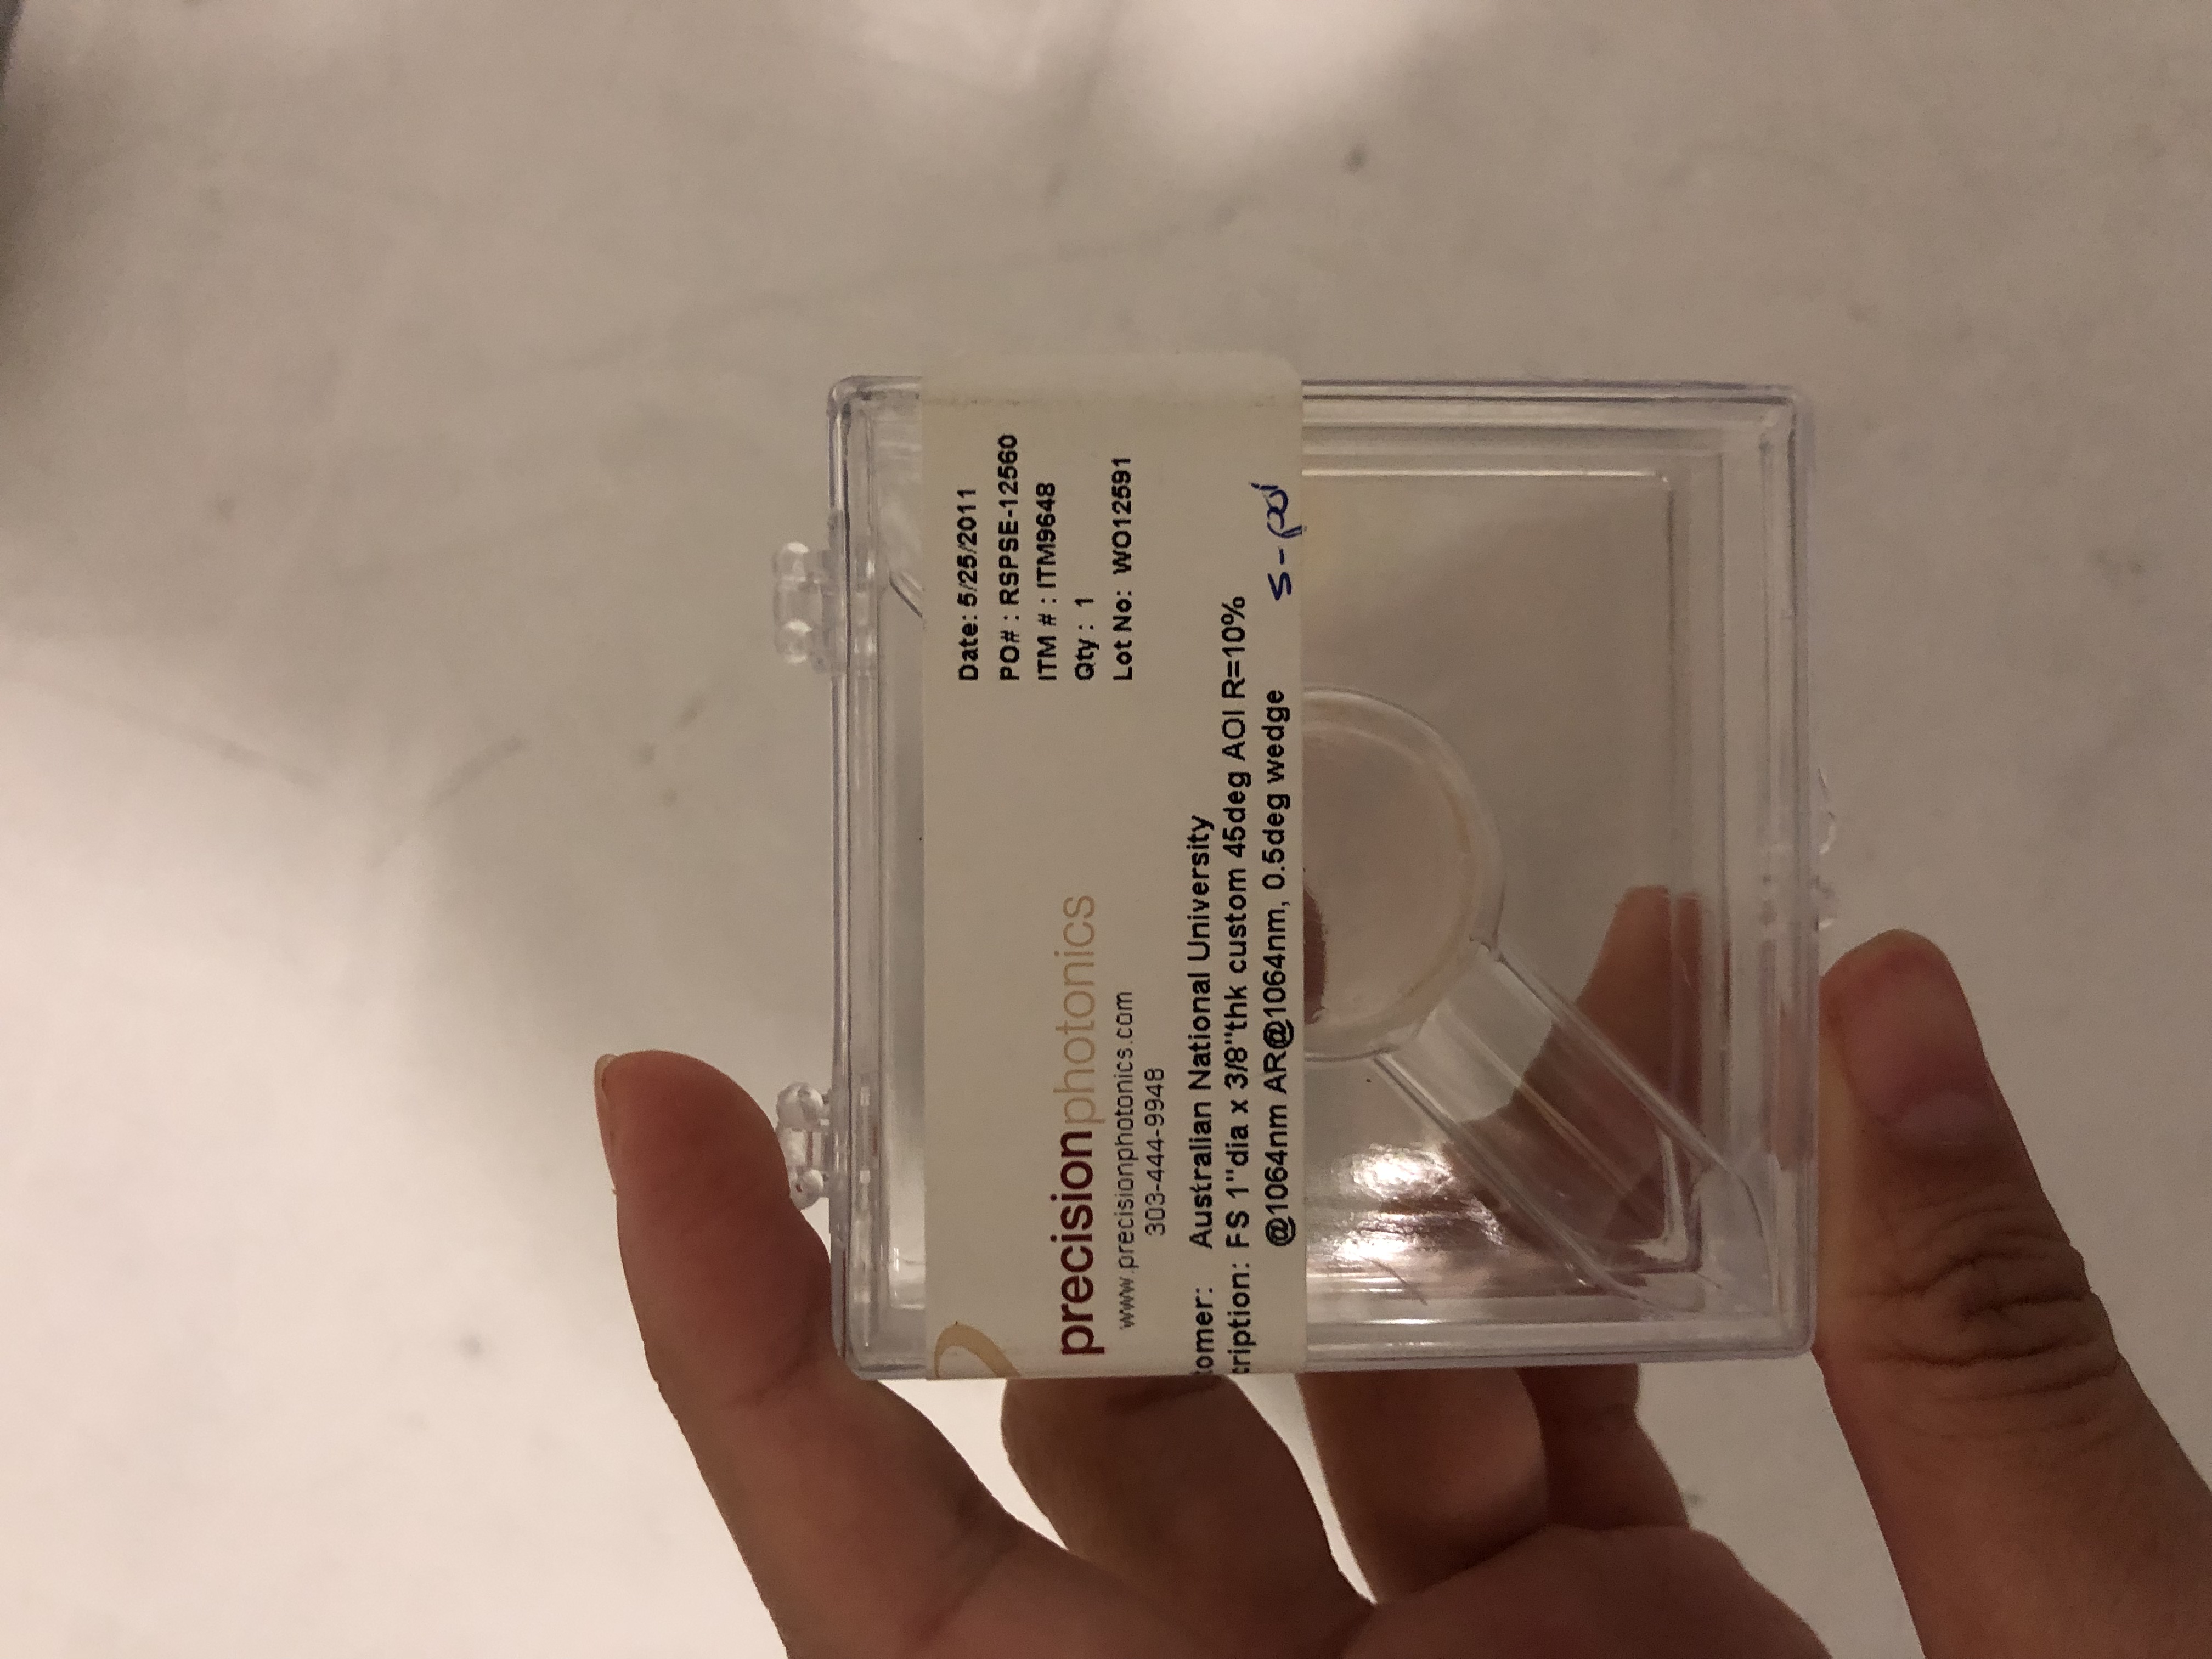
This is to allow us to have a small amount of power going into the fiber coupler without having to reject so much power with the half waveplate and the beam splitter cube. The mirror labeled R=10% but it actually reflects 5% (AR coated for 1064). The coupling efficiency through the fiber coupler is not great at the moment (~20%) but that's plenty enough for us. I set the power back to where we normally operated (~0.02 mW reflected, 0.5 uW transmitted). I think we are ready to have another go at low CLF power.
Keita, Sheila, Craig
We were confused about why my sign flip on the front end UIM stage helped flatten out the PCAL to DARM TF from last night. Keita and I checked all the front end calibration filters, and things seemed to make sense without a sign flip. We also injected some white noise during a lockloss and took a TF from CAL CS LOCK L3 IN1 to the calibrated outputs for each stage: H1:CAL-CS_DARM_ANALOG_ETMX_L{1,2,3}_OUT, as well as the summed total H1:CAL-CS_DARM_CTRL_DELAY_IN1, and compared this to Sheila's DARM model: the models matched well, and no sign flip seemed necessary.
This seems like a good method of verifying the front end calibration, the template is too big to attach but is exists at /ligo/home/controls/craig.cahillane/Calibration/FrontEndDARMCalibrationCheck.xml
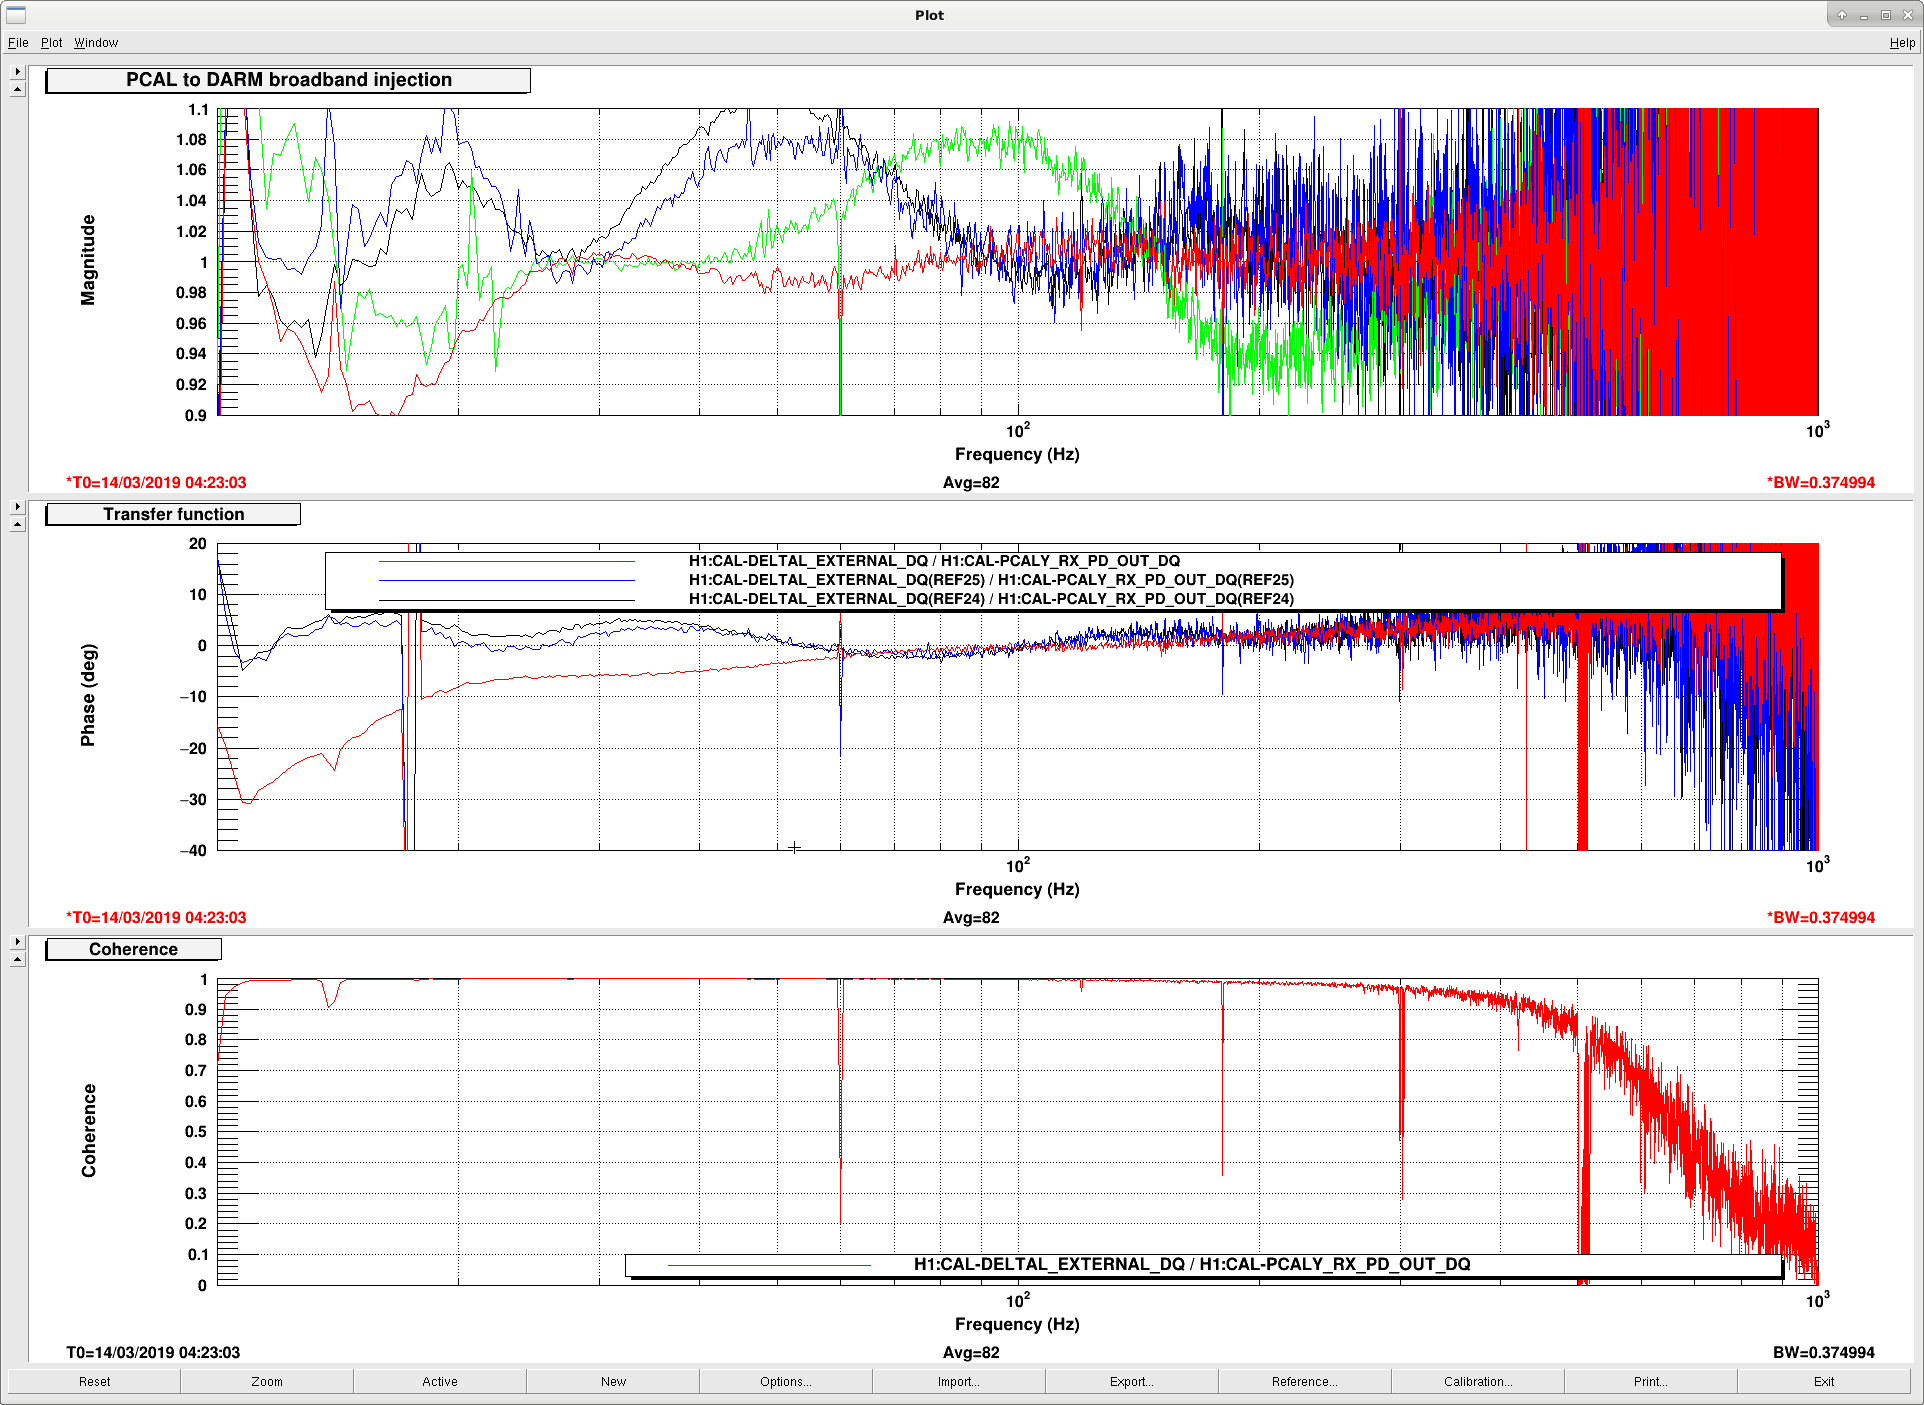
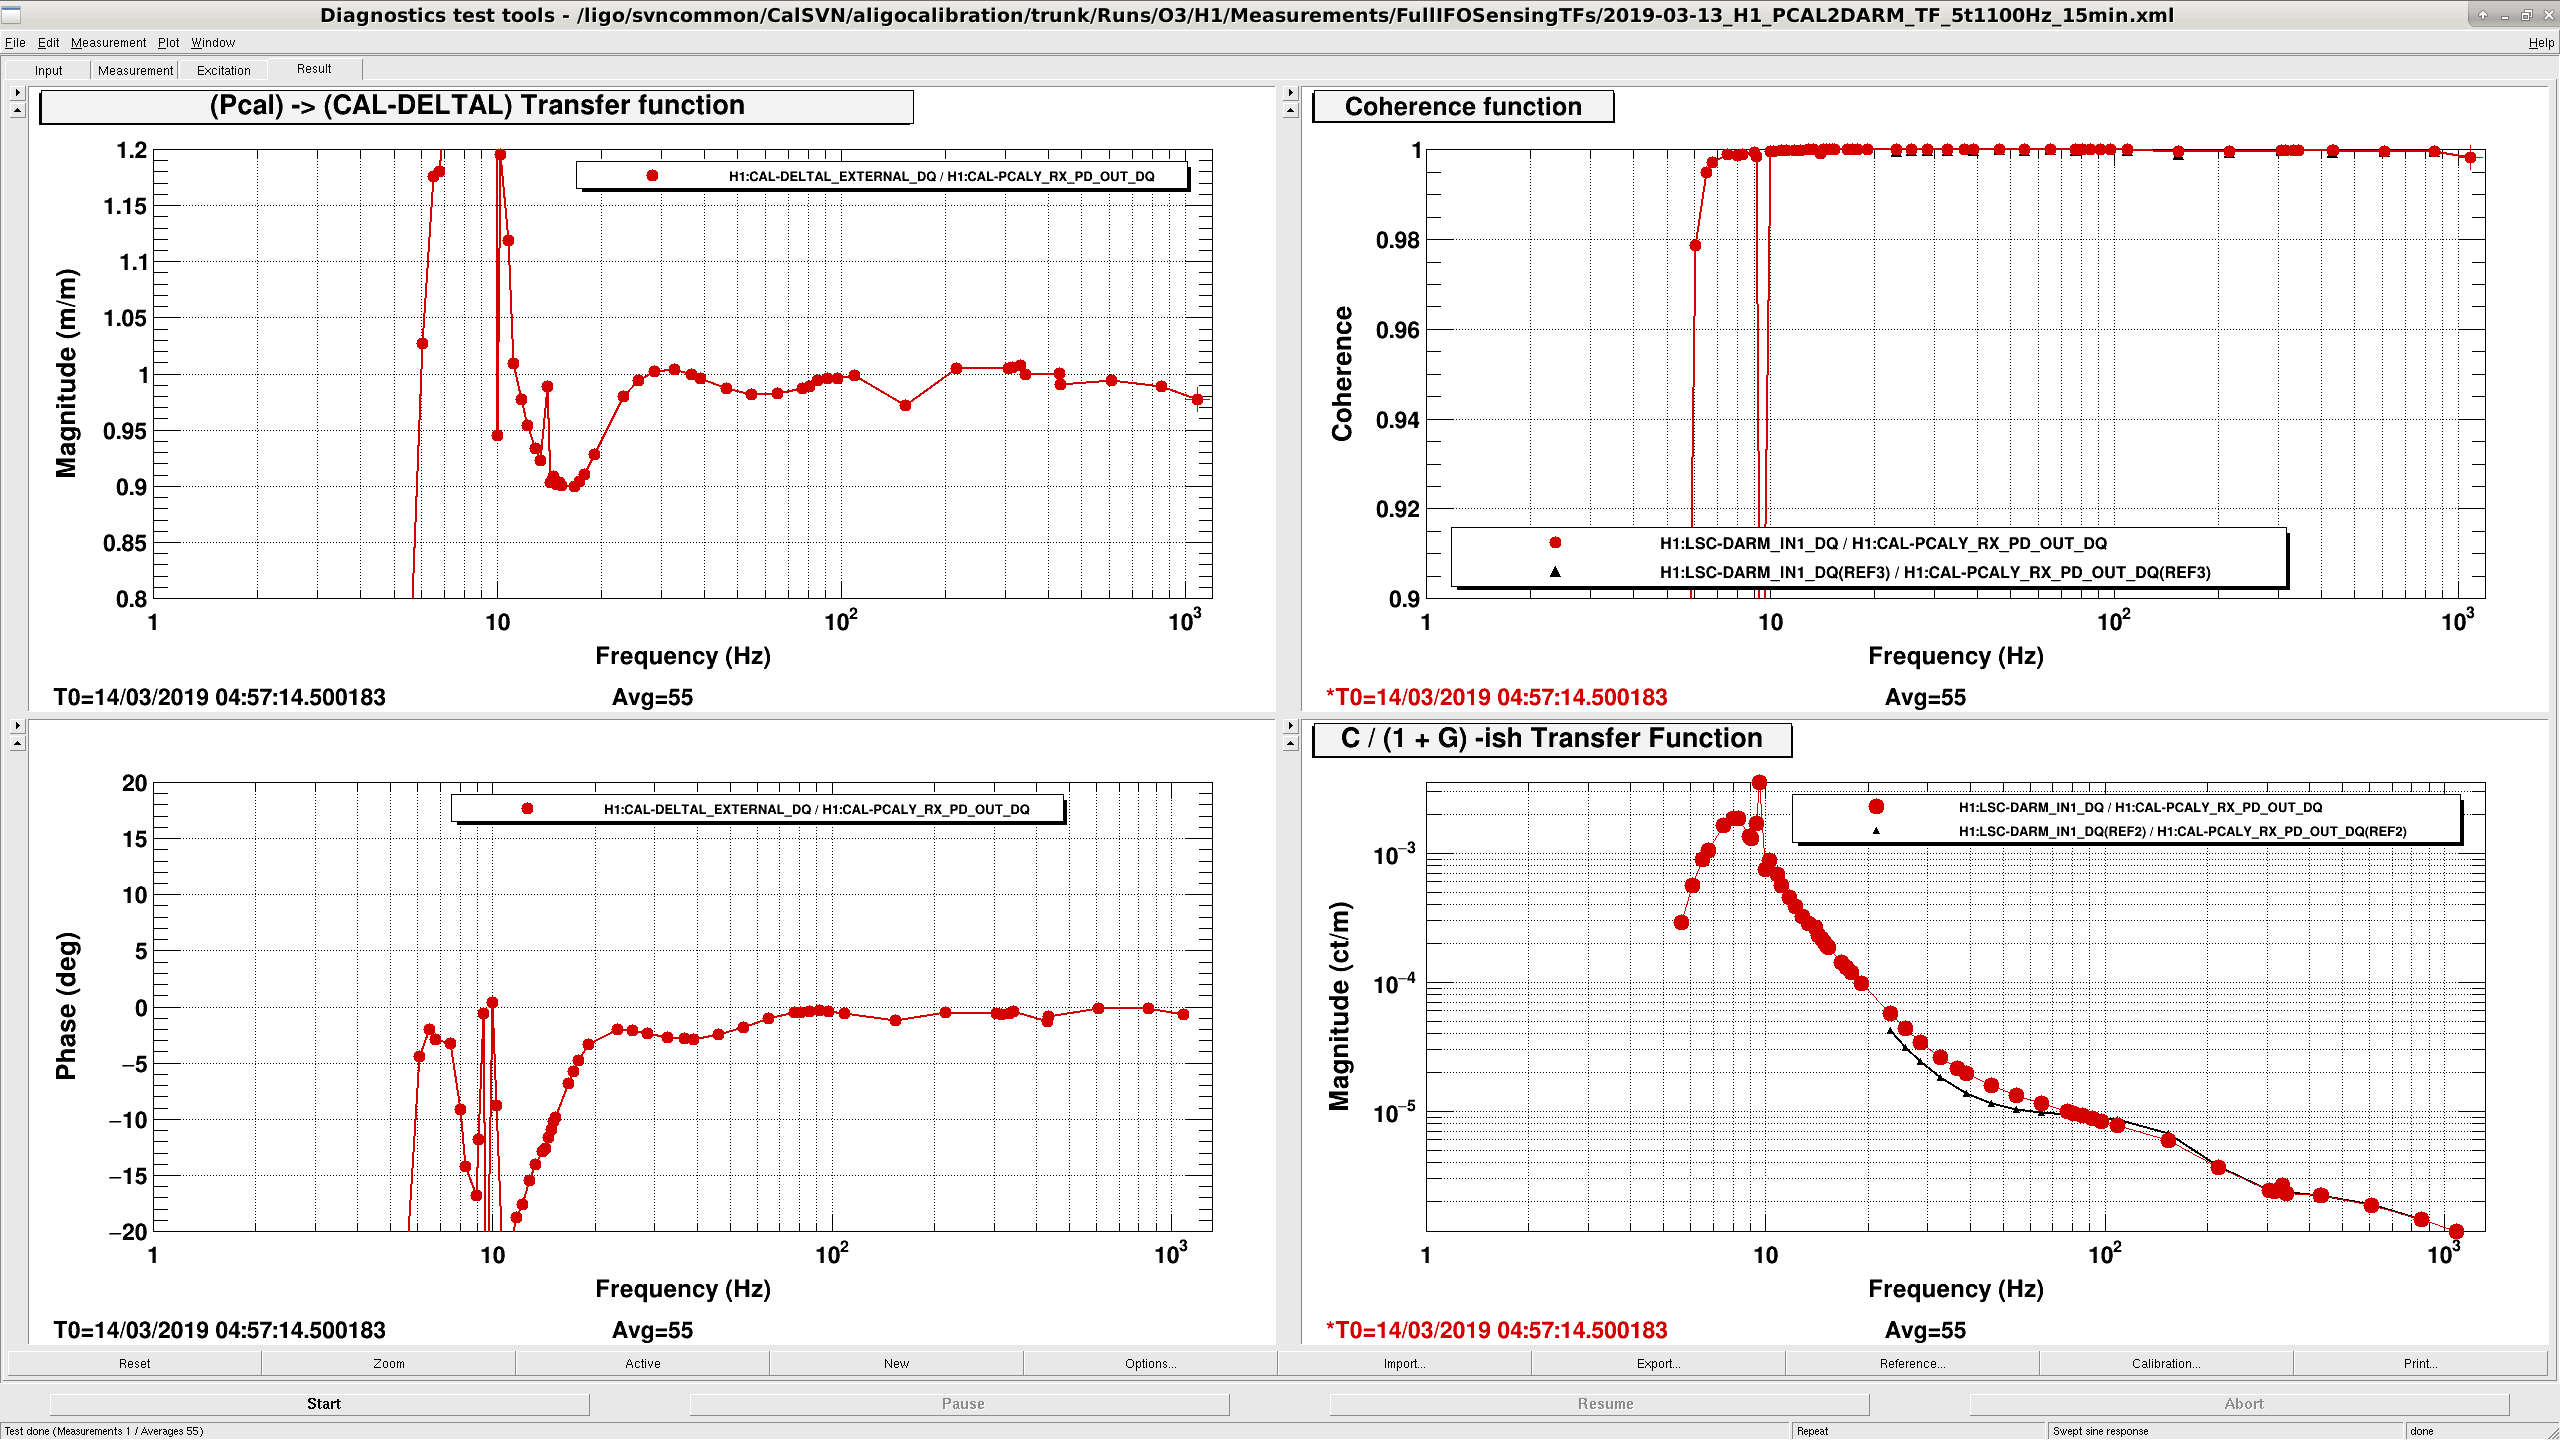
We reset all front end gains to 1.0 and remeasured PCAL to DARM. Things were good to 2% from 25 Hz to 1000 Hz using the sensing function fit from yesterday and Jeff's actuator gains from here. We decided to leave the front end calibration here, even though it underestimates DARM meters at 20 Hz by 10%, because the 20 Hz region doesn't have a huge effect on our reported BNS range. We recognize that this will be a problem for overestimating BBH range, but given the good match at higher frequencies this is the best calibration we have.
Overall calibration sign is incorrect for H1:CAL-DELTAL_EXTERNAL_DQ.
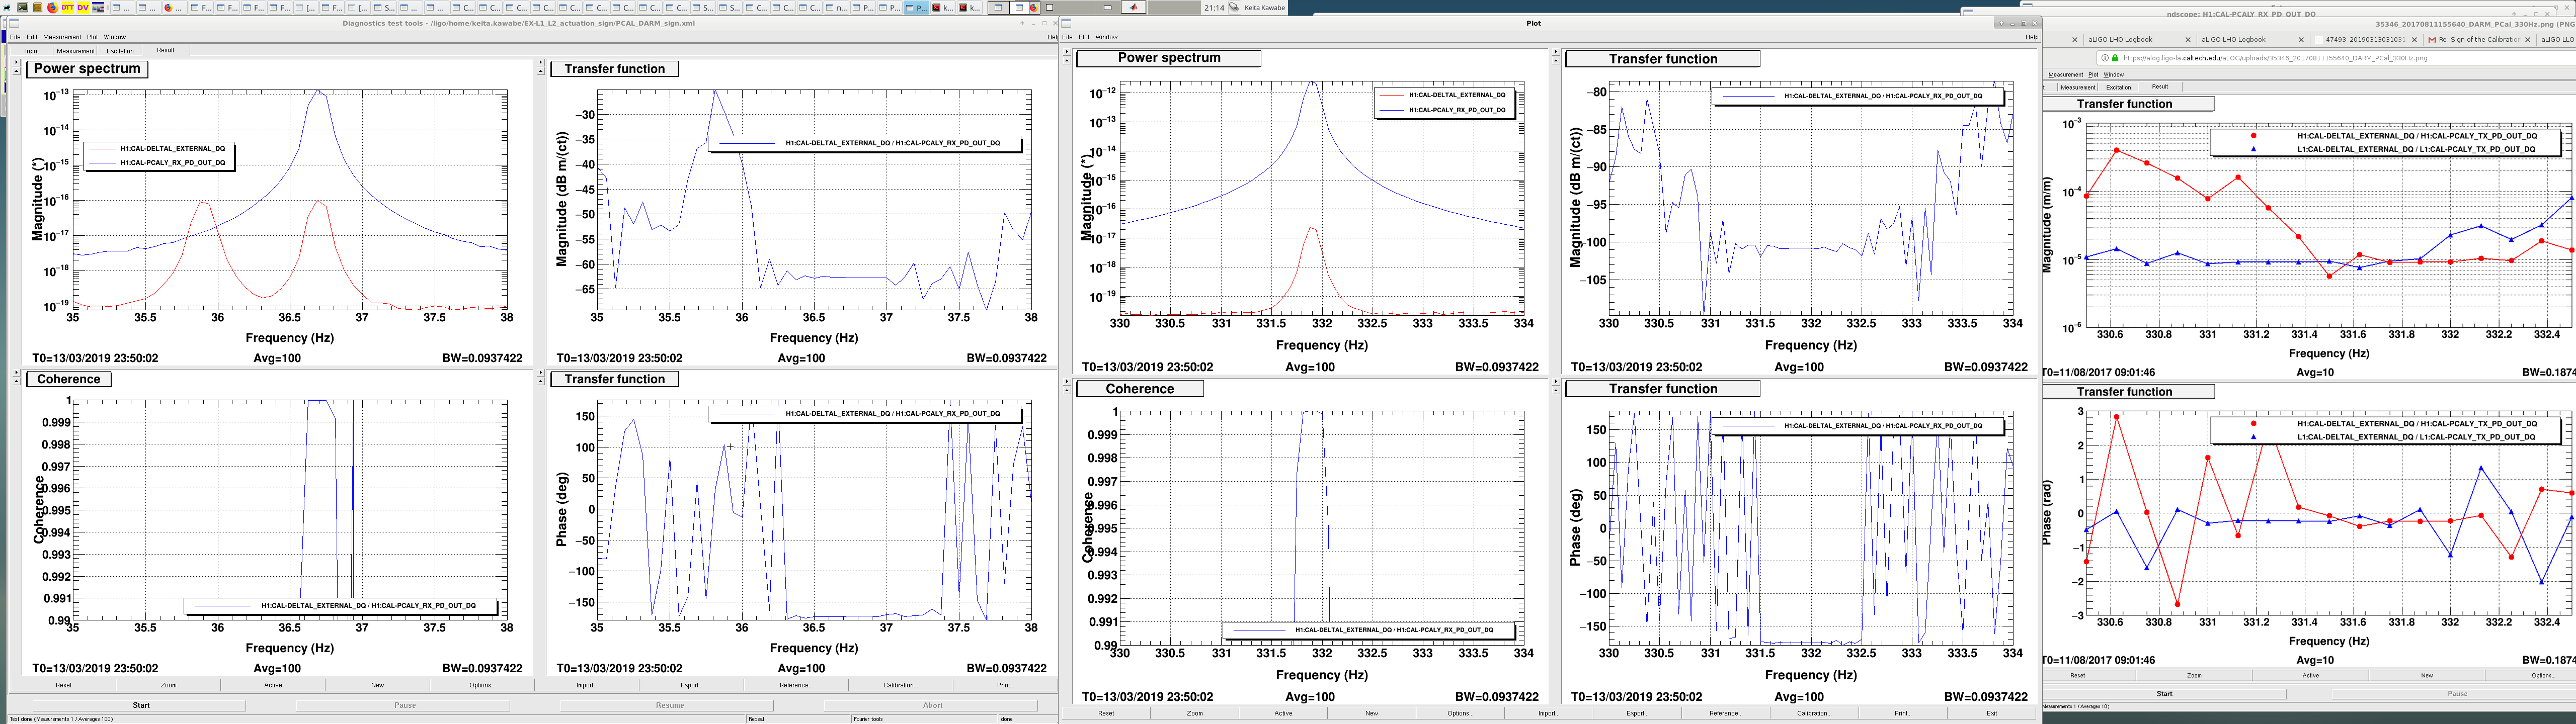
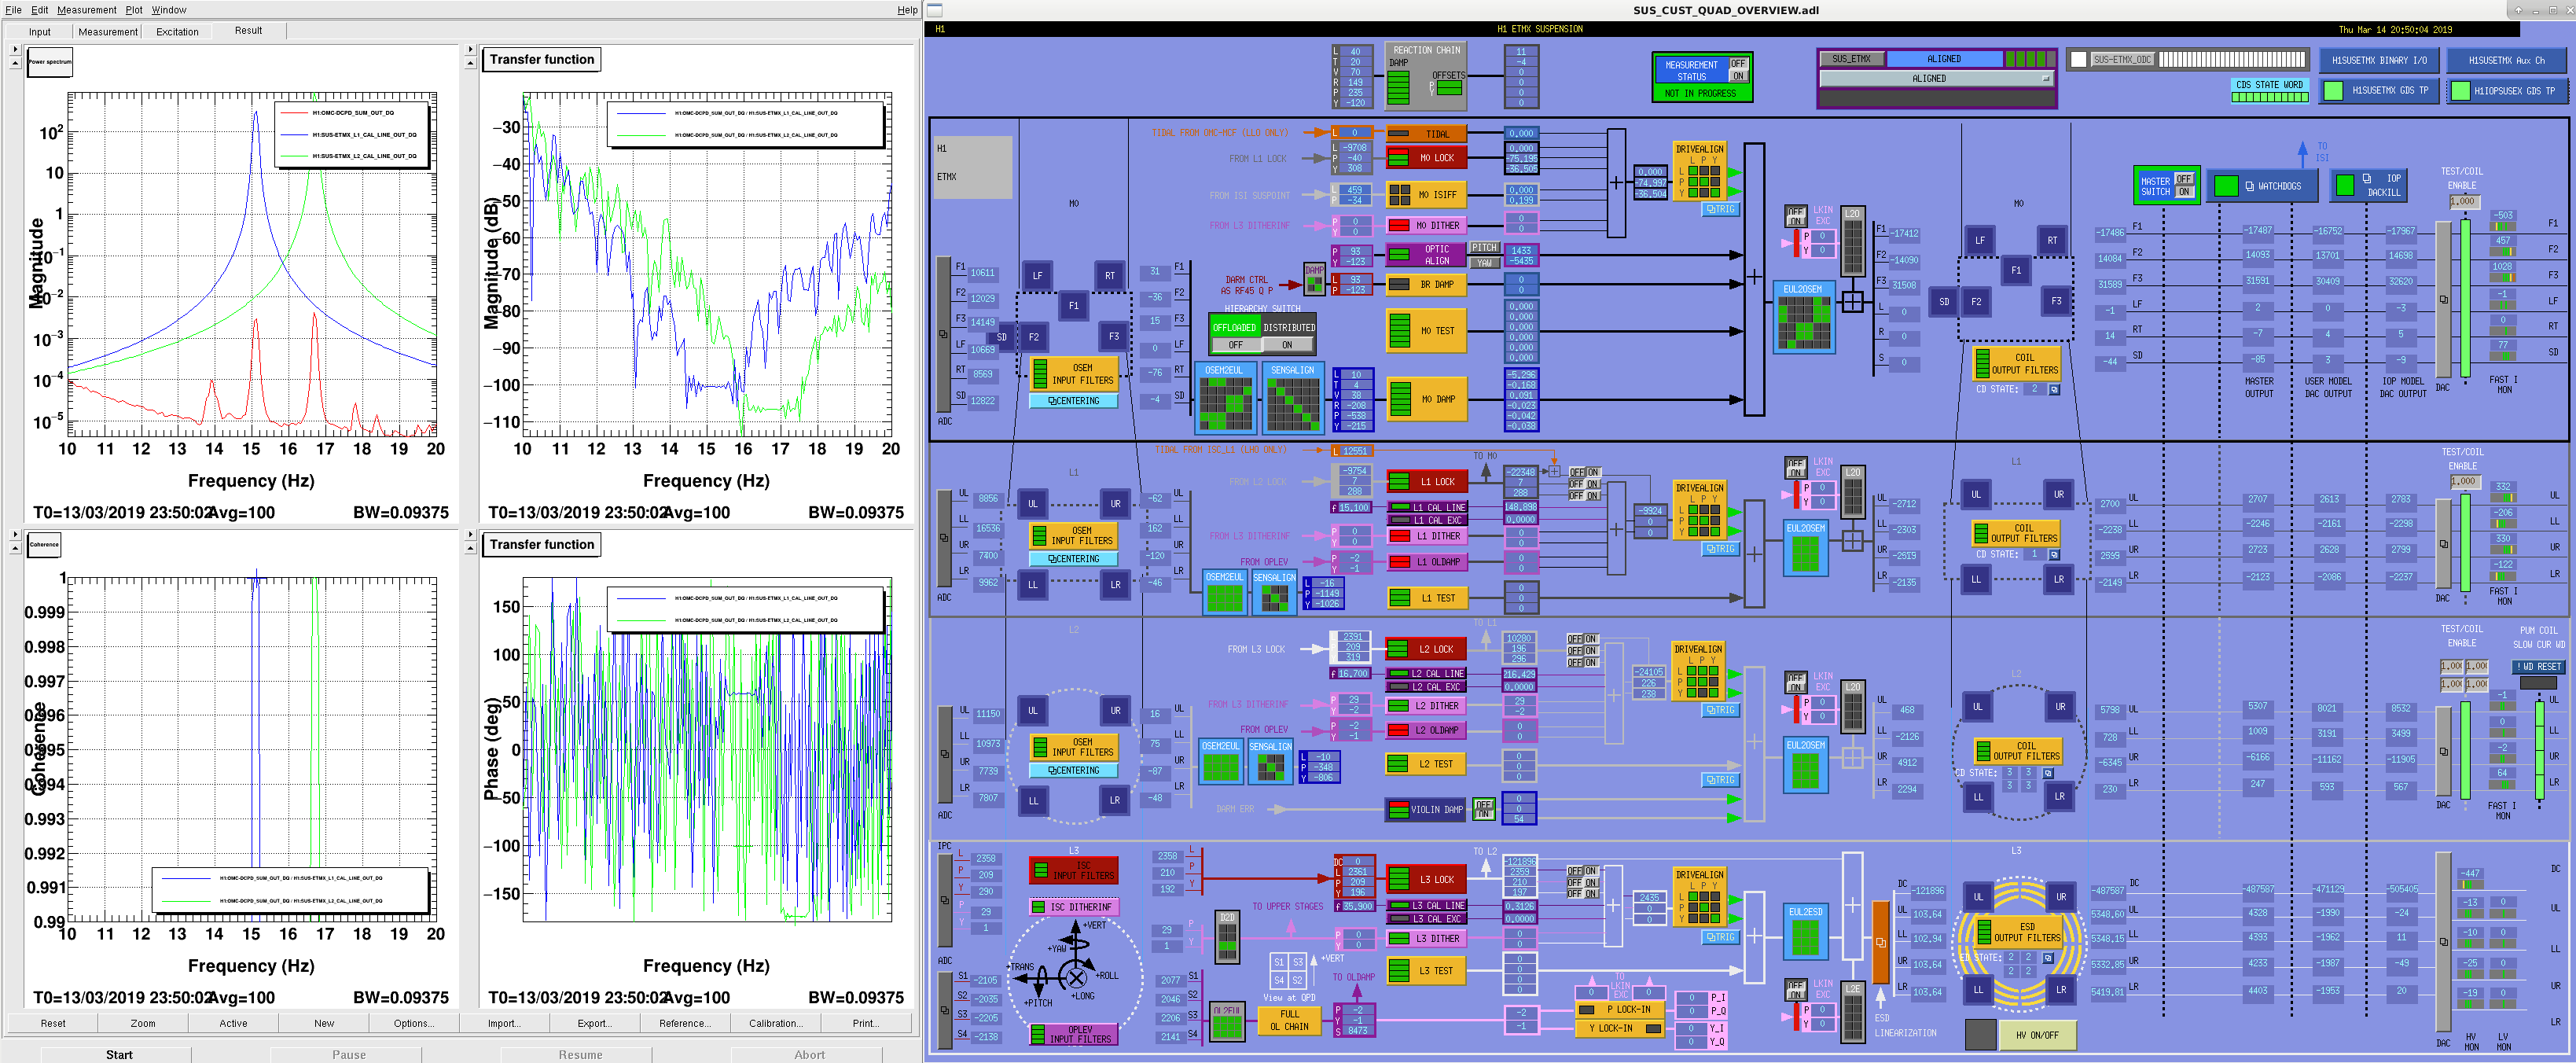
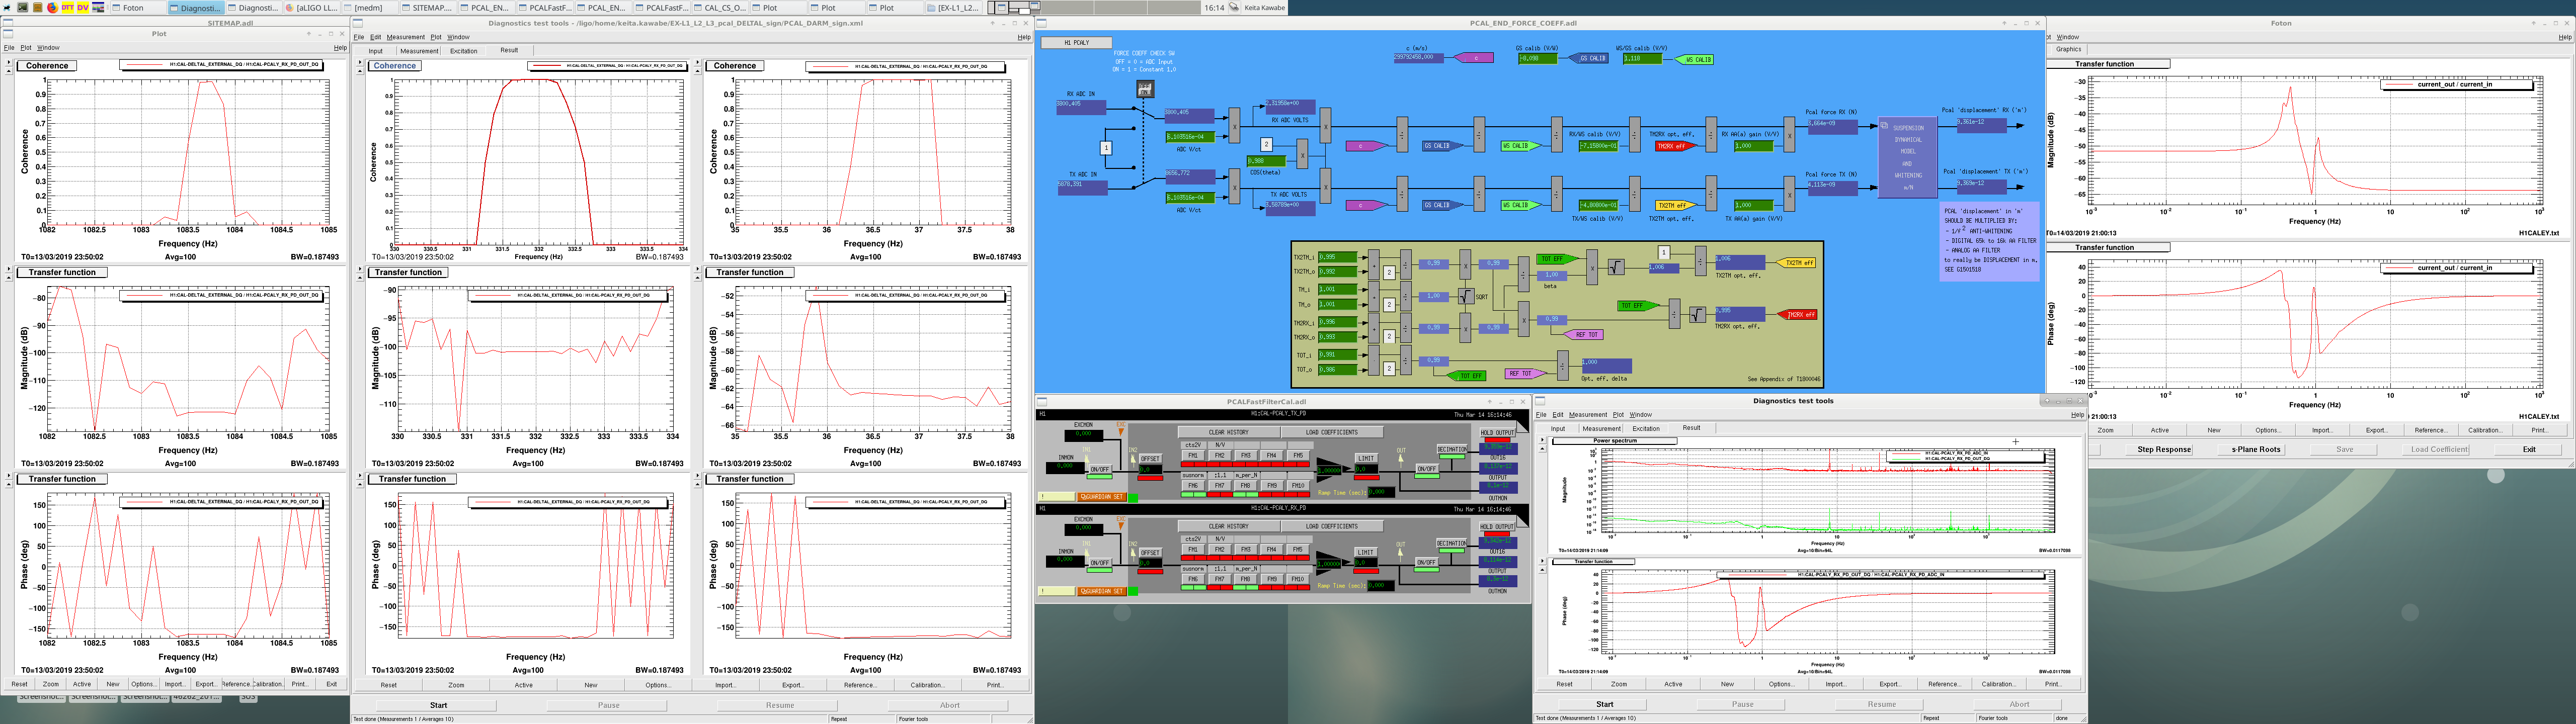
In the attached, left half shows the Pcal_X_RX_PD_OUT_DQ to DELTAL_EXTERNAL_DQ transfer function at three PCALY calline frequencies. DELTAL_EXTERNAL_DQ is calibrated in meters using H1DARMFOM dtt template, but I removed two 1Hz poles from PCAL_X_RX_PD so that basically it becomes the scaled power (positive means more power).
See how the phase of the TF is close to -180 deg at all three callines. This means that the overall sign of DELTAL channel is wrong. During O2, the same measurement showed tha both L1 and H1 were at ~0deg, which is the indication of correct sign (LLO alog 35346). This measurement is quite conclusive and that's the reason why we used this for LIGO and VIRGO calibration sign review in O2.
Incorrect sign is not because Craig did something, it has been like that for quite some time.
Let me explain the idea behind the measurement.
Let the Pcal power be P and the actuation function of Pcal be A such that the change in the Y arm length is
dY=AP.
LIGO-VIRGO sign convention is
dL=dX-dY
where positive dX or dY means longer X or Y arm.
The measured transfer function is
dL/P = (-dY)/P = -AP/P = -A.
Since Pcal pushes EY toward ERMY, A is positive at DC (i.e more power makes Y arm longer), but at frequencies much larger than the highest pendular resonance the test mass response is that of a free mass, so A is negative at e.g. ~36Hz and ~312Hz.
Therefore, if the sign of calibration is correct, power to DELTAL transfer function -A is positive, i.e. the phase is zero, not -180 deg.
Now, PCAL TX (transmitter) and RX (receiver) power channels are calibrated in a funny unit where the complex suspension response is embedded in the RX channel calibration itself (but only in part) as a calibration filter. That filter is shown in the foton (attached rightmost). Important thing is that DC phase as well as the phase for f>30Hz or so are both basically zero degree (phase=-3.2deg at 36Hz). In this sense, for f>30Hz, RX_PD_OUT is just a scaled version of the power. We know that the channel goes positive when there is light on the PD, goes zero when no light, so positive signal means more power.
RX_PD_OUT(f<0.01Hz or f>15Hz) = C*P
dL/RX_PD_OUT = dL/P/C where C is a positive number.
The measured quantity is just dL/P divided by a positive number.
Therefore, if the sign of calibration is correct, phase of RX_PD_OUT to DELTAL transfer function is zero, not -180 deg.
I could in principle do the same analysis using the channel without any calibration, e.g. CAL-PCALY_RX_PD_ADC_IN but this is not DQ channel so I cannot look back, which is inconvenient.
We're trying to get help from JeffK (who is not at the site) and JoeB to learn how to correct the sign in a calibration-mode-friendly way.
Great work, team!
We also measured the relative sign of EX L1 and L2 using ~16Hz callines on Wednesday.
L1 cal line is at 15.1Hz and L2 cal line at 16.7Hz. Since they're right next to each other, it's really easy to make a relative phase comparison of this path. By comparing this measurement with the calibration model we can establish if the relative sign of L1 and L2 actuation model is correct. Our conclusion was that it used to be correct, got incorrect when Craig flipped the L1 sign. That's one of the reasons why we decided to change the L1 sign back.
Let the actuation function from H1:SUS-ETMX_L1_DRIVEALIGN_L_IN to the displacement of the mass be A1, and from L2 to the displacement be A2.
15.1Hz is close enough to 16.7Hz, so DARM OLTF G at 15.1Hz is almost the same as at 16.7Hz. The same thing could be said for the sensing function C too. Because of this, the callines will show up as an error signal as
error=A1*L1calline*C/(1+G)+A2*L2calline*C/(1+G)=(A1*L1calline+A2*L2calline)*C/(1+G).
Transfer functions from L1 and L2 calline to the error signal are
TF1=error/L1calline = A1*C/(1+G)
TF2=error/L2calline = A2*C/(1+G).
If we make the ratio of the two, we'll get the ratio of the actuation function regardless of the sensing and OLTF.
TF1/TF2=A1/A2.
Getting back to the actual measurement (attached left), phase of the Measured transfer function from L1 to DCPD-SUM at 15.1Hz was 58.9 deg, -173.6deg for L2.
phase(TF1/TF2)=phase(A1/A2)=58.9-(-173.6)=232.5deg (measured).
You can use any signal in the sensing path as an error signal, in this measurement I'm using DCPD_SUM. I'm using H1:SUS-ETMX_L1_CAL_LINE_OUT_DQ etc. and L1calline and L2calline, which are directly added to H1:SUS-ETMX_L1_DRIVEALIGN_L_IN etc.
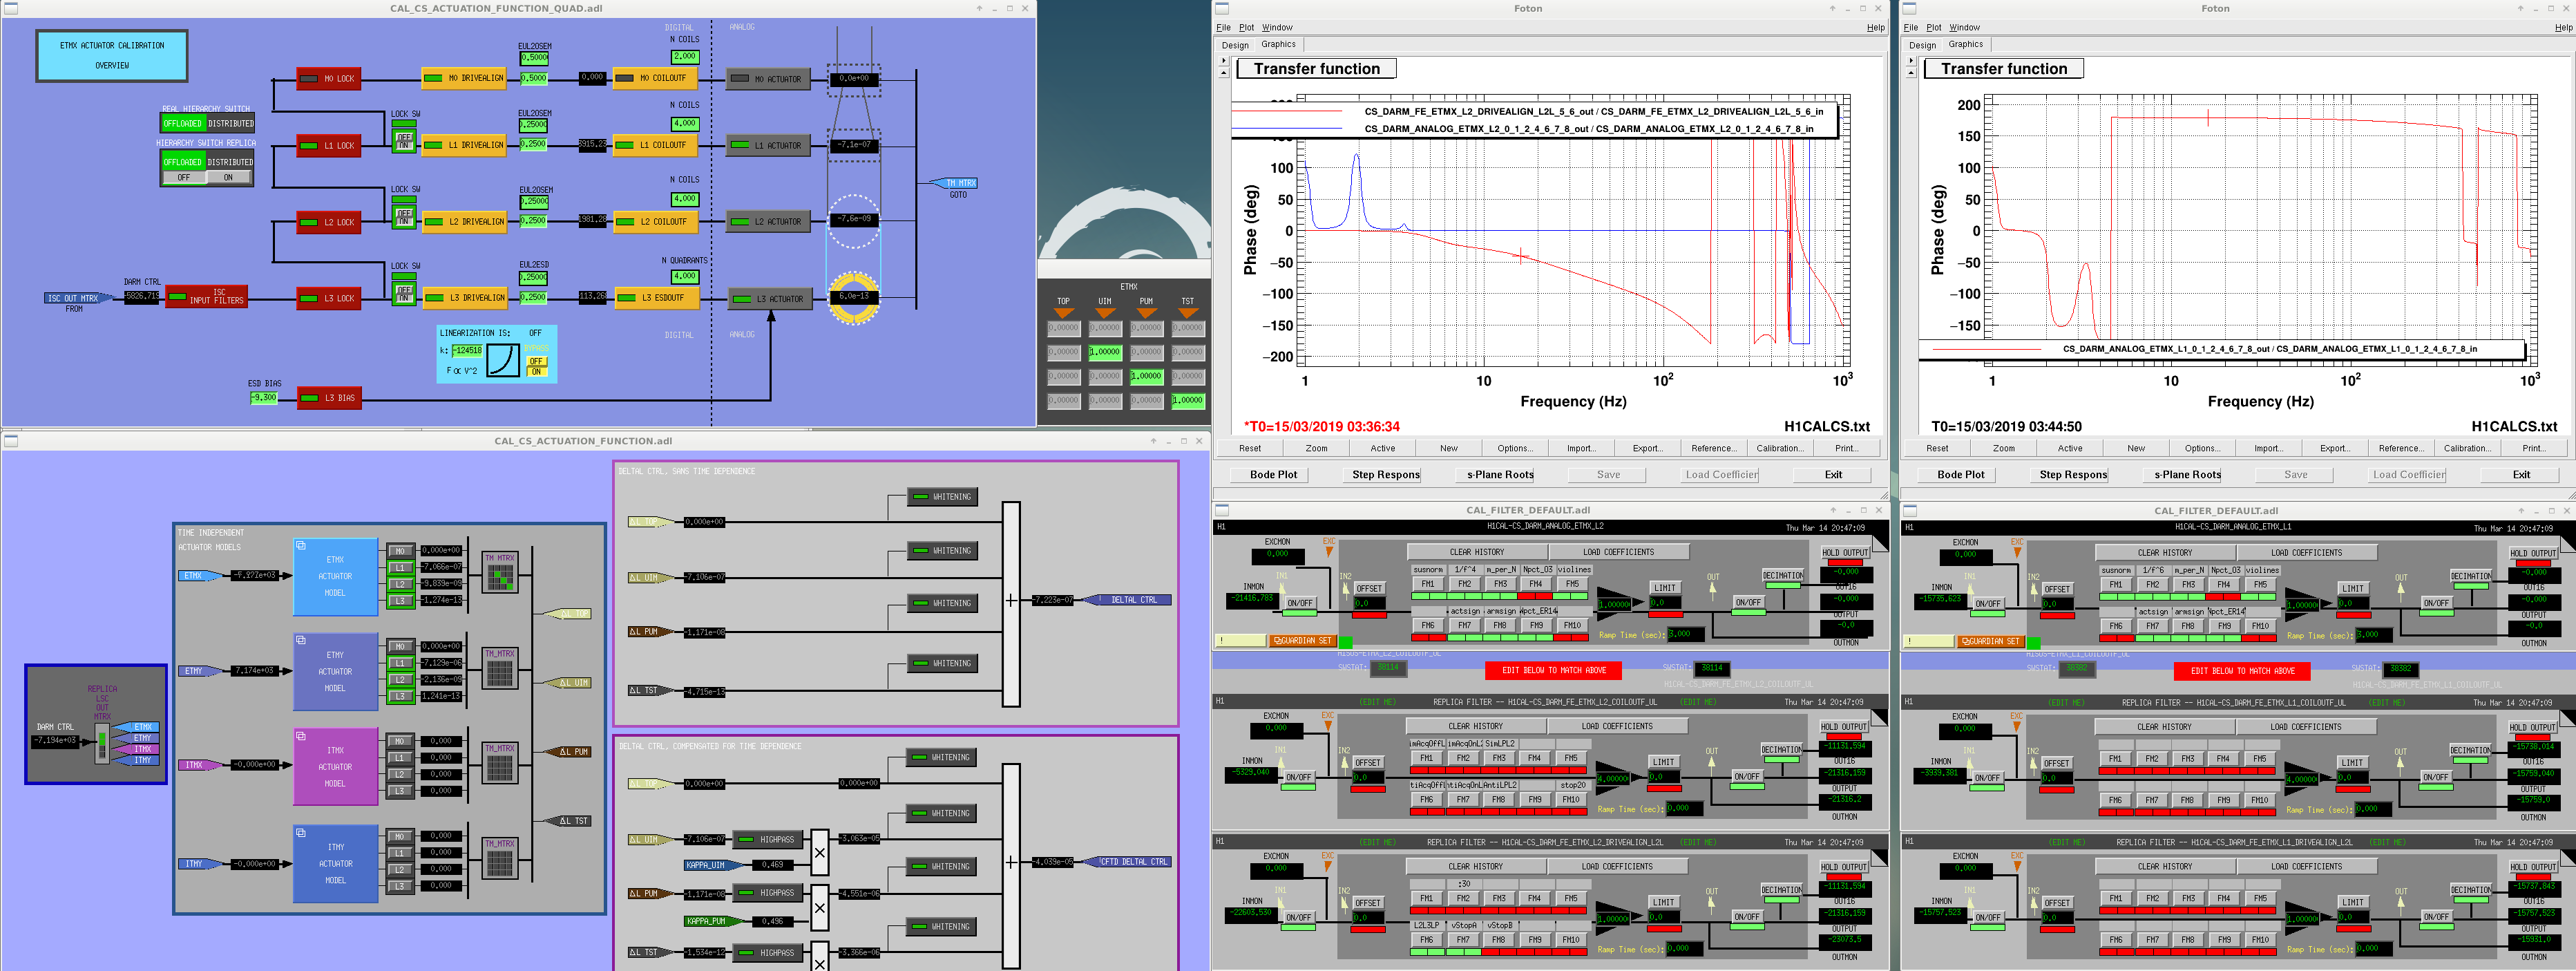
OTOH if you look at the calibration model actuation path, A1 and A2 are the product of three filter modules (DRIVEALIGN, COILOUTF and another one called ANALOG that represents the suspension response in analog world), output matrix that mixes L1 and L2 ANALOG output, and some digital gains. All of these are shown in the 2nd attachment (all gains are positive in this screenshot which represent the status now, but when Craig "flipped the L1 gain" H1:CAL-CS_DARM_ANALOG_ETMX_L1_GAIN was set to -1 rather than 1).
As shown in foton and filter screen shot, ETMX L2 drivealign L2L is -40.7deg at 16Hz, H1:CAL-CS_DARM_FE_ETMX_L2_COILOUTF is just a pass through, and ANALOG_ETMX_L2 was 0 deg, so the total is -40.7deg.
L1 drivealign is a pass through, coiloutf is a pass through, and ANALOG_ETMX_L1 is about 179.1 deg at 16Hz, so the total is 179.1deg.
phase(TF1)=179.1deg
phase(TF2)=-40.7deg
phase(TF1/TF2)=219.8 deg (model).
Comparing the model and measurement, it seems to agree well, which means that the sign of L1 path relative to L2 is correct now.
(But it was not the case when H1:CAL-CS_DARM_ANALOG_ETMX_L1_GAIN was set to -1 because phase(TF1) in the model was -0.9deg due to additional 180 degrees, so the model didn't make sense.)
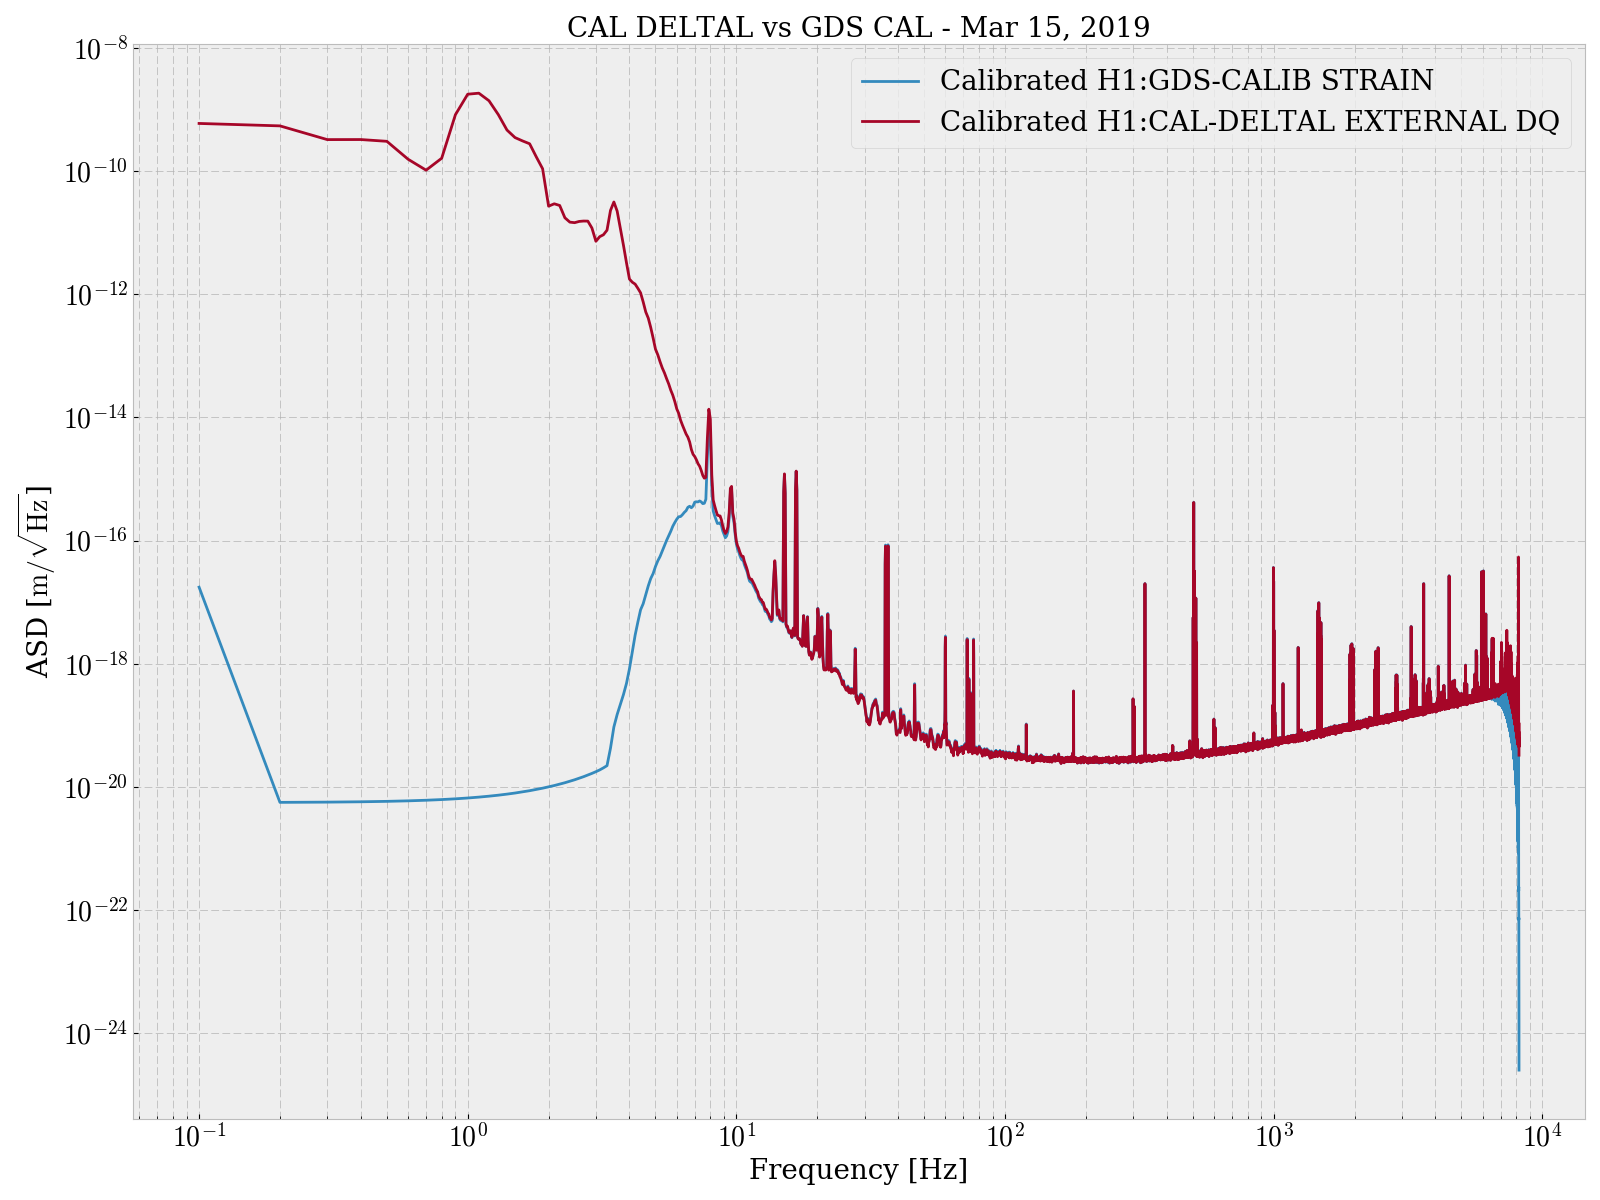
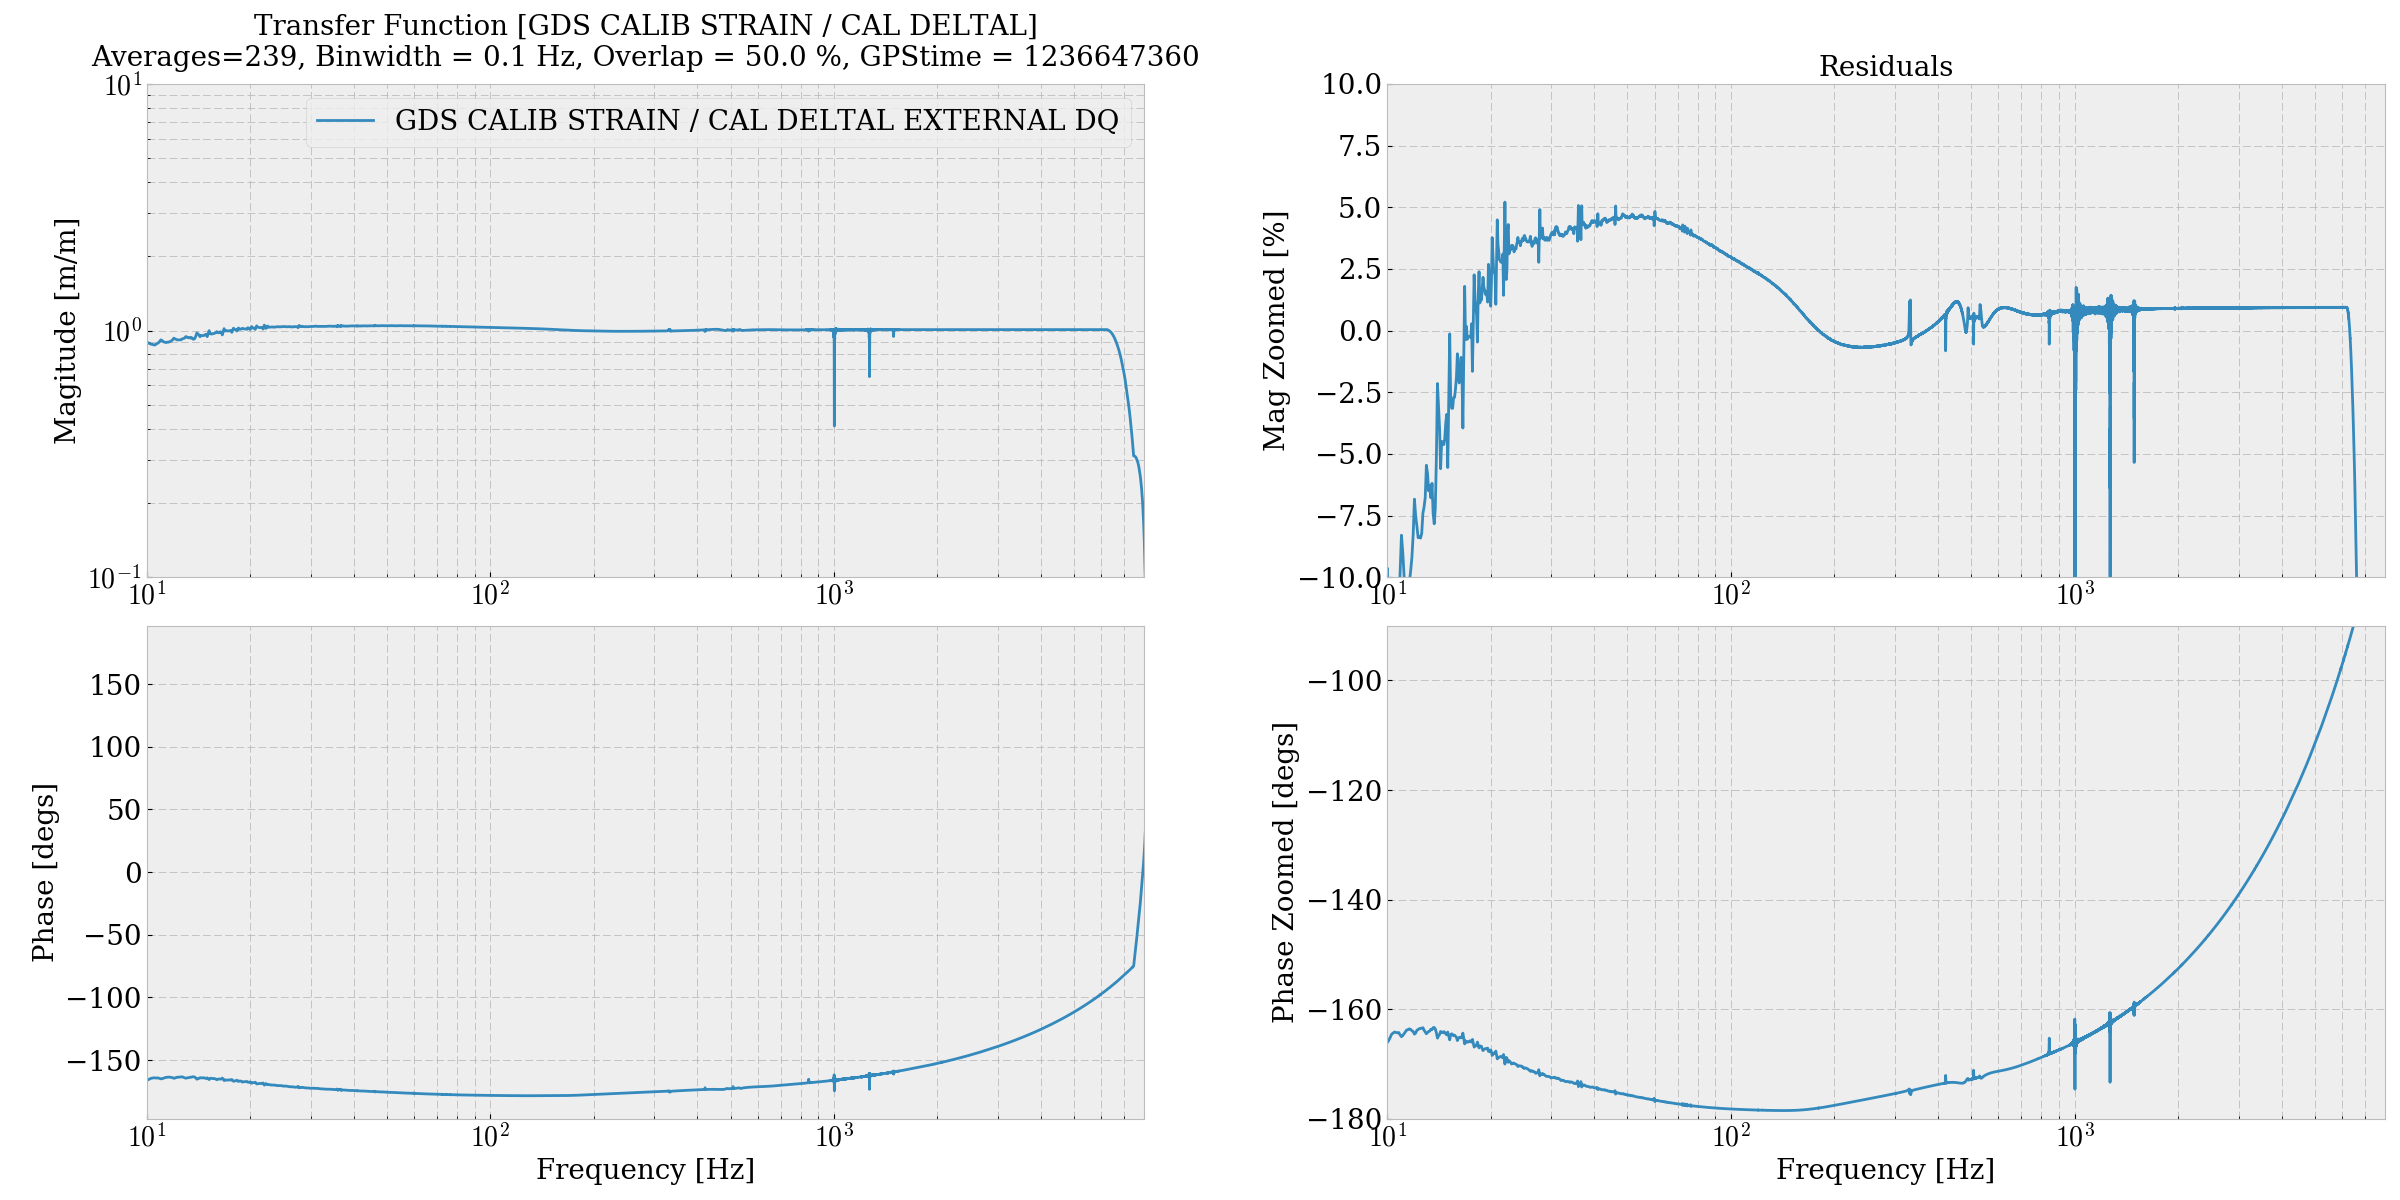
Here is a comparison of the ASD, TF, and uncalibrated time series between GDS CALIB STRAIN and CAL DELTAL EXTERNAL. The calibration applied to GDS CALIB STRAIN was just a multiplication by L = 3994.5 m. The calibration applied to CAL DELTAL EXTERNAL is attached as .txt: this is what is in the DARM FOM currently. These calibrations are applied to both the ASD and TF plot. There appears to be around -170 degrees between GDS CALIB STRAIN / CAL DELTAL EXTERNAL DQ.
Oh sorry I attached slightly wrong file for sign-flip measurement. This is what I wanted to show.
Test of DTT calibration for DELTAL (suspicious).
Since there was still some possibility that the DTT calibration was wrong, I asked JoeB to do the same measurement using LLO template but somehow he couldn't reliably pull the H1 data when he tried. I did it on my own following JoeB's advice.
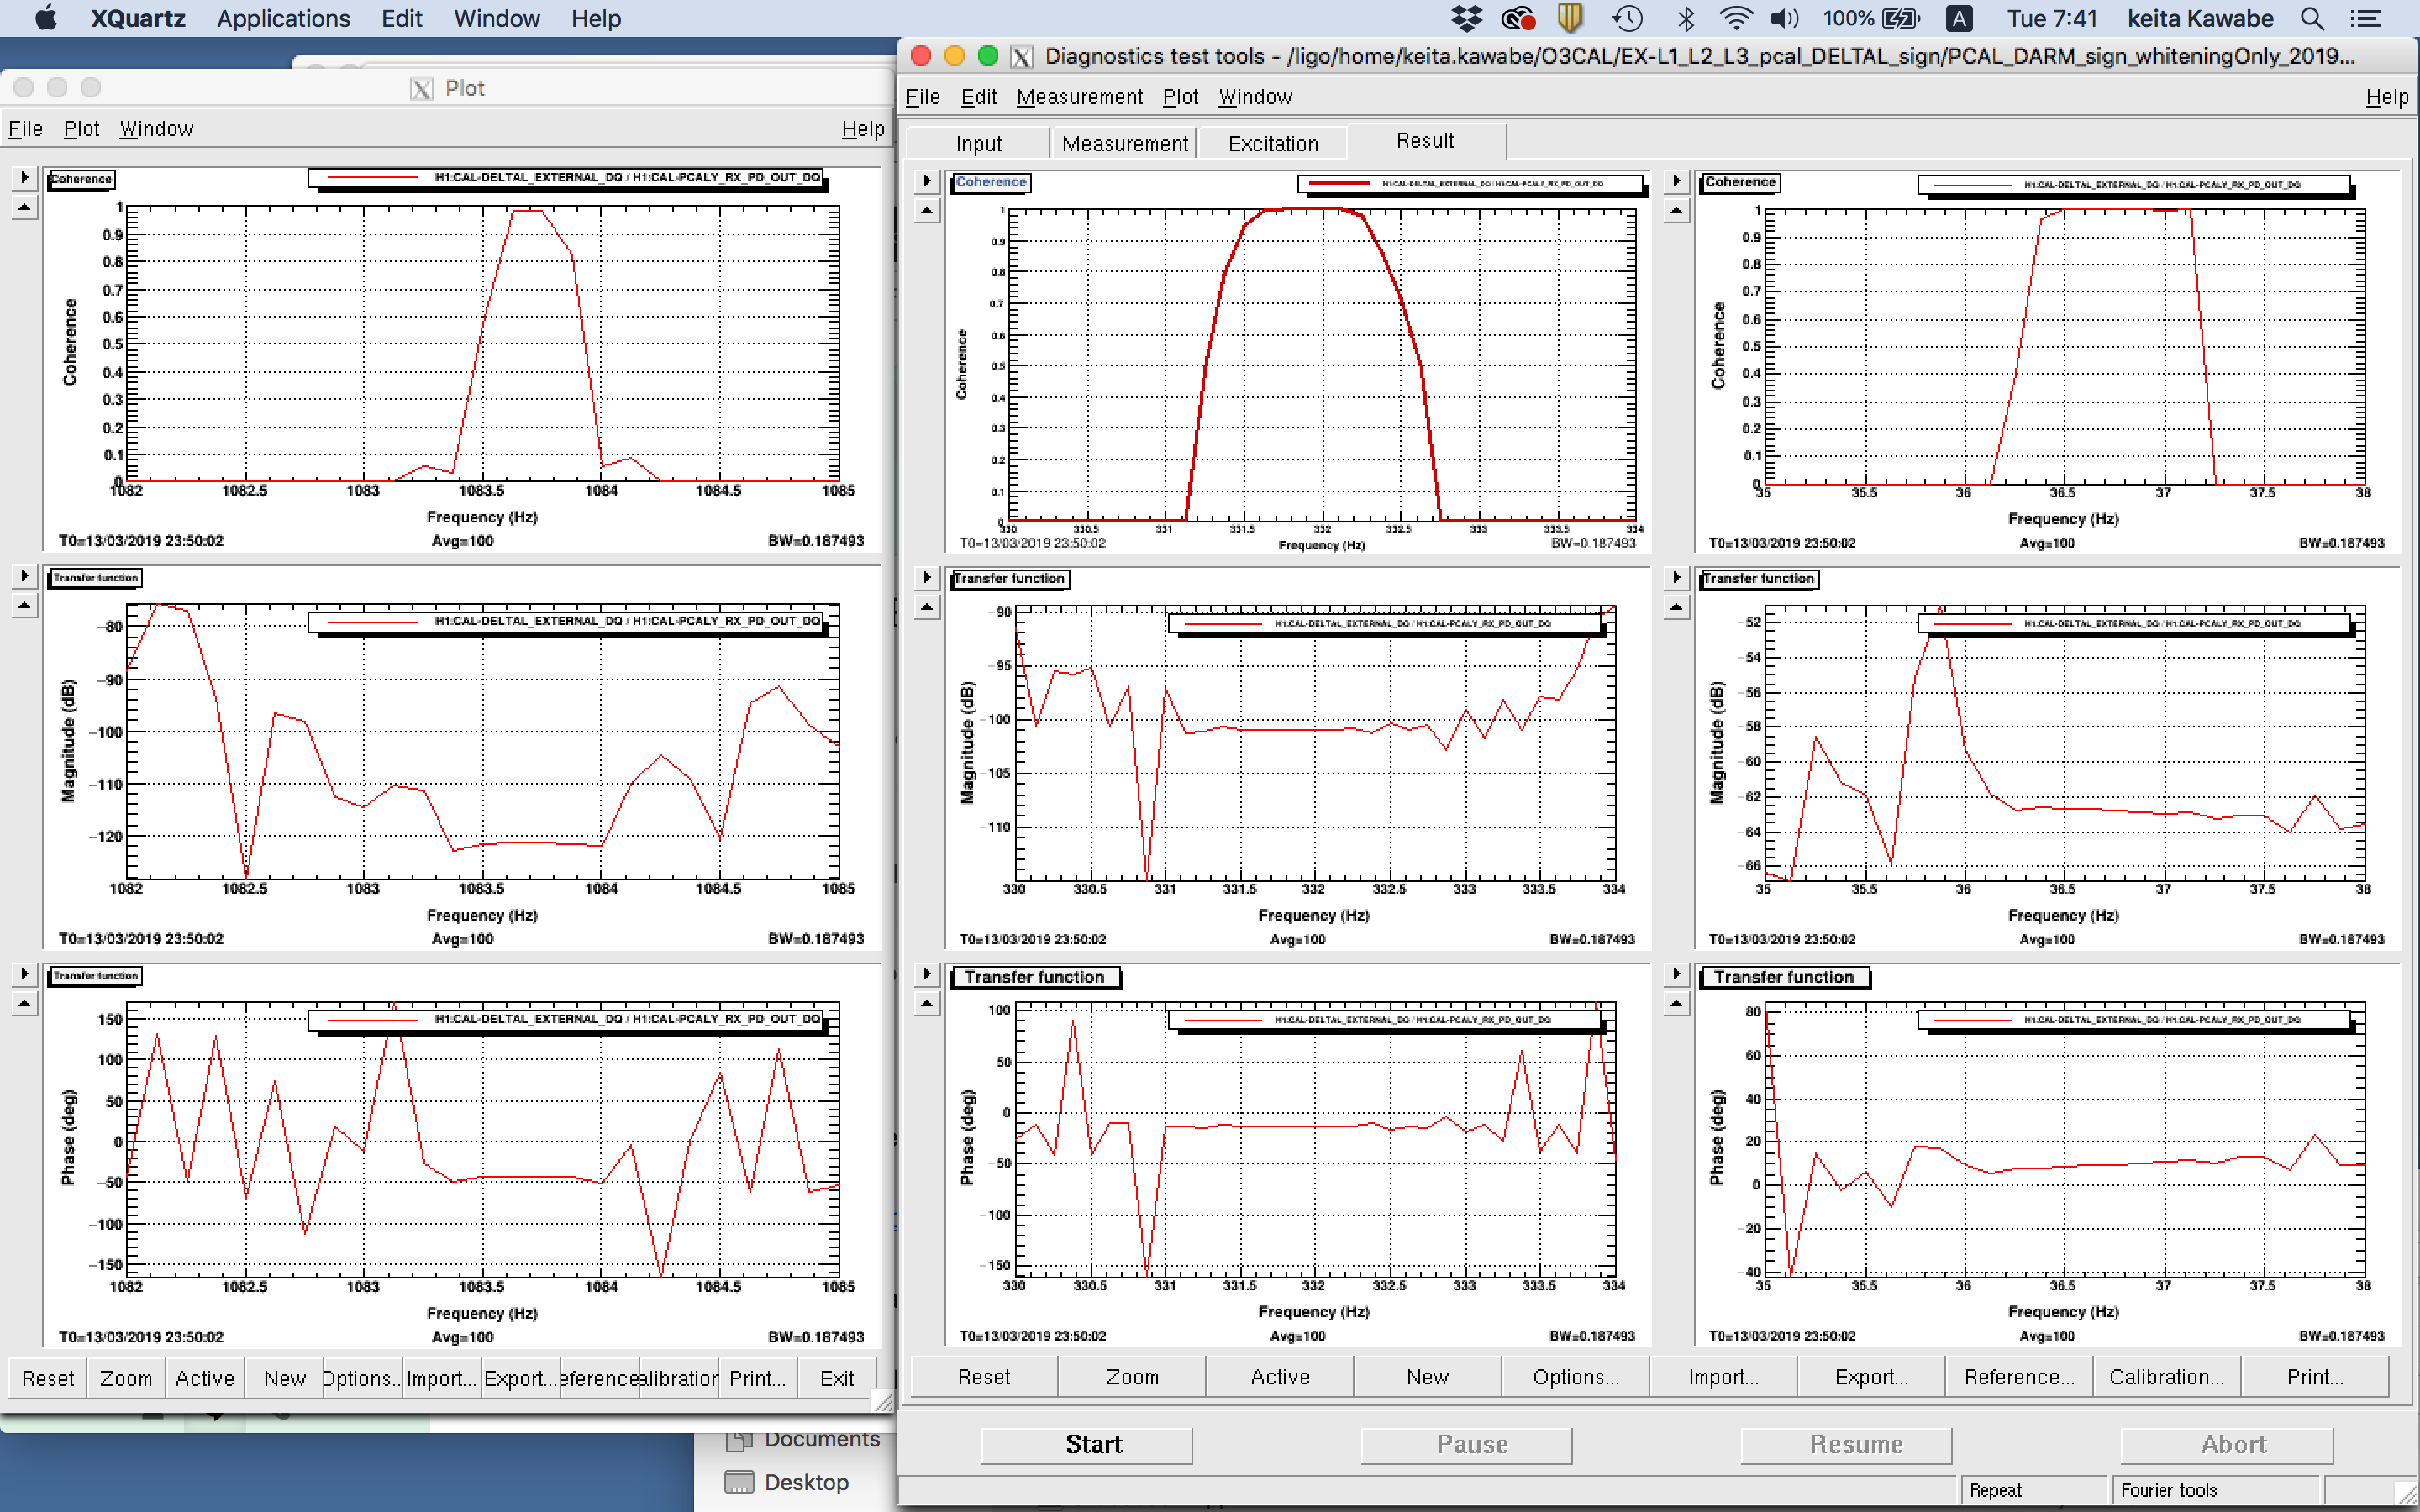
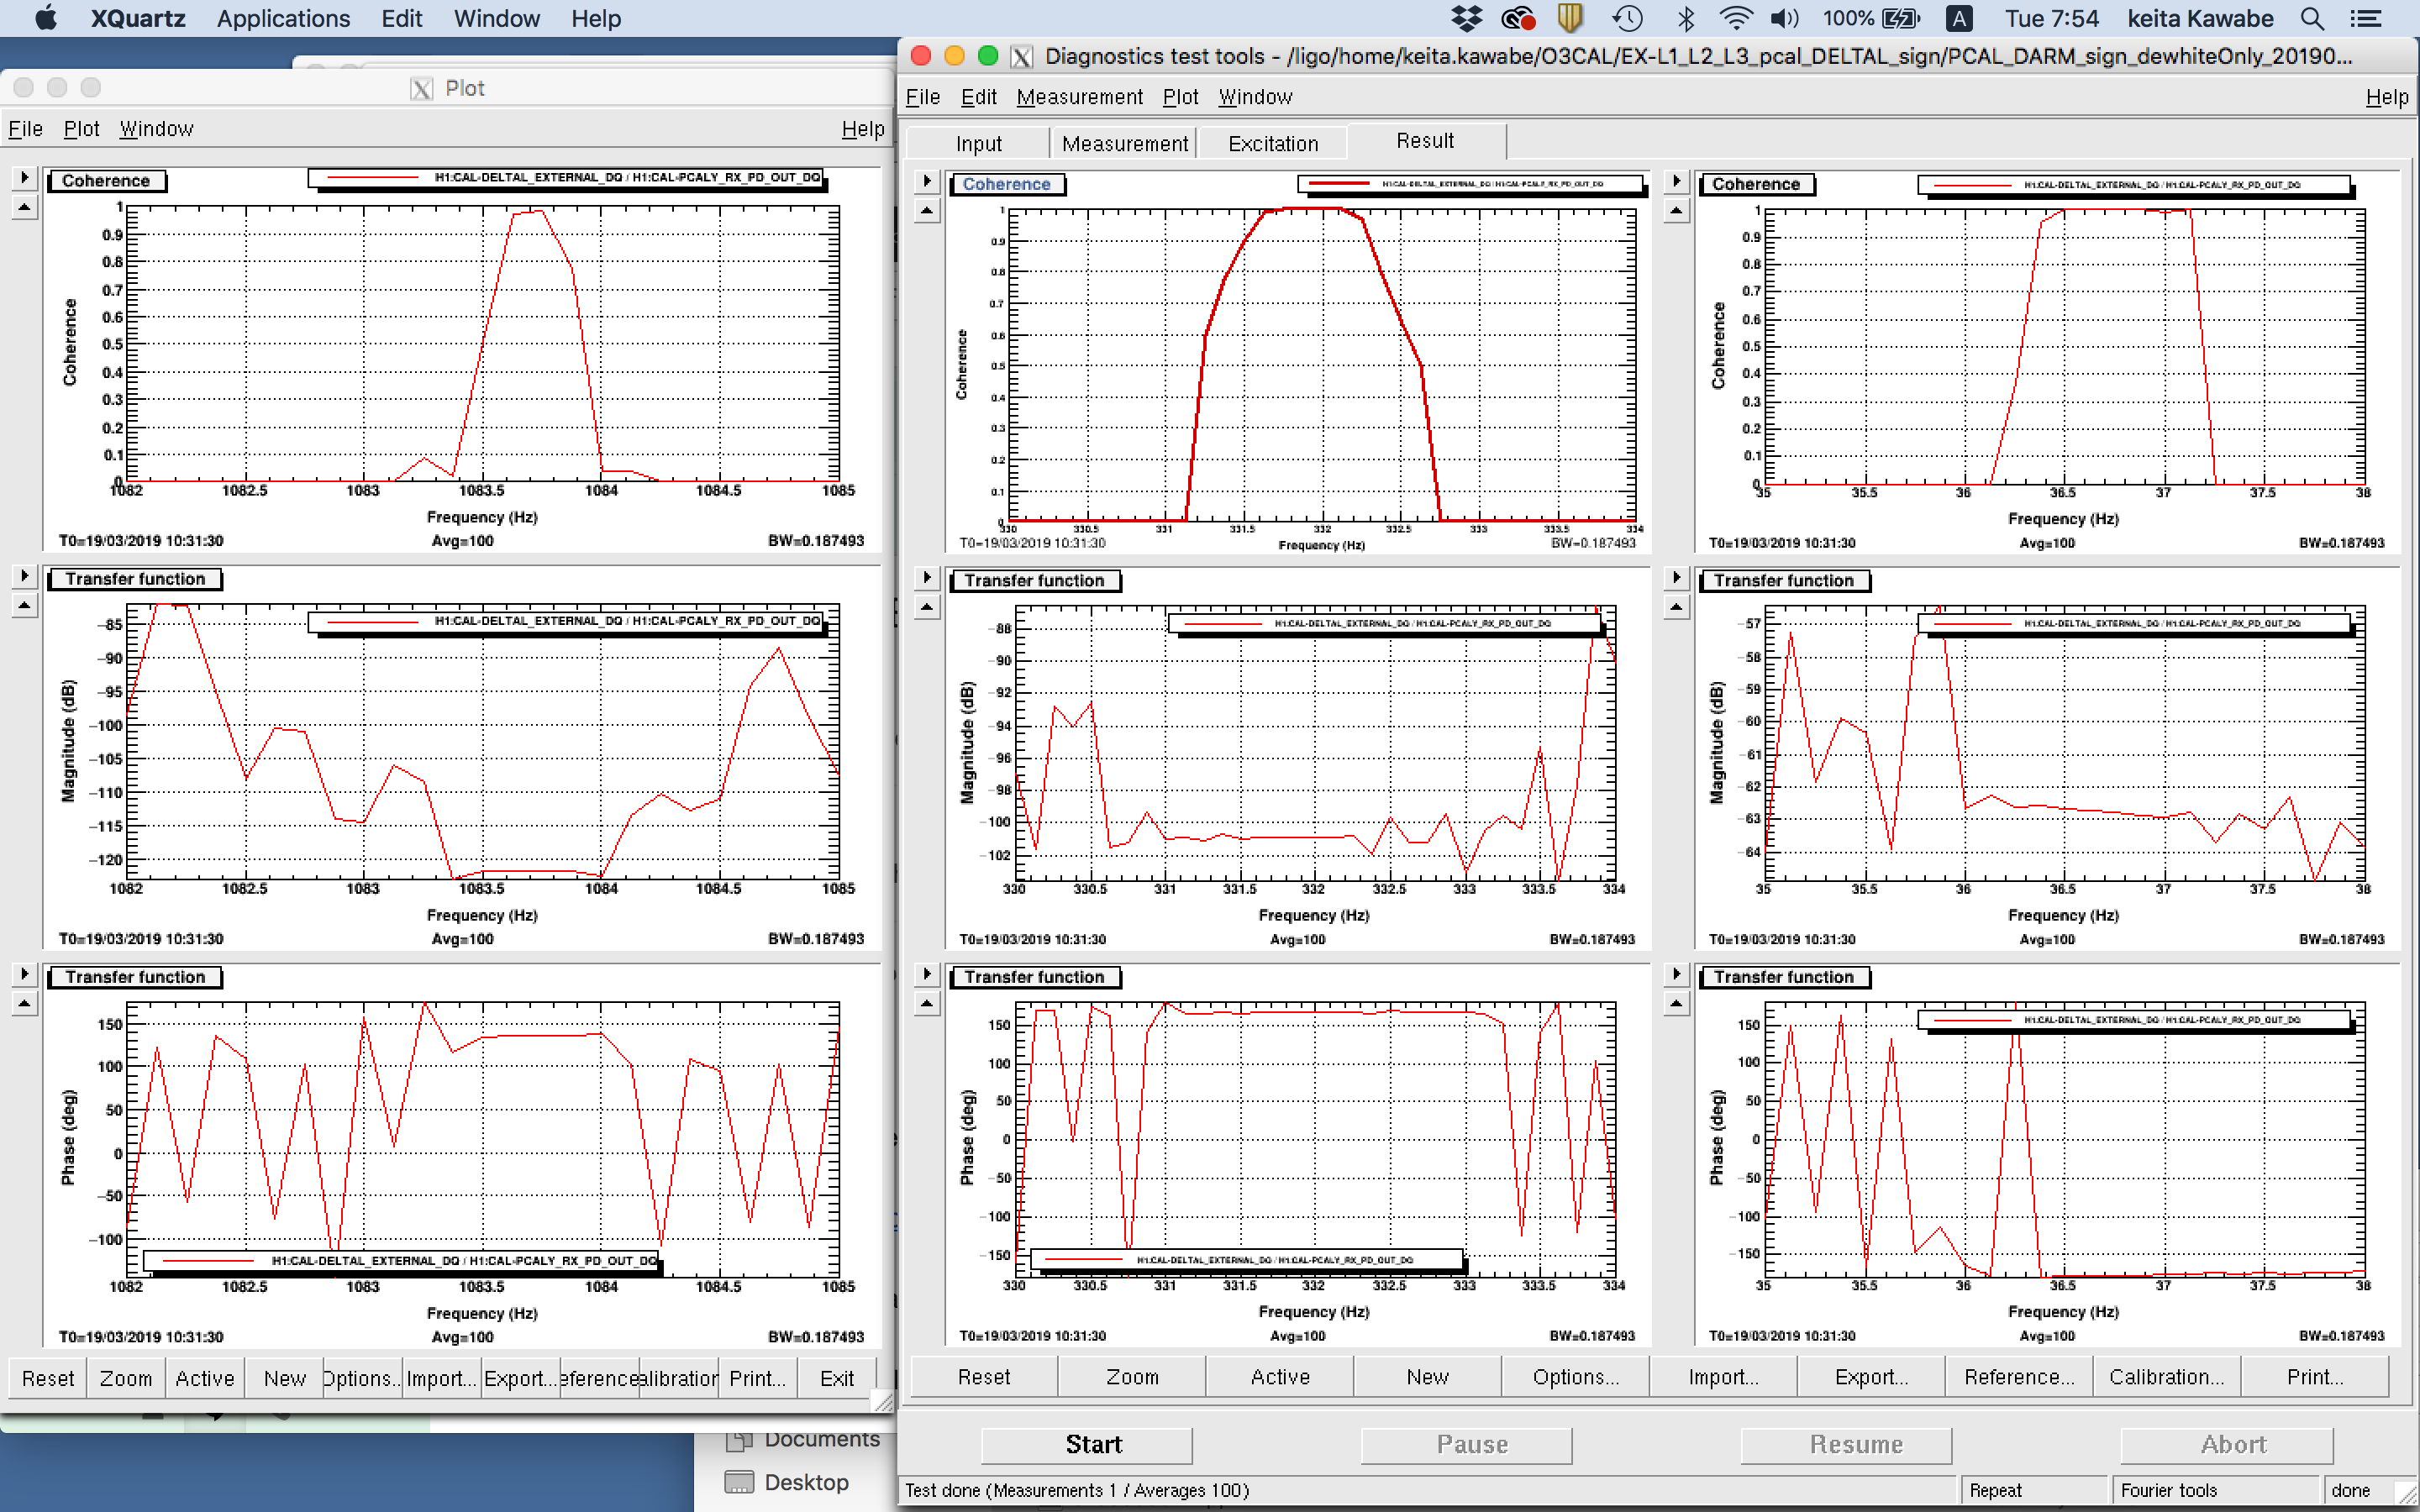
I removed the DTT calibration from LHO DARM FOM template, and put 6 pairs of [z,p]=[30,0.3] as dewhitening. This should be good enough. For Pcal I didn't change anything from my previous measurement (i.e. remove DTT calibration which was two poles at 1Hz, and just used the gain of 1 as the calibration).
The result shows that the sign was actually correct before we put the overall sign flip in (first attachment), and got incorrect after the overall sign flip (second).
The DTT templates were saved as
/ligo/home/keita.kawabe/O3CAL/EX-L1_L2_L3_pcal_DELTAL_sign/PCAL_DARM_sign_dewhiteOnly_20190313235002.xml
/ligo/home/keita.kawabe/O3CAL/EX-L1_L2_L3_pcal_DELTAL_sign/PCAL_DARM_sign_dewhiteOnly_20190319103130.xml
I have no idea how DTT template calibration is officially generated, so this could still be an intended behavior. Investigation continues.
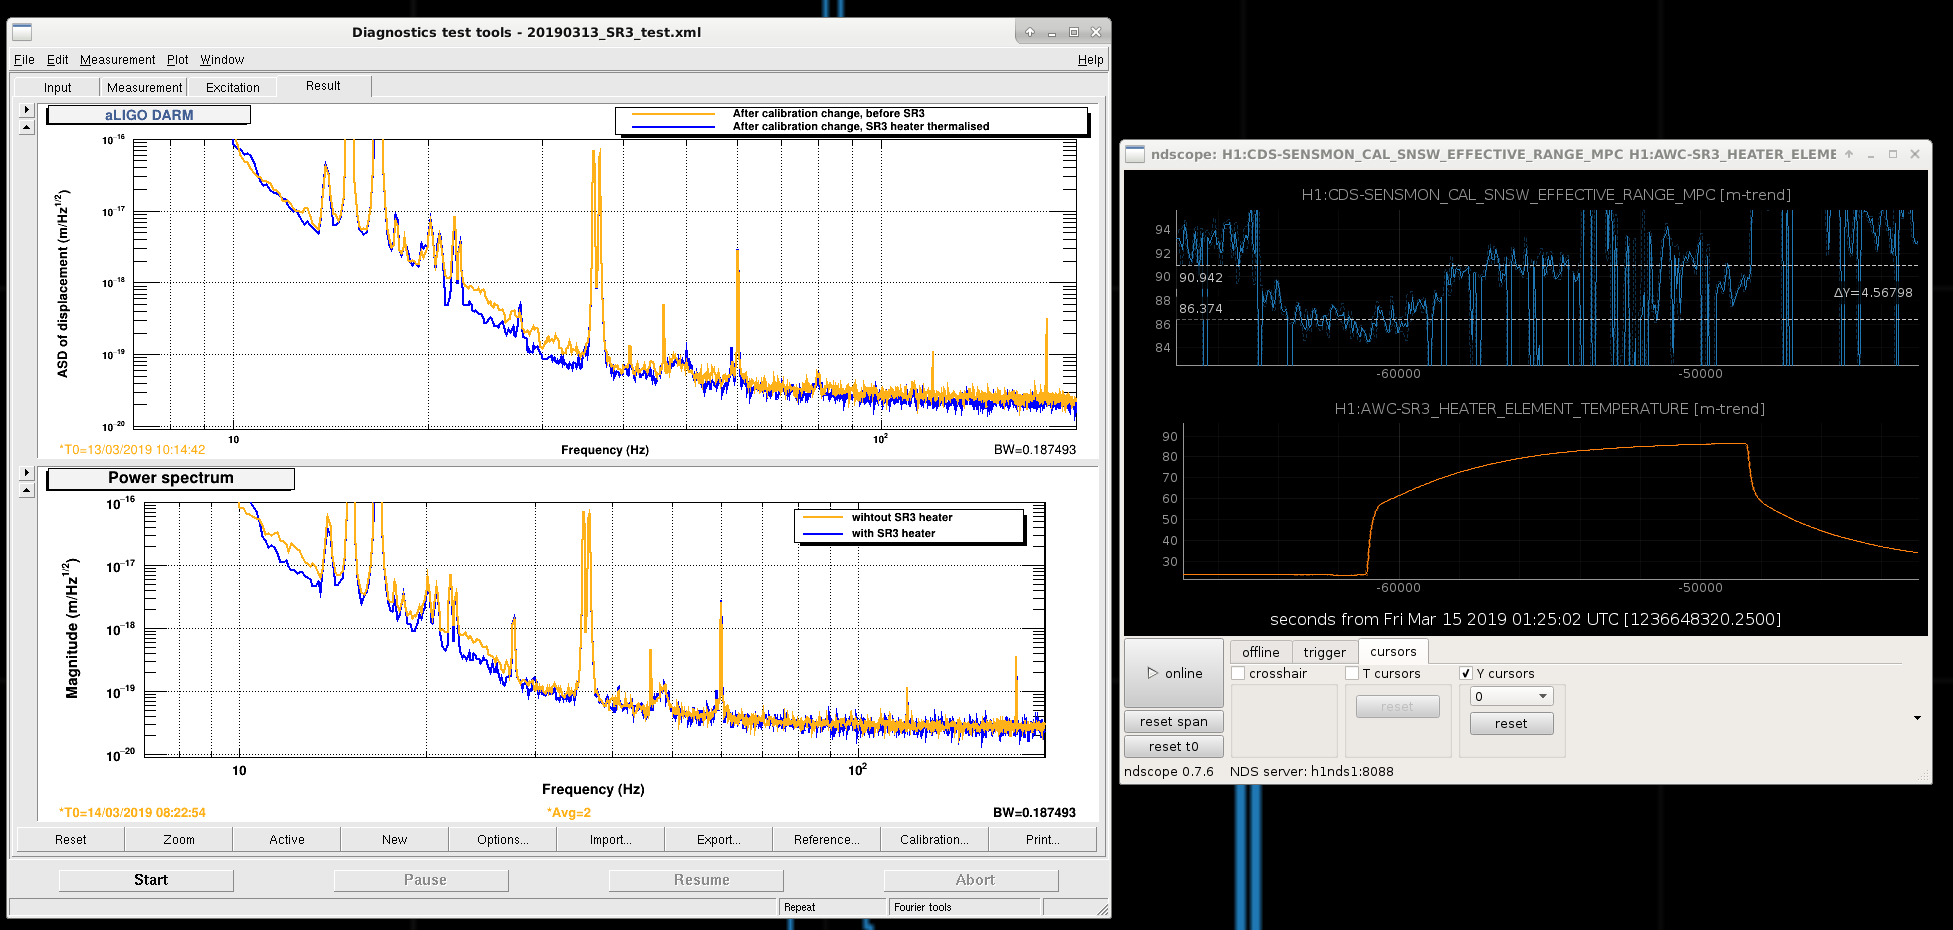
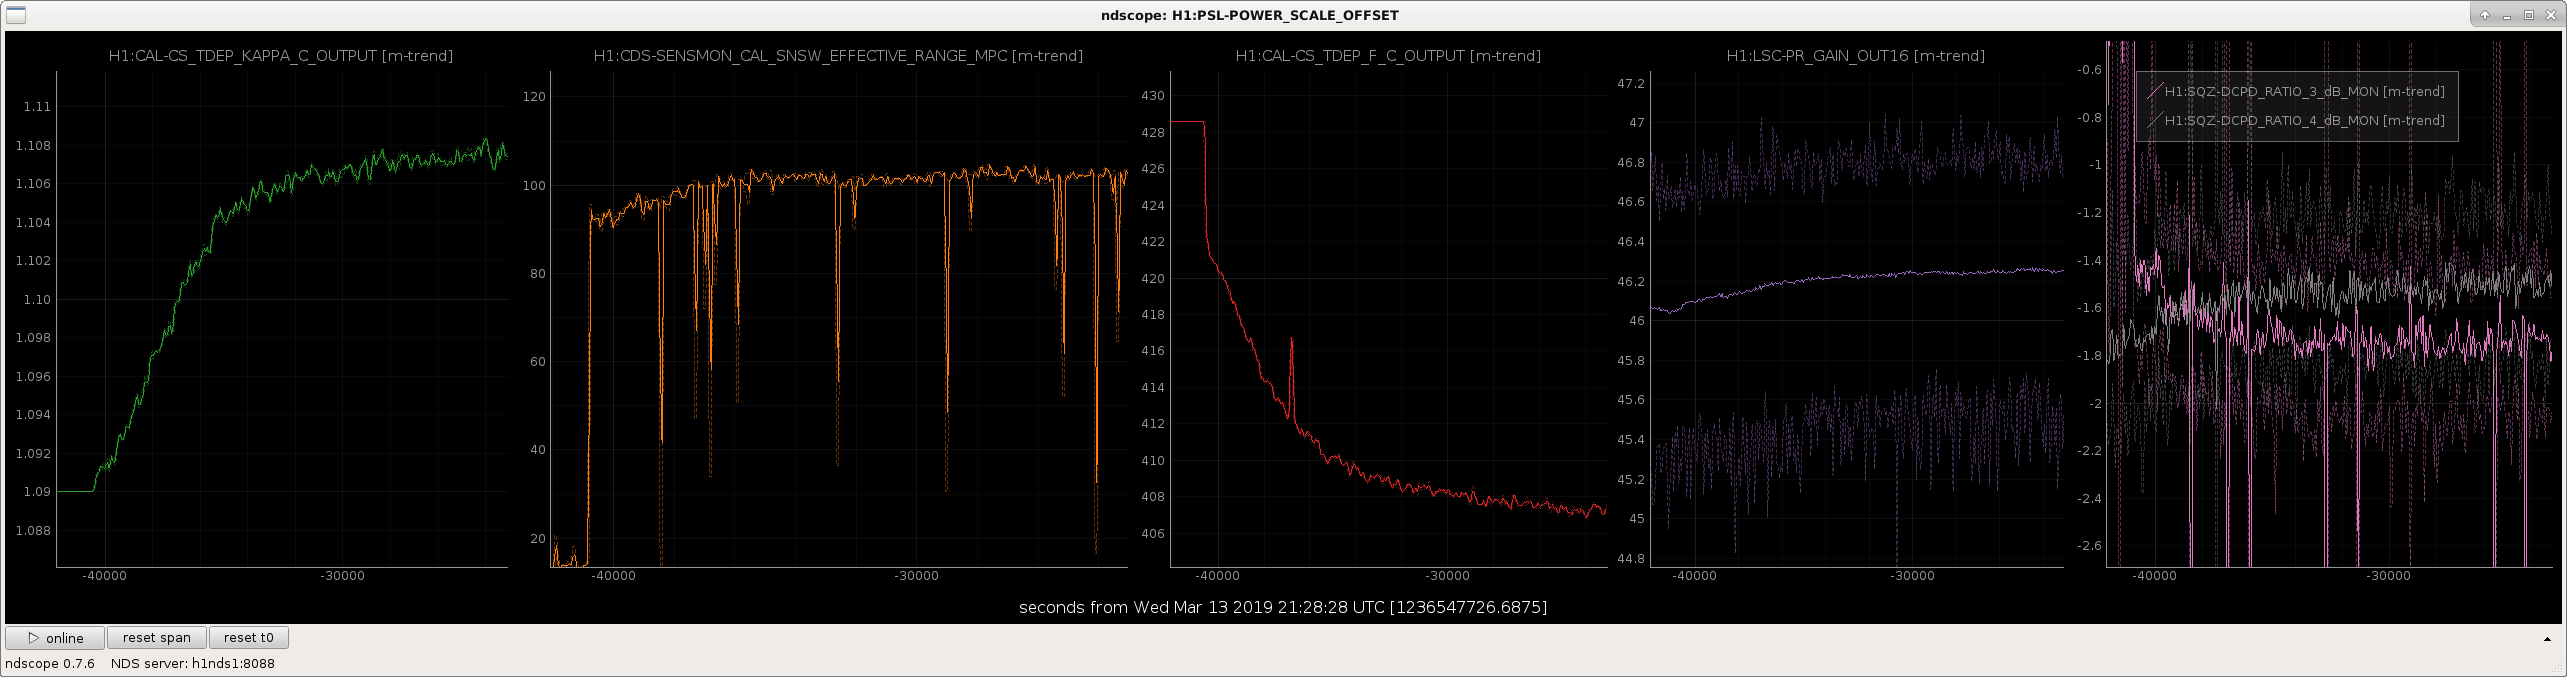
Last night we switched the SR3 heater on at the end of the shift, the aim was see how it affected some frequency and intensity lines at 4.5kHz and 3.25kHz we have been monitoring recently for tuning TCS. The heater input power was set to 5W to produce a ~360K heater element temperature which we believe is its full range.
In the end we actually saw an improvement at 20~300Hz in DARM, which was surprising. As mentioned by Jenne we thought this may be due to finding some better alignment but it seems like this may actually be the thermal actuation providing the gains. What noise actually improved down at 20-30Hz is not known. Above this it is likely because of the optical gain and PRG increases. Squeezing was being injected at the time, looking at two of the squeezing monitors (3 is 764Hz and 4 is 4680Hz) we see the low frequency squeezing increased slightly whereas the high frequency reduced. Perhaps there is some SRC detuning going on during this? Confusingly the SR3 heater also increased the PRG.
Before declaring this a win we plan to repeat the SR3 test using the SR3 cage servo tonight, hopefully we see similar results...
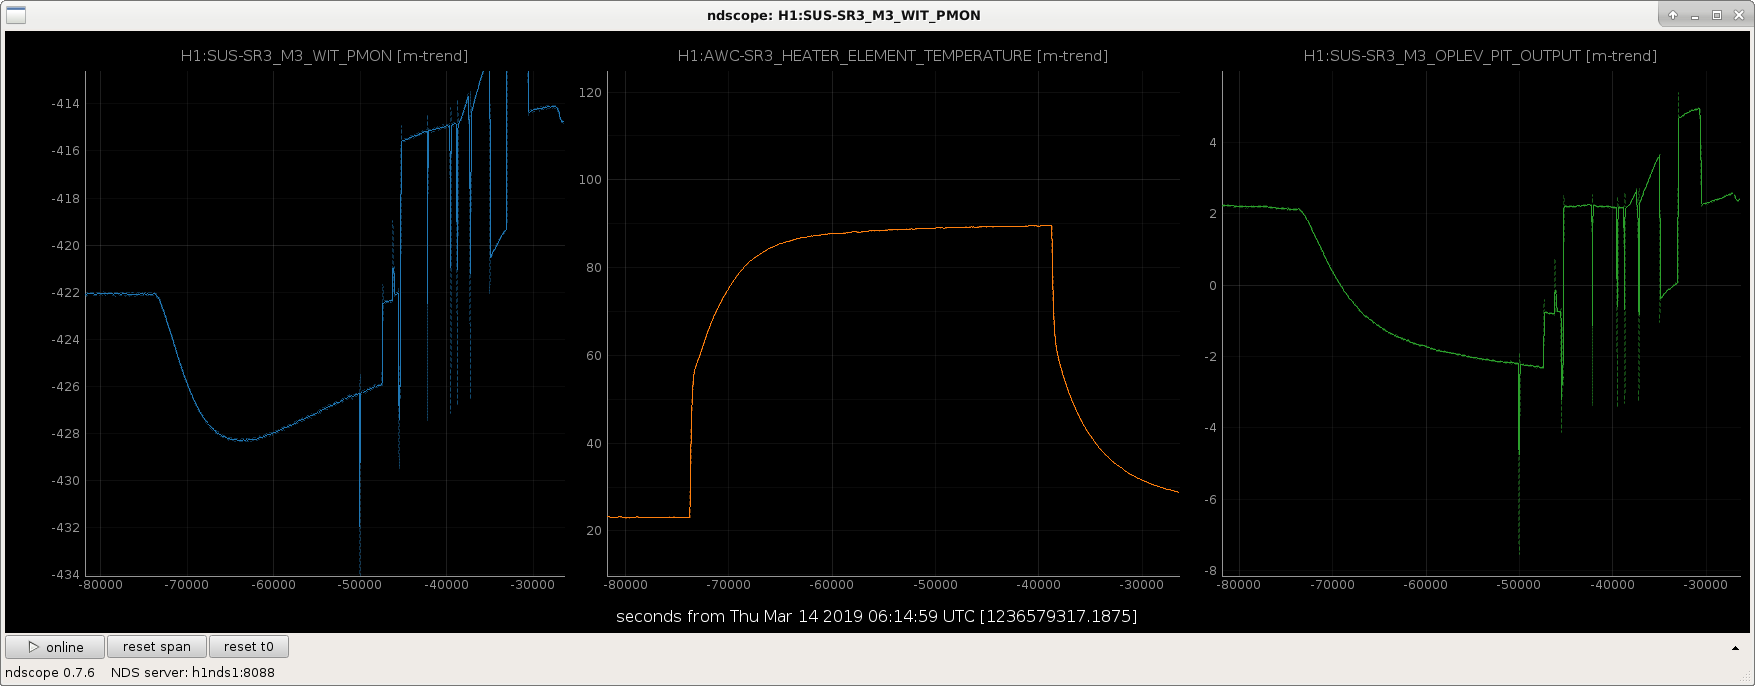
I tested the SR3 cage servo after a lock loss. I cleared the history (H1:SUS-SR3_M1_DITHER_P_OFFSET) which has for a long time been around 30. This pitched SR3 down so I brought it back up to the nominal oplev value in pitch/yaw. The slider values are now 437.8 and -151.8 in pitch and yaw. Relocking the IFO with these values seemed fine. I poked the pitch sliders and the cage servo brought it back, it is now switched on for locking.
Looking into the SR3 servo some more, the oplev and pitch osems were not agreeing last night when the heater was on. The OSEM says that pitch starts coming back down after some time, whereas the OPLEV says it keeps sagging. Could it be the OSEMS getting hot from the heater?
Anyway, the cage servo has been swapped to use the SUS-SR3_M3_OPLEV_PIT_OUTPUT instead as we feel that's a more reliable witness. The setpoint is 2.2 and the gain 1e-3.
Jenne, Sheila, Jeff B, Ed
People were having a little trouble with the SRC alignment step of initial alignment, so Jenne and I took a look at the cage servo. It looks like it was not fast enough to keep up with the thermal changes caused by the disk heater last night. We increased the gain by a factor of 50, based on the alignment change (seen by the oplev) during the temperature changes last night. This is able to move the optical lever 1.5 urad in ~15 minutes, this should be enough to keep up with the thermal changes.
looks like h1nds1 is back up and running.
Here are the tails of the previous two log files:
david.barker@zotws6: tail daqd.log.1552617326
[Thu Mar 14 20:38:09 2019] no_average=1
decimation flag=1
[Thu Mar 14 20:38:09 2019] couldn't create transient net-writer producer thread; pthread_create() err=11
[Thu Mar 14 20:38:09 2019] connection closed on fd=496
[Thu Mar 14 20:38:09 2019] ->93: start net-writer 1236656432 60 {"H1:SQZ-DCPD_RATIO_1_DB_MON" "H1:SUS-ITMX_M0_OSEMINF_F1_OUT_DQ" "H0:VAC-EX_X3_PT510B_PRESS_TORR" "H1:PEM-EY_TEMP_VEA_WEATHER_DEGC" "H1:SUS-ETMX_M0_OSEMINF_F3_OUT_DQ" "H1:SUS-ITMX_M0_OSEMINF_LF_OUT_DQ" "H0:VAC-MY_Y1_PT243B_P
[Thu Mar 14 20:38:09 2019] connection on fd 212 closed
Retry expired; requesting again
Packet buffer is full
david.barker@zotws6: tail daqd.log.1552621107
[Thu Mar 14 21:39:31 2019] connection closed on fd=501
[Thu Mar 14 21:39:31 2019] ->497: start net-writer 1236660113 60 {"H1:SQZ-DCPD_RATIO_1_DB_MON" "H1:SUS-ITMX_M0_OSEMINF_F1_OUT_DQ" "H0:VAC-EX_X3_PT510B_PRESS_TORR" "H1:PEM-EY_TEMP_VEA_WEATHER_DEGC" "H1:SUS-ETMX_M0_OSEMINF_F3_OUT_DQ" "H1:SUS-ITMX_M0_OSEMINF_LF_OUT_DQ" "H0:VAC-MY_Y1_PT243B_P
[Thu Mar 14 21:39:31 2019] connection on fd 499 closed
Retry expired; requesting again