Displaying reports 42641-42660 of 88668.Go to page Start 2129 2130 2131 2132 2133 2134 2135 2136 2137 End
Reports until 02:27, Tuesday 12 March 2019
H1 ISC (ISC)
georgia.mansell@LIGO.ORG - posted 02:27, Tuesday 12 March 2019 - last comment - 11:20, Tuesday 12 March 2019(47447)
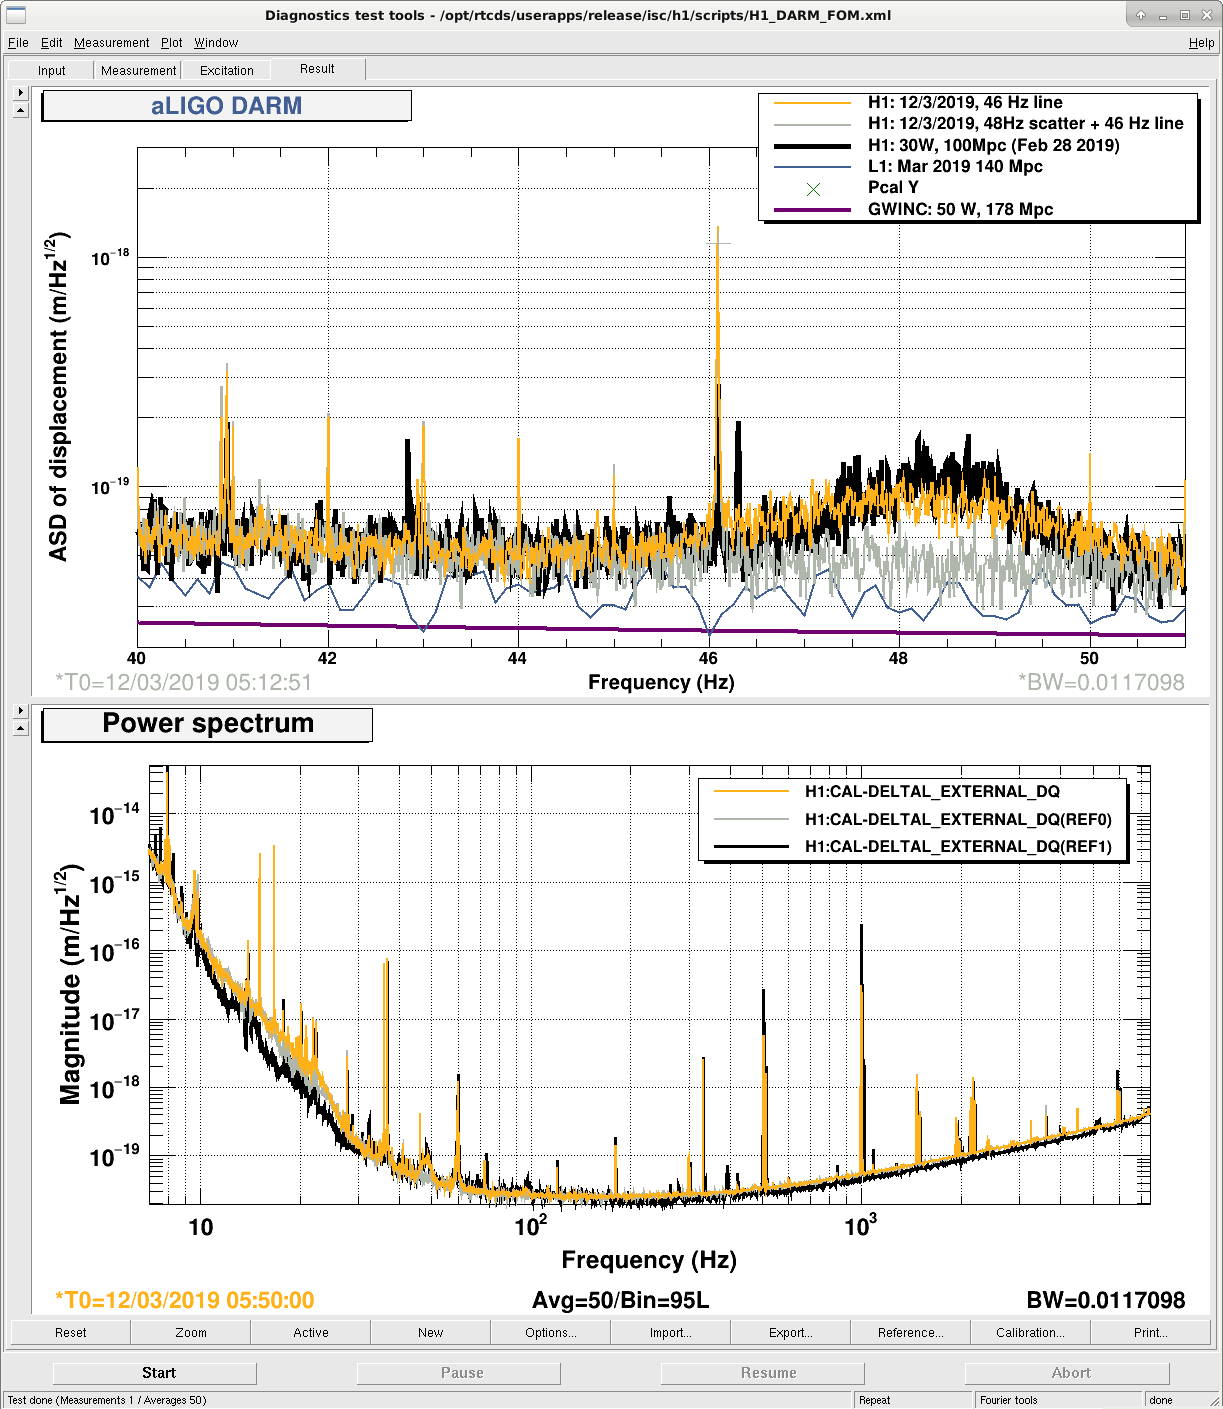
46 Hz line

During today's lock we have seen a high narrow peak at 46.1 Hz. This looks to be separate from the wandering 48Hz line (seen as a lump in our DARM spectra).

Bottom plot of attached screenshot is a 0.01 Hz resolution DARM spectrum. The top plot is zoomed into the 46 Hz region: black is a reference from Feb 28, grey and yellow are from two points during today's lock, with low and high ~48Hz line activity respectively. The 46 Hz line was also present in our Feb 28, but today it is a factor of ~4 larger for sone reason.


I ran bruco for a quiet time during this lock, but didn't see strong coherence with anything (closest being 0.21 coherence at 46 Hz with LSC-REFL_A_RF45_I_ERR_DQ).


(I had run bruco at a different time, and was excited to see coherence with an end-x sus rack magnetometer, but it turns out there was a glitch in the time window I picked.)

Images attached to this report
Comments related to this report
jenne.driggers@LIGO.ORG - 11:20, Tuesday 12 March 2019 (47456)

This feels reminiscent of the Hartmann wavefront sensor camera refresh rate.  Team TCS is going to look at this as soon as they are finished with their currently-ongoing maintenance tasks.

EDIT: Never mind, Danny looked, and all of the refresh rates are correctly set to be much lower frequency than this.

H1 CAL (CAL)
richard.savage@LIGO.ORG - posted 18:23, Monday 11 March 2019 (47444)
Yend Pcal optical follower offset reduced, may indicate Pcal laser output power has decreased significantly

NikoL, RickS

In response to comments that the 14 Hz harmonic of the Pcal injection at 7 Hz is larger (relatively) than it was in the past (it is still about -100 dBc), we adjusted the Optical Follower Servo (OFS) offset from the control room as follows:

  1. Turn off the Pcal excitations
  2. Open the OFS loop
  3. Increase the OFS offset until the OFSPD value stops increasing or the loop breaks lock
  4. Set the OFS offset (for example H1:CAL-PCALY_OPTICALFOLLOWEROFFSET) to half of the maximum OFSPD value
  5. Re-enable excitations
  6. Accept values in SDF

When we started, the loop offset was at 3.0, we had dropped it from 3.75 earlier in the day.  We left it at 2.95.  This is a ~20% decrease that might indicate that the laser output power is dropping, or that the AOM diffraction efficiency has decreased, or a combination of both.

We will measure the laser output power and begin to investigate further as soon as time and access allow.

H1 SQZ (SQZ)
nutsinee.kijbunchoo@LIGO.ORG - posted 17:24, Monday 11 March 2019 (47440)
Stopped old SQZ guardians

The old CLF guardian has been fighting me since guardian restart on Tuesday. I now stopped all the old SQZ guardians we are not using so it won't haunt me again.


Ps. This alog was meant to be posted Friday night. Sorry it never went out beyond a draft.

H1 General
travis.sadecki@LIGO.ORG - posted 16:00, Monday 11 March 2019 (47439)
Ops Day Shift Summary

TITLE: 03/11 Day Shift: 15:00-23:00 UTC (08:00-16:00 PST), all times posted in UTC
STATE of H1: Commissioning
INCOMING OPERATOR: None
SHIFT SUMMARY:  Most of the day after lockloss spent damping violin modes and tuning filters.
LOG:

16:35 Keita to LVEA ISS 2nd loop measurement while H1 is out of lock

16:51 Keita done

21:25 Dave to both ends looking at chassis to be replaced tomorrow

21:53 Nutsinee to SQZ rack

21:54 Dave at MY

H1 ISC (ISC)
keita.kawabe@LIGO.ORG - posted 13:40, Monday 11 March 2019 (47434)
Removed OMC QPD breakout board

Related: alog 47227

At around 10AM local time (17:00 UTC) I removed OMC QPD cable breakout board that was added in the above mentioned alog. We'll see if this makes any difference.

H1 ISC (ISC)
hang.yu@LIGO.ORG - posted 13:38, Monday 11 March 2019 - last comment - 08:07, Friday 15 March 2019(47433)
Quadratic A2L decoupling

It seems that we could enhance our A2L decoupling by including the quadratic terms such as DH_P(t) * CS_P(t) when doing offline noise subtraction.

Please see the attached plot for an example. 

Details:

Note that a2l noise in t-domain is given by 

    dL(t) = dy(t) * dTheta(t),

where dy is the spot position and dTheta is the angular motion of a mirror. In the online A2L feedforward (as done in the SUS L2 stage), we do

    dL_ff(t) = dy(DC) * dTheta(t),

i.e., subtracting the dominating 'linear' coupling. The dither locking basically does the same thing as it servos dy(DC) to a fixed value. 

On the other hand, we also have

    dy(t) ~ dy/dTheta * dTheta( t - t_delay),

where dy/dTheta is a constant determined completely by the cavity's geometry. For the off-resonance 01/10 modes, the delay time is on the order

    t_delay ~ 2L/c ~ 3x10^{-5} sec,

which is effectively 0 for the A2L coupling we are interested in. 

As a result, it suggests that the A2L noise will contain terms like 

    dL(t) ~ dTheta(t)**2,

in the time domain. 

The argument above suggests that in the offline data cleaning, in addition to include the linear ASC terms, such as DH_P(t), we can also include quadratic terms that are the products of ASC outputs in the time-domain, e.g., DH_P(t) * CS_P(t). 

In the attached plot, the blue trace is the calibrated DARM ('GDS-CALIB_STRAIN') at gps: 1236207018 + [0, 2048] sec. I took 8 sec of data per fft and 50% overlap, thus 511 averages in total.

In the orange trace is the DARM after removing all the linear ASC coupling using a freq-domain MISO-coherence-based subtraction. We don't see any significant improvement over the noise, which is as expected as the soft dithering loops should zero the linear coupling. 

In the green trace, we further include quadratic ASC outputs and again do the freq-domain MISO-coherence analysis. This seems to improve the subtraction in the 10-30 Hz band where the ASC noise dominates.

The caveat is that the subtraction done so far are all in the freq-domain. I haven't tested how-well a t-domain Wiener filter could reproduce the result. More importantly, due to the amount of clean lock stretches available, we haven't checked how stationary the quadratic coupling is from one time to another. 

Nevertheless, the initial result seems promising, and including those quadratic terms should not be technically hard in the offline subtraction. 

Non-image files attached to this report
Comments related to this report
hang.yu@LIGO.ORG - 08:07, Friday 15 March 2019 (47527)ISC

Gabriele, Hang

Gabriele pointed out that the f-domain subtraction using coherence could easily lead to over subtraction, as the finite amount of average could over-estimate the coherence. For example, the improvement above 30 Hz in the previous attached plot could hardly be real as the ASC noise should have been rolled off there. 

We thus looked at a longer data stretch of 10240 sec (~ 3 hrs; 5 times what we used in the previous study) starting at gps 1236511818. Again we use 8 sec per fft and 50% overlaps, and therefore 2559 averages. This should mitigate the errors due to finite averaging.  The result is attached to this entry. 

In the first plot we show the DARM noise spectra before and after subtracting the linear/quadratic ASC channels.

In the second plot we present the largest contributions' projection to DARM (ranked by the contribution at 25 Hz).

In the last one we compute the SISO coherence between [CH_Y(t)xCS_P(t)] and DARM as a sanity check for result plotted in the second figure. 

===================================================================================

Some conclusions based on the plot:

    1. We still see a significant (visible by eyes) improvement in the 15-30 Hz band by including the quadratic terms such as DH_P(t) x CS_P(t). The level of noise reduction is roughly comparable to what we had in the previous entry in this band. 

    2. Below 20 Hz the dominating nonlinear correction comes from [CH_P(t) x DH_P(t)] which is more or less expected. On the other hand, the largest contribution at 25 Hz is from [CH_Y(t) x CS_P(t)]. This is a bit surprising. Nonetheless, we also looked at the SISO coherence and saw a similar amount of projection to DARM. Thus the coupling should be real. It suggests that we may have large P/Y and C/D cross-coupling simultaneously.

    3. Above 30 Hz, the quadratic subtraction matches the linear subtraction. This should be viewed as a reduction in the systematic error in our approach. 

    4. In the 10-15 Hz band, even linear subtraction can still improve the noise performance. This is an indication that in addition to the geometrical a2l coupling (that is freq independent), we also have a path of angle->power->length coupling (that scales ~ 1/f^2 and thus is visible only at low frequencies; this path also cannot be subtracted by the dithering soft loop which handles only the geometrical one). This is consistent with the previous observations that as we decreased the dithering frequency (thus locking pt was more biased by the radiation P effect), the ASC->DARM coupling got worse at ~20 Hz.

Non-image files attached to this comment
H1 AOS (DetChar, ISC, SUS)
beverly.berger@LIGO.ORG - posted 12:37, Monday 11 March 2019 (47432)
Informal DQ shift: 4 - 10 March UTC
H1 PSL
edmond.merilh@LIGO.ORG - posted 11:16, Monday 11 March 2019 (47430)
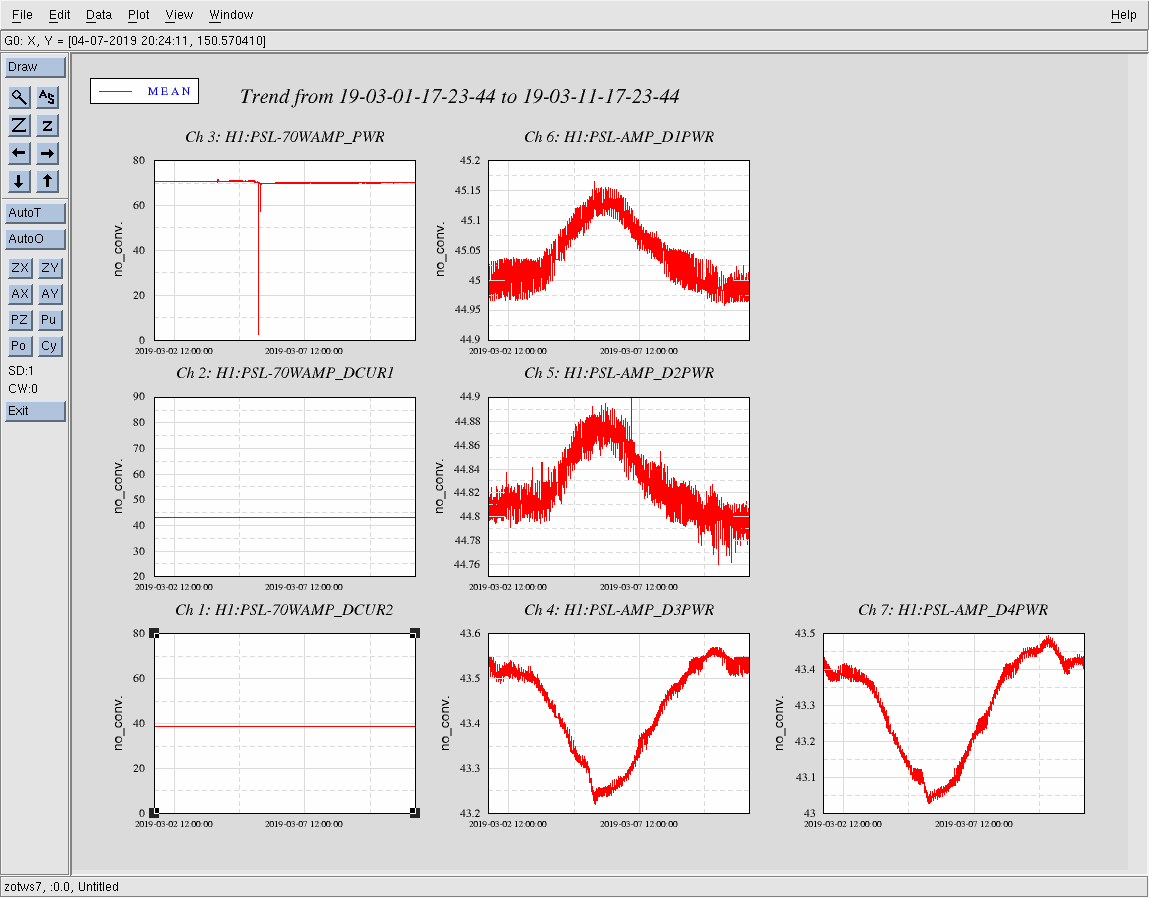
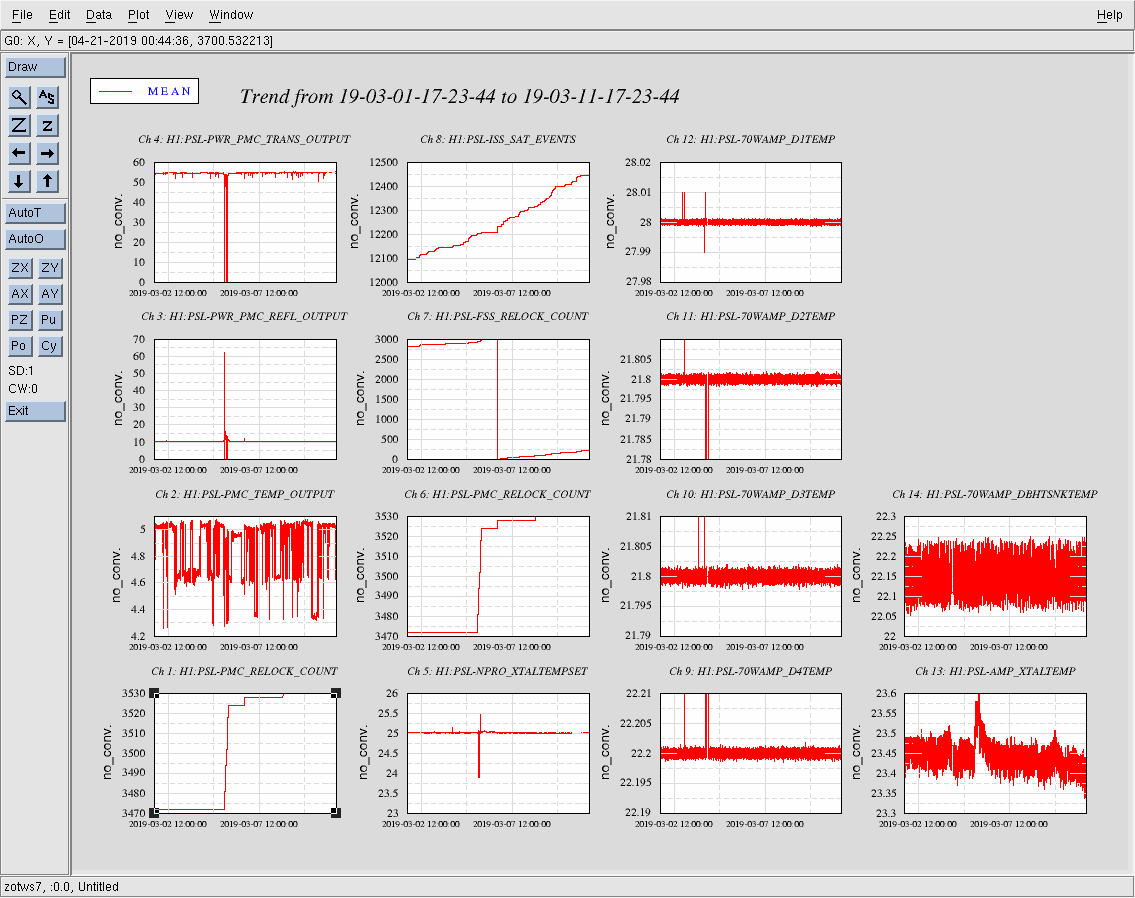
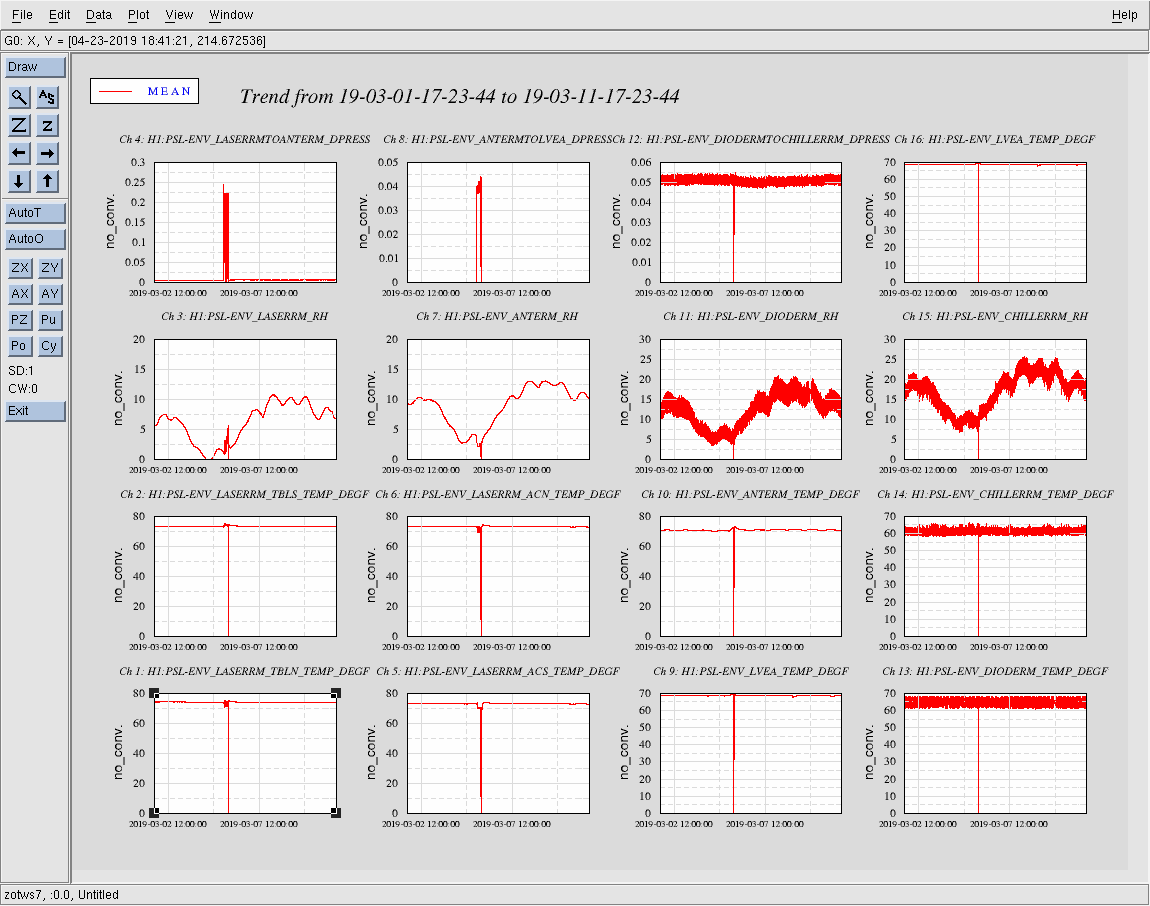
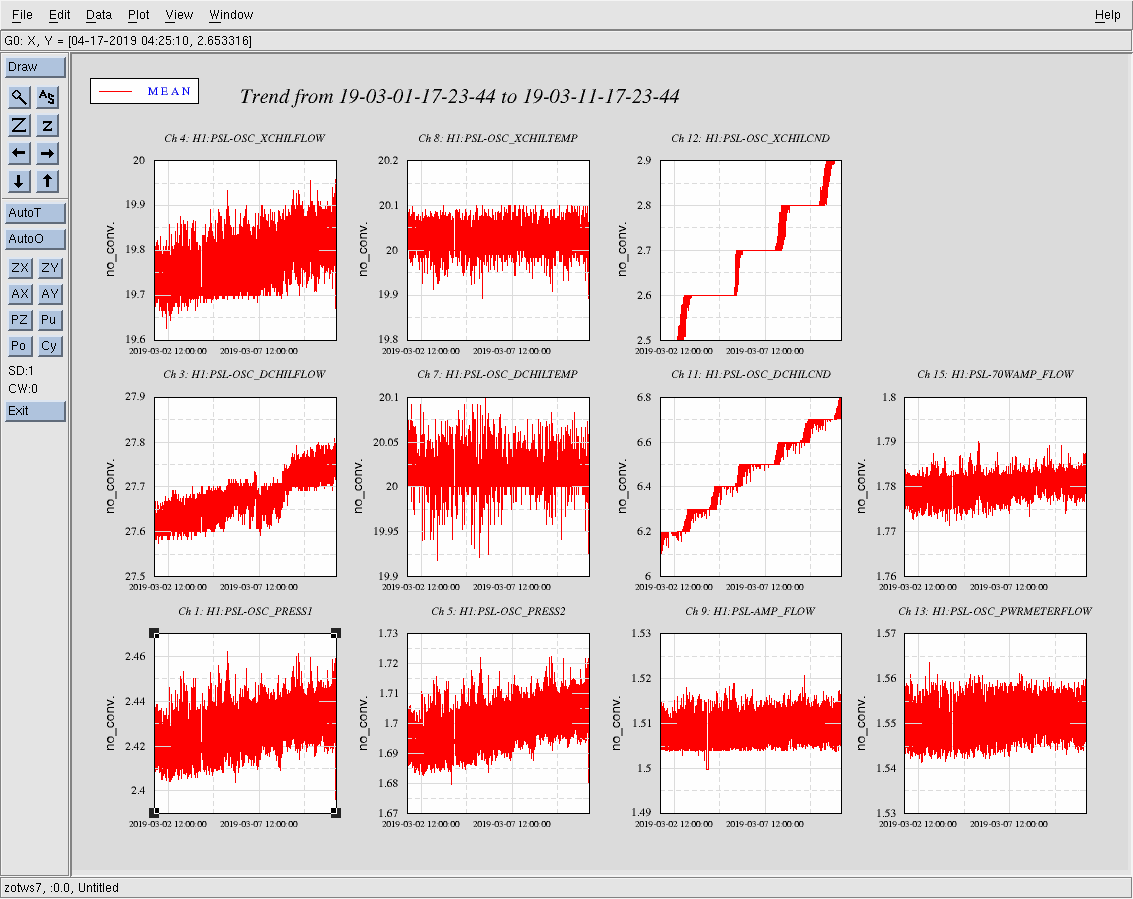
PSL Weekly Report - 10 Day Trends FAMIS #10600
Images attached to this report
H1 CAL (GRD, INJ)
jeffrey.kissel@LIGO.ORG - posted 10:55, Monday 11 March 2019 (47429)
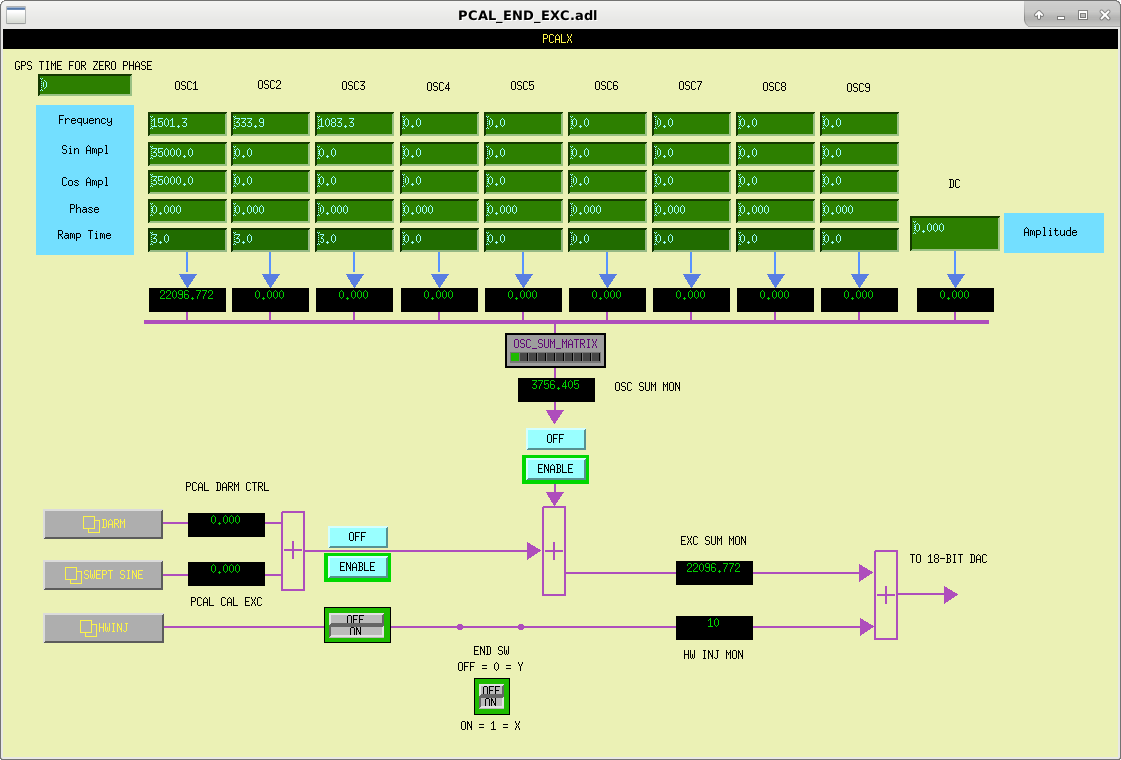
PCAL EXC Screen Updated to Clearly Show All Excitations
J. Kissel

The data from last week's calibration of PCAL EX was corrupted by HWINJ's still being on -- which were understandably missed because the new HWINJ infrastructure (see LHO aLOG 46407) didn't get propagated to (and admittedly never was on) the PCAL "excitations" screen, and the remaining HWINJ CTRL screens were white with vestigial channels.

As such, I've 
- Removed all calls to old HWINJ screens from the site map
- Added the HWINJ path to the PCAL EXC screen (with a link back to the now one-and-only HWINJ CTRL screen.)

Now all excitation paths to the PCAL DACs are shown on this excitation screen.

While I was add it, I cleaned up the screen to make it more clear:
- Added an end station label at the top, so as to not get confused when both end station screens are open
- Changed the OSC_SUM_MATRIX link button to a blinky-light matrix, so it's obvious from the EXC screen level which lines are requested to be ON
- R-arranged the addition of the DARM and SWEPT SINE path, to better reflect how they're added and sent out to the DAC in the front-end code.

I did hit one "hitch" though -- the visualization of the "$(IFO):CAL-INJ_END_SW" channel which controls to which end-station the now-corner-station-generated HWINJ signal goes is buggy, because I can't figure out how to get a common MEDM screen to both end stations (which are otherwise riddled with macro substitutions to differentiate labels and channels) to show the correct operation of the channel at each end station.
This can go on the low-priority list to fix.

The updated sitemap and common excitation screen have been committed to:
    /opt/rtcds/userapps/release/cds/h1/medm/
        SITEMAP.adl
    /opt/rtcds/userapps/release/cal/common/medm/
        PCAL_END_EXC.adl 
Images attached to this report
H1 ISC
jenne.driggers@LIGO.ORG - posted 08:43, Monday 11 March 2019 - last comment - 18:04, Monday 11 March 2019(47421)
Removed 1 OMC whitening

ITMX violin modes 1 and 2 are a bit high, and the OMC DCPDs started saturating, so I removed 1 stage of OMC DCPD whitening at about 15:40 UTC.  I have also turned off the damping gains for those modes to they at least don't get worse for now.

Comments related to this report
jenne.driggers@LIGO.ORG - 09:28, Monday 11 March 2019 (47425)

Was unsuccessful in damping the mode.  It made the spectrum really terrible.  I tried increasing the ADS dithers so that they wouldn't get drown out, and that wasn't good.  I turned off the ADS, but we still lost lock.

jenne.driggers@LIGO.ORG - 10:08, Monday 11 March 2019 (47426)

Kara and I had a look, and the phase rotator filters in ITMX Mode 2 weren't at the correct phases (+40 deg and -70 deg, rather than +/- 60 deg, and their magnitudes weren't unity at the violin frequency).  She used Patrick's gui to put in +/-30 deg and +/-60 deg filters, so that we can hopefully find something that more reliably damps this mode.  For now, it is also commented out of the lscparams so that it won't turn on with totally different filters than it used to have.

jenne.driggers@LIGO.ORG - 14:34, Monday 11 March 2019 (47436)

Anamaria changed the Mode2 filter to also catch the Mode 4 frequency, and turned off the gain for Mode4. 

Also, we made the Mode3 filter much more narrow, so that the tail of it isn't hitting its neighbors and potentially driving them up.

jenne.driggers@LIGO.ORG - 14:46, Monday 11 March 2019 (47437)

Ensured that Mode9 is very narrow (it was already an 8th order butterworth), and made mode1 more narrow (4th order to be 6th order) to help prevent it from hitting the mode9 frequency.

kara.merfeld@LIGO.ORG - 17:57, Monday 11 March 2019 (47442)SUS
I've adjusted the guardian damping settings for ITMX modes 2 and 4.  

Mode 2 now uses filters FM5, FM9, and FM10 with gain=-25.

Mode 4 now has gain=0.
kara.merfeld@LIGO.ORG - 18:04, Monday 11 March 2019 (47443)
I've commented out both ITMX modes 1 and 9 so that we can make it to NLN now, and find the best damping settings later after we've had a chance to check consistency.
H1 ISC (ISC)
craig.cahillane@LIGO.ORG - posted 03:38, Sunday 10 March 2019 - last comment - 02:59, Tuesday 12 March 2019(47417)
Induced Scattering in the OMC ASC Ang X
Georgia, Craig

This evening we revisited the scattering shelves we saw last Tuesday.  Gabriele thought further about OMC ASC scattered light.

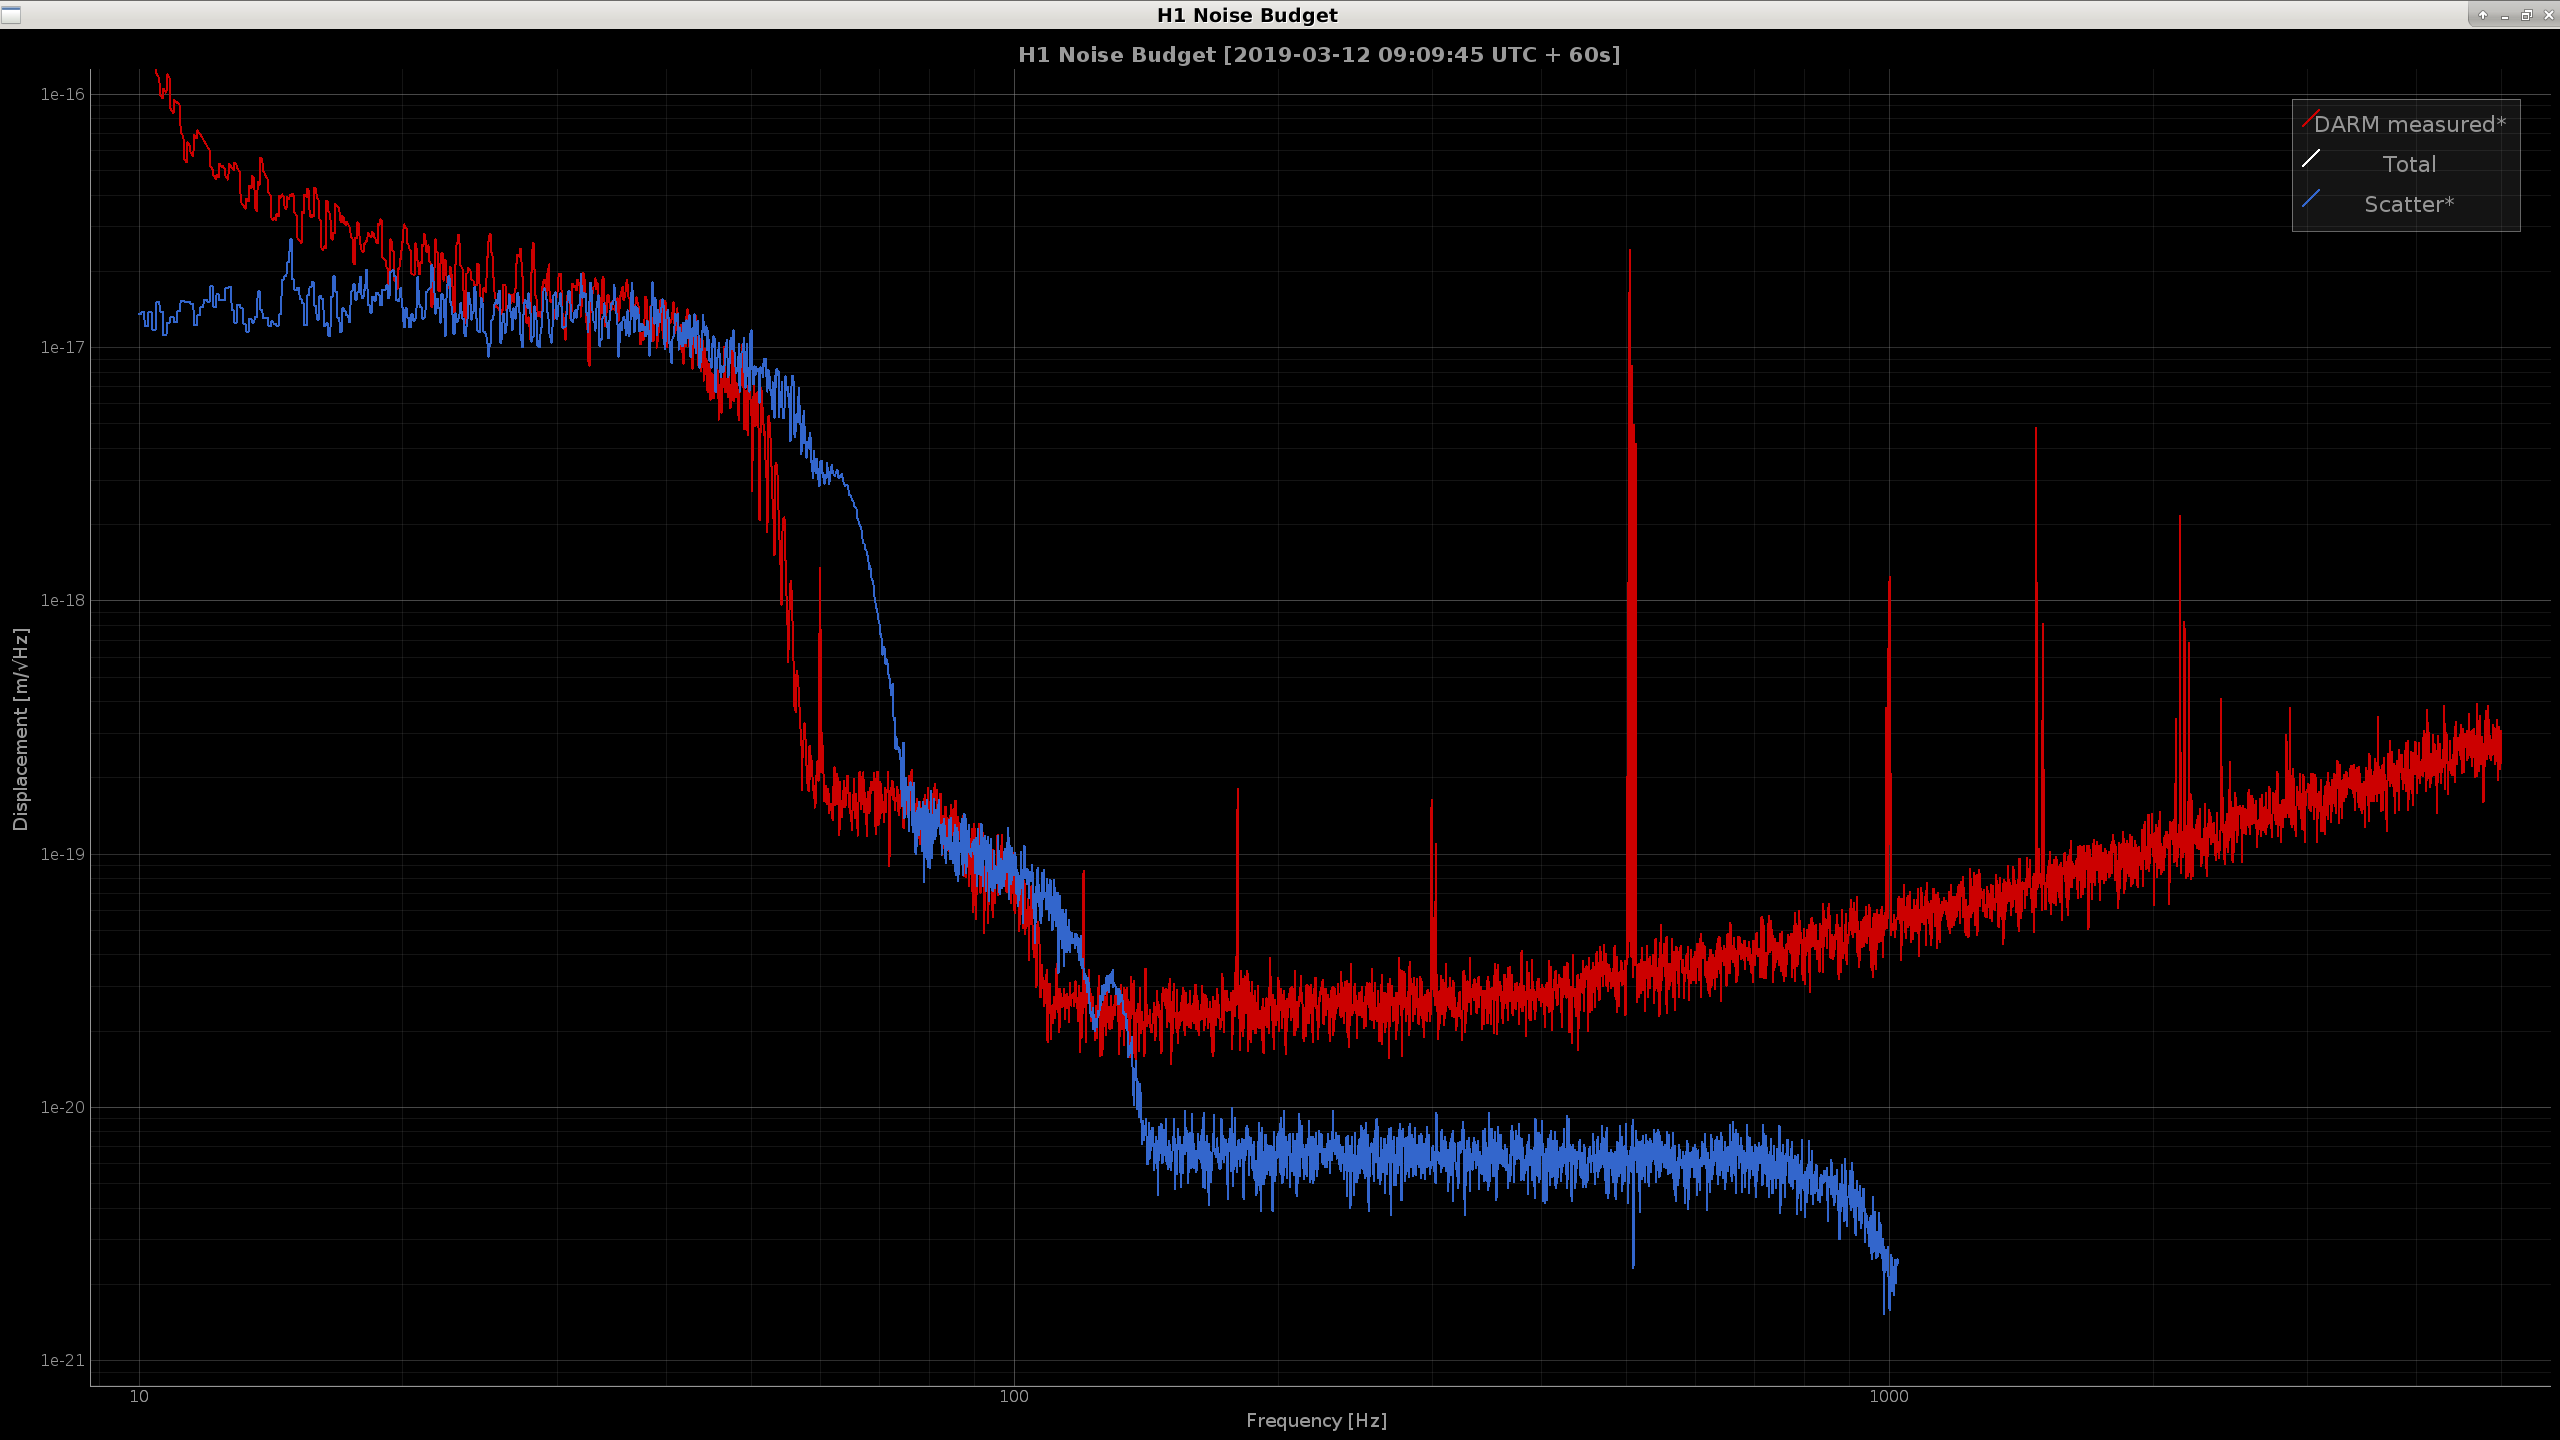
This evening we drove OMC Ang X with a 0.5 Hz sine wave injection.  By increasing the Ang X RMS by around a factor of 10, we are able to replicate the scattering seen on Tuesday.

The plot shows the DARM scattering plus the OMC ASC calibrated into DARM meters from here.  With not a huge increase in OMC displacement RMS (red vs green in the plot), we see significant scattering in DARM.  Probably what is a better witness of scattering is OMC velocity RMS: the 0.5 Hz line is fairly energetic for this control loop.  In any case, it's possible this scatter shelf lies not far below DARM at around 10Hz.

Tomorrow we will make a physics model of this scattering and project it into DARM for all OMC ASC. 
Non-image files attached to this report
Comments related to this report
gabriele.vajente@LIGO.ORG - 10:51, Monday 11 March 2019 (47423)

Here I am trying to build a model of the scattering. If you don't have time to read all of it, jump directly to the last plot, which gives what I believe is a reasonably good model that we could use for noise projections.

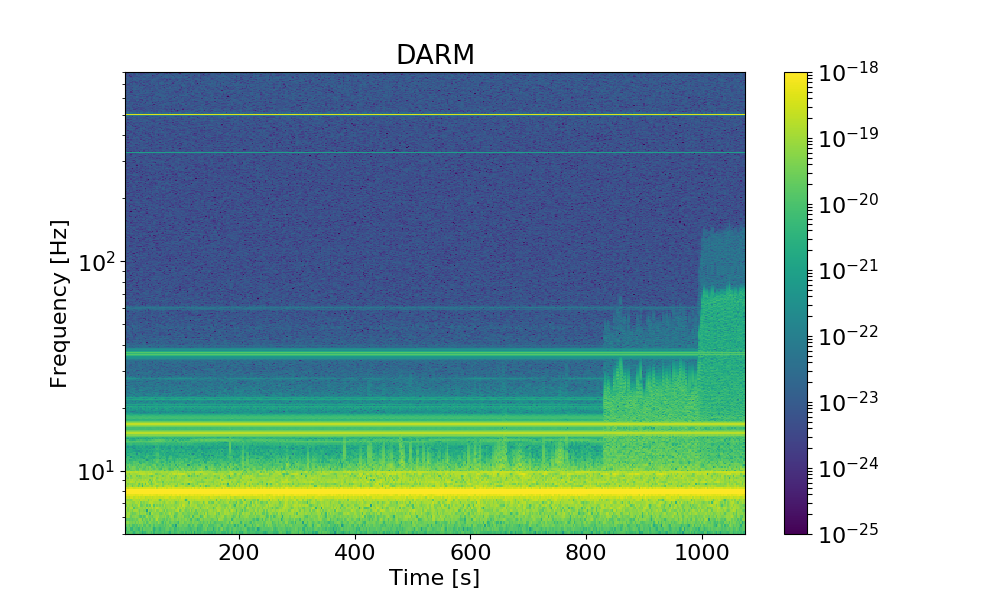
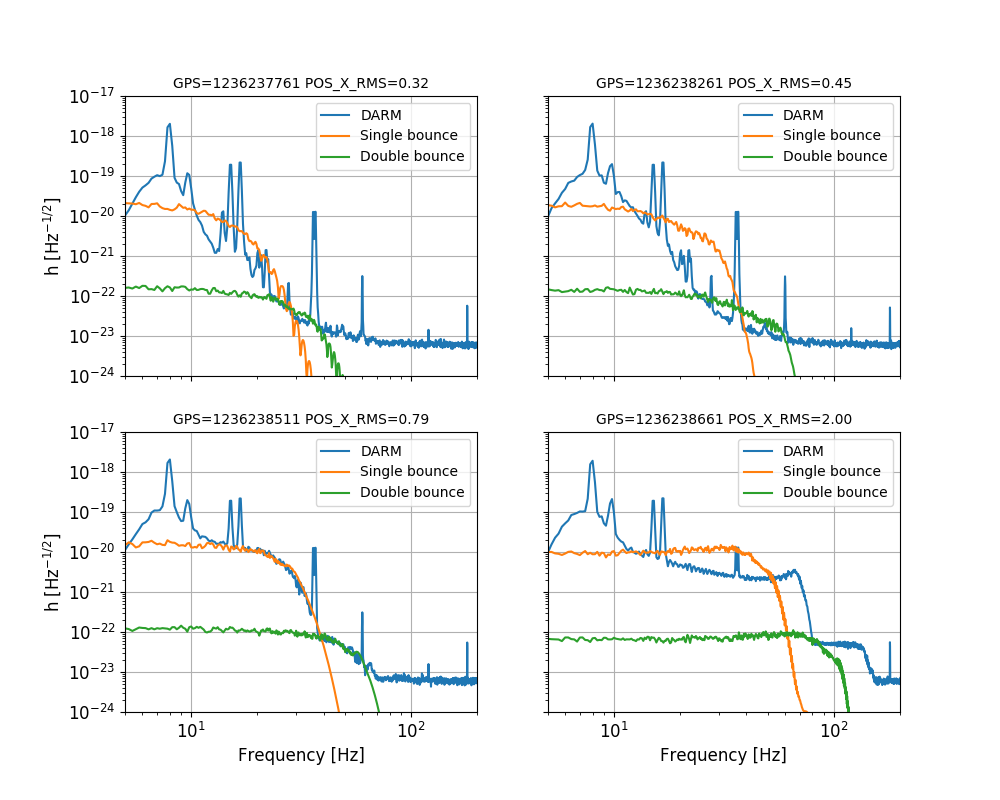
Here's a spectrogram of DARM during times around the OMC ANG X injections. It is evident that even without any injection, there are scattering shelves in DARM going up to 20-30 Hz. 


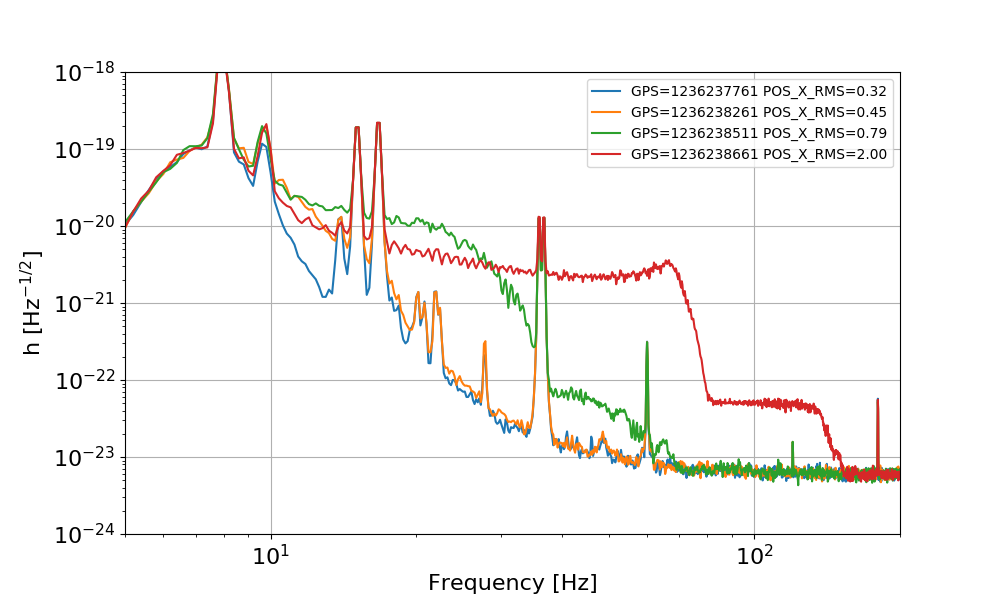
I selected four periods: two before the injection (fist at T=100s in the spectrogram above: almost no scatter visible, second at T=600s, some scattering visible) and two during the injection (T=850s: low amplitude injection, T=1000s: high amplitude injection). 


Using H1:OMC-ASC_ANG_X_INMON as a proxy for the scatterer motion, I can fit a scattered light noise model based on the "phase wrapping" model (from Accadia 2010 and Canuel 2013), including a single bounce and a double bounce. The model simply assumes that the fringe wrapping gives a noise in h(t) that can be modeled by


where f_1 and f_2 are the two coupling coefficients for the single and double bounces (related to the amount of light which is scattered back) and k_1 is a factor converting the OMC_ANG_X into the actual length change in the scattering path. 

If I use the medium amplitude injection, I can find coefficients that described quite well the spectrum of scattered light. The parameters are f_1 = 1e-19, f_2 = 1e-21, k_1 = 22e-7. In the plot below I use those parameters to "project" the scattered light noise for all four periods. The bottom left plot shows that the fit is good for the medium amplitude injection, but clearly fails for all other cases.


I can't reproduce the scattered light noise for both medium and hgh amplitude using any of the H1:OMC-ASC_[AND/POS]_[X/Y]_INMON signals. In particular for the high amplitude injection I can't reproduce the rising edge of the shelf. Typically one gets such rising edges when the RMS of the motion is concentrated at almost a single frequency.

If we assume that only the 0.5 Hz motion is responsible for the scattering, we can proceed as follows:

  1. First, I apply a narrow band filter to H1:OMC-ASC_ANG_X_INMON, composed of a zero at 0 Hz plus a complex pole at -0.1 +- 0.5j Hz, scaled to maintain a gai of 1 at 0.5 Hz. 
  2. Then I can use the filtered signal to fit the high amplitude injection noise.

The best parameters are: f_1=3.5e-20, f_2=5e-22, k_1=1.6e-5. The resulting noise projects well for both the high and medium injection amplitude, and it is also in the right ballpark for the high scattering period without injection. So this seems to be a good model.


Images attached to this comment
gabriele.vajente@LIGO.ORG - 15:30, Monday 11 March 2019 (47438)

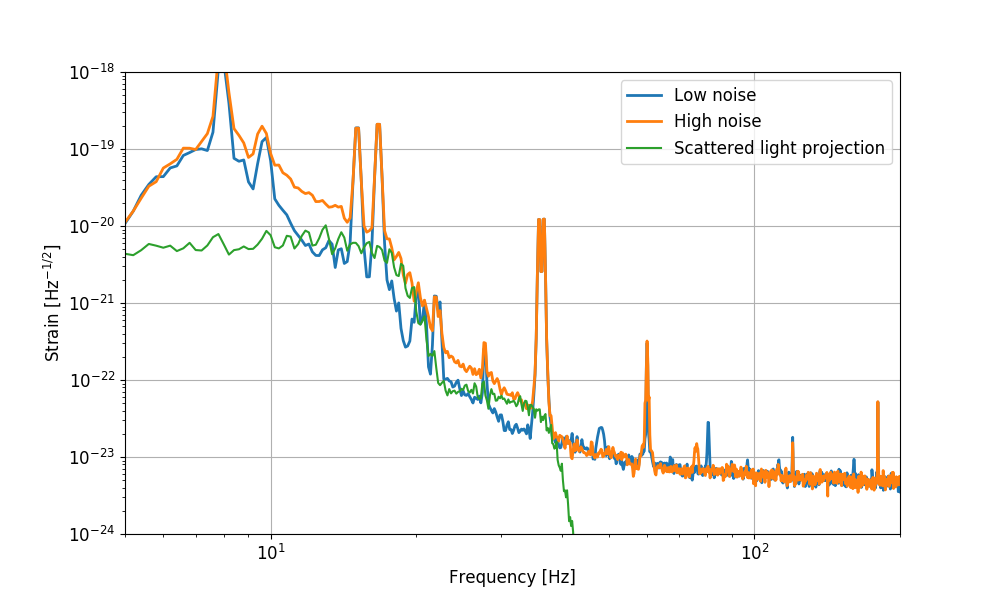
We can apply the same scattered light model to the noisy period reported in 47399. It looks like the same parameters over-estimate the up-conversion (i.e. the corner frequency of the scattered light is too high). So I had to reduce the k_1 coefficient from 1.5e-5 to 1.0e-5, while I could use the same coupling factors f_1 and f_2.

Images attached to this comment
georgia.mansell@LIGO.ORG - 02:09, Tuesday 12 March 2019 (47446)

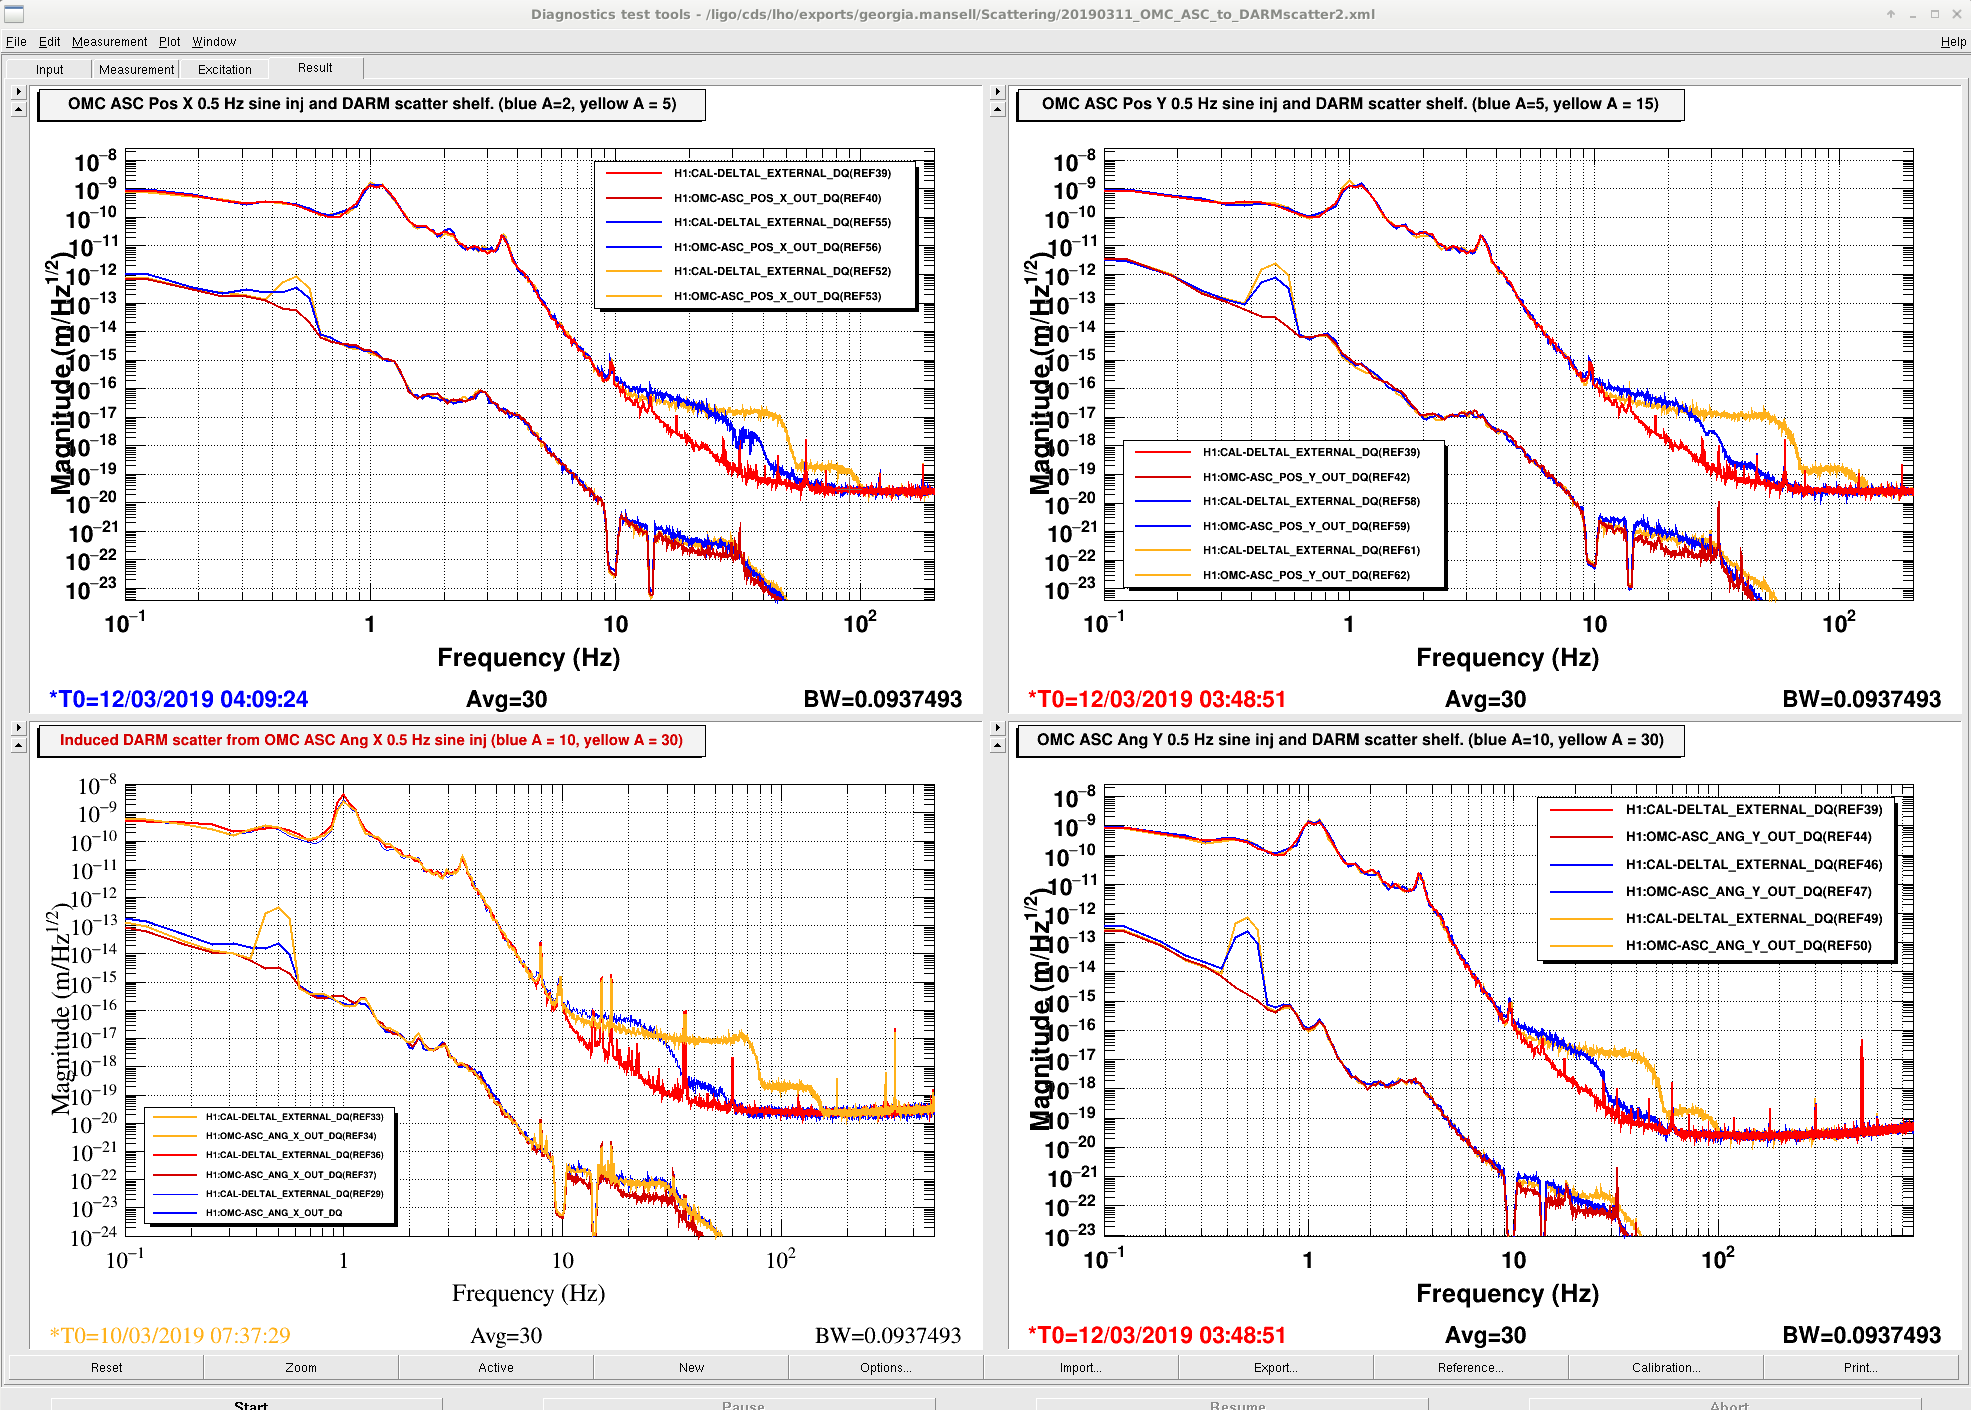
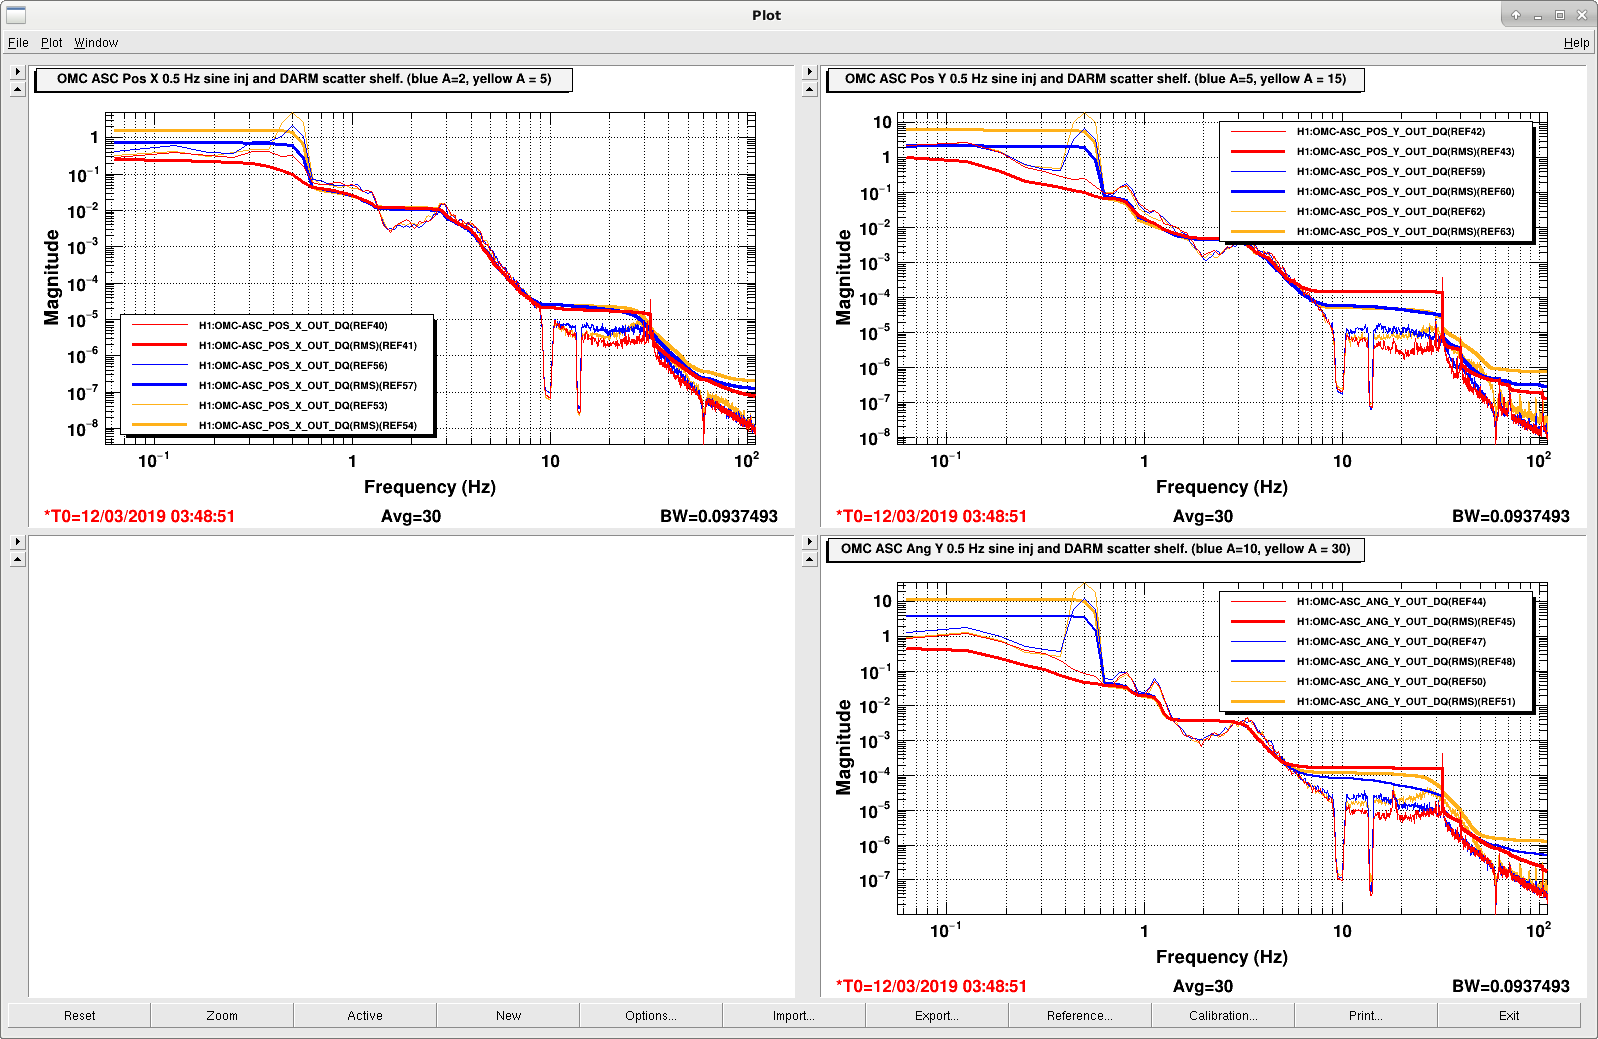
I ran some 0.5 Hz line injections in the other OMC ASC degrees of freedom to see if there were any differences in the coupling.

First attached figure shows DARM and the control signals for (clockwise from top left) POS_X, POS_Y, ANG_Y and ANG_X. Red is ambient noise, blue with a moderate excitation and yellow with a larger excitation. Apologies for the different excitation amplitudes. POS_X has the strongest coupling.

Second attached figure is the control signals and corresponding RMSs.

I haven't done the work of projecting these into DARM yet, but in case anyone wants to the template can be found here:

/ligo/cds/lho/exports/georgia.mansell/Scattering/20190311_OMC_ASC_to_DARMscatter2.xml


Images attached to this comment
craig.cahillane@LIGO.ORG - 02:59, Tuesday 12 March 2019 (47449)
Ran some more injections into OMC ASC ANG X, this time with a BB Inj 0.1 to 1 Hz.  Stored at https://lhocds.ligo-wa.caltech.edu/exports/craig.cahillane/Scatter/
Continuing work on the scattering projection into DARM in the live noisebudget.  It's not too far away, needs more work though.

Images attached to this comment
Non-image files attached to this comment
H1 ISC (ISC, PSL)
keita.kawabe@LIGO.ORG - posted 17:20, Friday 08 March 2019 - last comment - 13:35, Monday 11 March 2019(47409)
ISS 2nd loop gain was too big, gain set 5dB lower (Jenne, Georgia, Keita)

While IFO was down due to HEPI failure in the morning, I went to the floor to measure the ISS 2nd loop OLTF at 30W.

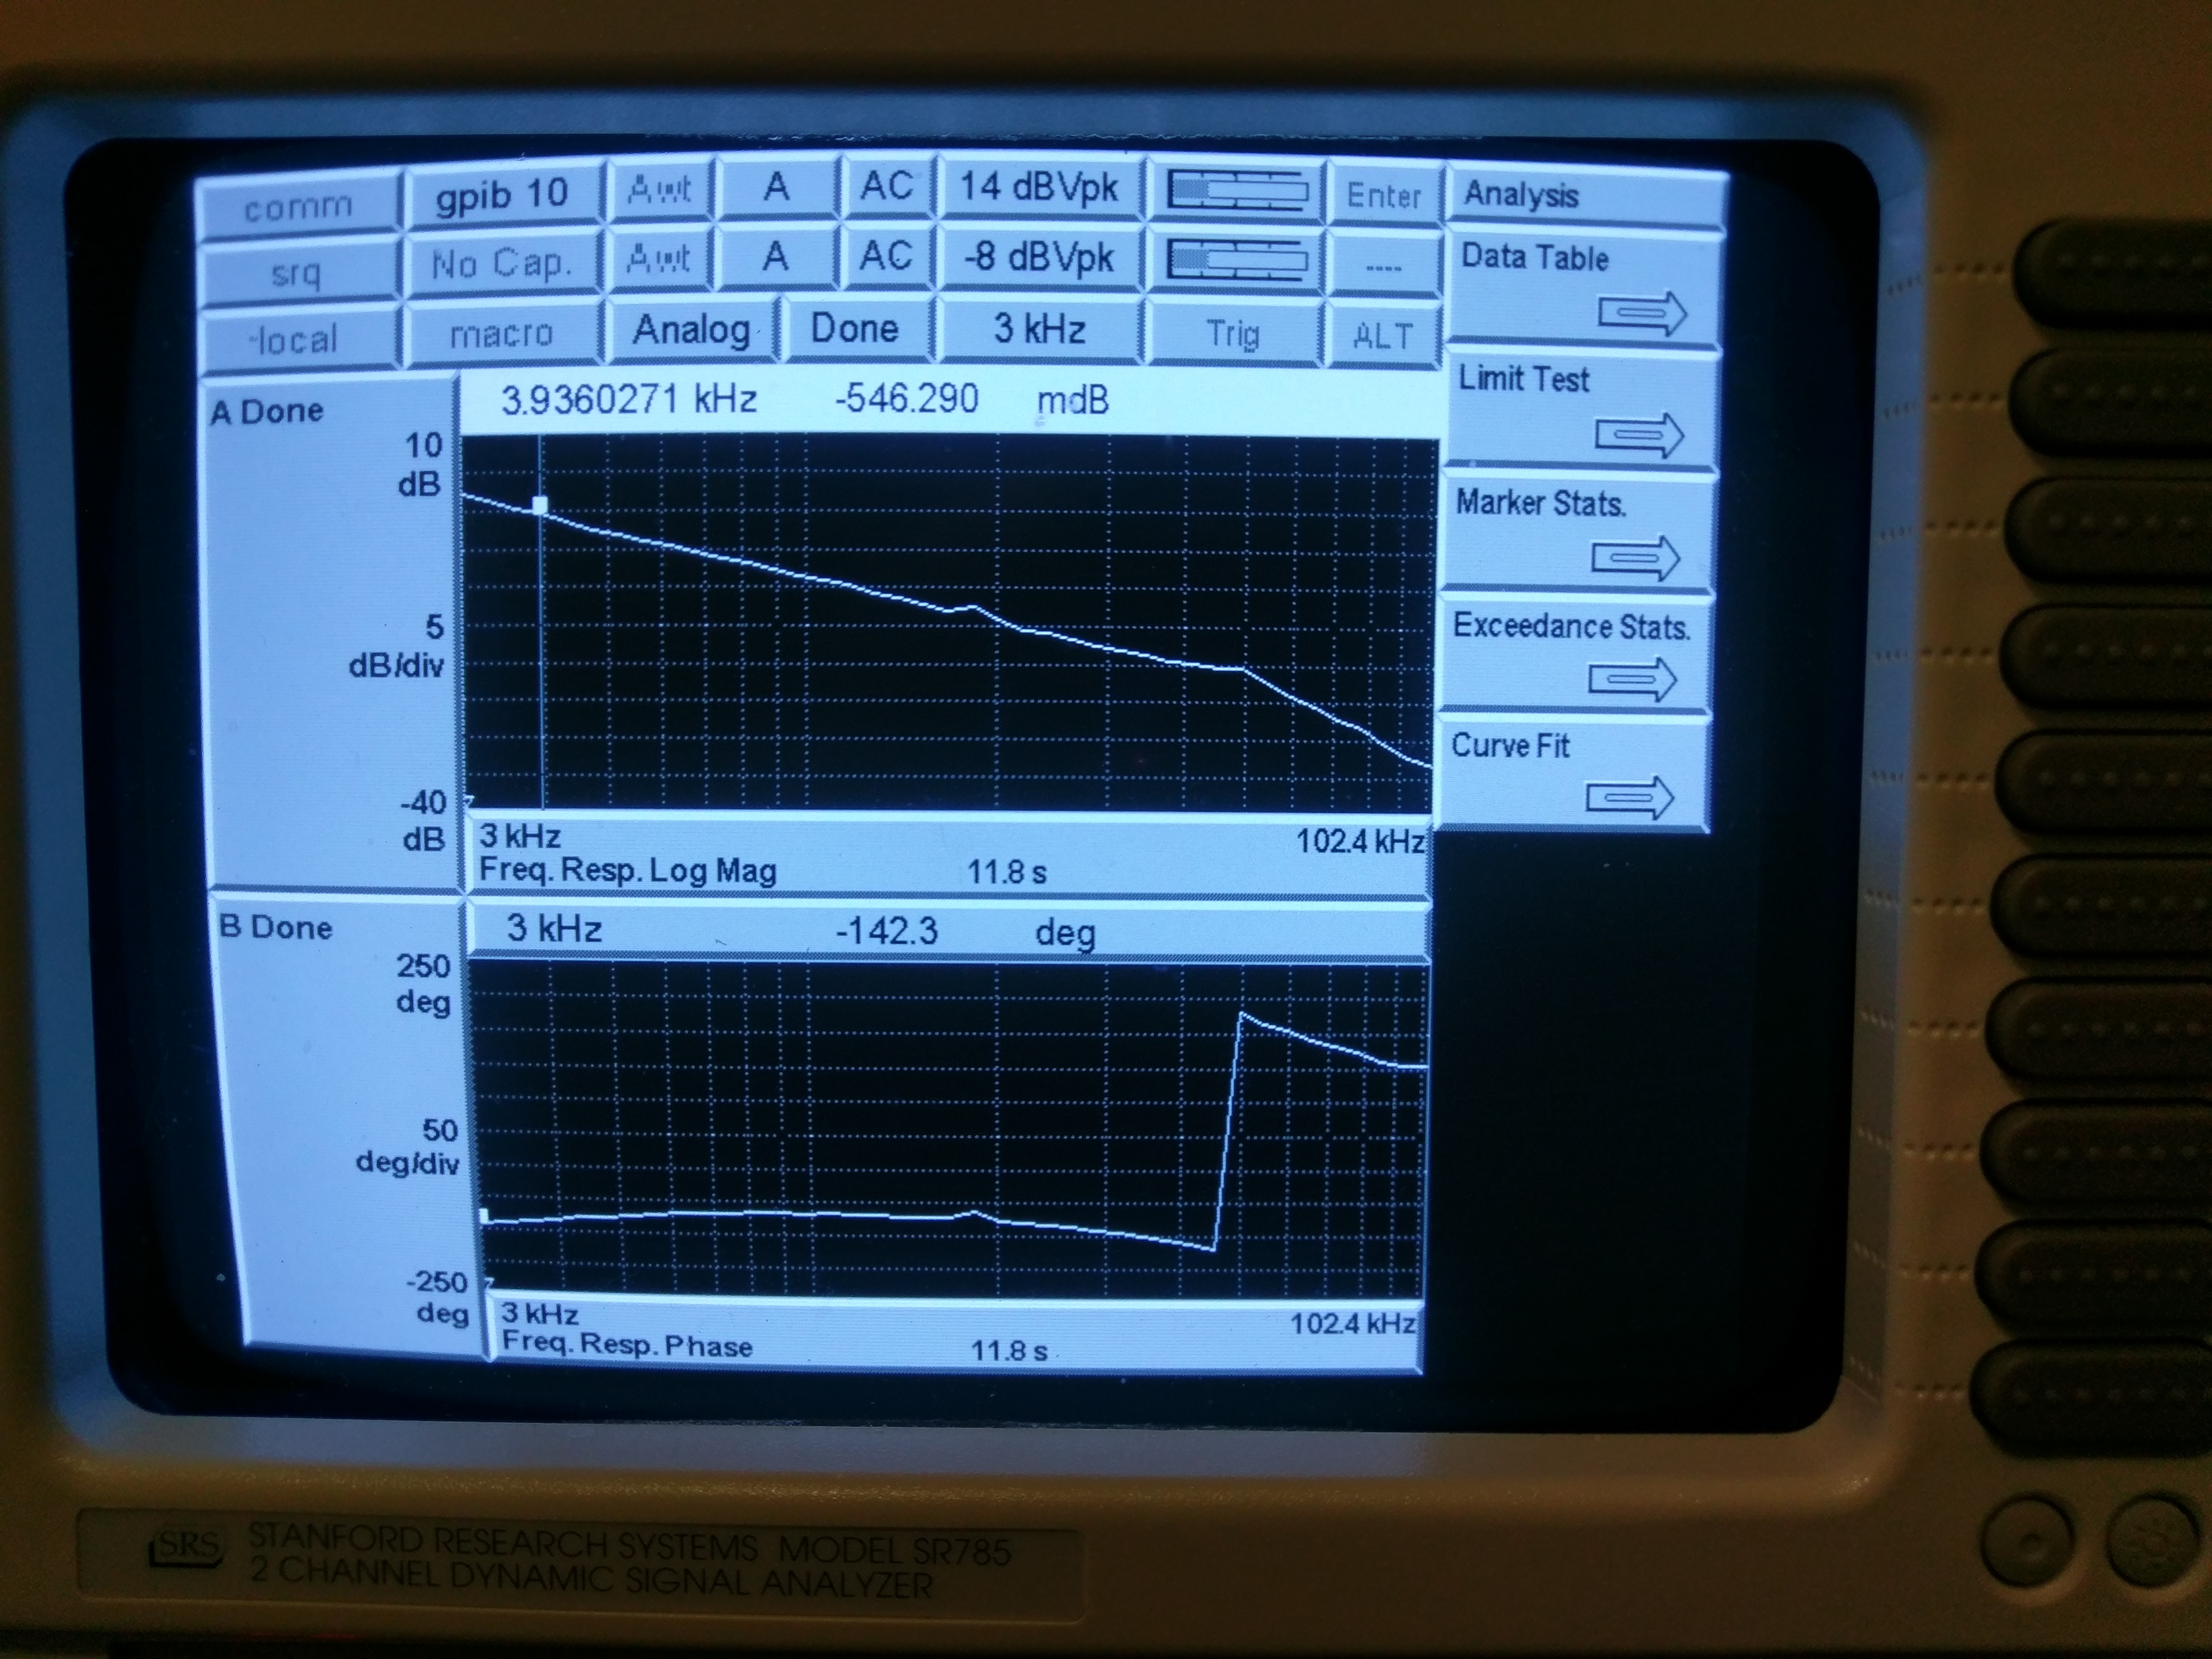
UGF was somewhat higher than 40kHz, phase margin less than 20 degrees. (First attachment, note that the measured TF is OLTF/10 due to the modification we made in January (alog 46317) where the summation opamp gain is -10 instead of -1. Sorry about confusing cursor position, I was confused when I took this picture.)

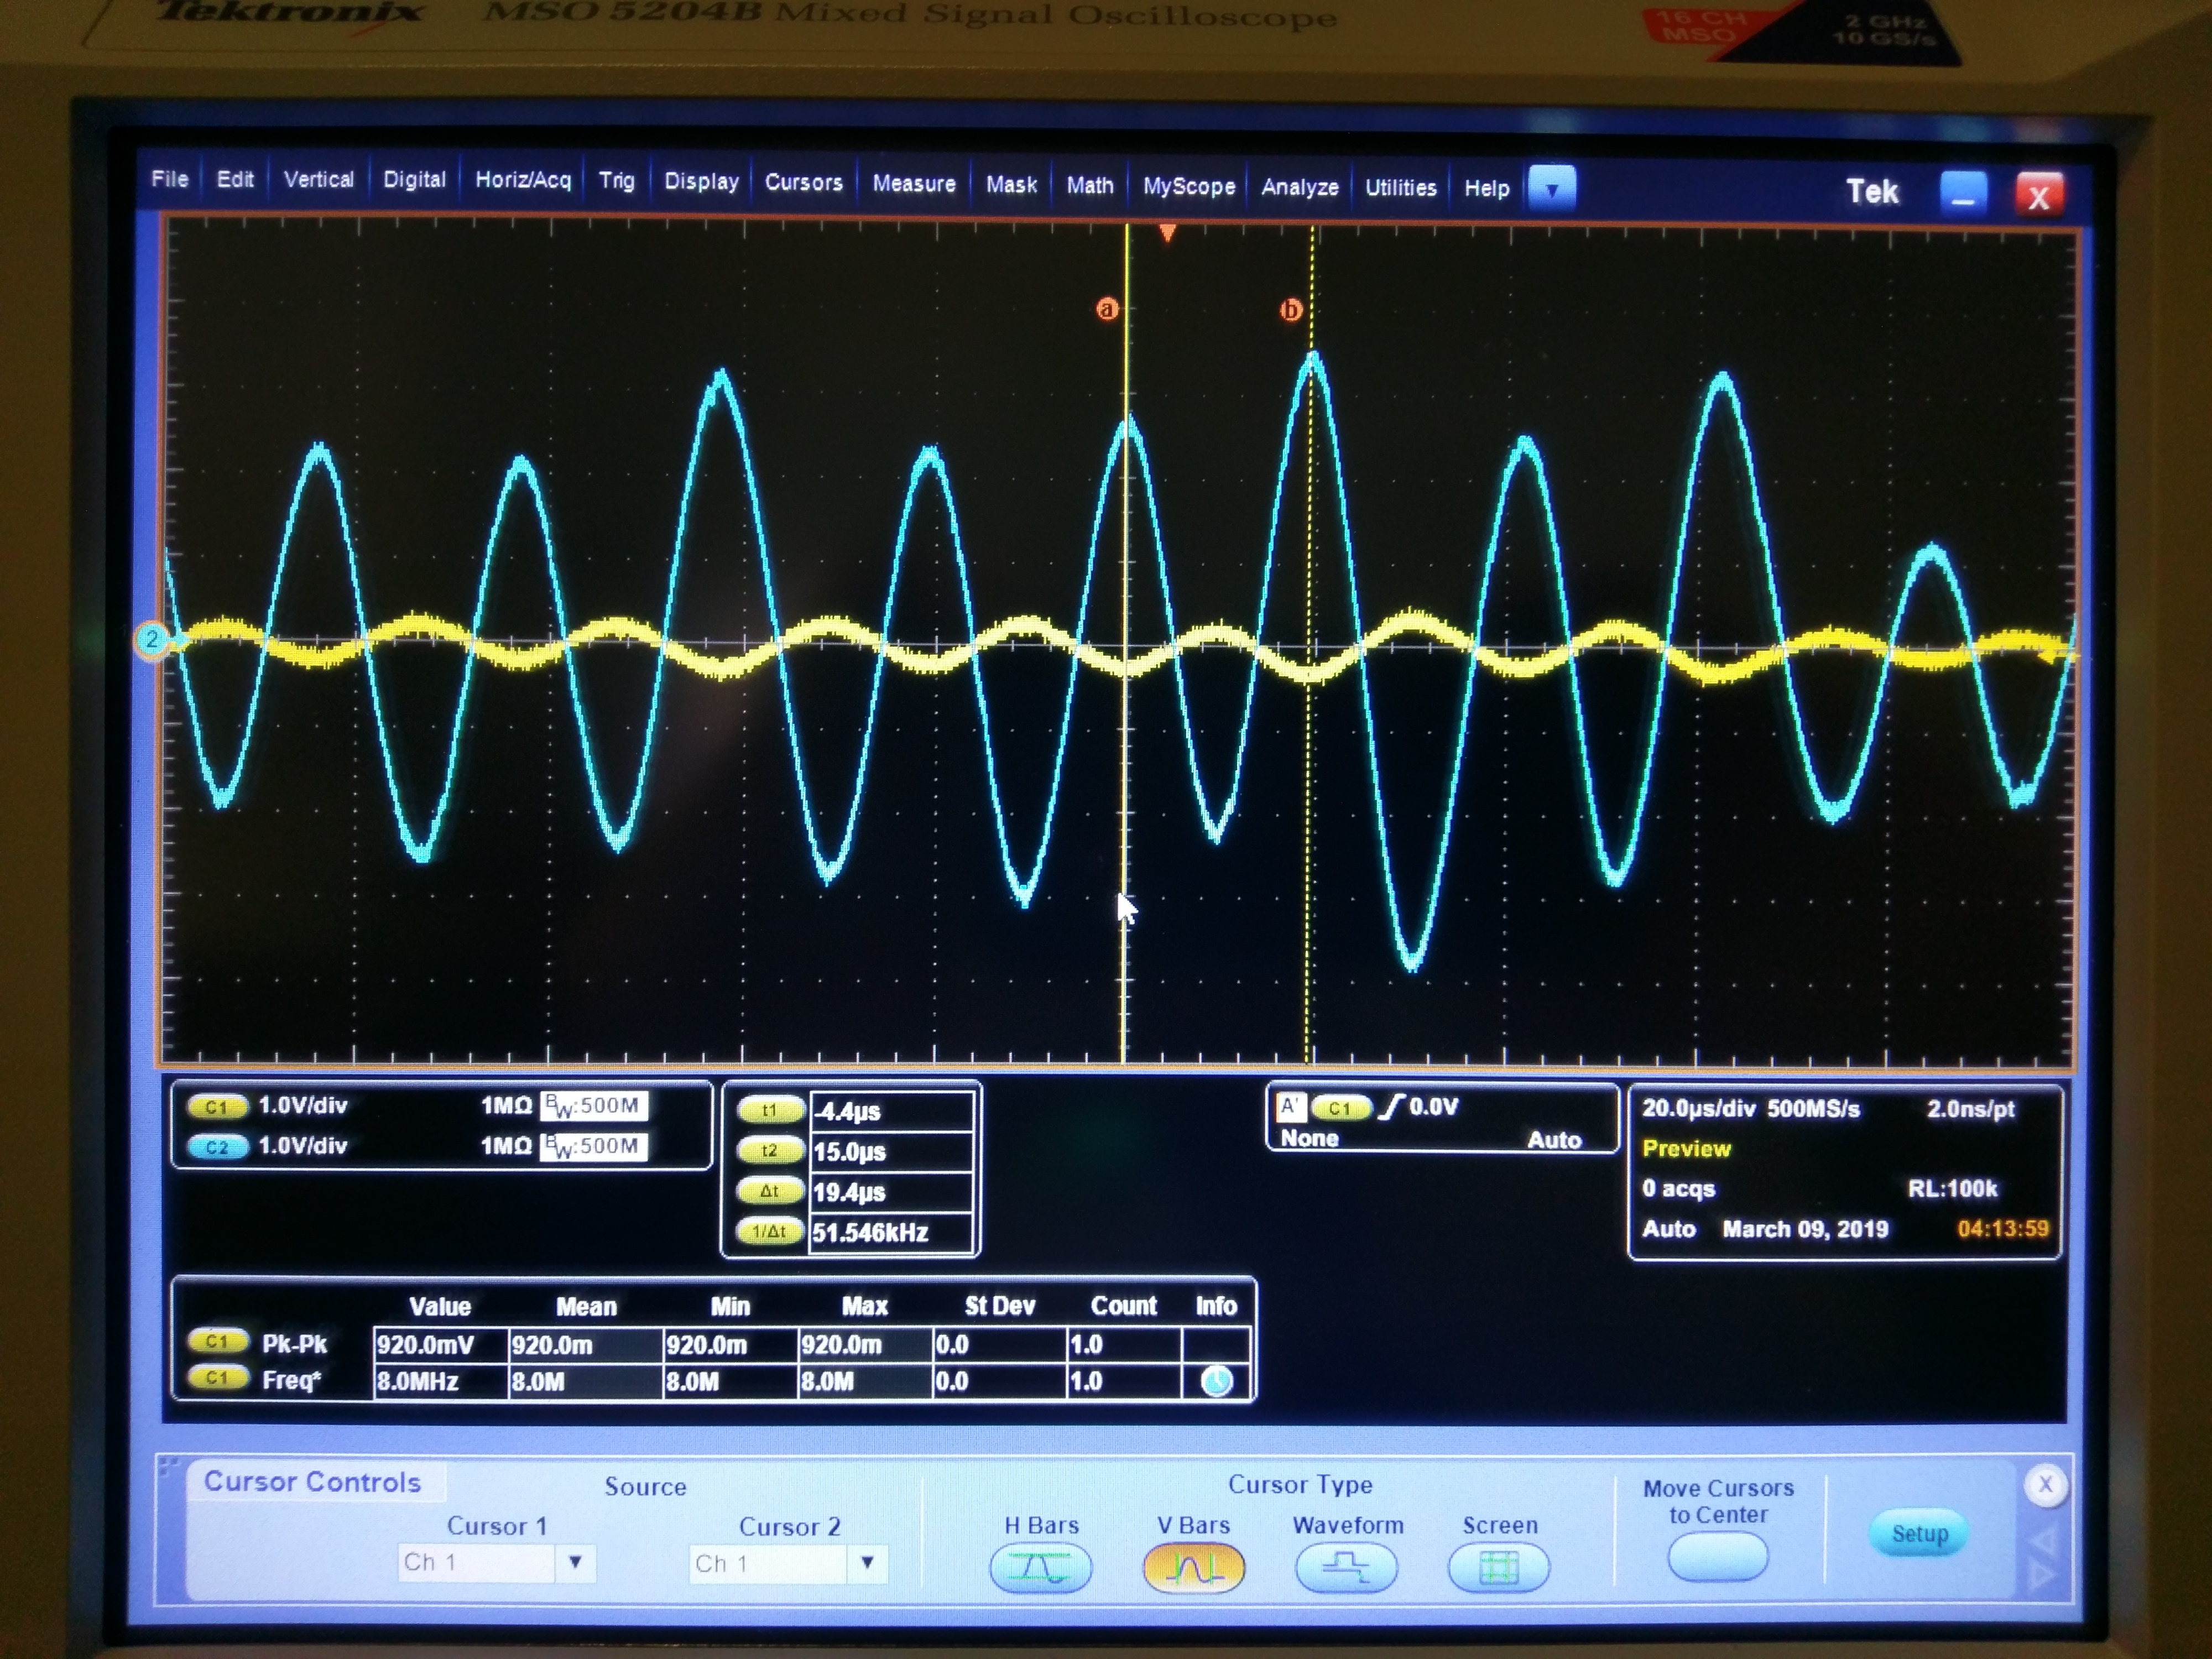
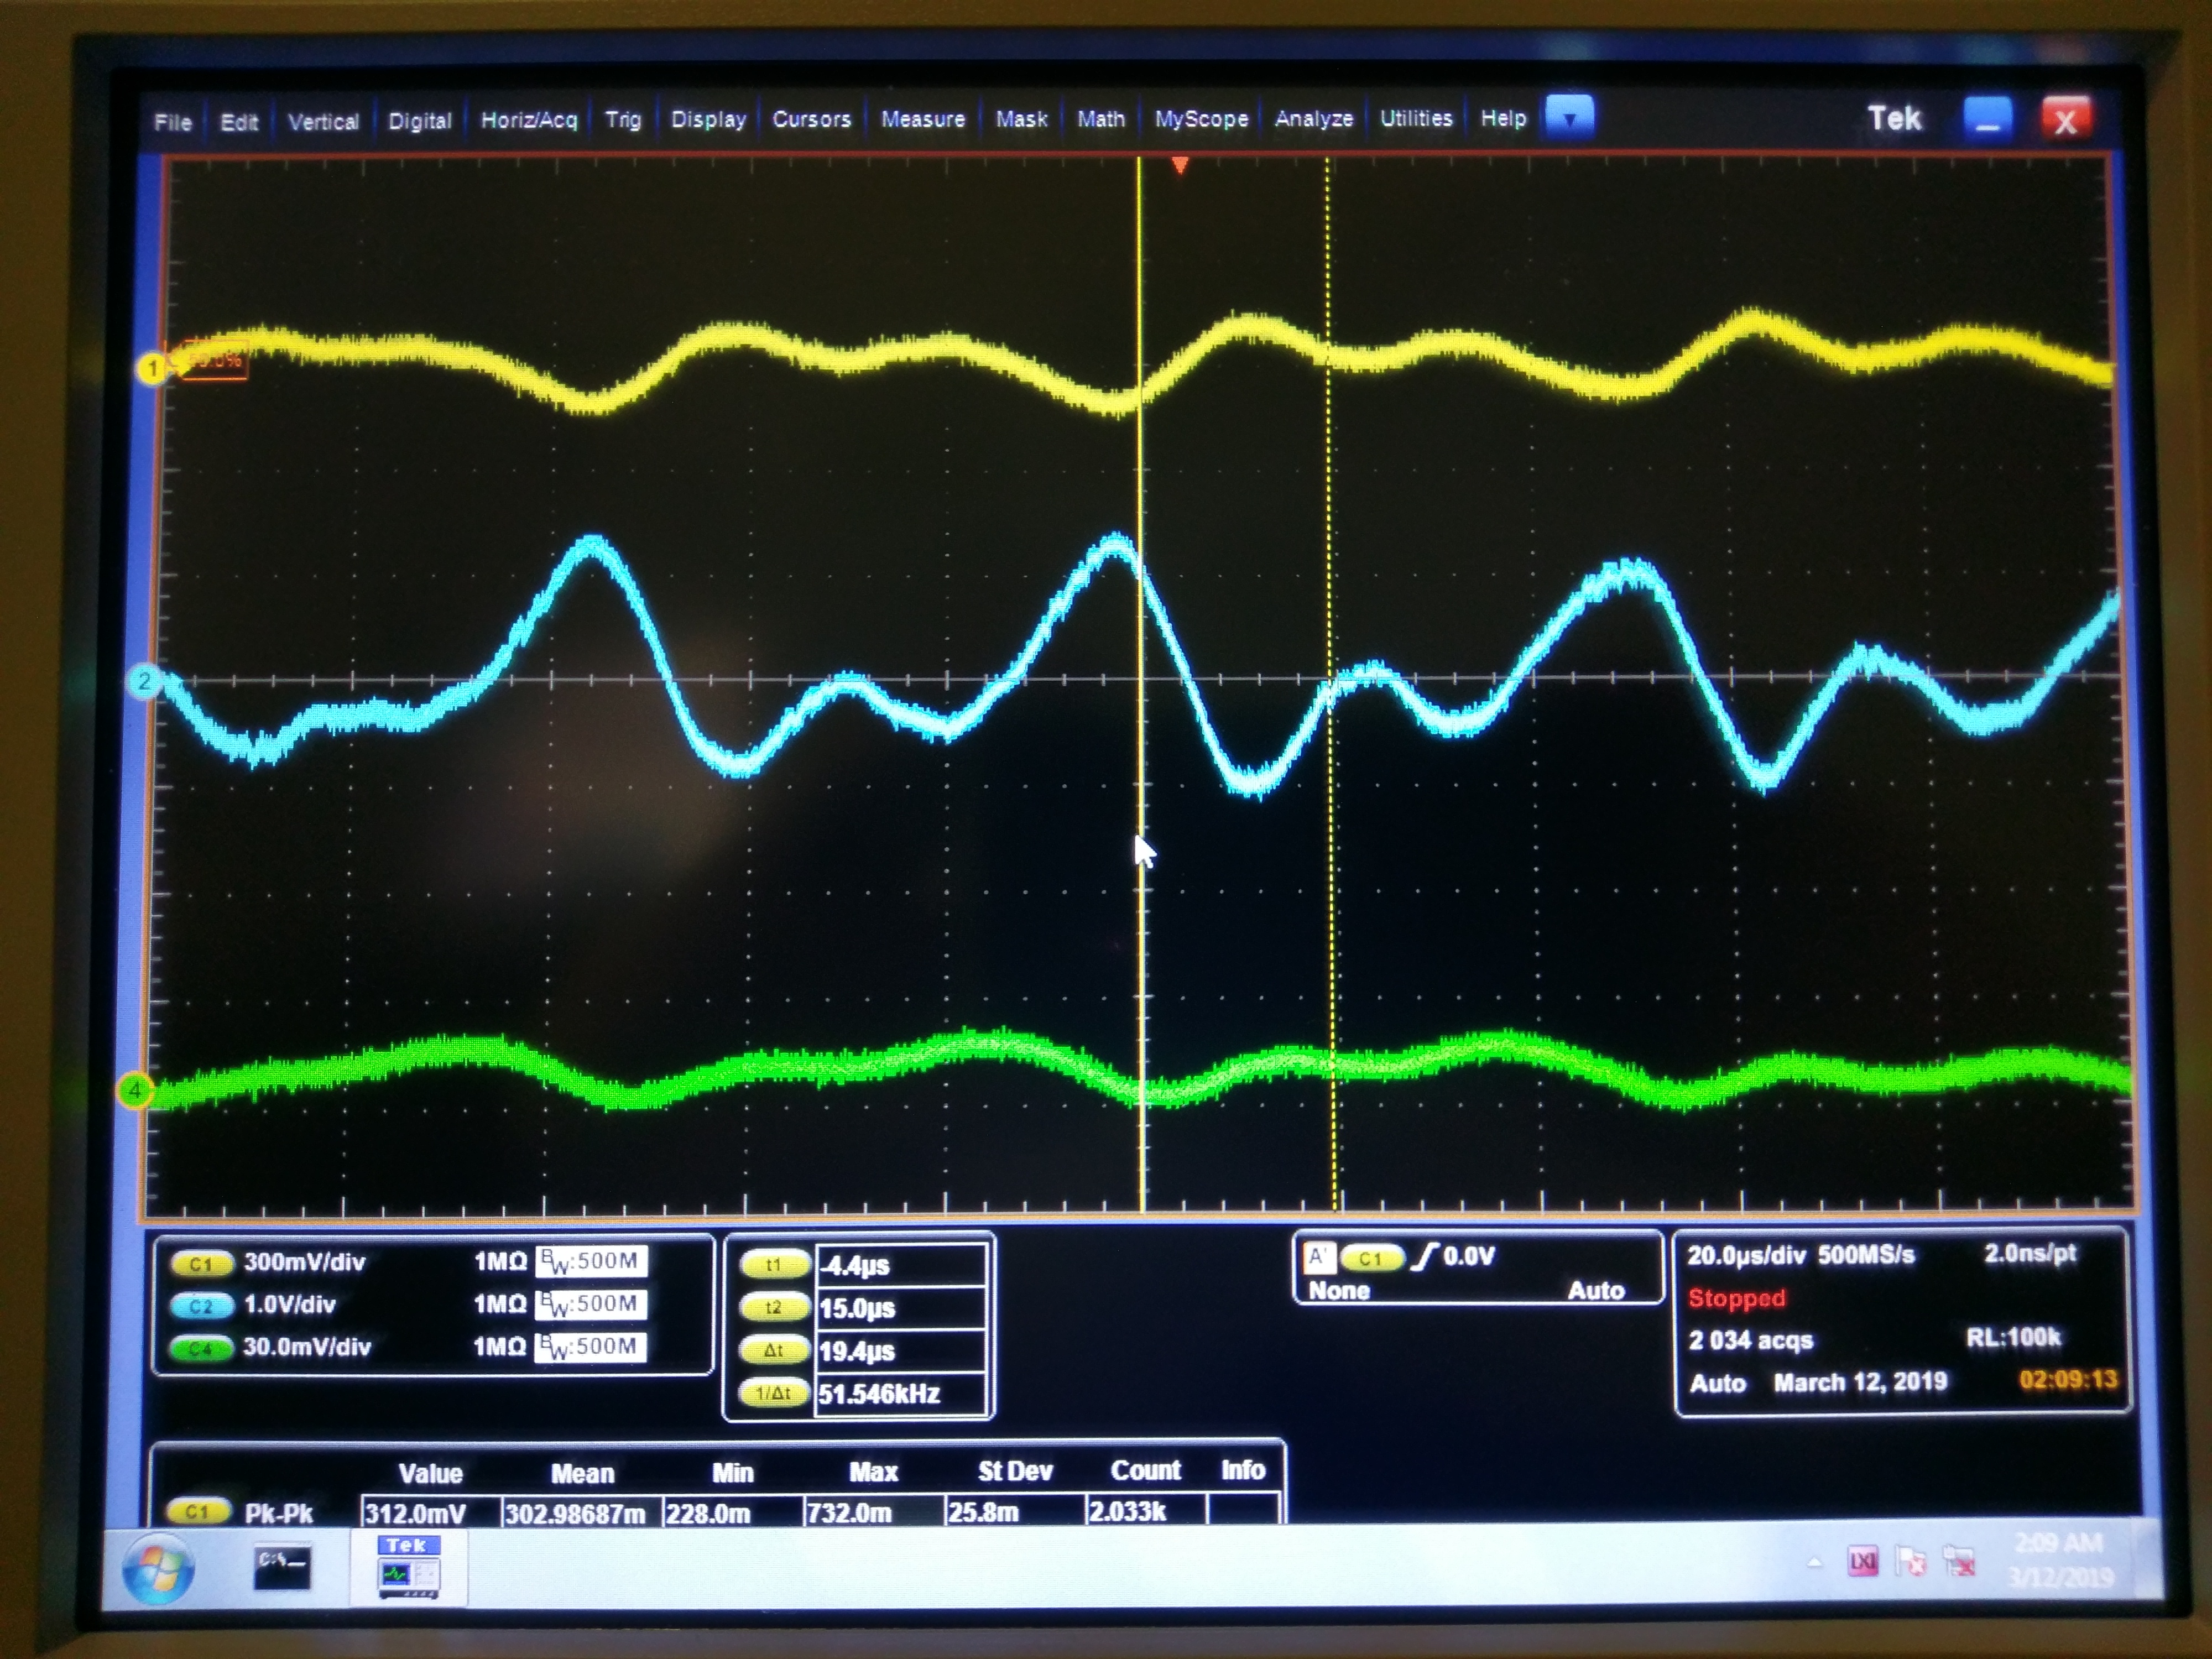
As the result there is a huge gain peaking at about 50kHz, producing about 5 to 6 Vpp at the output of the summation opamp, which is too large. (Second attachment, yellow is before the summation amp, blue is after. Didn't measure the output of the board.)

Later Georgia set the VGA gain 5 dB lower (H1:PSL-ISS_SECONDLOOP_GAIN will be 7dB instead of 12dB) in the guardian so that the UGF comes down to about 20kHz, with ~50deg phase margin.

Since we're trying to lock I won't repeat my measurements on the floor at the moment but we need to do it during EQ time or on Tuesday.
 

Images attached to this report
Comments related to this report
keita.kawabe@LIGO.ORG - 17:41, Friday 08 March 2019 (47410)

If you have an opportunity over the weekend, what you need to do is:

Set the laser power to 30W. Go to ISS_DC_COUPLED (IMC_LOCK guardian). Confirm that the VGA gain slider is at 7dB.

Go to the floor. At the back of the ISS 2nd loop chassis on the rightmost PSL rack, there are four BNC connectors labeled as ERR1, ERR2, EXC and board OUT.

Connect the excitation of SR785 to EXC, CHA to ERR2, CHB to ERR1.

In the MEDM screen, enable excitation input.

EXC voltage of 1000mV is OK. There's a 1/10 attenuation in the EXC path so this is not excessive. You'll have to integrate long (e.g. 0.1 sec or some such) to get a decent measurement.

Measure the OLTF. Note that the measured quantity is OLTF/10.

Disable EXC, disconnect EXC, connect ERR2 and ERR1 and OUT to a scope and measure the voltages. If you still see a huge gain peaking you want to lower the gain further.

keita.kawabe@LIGO.ORG - 13:35, Monday 11 March 2019 (47427)

This morning when H1 lost lock, I quickly went to the floor and made the same measurements, and things look OK.

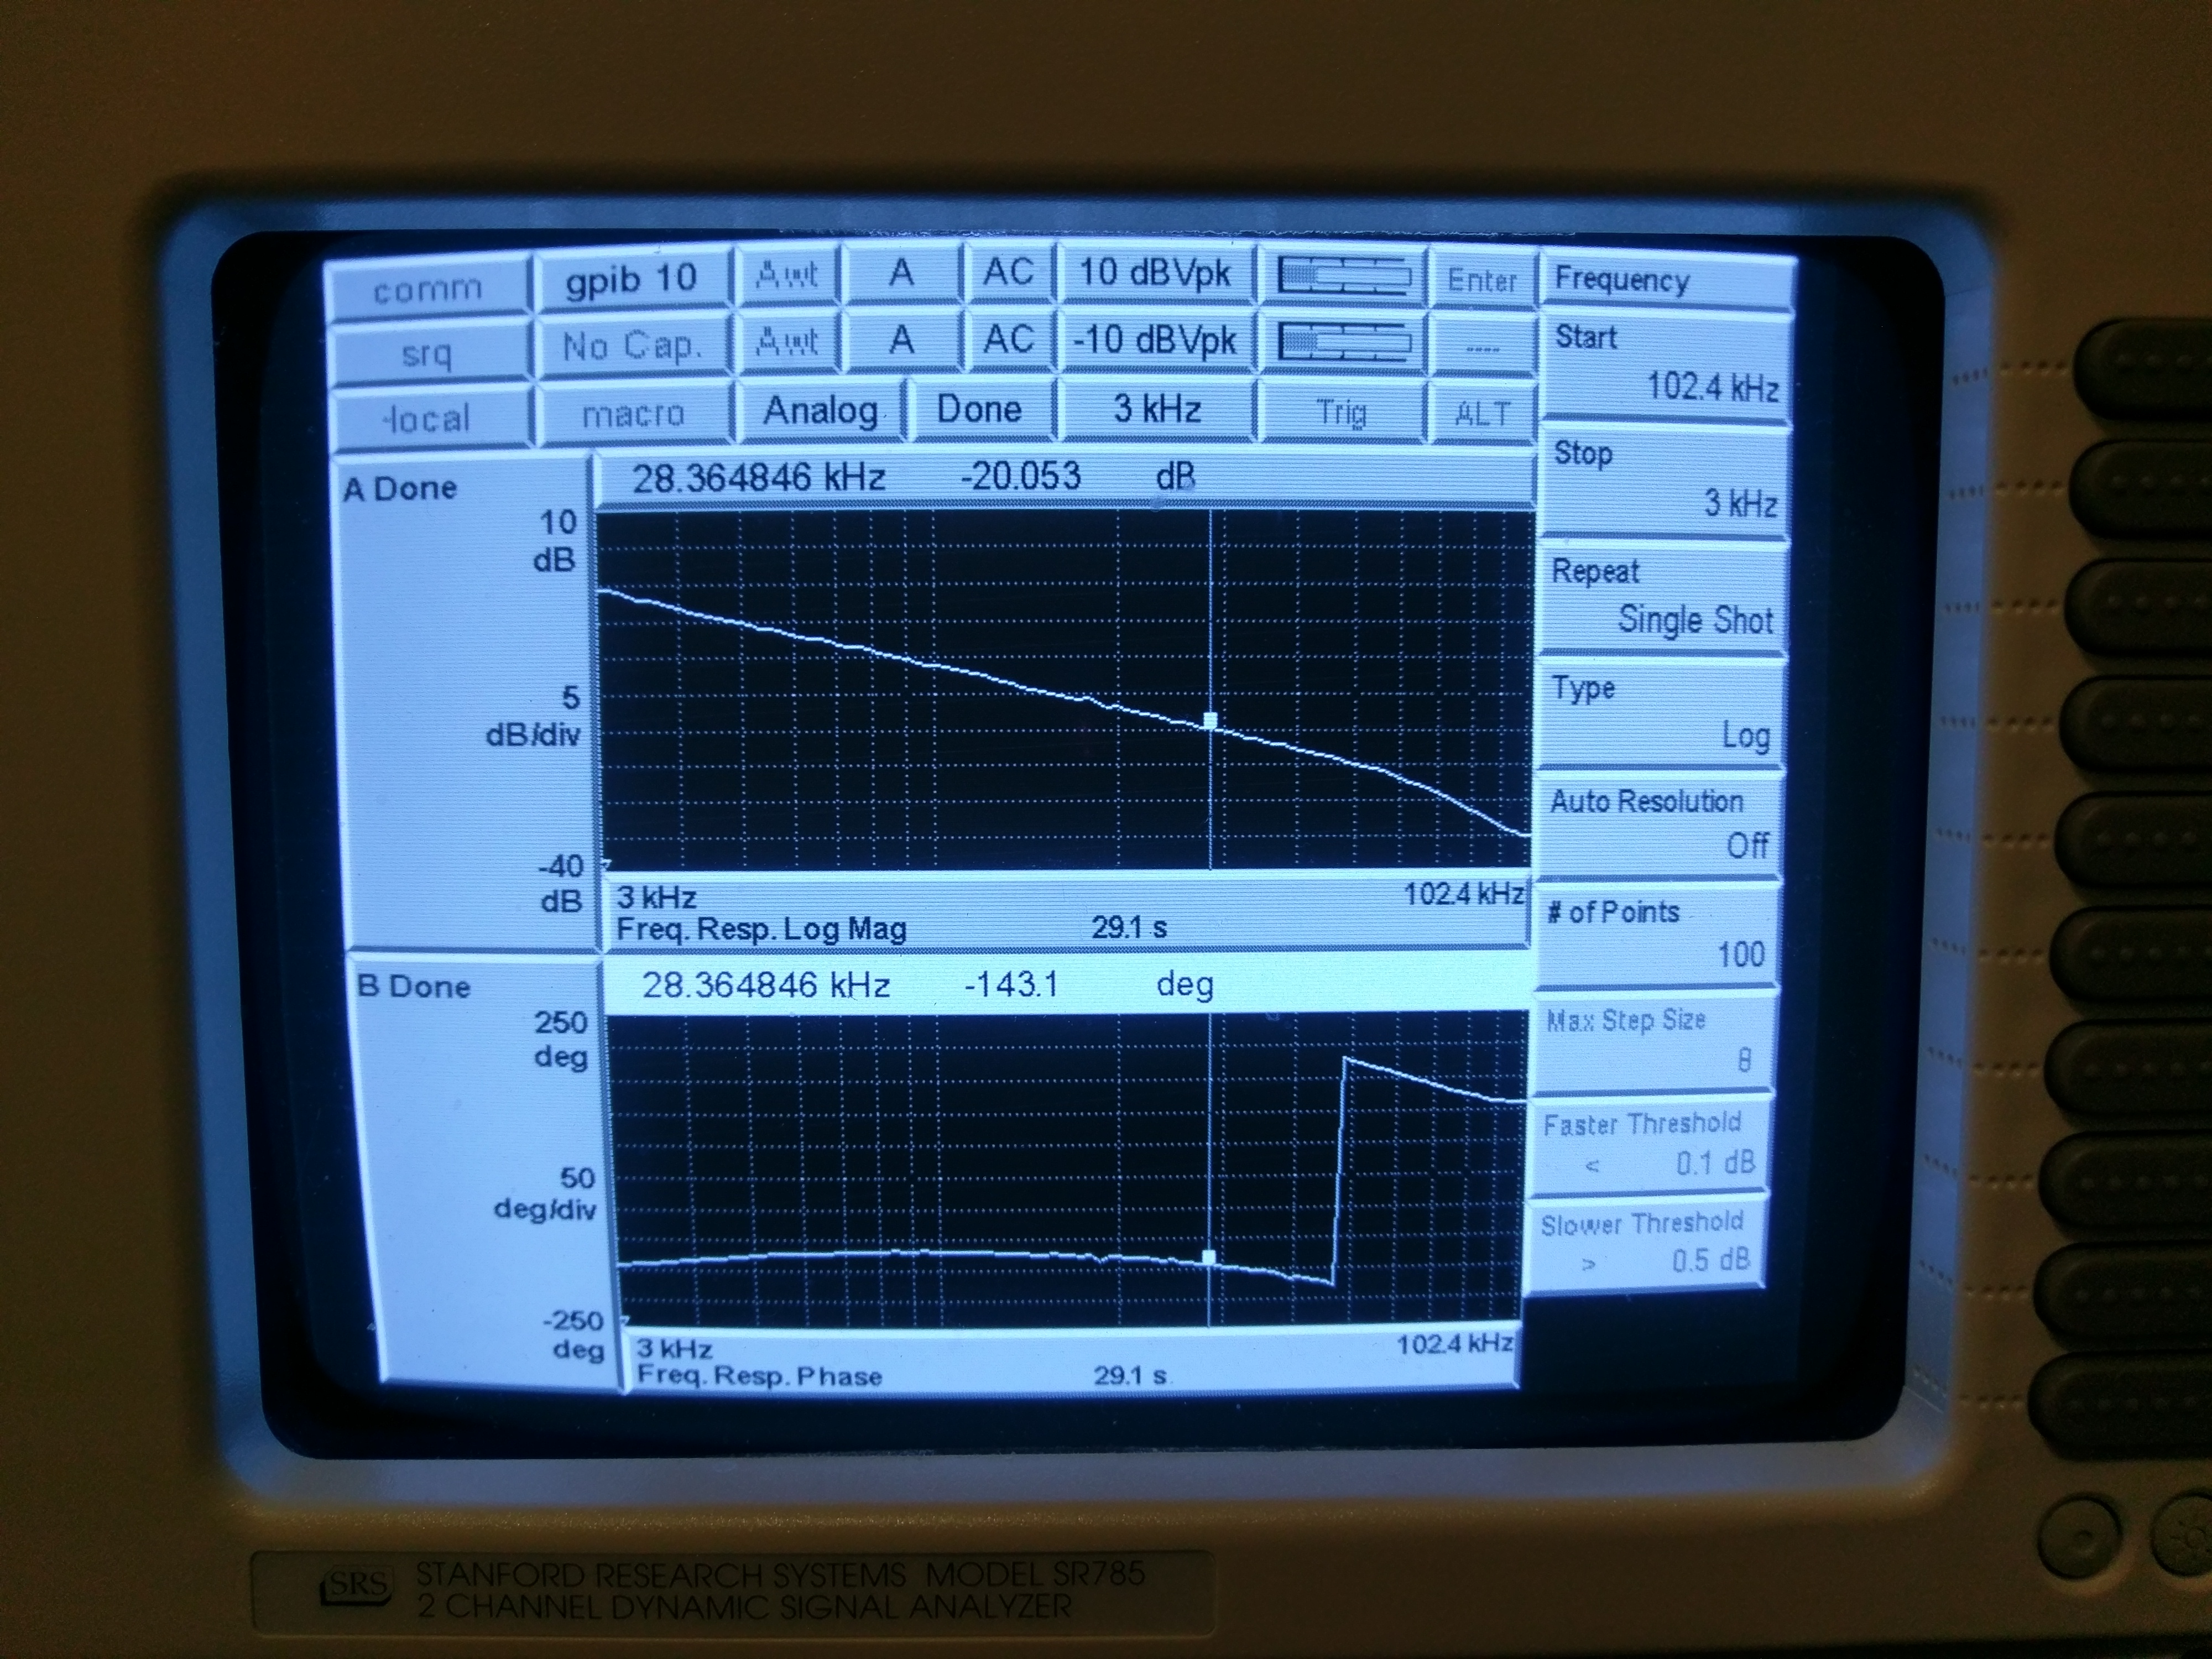
At 30W with 7dB VGA slider, UGF~28kHz, phase margin~37deg, which look good to me (first attachment).

Moving the slider back up to 12dB, the servo immediately started the oscillation at about 50kHz. Bringing it down to 11dB already quenched the oscillation.

With the nominal gain of 7dB, the residual noise at around 50kHz was ~1Vpp after the x10 summation stage with maybe another 1+Vpp or so at around UGF (second attachment blue) which is larger than I'd like. However, the output of VGA with 7dB gain will be ~4.5+Vpp which would be large but OK. The output of the board was measured to be about 15~20mVpp or so (2nd attachment green), this is no problem for the 1st loop.

(The reason why the board output is small is because two fixed boost type filters downstream has about 2E-3 attenuation combined for f>20kHz.)

Images attached to this comment
Displaying reports 42641-42660 of 88668.Go to page Start 2129 2130 2131 2132 2133 2134 2135 2136 2137 End