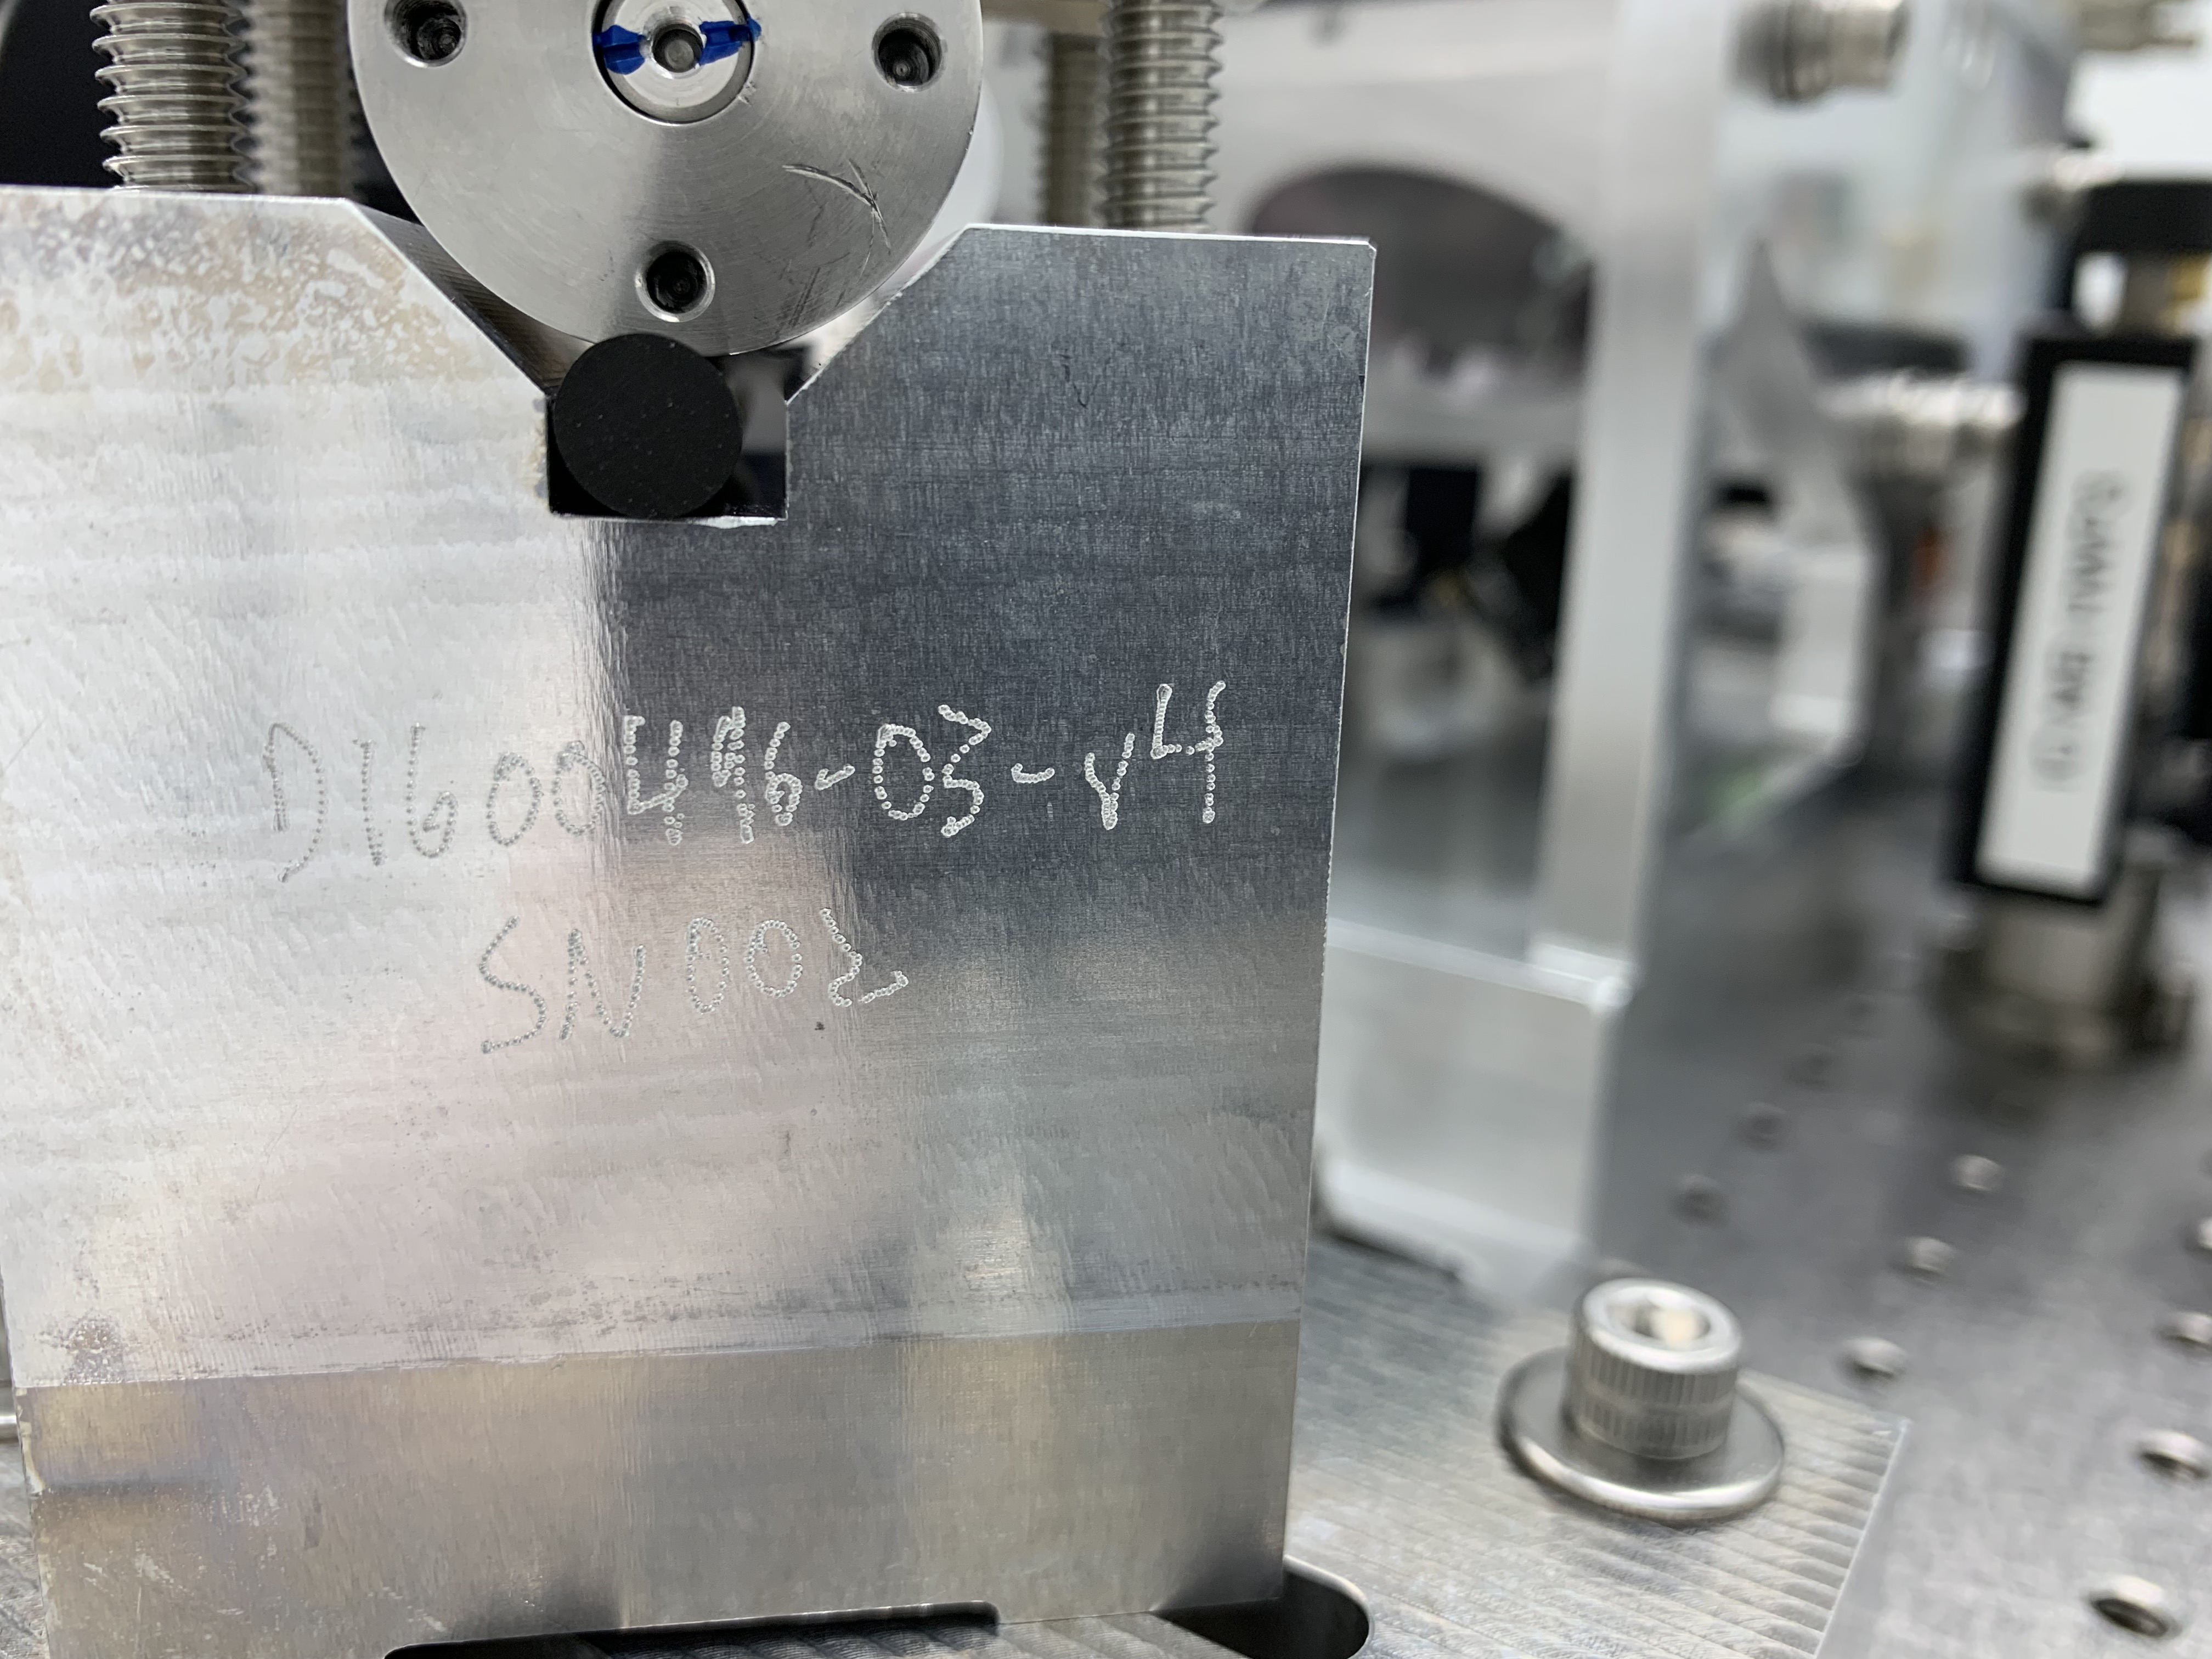
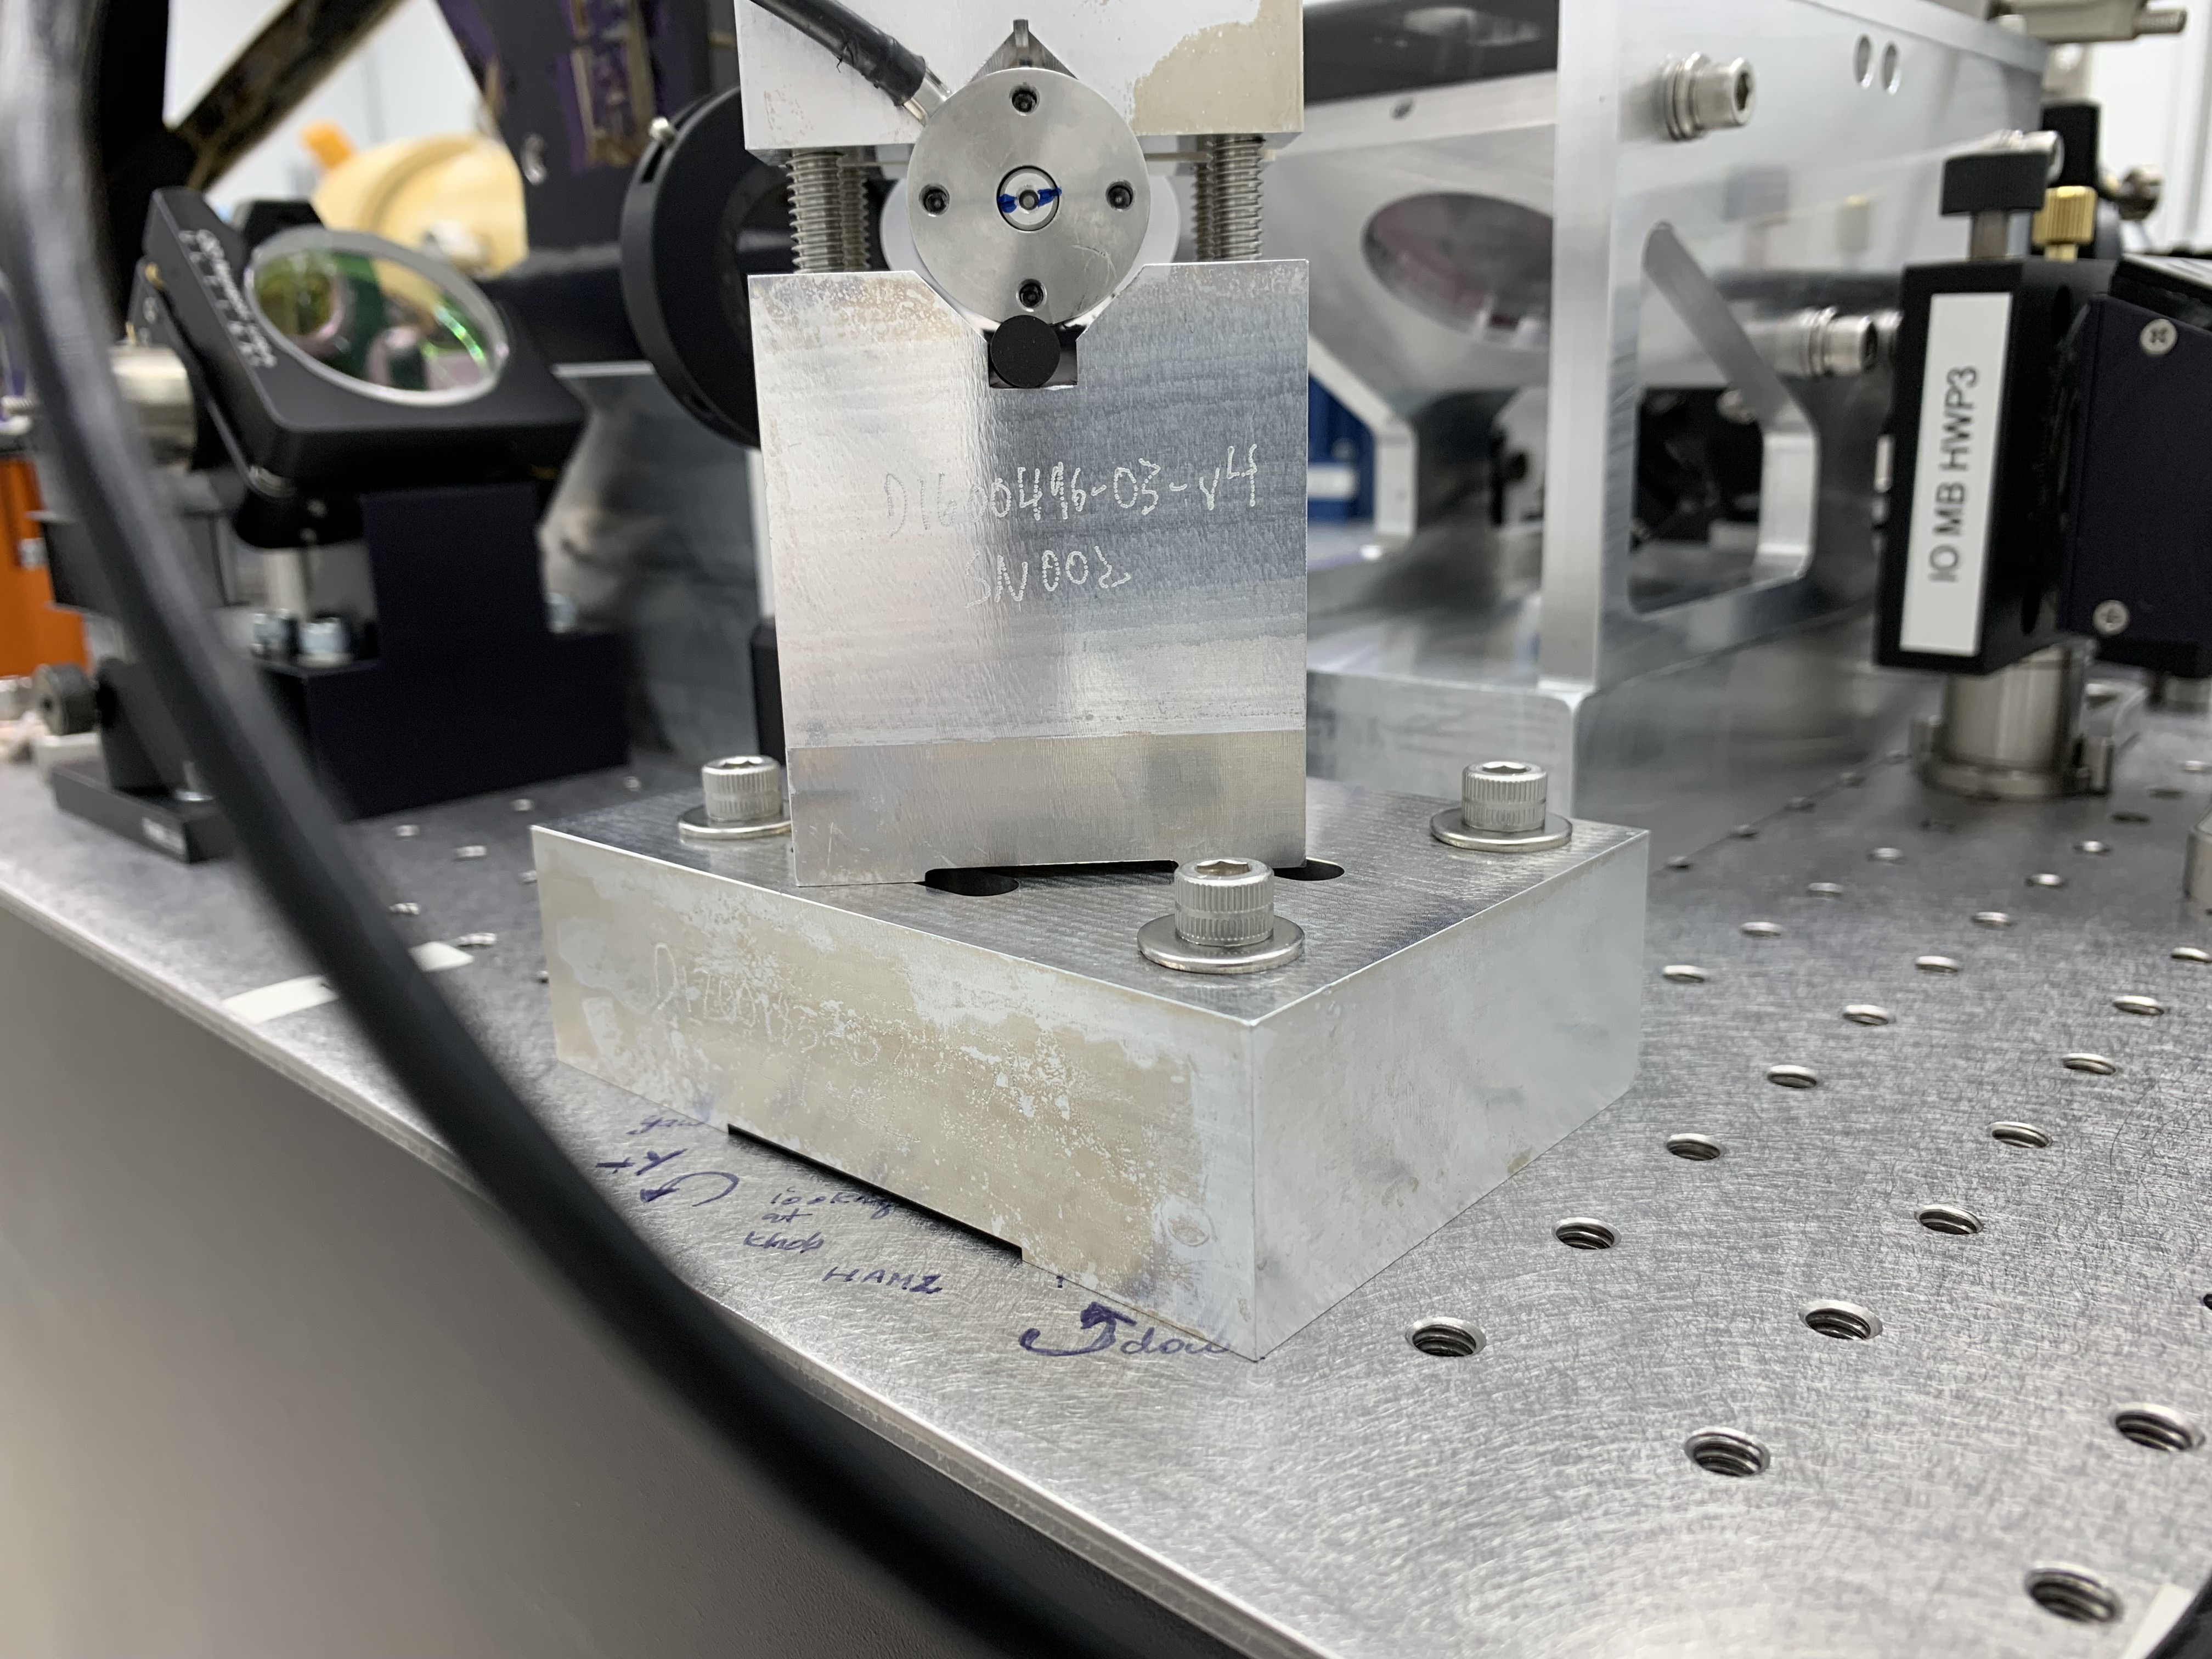
The shaft seal is leaking on the Y-end chilled water booster pump. This pump "boosts" the chilled water pressure to make up for transmission losses. I valved-out the parallel chilled water circuit which contains this booster pump and which supplies the Mechanical Room and VEA. The HVAC should not be affected. The pump has been removed and will be repaired or replaced asap.
Today, while doing some cabling for PSL Picomotors, I noticed that the clamping of hte PZT actuator doesn't look right (see attached photos).
It seems that the screws that apply the clamping force, thus constraining the PZT body between the upper vee and the lower vee (and compressing the viton damping cylinder in the process) were not sufficiently tightened.
The PZT actuator cylinder appears to be floating on top of the viton cylinder, lightly constrained by the upper vee, but not the lower one - there is an obvious 1-2 mm gap between the PZT cylinder and the lower vee, on both sides.
Thanks for sharing, Rick. The cylinder of the PZT definitely should not be floating atop the viton cord, and the PZT cylinder definitely should be registered onto the V contact planes of the Base and the two Clamps.
SYS (EddieS) is working on updating the drawing D1700002 for clarity, but these are the steps that should have been implemented during assembly:
Some comments closing the loop on documentation:
Discussed at IIET call 3/8: See notes / actions at https://services.ligo-la.caltech.edu/FRS/show_bug.cgi?id=12077.
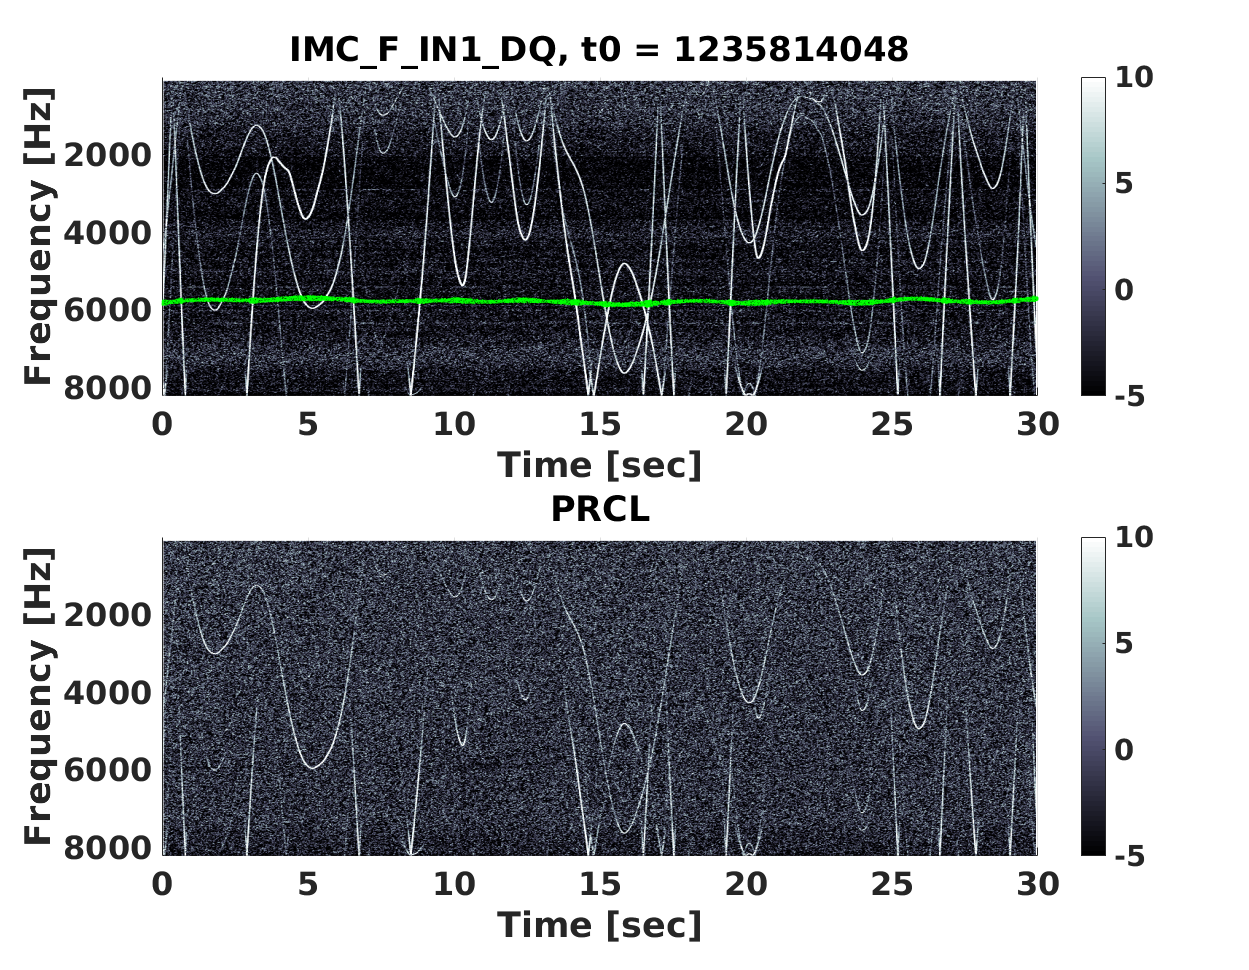
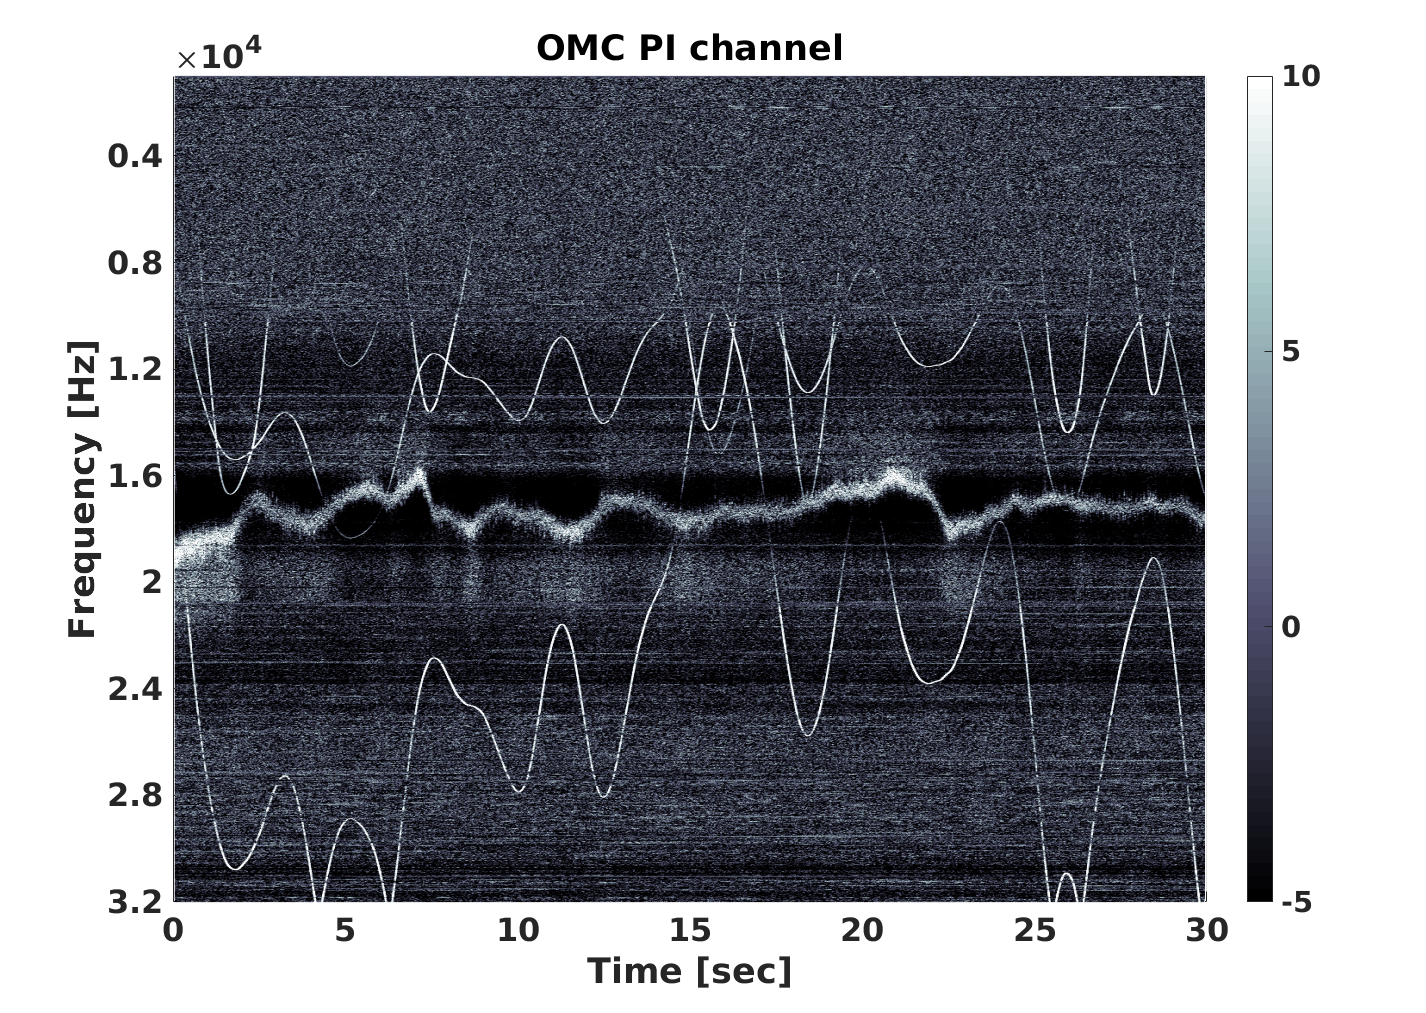
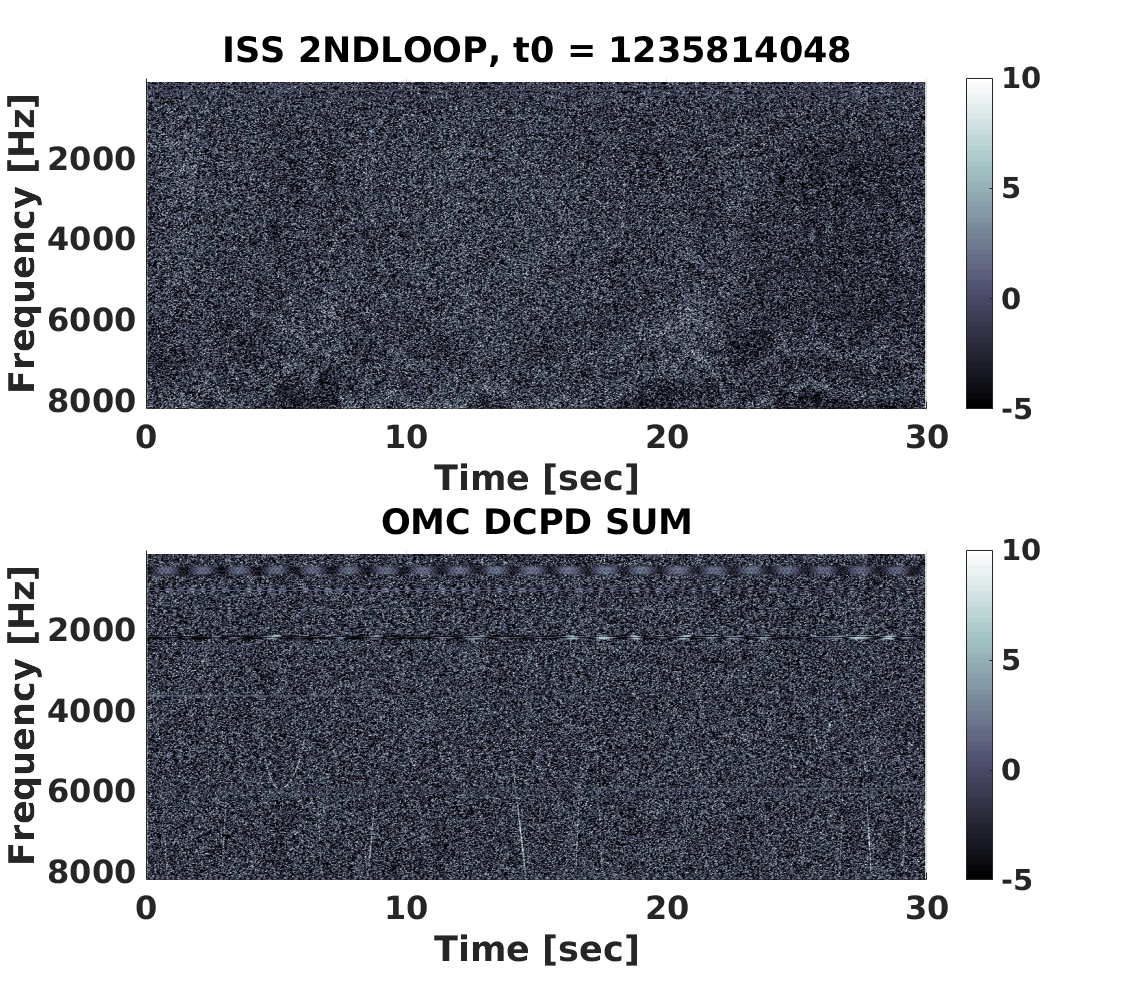
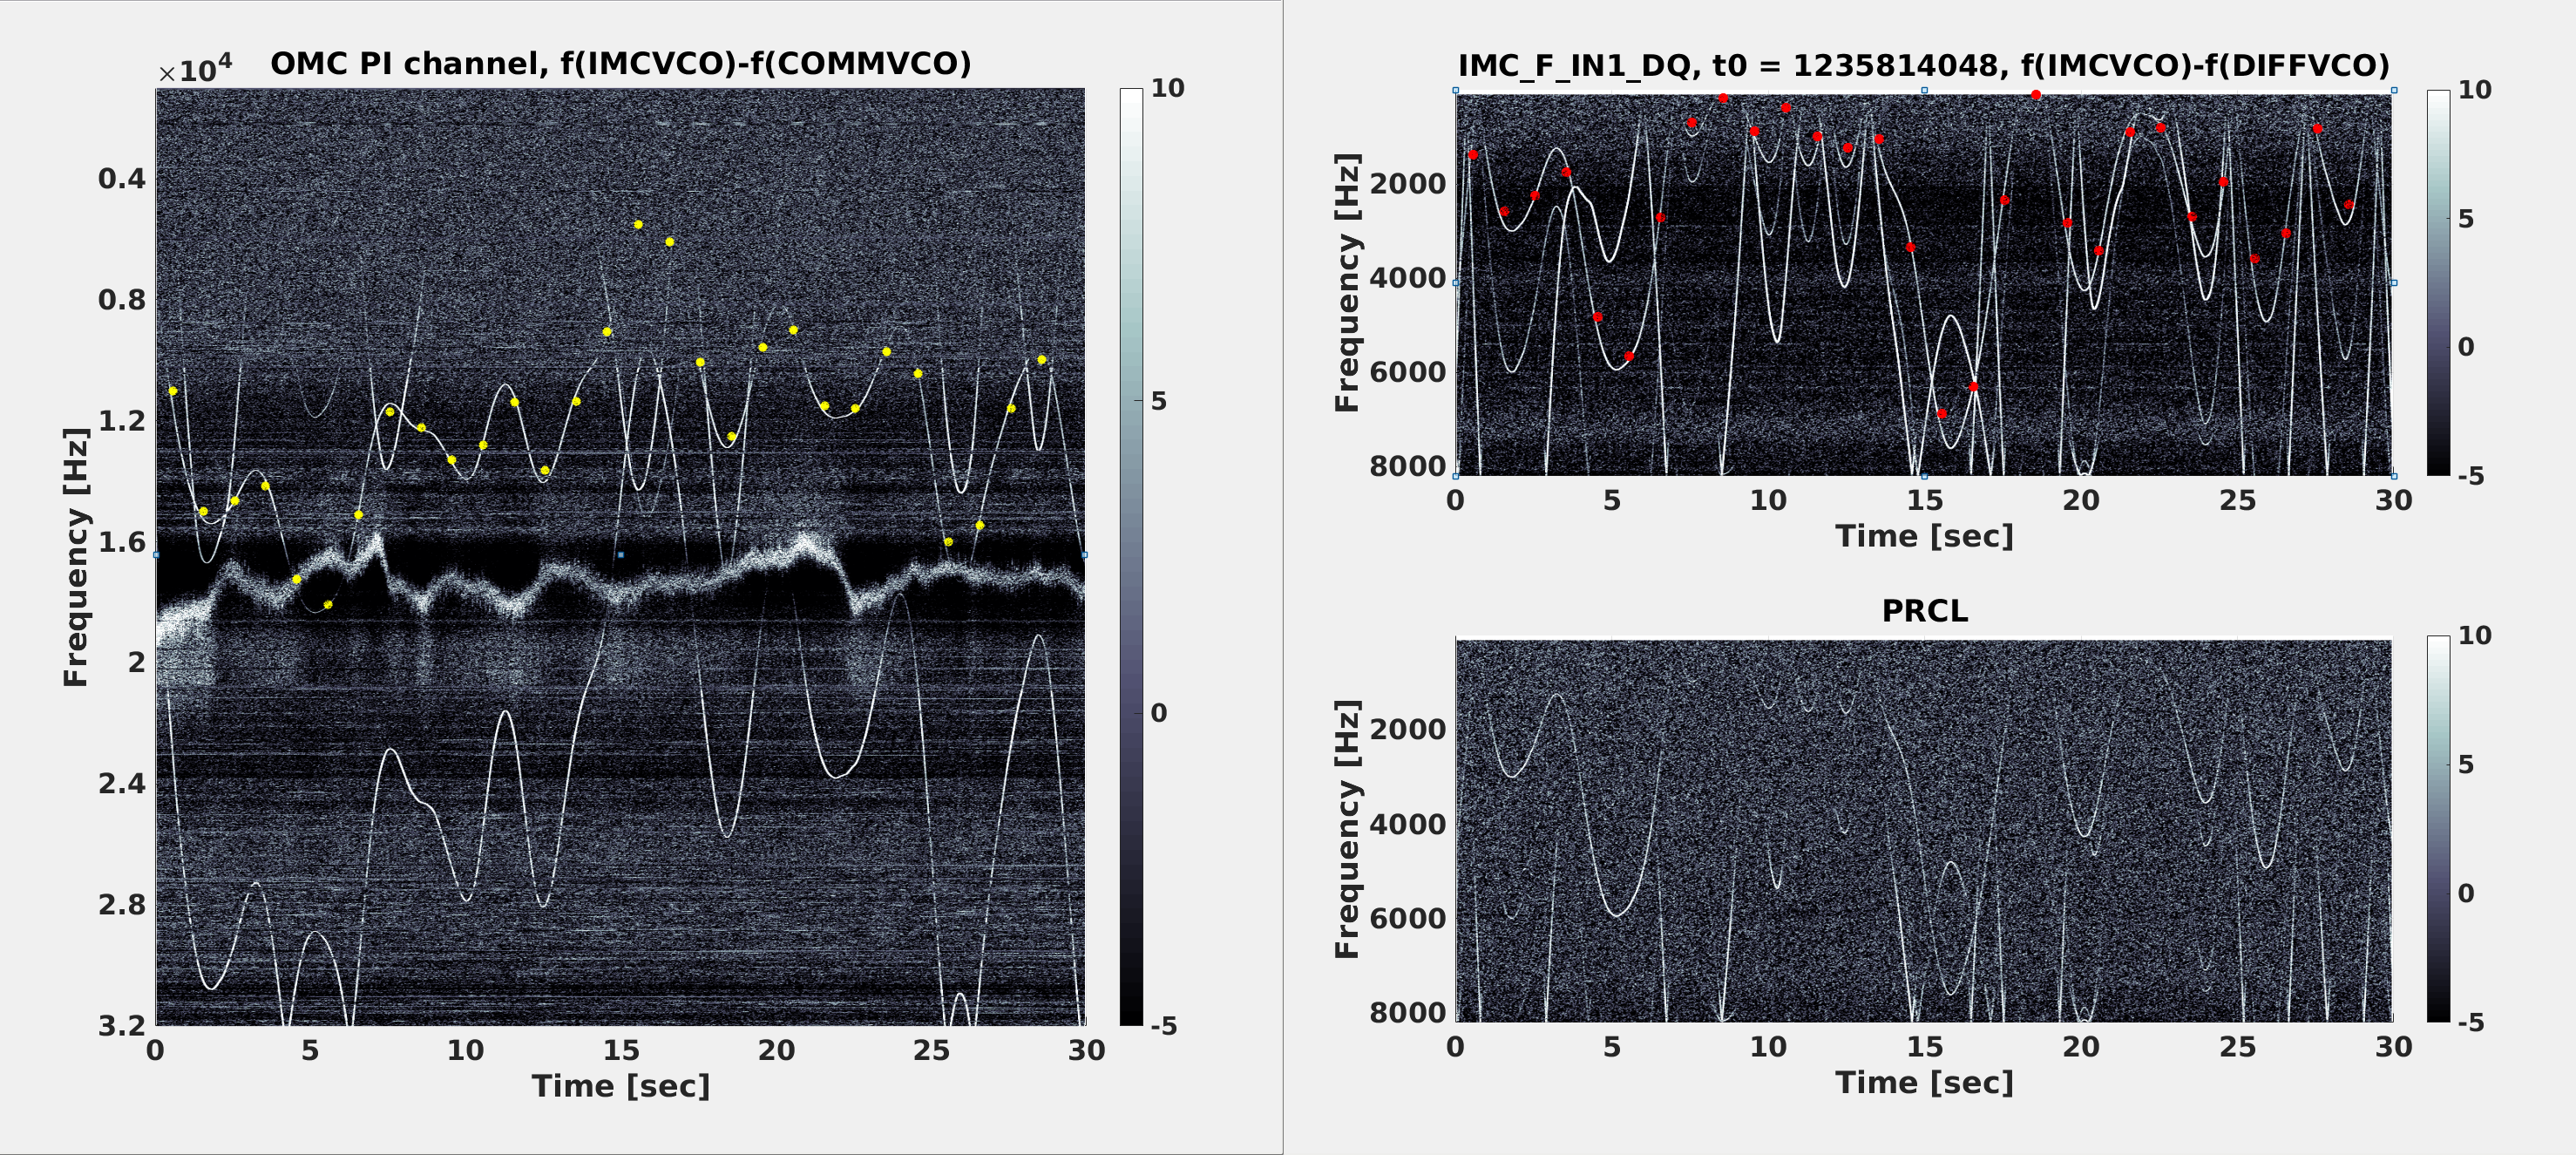
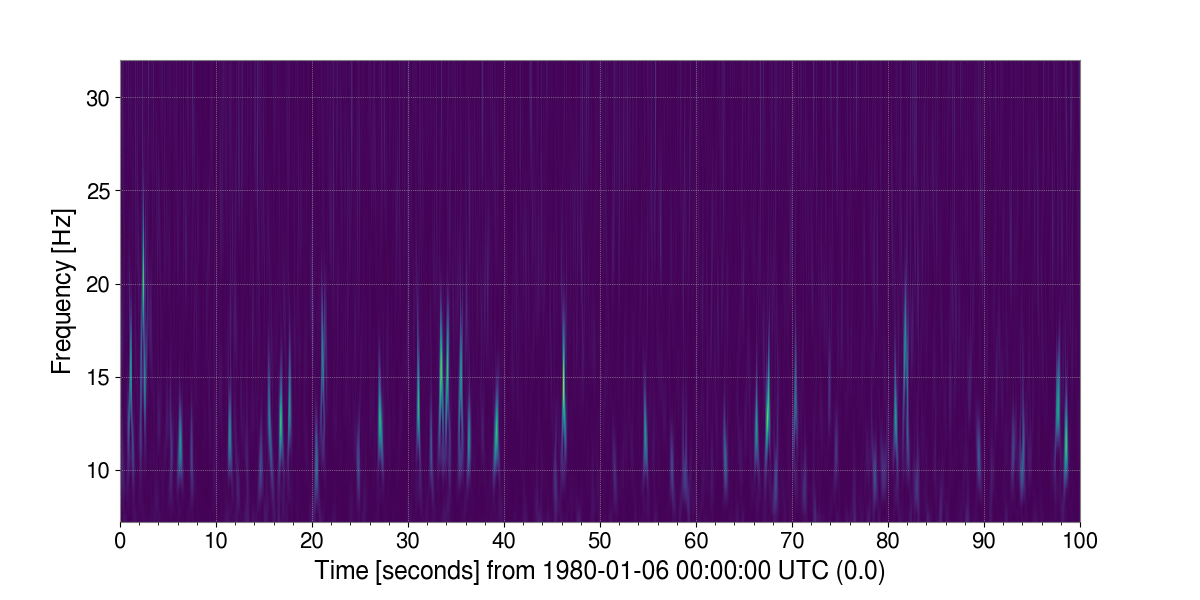
To aid the diagnosis of RF whistles (aka arches), I tried a matlab script that LLO has been using. It essentially just makes normalized spectrograms of channels that are good witnesses of the whistles. The attached plots are the outputs from running this script on data from last night's lock, around 10:00:00 UTC. The whistles/arches are clearly visible in the OMC PI (parametric instability) readout channel up to 32 kHz; they're also quite visible in IMC_F and PRCL (8 kHz and below). At this time the IMC VCO frequency was between 78.781 MHz and 78.794 MHz.
The script is 'look_for_arches.m', and is in: /ligo/home/peter.fritschel/Whistles/
In the first attachment, left panel is the frequency difference between IMC VCO and COMM VCO (which is mostly higher than 8kHz) plotted on top of OMC PI channel spectrogram, and right panel is the difference between IMC VCO and DIFF VCO (lower than 8kHz) plotted on top of IMC_F spectrogram.
The agreement with one of the whistle trace is pretty good.
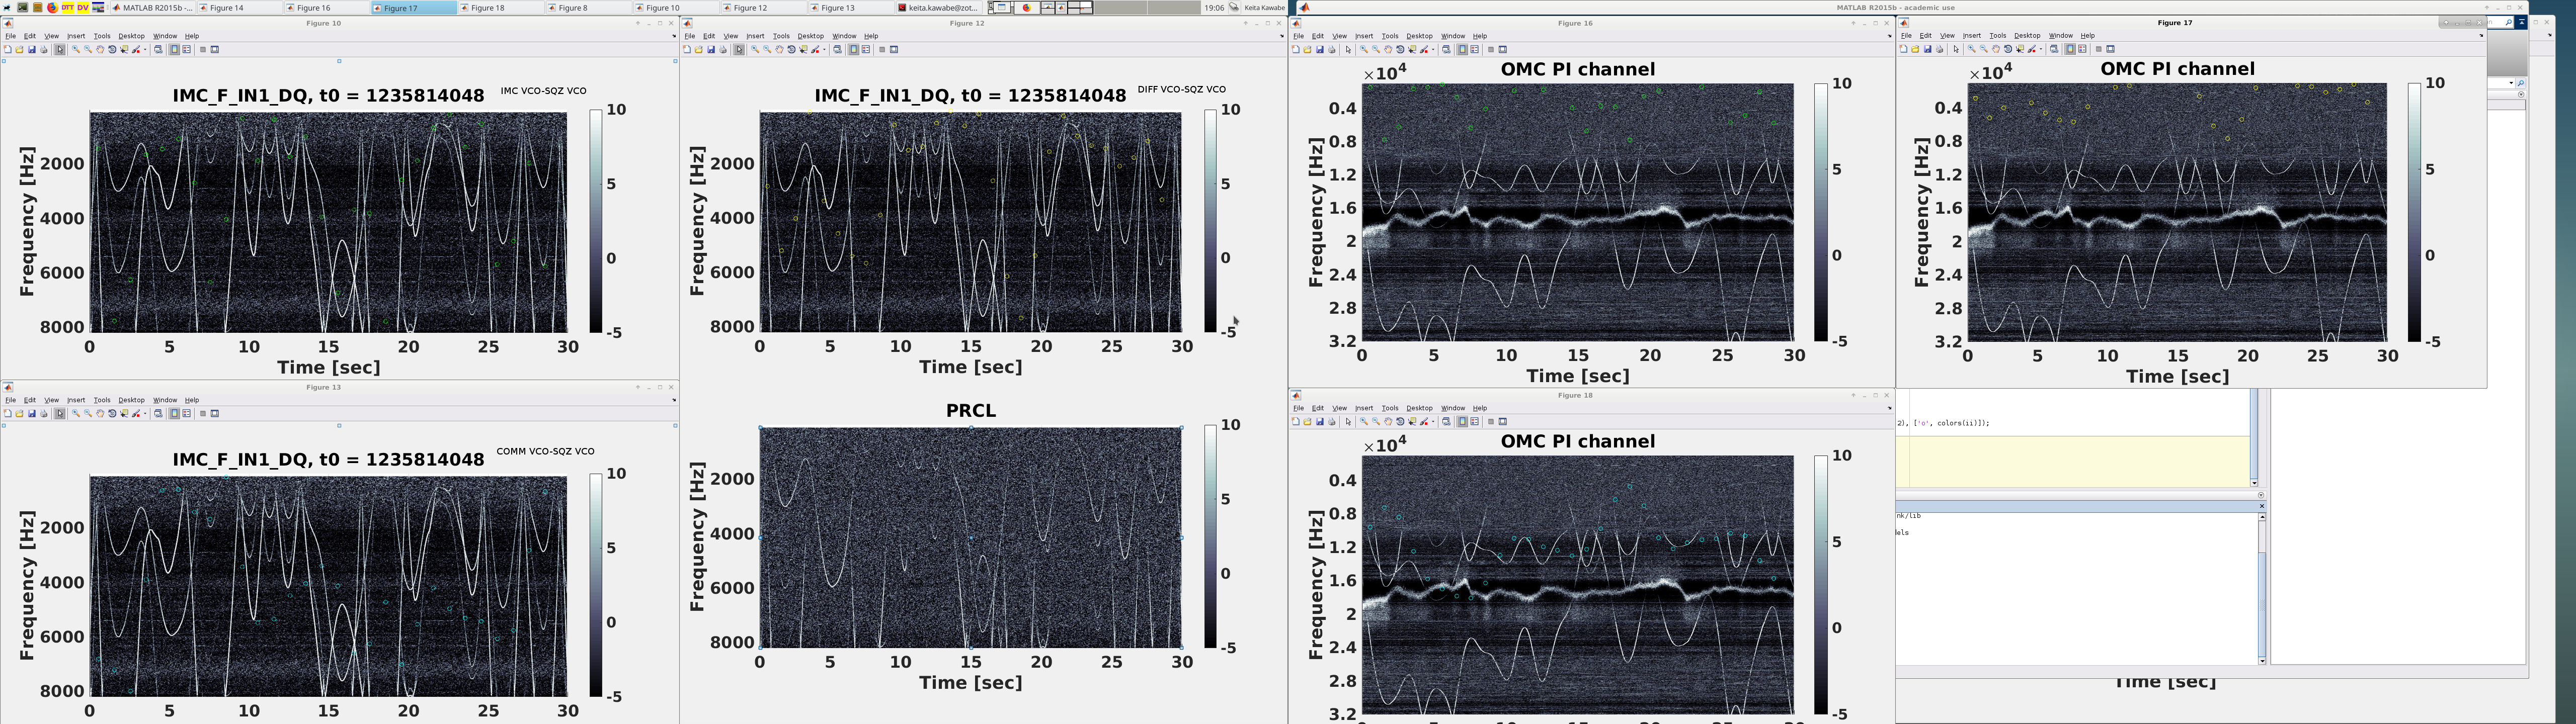
In the second attachment, IMCVCO - SQZVCO (green), diffVCO-SQZVCO (yellow) and commVCO-SQZVCO (cyan) might be correlated to weaker whistles in IMC_F but it's not as clear as IMC VCO and COMM or DIFF. These guys didn't look good on OMC PI channel.
What was done:
I took all available RF oscillator frequencies in the timing system and made differences between them. I discarded combinations that doesn't produce anything lower than 24kHz.
Anything larger than 8192Hz is aliased in the plotting on IMC_F, using 16384Hz sampling rate (but the only thing that was aliased is IMC-COMM).
Frequency counter measures the frequency once per second even though the channels are updated at 16Hz, so I just took the time stamp of the first updated value as the representative of the averaged frequency for the previous 1 second. Time axis was shifted by 0.5 sec due to this.
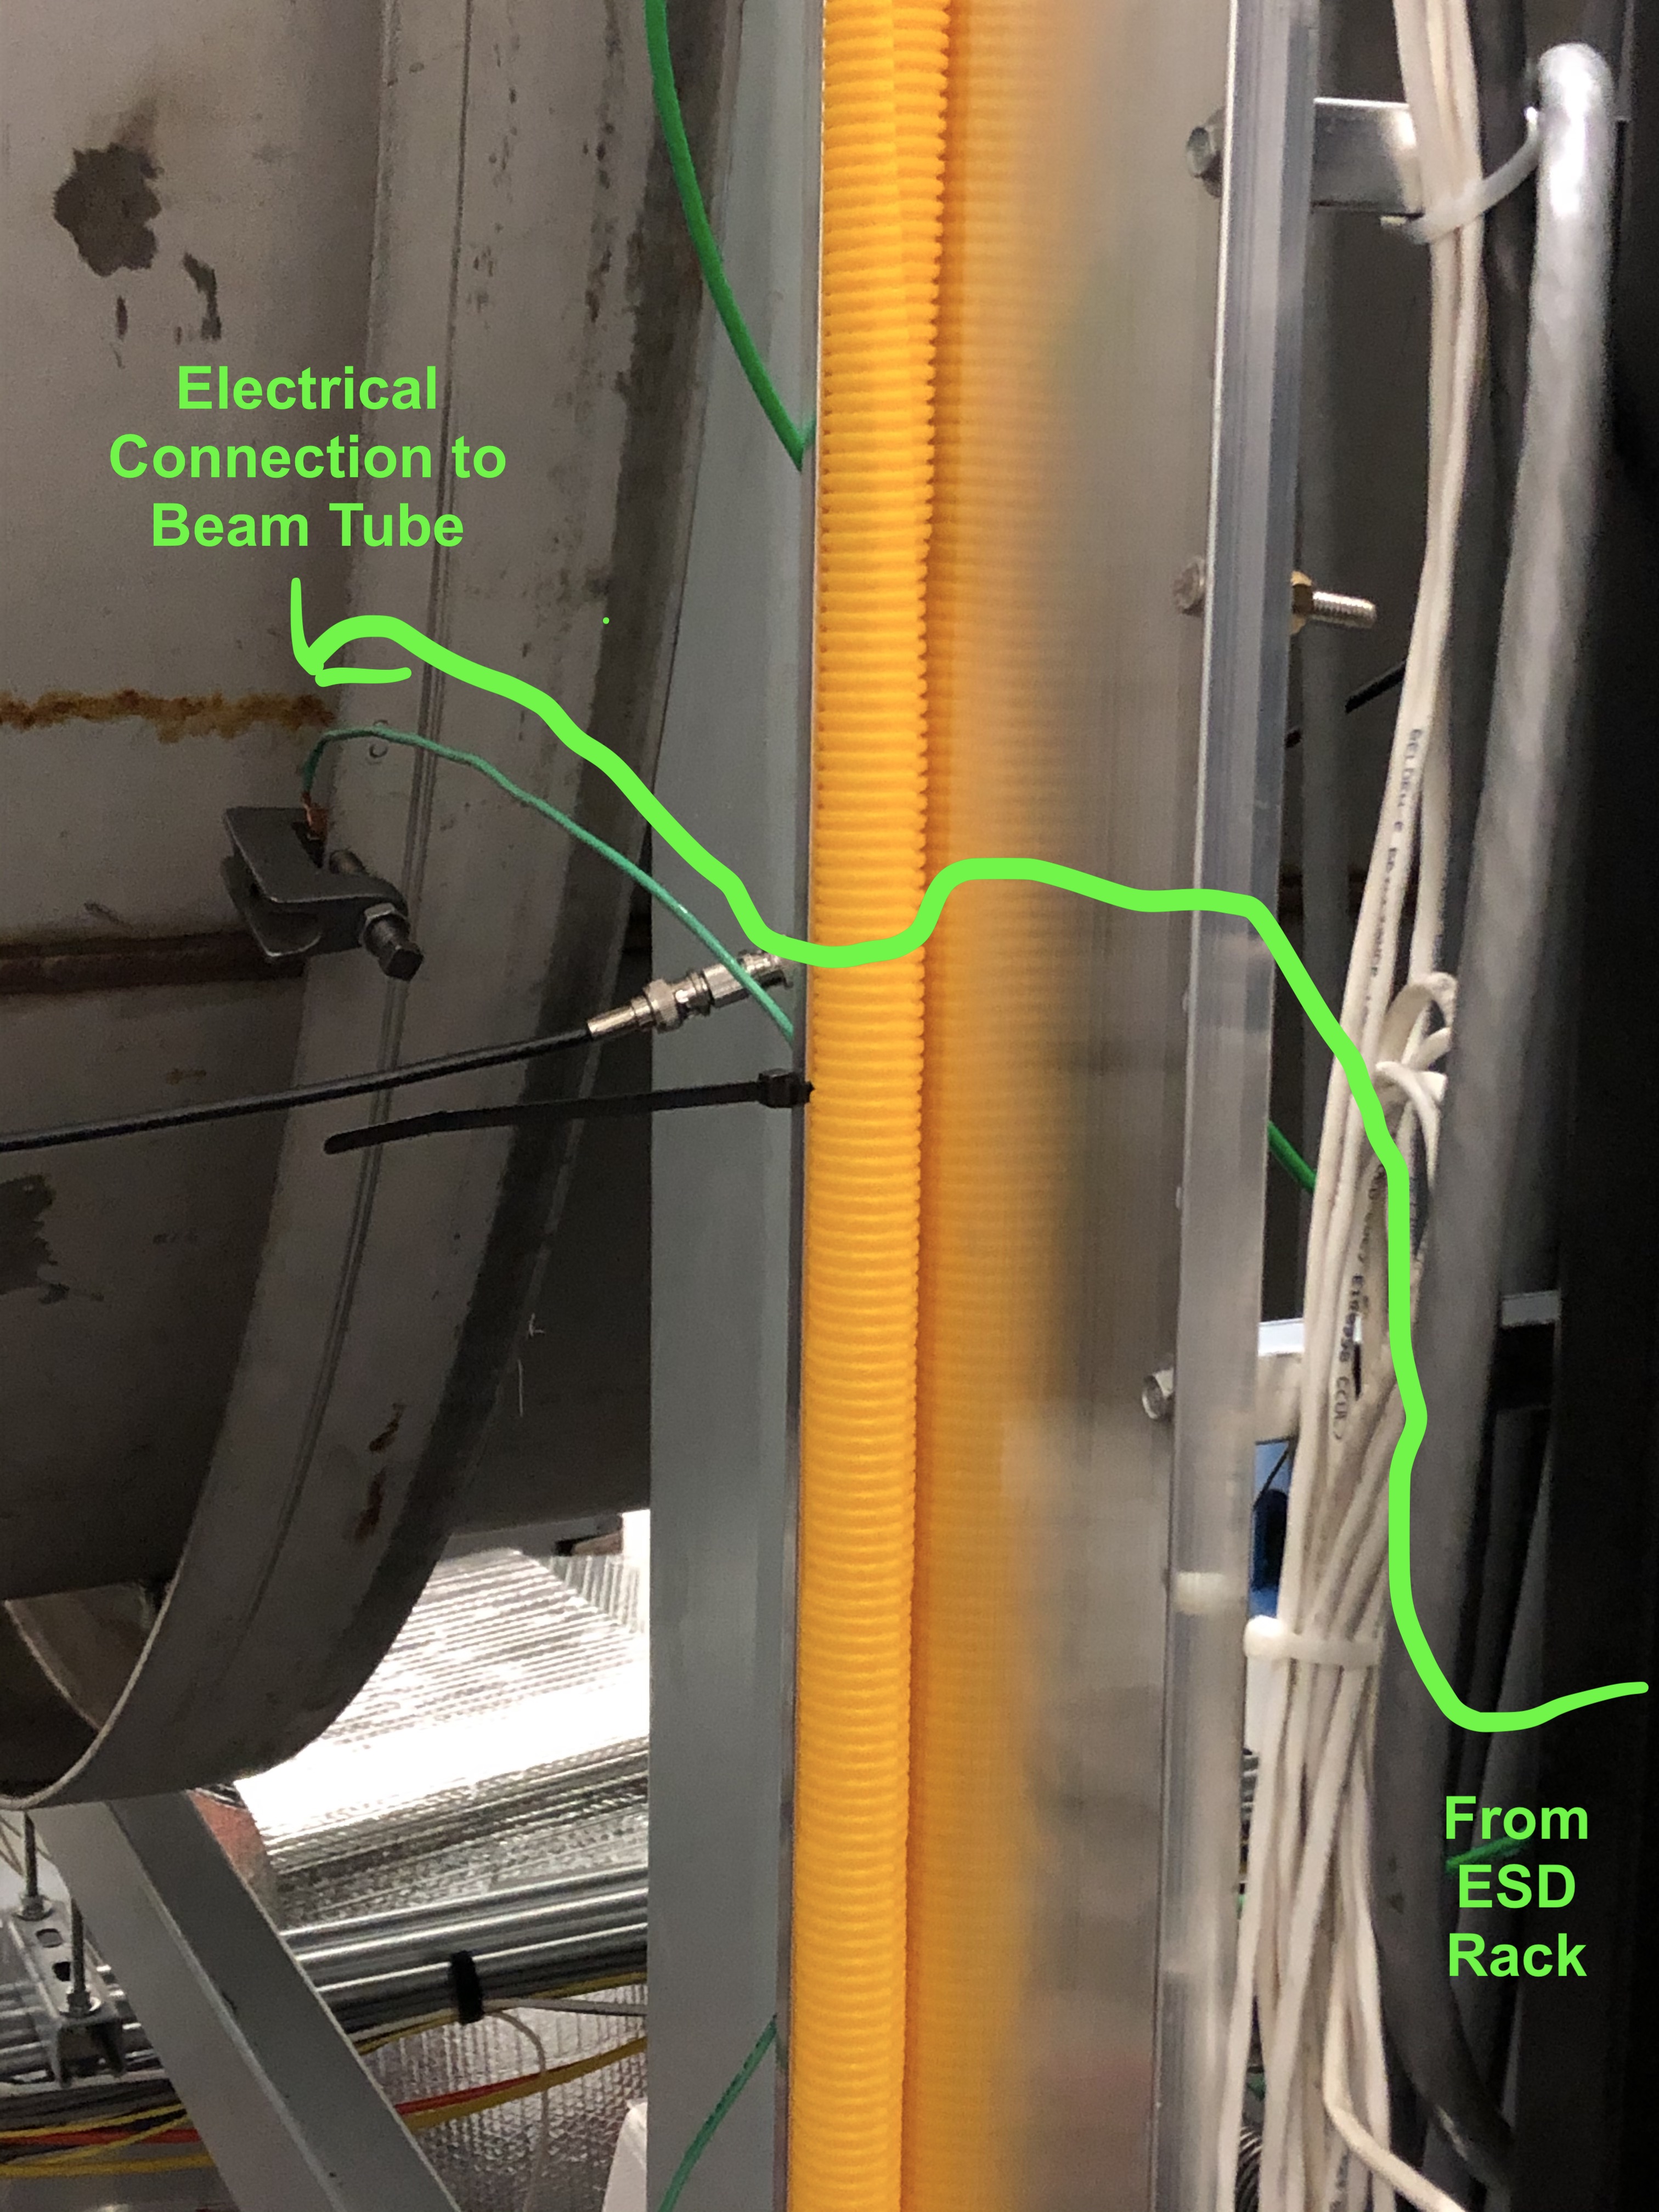
Filiberto, Ed, Richard, Rich A ETM-X ESD drive system has been floated from any connection to ground. After establishing that the whole system is floating WRT rack or building ground, we made a single connection to the beam tube as a reference point (see attached PDF diagram) Summary of Actions: I. For cable HI-SUS-ETMX-90 cut pin 8 (and unused pin is by accident) to remove a ground in the D1100809 AA Chassis Interface Board (CH I to 6) input connection. The actual cut was made in the gender changer on the front panel D 15 monitor output of the HV AMP. This cable is the HV monitor read back for the HV Amplifier Box. 2. Removed all rack ground connections in remote DC power supplies. The returns of all the DC outputs were previously connected to the rack/building ground 3. Connected the HV Amp & LV AMP to beam tube ground next to ESD rack. This is the single ground point for the ESD system 4. Installed dielectric breaks between rack and HV ESD amps 5. Verified entire ESD system is floating, then deliberately grounded to beam tube 6. Lifted cable shield connection on cable H1-SUS-ESD-5 at the LV Driver PI input connector (D-I 5) 7. Lifted cable shield connection on cable H1-SUS-ESD-6 at AA input (LV Driver monitors D-9) 8. Restored ground voltage mon (PEM) between beam tube & top of LV ESD Amp 9. Transitioned back to permanent ESD DC supplies in remote DC racks 10. Swapped HV preamp back to the one that was originally installed in EX so the 3RD IFO unit can be returned to the H2 building
Work done under WP 8112.
The ESD ground to the Beam Tube was chosen to get us as close to the OPTIC potential ground as possible. We know have equipment like the ring heater grounded in the chamber that is could create ground path concerns for us. This may not be ideal but after testing Robert has been doing seems like a good step.
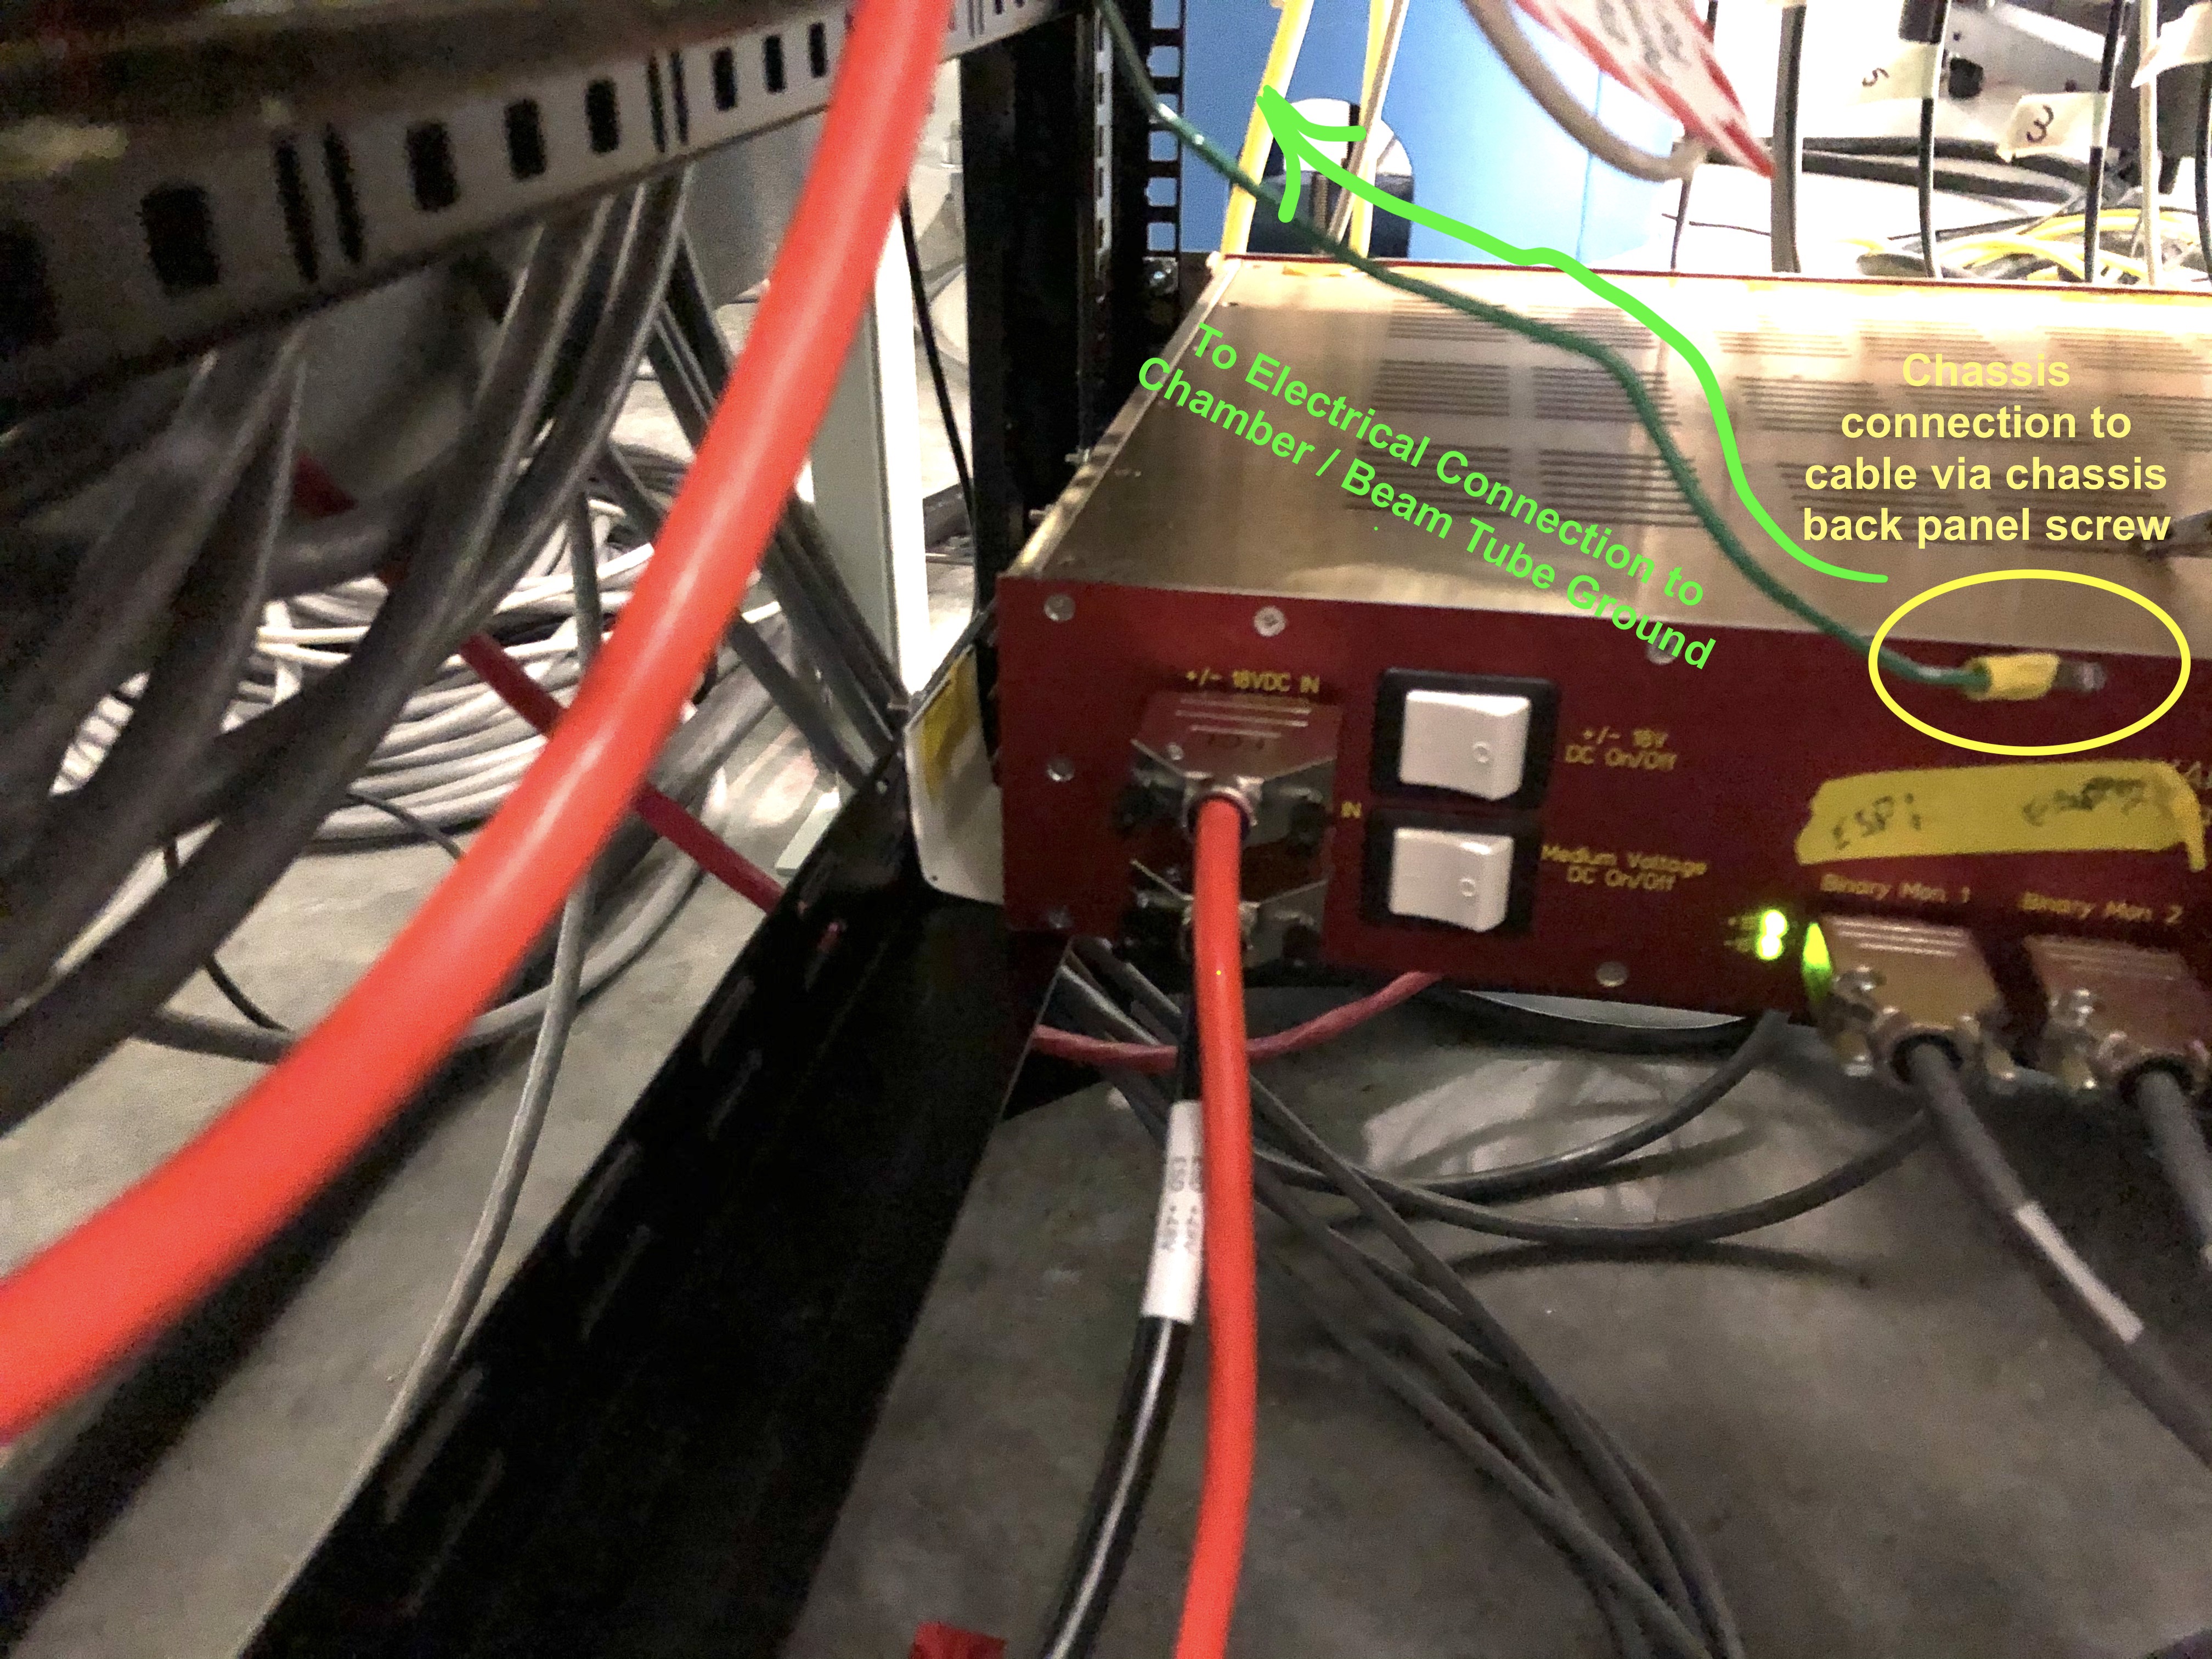
A *very* late entry, but the electrical shielding of the ESD driver chassis has come up recently again as we've found some evidence for excess electrical noise in August 2022 a la LHO aLOGs 64526 or 64478. As such I dug back through my pictures from Dec 2019, when I first discovered that this work had happened and/or that the electrical grounding of the ESD low-voltage driver chassis had been... "reconfigured" ... in this way. In 2019-12-10_H1SUSETMX_L3_ESD_Driver_Shielding_AtChassis, I show the connection to the low-voltage chassis. Note -- this cable from the low-voltage chassis goes up an electrically connects to the chassis of the UK high-voltage chassis as well before heading to electrically connect to the beam tube. This is not explicitly drawn in Rich's diagram above. While I haven't seen it with my own eyes, I've confirmed this with Fil, verbally, today (2022-08-23). In 2019-12-10_H1SUSETMX_L3_ESD_Driver_Shielding_FromRACtoChamber.jpg I show the connection to the chamber.
WP8108 DAQ 10GE switch reconfigure
Jonathan, Dave:
Please see alog below for details. DAQ computers were restarted twice during this upgrade. The DAQ was not reconfigured.
WP8038 h1guardian1 machine relocation
Jonathan, T.J., Dave:
the new V4 h1guardian1 machine was moved from its temporary location to its correct location. The V2 machine (old guardian) which was in this slot will get racked as h1dmt4 once we get a compatible rail kit installed.
TJ monitored the restart of the guardian nodes, there were no issues.
WP8075 DMT test machine upgrade
Jonathan, Greg, Dave:
h1dmt2 was moved from its current location to below the h1dmt0,1 stack (a slot vacated by the h1guardian1 move). This in turn frees the space for the new h1dmt4 machine.
cdsfs1 reboot
Carlos, Jonathan:
Carlos discovered issues with cdsfs1. It was updated and rebooted.
Beckhoff restarts and SDF restart.
Daniel, Dave:
Daniel restarted some Beckhoff systems and found that the SDF for C1PLC1 became unresponsive. I restarted h1sysecatc1plc1sdf to fix this.
CNS-II GPS receivers were swapped between end stations, now Timing system is green. The surprising thing was within a minute of putting, for example, the 'EX' unit at EX, its timing status went green. I was expecting several hours of satellite locking would be needed for this to happen.
The new install table is
| EX | S/N 404358 |
| EY | S/N 404357 |
Details of today's restarts
2019_03_05 10:27 h1fw2
2019_03_05 10:36 h1nds1
2019_03_05 10:38 h1fw0
2019_03_05 10:44 h1tw3
2019_03_05 10:46 h1fw1
2019_03_05 10:46 h1tw0
2019_03_05 10:48 h1tw0
2019_03_05 10:50 h1nds0
2019_03_05 10:52 h1broadcast0
2019_03_05 10:52 h1tw0
2019_03_05 10:56 h1fw0
2019_03_05 10:56 h1fw1
2019_03_05 10:56 h1fw2
2019_03_05 10:56 h1nds0
2019_03_05 10:56 h1nds1
2019_03_05 10:56 h1tw0
2019_03_05 10:56 h1tw1
2019_03_05 10:56 h1tw3
2019_03_05 10:59 h1broadcast0
2019_03_05 11:07 h1sysecatc1plc1sdf
NOTE: h1dc0 is missing from this list.
P. King, R. Savage, J. Oberling, D. Sigg
FSS RefCav Picomotor Mirror Mounts
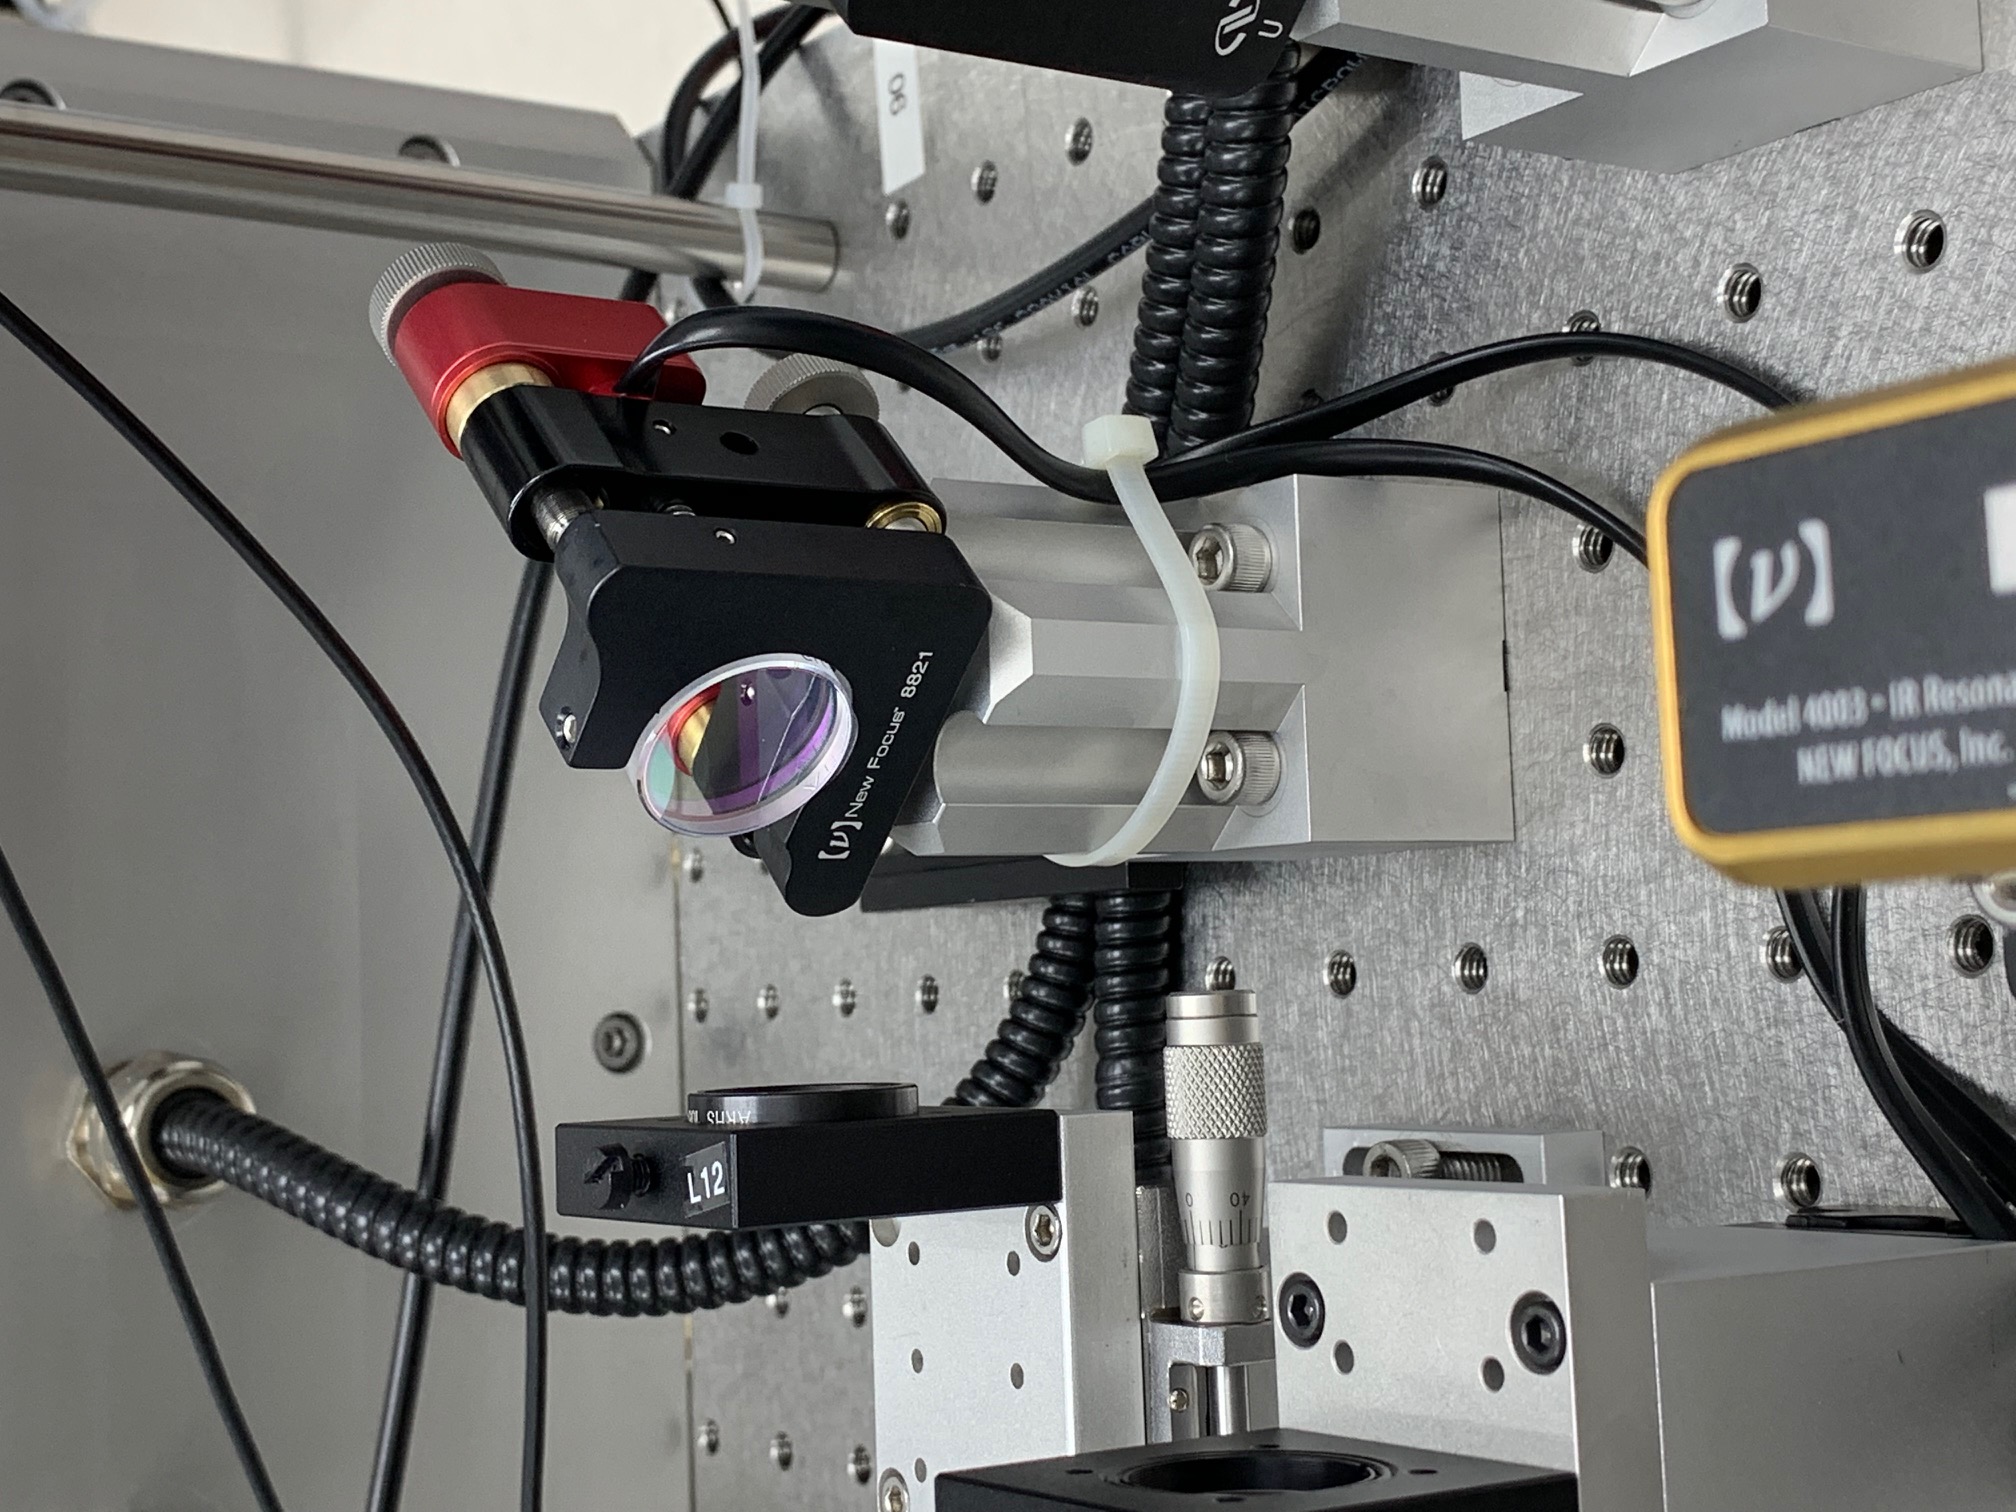
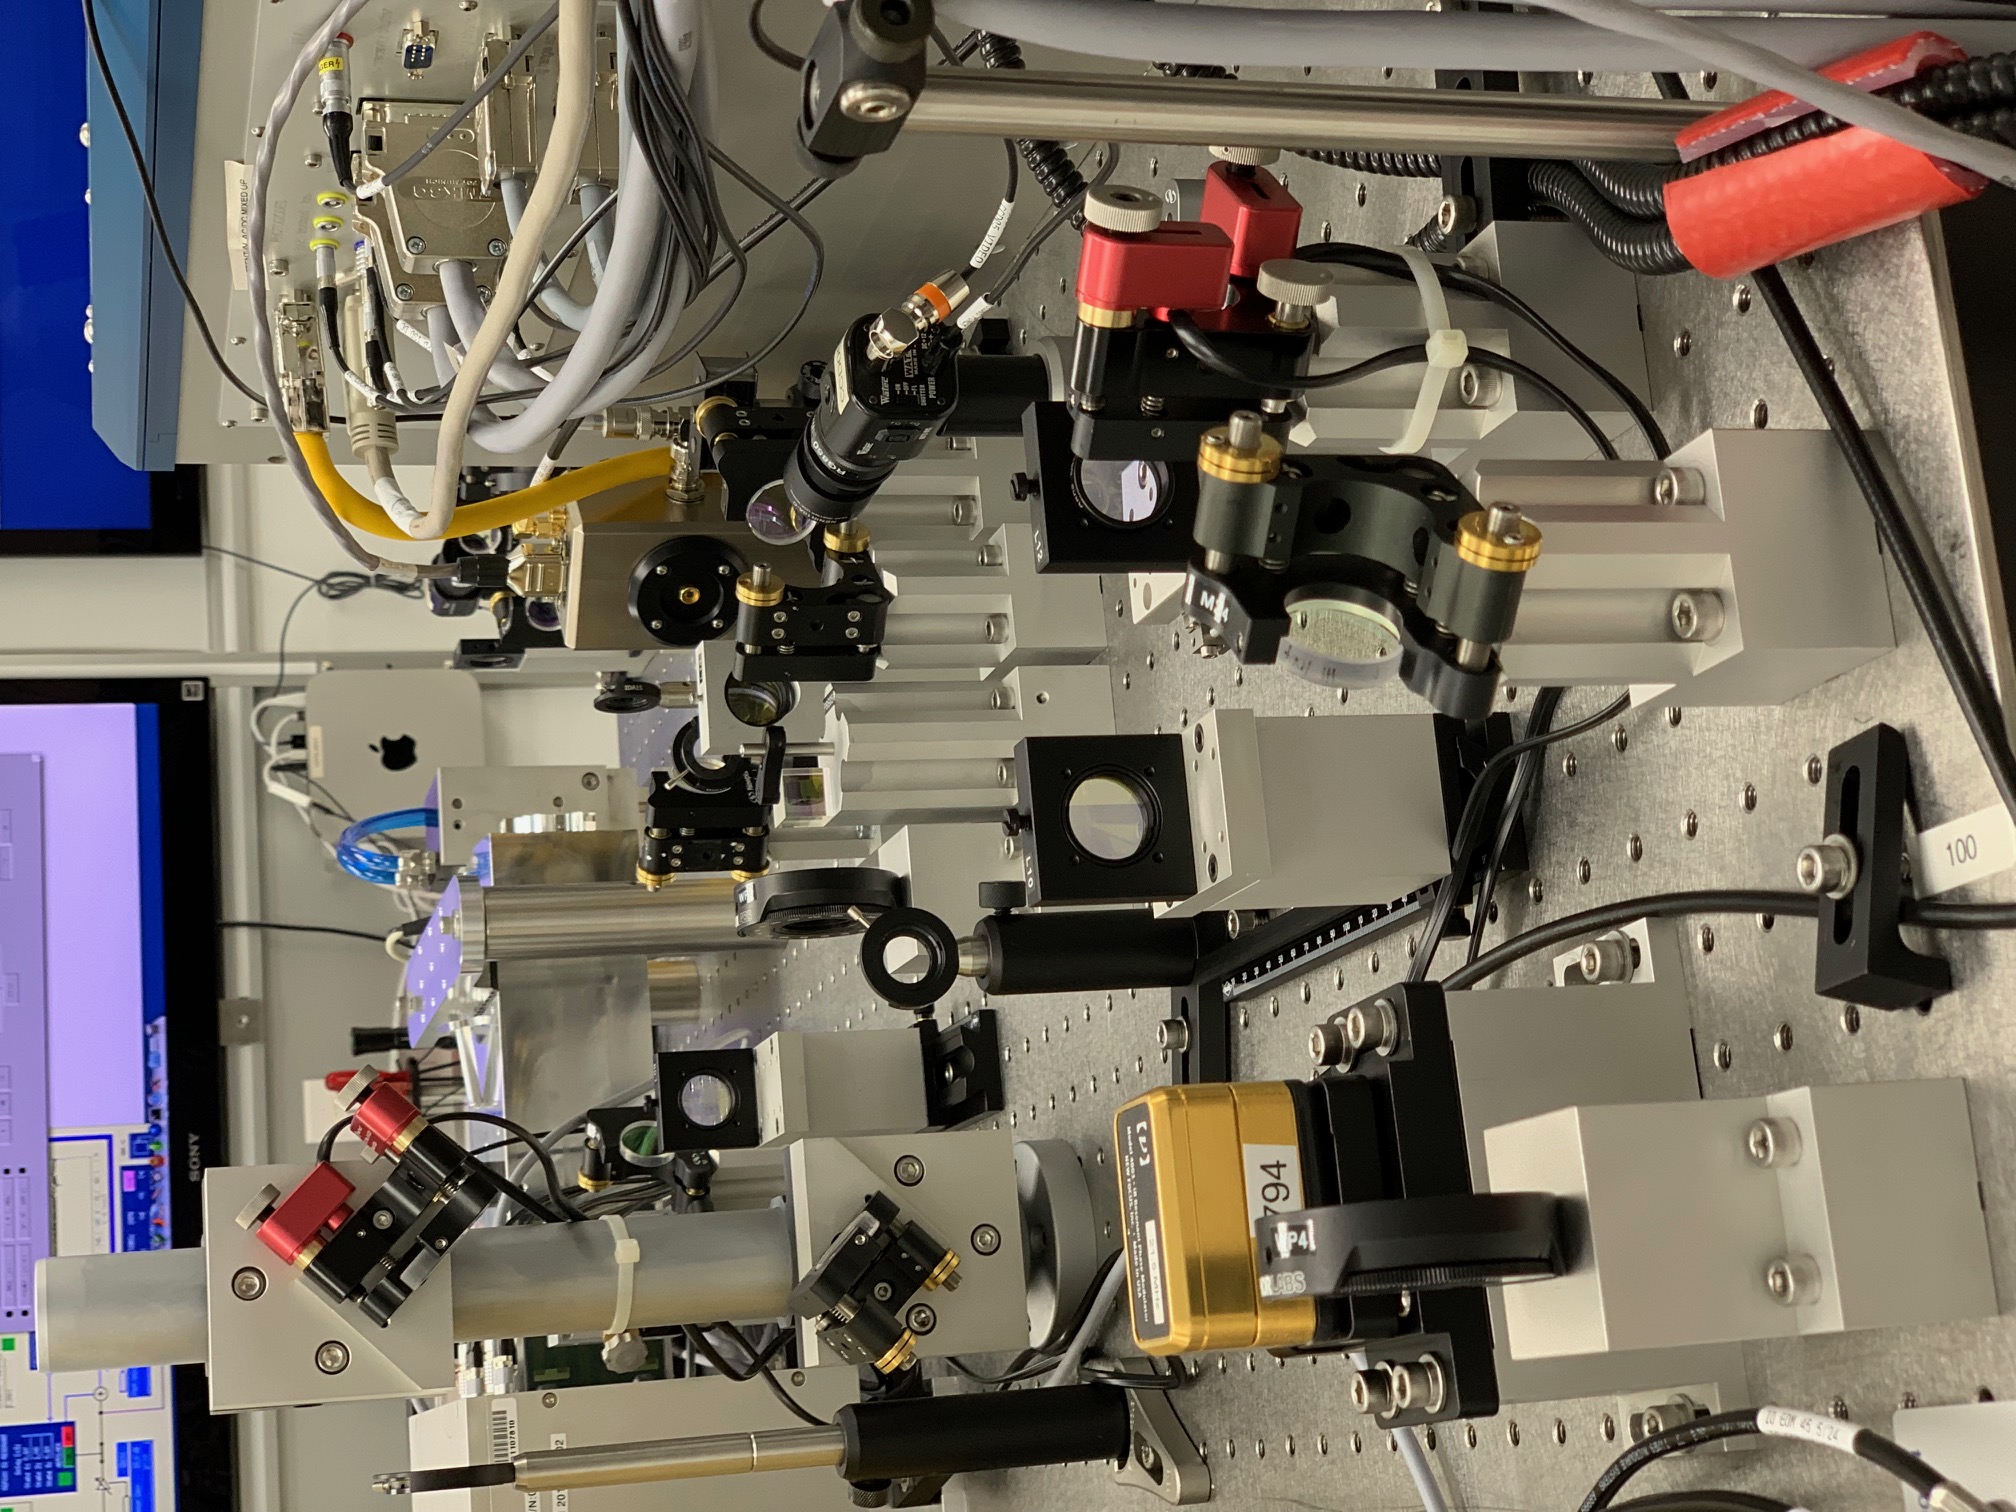
At the request of the LHO commissioning team, today we installed 2 picomotor equipped mounts in the FSS RefCav path. We replaced the mount for mirror M27 (immediately after the FSS EOM, 1st attachment) and for the upper periscope mirror (UPM, 2nd attachment). We used M27 instead of the lower periscope mirror (LPM) because the LPM is too close to the RefCav; with this setup, M27 primarily changes beam position while the UPM primarily changes beam angle. The 3rd attachment shows both new picomotor mounts.
The same driver (PICO D) that runs the picomotors for the PMC input mirrors (mirrors M06 and M07) had 2 empty channels, so we used these for the new RefCav picomotors. As of now, channels 1 & 2 are for the PMC picomotor mirrors and channels 3 & 4 are for the RefCav; Daniel changed the displayed channel names on the picomotor control MEDM screen to reflect this. To end, we confirmed that all picomotors functioned as expected, which they did. When we left the enclosure the FSS RefCav TPD read ~4.1V, and the PMC was transmitting ~54.5W. During the next maintenance window where we do not have an enclosure incursion, I will tweak the alignment into both the PMC and RefCav.
70W Amplifier Power Monitor PD
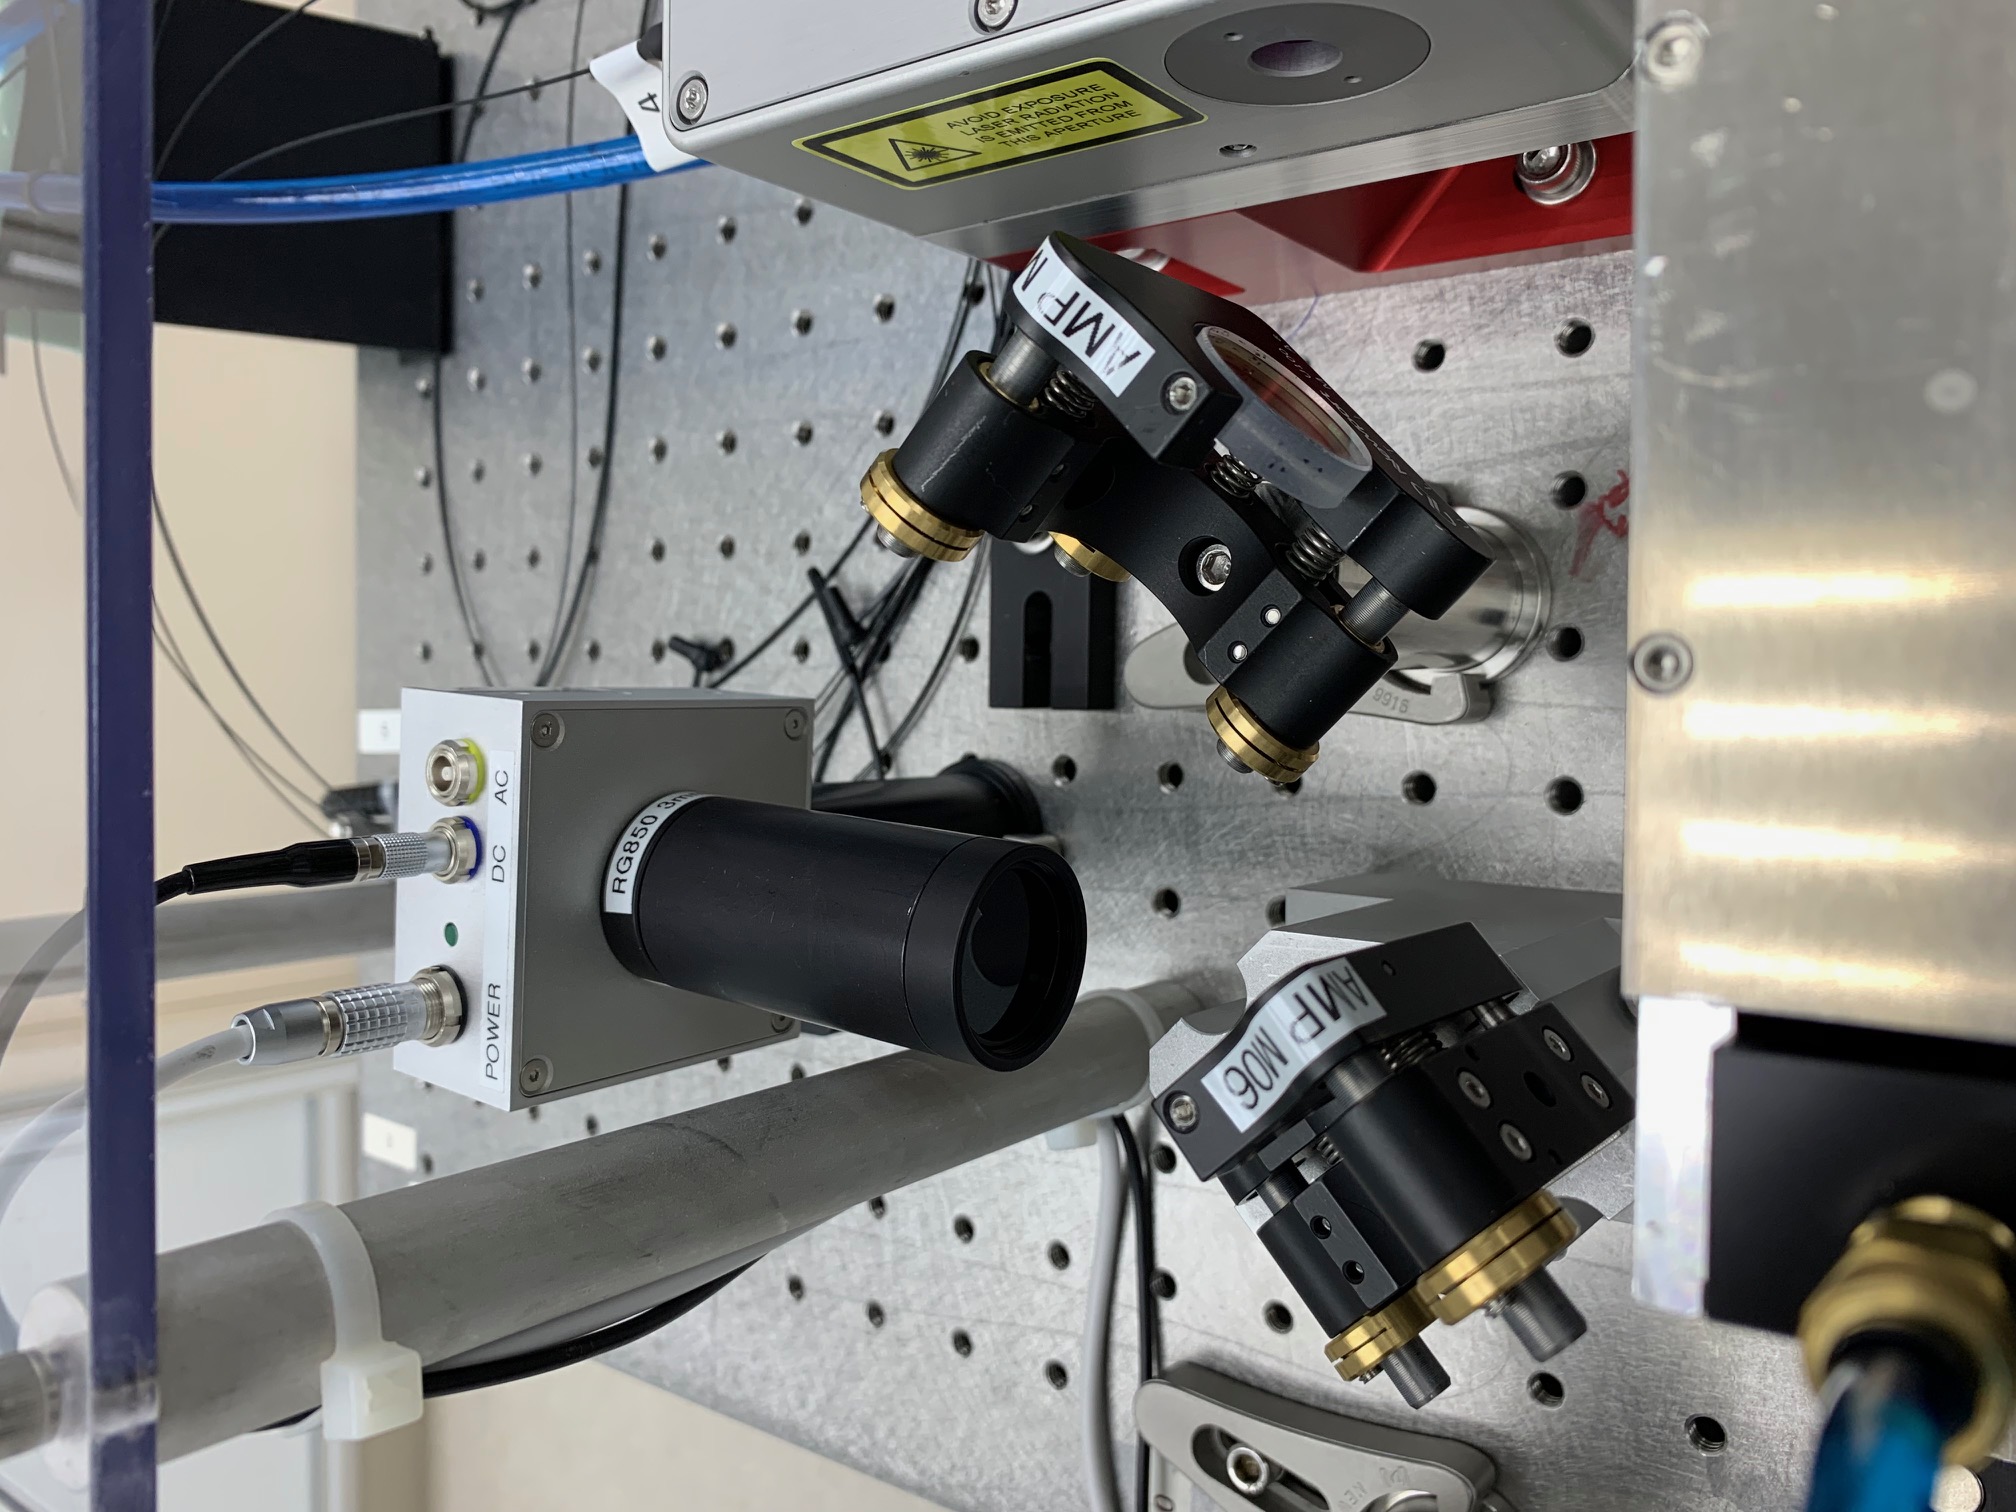
We had noticed some odd behavior with the 70W amp power monitor PD (the PD that the 70W amp power watchdog triggers off of). When blocked directly at the PD aperture, the PSL Beckhoff software reports ~3W on this PD; when blocked farther away the reading is ~52W. We suspected the cause to be room lights, so we added a tube with a RG850 (808nm pump light filter) screwed onto the end (4th attachment); this second RG850 was added to block more of the room light, as one wasn't quite enough. This reduced the blocked reading to ~3W regardless of how far away the blockage occurred, with no degradation in the amount of power read by the PD when unblocked.
The DMT computers have been patched and rebooted, bringing in gds2.18.16-1.el7 and " new features needed to connect idq to the low latency frames," as per WP 8106. John Zweizig will be reconfiguring the new features.
I have reconfigured the dmt dq monitor to copy the iDQ channels into the h(t) frames. The monitor includes a 10s deadline on the arrival time, in which case the idq channels will be written as zeros, to prevent delays in the h(t) frame delivery. The current idq channel list includes:
H1:IDQ-OK_OVL_16_4096 0
H1:IDQ-RANK_OVL_16_4096 0
H1:IDQ-FAP_OVL_16_4096 0
H1:IDQ-EFF_OVL_16_4096 0
H1:IDQ-LOGLIKE_OVL_16_4096 0
H1:IDQ-PGLITCH_OVL_16_4096 0
WP8108
Jonathan, Dave:
The DAQ Fujitsu 10gigabit switch was reconfigured today in preparation for a dual-data-concentrator upgrade.
In the old configuration, all ports belonged to VLAN-102, and there were some gaps in the port assignments.
In the new configuration, a new VLAN-110 was created and assigned to the first 6 ports. All old ports were shuffled to the right to clear these first 6 ports, and port gaps were filled. This required a data interruption for all DAQ machines except h1tw1.
We did the upgrade in two phases.
PHASE-I, assign and activate ports 7-16 to VLAN-102, move DAQ machines one-at-a-time to their new port, waiting for each one to come back before proceeding. h1dc0 was last to be moved, since its return caused all the other systems to restart again. From a user's point of view, this looked like two DAQ restarts (with no configuration change). Where necessary, ports 17-24 were assigned to the default VLAN-100 and disabled.
PHASE-II, disconnect the FE-DC0 link from direct Netgear-to-h1dc0 to Netgear-VLAN110-h1dc0. This was done in two steps to ensure h1dc0 continued to run throughout. First the fiber from the last Netgear port (50) was disconnected at h1dc0 and rerouted to port-1 of the Fujitsu. A new 2M fiber from port-3 Fujitsu (VLAN-110) took its place at h1dc0. While this was being routed about half the front end's data was bad. This was most of the corner station. Last step was to disconnect Netgear-port49 to h1dc0 and replace this with the second 2M fiber from Fujitsu-port-4.
Data went good again, no restarts of mx_stream or h1dc0 were needed.
Updated the corner TwinCAT code to the most recent SVN revision. This adds the names for the new picomotors installed in the PSL reference cavity path. Nothing else should have changed.
Tried getting the 2G TTFSS working. In summary, it failed.
More details to follow.
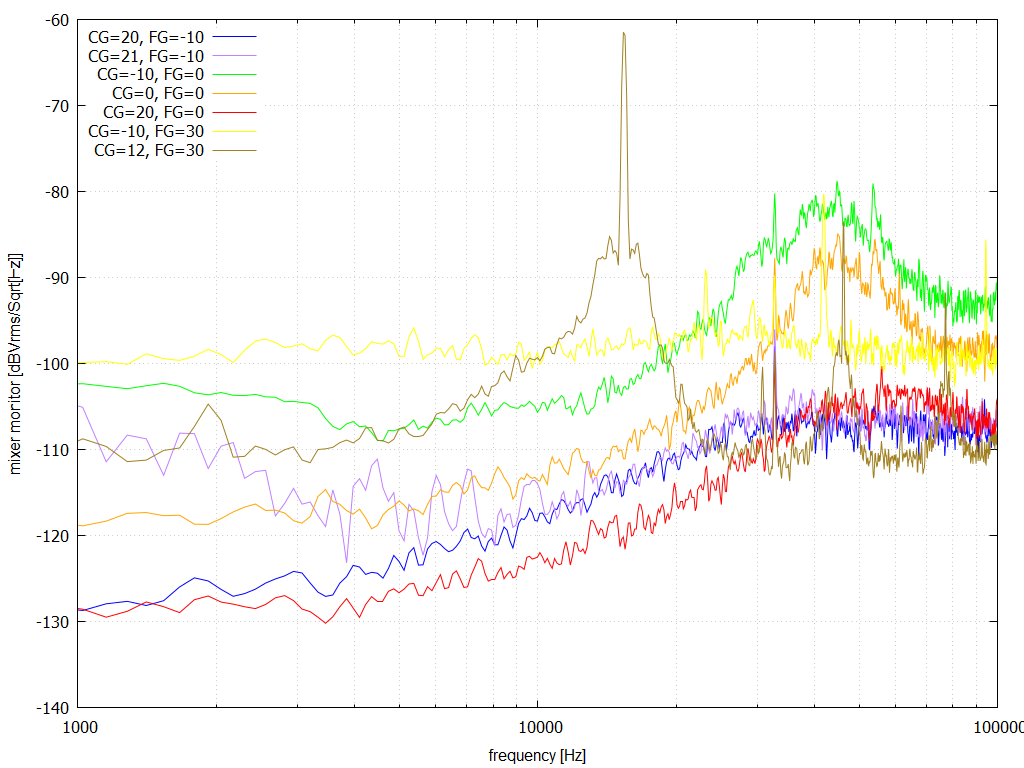
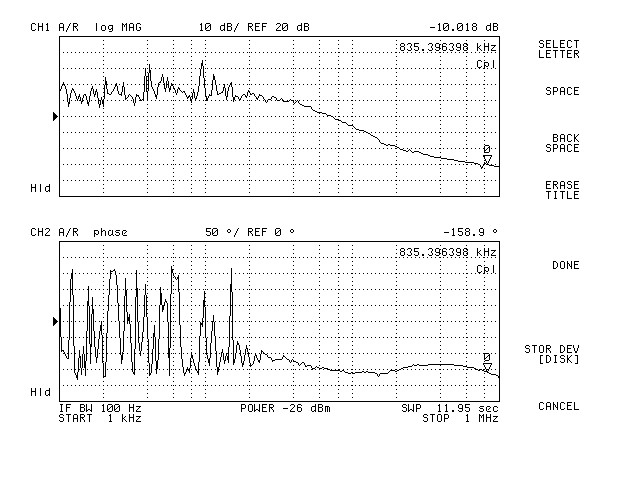
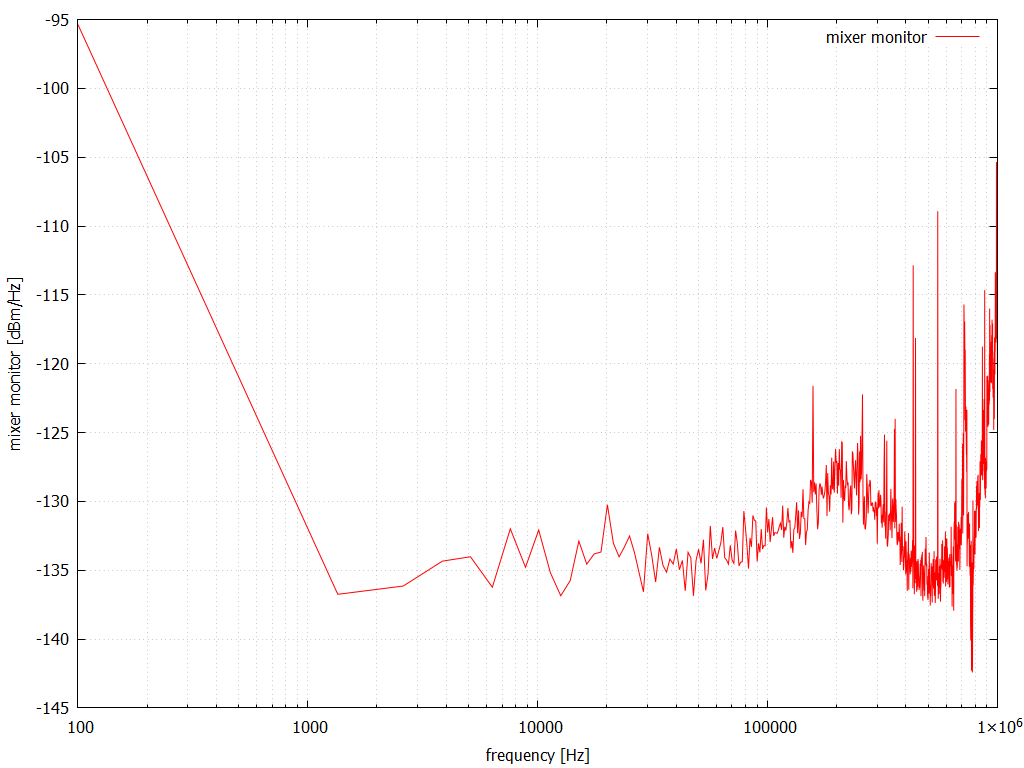
Following on from a previous attempt (see alog #4173) where the PZT kept oscillating even when both the common and fast gains were set to zero. It was found increasing the fast gain to 0 dB and then increasing the common gain stopped the PZT from oscillating. OUT2.png shows the error siginal for a few gain settings. The highest I could push the gains was a common gain of 26 dB and a fast gain of 3 dB (see C26F3.jpg) at which the UGF was 835 kHz - past where you'd want to be from a phase margin standpoint. The loop at this setting seemed sensitive and prone to oscillating, most likely because of something beyond 1 MHz (see IN2.jpg for the mixer spectrum).
Nutsinee Daniel
With the discovery that the noise eater can add noise to the beat note between the PSL and SQZ lasers (LLO alog 43837), we added a 100MHz high pass filter to the spare TTFSS (S1700330).
On the PFD D1002471 we changed:
This unit was installed and the old unit removed (S1700331). We also removed the IQ demod version of the TTFSS that was still on top ISCT6.
Noticed that the fan of the laser power supply starting to sound like a coffee grinder...
Daniel, Nutsinee
Board S1700330 is back in the shop. We suspect broken boost3. Currently using S1700331.
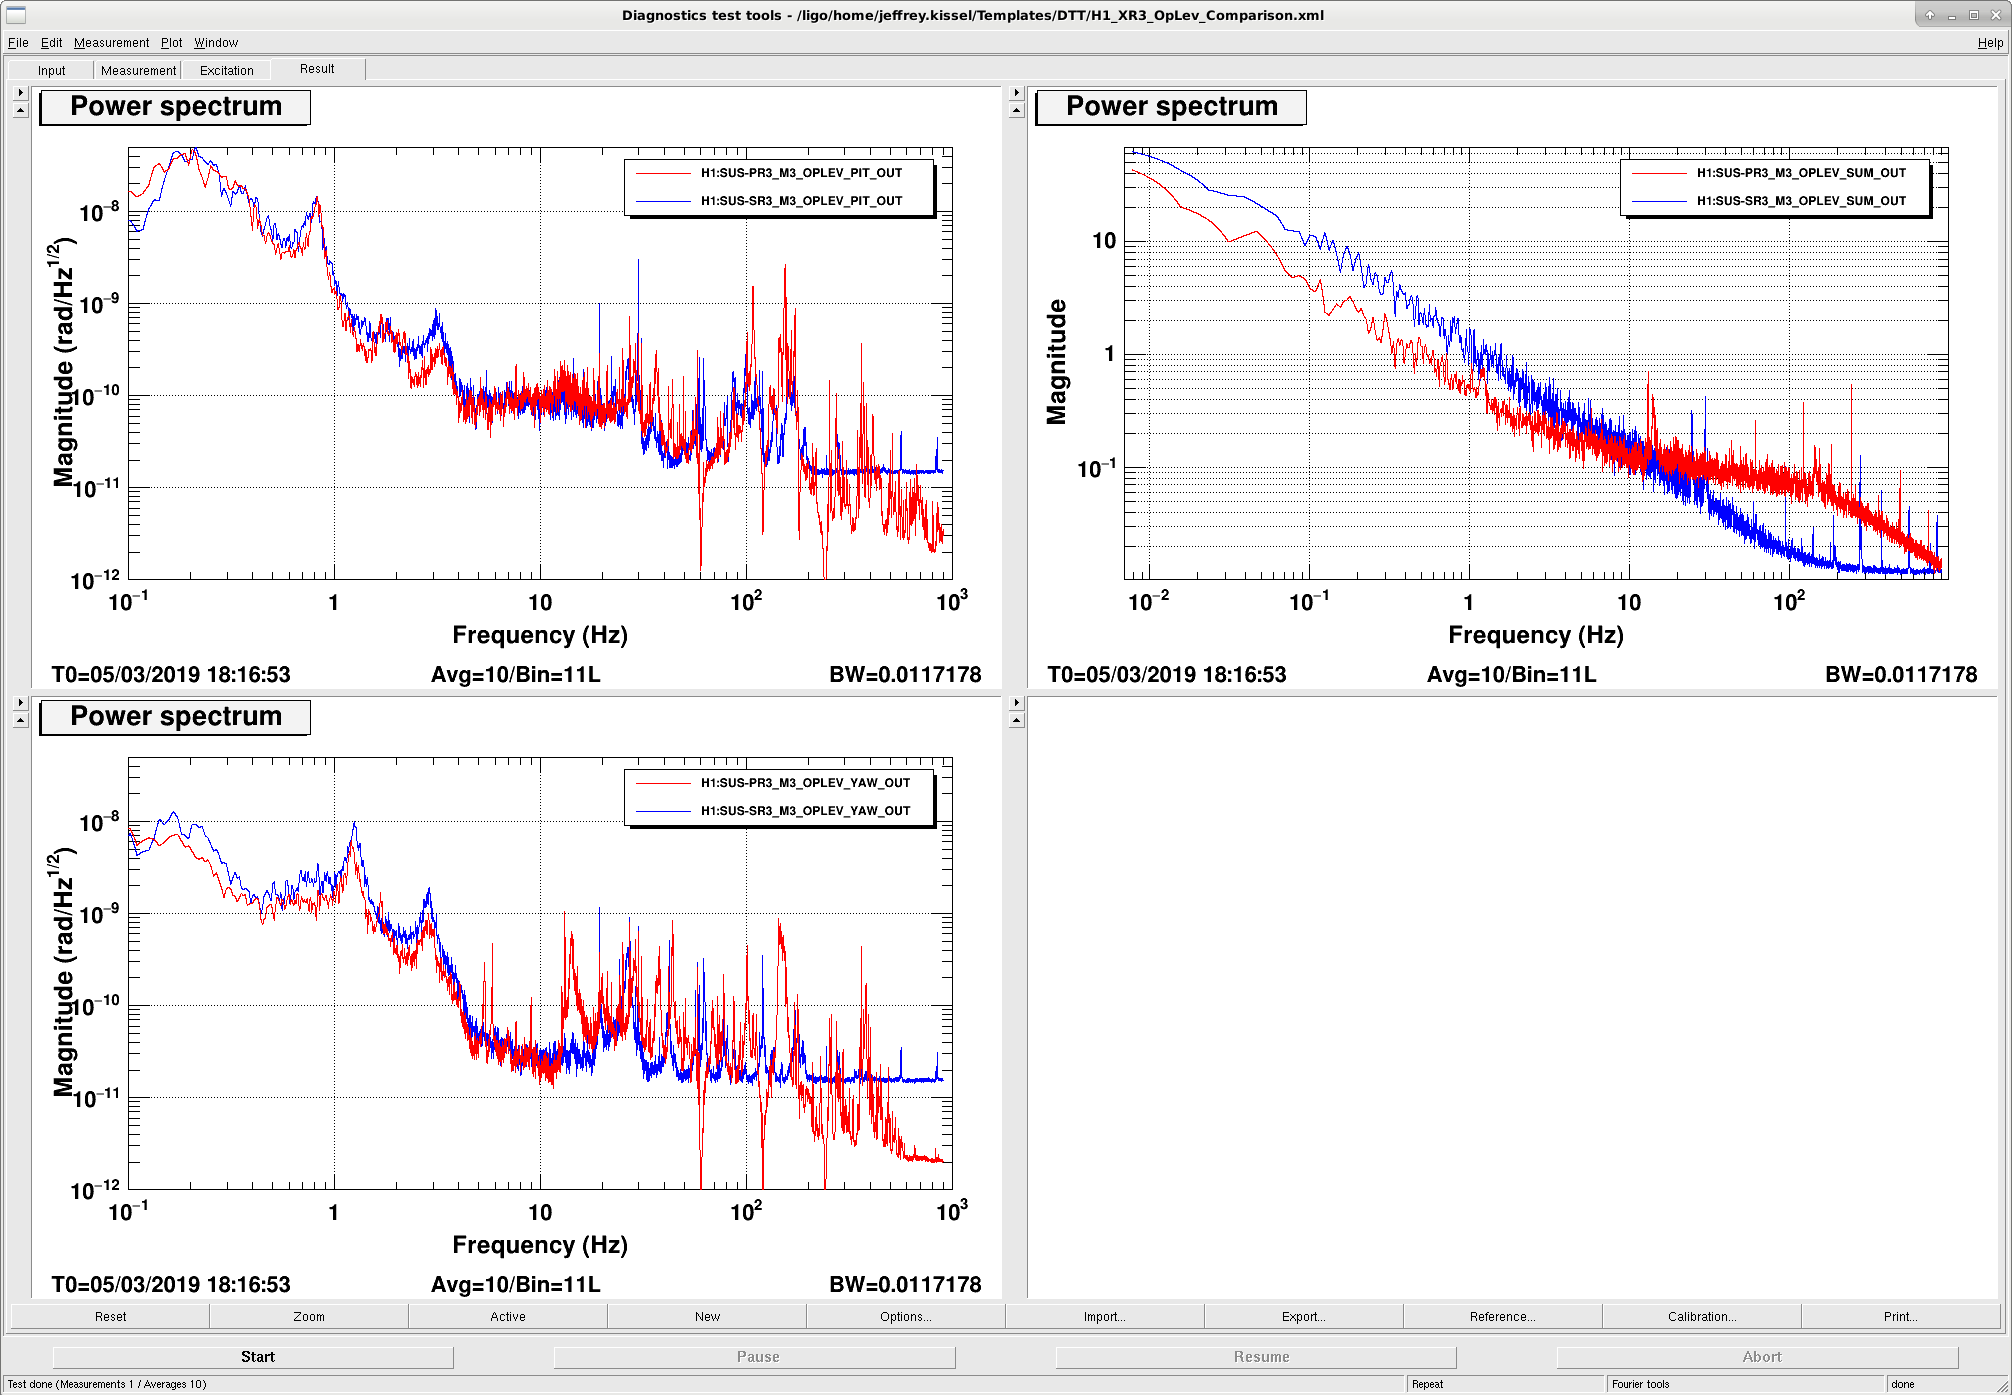
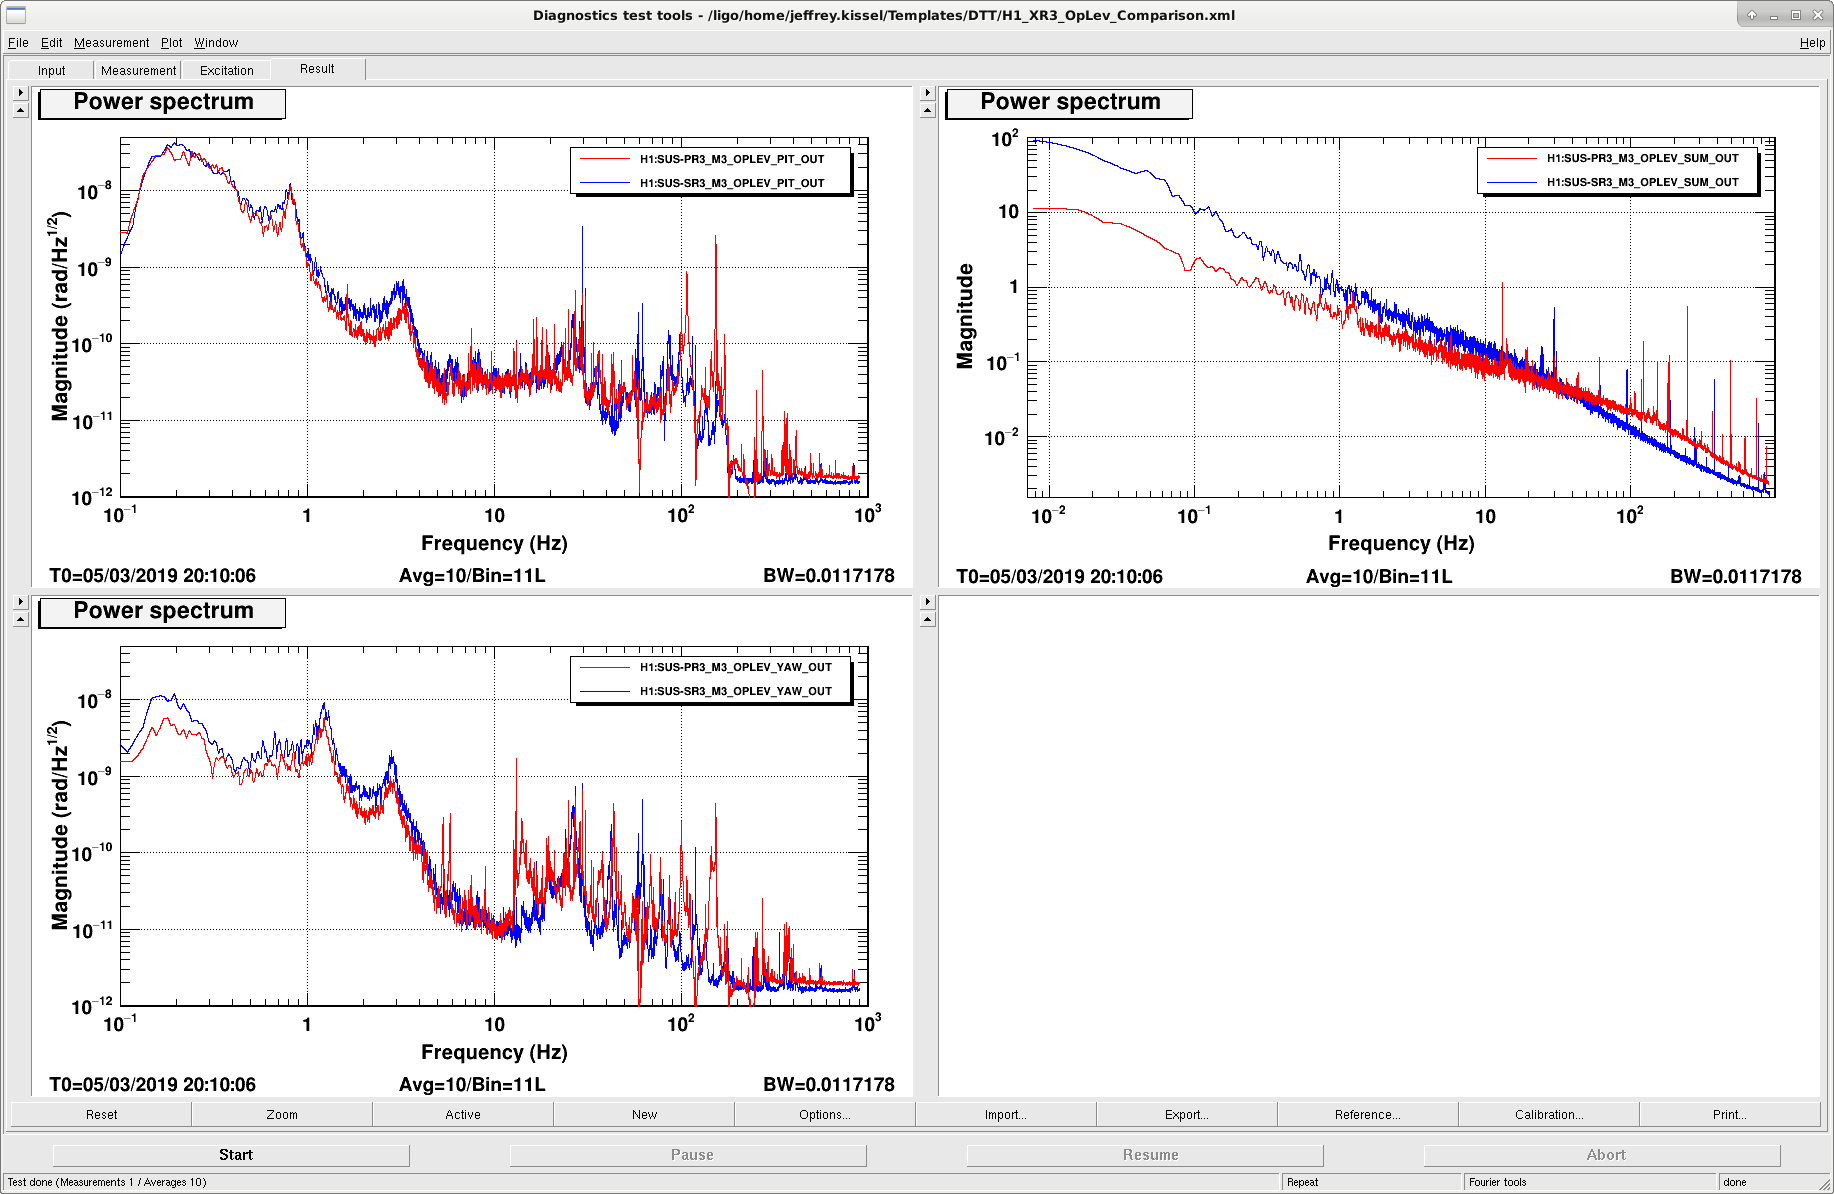
J. Kissel, J. Oberling Work Permit 8109 FRS Ticket 12394 Jason installed new components for SR3 optical lever this morning, which had died mid-February 2019 (LHO:47066). To check it's functionality, I've - Checked that the SUM is nice and high (good!) - Checked its centering (good!), and - Compared its amplitude spectral density in Pitch, Yaw, and SUM against PR3's optical lever -- a similar optical lever watching a similar suspension on a similar isolation system. (not yet good) The noise above ~50 Hz is dominated by some white noise at the equivalent of ~1.5e-11 rad/rtHz, which I suspect is ADC noise. The straightforward solution is to just apply some analog whitening as has been done with all other levers. PR3's lever doesn't hit white noise until ~500 Hz, at the equivalent of 2e-12 in YAW; PIT is not limited by ADC noise, so we should be able to achieve this level of performance. Once the whitening has been tuned, this test will need to be repeated, so I've stored the template for this measurement in /ligo/home/jeffrey.kissel/Templates/DTT/ H1_XR3_OpLev_Comparison.xml for that future use.
As Jeff says above, I swapped the dead SR3 OpLev laser with a spare; the laser output power was tweaked until SUM count of ~27k was acheived. The SN of the new laser is 104-1.
I turned on a single set of whitening filters (and their corresponding dewhitening filters; this change was accepted in SDF) and re-ran Jeff's measurement, see attachment. As can be seen, SR3 OpLev performance now closely matches that of PR3, with neither one hitting noise until ~200Hz. As these are only useful up to 100Hz, this is sufficient for now; should more whitening be necessary at a later date, both PR3 and SR3 oplevs have 2 additional sets of whitening filters that can be enabled.
This closes WP 8109.
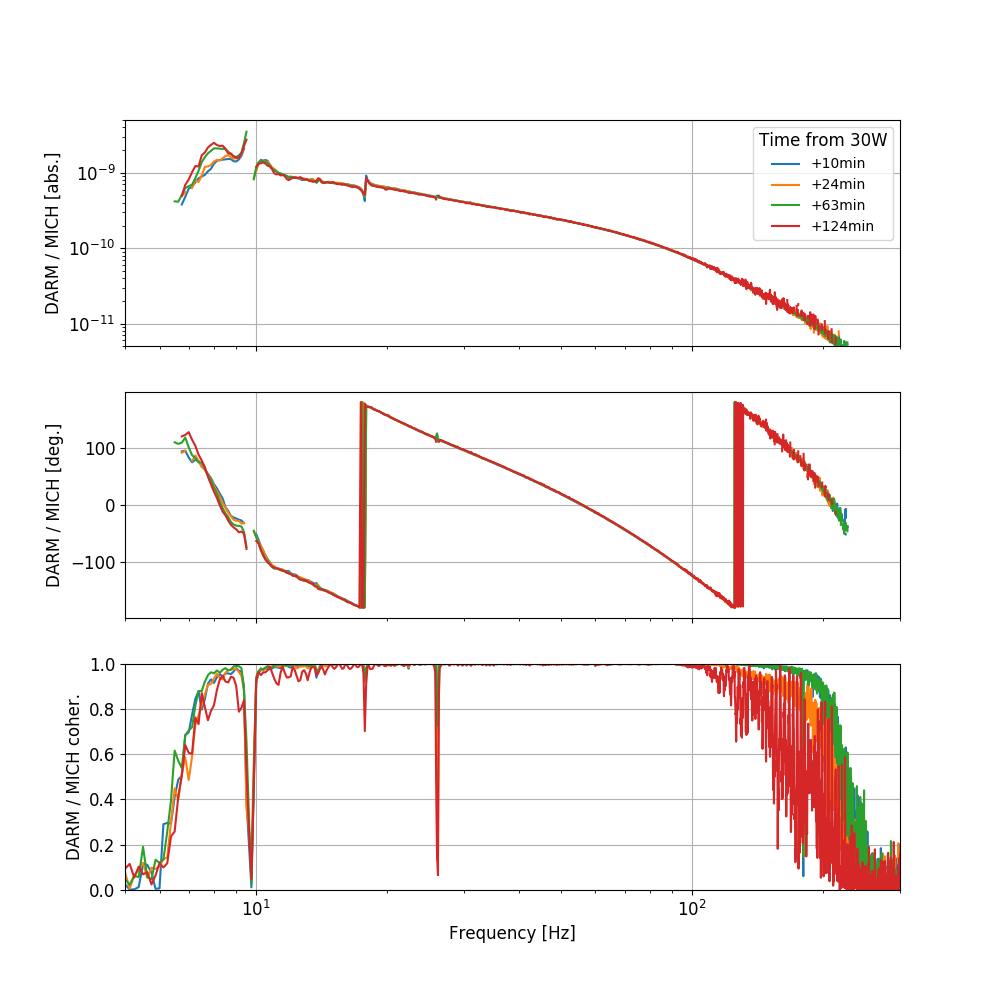
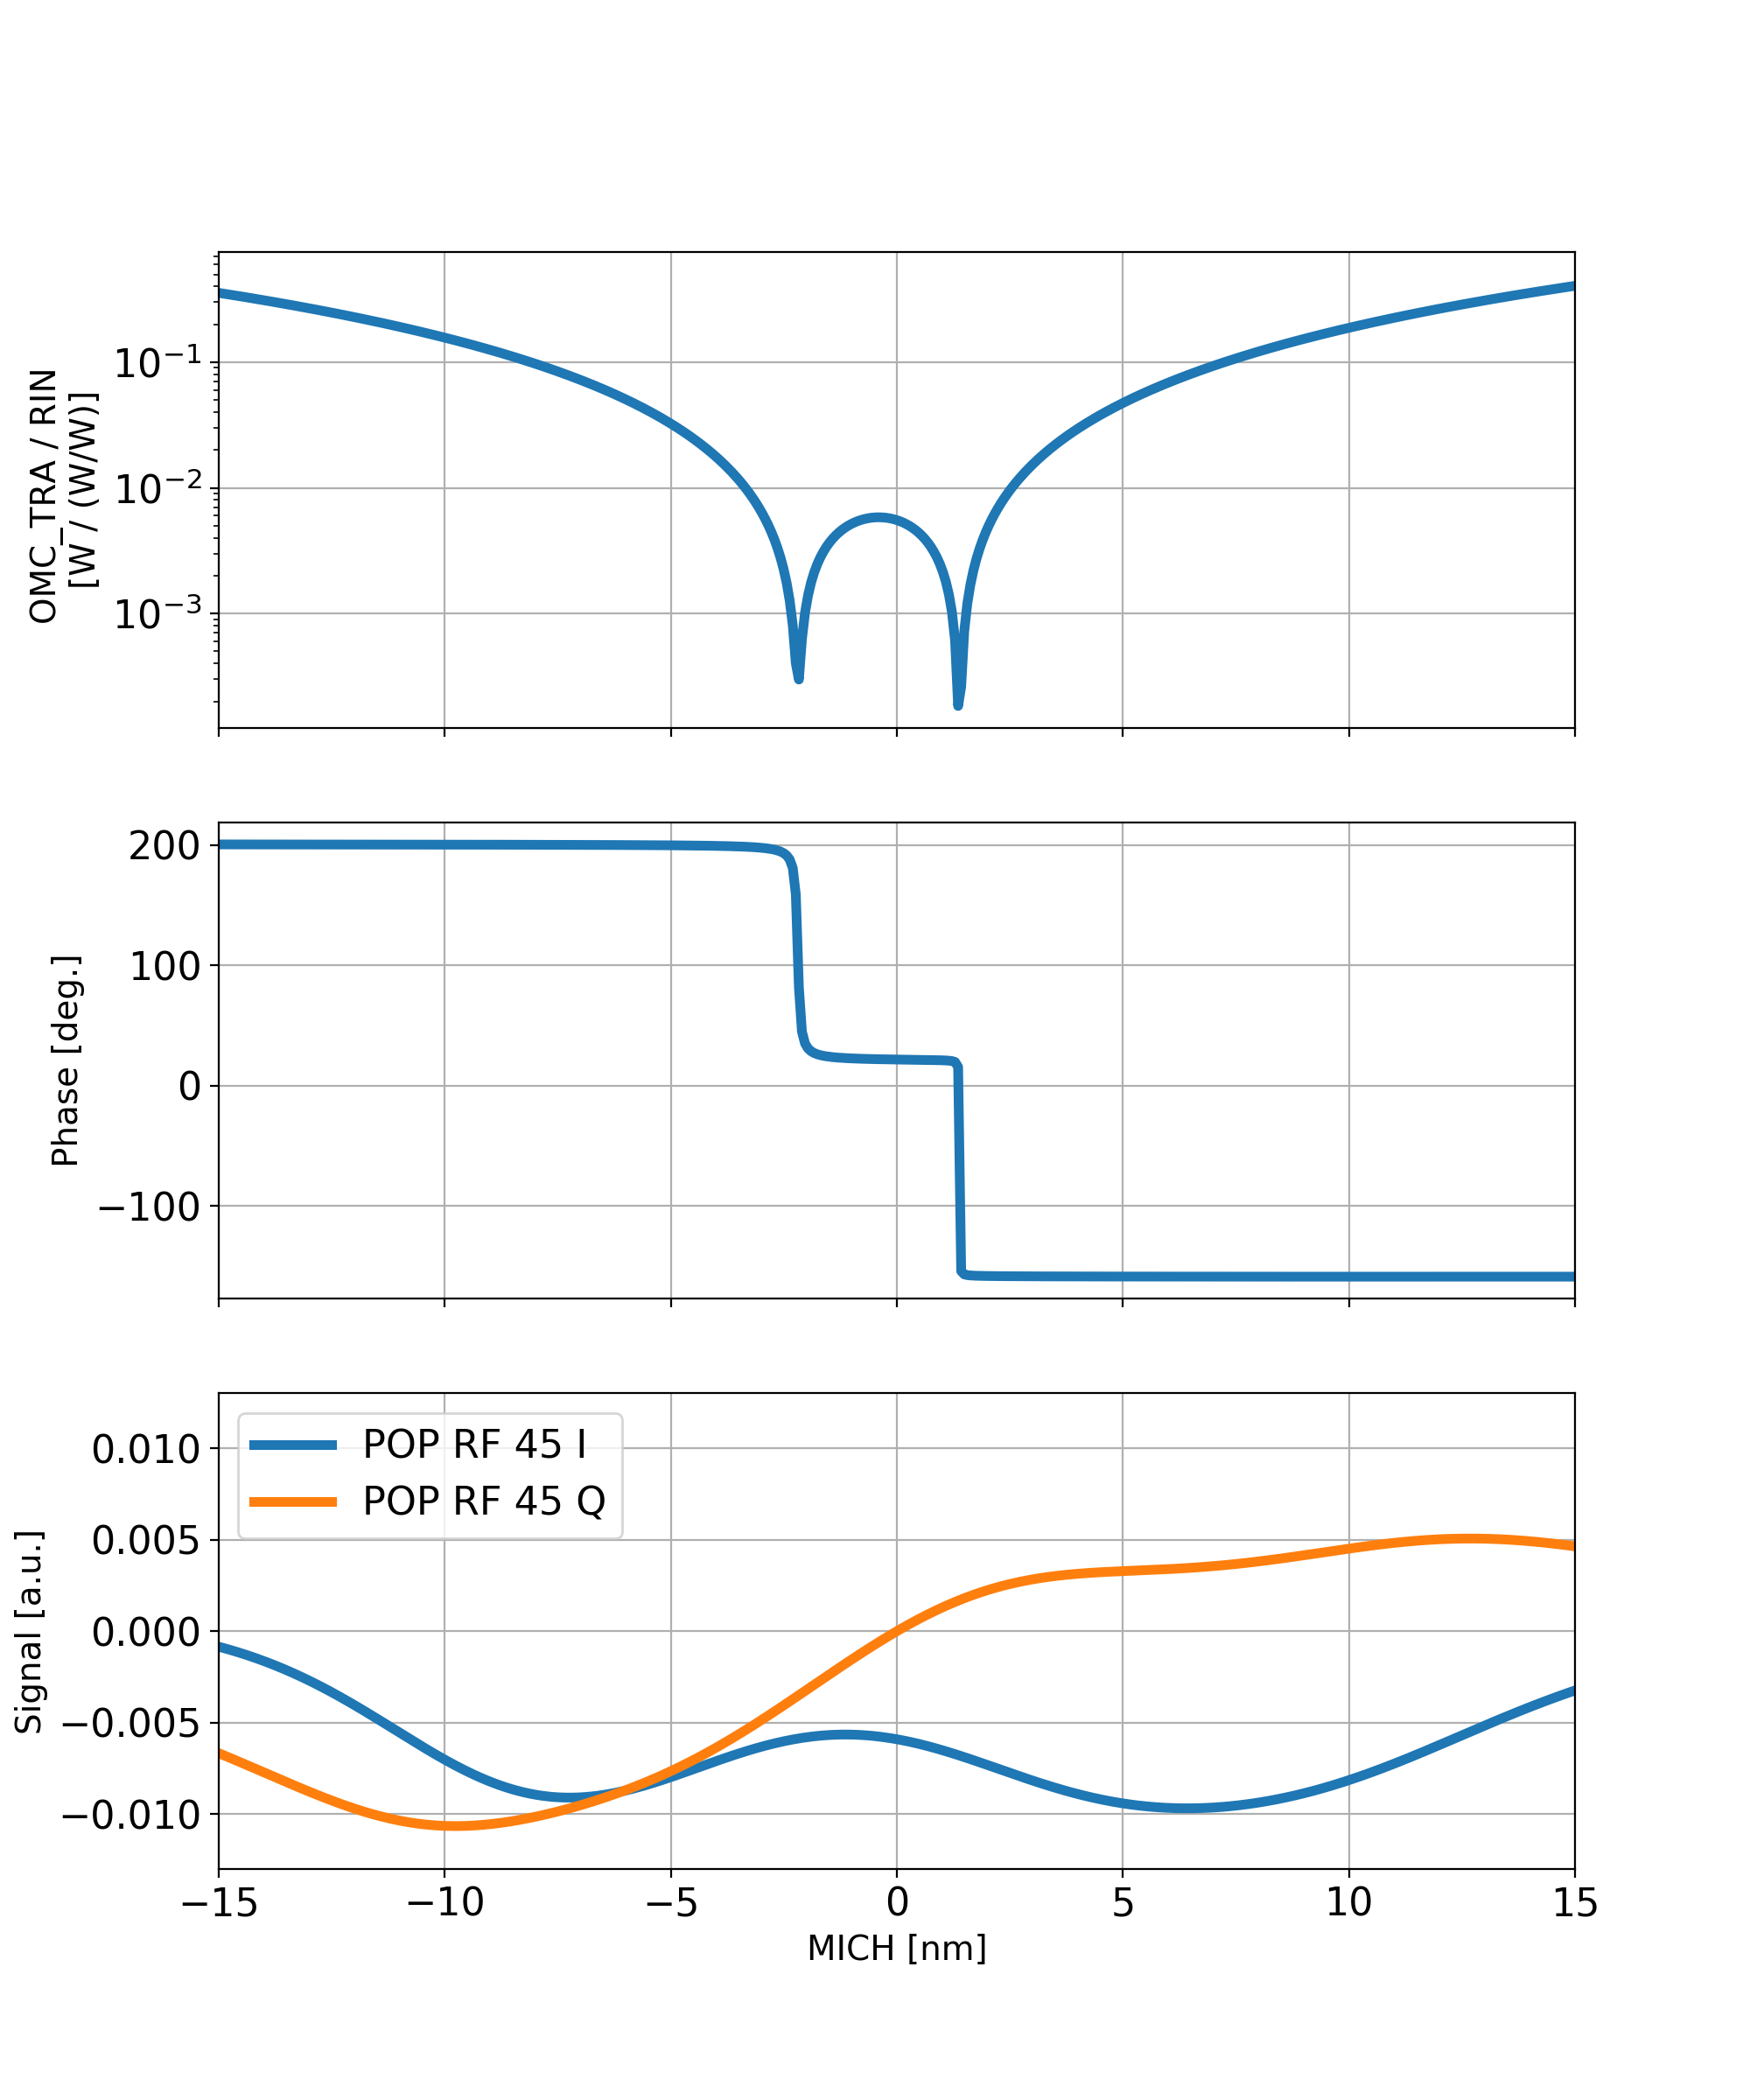
Following up on 47176, Craig did a series of MICH noise injections at different times during the lock, to check if the MICH to DARM transfer function is changing. He switched off the MICHFF for each measurement, so what we measure is the entire MICH to DARM coupling (not the residual after feed-forward).
The suspicion was that the coupling changes during thermalization. This is confirmed. The plot below shows the measured coupling at different times, reported as minutes elapsed after powering up to 30 W.
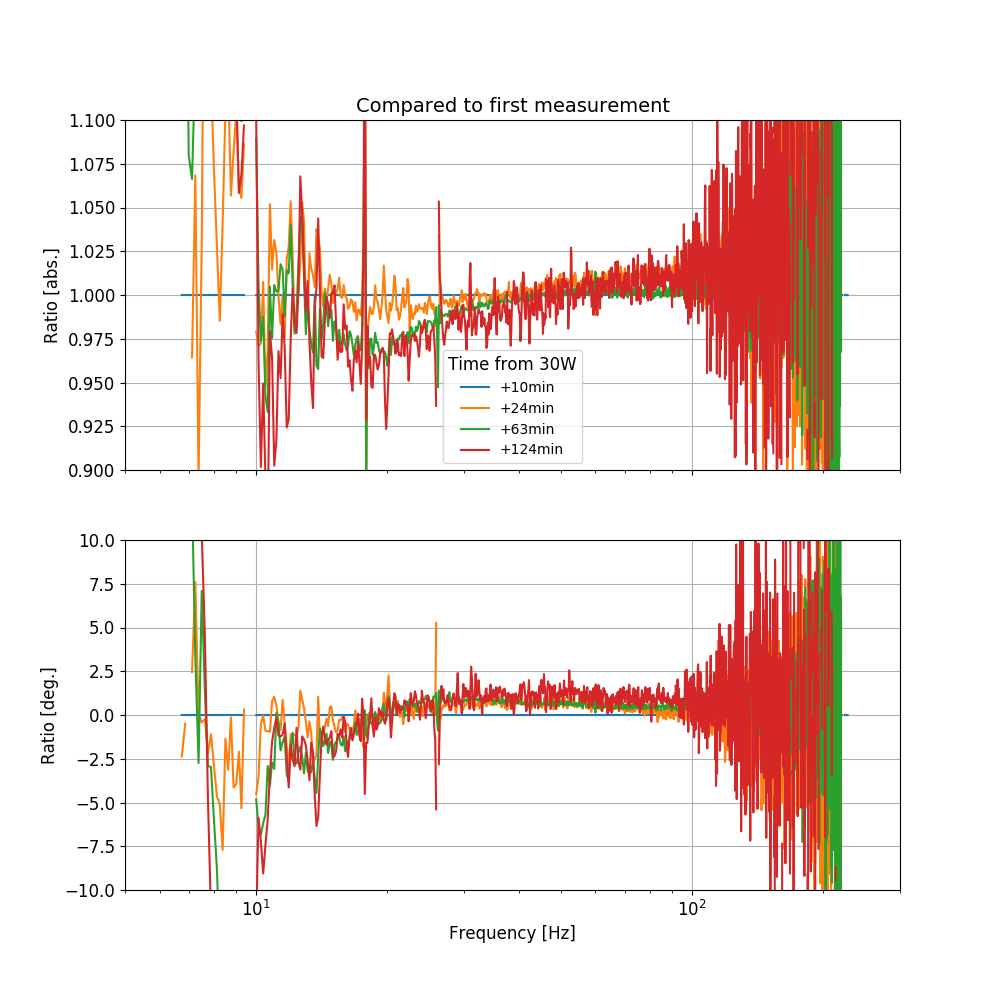
Although at first inspection the four measurements seem quite similar, if we compute the ratio of each measurement over the first one (used as reference), we see that there are changes of the order of 4% in amplitude and 2.5 degrees in phase. This is most likely a limitation on the performance of the MICH feed-forward cancelation.
Averaging Mass Centering channels for 10 [sec] ...
2019-03-04 12:04:49.360399
There are 10 T240 proof masses out of range ( > 0.3 [V] )!
ETMX T240 1 DOF X/U = 0.412 [V]
ETMX T240 1 DOF Y/V = 0.317 [V]
ETMX T240 1 DOF Z/W = 0.419 [V]
ETMX T240 2 DOF X/U = -0.307 [V]
ETMX T240 2 DOF Y/V = -0.736 [V]
ETMX T240 3 DOF X/U = 0.345 [V]
ITMX T240 1 DOF X/U = -0.427 [V]
ITMX T240 3 DOF X/U = -0.373 [V]
ITMY T240 3 DOF Z/W = -0.59 [V]
BS T240 1 DOF Z/W = 0.31 [V]
All other proof masses are within range ( < 0.3 [V] ):
ETMX T240 2 DOF Z/W = 0.234 [V]
ETMX T240 3 DOF Y/V = 0.292 [V]
ETMX T240 3 DOF Z/W = 0.292 [V]
ETMY T240 1 DOF X/U = 0.085 [V]
ETMY T240 1 DOF Y/V = 0.264 [V]
ETMY T240 1 DOF Z/W = 0.107 [V]
ETMY T240 2 DOF X/U = 0.107 [V]
ETMY T240 2 DOF Y/V = 0.021 [V]
ETMY T240 2 DOF Z/W = 0.036 [V]
ETMY T240 3 DOF X/U = 0.115 [V]
ETMY T240 3 DOF Y/V = 0.107 [V]
ETMY T240 3 DOF Z/W = 0.289 [V]
ITMX T240 1 DOF Y/V = 0.165 [V]
ITMX T240 1 DOF Z/W = 0.138 [V]
ITMX T240 2 DOF X/U = 0.184 [V]
ITMX T240 2 DOF Y/V = 0.165 [V]
ITMX T240 2 DOF Z/W = 0.257 [V]
ITMX T240 3 DOF Y/V = 0.152 [V]
ITMX T240 3 DOF Z/W = 0.057 [V]
ITMY T240 1 DOF X/U = 0.217 [V]
ITMY T240 1 DOF Y/V = 0.142 [V]
ITMY T240 1 DOF Z/W = 0.192 [V]
ITMY T240 2 DOF X/U = 0.154 [V]
ITMY T240 2 DOF Y/V = 0.268 [V]
ITMY T240 2 DOF Z/W = 0.24 [V]
ITMY T240 3 DOF X/U = -0.092 [V]
ITMY T240 3 DOF Y/V = 0.23 [V]
BS T240 1 DOF X/U = 0.004 [V]
BS T240 1 DOF Y/V = -0.078 [V]
BS T240 2 DOF X/U = 0.079 [V]
BS T240 2 DOF Y/V = 0.29 [V]
BS T240 2 DOF Z/W = -0.02 [V]
BS T240 3 DOF X/U = 0.112 [V]
BS T240 3 DOF Y/V = -0.162 [V]
BS T240 3 DOF Z/W = -0.154 [V]
Assessment complete.
Averaging Mass Centering channels for 10 [sec] ...
2019-03-04 12:07:07.353372
There are 1 STS proof masses out of range ( > 2.0 [V] )!
STS A DOF X/U = -7.969 [V]
All other proof masses are within range ( < 2.0 [V] ):
STS A DOF Y/V = -0.922 [V]
STS A DOF Z/W = -0.258 [V]
STS B DOF X/U = 0.29 [V]
STS B DOF Y/V = -0.523 [V]
STS B DOF Z/W = -0.308 [V]
STS C DOF X/U = 0.358 [V]
STS C DOF Y/V = 0.165 [V]
STS C DOF Z/W = 0.645 [V]
STS EX DOF X/U = 0.026 [V]
STS EX DOF Y/V = 0.345 [V]
STS EX DOF Z/W = 0.317 [V]
STS EY DOF X/U = 0.359 [V]
STS EY DOF Y/V = -0.13 [V]
STS EY DOF Z/W = 0.793 [V]
Assessment complete.
Most of the T240 masses shown as out of range are on ETMX. I've now re-centered them, and all of the ETMX masses are currently back in spec. The other out of spec masses are only barely out of range and only one or two masses per chamber, so are not pressing.
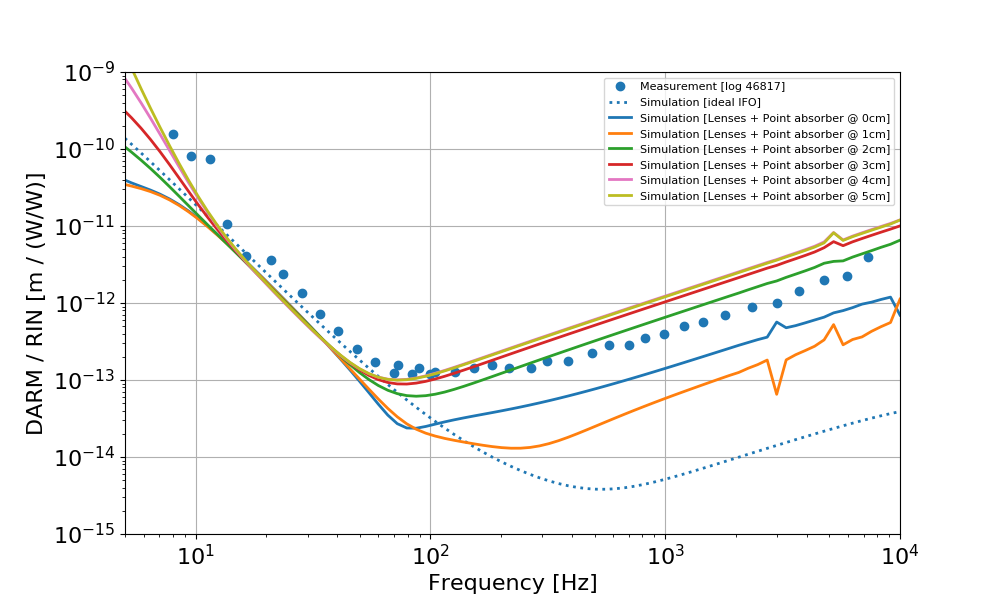
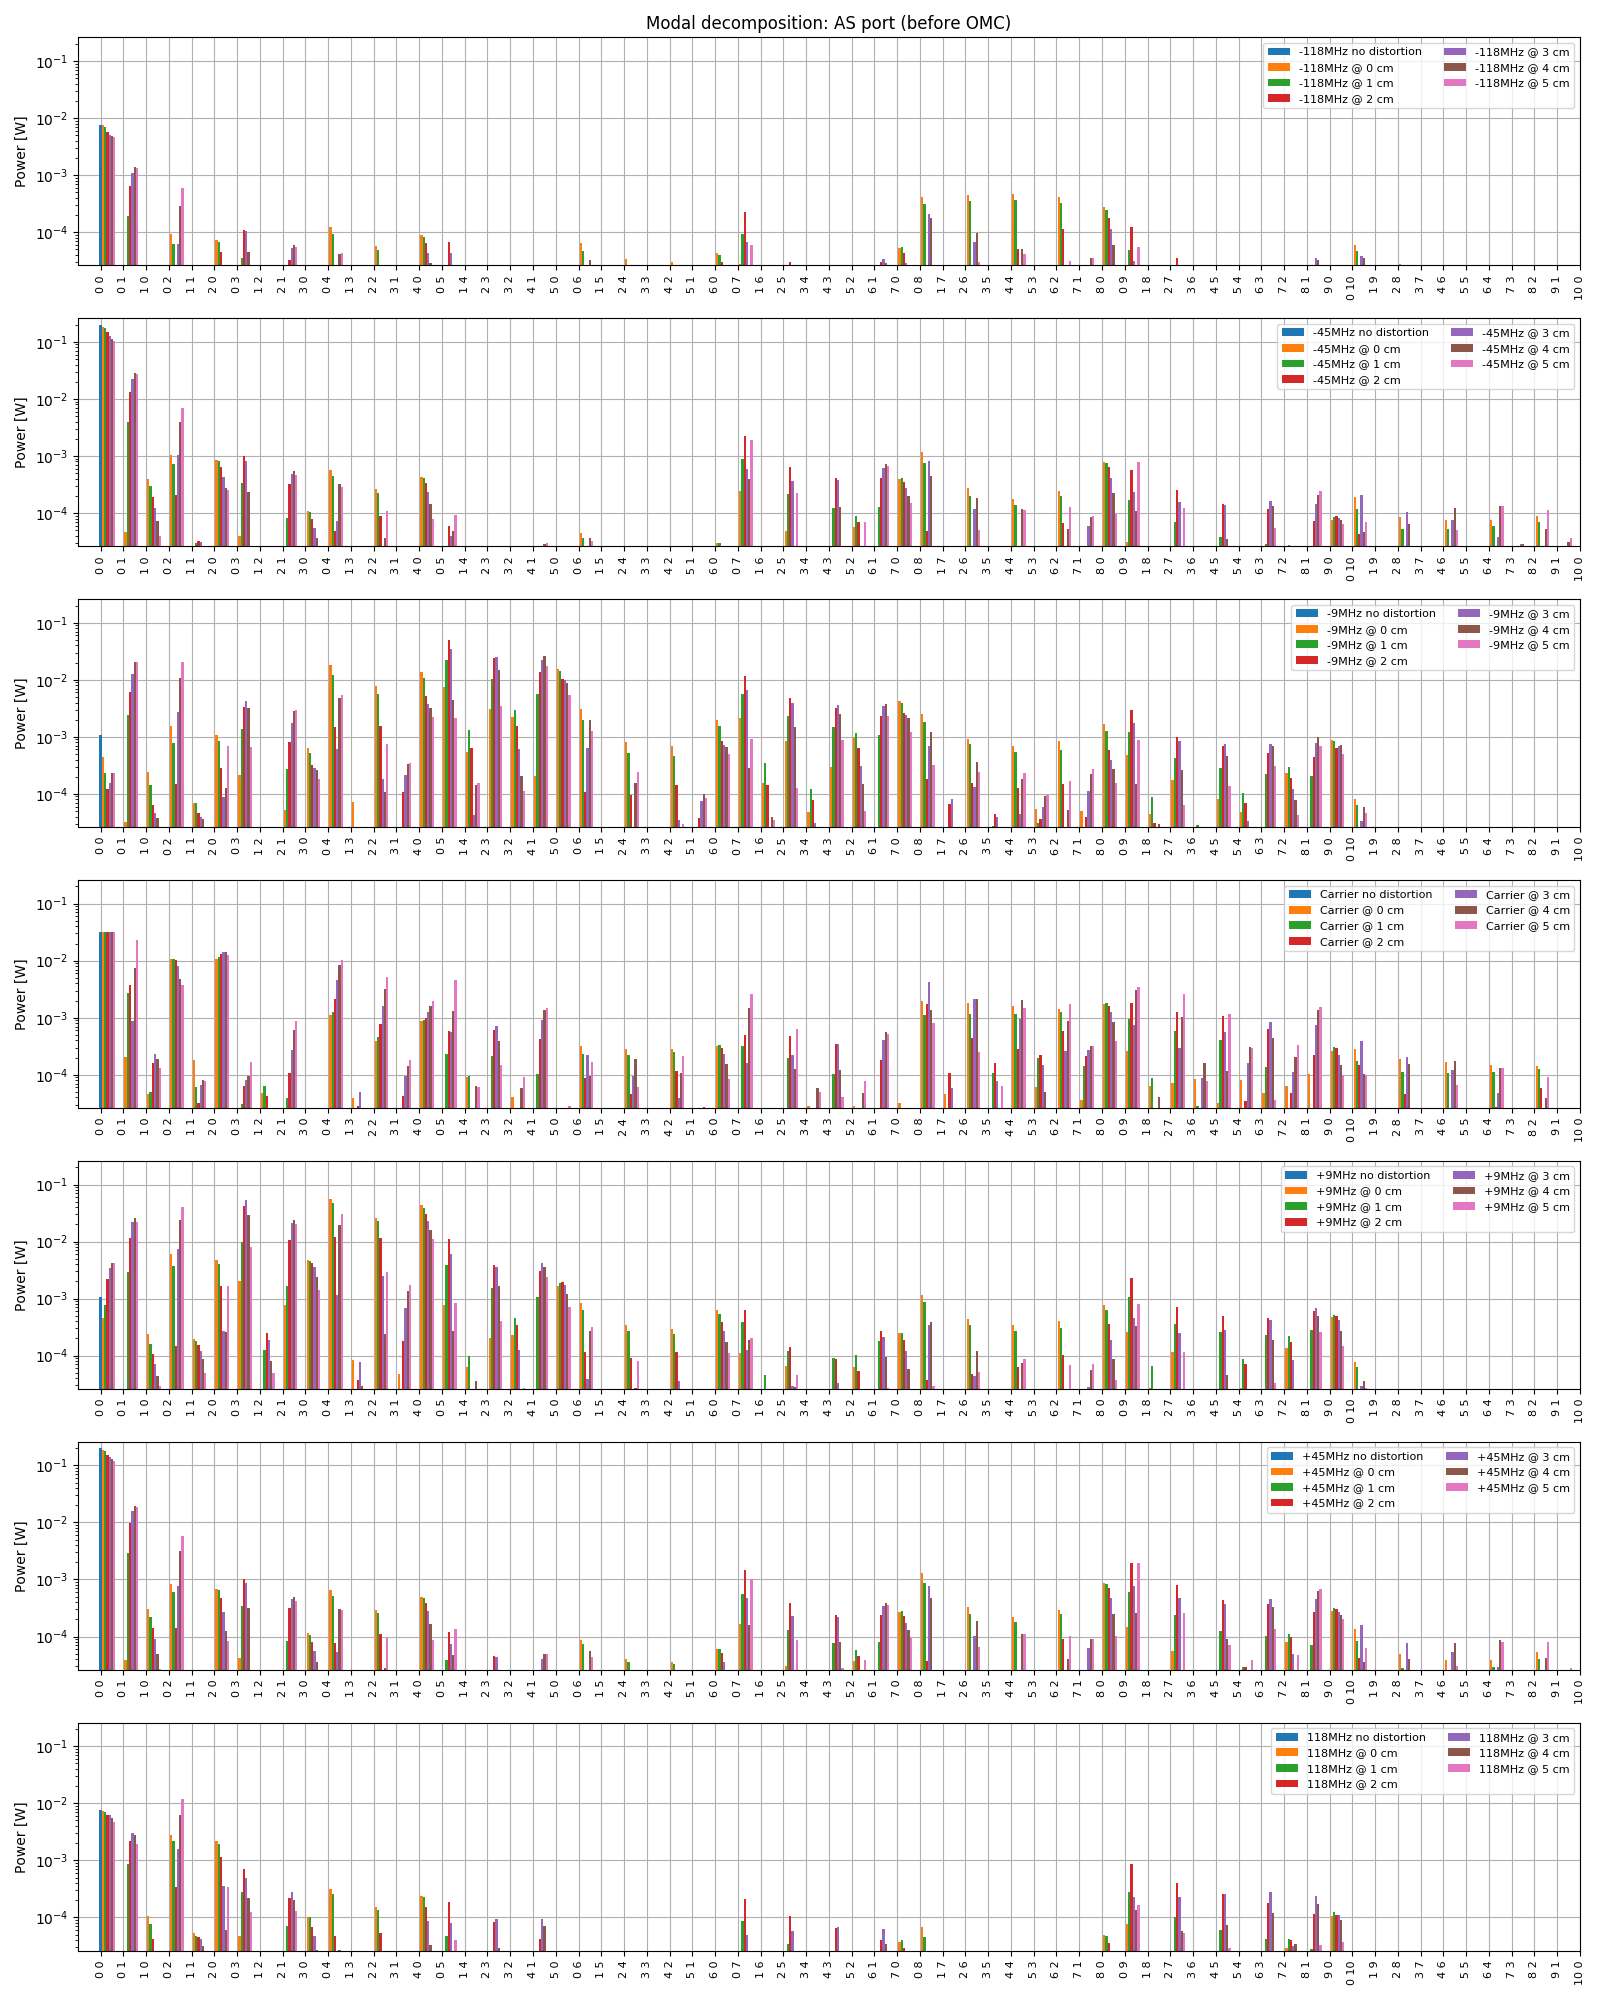
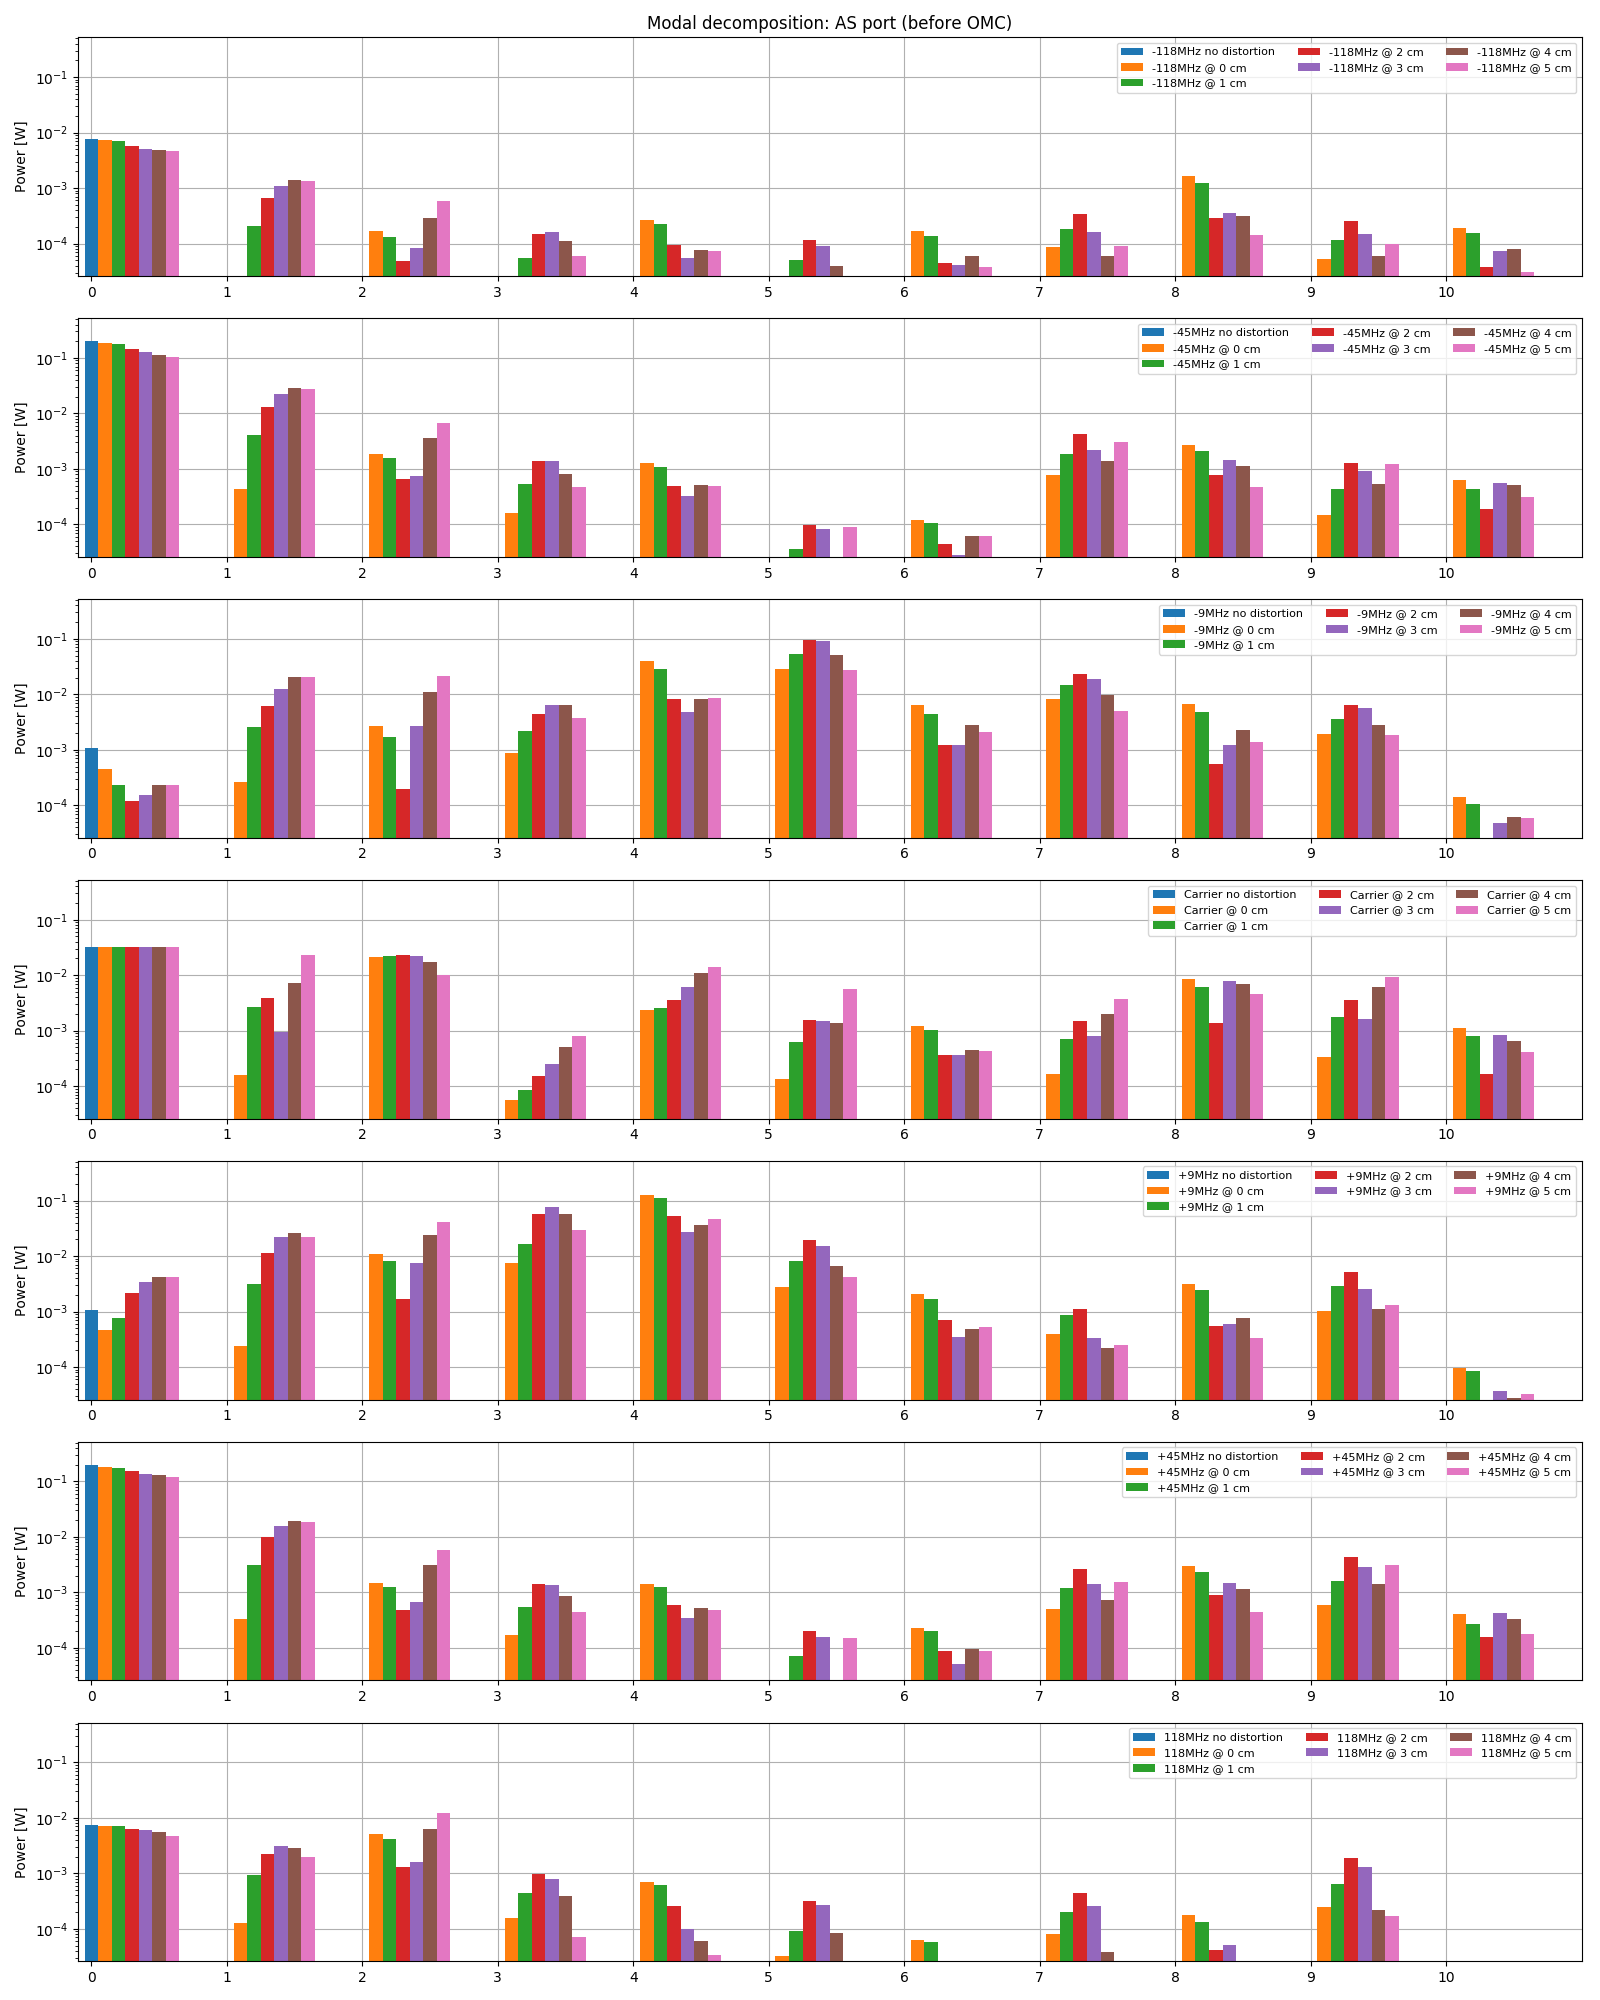
Here's another update to previous simulation of the effect of the optical path distortion (OPD) in ITMY due to the point absorber (following up on 47027 and 46952).
Simulation details:
Results:


The two plots below show the mode content at the OMC input as a function of the point absorber position. The input power is 26 W and the modulation depth is 0.2 for 9 MHz and 45 MHz and 0.1 for 118 MHz. The first plot shows the decomposition into all modes, while the second shows the total for each order.
In the worst case scenario, with the point absorber at about 2cm from the beam center, the largest TEM9 mode has about 5 mW of power, so five times more than what initially reported in 47027. This means that (assuming all the TEM9 mode is transmitted by the OMC) we would need a RF9 RIN of about 1e-7 /rHz to explain the DARM excess noise.
Danny, Dan
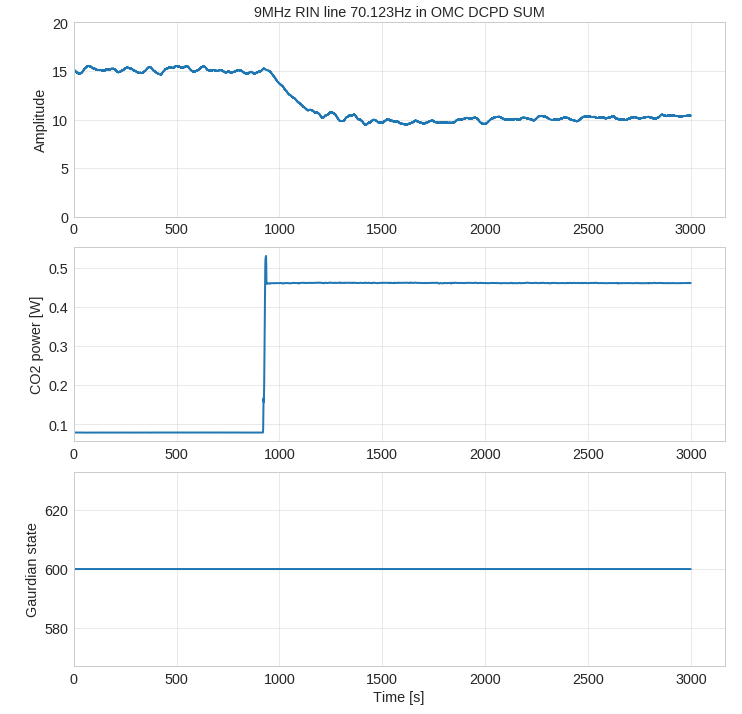
9MHz RIN line over locks
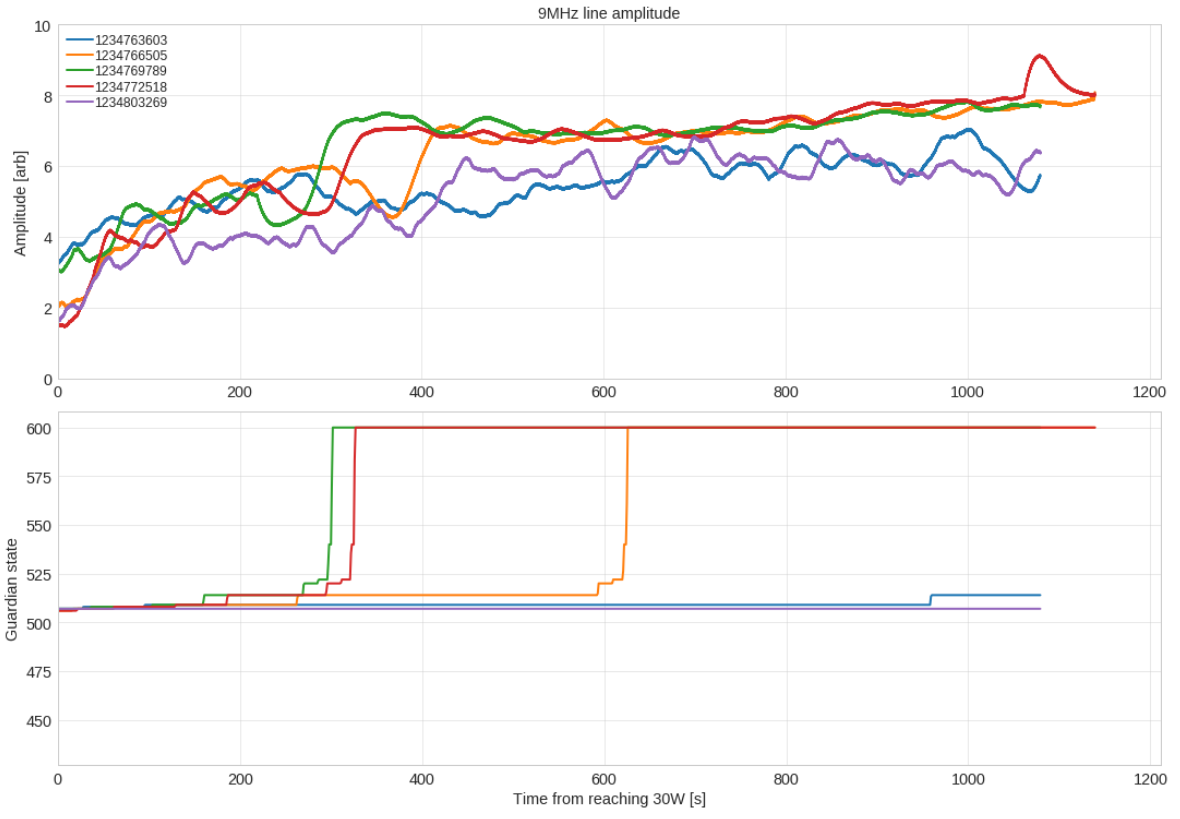
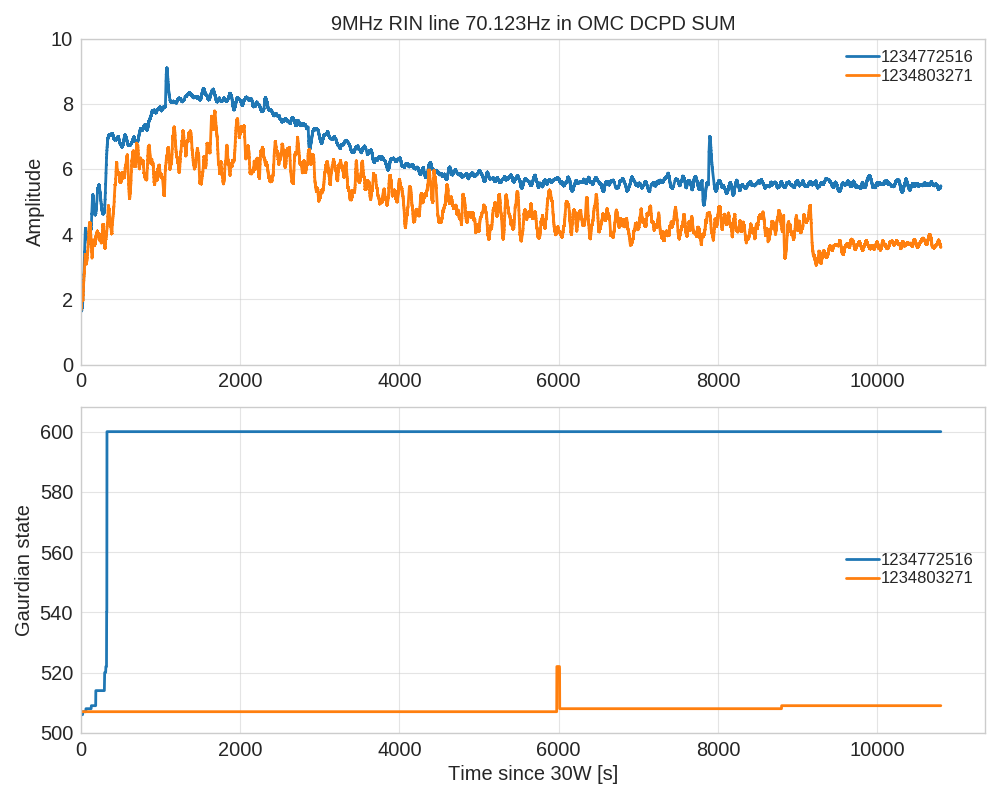
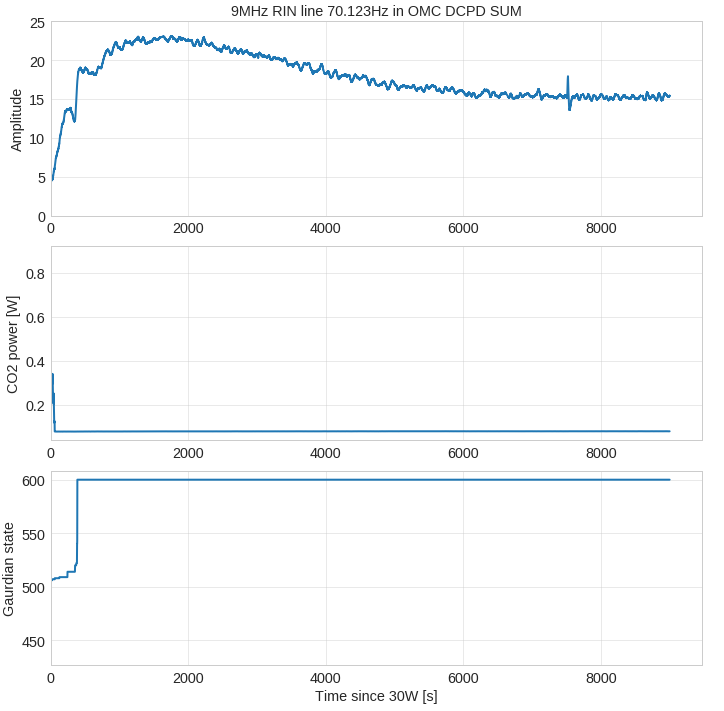
We put a line at 70.123Hz in the 9MHz for a few locks to see how it was behaving over time. When it was one we had a few short locks and two longer ones so far. It seems there are two states in which the coupling finds itself, one that peaks around "8" and another "6". This may coincide with going to LOWNOISE_ESD_ETMX (Guardian state 514) - the jump up in RIN coupling for red/green/orange seems to happen at roughly the same time after we go up to state 514. During the two long locks it's clear there's some long time constant to the RIN coupling, it takes around 4000s after going to 30W for this to settle. So depending on the thermal state we took the RIN measurements previously this might be a reason we got confused.
ITMY Mask
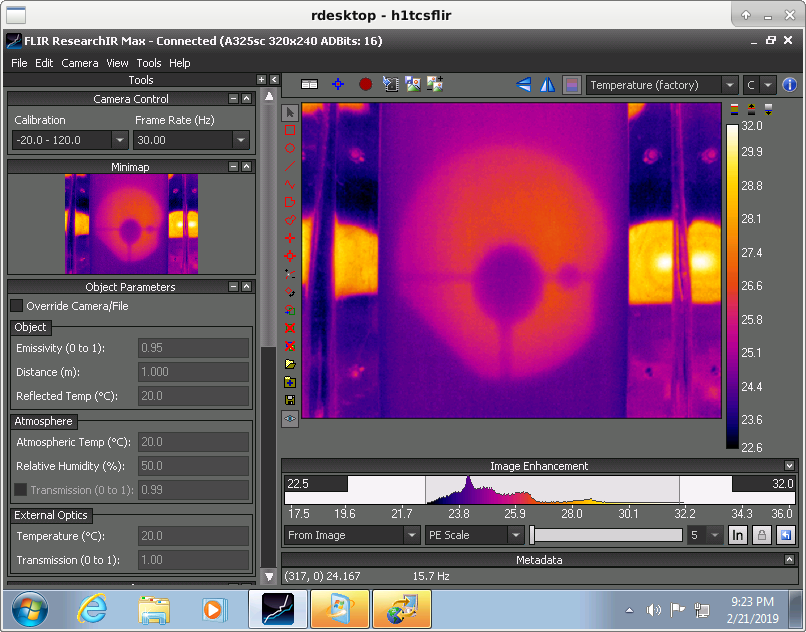

Last night we tried out the ITMY mask. The initial plan was to just apply the mask with the IFO unlocked to see how the induced OPD compared to what we expected. Then as we had the IFO to ourselves we decided to just go for it and try it out in a full lock to see what happened. Edit: this test was just to get the CO2 mask on at the expected power without causing a lockloss, the expected implementation requires changing ring heaters as well which is something to try another day.
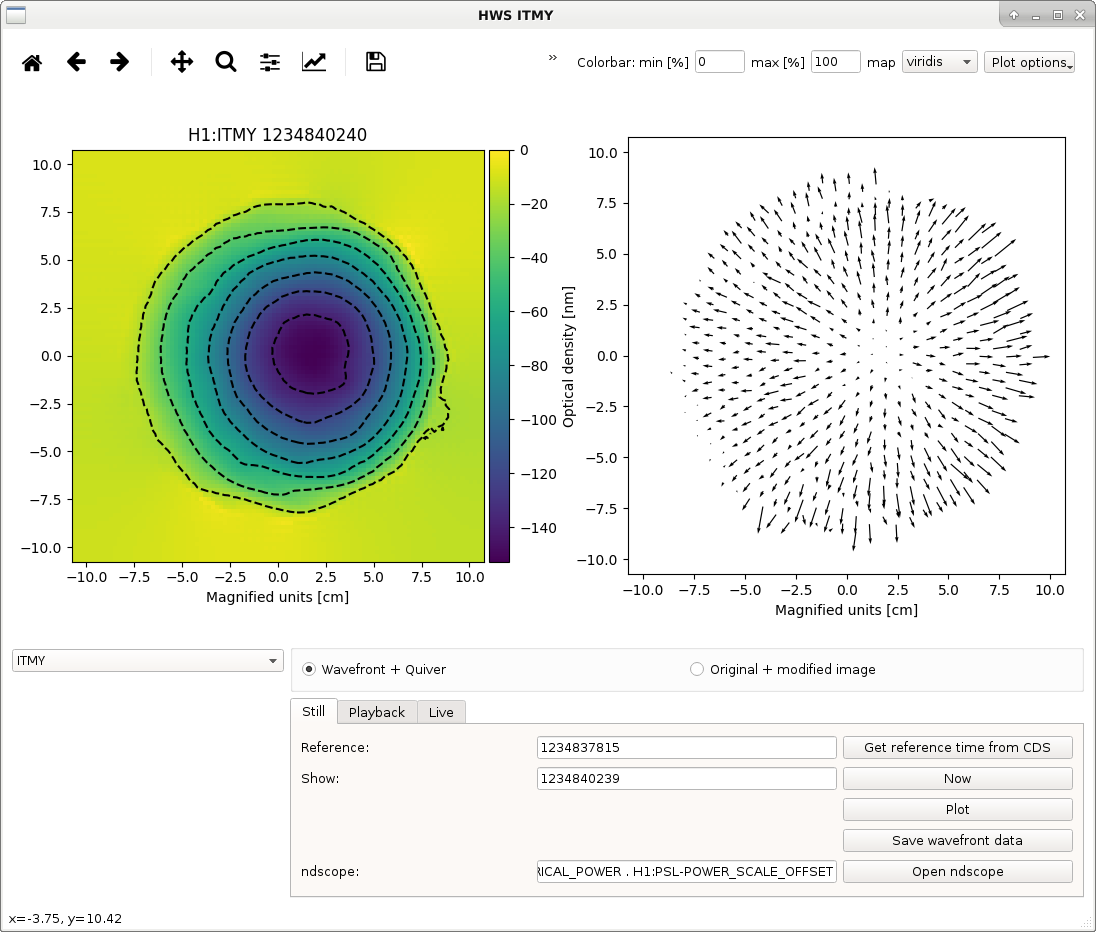
Initially the OPD doesn't look quite like we expected. What isn't obvious is the crescent moon like shape seen in alog 46976 (Top right figure). This could be because the HWS probe beam isn't illuminating the full area so we just see a small section of it. I took the 30W point absorber OPD and added it to the offline mask OPD to get a rough idea of what might be the total effect, from this it reduces the overall optical depth and the larger spatial frequency heating from the absorbers.
From initial inspection the alignment of the minimum is not too far off from the point absorbers, we might want to try shifting the mask slightly in future. However it looked reasonably well aligned enough to try in a full lock.
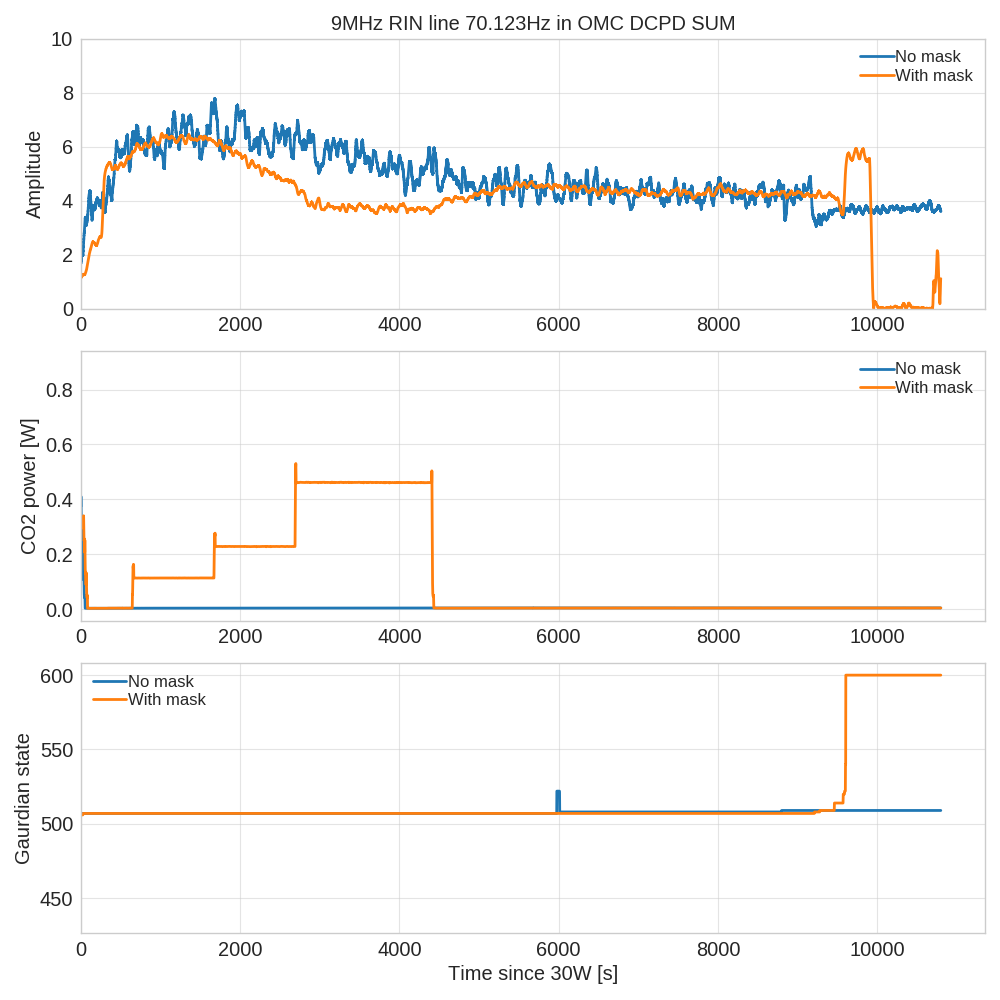
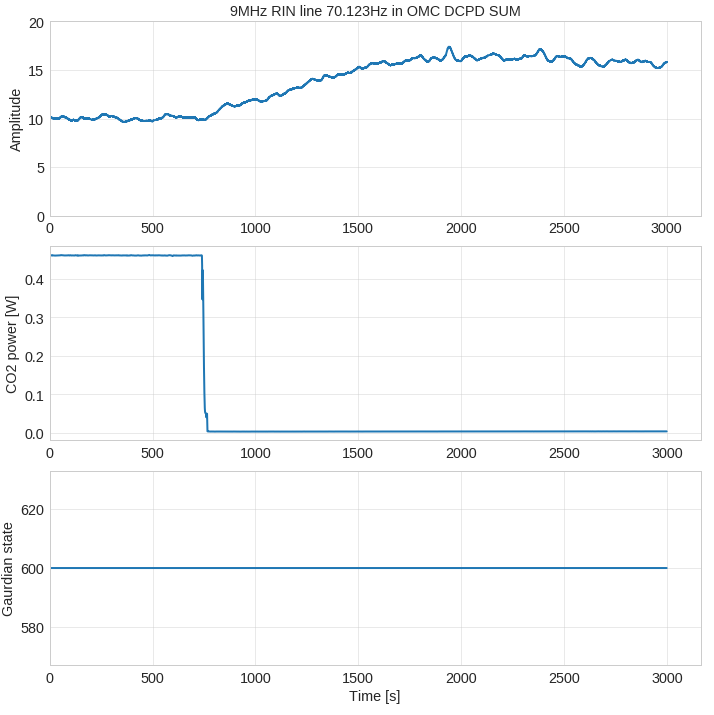
We powered up to the 30W state but didn't go to low noise ASC. We then put the mask in and stepped up in CO2Y power 100mW, 200mw, 400mW in 1000s intervals. We compare this with the 30W lock we had yesterday with the 9MHz RIN line on where we also didn't go to a low noise state. Looking at the RIN coupling we can see an improvement as the mask is introduced, then when we switched it off it goes back to as it was before. I injected a line that was 10x larger than the previous day by accident so the amplitude is rescaled and the line is less noisy. In hindsight we should have left it on a bit longer to see how it affected the steady state after 4000s, however we wanted the thermal state to return to normal for the night shift commissioning. From the data it looks as if the RIN coupling levels off between 3000-4000s. It looks to be at roughly the same level as the steady state case without the mask. Perhaps there is another dominating coupling effect at that stage where the mask no longer helps.
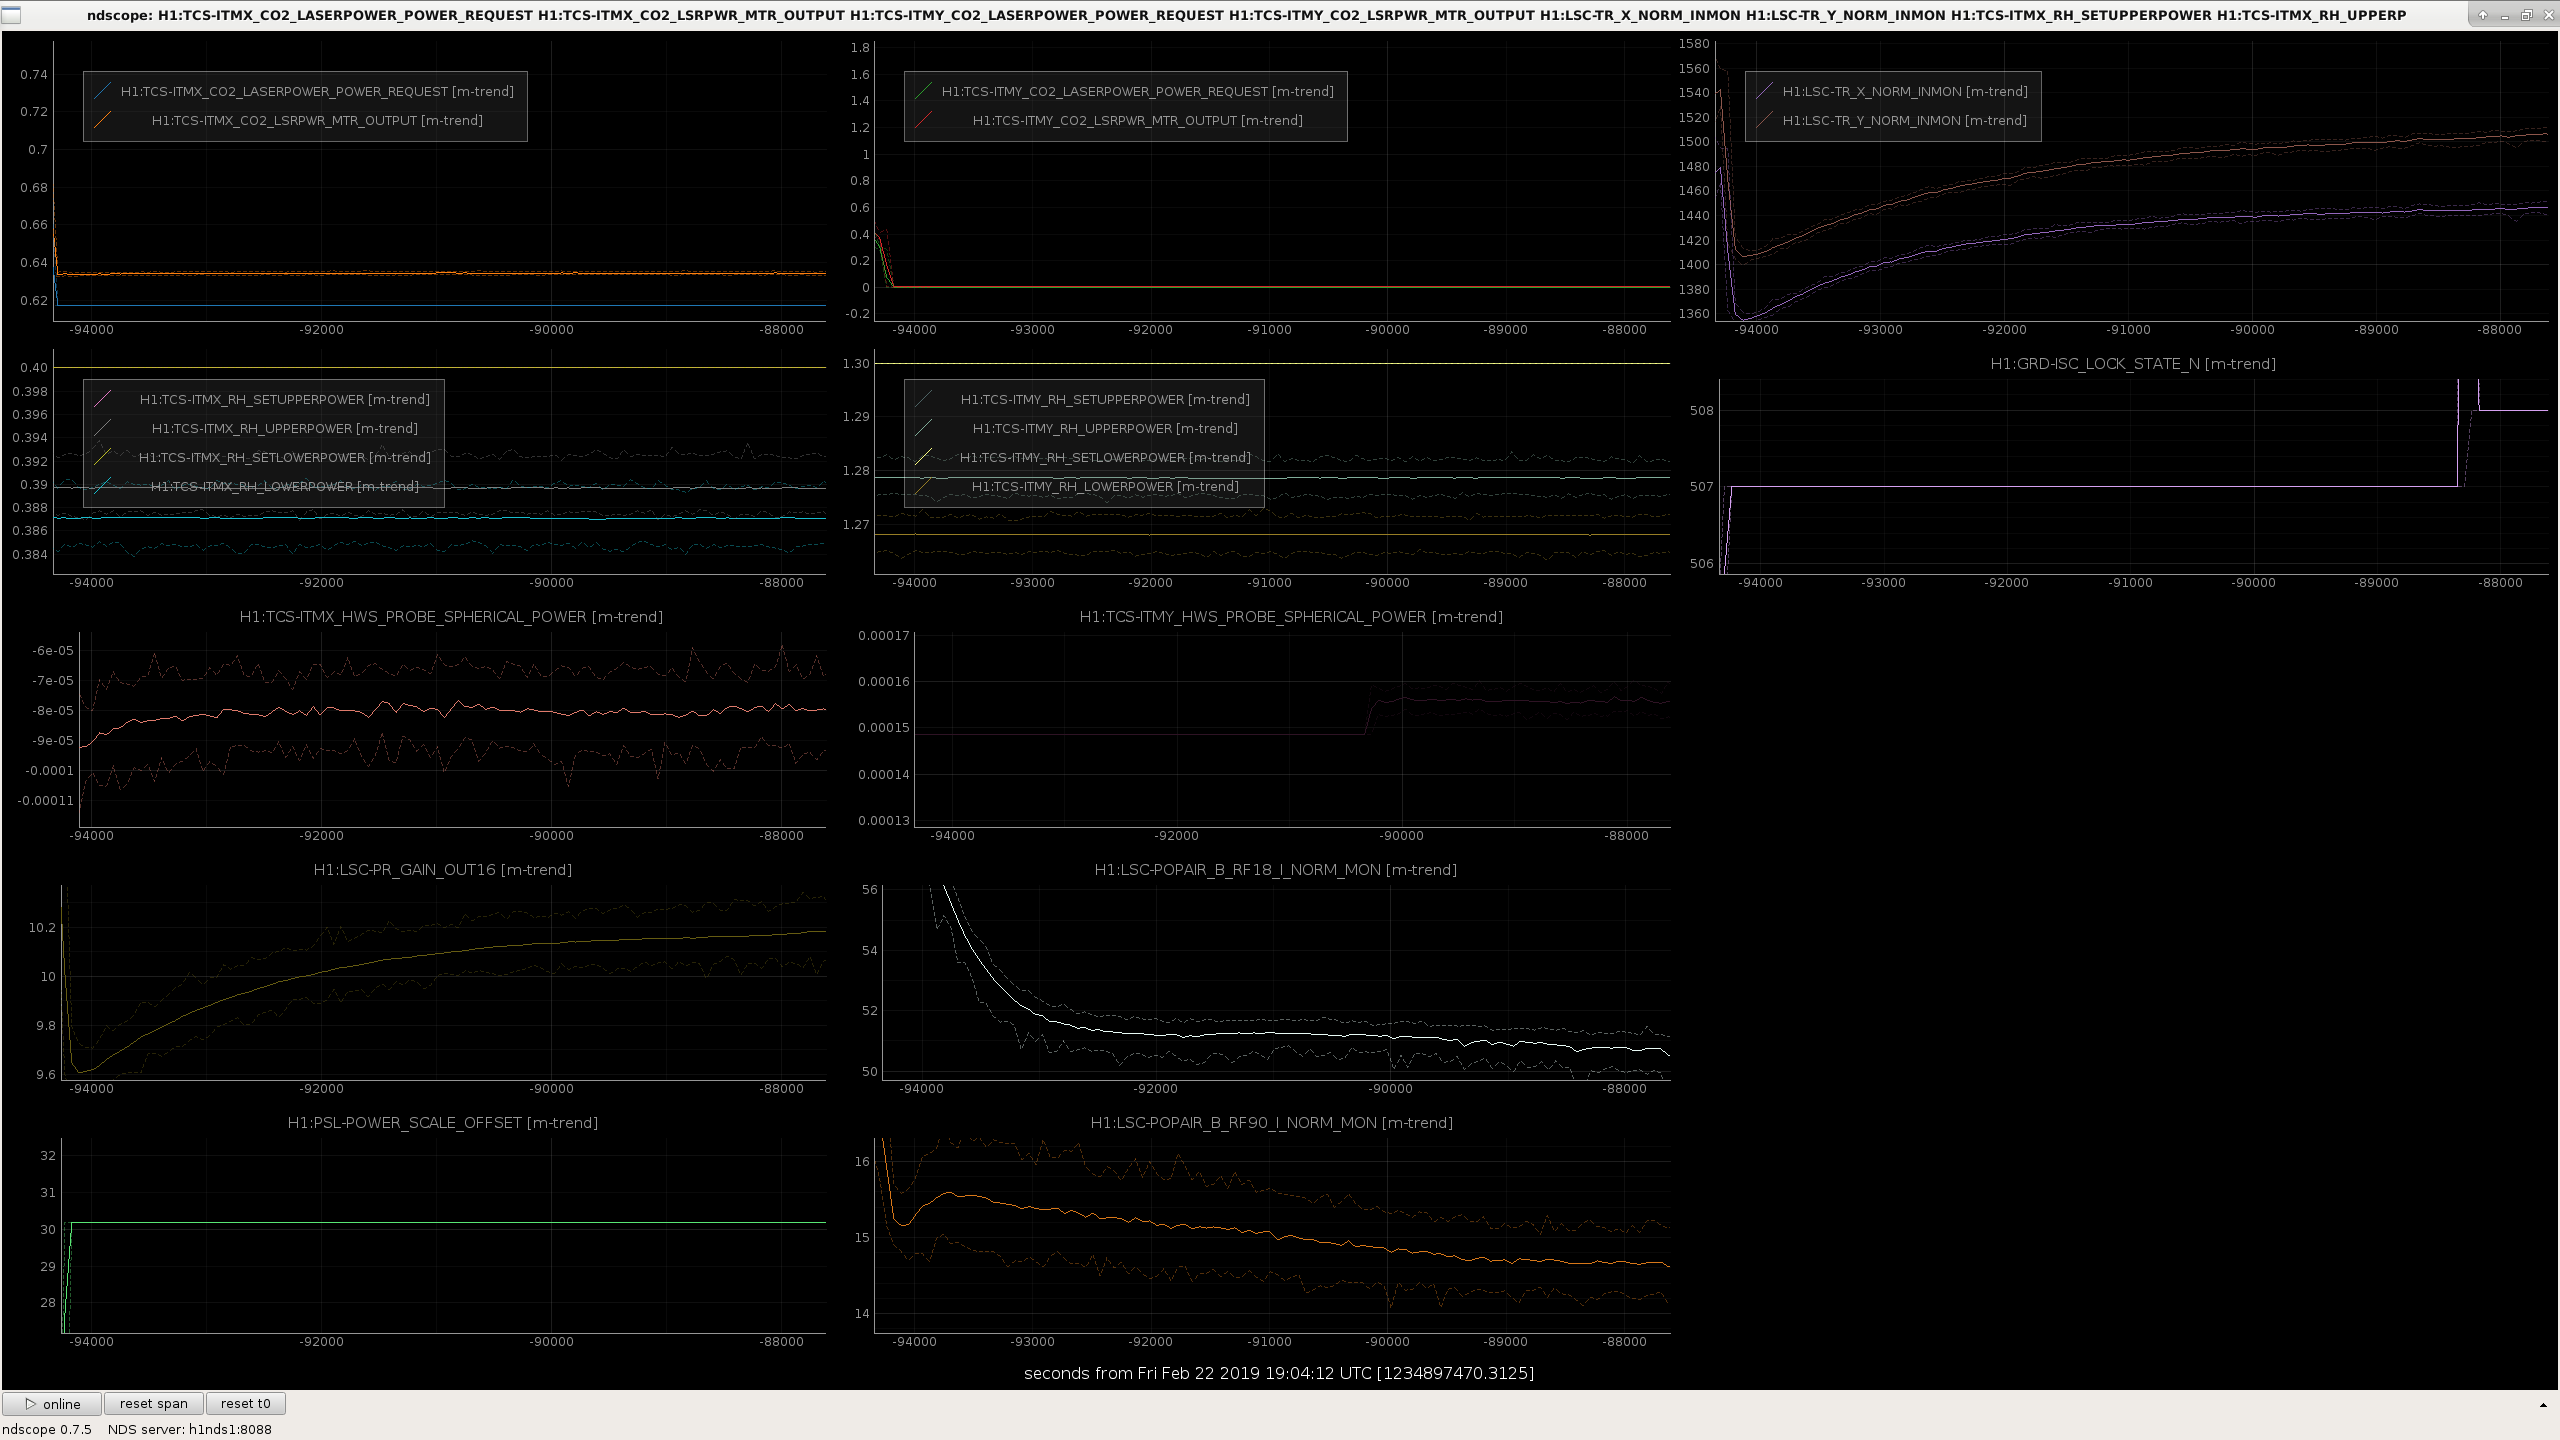
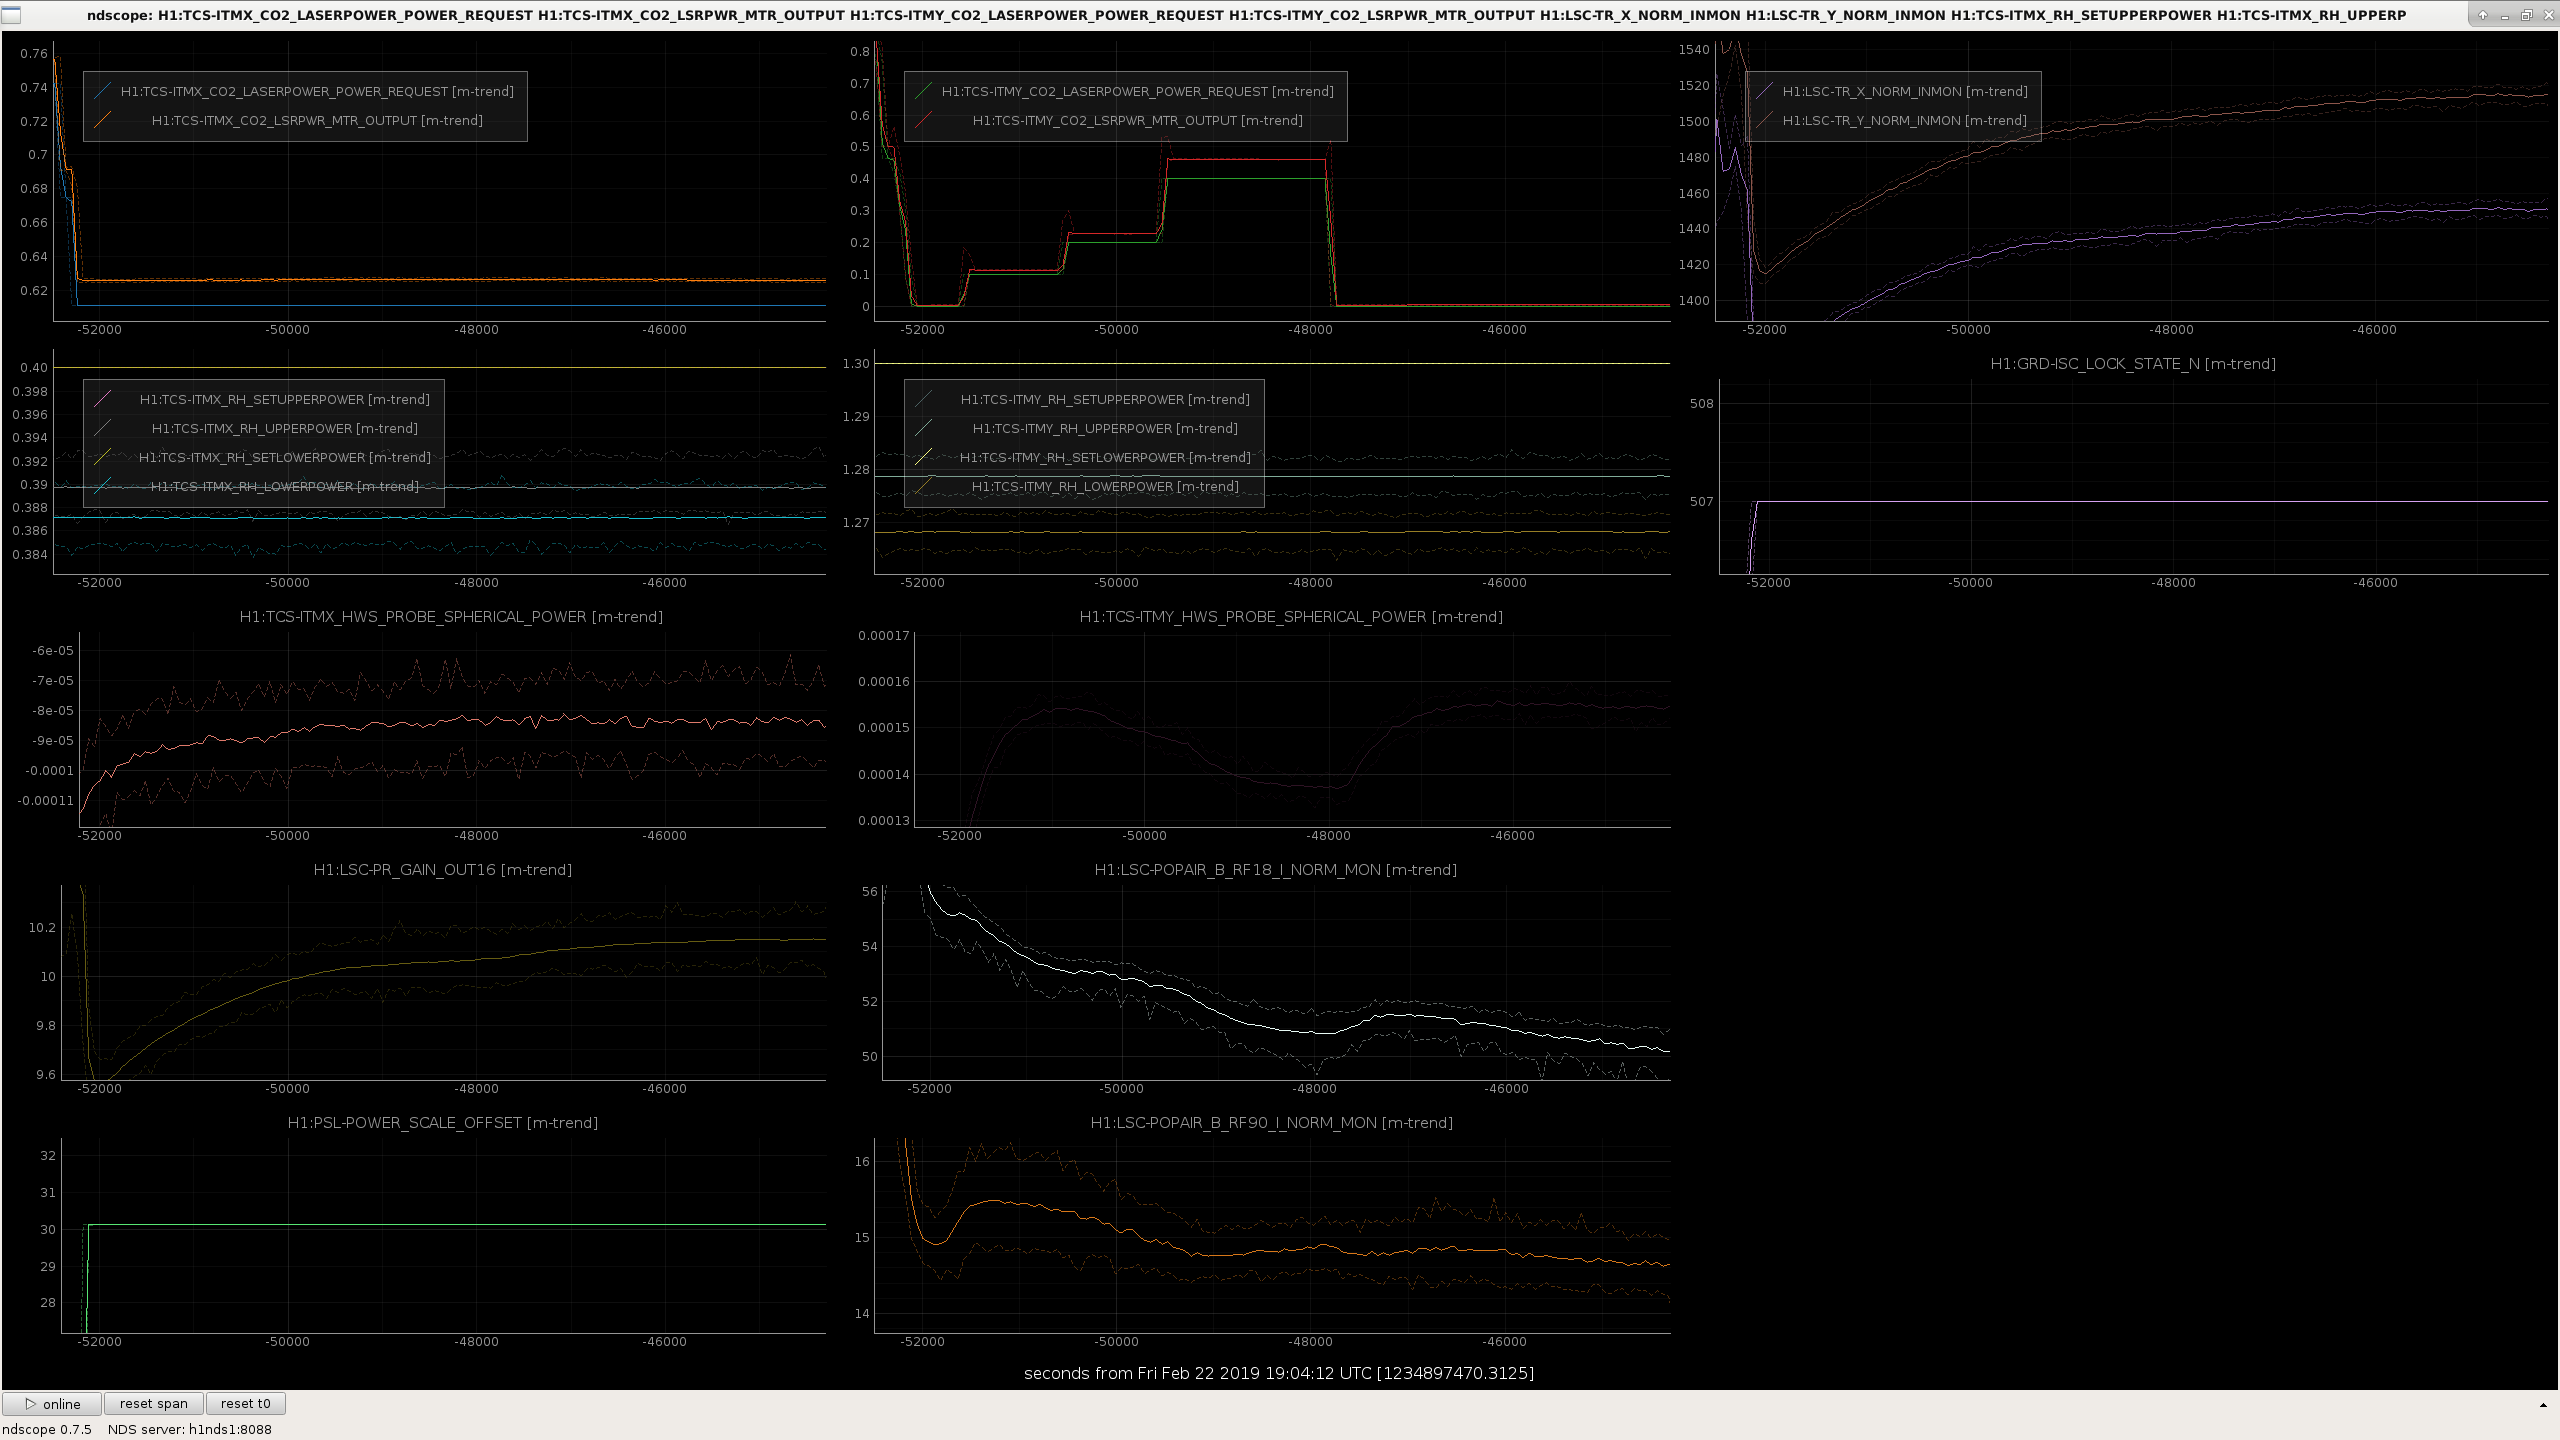
RF90/RF18/PRG/HWS traces with and without the mask.
Comparing with and without the mask we can see:
Things to try next:
Adding a plot of power levels of the two locks with mask and without. PRG and arm power remain lower with CO2 ITMY mask on, but POP18 is higher.
The other night we put the mask on once the IFO had thermalized alog 47097. The effect of the mask looked to be leveling off. However when applying the mask at a later date we also saw an improvement in the coupling.
Here is the 9 MHz RIN line amplitude at the start of the lock, when we switched the mask on, and when we switched it off. Overall saw ~30% reduction in coupling.
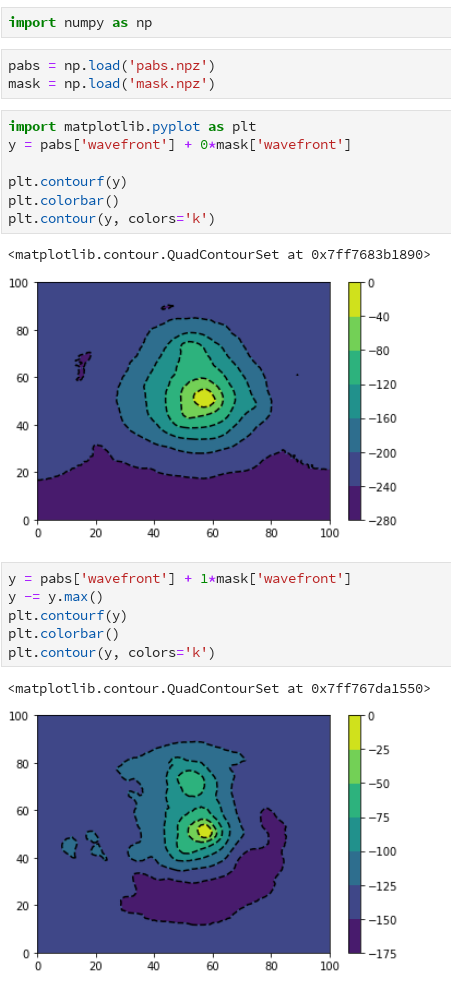
Attached is a breakdown of the mask test with a thermalised IFO at 30W. We switched on the mask for two hours. Plotted is the OPD changes between several points:
What's confusing us is that we now see an OPD change that is different to when we applied the mask separately. i.e. case 4 does not look like this.
The magnitude of the optical depth change is completely different too. Case 4 has an OPD change of 40nm, whereas applying the mask out of lock gave us ~140nm. I can't think of why this would be the case, perhaps the mask induces a change in the beam which introduces a different OPD, so some non-linear effect is in play. If so, it will be difficult to predict what mask shape to actually use.
It does however have a crescent like shape similar to aidans model Aidan's model (top right image here), although that may be a coincidence.
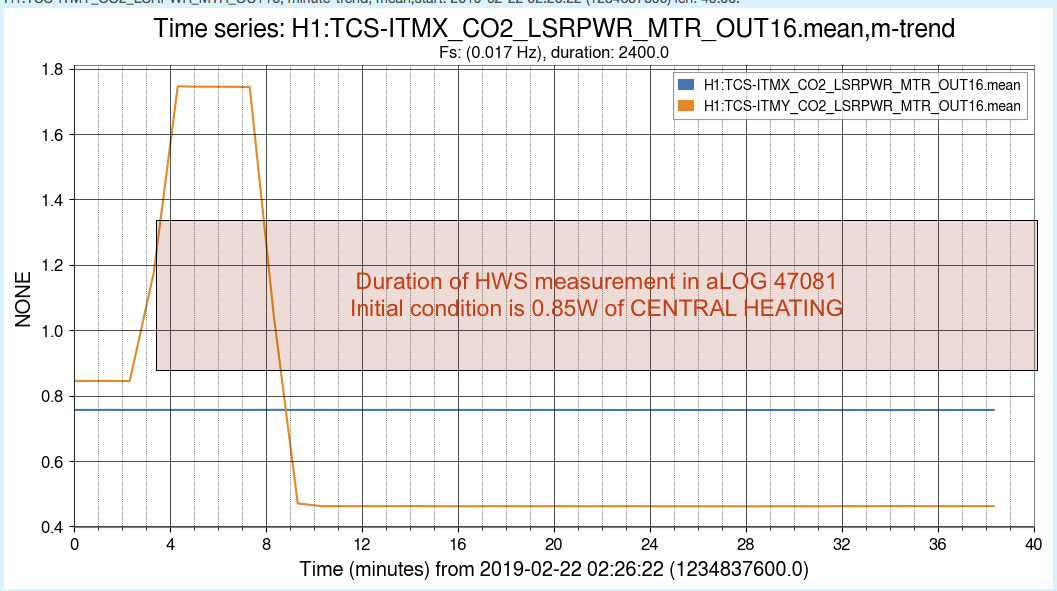
The reference for the "140nm measurement" of the CO2Y mask thermal lens was not taken at a cold state but rather with 0.85W of CENTRAL heating on. This yields a strong positive lens. If this positive lens is taken as a reference (or zero) point and then central heating is turned off, we will see a strong negative lens in the measurement.
Probably best to repeat the calibration of the CO2Y mask from a genuine cold state.
So the "140nm OPD measurement" is looking at the difference between a reference state of "0.85W central + 0.0W custom mask" and "0W central + 0.45W custom mask".

Alexei, Dan
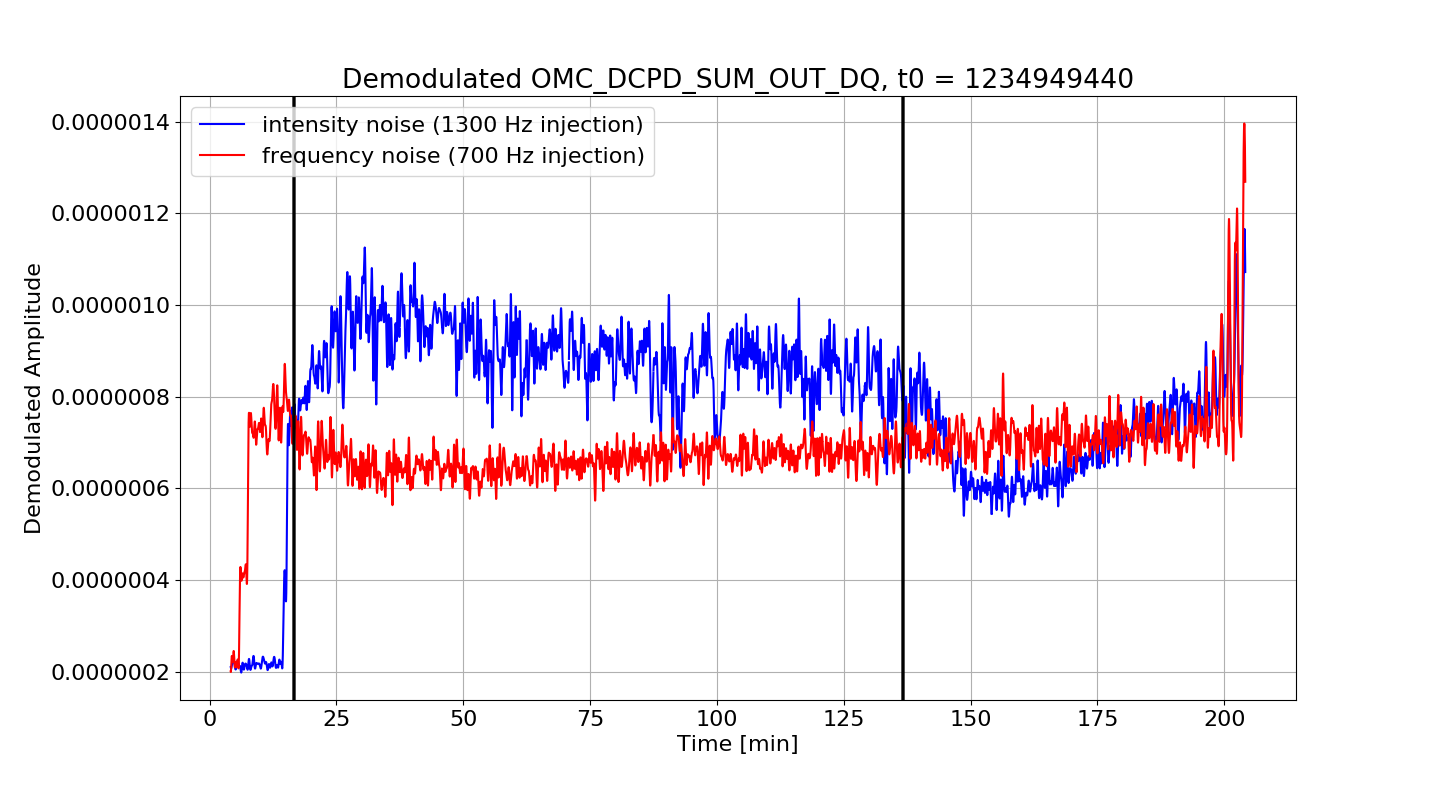
Pulled the data from OMC_DCPD_SUM_OUT_DQ corresponding to the injections of frequency and intensity noise lines as outlined in alog 47097.
The first black line is when the CO2 was switched on the second black line is when it got switched off. Looks like the mask increases intensity noise coupling but doesn't do much of anything to the frequency noise.
The ringing towards the end is likely some instability as there is a lock loss about 10 minutes after the data ends.