TJ, Dan B., Danny V.
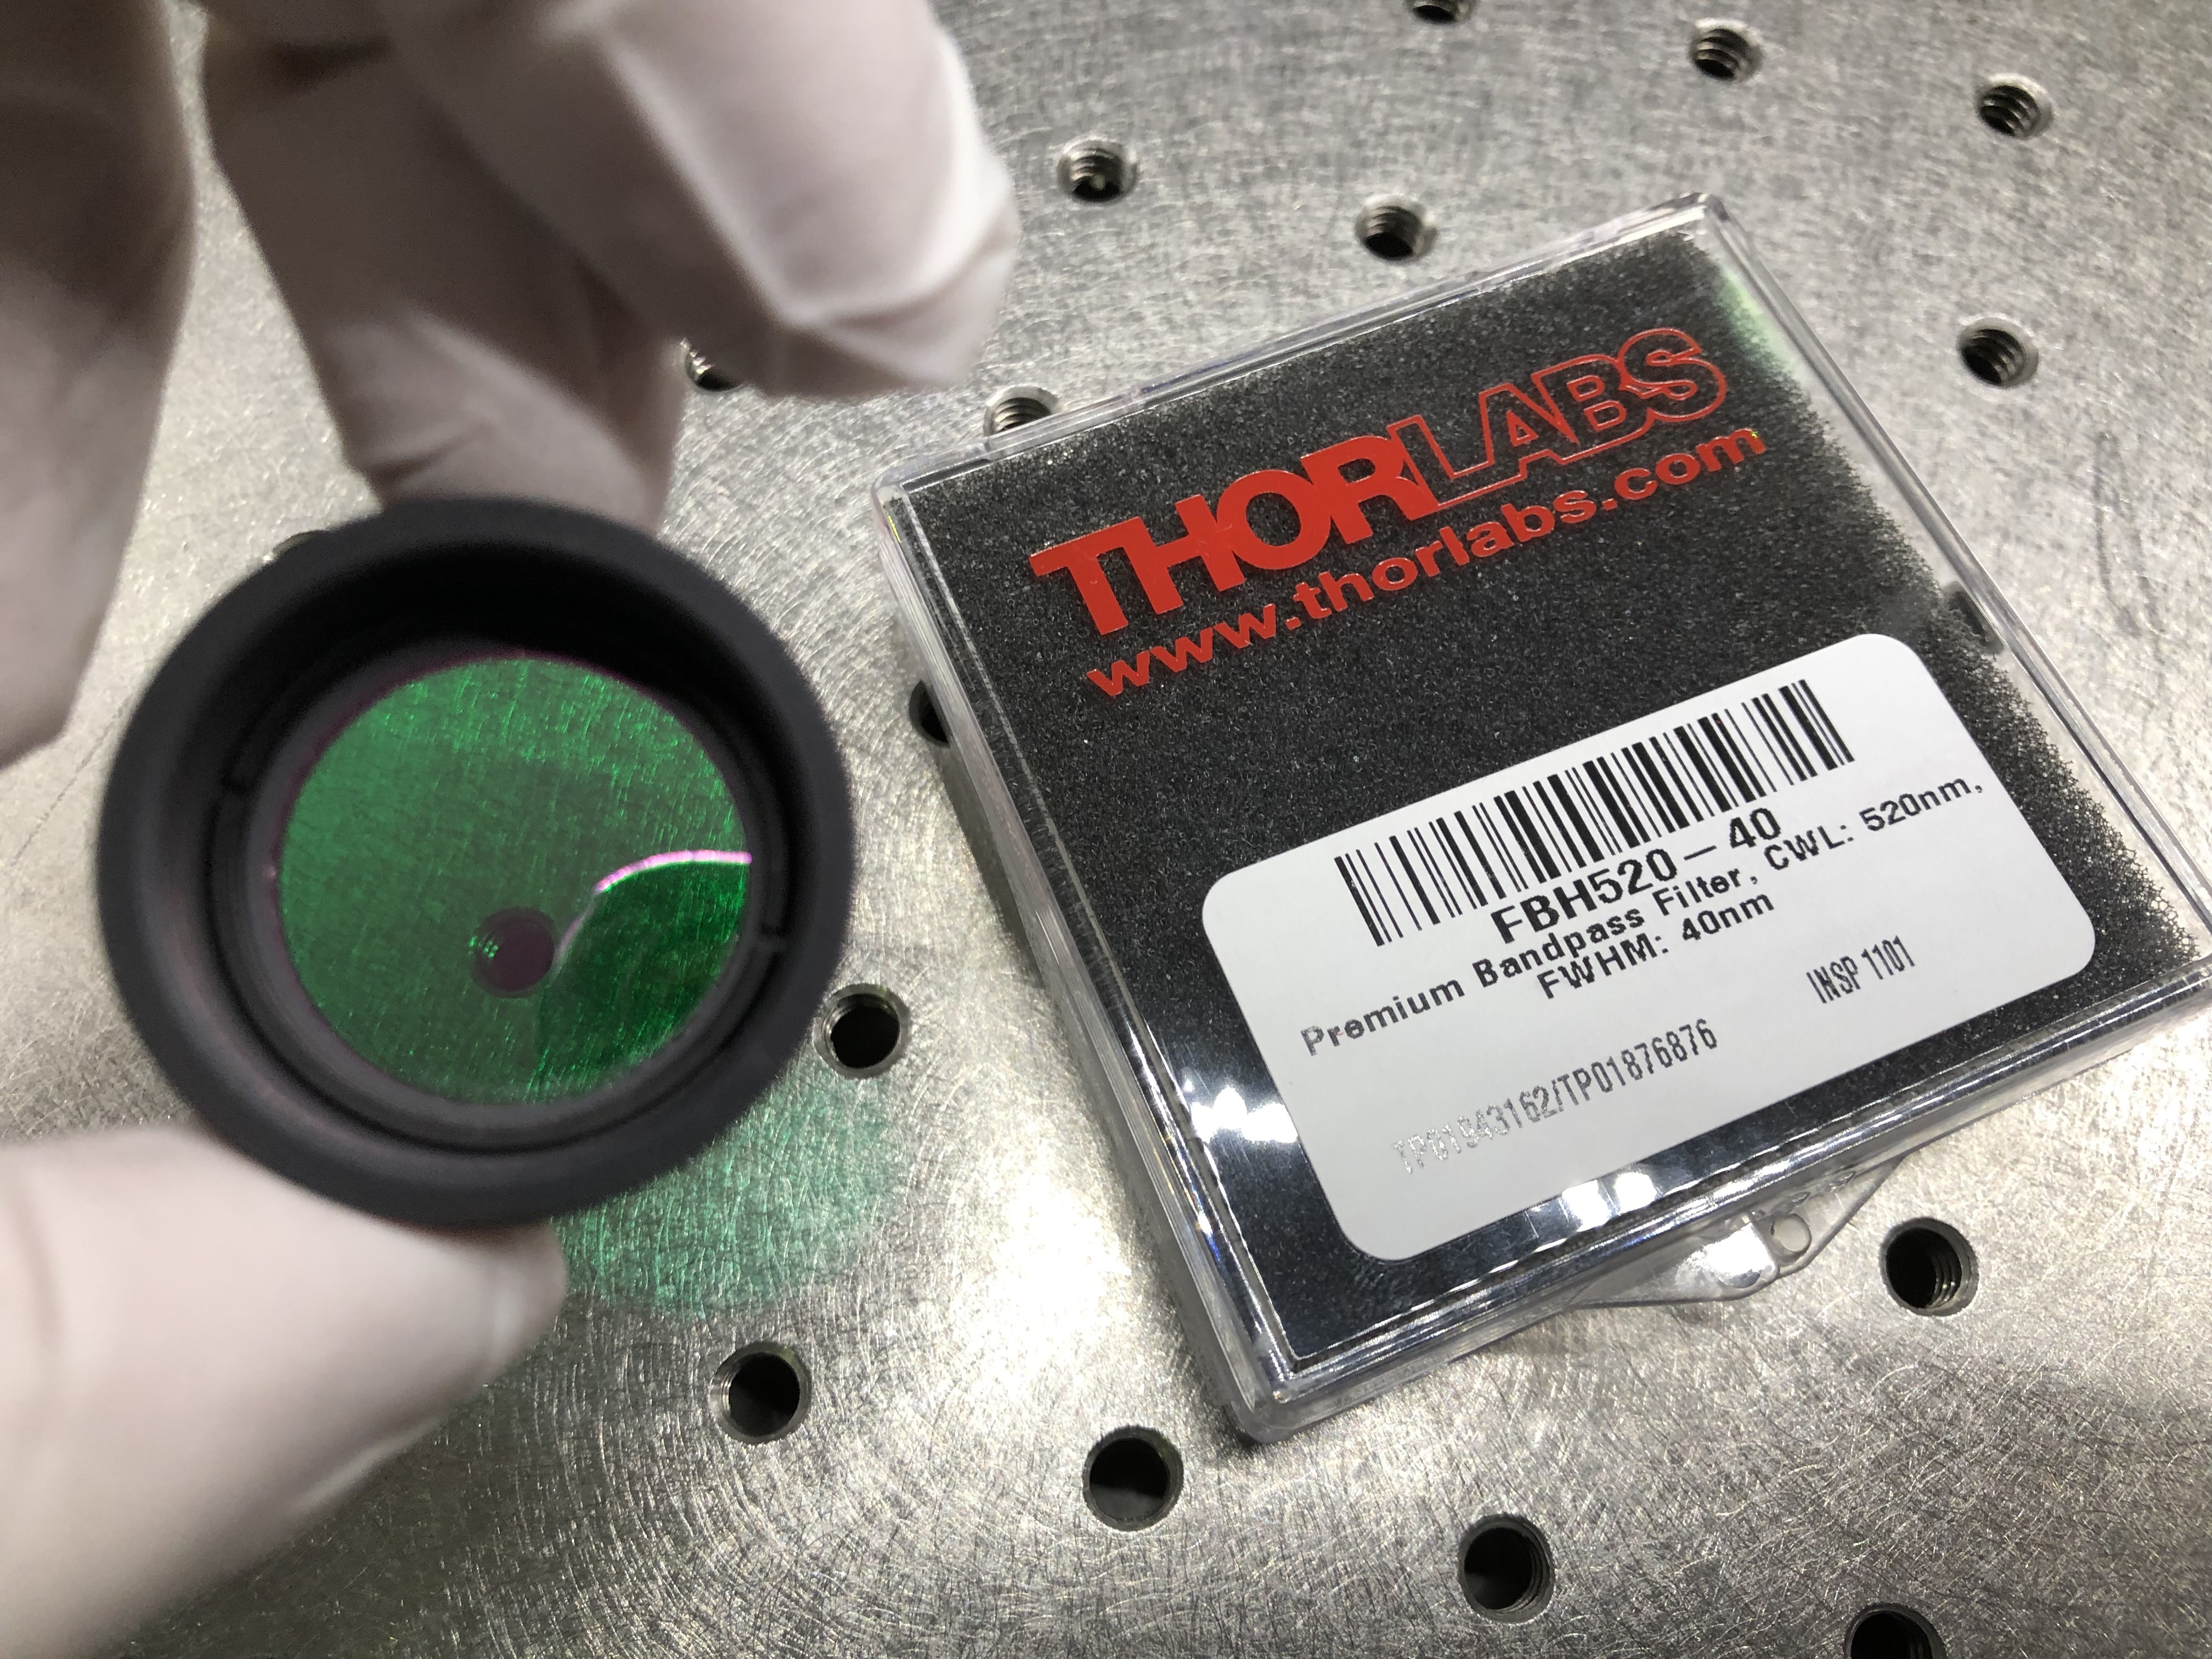
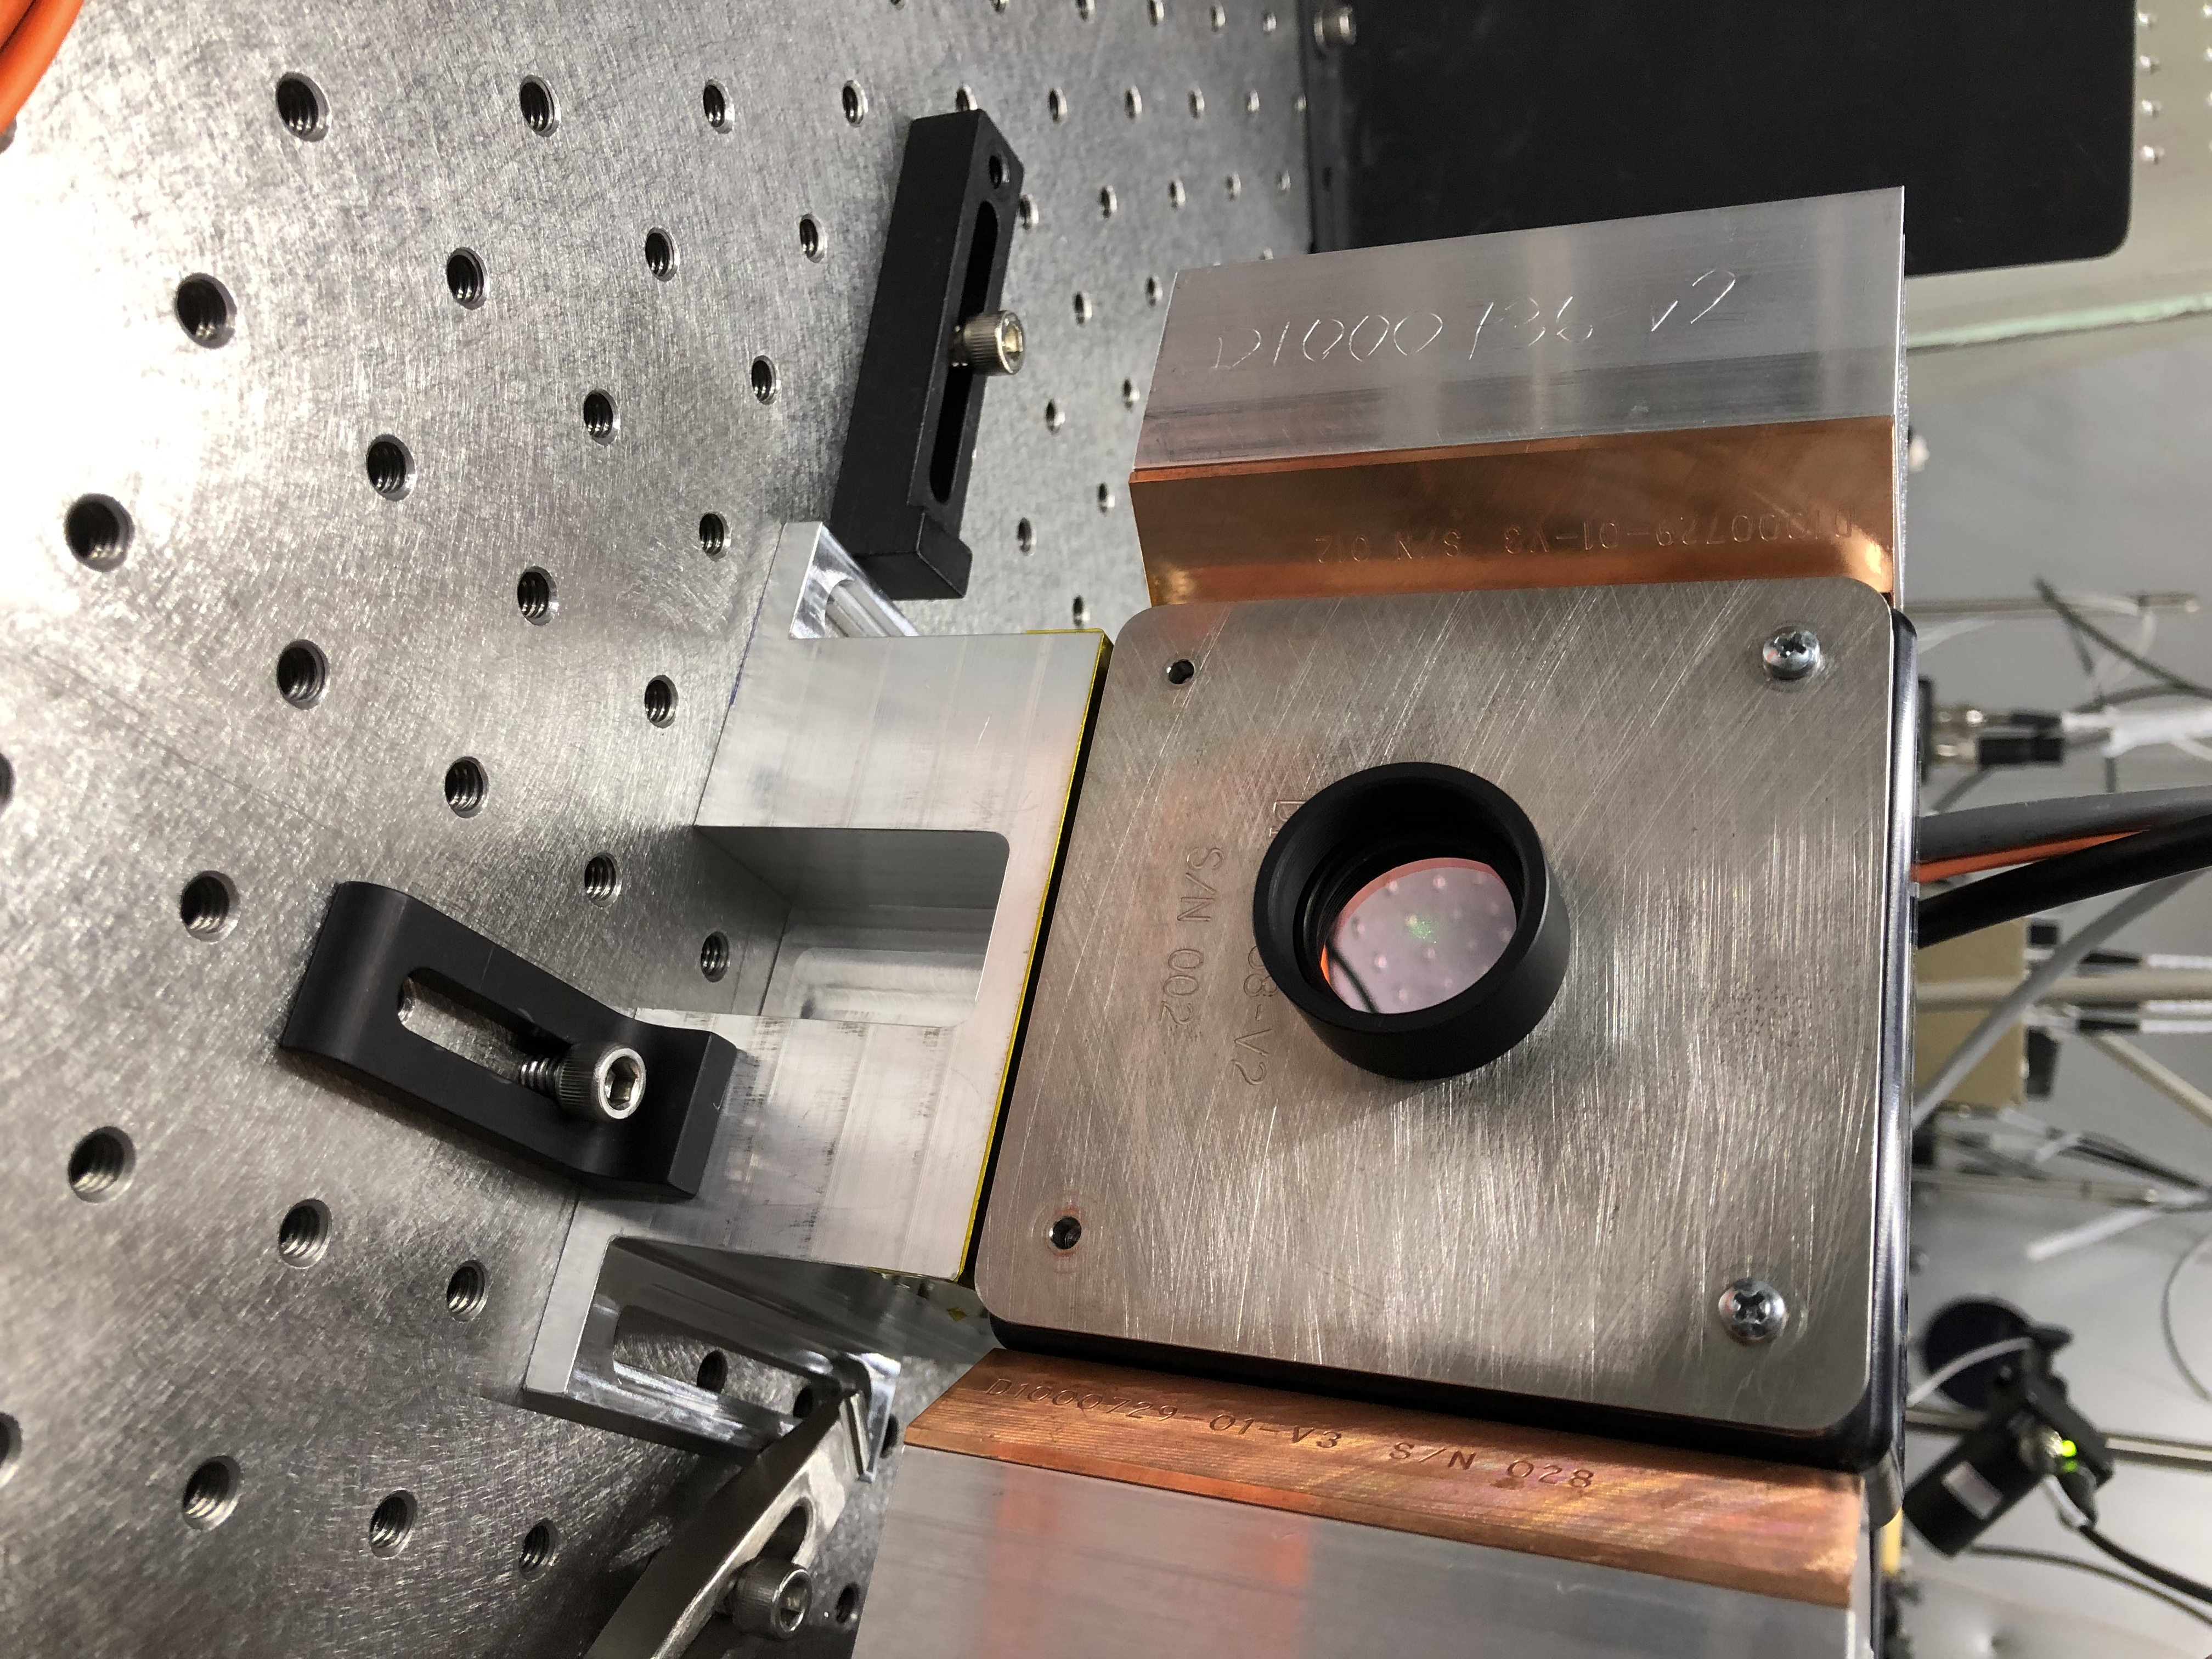
This filter has not fixed the issue with the lensing being negative on powerup on ETMY
A quick update on Maintenance Tuesday: Due to issues with the PSL FSS and SEI/ASC model changes, the nominal start of recovery is delayed. Teams are working as best they can to solve the current issues and IFO recovery will begin as soon as possible.
This continues an investigation from alog 45157 to look at the DAQ readbacks of the common mode board in reflection. The attached plot shows the channels for a measurement during the long good lock at 30W (GPS 1235030418; UTC 2/24/2019 08:00:00):
| Channel | Gain (dB) |
|---|---|
| LSC-REFL_SERVO_IN1GAIN | +6 |
| LSC-REFL_SUM_A_IN2GAIN | +8 |
| LSC-REFL_SERVO_FASTGAIN | +16 |
| IMC-REFL_SERVO_IN2GAIN | –22 |
| IMC-REFL_SERVO_IN1GAIN | +22 |
| IMC-REFL_SERVO_FASTGAIN | –18 |
Peter F, Sheila
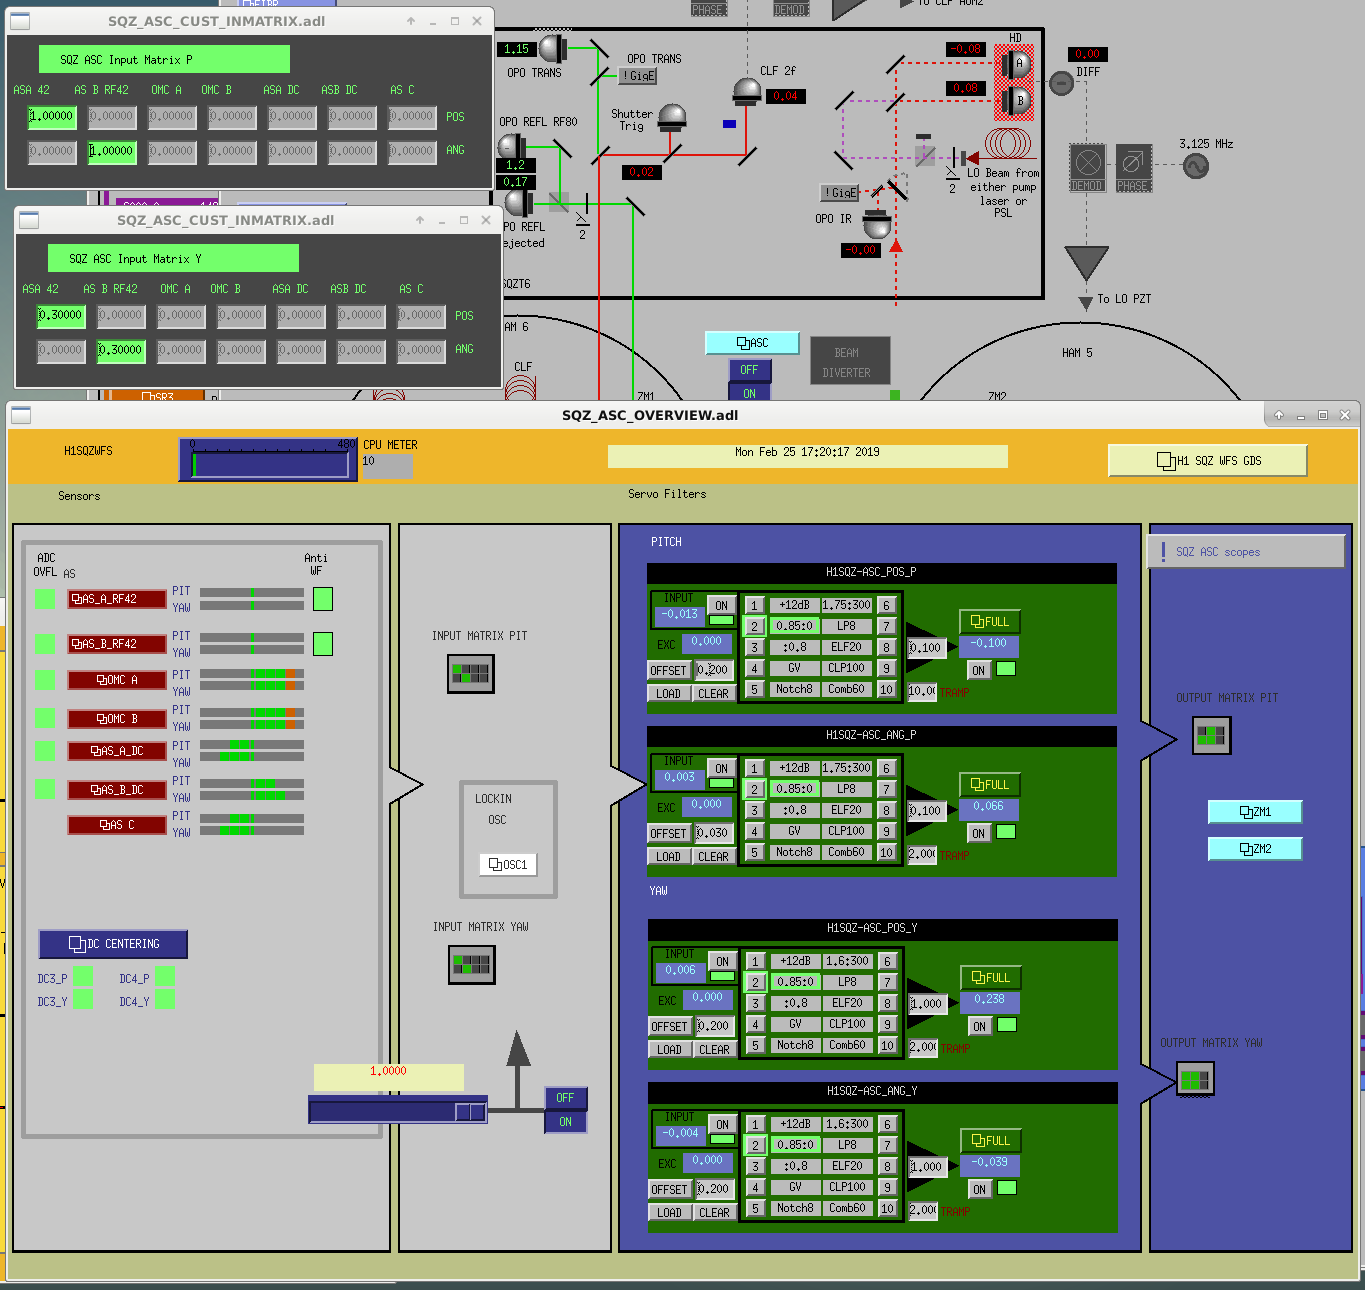
We had a chance to close the AS42 loops this afternoon, which we did with the settings in the attached screenshot. These are low bandwidith loops, but are probably good enough to start with. The pitch loops started to oscillate with a factor of 3 more gain.
This hasn't been added to the guardian yet, and we didn't get a chance to see any impact on squeezing since the interferometer wasn't in low noise when we did this, but we were able to see that the loops increased the 3MHz transmitted through the OMC.
I spent some time this morning trying to get the full IFO to match the beam spot from Saturday (alog 47101) that seemed to be mostly away from the big point absorber on ITMY. This new candidate position is about 9.7 mmm low-of-center on ITMY, whereas the previous nominal position was 9.9 mm high-of-center.
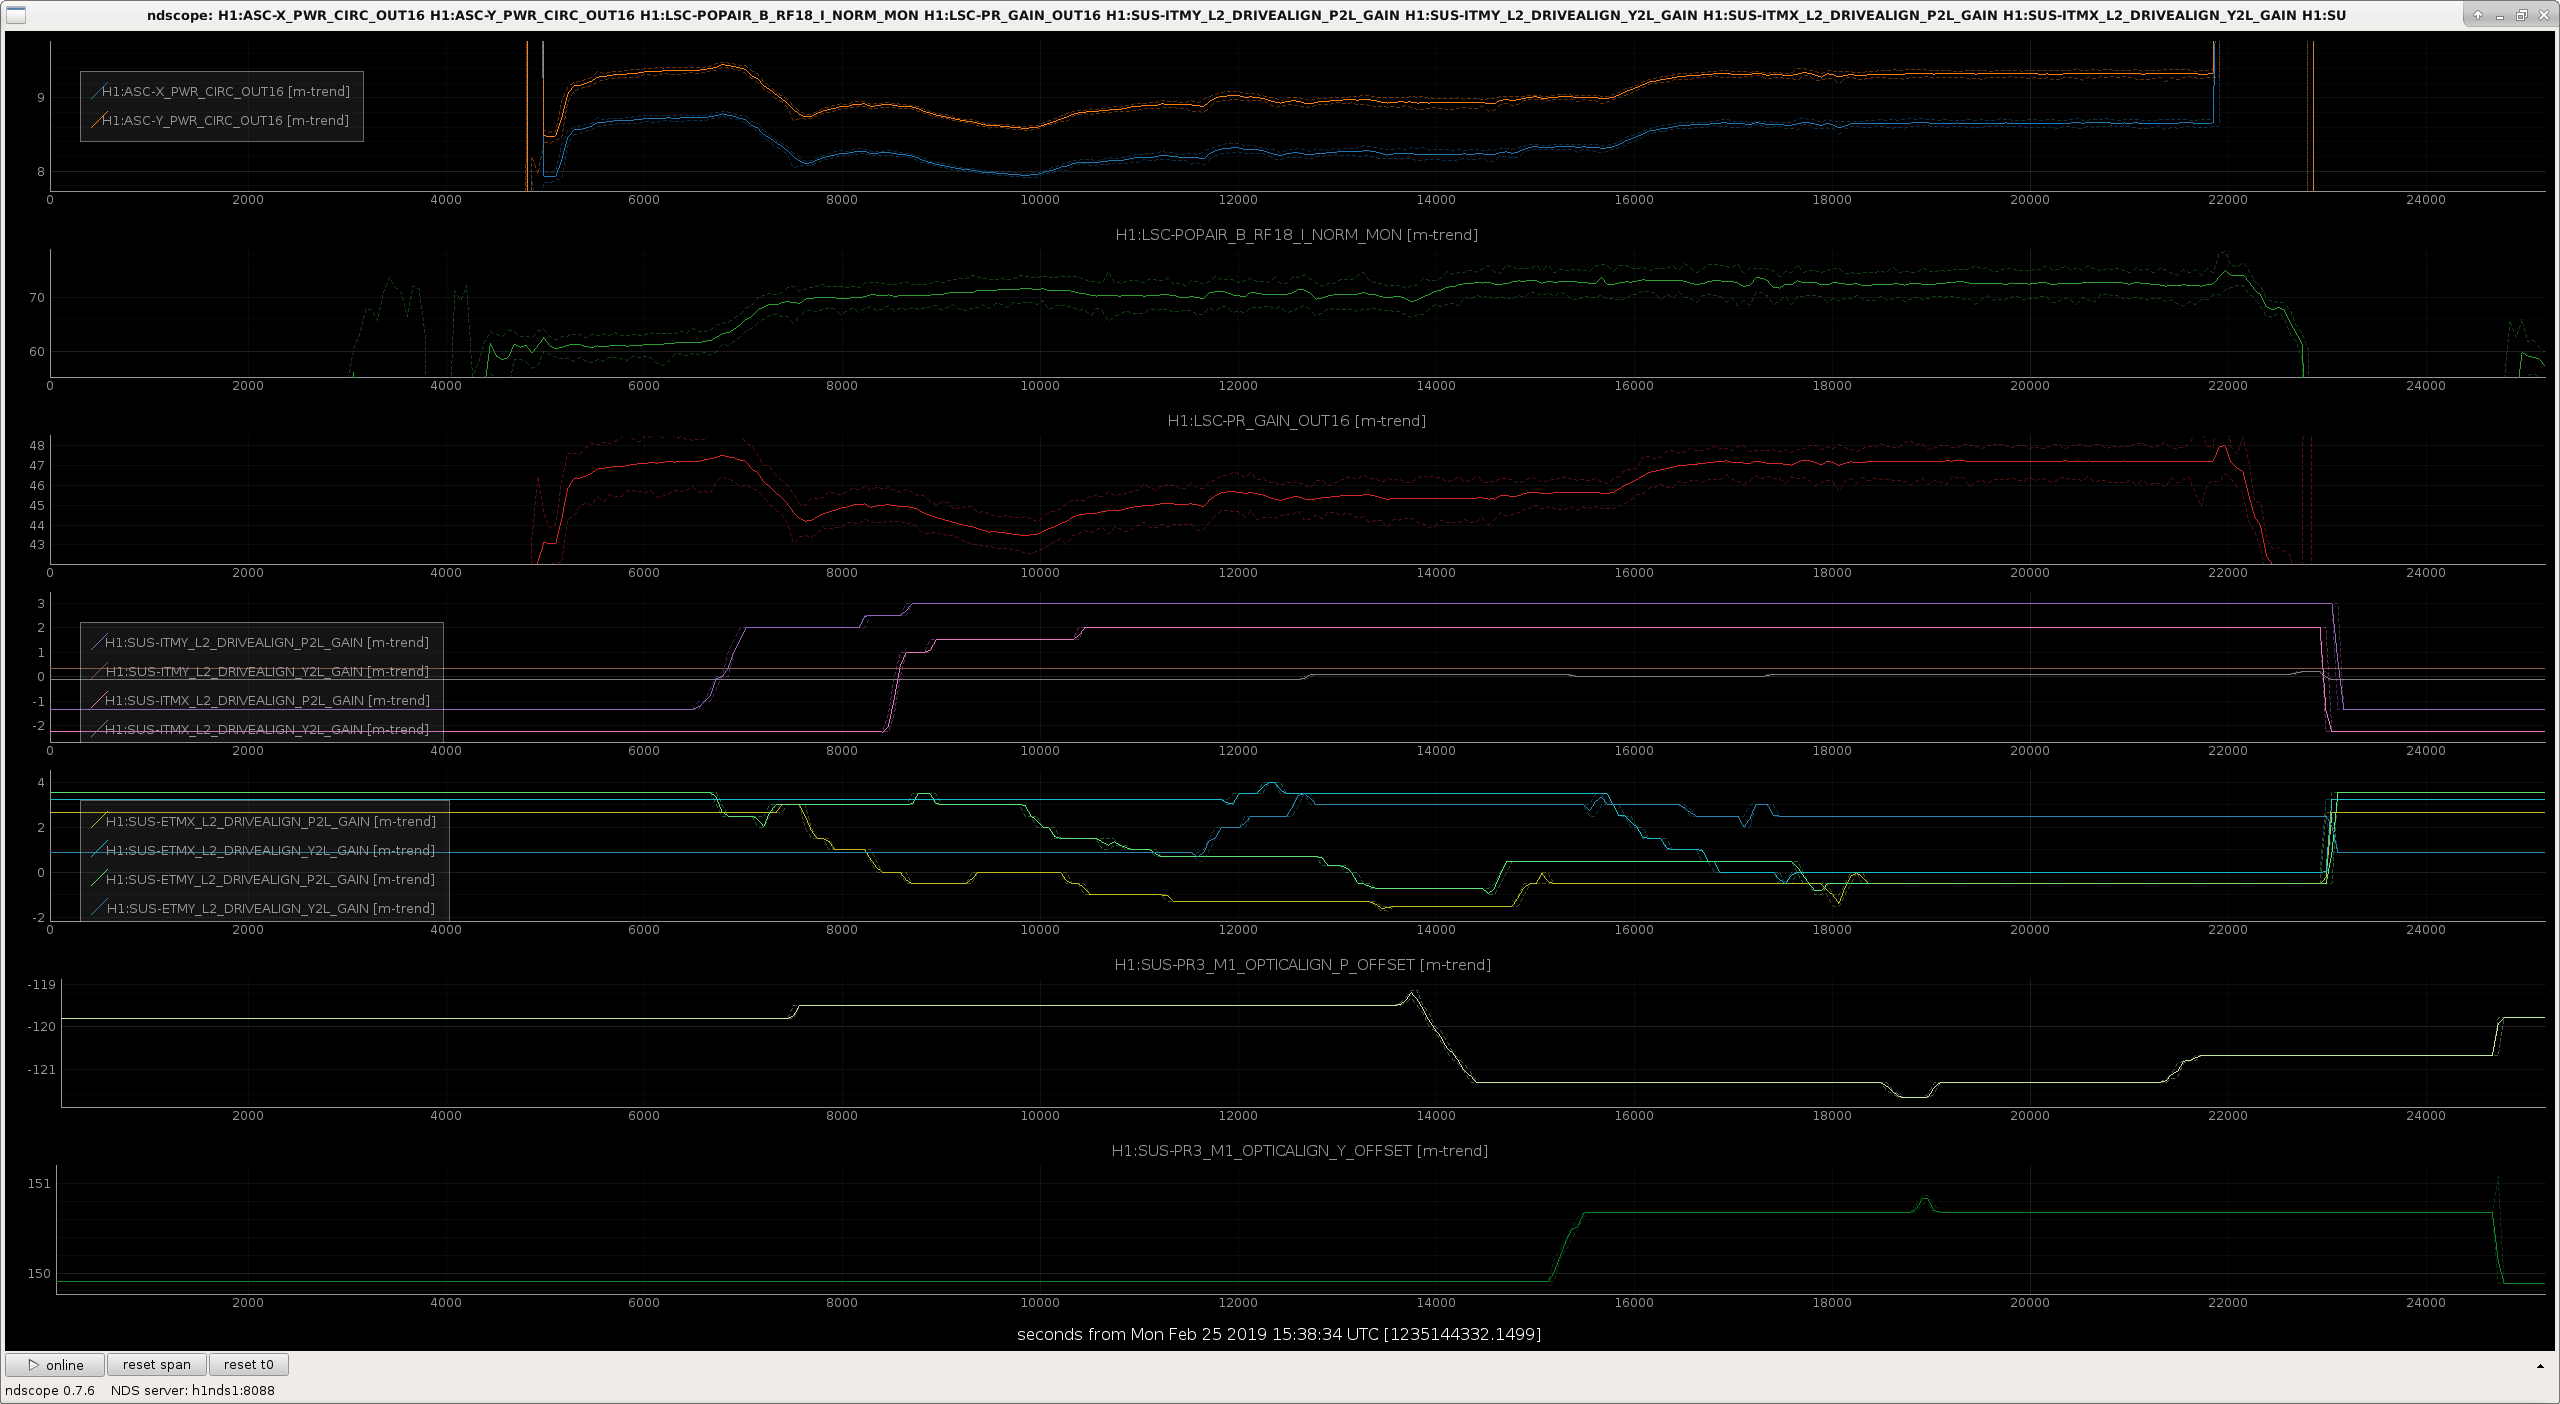
In the attached first figure, we are locked at 2W DC readout starting at about 5000 seconds. A little after 6000 seconds, I start moving ITMY's spot position by changing its A2L gain. You can see that the POP18 buildup went from its usual value of 60-ish counts up to 70-ish. However, the power recycling gain and the buildups in the arm cavities had decreased. I moved the ETM spots by changing their A2L gains, and I also moved PR3 to try to get the PRC axis nicely aligned with my best arm axes. This brought the carrier buildups back to about where they had started, and also increased the POP18 a little bit more.
Around 22,000 seconds I started increasing the laser power, first to 10 W, then in steps of 5 W. The POP18 buildup didn't seem to go down quite as fast as it has in the past, which would be consistent with having avoided the ITMY point absorber. However, the carrier buildups went down much faster than usual. Afterward, Dan found that it looks like I accidentally put the ETMX beam spot right on top of its point absorber. Since I was doing my alignment at 2W, the absorber on ETMX wasn't bothering me, so I didn't realize that I should avoid it. This is likely the reason that the carrier buildups went down so drastically.
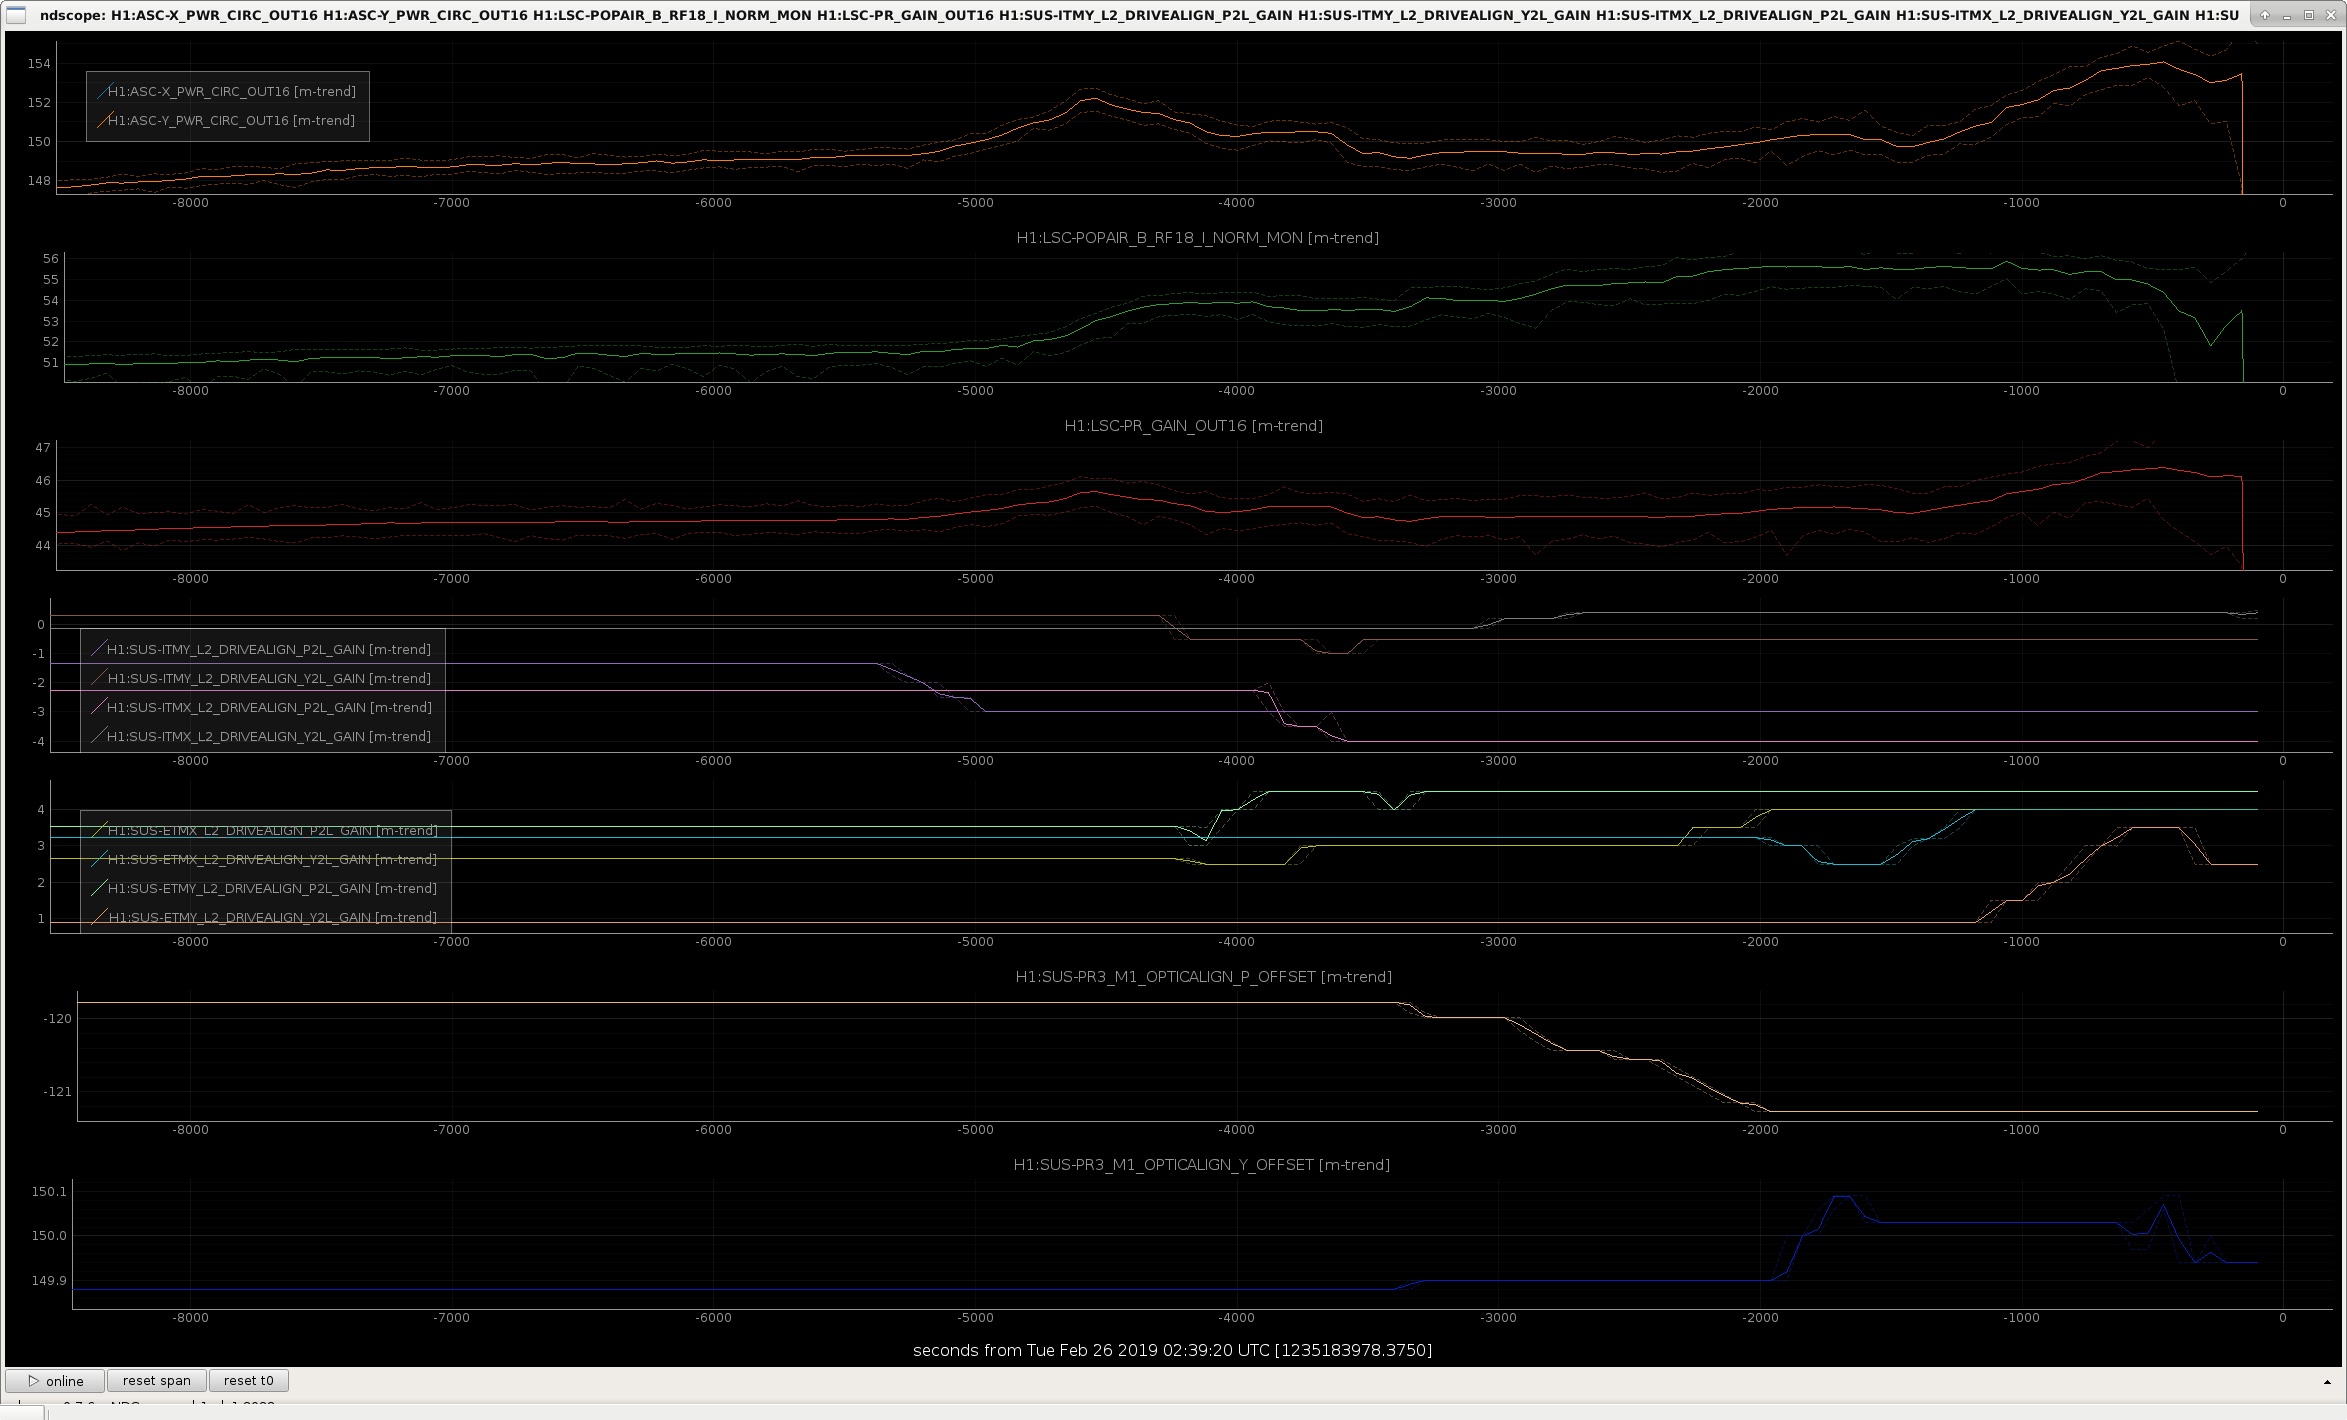
In the afternoon, Dan and I decided to try the ITMY spot that is even higher of center than the point absorber, since this location had given us better carrier buildups on Saturday. Note that in the second attached figure, we started moving spots while already locked at 30W, so the POP18 and PR gain look lower than in the first figure which was at 2W. In this second figure you can see that I started moving ITMY's A2L gains at around -5500 seconds. Before that time, the PR gain was less than 45, the POP18 buildup was less than 52, and the Yarm's circulating power was around 149 kW. After the spot moves, I had the power recycling gain above 46, the POP18 buildup about 55.5, and the Yarm circulating power just barely at 154 kW. So, that's an extra 5 kW circulating in the arms. We seemed really stable for most of this moving, but at the very end something started ringing up in ASC, mostly Yaw although also Pitch, and I couldn't recover, despite trying to move some things back a few steps (ETMY Y2L gain and PR3 yaw slider). The oscillation was at the 0.49 Hz frequency that we often associate with dP/dTheta. I think the oscillation itself was mostly under control, but the noise in DARM got high enough that it was drowning out the ADS signals, so the arms and PRC started moving around a lot.
To relock: We wanted to keep these A2L gains, so we moved PR3 back to it's original position according to sliders (about -119.8 pit and 149.8 yaw), then locked DRMI, and got to ENGAGE_ASC_FOR_FULL_IFO. During this state, I moved PR3 back to where we had it at high power last lock. The ADS loops moved the rest of the degrees of freedom to put the spots where we had them. So far, we were able to power back up to 30W with this situation. POP18 has stayed fairly flat during the power up and after 10 minutes of thermalization (yay!), and the carrier recycling gain and arm buildups are increasing as we thermalize (also yay!). The POPX PZT is unhappy, but seems to be doing better at 30W as our loops converge. I changed the checker in ENGAGE_ASC_FOR_FULL_IFO to let you pass with a notification if the centering of the spot isn't too bad. Formerly, it would just Return False if you were at all mis-centered.
If we decide we like these positions (I think we will), then we're going to have to move the green initial alignment setpoints, the ALS beatnote paths on ISCT1, and perhaps also relieve the POPX PZT.
Other locking notes:
I made some attempts are moving the spot positions in yaw, however every move I made resulted in a ~0.6Hz ring up that looked like it was coming from DHARD yaw. I managed to get a few extra kW in the arms but nothing significant. The IFO did not want to lock with these positions either and failed whilst waiting for the soft loops to converge.
I put the loops back and waited a while in ENGAGE_ASC_FOR_FULL_IFO before continuing, seemed to lock fine.
After powering up and thermalizing POPX picos were railed in pitch still. I moved PR3 pitch up a bit so it wasn't and so far the IFO locks fine by itself, no need to adjust PR3 to get ALS past LOCKING_ALS.
[M. Wade, G. Mendell, A. Viets]
I restarted the GDS testing calibration pipeline on the testing machine h1dmt3 around GPS time 1235188273. This restart picked up gstlal-calibration-1.2.8. Hopefully the results of the testing pipeline start to show up soon on the calibration testing tab of the summary pages.
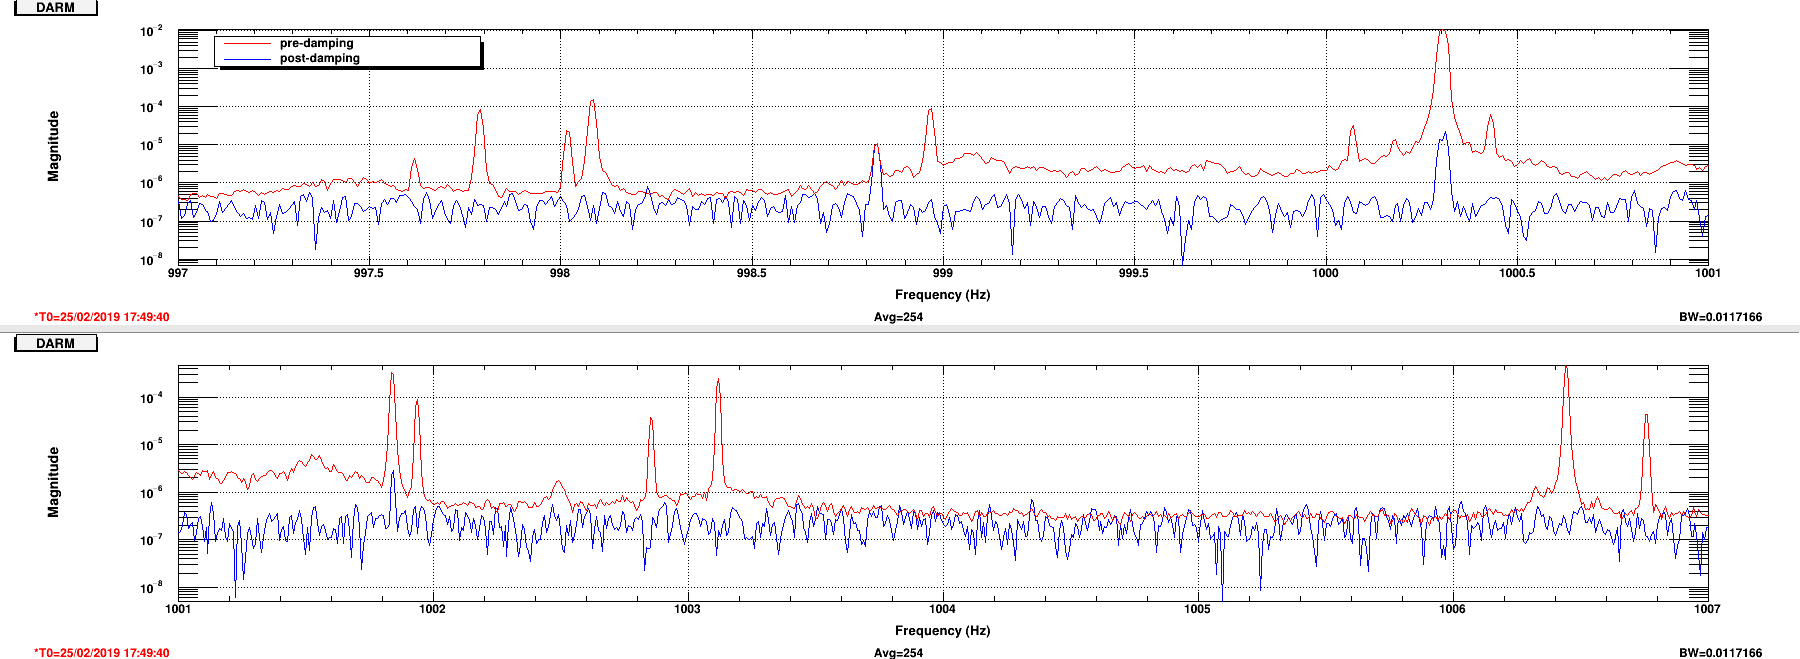
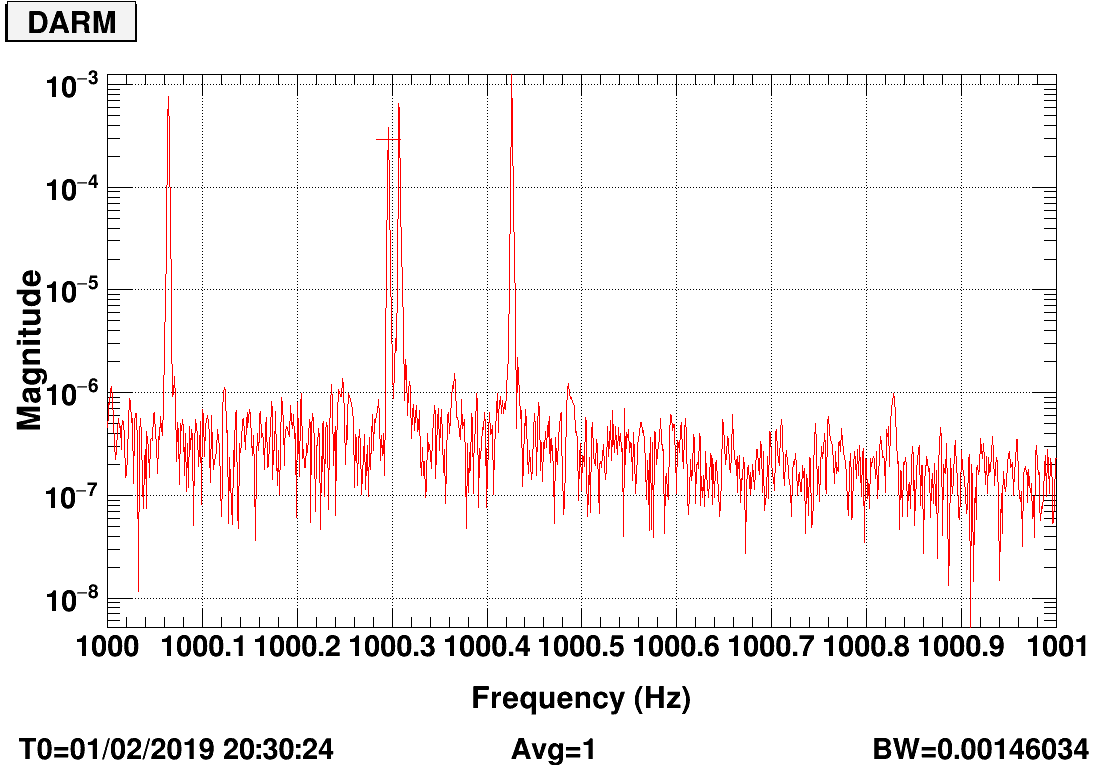
I examined the violin mode at about 1000.3Hz using a high frequency resolution, and found that it is actually 2 violin modes, both on ETMY, located at 1000.2936Hz and 1000.307Hz. I have created damping filters for these in ETMY mode 18 and ETMY mode 20, respectively. ETMY has 4 violin modes within the space of about 0.3Hz, and today I managed to damp all 4 of them simultaneously, as well as several modes at higher frequencies, as shown in the attachment. The settings that worked today were: ETMY Mode 11: 180 degrees, gain = 200 ETMY Mode 18: 270 degrees, gain = 30 ETMY Mode 20: 90 degrees, gain = 12 ETMY Mode 12, 300 degrees, gain = 100. It should be noted that when Mode 18 runs without the others running, it drives all 3 of them up, and when Mode 20 runs without Mode 18, it drives up Mode 18 as well. So it is best to run all 4 of the damping filters. There appears to be a violin mode at 998.82Hz. I have attempted to damp all 4 test masses at this frequency, at 90 degrees phase, with gain = 25, and have seen no change either positive or negative. I then repeated this for both ETMY and ITMX length, pitch, and yaw, with gain = 150 and phase = 90 degrees, and again had no change. I plan to change the phase and try the other two masses, but the possibility exists that this is actually not a violin mode, or doesn't couple well to any of our actuation degrees of freedom. I have created the following monitor filters: ITMX Mode 19 at frequency 998.019Hz ITMY Mode 19 at frequency 997.613Hz ETMY Mode 18 at frequency 1000.294Hz ETMY Mode 20 at frequency 1000.307Hz. I have modified the following monitor filters to make them better match the violin mode locations at higher frequency resolution: ITMX Mode 13 from 998.09Hz to 998.083Hz ITMY Mode 16 from 997.78Hz to 997.785Hz ETMY Mode 11 from 1000.44Hz to 1000.423Hz ETMY Mode 12 from 1000.06Hz to 1000.061Hz. I made the following changes to the damping filter bank to make them better match the violin mode frequencies: ETMX Mode 13 from 1010.4Hz to 1010.356Hz ETMX Mode 14 from 1010.59Hz to 1010.581Hz ETMY Mode 13 from 1009.94 to 1009.932Hz.
TITLE: 02/25 Day Shift: 16:00-00:00 UTC (08:00-16:00 PST), all times posted in UTC
STATE of H1: Commissioning
INCOMING OPERATOR: None
SHIFT SUMMARY: Commissioning continues. Snowing on site and an early release from the Hanford site. I have needed to toggle the noise eater on ALS X in order to get it to lock. Without it, it will oscillate and glitch.
LOG:
1655 Nutsinee to LVEA ISCT6
1748 Nutsinee out
1820 Nutsinee back out to LVEA ISCT6
1825 Karen to MY
1830 Chandra and vendors heading to MY (3 cars)
1836 Nutsinee out
1901 Danny, Dan to EX to turn on HWS
1914 Karen leaving MY
1920 Danny, Dan back
1924 Chandra and Pfeifer crew leaving one person at MY and the rest heading to MX
2306 Nutsinee to LVEA ISCT6
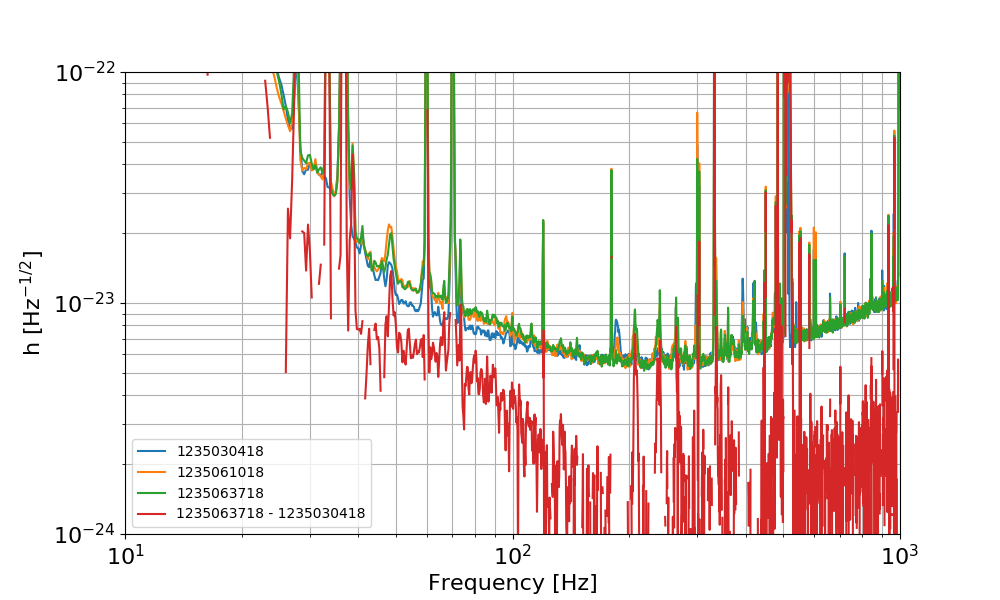
Looking at the range plot in the summary pages, there was a clear degradation of the sensitivity over time during the last long lock.
I picked the three times highlighted with the arrows and compared the sensitivity spectra. In the plot below the GDS-CALIB_STRAIN spectrum is shown for the three times, as well as the quadrature difference of the last and first spectra (the worst and the best).
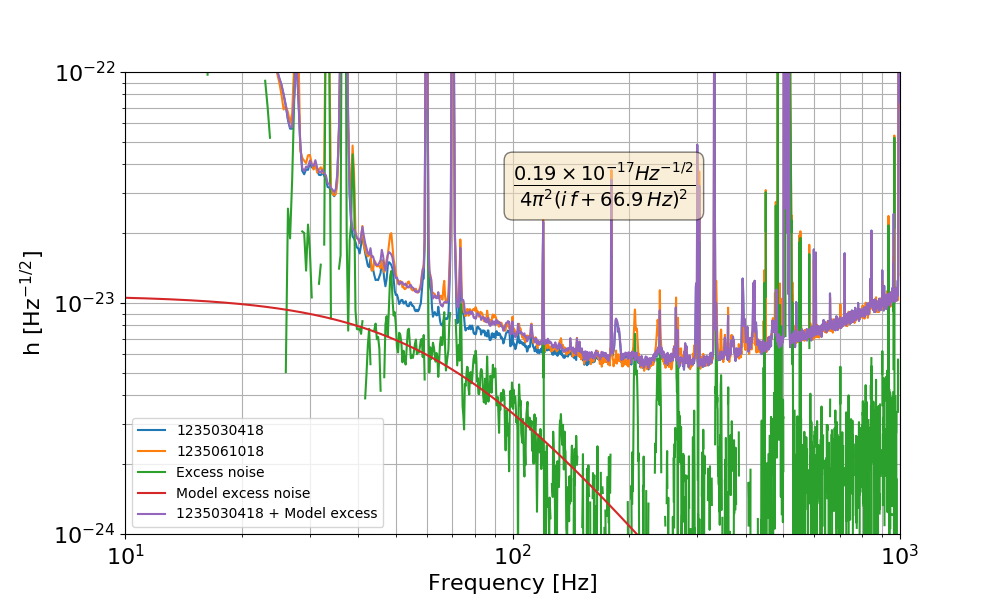
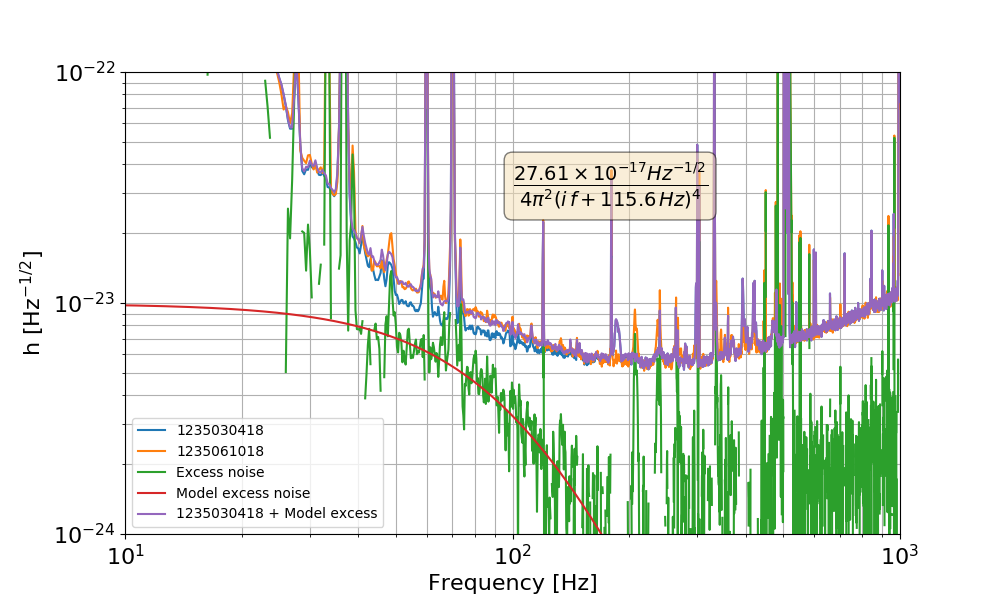
I tried to see what kind of noise is needed to explain the sensitivity worsening. I modeled the excess noise as a double real pole and fit it to the data. The result is shown below: the excess noise is quite well described by a double real pole at about 67 Hz. Note: the optimal fit parameters are obtained by minimizing the difference between the worst PSD and the best PSD + excess noise, summing over all frequencies between 40 and 200 Hz. However, the noise can be similarly be described by any function with a steep enough cut-off at 50-100 Hz. For example, using four simple poles at about 120 Hz. maybe scattered light? That's a process that can give steep roll-offs like this. No strong evidence.
BruCo scans of the first two periods are in progress.
BruCo scans for "good" and "bad" times are ready:
Good: https://ldas-jobs.ligo.caltech.edu/~gabriele.vajente/bruco_lho_1235030418/
Bad: https://ldas-jobs.ligo.caltech.edu/~gabriele.vajente/bruco_lho_1235061018/
Nothing has significantly more coherence in the bad times than in the good times...
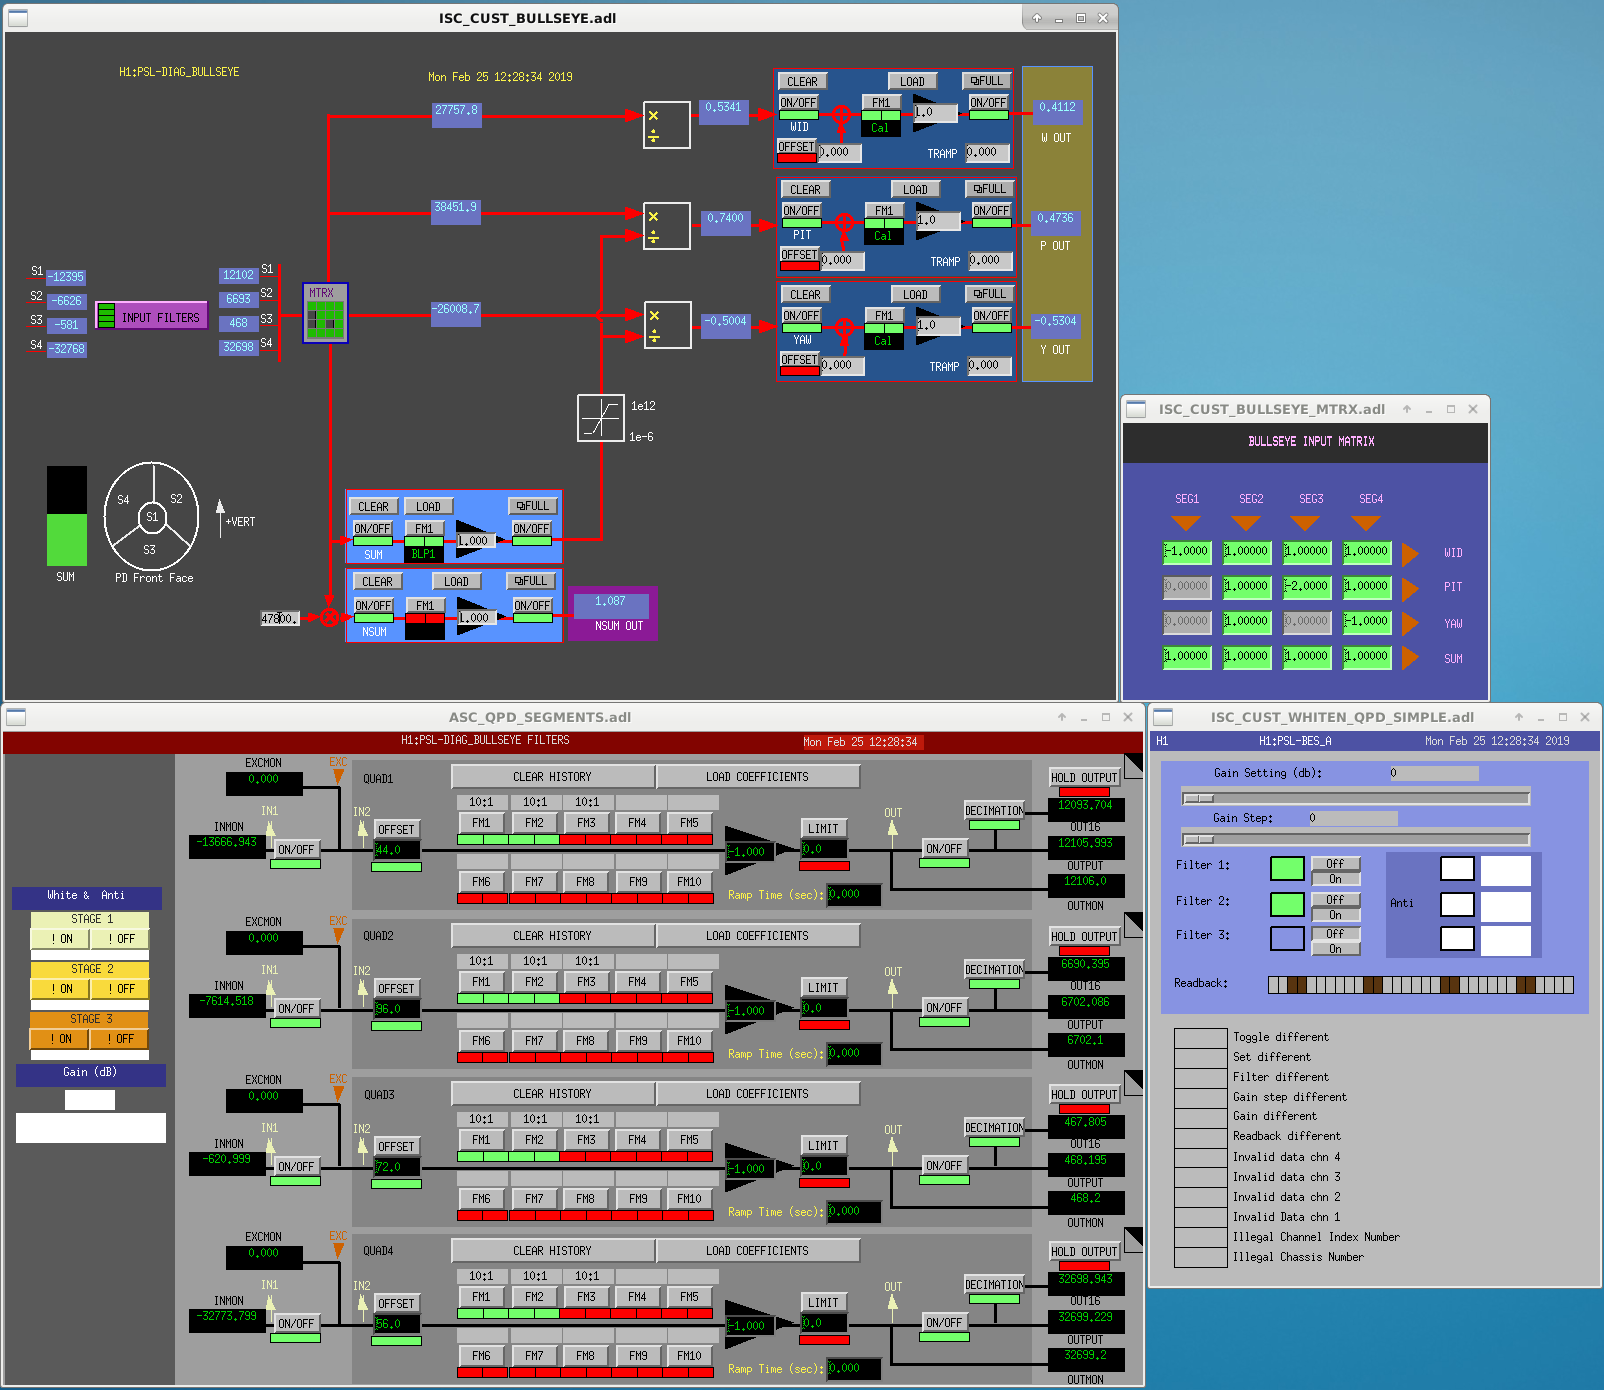
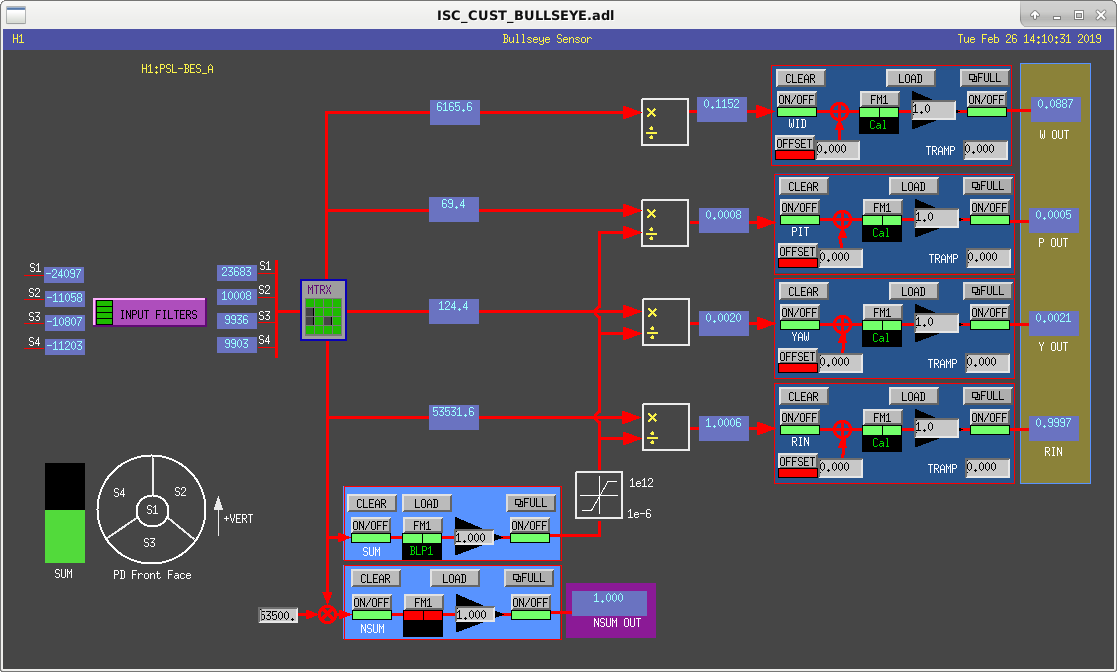
An investigation to why the bullseye sensor wasn't working revealed that the cable was disconnected near the MC2_TRANS whitening chassis. A Y-cable is used to add the bullseye channels to this chassis. There maybe two reasons for this: (1) the bullseye cable coming from the PSL is labeled BSC3-CPS-TIMING (sic!) and (2) the DB9 cable connection was free hanging without locknuts. So, the cable may just have fallen out on its own back on 11/10/18. I reconnected the cable and added the locknuts.
In some placed the channels are named PSL-BES_A in other places it is PSL-DIAG_BULLSEYE. Made them all consistent with the former.
The light is currently not centered on the bullseye and one segment is saturating.
The bullseye sensor is fully functional again thanks to the alignment of Peter & Jason, and a new ASC model by Dave.
The medm screens have been updated. The whitening of the input segments is now working as expected, and a RIN channel was added.
Spectra
Commissioning update: Longer locks hitting 100Mpc seems to be more common, the ITMX RO OSEM maybe causing some issues.
Tuesday:
Fac - EX is now accessible for nitrogen delivery tomorrow. EY will need some plowing, starting this morning.
HFD will be on site.
Vac - Vendor starting work at MY, but also checking spots in most buildings but not VEAs. This work will continue all week.
MY electronics finish.
PEM - Moving magnetometers to many locations.
PCal - EY measurement.
CDS - ITMX RO OSEM investigation.
Model restarts: SEI (see below), h1sqz, h1asc, EY Beckhoff
SEI - h1hpi/h1isi(ey/ex)/h1seiproc models restart. DAQ restart needed as well. (Take all platforms to safe state.)
HEPI accumulator quarterly check, platforms will be down.
PSL - Bullseye sensor troubleshooting.
TT FSS box, mirror count.
HWS - Temperature sensor install.
Addressed TCS Chillers (07:43 - 8:50 AM PST today/Mon)
TITLE: 02/25 Day Shift: 16:00-00:00 UTC (08:00-16:00 PST), all times posted in UTC
STATE of H1: Commissioning
OUTGOING OPERATOR: None
CURRENT ENVIRONMENT:
Wind: 14mph Gusts, 10mph 5min avg
Primary useism: 0.08 μm/s
Secondary useism: 0.35 μm/s
QUICK SUMMARY: Commissioning is just starting, attempting to see how restricting this ITMX RO OSEM is.
Craig, Georgia
This afternoon we could not make it through ENGAGE_DRMI_ASC without (1) the verbal alarms saying that IX had saturated, and (2) a 0.5 Hz oscillation ringing up when the beamsplitter oplev servo was turned off.
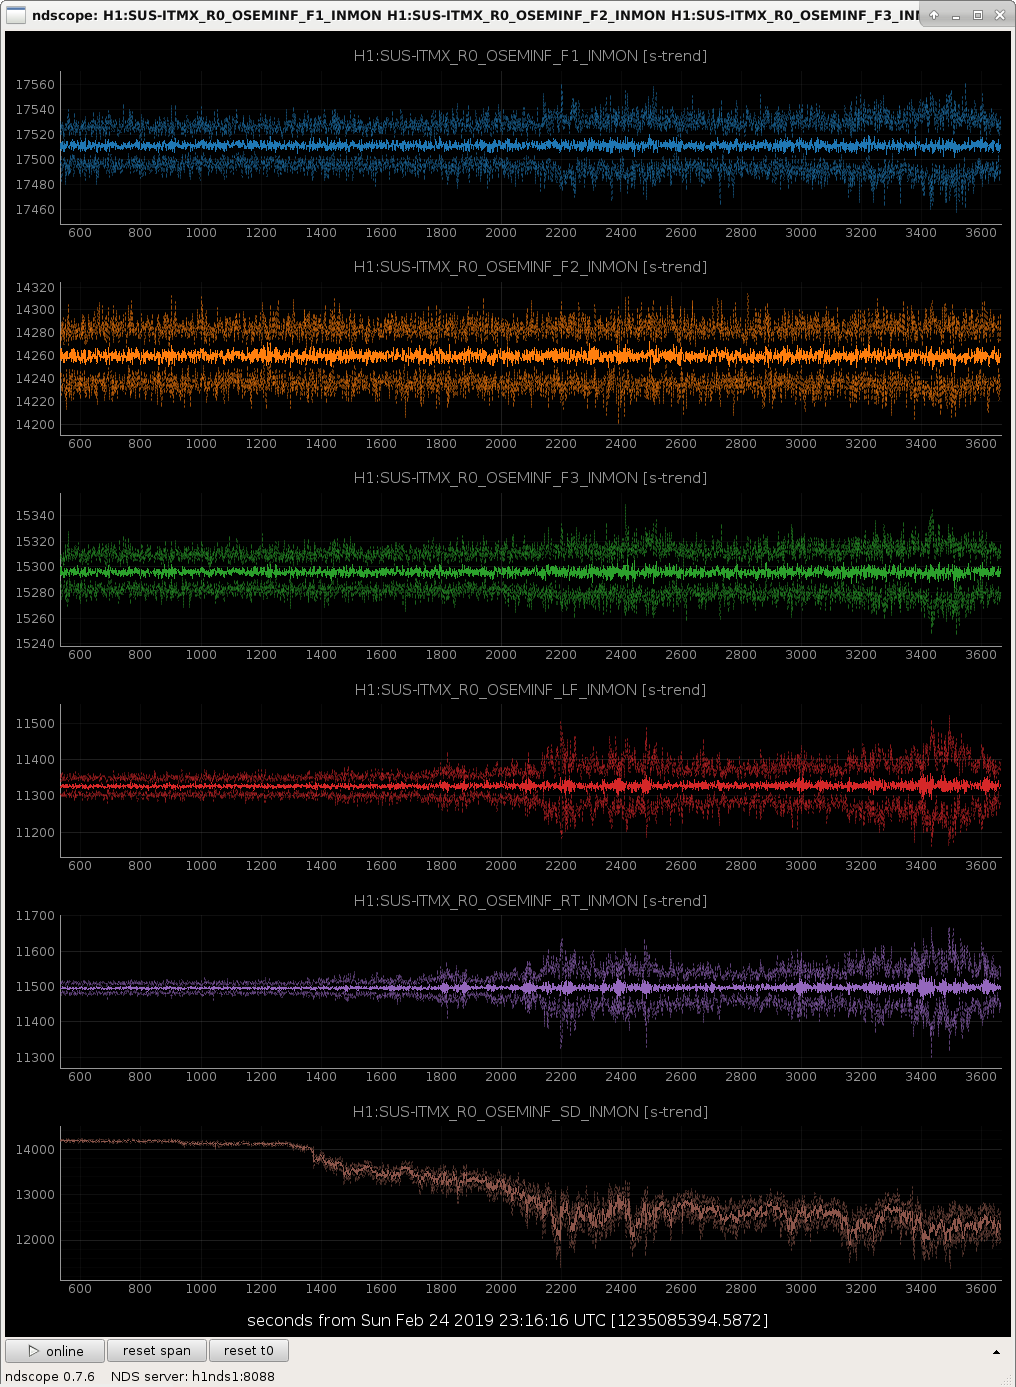
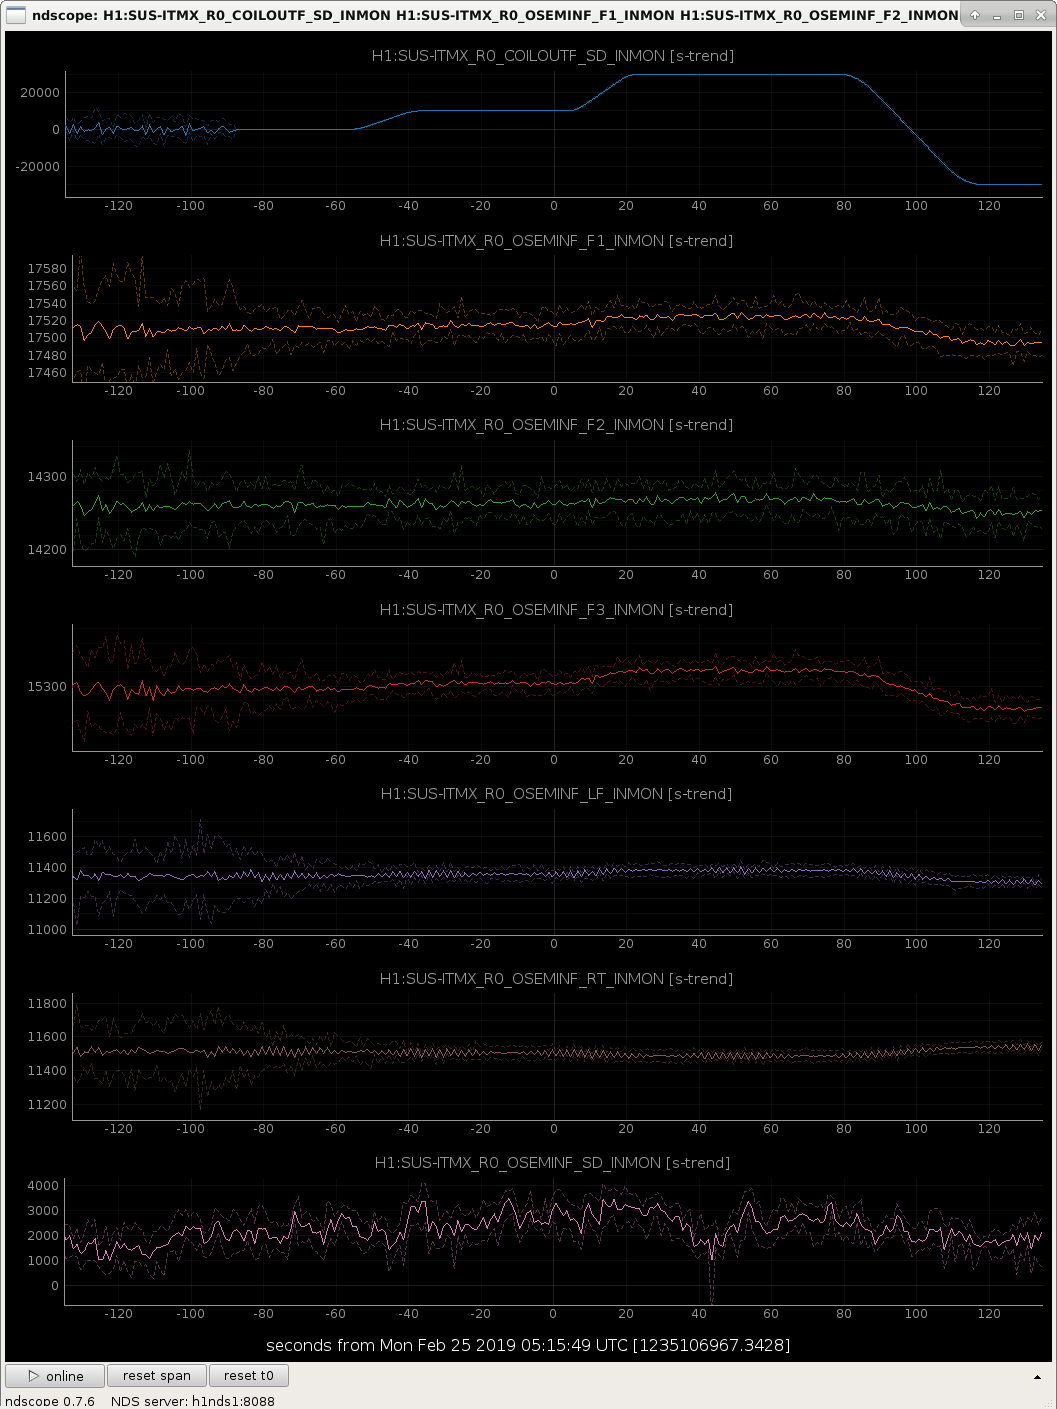
This first problem was baffling since nothing should be feeding back to IX at this early stage in the lock acquisition sequence. We had a look at the ITMX top mass (M0) and reaction chain (R0), and found some strange behaviour on the reaction chain OSEMs. Before we had begun working on alignment this afternoon, while the interferometer was just sitting trying to lock the arms in green, the sensor input of the SD (transverse) OSEM had plummeted, and the noise on the other OSEMs (particularly LF and RT) had increased. First attachment shows inputs to the R0 OSEM input filters at this time. Second attachment shows M0 and R0 master out signals (bottom 3 rows are R0) which go to the coil drivers.
I had a look at the M0 and R0 channels for the other test masses and didn't see anything similar.
We tried adding positive and negative offsets in the test filters, which adds an offset to the coil driver and should be seen in the sensor. We expected that if the we were close to the edge of the shadow sensor, an offset in one direction would be visible in the sensor. Our offsets were not seen in the SD sensor (though there was some coupling to the other sensors) as shown in the third attachment. Does this suggest that the light source for this particular OSEM has died? Or are we missing something?
We also noted that when turning off the damping feedback to this sensor the noise in the other sensors was reduced (visible early in the time series in the third attachment). We have left this feedback off, and managed to reach lownoise_length_control without a problem.
(We never solved the 0.5 Hz oscillation problem when engaging DRMI ASC. We had resolved let the IFO lose lock at this step and work on single bounce RF9 modulation problems, when for no apparent reason we succeeded in locking, got up to lownoise_length_control, and lost lock due to a 4.7 Hz ETMX L2/L3 oscillation that caused many locklosses yesterday.)
An FRS ticket (no. 12410) has been created to look into this issue, the link is given below, https://services.ligo-la.caltech.edu/FRS/show_bug.cgi?id=12410
The channel was responding but was not healthy. Following the signal chain out of the Coil driver to the AA chassis showed healthy signal. Out of the AA chassis to the ADC also looked good. Disconnecting the AA from the ADC showed a -12000 count offset. Dave B. and I then shut down the computer and IO chassis. Brought the system back up and everything seems to be fine. We will have to keep and eye on this.
Danny, Dan
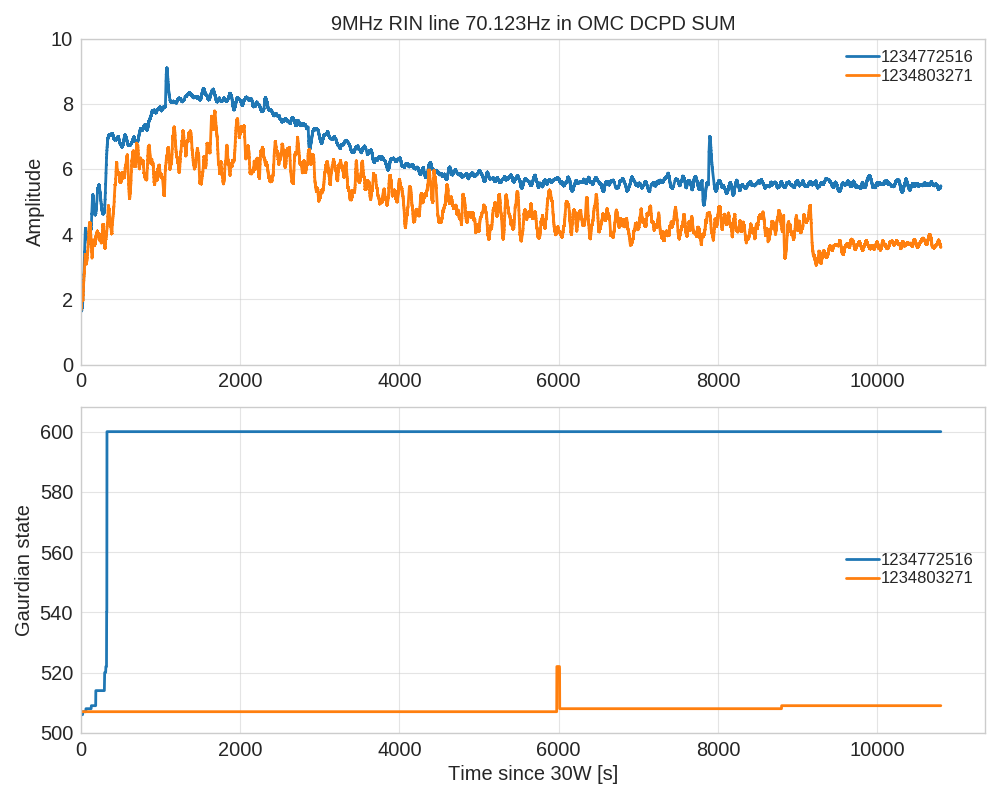
9MHz RIN line over locks
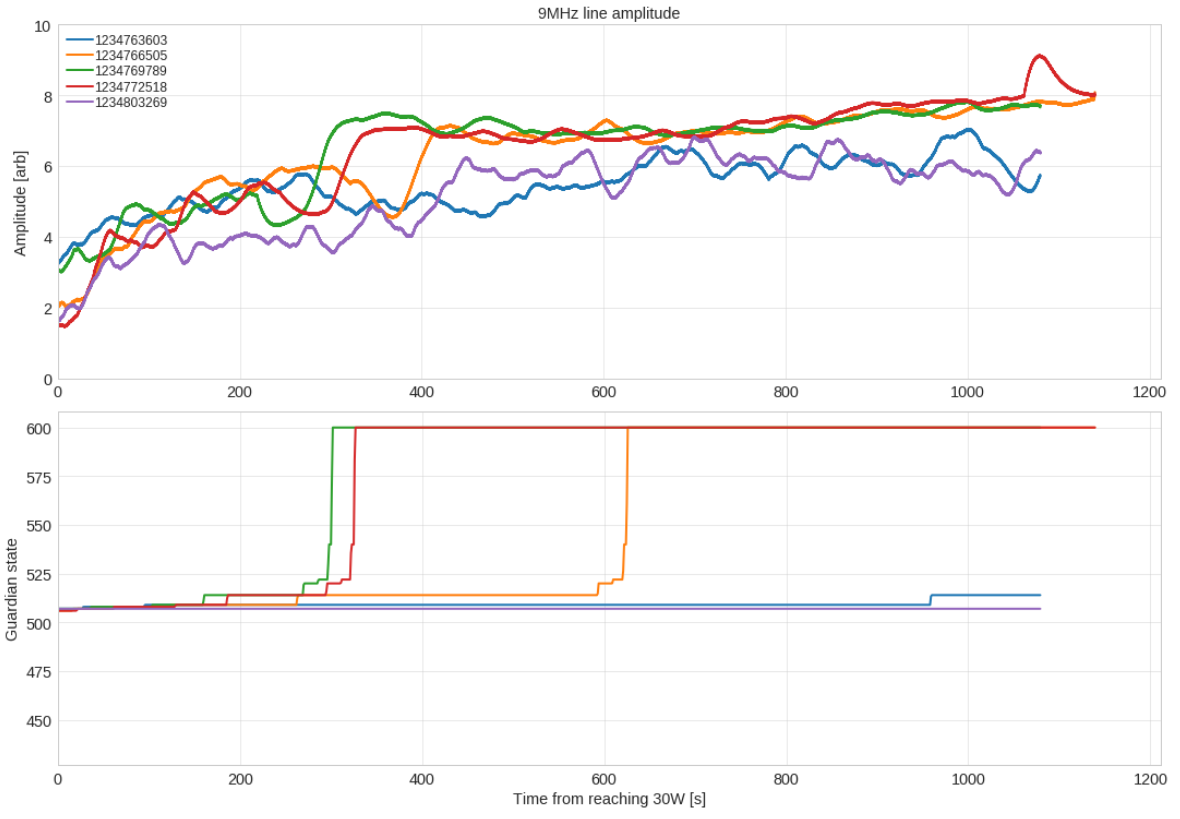
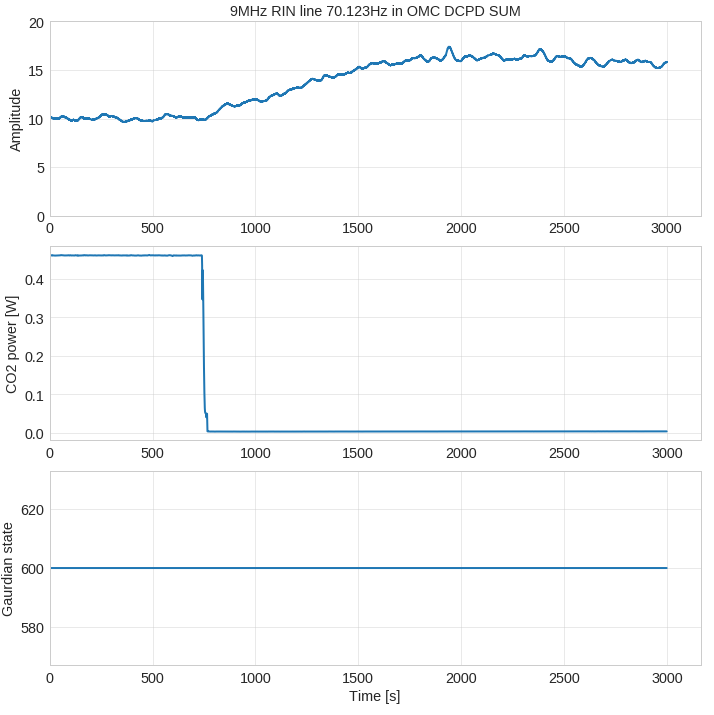
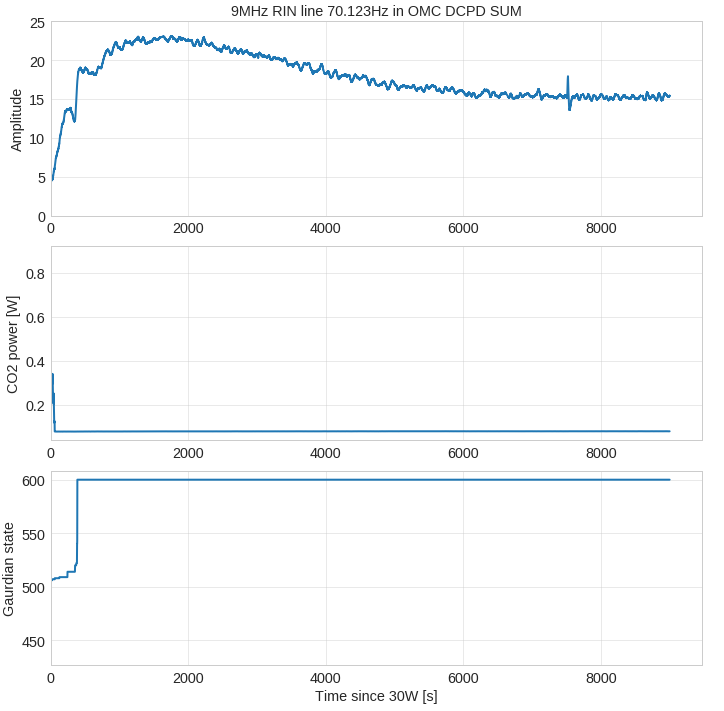
We put a line at 70.123Hz in the 9MHz for a few locks to see how it was behaving over time. When it was one we had a few short locks and two longer ones so far. It seems there are two states in which the coupling finds itself, one that peaks around "8" and another "6". This may coincide with going to LOWNOISE_ESD_ETMX (Guardian state 514) - the jump up in RIN coupling for red/green/orange seems to happen at roughly the same time after we go up to state 514. During the two long locks it's clear there's some long time constant to the RIN coupling, it takes around 4000s after going to 30W for this to settle. So depending on the thermal state we took the RIN measurements previously this might be a reason we got confused.
ITMY Mask
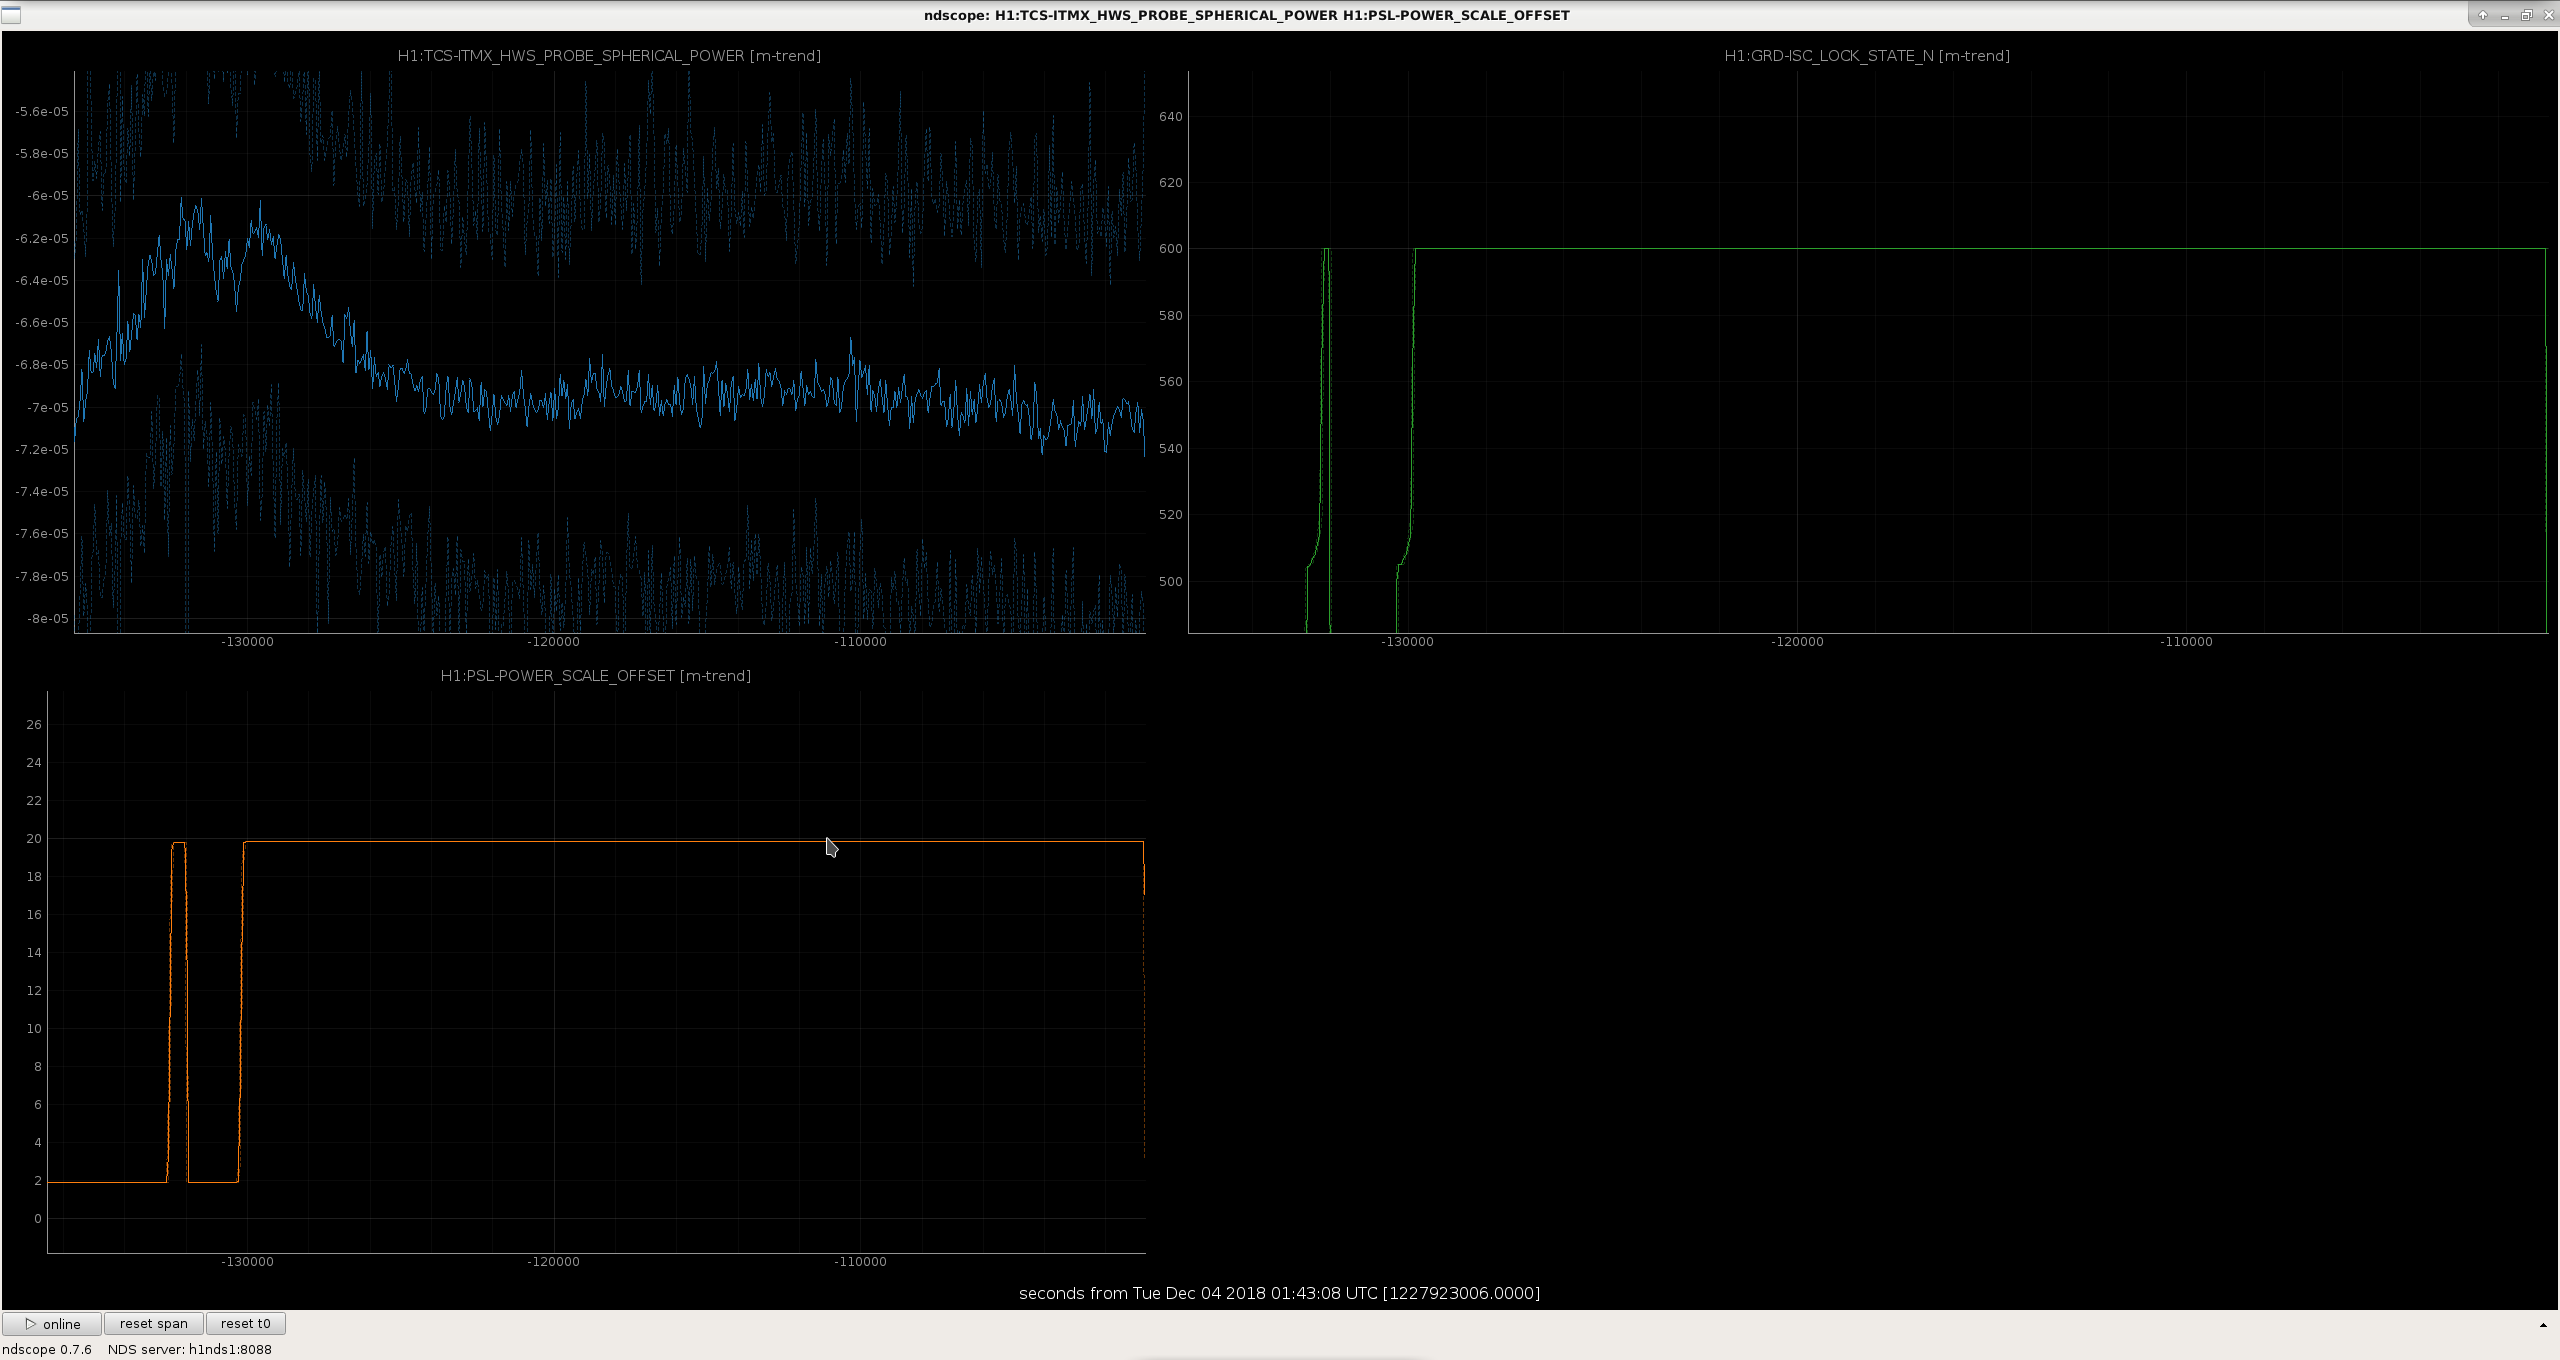
Last night we tried out the ITMY mask. The initial plan was to just apply the mask with the IFO unlocked to see how the induced OPD compared to what we expected. Then as we had the IFO to ourselves we decided to just go for it and try it out in a full lock to see what happened. Edit: this test was just to get the CO2 mask on at the expected power without causing a lockloss, the expected implementation requires changing ring heaters as well which is something to try another day.
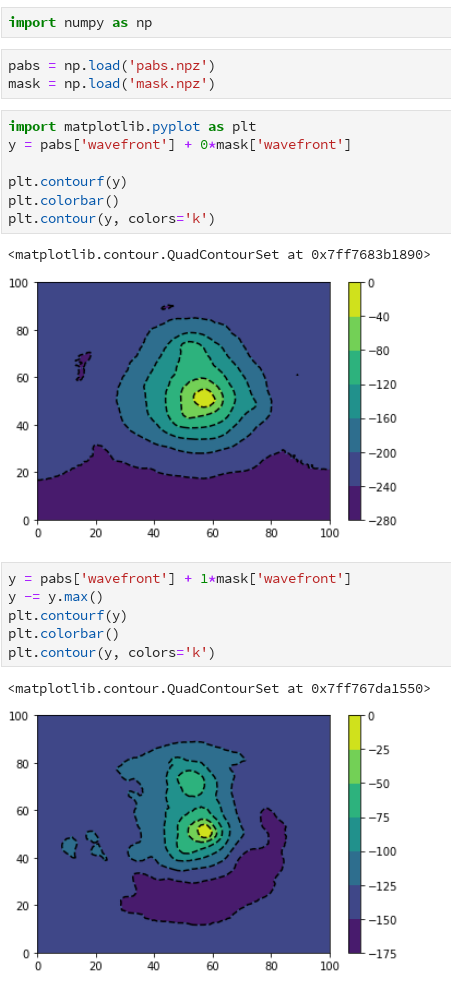
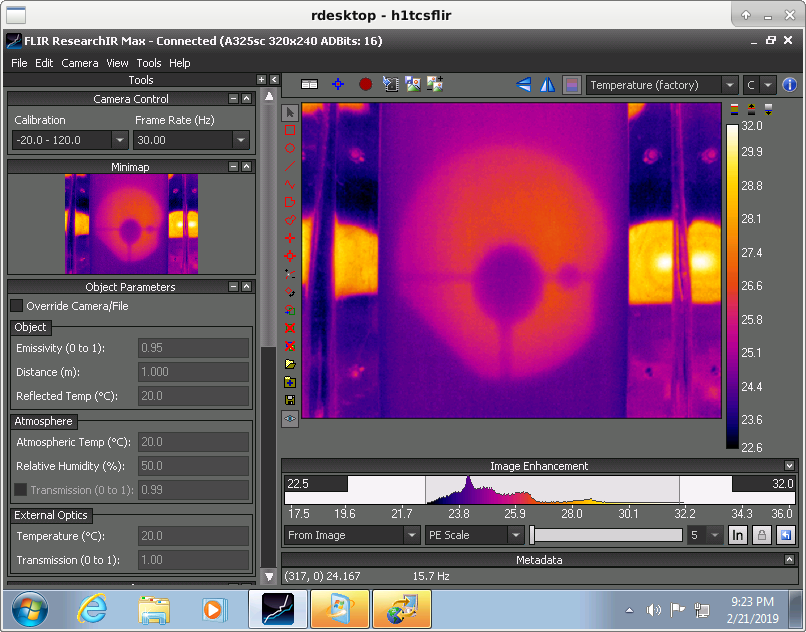
Initially the OPD doesn't look quite like we expected. What isn't obvious is the crescent moon like shape seen in alog 46976 (Top right figure). This could be because the HWS probe beam isn't illuminating the full area so we just see a small section of it. I took the 30W point absorber OPD and added it to the offline mask OPD to get a rough idea of what might be the total effect, from this it reduces the overall optical depth and the larger spatial frequency heating from the absorbers.
From initial inspection the alignment of the minimum is not too far off from the point absorbers, we might want to try shifting the mask slightly in future. However it looked reasonably well aligned enough to try in a full lock.
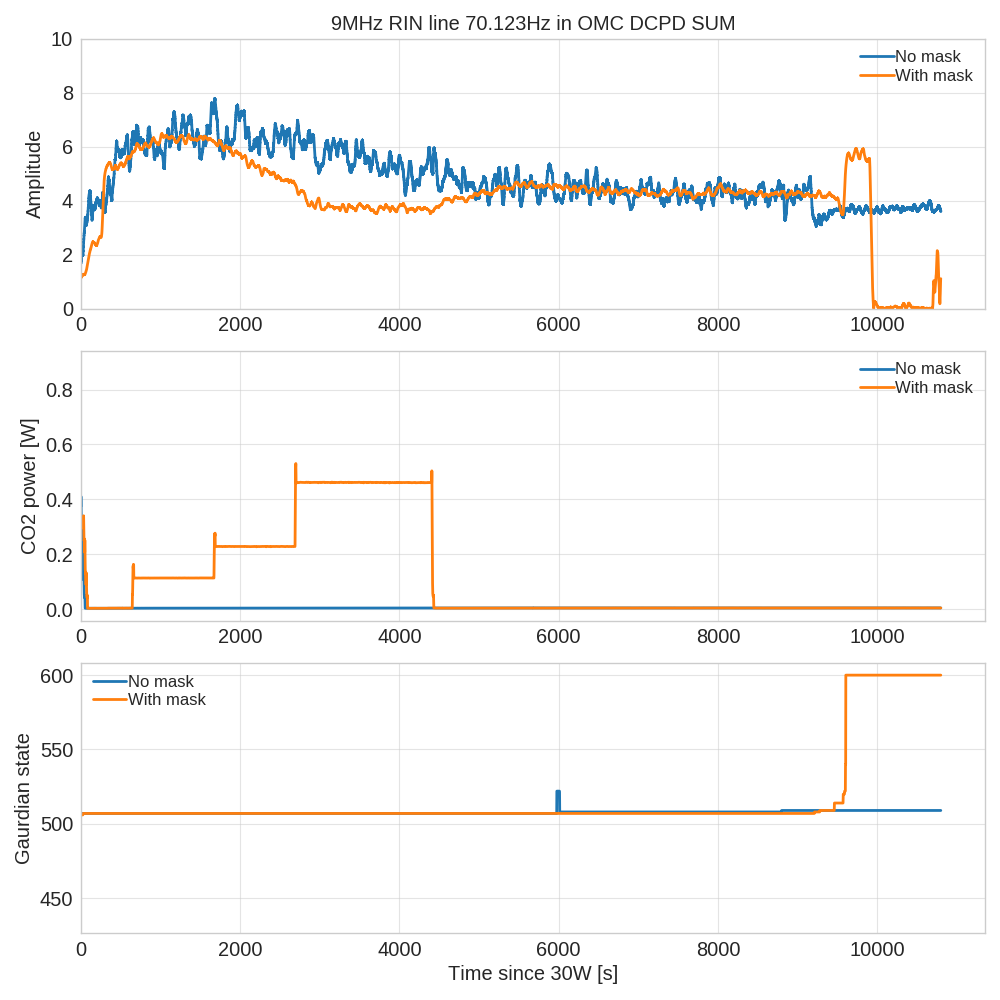
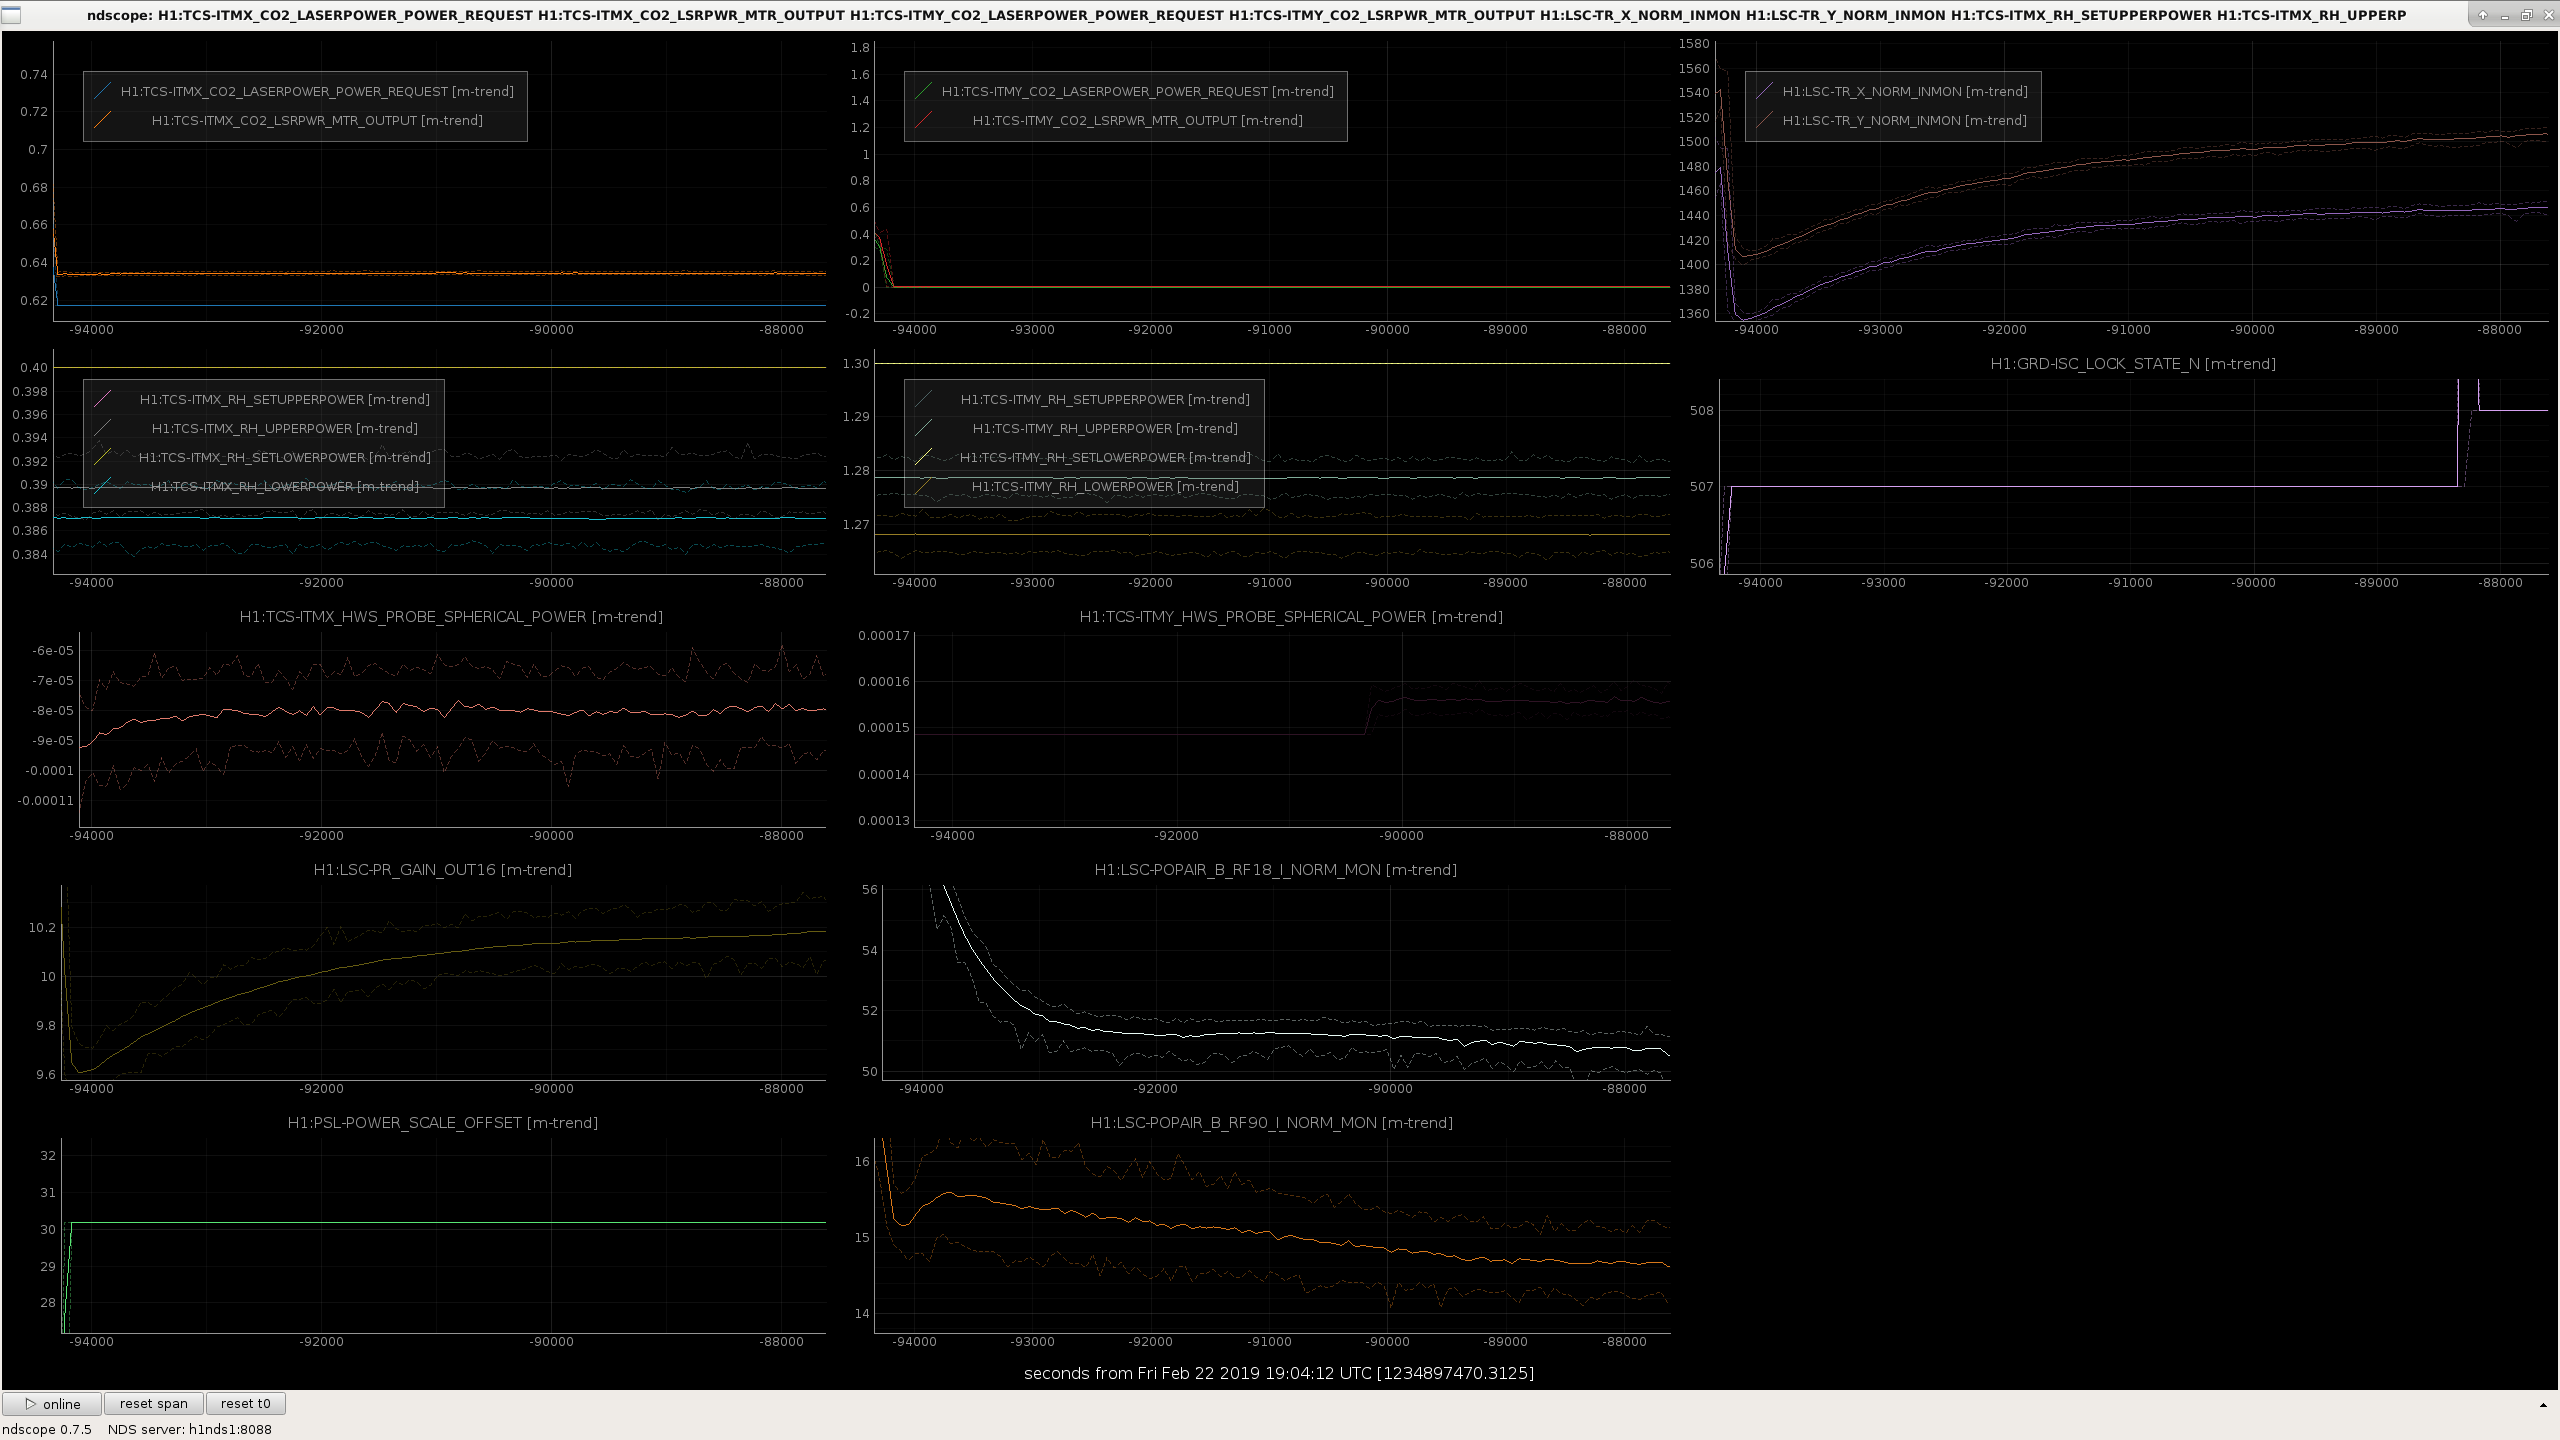
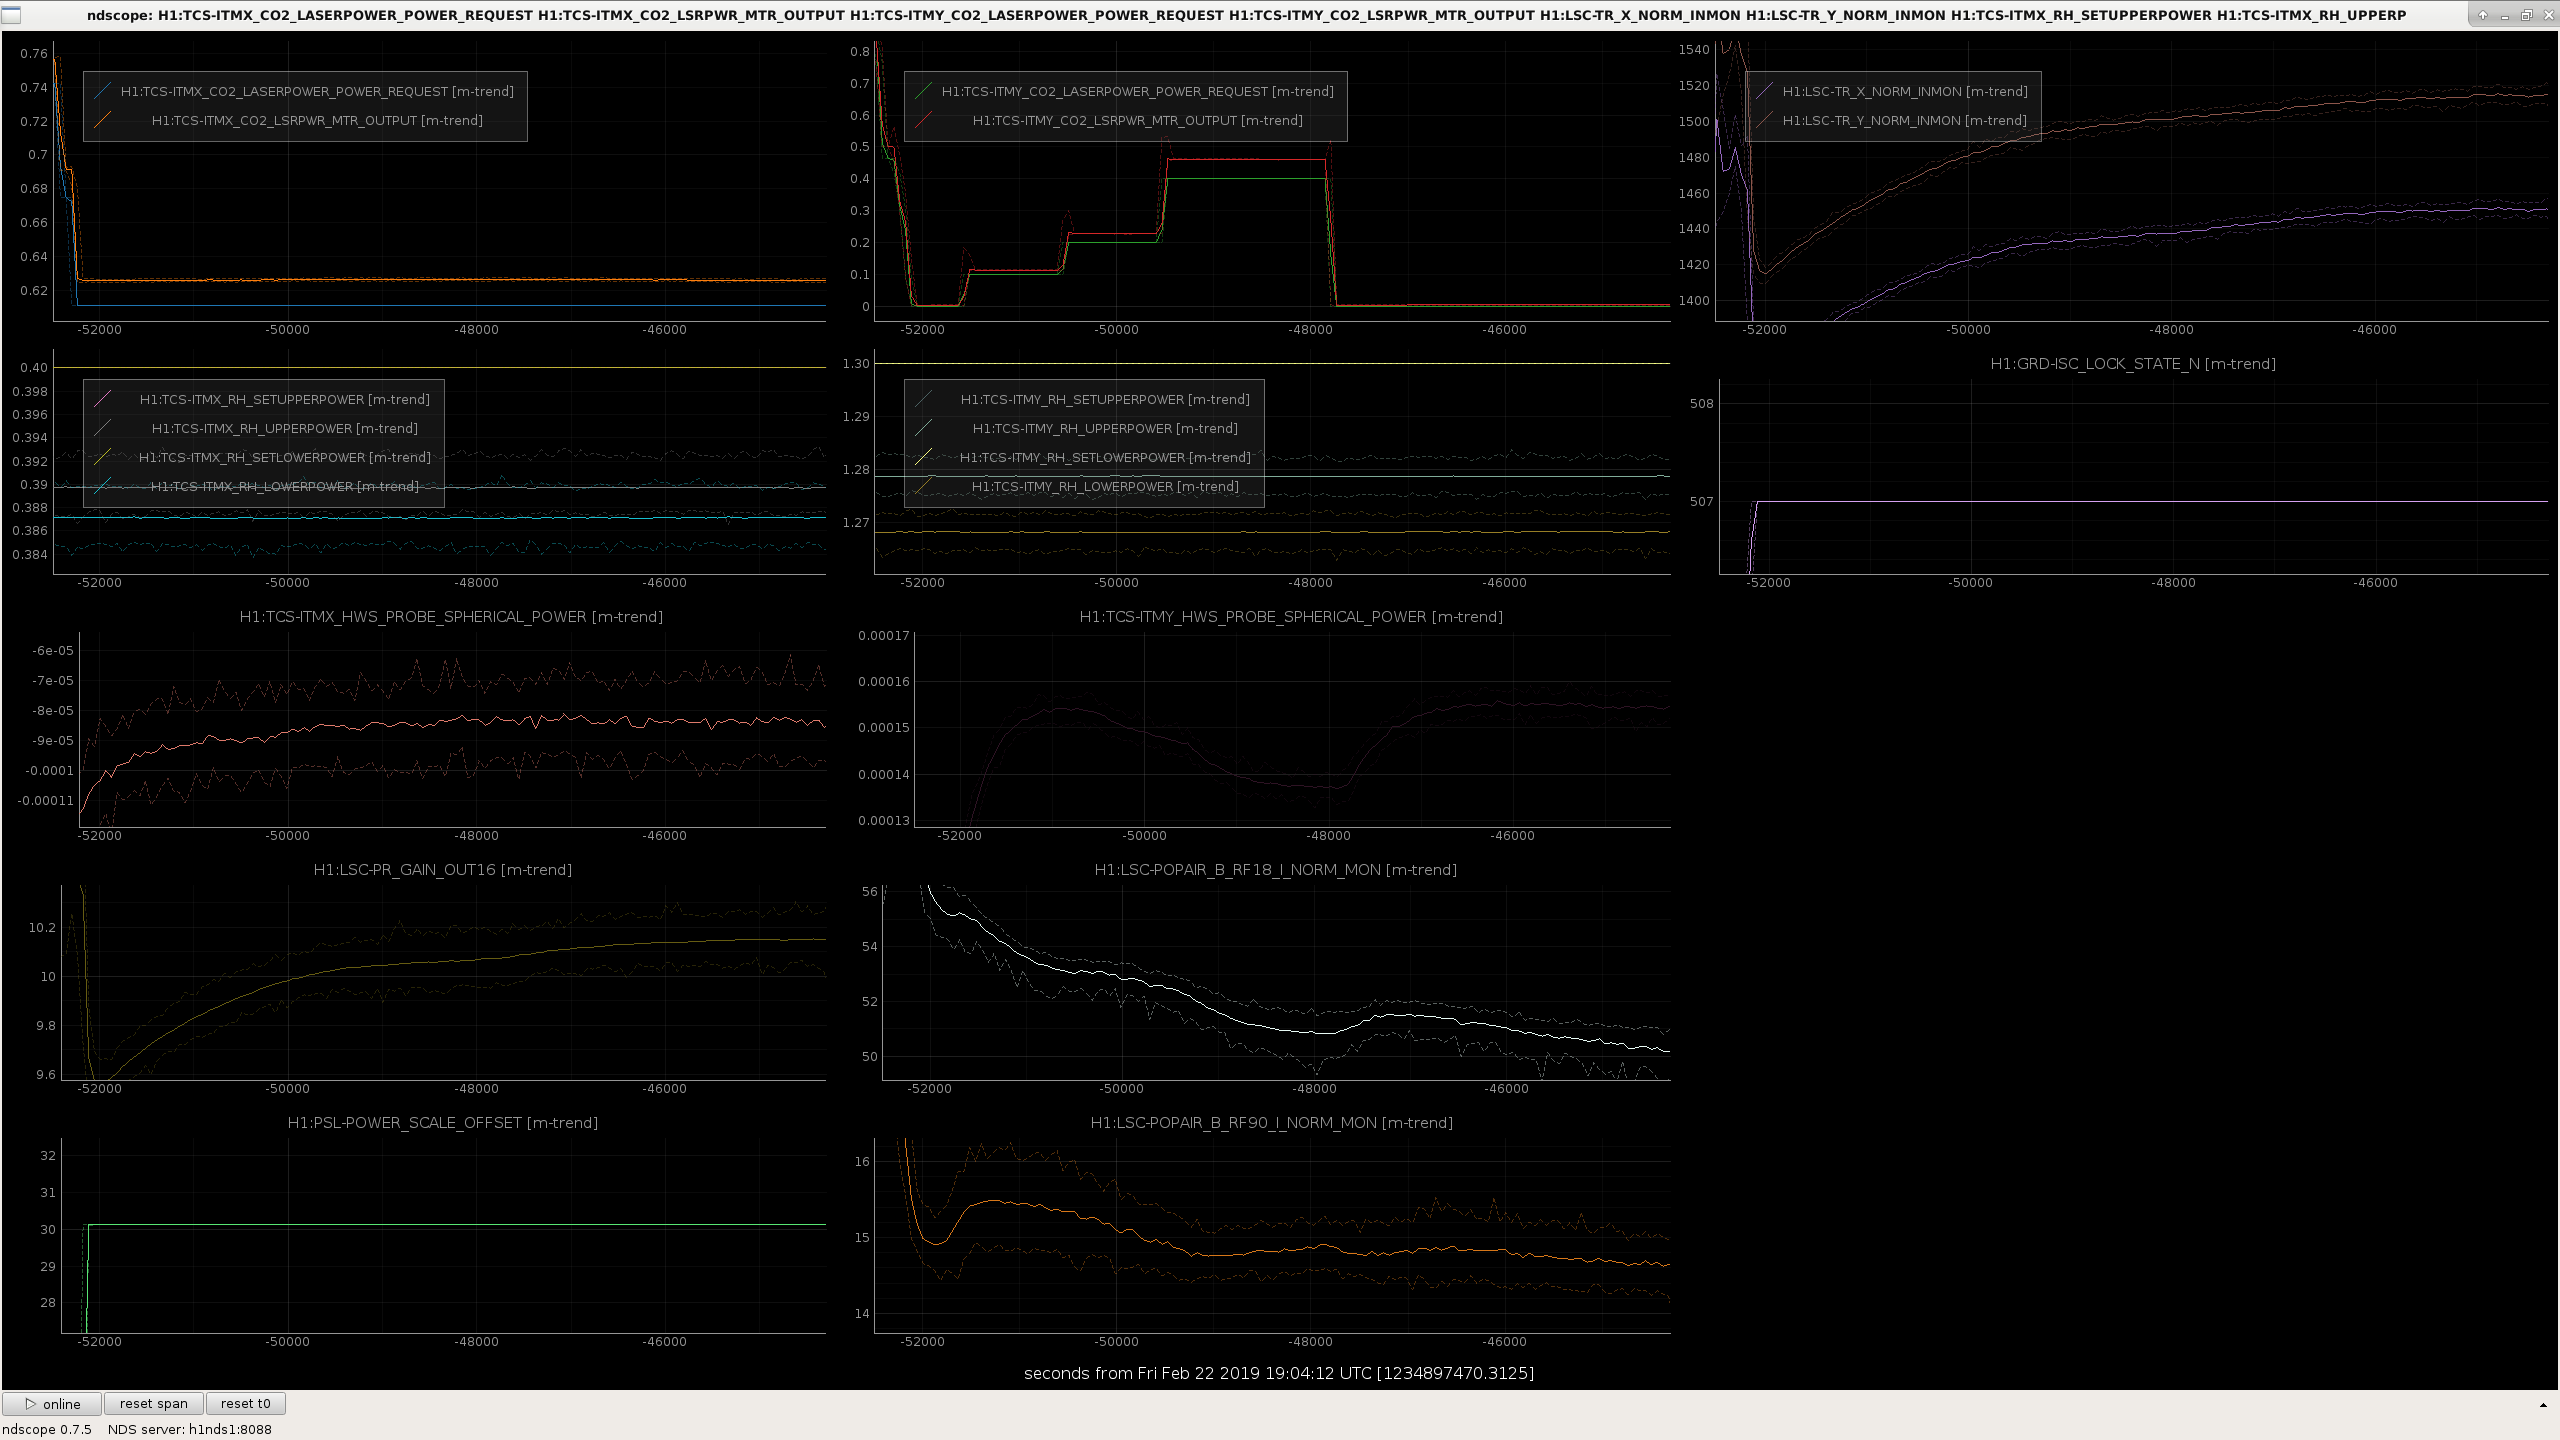
We powered up to the 30W state but didn't go to low noise ASC. We then put the mask in and stepped up in CO2Y power 100mW, 200mw, 400mW in 1000s intervals. We compare this with the 30W lock we had yesterday with the 9MHz RIN line on where we also didn't go to a low noise state. Looking at the RIN coupling we can see an improvement as the mask is introduced, then when we switched it off it goes back to as it was before. I injected a line that was 10x larger than the previous day by accident so the amplitude is rescaled and the line is less noisy. In hindsight we should have left it on a bit longer to see how it affected the steady state after 4000s, however we wanted the thermal state to return to normal for the night shift commissioning. From the data it looks as if the RIN coupling levels off between 3000-4000s. It looks to be at roughly the same level as the steady state case without the mask. Perhaps there is another dominating coupling effect at that stage where the mask no longer helps.
RF90/RF18/PRG/HWS traces with and without the mask.
Comparing with and without the mask we can see:
Things to try next:
Adding a plot of power levels of the two locks with mask and without. PRG and arm power remain lower with CO2 ITMY mask on, but POP18 is higher.
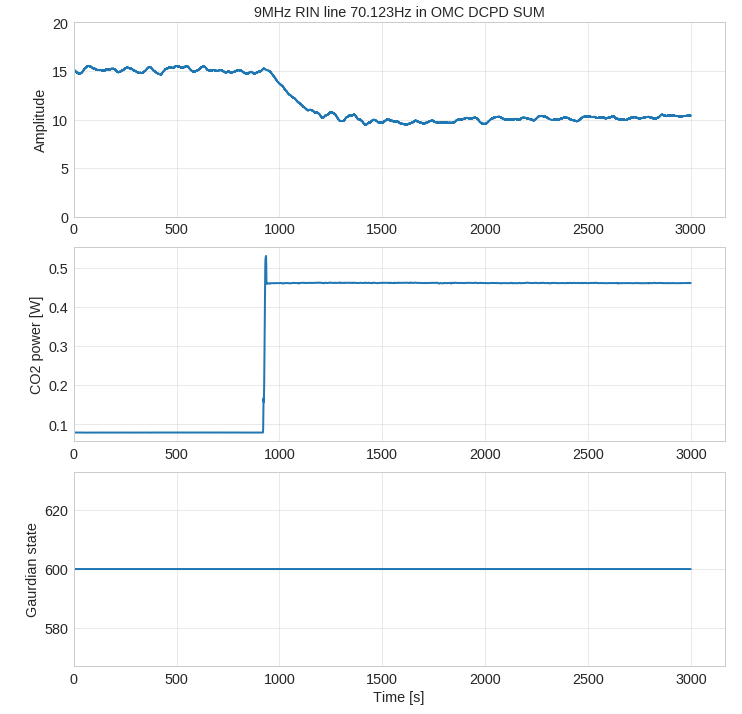
The other night we put the mask on once the IFO had thermalized alog 47097. The effect of the mask looked to be leveling off. However when applying the mask at a later date we also saw an improvement in the coupling.
Here is the 9 MHz RIN line amplitude at the start of the lock, when we switched the mask on, and when we switched it off. Overall saw ~30% reduction in coupling.
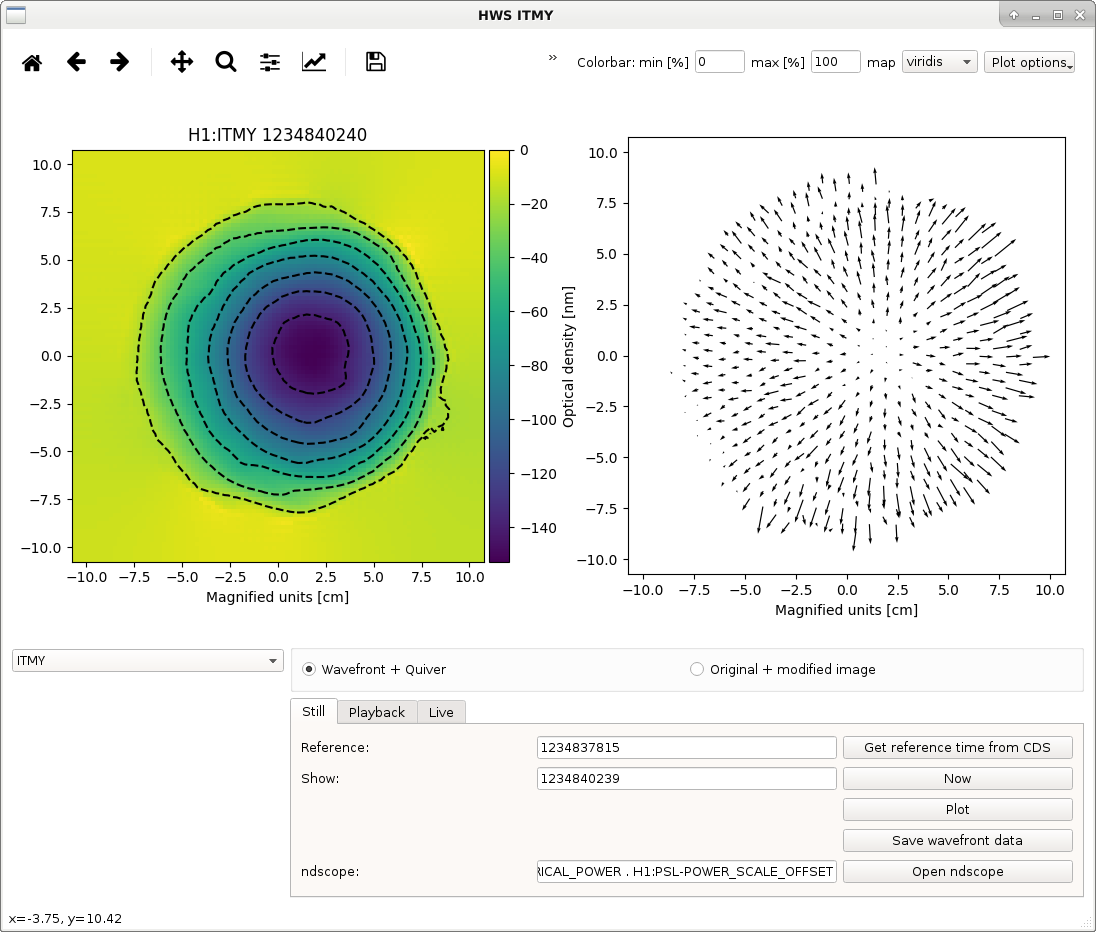

Attached is a breakdown of the mask test with a thermalised IFO at 30W. We switched on the mask for two hours. Plotted is the OPD changes between several points:
What's confusing us is that we now see an OPD change that is different to when we applied the mask separately. i.e. case 4 does not look like this.
The magnitude of the optical depth change is completely different too. Case 4 has an OPD change of 40nm, whereas applying the mask out of lock gave us ~140nm. I can't think of why this would be the case, perhaps the mask induces a change in the beam which introduces a different OPD, so some non-linear effect is in play. If so, it will be difficult to predict what mask shape to actually use.
It does however have a crescent like shape similar to aidans model Aidan's model (top right image here), although that may be a coincidence.
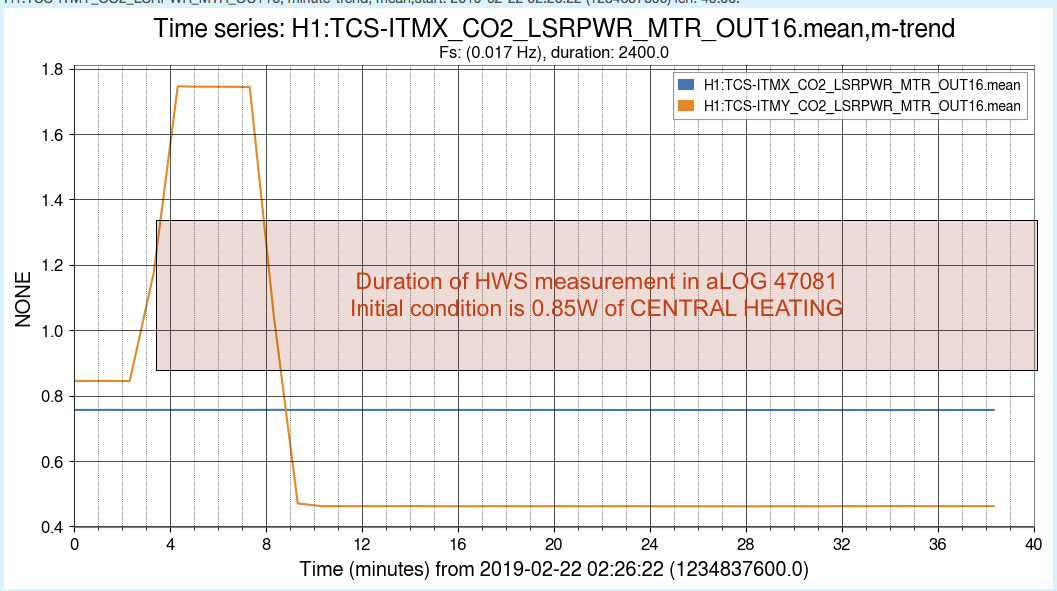
The reference for the "140nm measurement" of the CO2Y mask thermal lens was not taken at a cold state but rather with 0.85W of CENTRAL heating on. This yields a strong positive lens. If this positive lens is taken as a reference (or zero) point and then central heating is turned off, we will see a strong negative lens in the measurement.
Probably best to repeat the calibration of the CO2Y mask from a genuine cold state.
So the "140nm OPD measurement" is looking at the difference between a reference state of "0.85W central + 0.0W custom mask" and "0W central + 0.45W custom mask".

Alexei, Dan
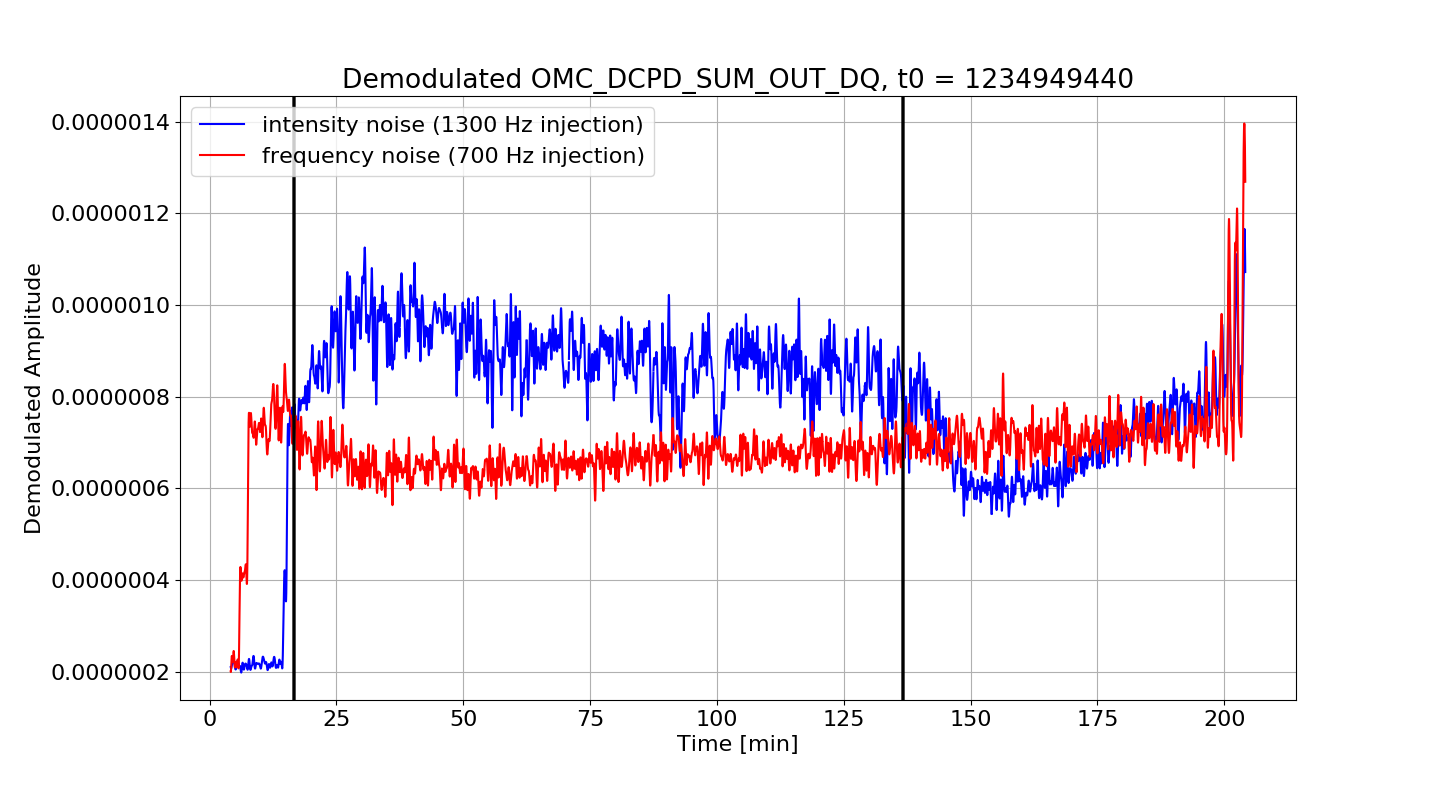
Pulled the data from OMC_DCPD_SUM_OUT_DQ corresponding to the injections of frequency and intensity noise lines as outlined in alog 47097.
The first black line is when the CO2 was switched on the second black line is when it got switched off. Looks like the mask increases intensity noise coupling but doesn't do much of anything to the frequency noise.
The ringing towards the end is likely some instability as there is a lock loss about 10 minutes after the data ends.

A plot of inspiral range hour-trends supports the impression that the rate of major glitches is, at present, greater than in O1 or O2 at LHO and possibly LLO as well. The minimum range per hour in Figure 1 (blue) appears lower now than in O1 and O2 (and the associated commissioning time) because fewer hours are free of major range drops. The plot on the second page of Figure 1 compares single recent days around the supernova alert, when the interferometers were mostly left free of commissioning glitches, to random days in O2, and these plots also suggest a higher big glitch rate at both sites. Hopefully, the high glitch rate will go away once the interferometers are in run mode, but I think we should start worrying, just in case.
One possibility is that the apparent increase in glitch rate is due to a new piece of equipment such as electronic or computer equipment, that was installed at each site during the O1-O2 break. Sheila pointed out that the possibilities might be narrowed down at LLO since the installation was staggered. I looked for a step increase, and, while it is not completely clear, the best candidate appeared to be the March – September 2018 down-time (Figure 2). Suggestions of equipment to investigate would be appreciated.
I, and as far as I know, others, have not found channels that predict the majority of the major glitches. So, Kara and I set up magnetometer channels to monitor new equipment that might be too far from the permanent magnetometers for glitch source identification.
Robert, Kara
|
H1:PEM-EX_ADC_0_13_2K_OUT_DQ |
EX HV ESD power supply, gain 1 |
|
H1:PEM-CS_ADC_5_20_2K_OUT_DQ |
Diode room 70W box, gain 100 |
|
H1:PEM-CS_ADC_5_21_2K_OUT_DQ |
Diode room 70W box, gain 1 |
|
H1:PEM-CS_ADC_5_22_2K_OUT_DQ |
Diode room 70W box, gain 1 |
|
H1:PEM-CS_ADC_5_23_2K_OUT_DQ |
Squeezer rack, gain 100 |
|
H1:PEM-CS_ADC_5_24_2K_OUT_DQ |
Squeezer rack, gain 1 |
|
H1:PEM-CS_ADC_5_25_2K_OUT_DQ |
Squeezer rack, gain 1 |
There are so far no obvious correlations between the magnetometer signals and the glitches. We will continue to analyze the lock segments that we have using different methods, but to broaden our search I have moved the 3rd magnetometer from the squeezer rack to next to the TTFSS on top of the table at Nutsinee's suggestion.