TITLE: 02/22 Day Shift: 16:00-00:00 UTC (08:00-16:00 PST), all times posted in UTC
STATE of H1: Commissioning
INCOMING OPERATOR: None
SHIFT SUMMARY:
Had a 6-hr lock for good chunk of the shift, then dropped out which allowed for an LSC model/daq restart (+restart of HAM6 dust monitor). Now commissioning continues (some 2nd harmonic violin mode going on by Kara & Jenne + other work).
LOG:
ssh controls@h1build
now automatically puts you into the build directory, defines a build alias and gives a build example:
Last login: Fri Feb 22 15:36:18 PST 2019 from h1boot1 on pts/3
Please Note: You are in the build directory. To return to this directory type 'build'
Reminder, to build a model (e.g. h1tcscs)
make h1tcscs
make install-h1tcscs
controls@h1build /opt/rtcds/lho/h1/rtbuild/current $
Because h1build is a diskless front end machine like the others, this shortcut is only defined if $(hostname) == "h1build" in ~/.bash_login
Sheila, Jenne, Dave:
A new h1lsc model was loaded. This added some slow channels to the DAQ (output matrix row-11 chans and pop_a_lf_dark_offset).
DAQ was restarted for h1lsc changes, and the previous week's pending gds broadcaster change (Guardian OK channels).
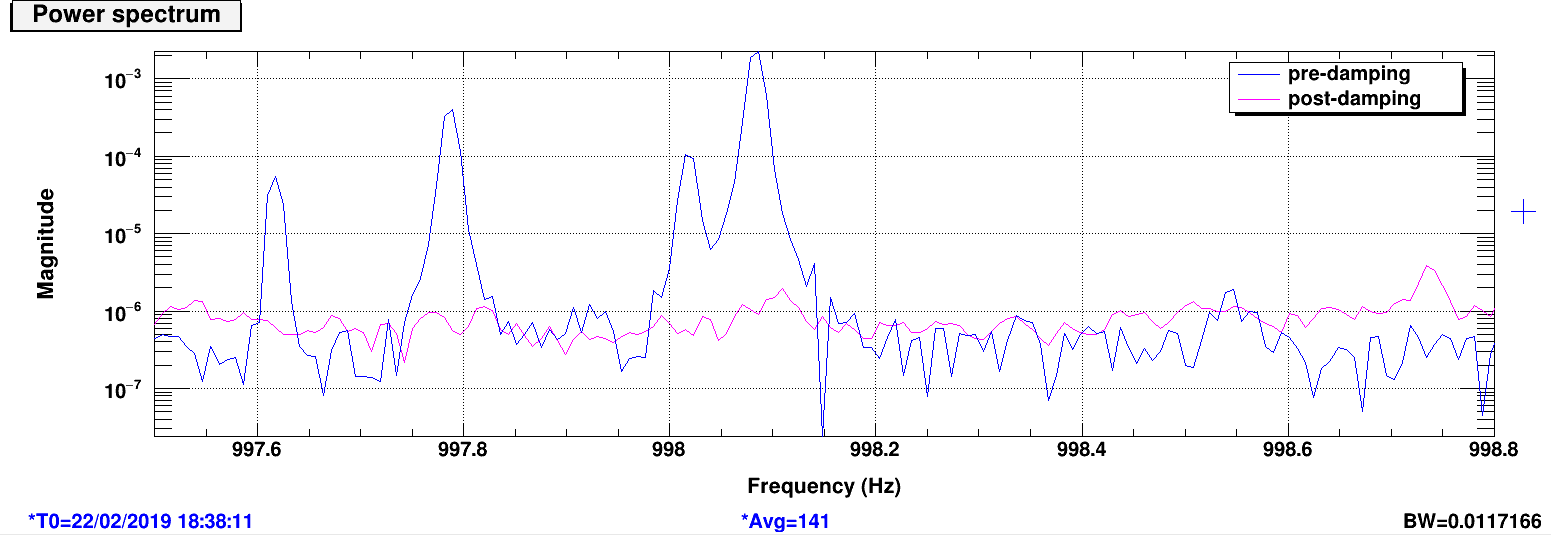
I have identified a new 2nd order violin mode at 998.017Hz as being on ITMX. I used Patrick's program to create damping filters for it at 998.02Hz. This mode is best damped when the phase is set to 270 degrees on the ITMX yaw, with gain=50. This is now in the filter bank as ITMX mode 19. This violin mode has been reduced by 2 orders of magnitude. I have also identified a new 2nd order violin mode at 997.613Hz as being on ITMY. I created a damping filter for it at 997.62Hz, which functions best when the phase is 270 degrees on the ITMY yaw, with gain=20. This is now in the filter bank as ITMY mode 19. This violin mode was reduced by about 1.5 orders of magnitude. I have adjusted Patrick's pre-existing ITMX mode 13 filter from 998.09Hz to 998.08Hz to better address the violin mode, which at higher resolution is located at 998.083. Even though this is only 0.04Hz away from the next lowest frequency mode, their filters are sufficiently narrow so as not to interfere with each other. This violin mode was reduced by 3 orders of magnitude. I have adjusted the gain for ITMY mode 16 (997.78Hz), from gain=200 to gain=20. Today, this was sufficient to damp the mode by over 2 orders of magnitude. These changes have not yet been permanently committed to the guardian. This will happen after we watch these settings through the full acquisition of lock. violinmodes_1.png shows these peaks before and after these damping filters were applied.
[J. Driggers, T. Massinger, J. Kissel, A. Viets]
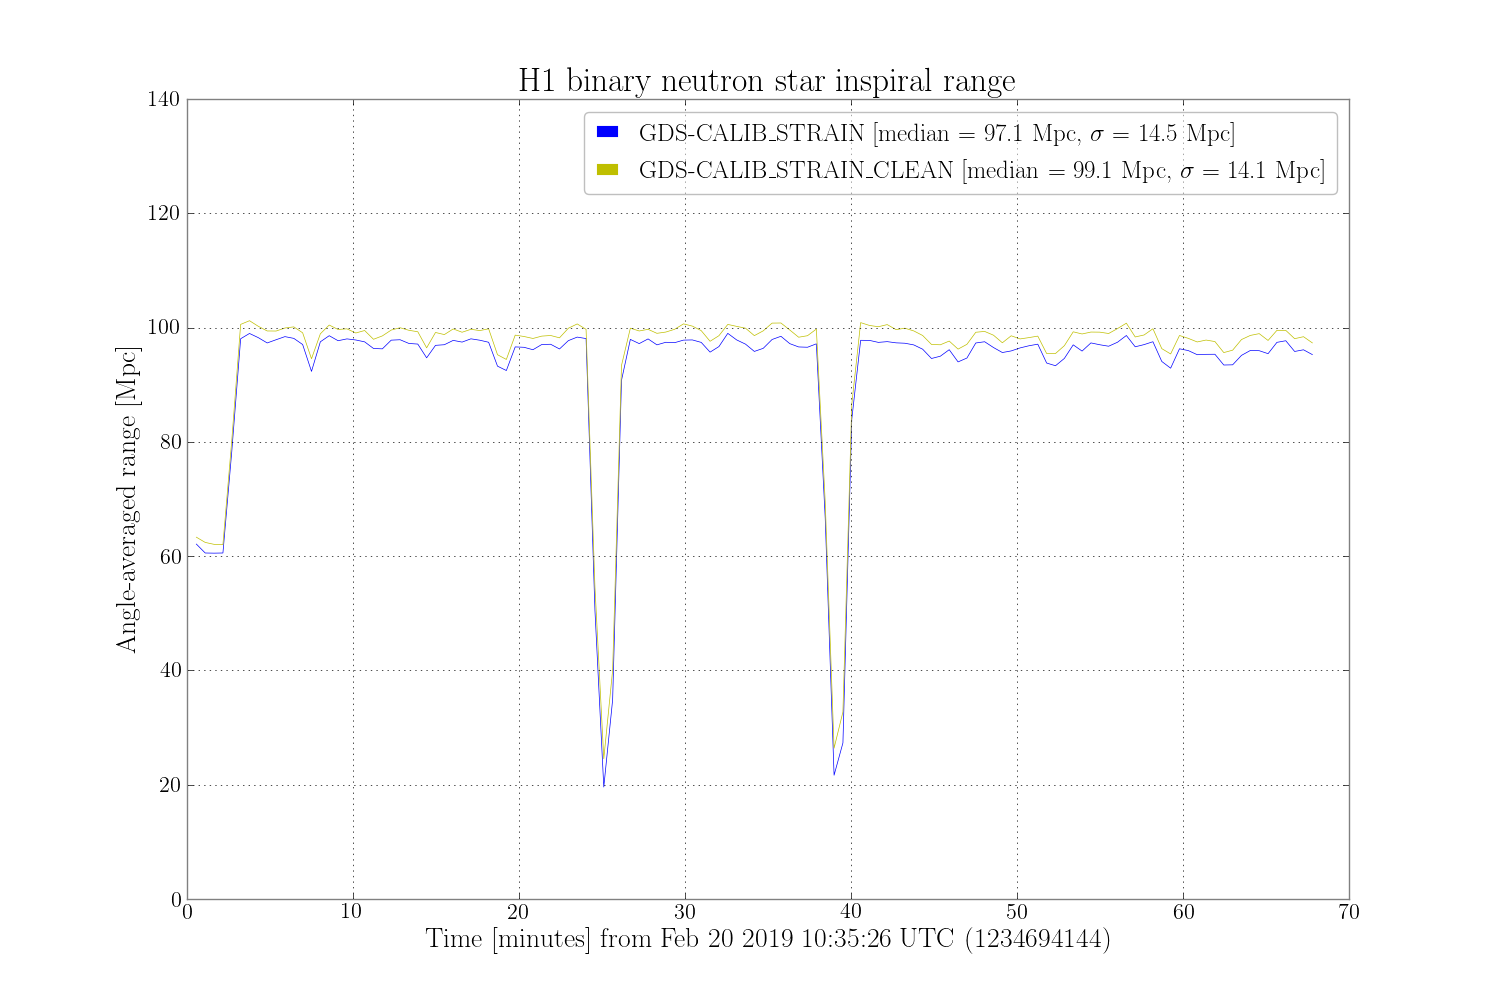
I ran the noise subtraction code in the gstlal calibration pipeline on the same time interval that Sheila used for the spectrum in LHO aLOG 47011. The results are shown in the attached plots. The first attachment is the ASD produced from only the time that was used in that aLOG, and the second ASD is based on over an hour of data. The last plot is a time series of BNS range, in which the cleaned data averages about 2 Mpc better than the uncleaned data and goes above 100 Mpc several times. I used gwpy.astro.inspiral_range() to compute the BNS range. Unfortunately, this was not produced in low latency, due to the fact that the noise subtraction was being gated by the guardian channel GRD-ISC_LOCK_OK. Apparently this is related to an issue with the squeezer guardian. However, data like this should be produced soon in low latency by GDS-CALIB_STRAIN_CLEAN.
Note that the h(t) data used here was from the gstlal calibration pipeline, so the correction Jeff applied (LHO aLOG 47032) may not exactly apply here, the recent summary pages (e.g. 2019-02-03) show agreement to within ~5% between GDS and the front end.
Danny, Dan
9MHz RIN line over locks
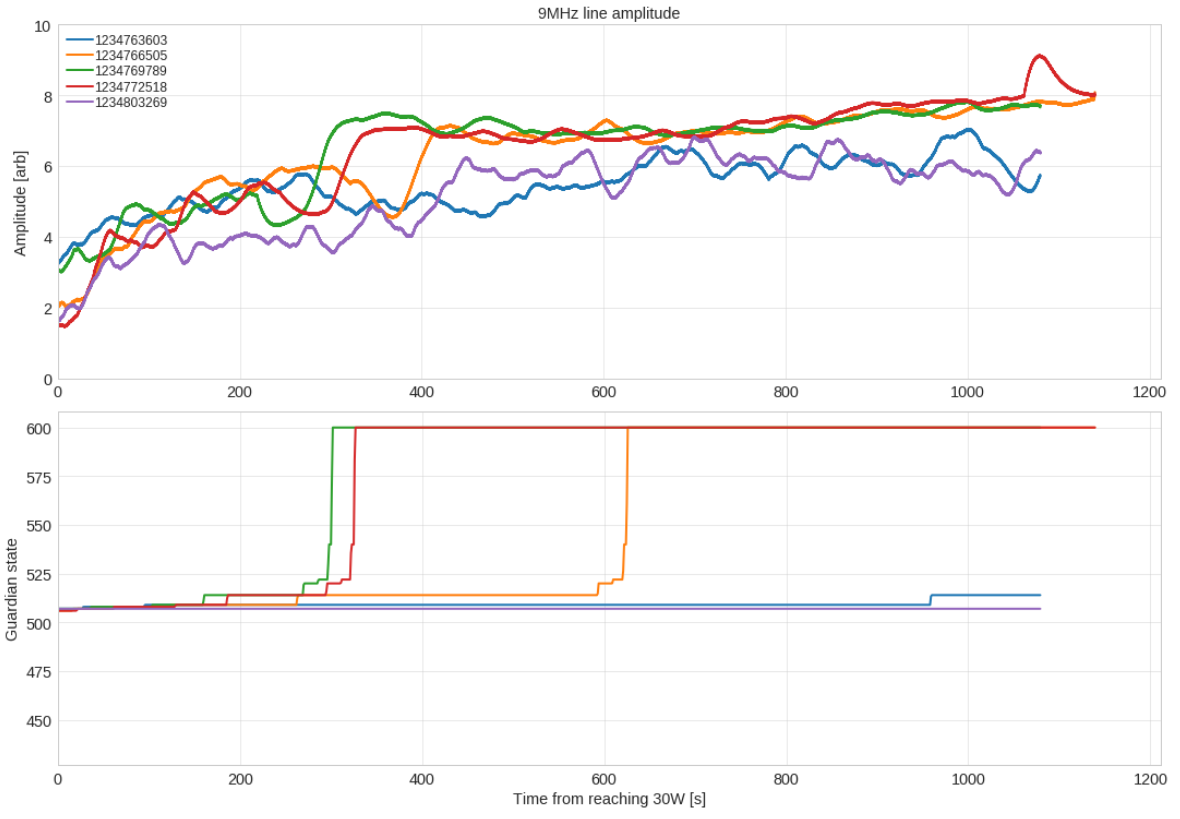
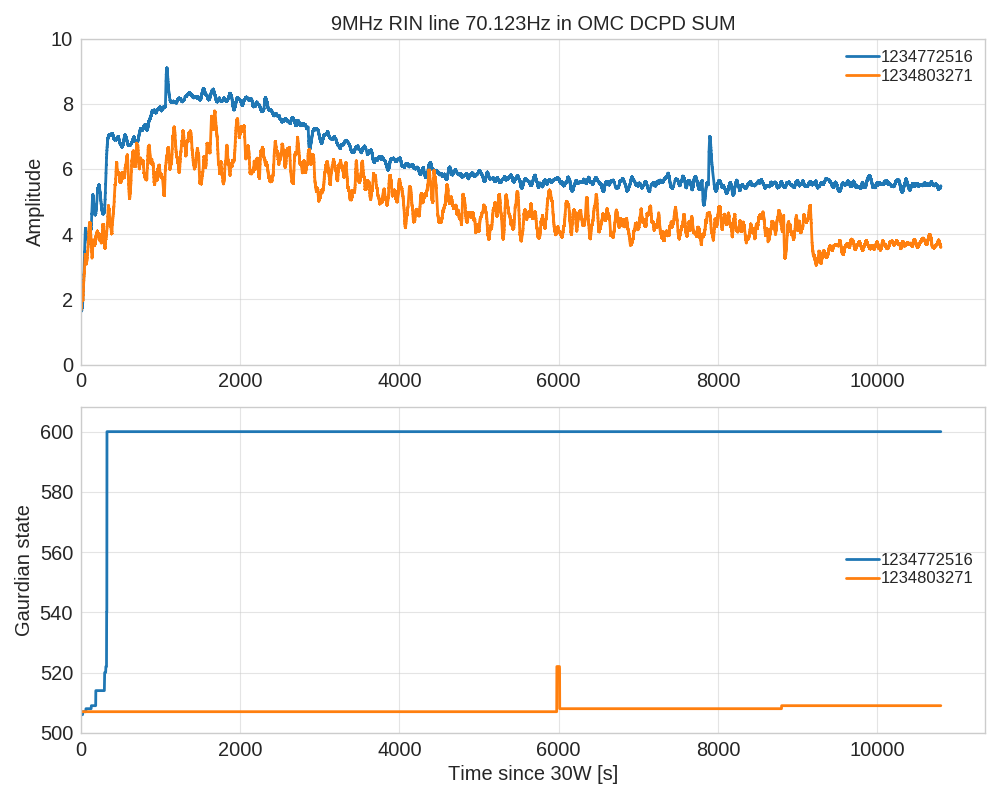
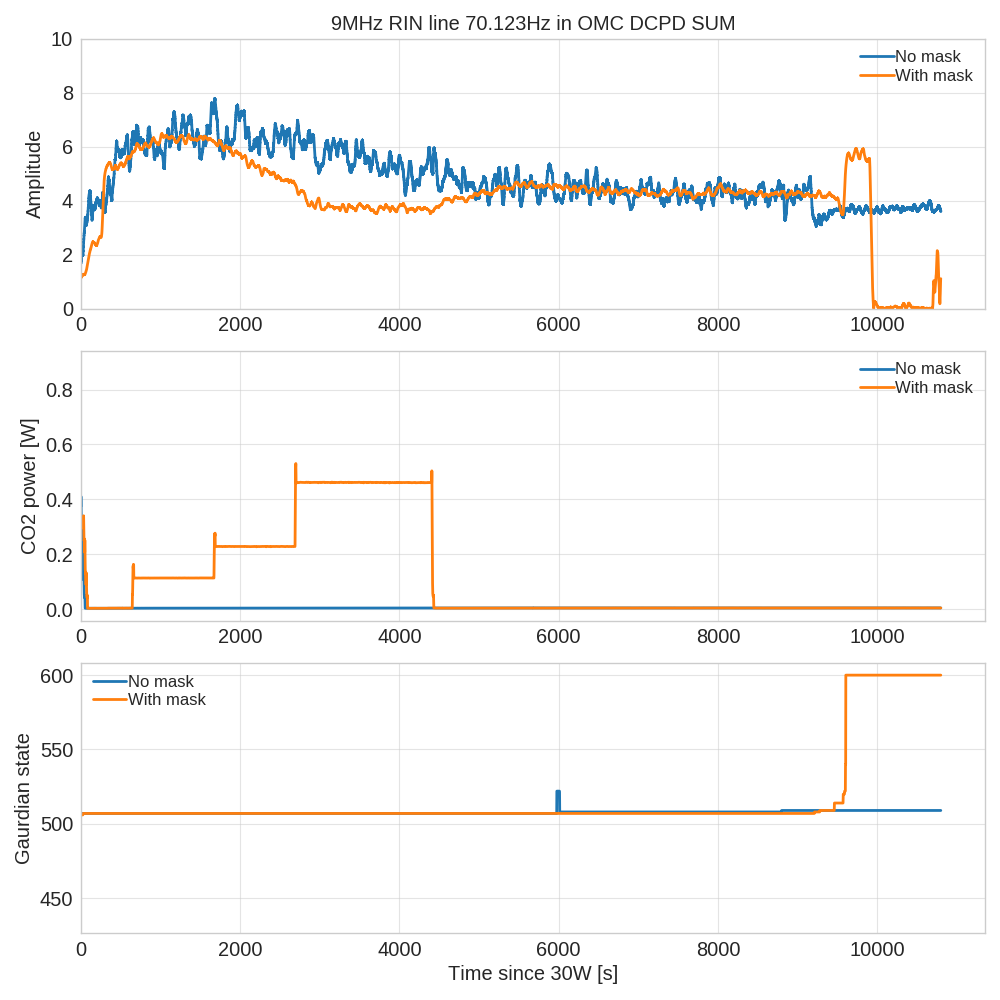
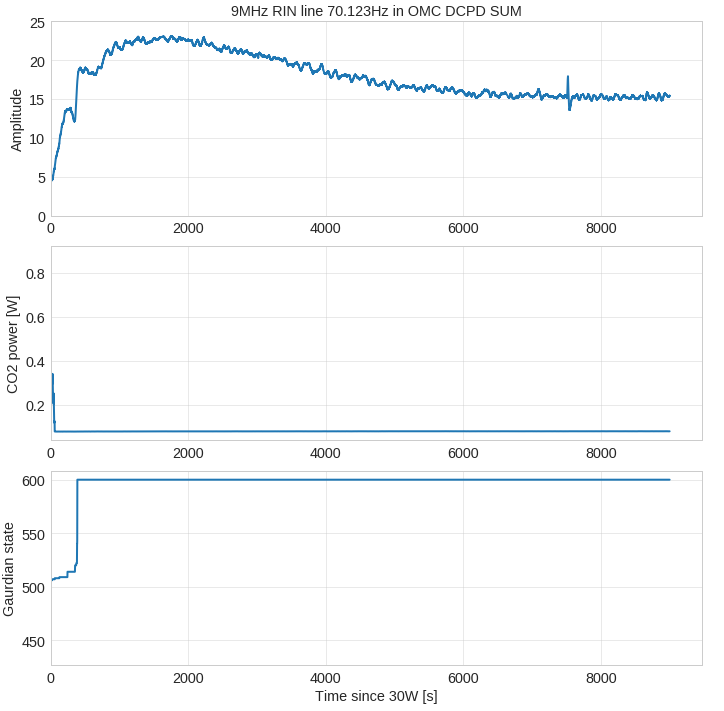
We put a line at 70.123Hz in the 9MHz for a few locks to see how it was behaving over time. When it was one we had a few short locks and two longer ones so far. It seems there are two states in which the coupling finds itself, one that peaks around "8" and another "6". This may coincide with going to LOWNOISE_ESD_ETMX (Guardian state 514) - the jump up in RIN coupling for red/green/orange seems to happen at roughly the same time after we go up to state 514. During the two long locks it's clear there's some long time constant to the RIN coupling, it takes around 4000s after going to 30W for this to settle. So depending on the thermal state we took the RIN measurements previously this might be a reason we got confused.
ITMY Mask
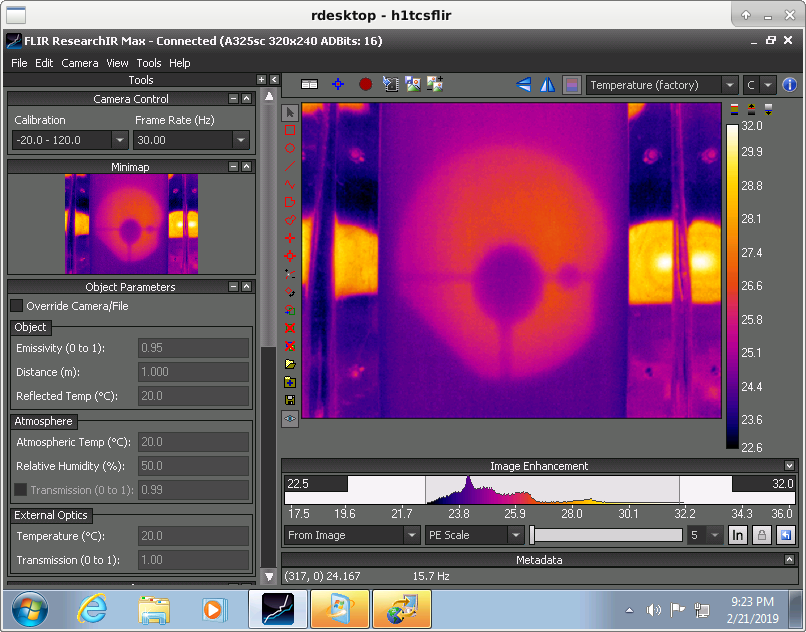
Last night we tried out the ITMY mask. The initial plan was to just apply the mask with the IFO unlocked to see how the induced OPD compared to what we expected. Then as we had the IFO to ourselves we decided to just go for it and try it out in a full lock to see what happened. Edit: this test was just to get the CO2 mask on at the expected power without causing a lockloss, the expected implementation requires changing ring heaters as well which is something to try another day.
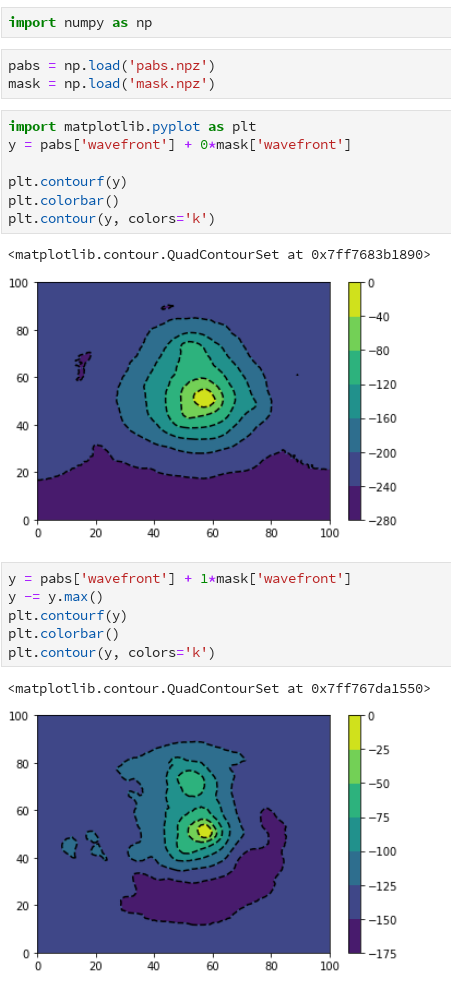
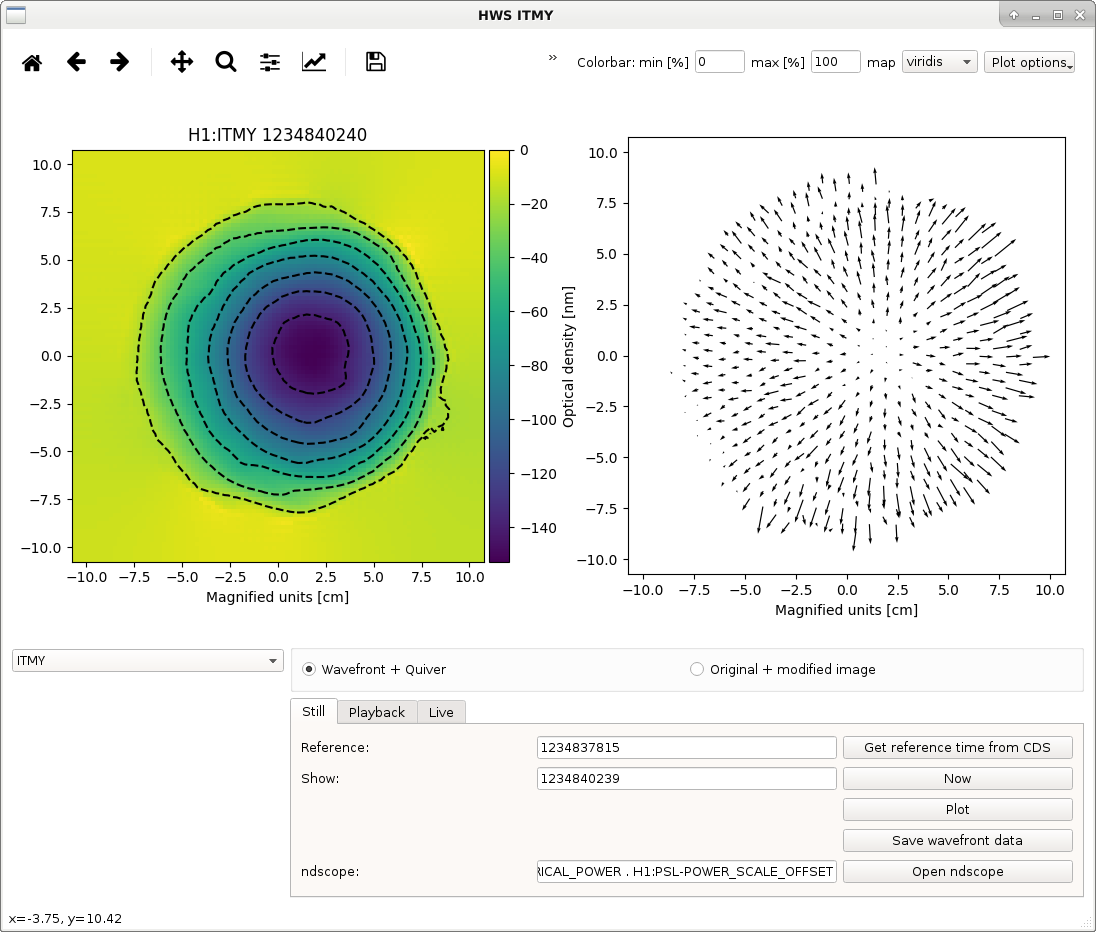
Initially the OPD doesn't look quite like we expected. What isn't obvious is the crescent moon like shape seen in alog 46976 (Top right figure). This could be because the HWS probe beam isn't illuminating the full area so we just see a small section of it. I took the 30W point absorber OPD and added it to the offline mask OPD to get a rough idea of what might be the total effect, from this it reduces the overall optical depth and the larger spatial frequency heating from the absorbers.
From initial inspection the alignment of the minimum is not too far off from the point absorbers, we might want to try shifting the mask slightly in future. However it looked reasonably well aligned enough to try in a full lock.
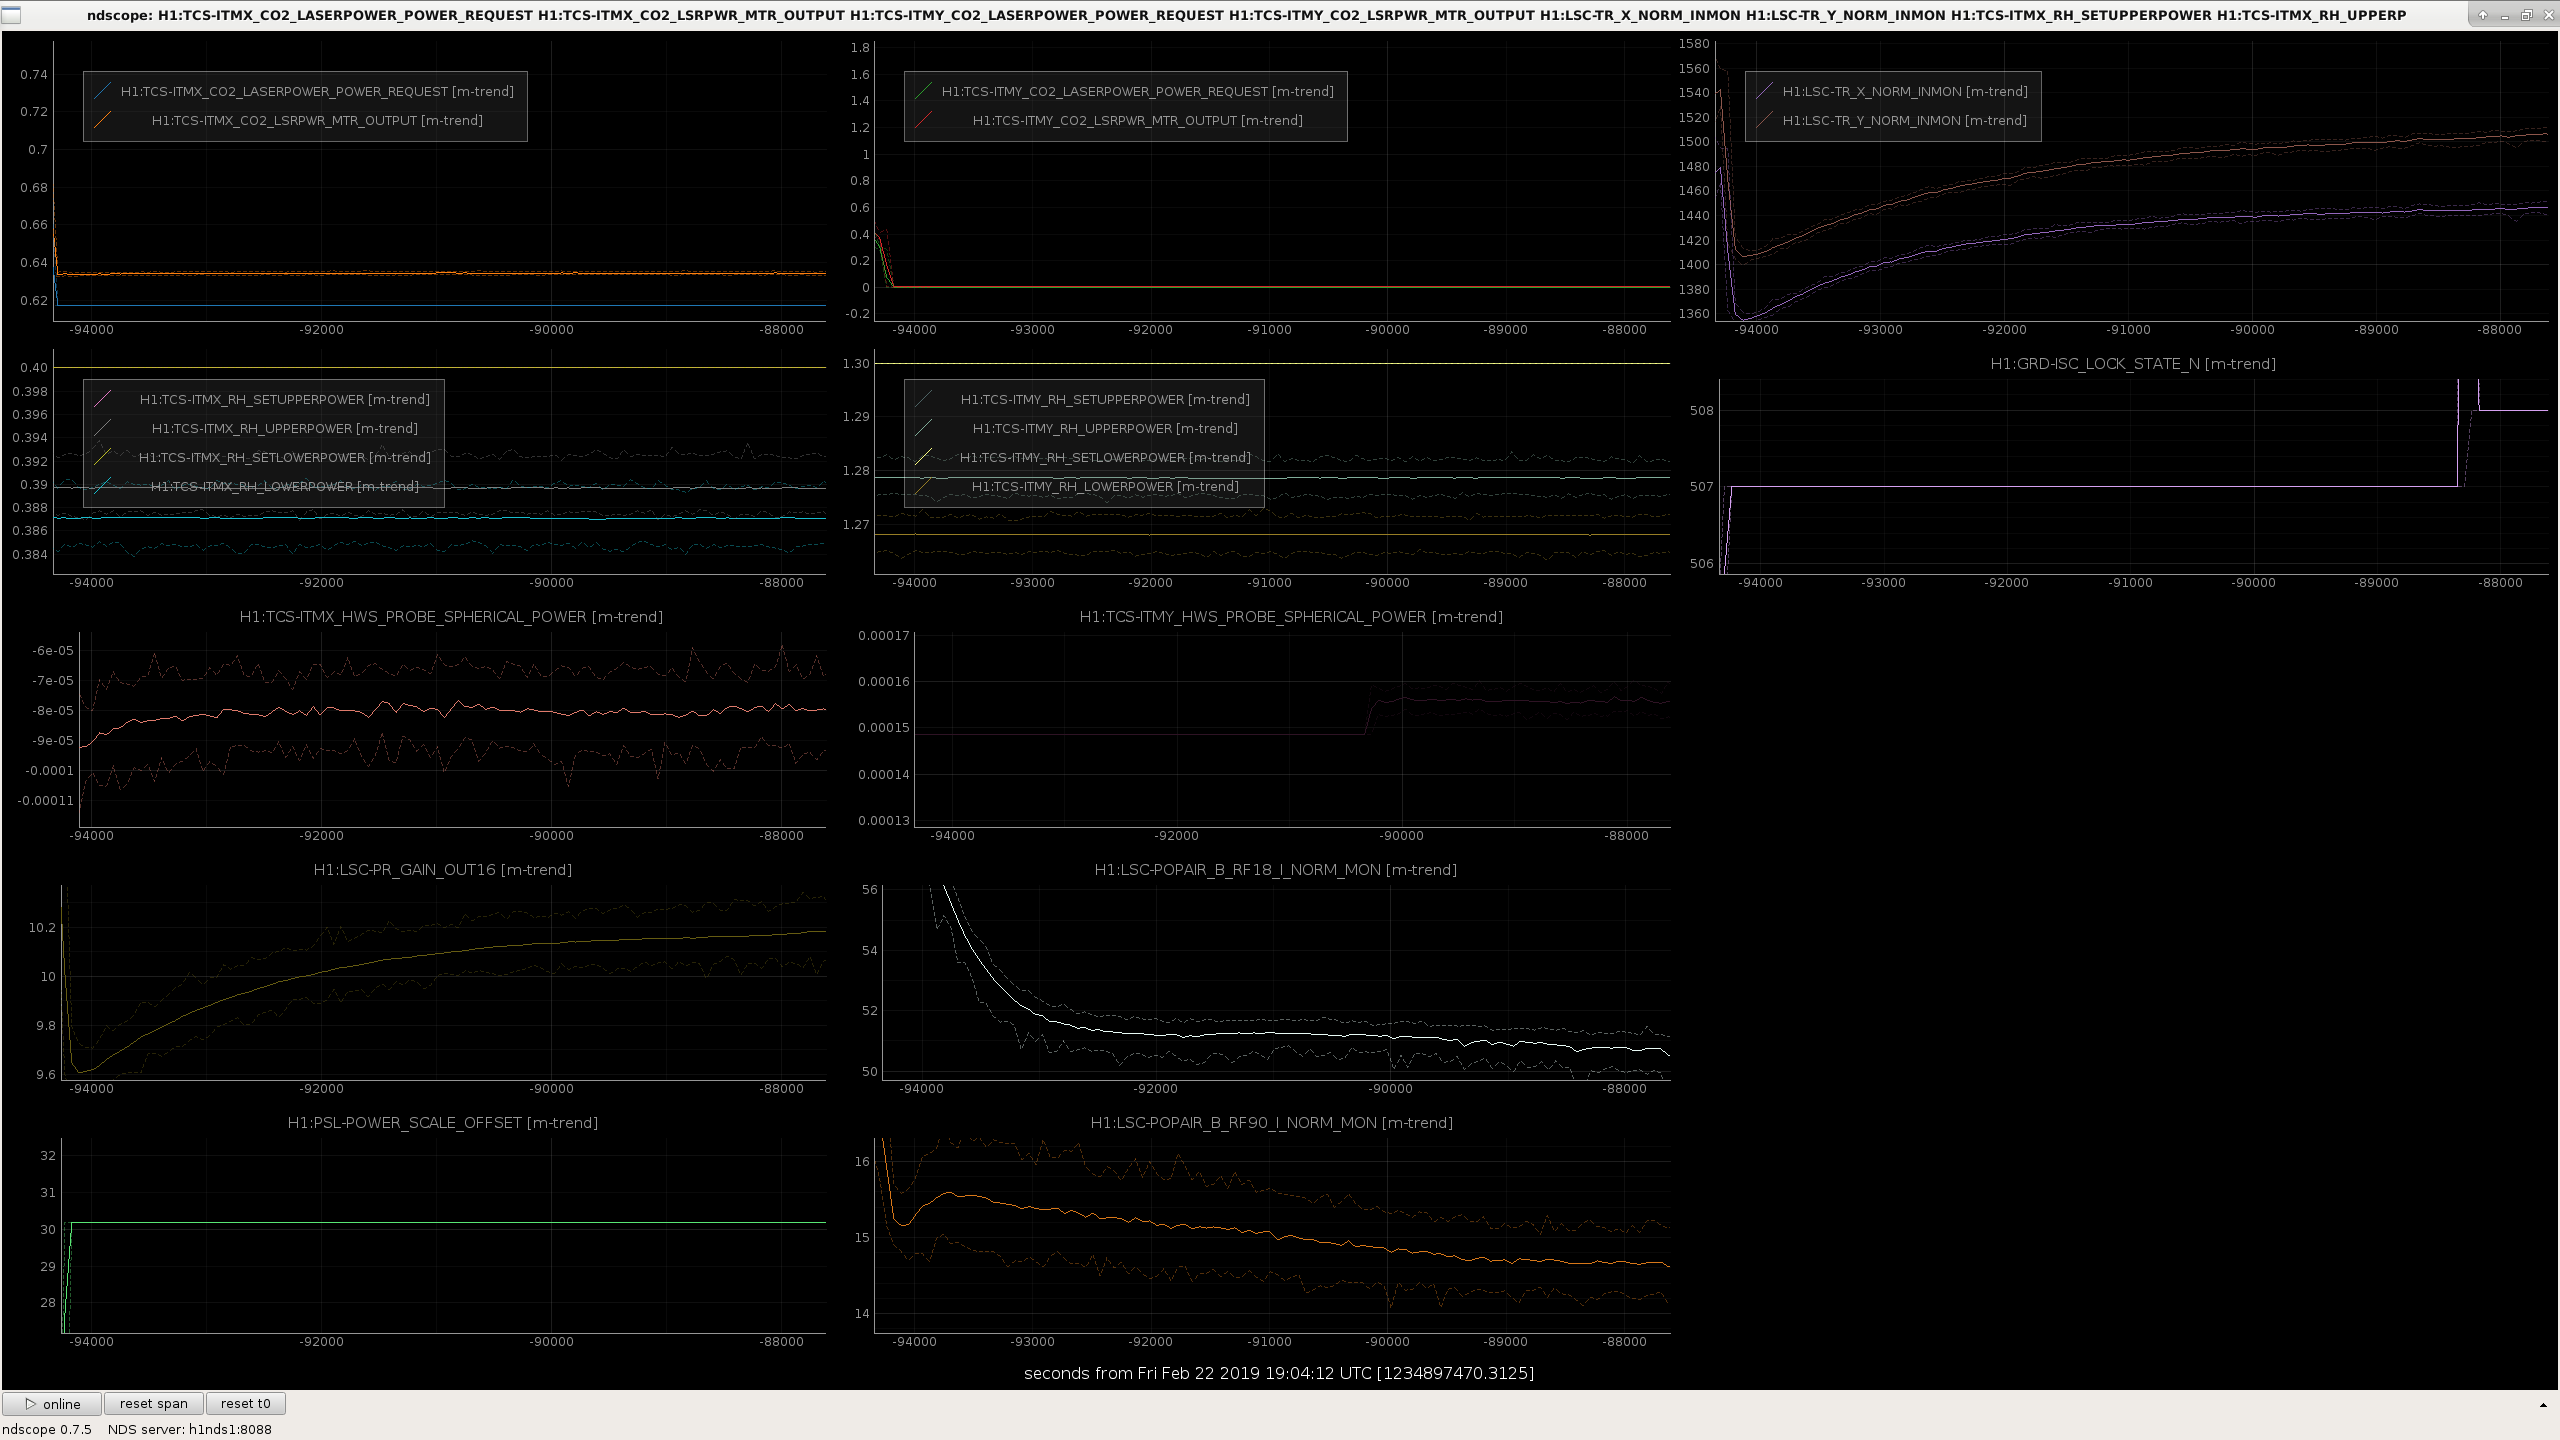
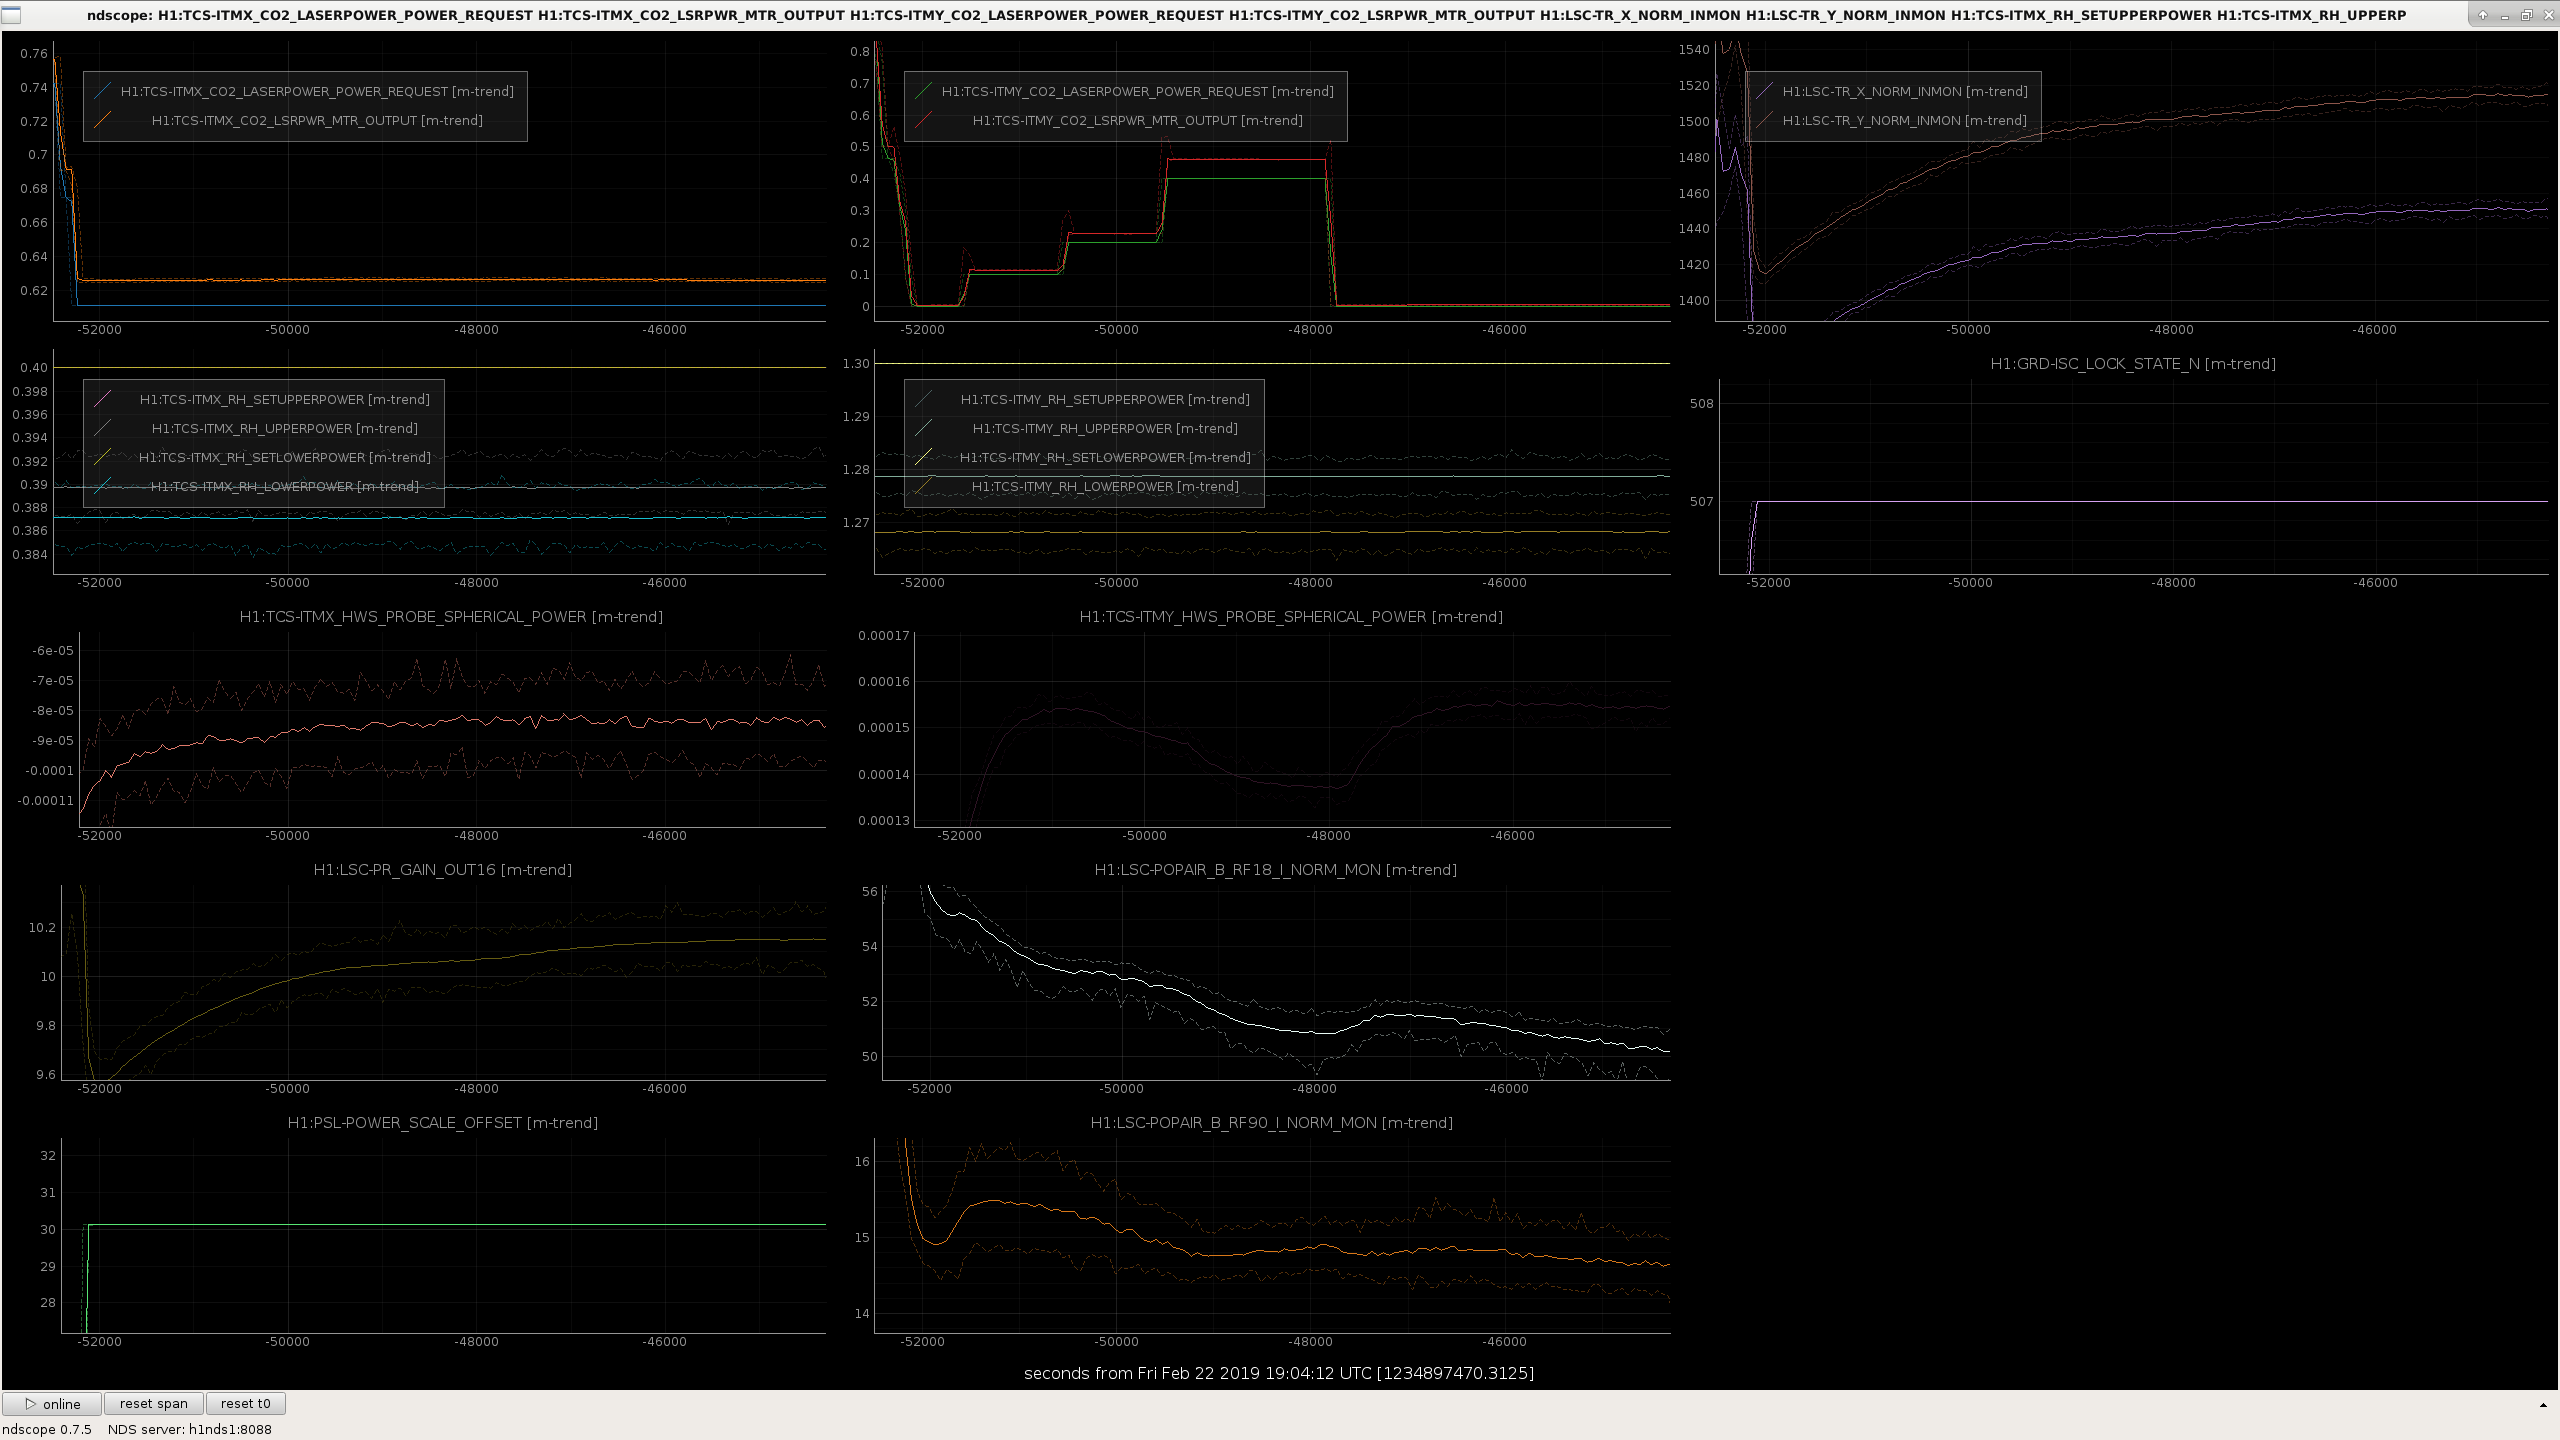
We powered up to the 30W state but didn't go to low noise ASC. We then put the mask in and stepped up in CO2Y power 100mW, 200mw, 400mW in 1000s intervals. We compare this with the 30W lock we had yesterday with the 9MHz RIN line on where we also didn't go to a low noise state. Looking at the RIN coupling we can see an improvement as the mask is introduced, then when we switched it off it goes back to as it was before. I injected a line that was 10x larger than the previous day by accident so the amplitude is rescaled and the line is less noisy. In hindsight we should have left it on a bit longer to see how it affected the steady state after 4000s, however we wanted the thermal state to return to normal for the night shift commissioning. From the data it looks as if the RIN coupling levels off between 3000-4000s. It looks to be at roughly the same level as the steady state case without the mask. Perhaps there is another dominating coupling effect at that stage where the mask no longer helps.
RF90/RF18/PRG/HWS traces with and without the mask.
Comparing with and without the mask we can see:
Things to try next:
Adding a plot of power levels of the two locks with mask and without. PRG and arm power remain lower with CO2 ITMY mask on, but POP18 is higher.
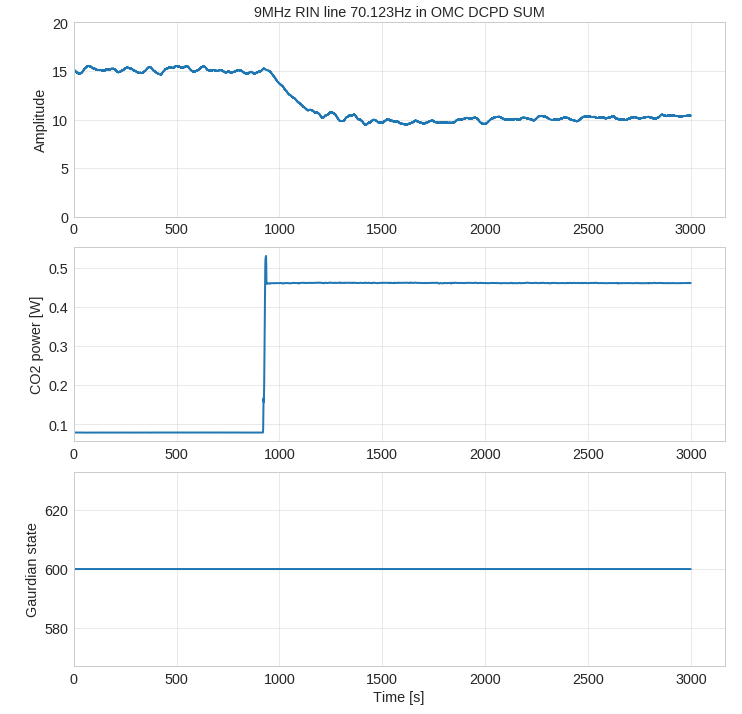
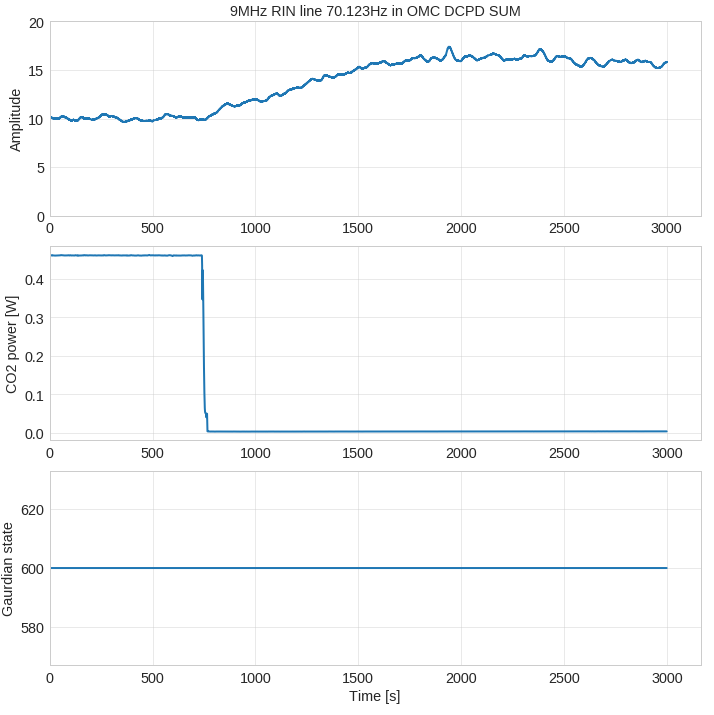
The other night we put the mask on once the IFO had thermalized alog 47097. The effect of the mask looked to be leveling off. However when applying the mask at a later date we also saw an improvement in the coupling.
Here is the 9 MHz RIN line amplitude at the start of the lock, when we switched the mask on, and when we switched it off. Overall saw ~30% reduction in coupling.

Attached is a breakdown of the mask test with a thermalised IFO at 30W. We switched on the mask for two hours. Plotted is the OPD changes between several points:
What's confusing us is that we now see an OPD change that is different to when we applied the mask separately. i.e. case 4 does not look like this.
The magnitude of the optical depth change is completely different too. Case 4 has an OPD change of 40nm, whereas applying the mask out of lock gave us ~140nm. I can't think of why this would be the case, perhaps the mask induces a change in the beam which introduces a different OPD, so some non-linear effect is in play. If so, it will be difficult to predict what mask shape to actually use.
It does however have a crescent like shape similar to aidans model Aidan's model (top right image here), although that may be a coincidence.
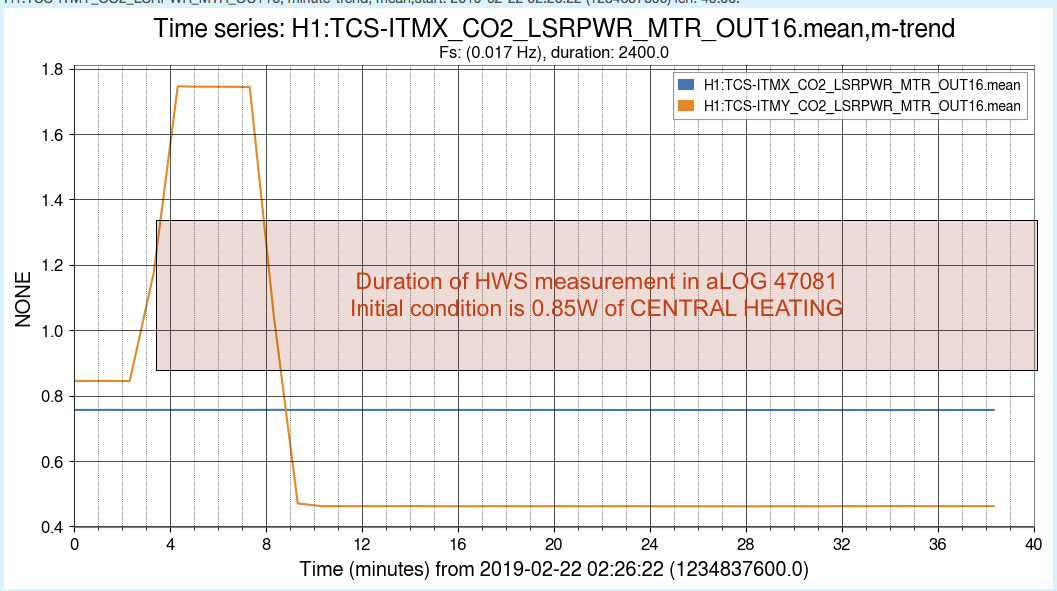
The reference for the "140nm measurement" of the CO2Y mask thermal lens was not taken at a cold state but rather with 0.85W of CENTRAL heating on. This yields a strong positive lens. If this positive lens is taken as a reference (or zero) point and then central heating is turned off, we will see a strong negative lens in the measurement.
Probably best to repeat the calibration of the CO2Y mask from a genuine cold state.
So the "140nm OPD measurement" is looking at the difference between a reference state of "0.85W central + 0.0W custom mask" and "0W central + 0.45W custom mask".

Alexei, Dan
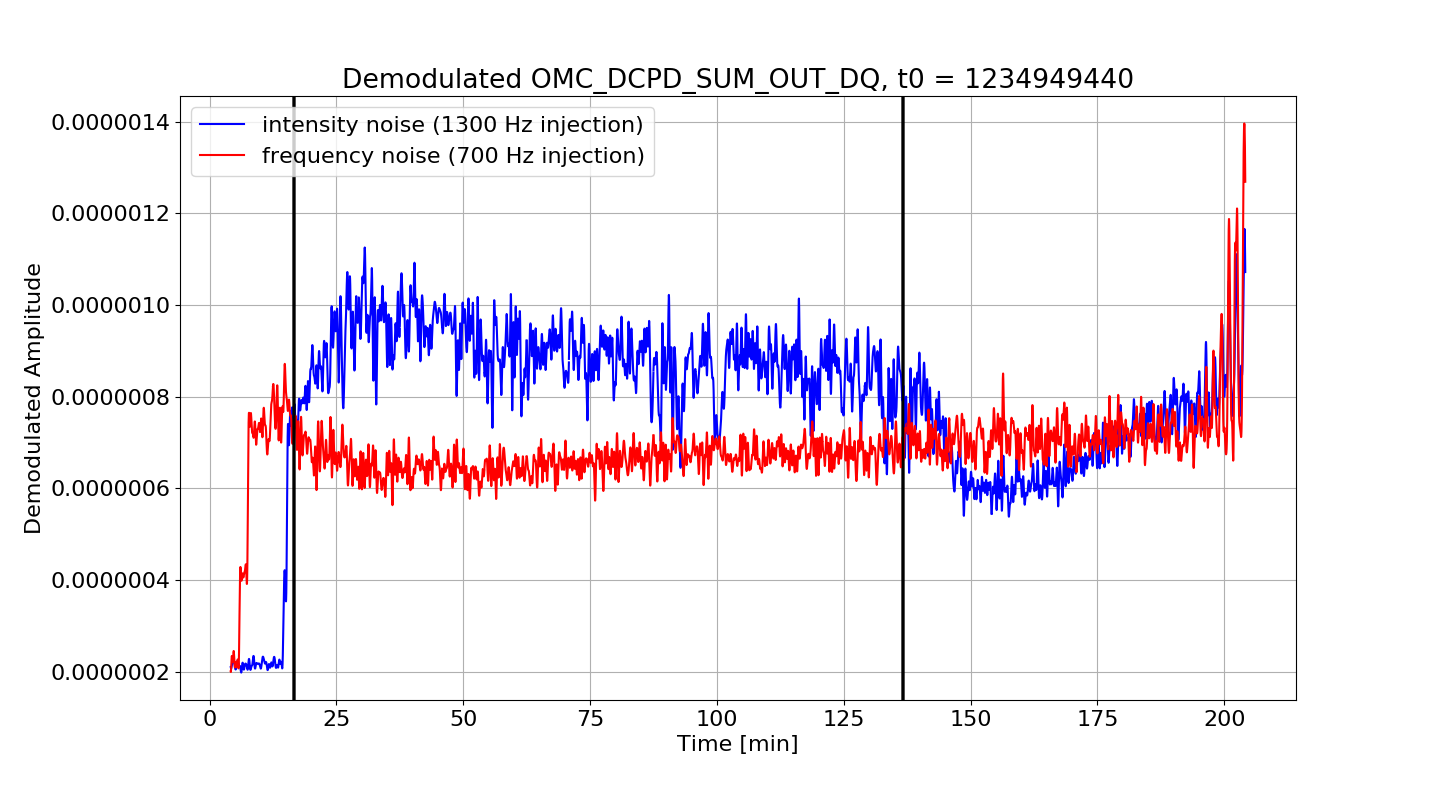
Pulled the data from OMC_DCPD_SUM_OUT_DQ corresponding to the injections of frequency and intensity noise lines as outlined in alog 47097.
The first black line is when the CO2 was switched on the second black line is when it got switched off. Looks like the mask increases intensity noise coupling but doesn't do much of anything to the frequency noise.
The ringing towards the end is likely some instability as there is a lock loss about 10 minutes after the data ends.

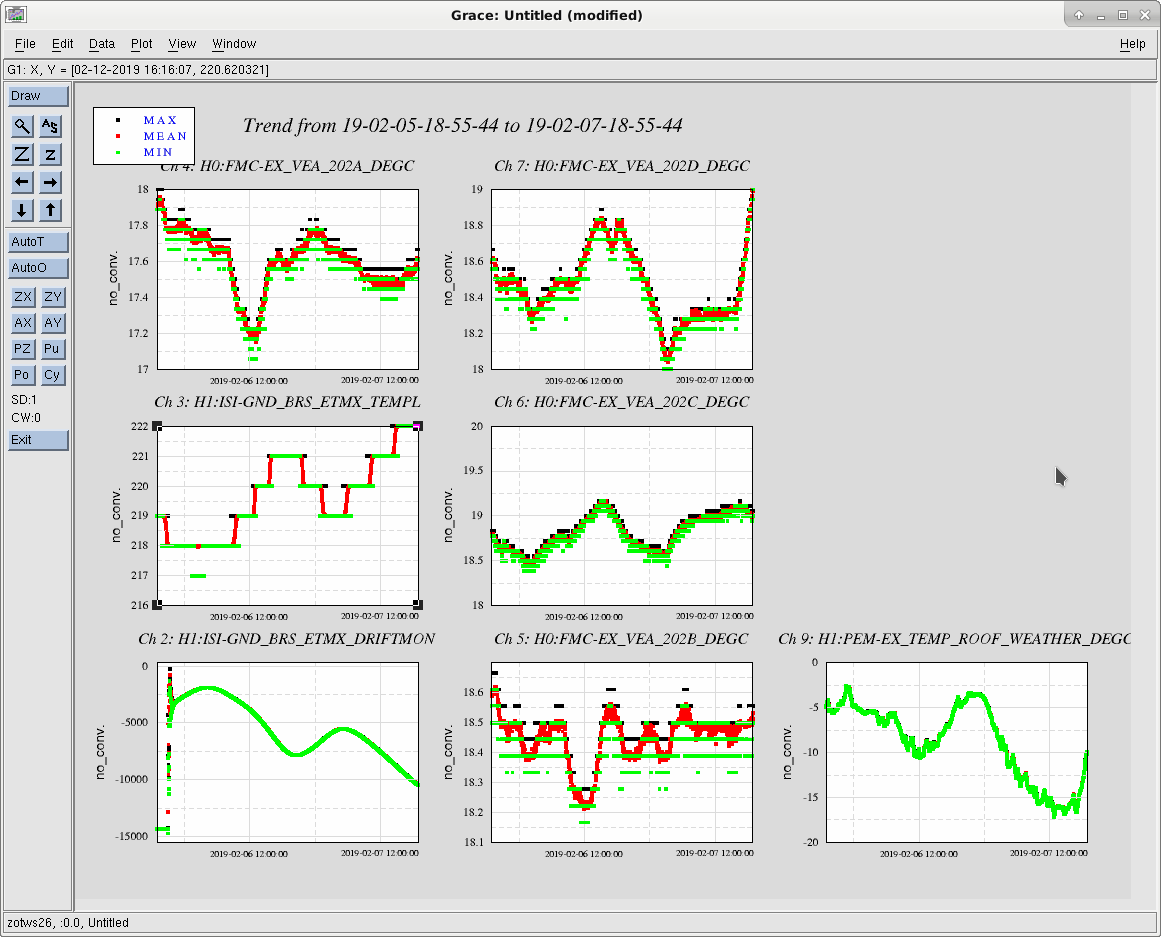
A couple weeks ago, Bubba changed the HVAC controls at the endstations, removing the B sensor from the loop, and just using the A C and D sensors. This seems to have helped the temperature stability of BRSX. First attached trends are for the last 2 days, the outside temps dropped about 10C, the driftmon moved about 3000 counts peak to peak, but the average position didn't really seem to move much. The second image are trends from 2 days around the 7th of this month, before Bubba's change. For this earlier time, the outside temps dropped about 10C outside, BRSX moved about 8000 counts peak to peak, with the average moving maybe 4000 counts.
Nice set of data Jim.
From the first set of plots, it looks like your EX BRS drift sensitivity to temperature is 0.2degC / 3750 cts * 32000 cts / CCD= 1.7 degC / CCD.
In other words when the box temperature changes by 1.7 degC, the brs would drift full range on the CCD.
For comparison, our least sensitive BRS at LLO is IY ~ 1.3 degC / CCD and most sensitive EY ~0.5degC / CCD.
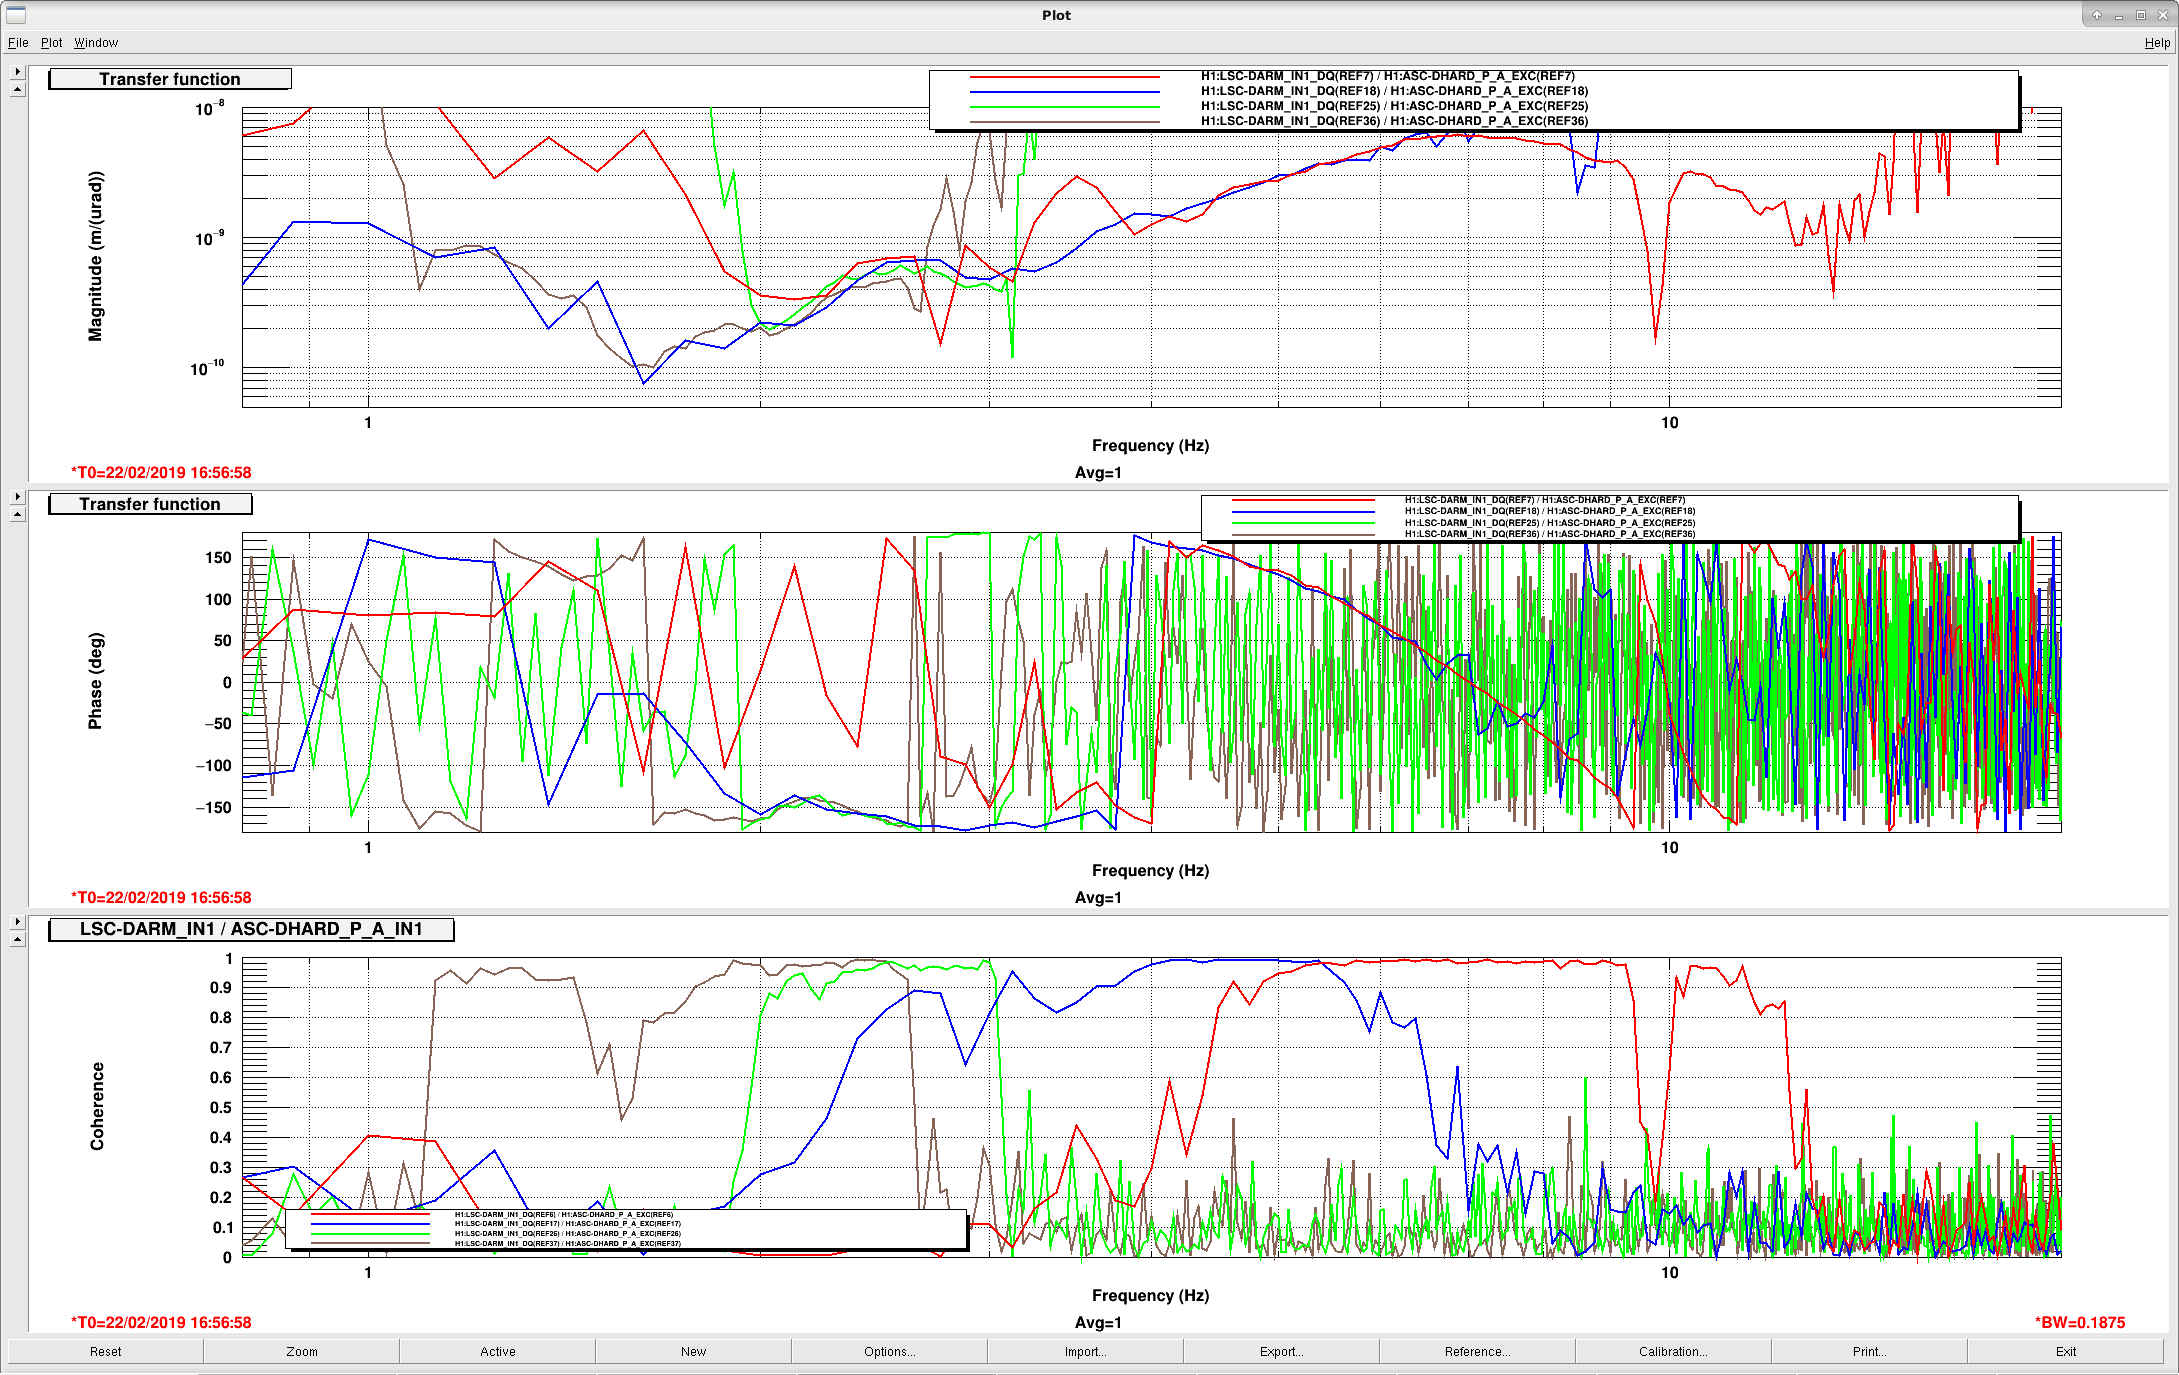
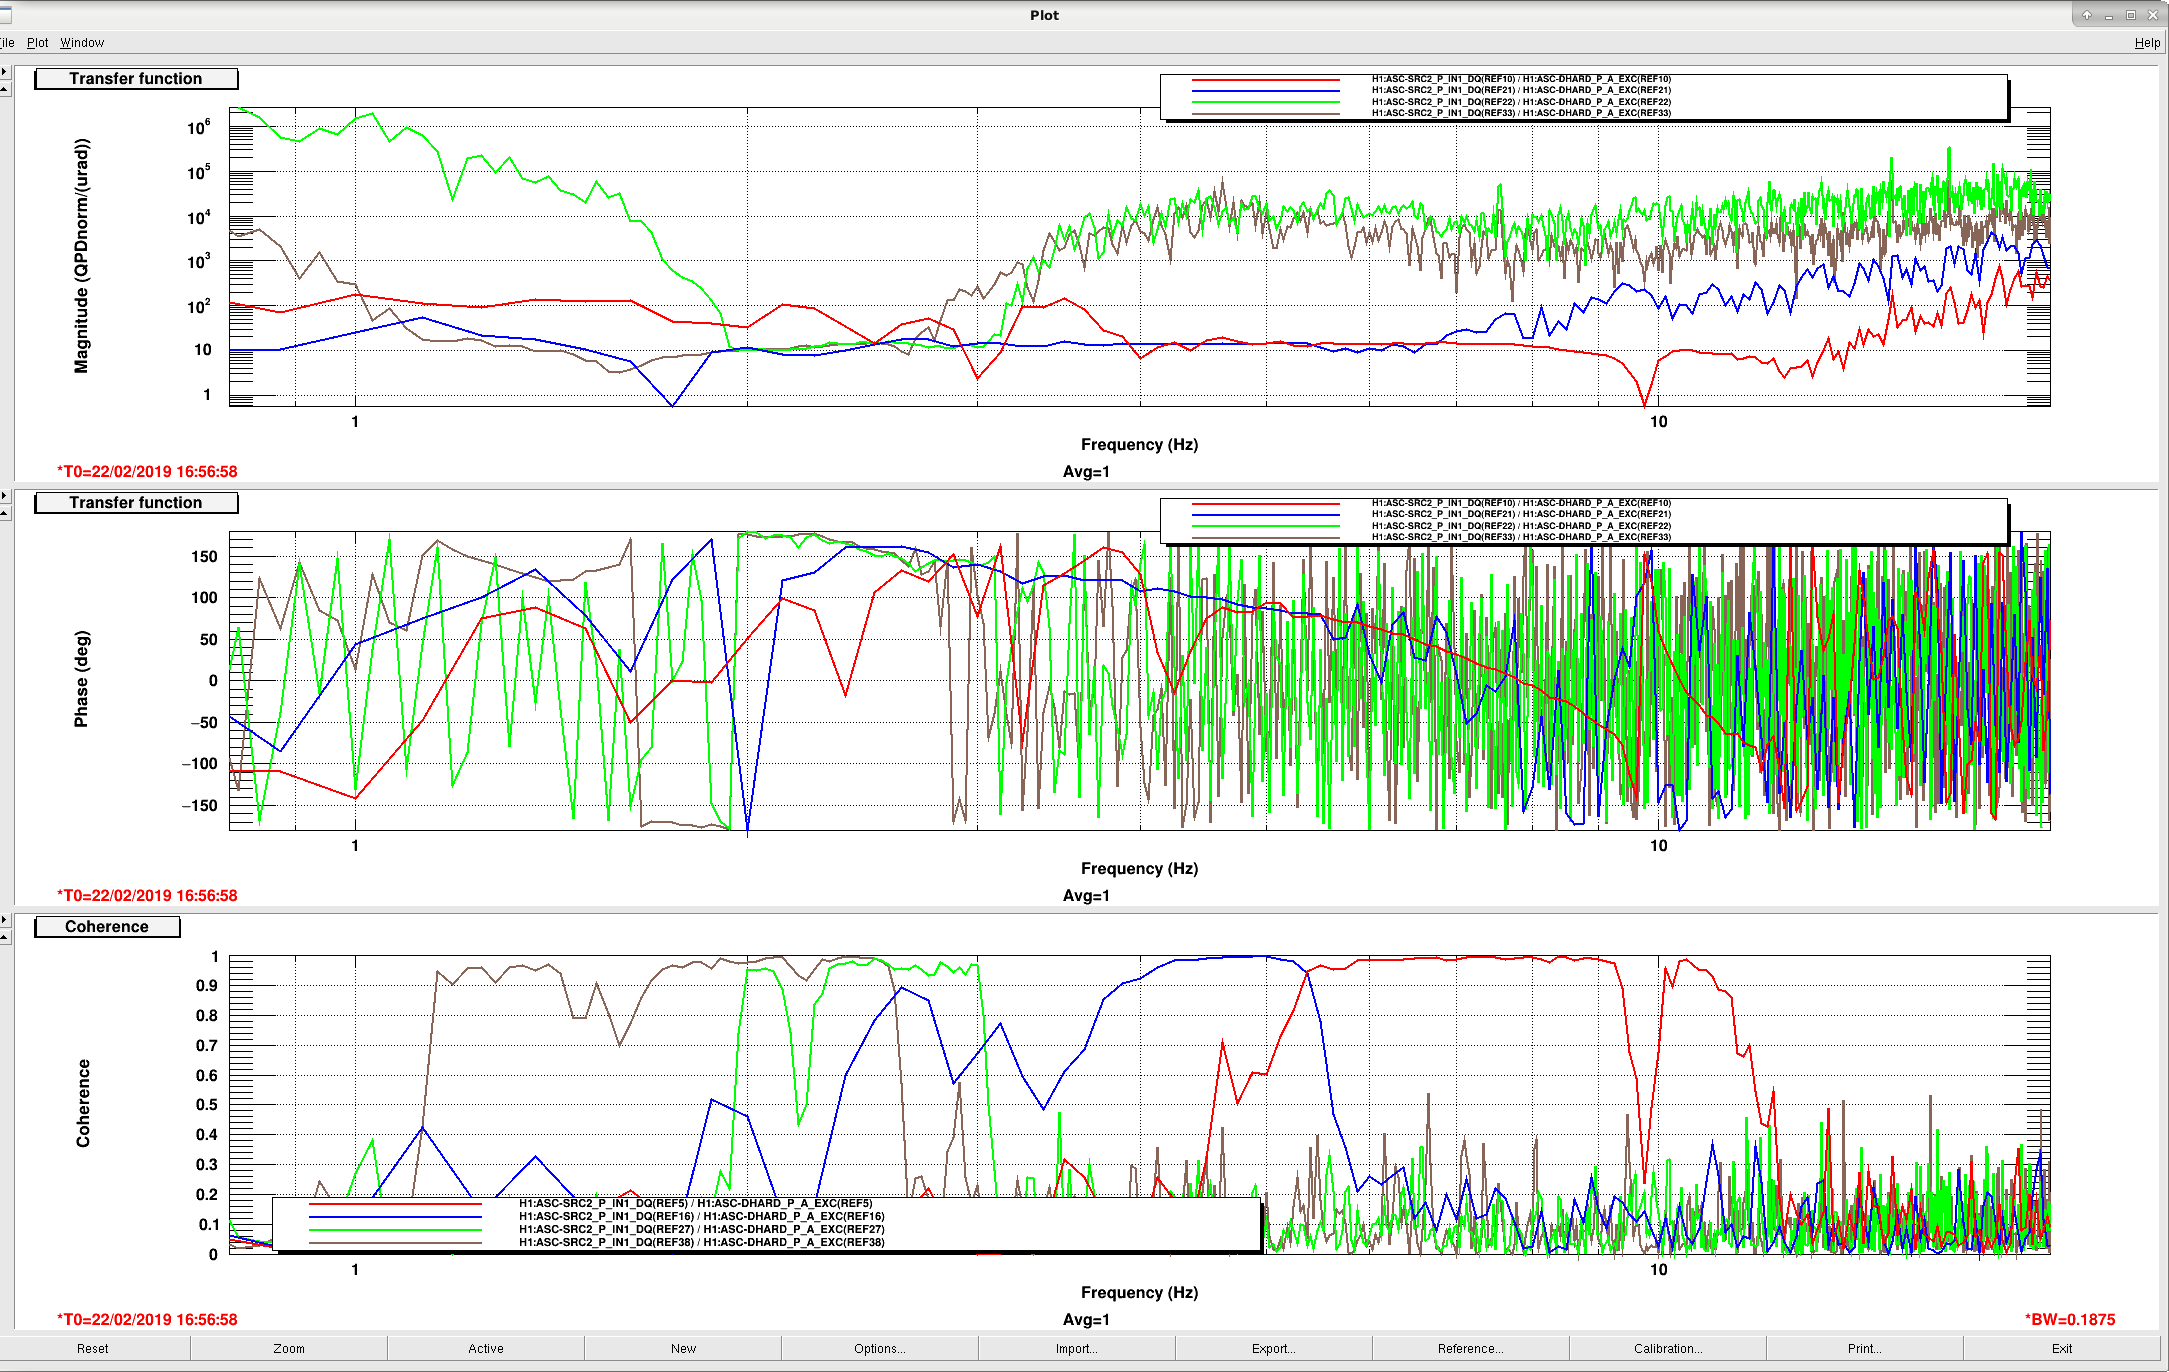
Sheila and Keita had pointed out that DARM could effect the DC centering loops on the AS WFS, which could then couple in to the ASC loops. This is particularly suspicious since we see a lot of DHARD motion when we lose lock due to the 4.5 Hz DARM ring-up.
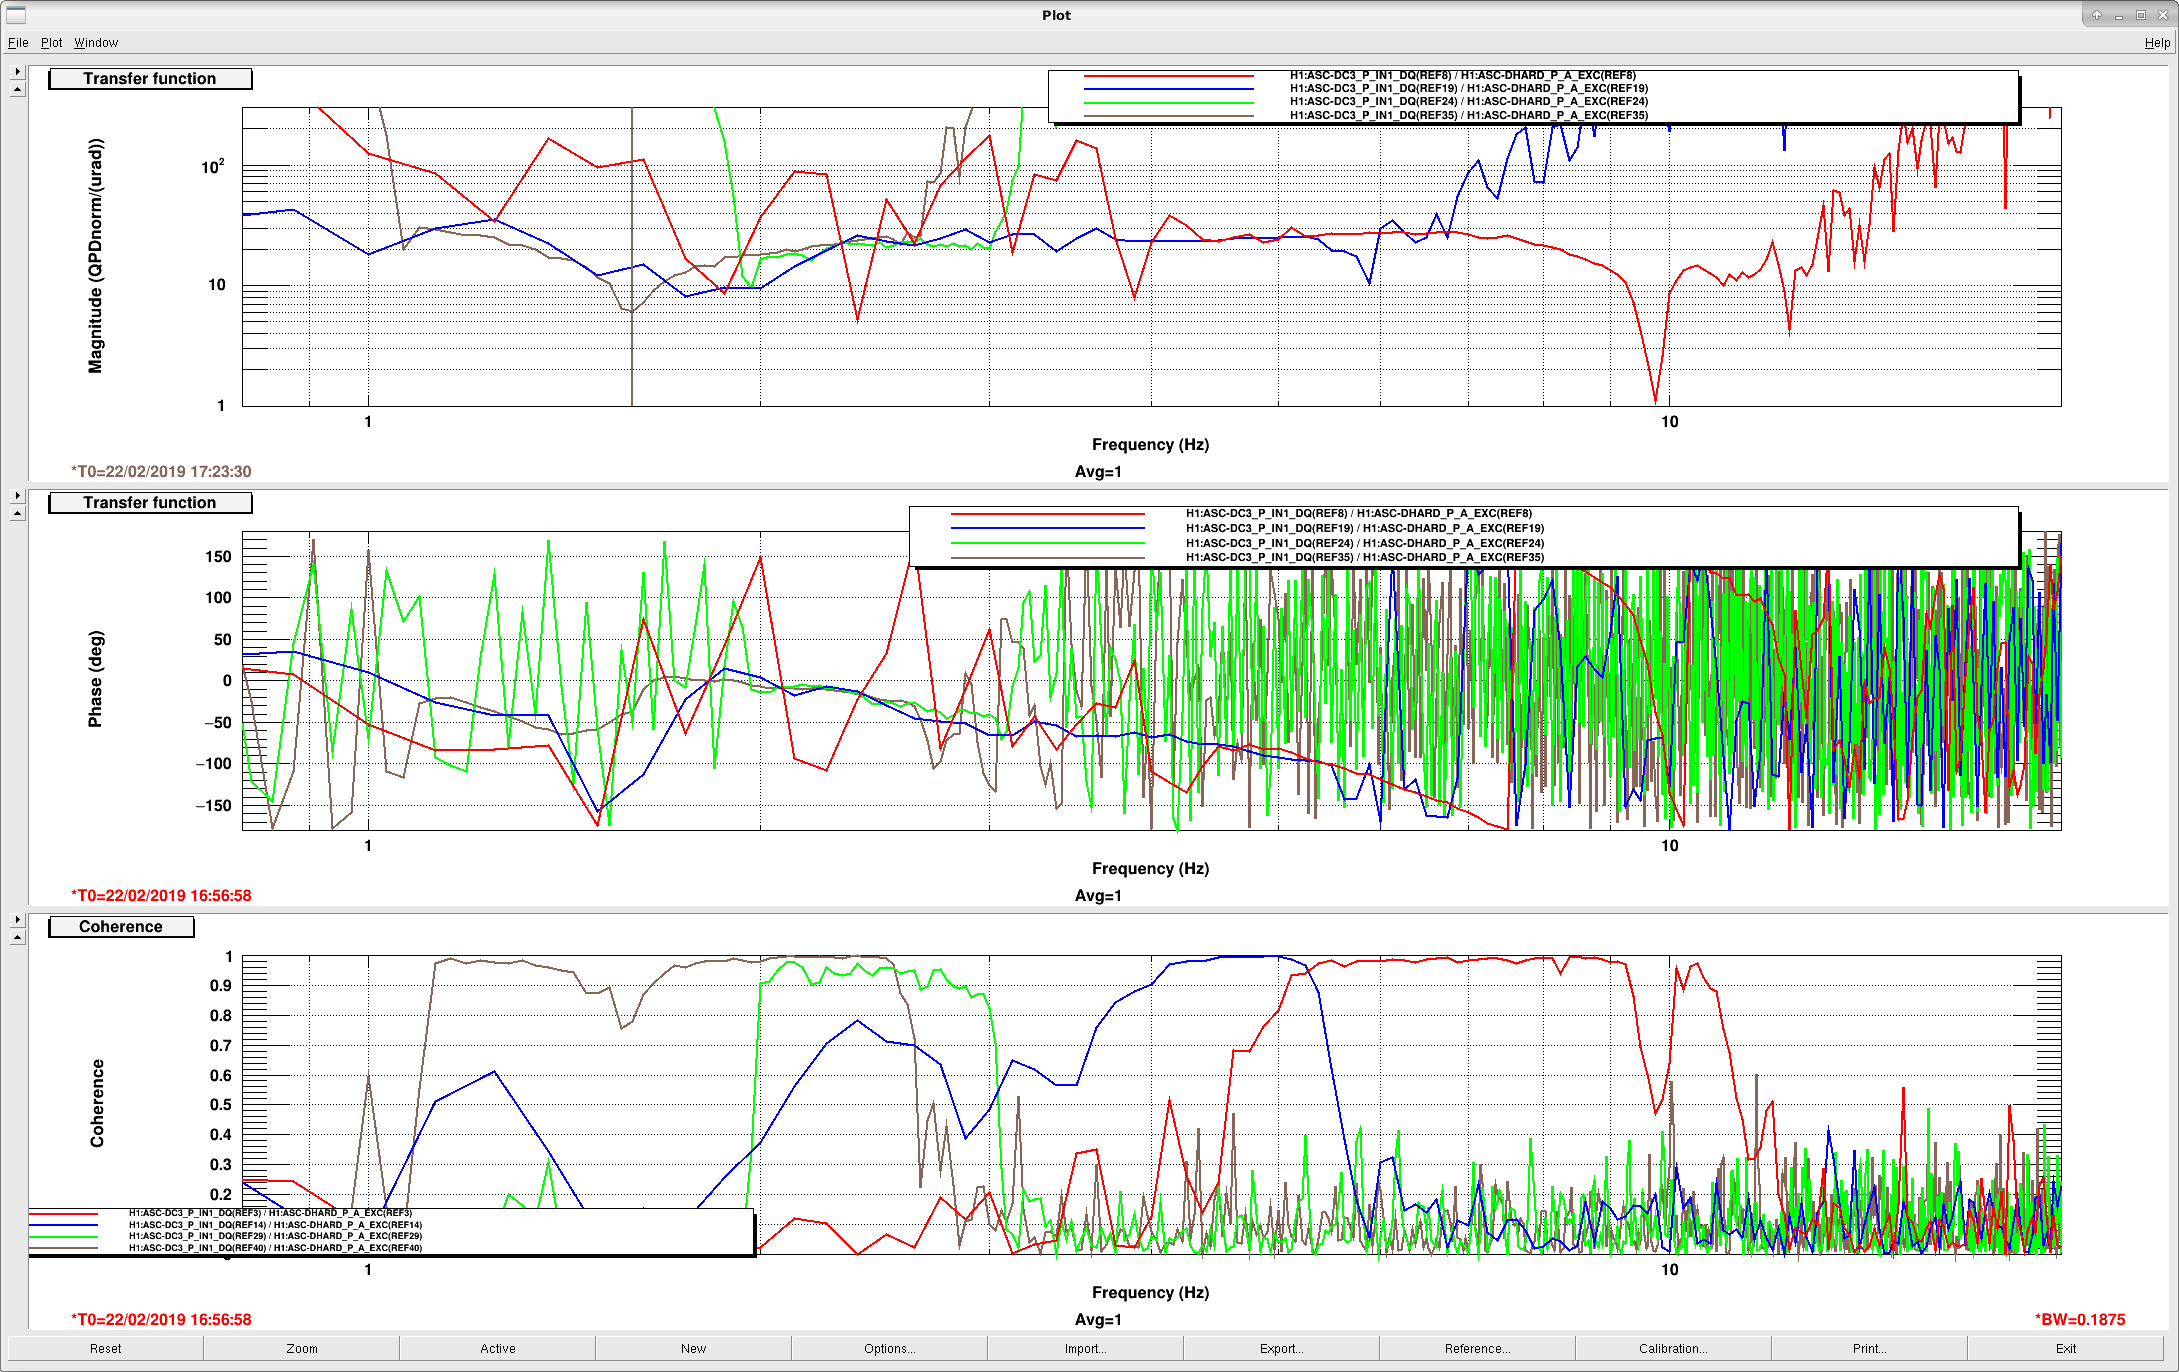
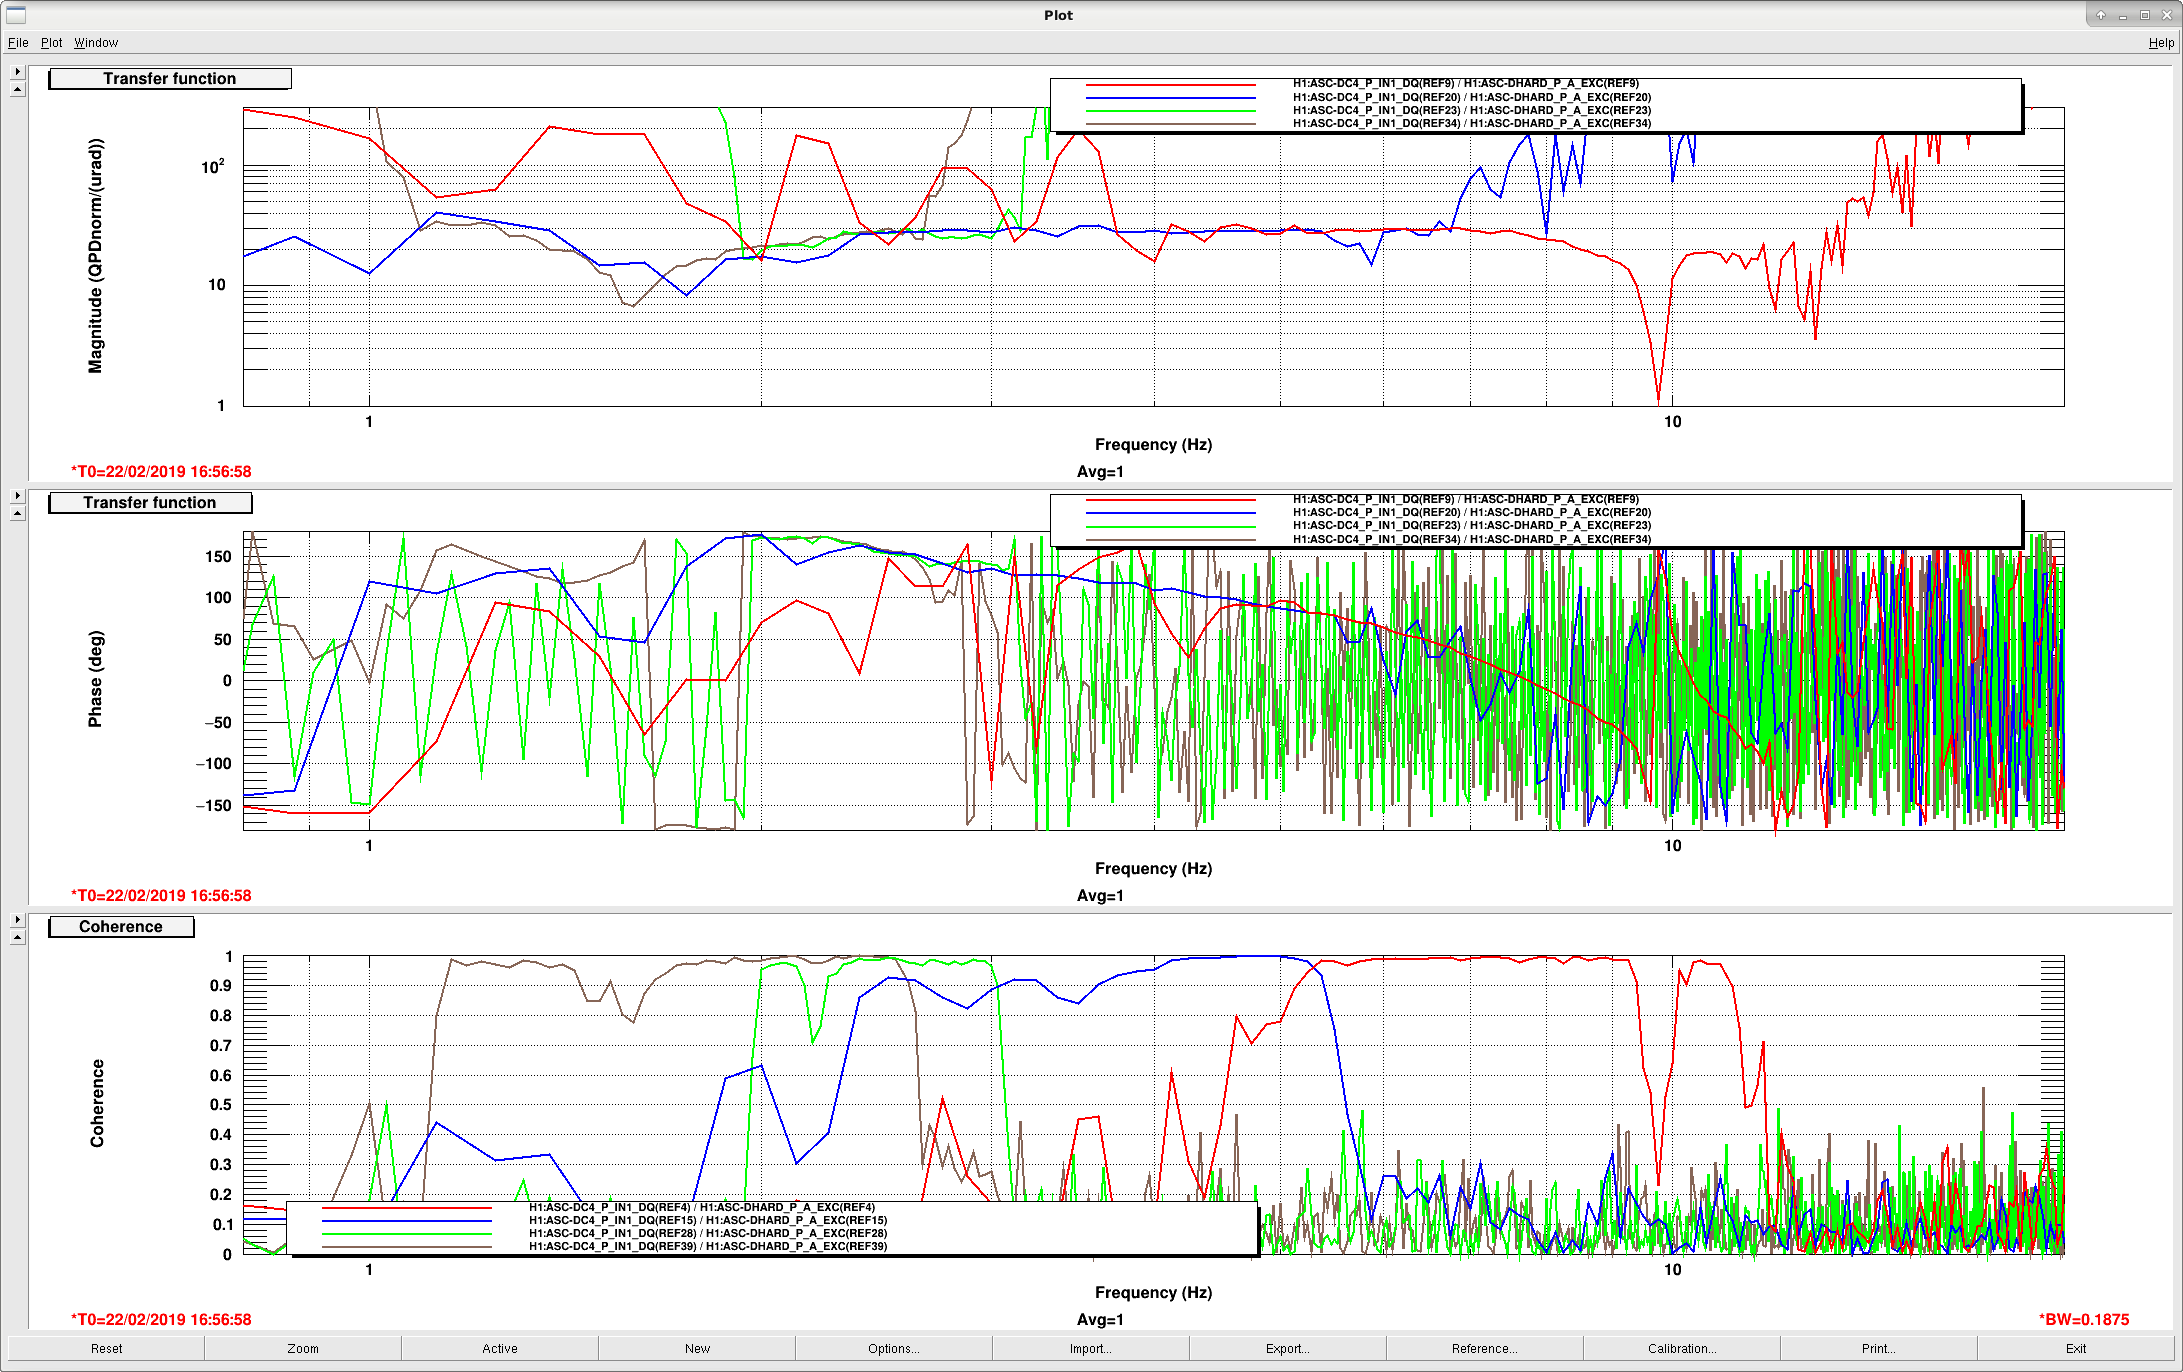
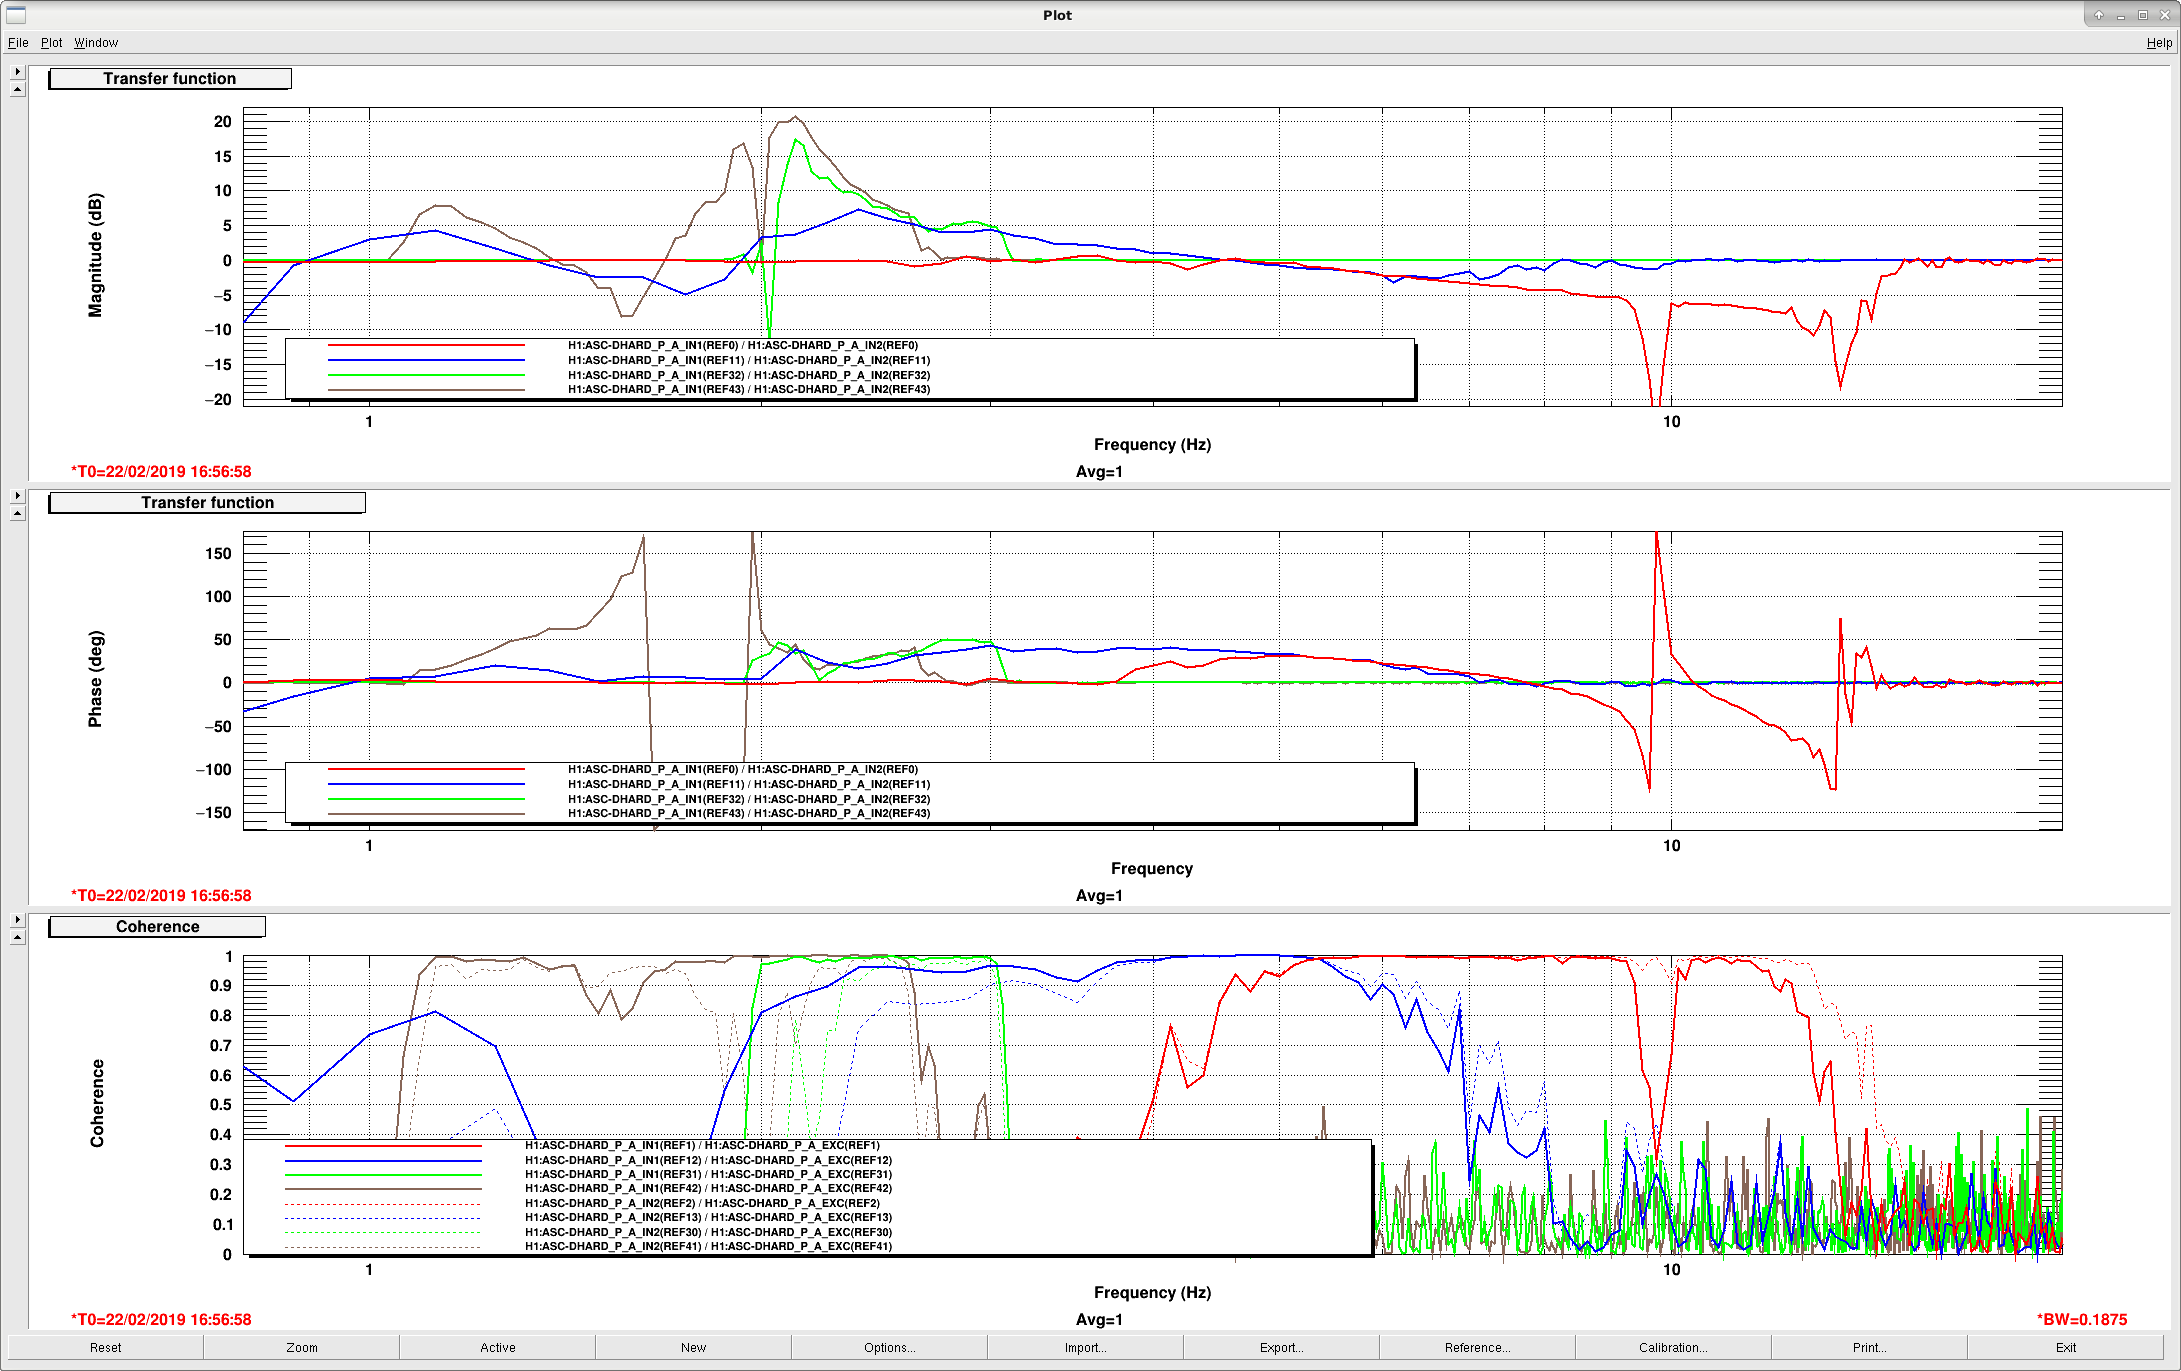
So, I made a DHARD_P measurement and plotted the response in DARM, DC3 (AS_A), DC4 (AS_B), and SRC2 (AS_C). Each attached figure has the relevant transfer function (either DHARD_P open loop gain, or DHARD_P_EXC to other degree of freedom's IN1), along with the coherence. I did 4 different frequency bands of noise injection, so that's why there are so many traces on each plot.
DC3, DC4, and SRC2 all seem to have fairly flat couplings to DHARD, with perhaps a bit of a dip around 1.6 Hz. DC3 and DC4's couplings are about 20 normalized QPD counts per DHARD microradian, while SRC2's coupling is about 10 normalized QPD units per microradian.
DARM's coupling with DHARD increases with frequency, but it's coupling level at 4.5 Hz is 2 picometers / microradian.
Recall from Hang's alog 47034 that we hope to keep our DHARD noise below 1nrad rms.
** Calibration of DHARD comes from alog 46453. Calibration of DARM comes from the inverse sensing function filters in H1:CAL-CS_DARM_ERR for O3. I could (but didn't) also multiply by Craig's fudge factor of 1.177 in the gain of that filter bank to give us a DARM to DHARD coupling of 2.3 pm/urad at 4.5Hz.
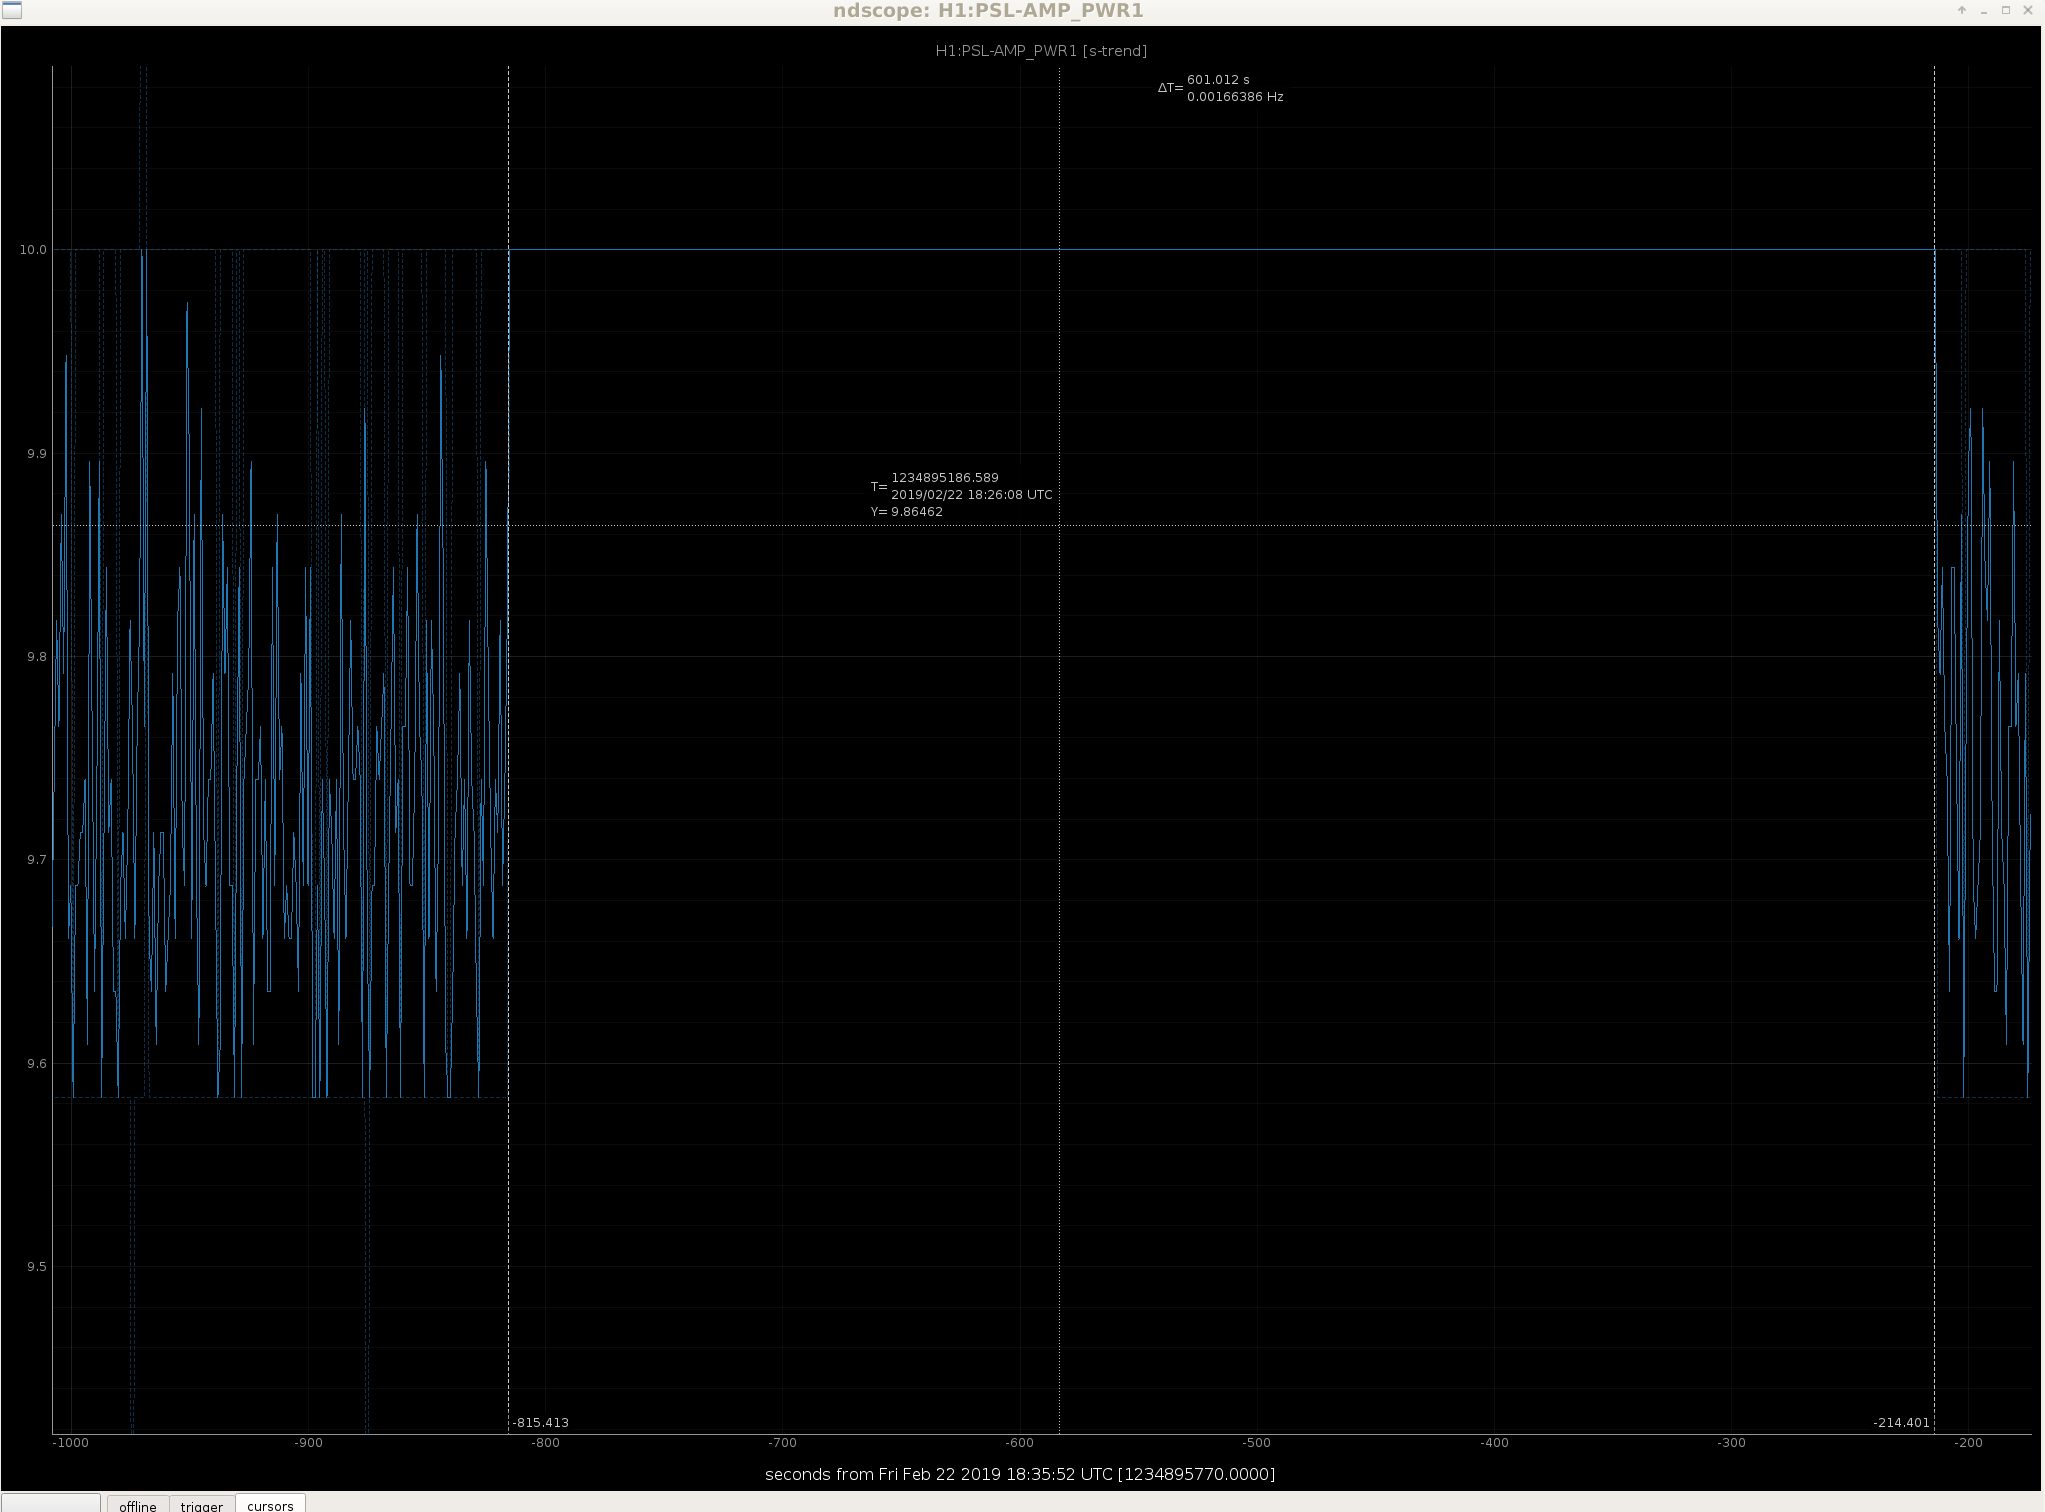
For almost exactly 10 mins, network connection to the h1pslctrl0 machine (Beckhoff PLC controller in the diode room) was lost. The DAQ-EDCU reported loss of channels, and the laser MEDM screen showed disconnected channels. It would appear it all came back by itself.
Problem was between the times 18:22:16 and 18:32:17 UTC Friday 22 Feb 2019.
Mike was contacted by American Rock Products with a heads up this morning regarding an explosion at one of their nearby sites: Kiona Quarry (which is basically just NW of Candy Mountain & about 12.5miles from LHO).
The explosion is set for Monday (2/25) at around 2pm. Have tagged DetChar & SEI in case members from those groups would like to look for this seismic signal.
Notes:
Following on from yesterday's FSS work and taking advantage of the earthquake, I carried out some
further FSS work.
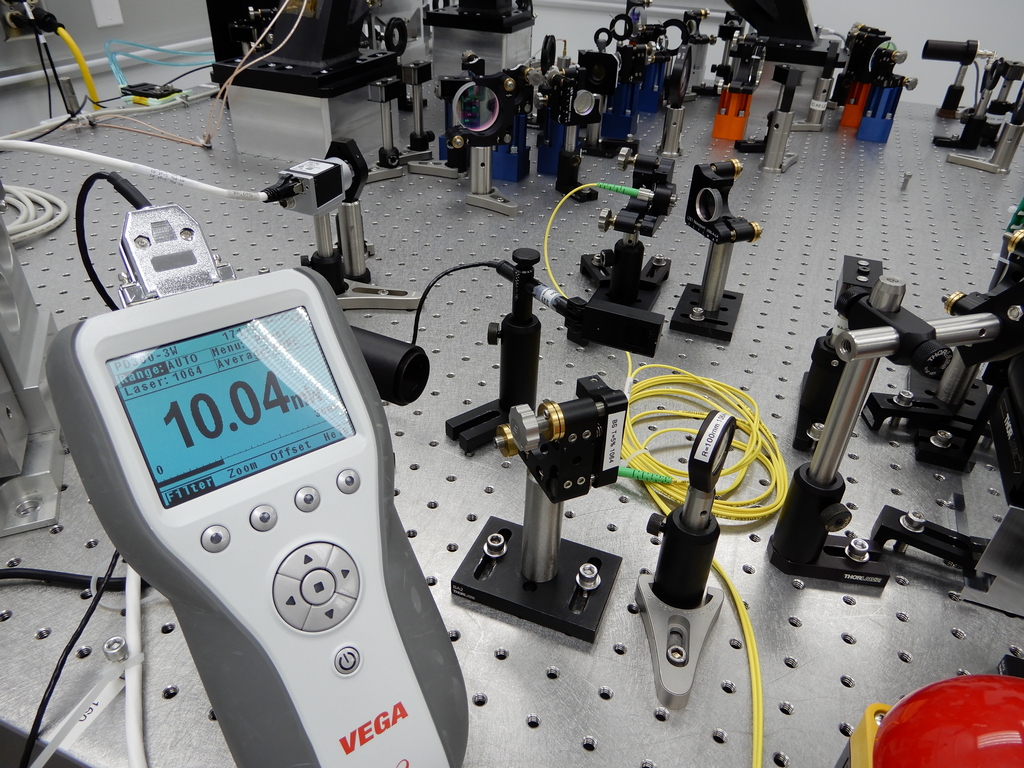
All power measurements were done with the Ophir PD300-3W.
- ~29 mW at base of periscope
- ~1.5 mW incident on RF photodiode
Noticed that there was a bit of beam clipping on the 21.5 MHz EOM, with the beam hitting around 9 o'clock
looking at the input face. After correcting for this the power on the RF photodiode increased to ~2.8 mW.
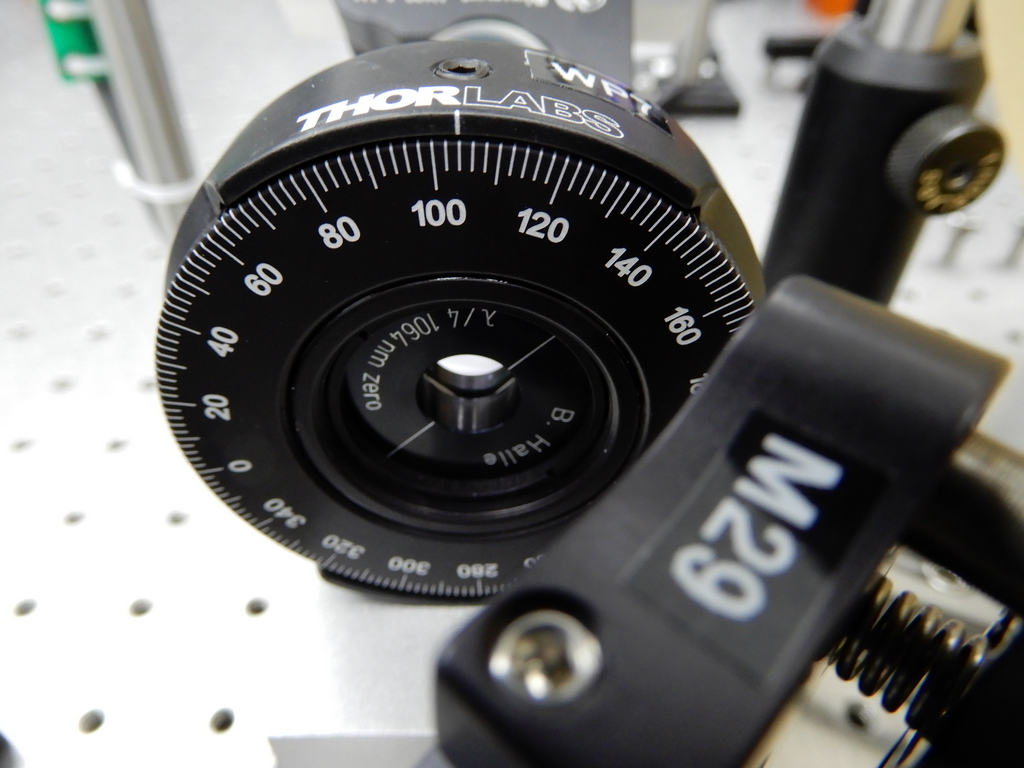
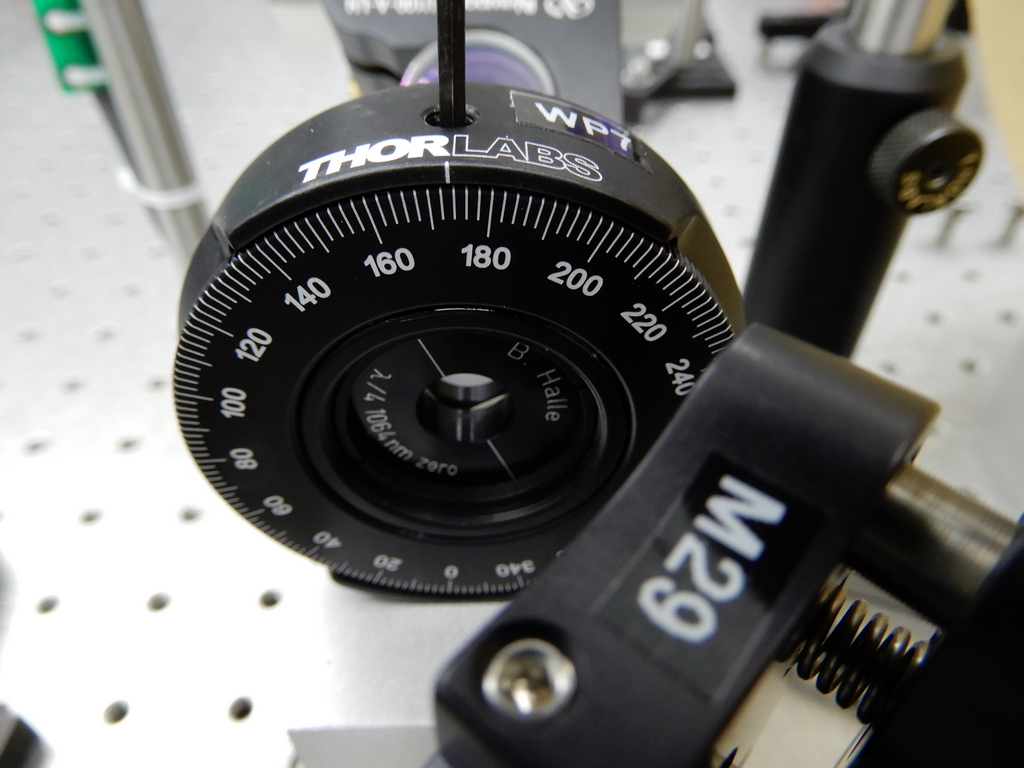
Adjusted the quarter-waveplate at the base of the periscope to give 3 mW on the RF photodiode. The UGF is now
back up over 500 kHz. At this point the transmission monitor was saturated at 10.95 V. (C28F15.TIF, C28F15.TXT
for data). Measured the power before the turning mirror in front of the ALS fibre to be ~7 mW at this point
(see Before.jpg for quarter waveplate angle). I adjusted the quarter waveplate located after the reference cavity
and this increased the power at the ALS fibre and decreased the transmission signal (see After.jpg and Power.jpg).
The transmission signal at this point was ~2.1. The maximum power to the ALS fibre appears to be somewhere between
11-12 mW and the transmission signal drops as low as 1.5 V. Thus far I haven't thought too much about what all
the polarising optics do.
Data files attached to this entry:
TP3-1.txt mixer monitor signal when the FSS was locked
DARK.txt mixer monitor signal when light to the RF photodiode was blocked
LOCKED.txt mixer monitor signal when the FSS was locked (data memory was recorded)
OLTF.txt open loop transfer function taken just prior to my exiting the enclosure (a reality check)
CG28FG15.txt transfer function out to 5 MHz
Richard trended the ALS fibre monitor signal, there was a small increase noted.
RF photodiode signal level: unlocked 290 mV locked 58-59 mV
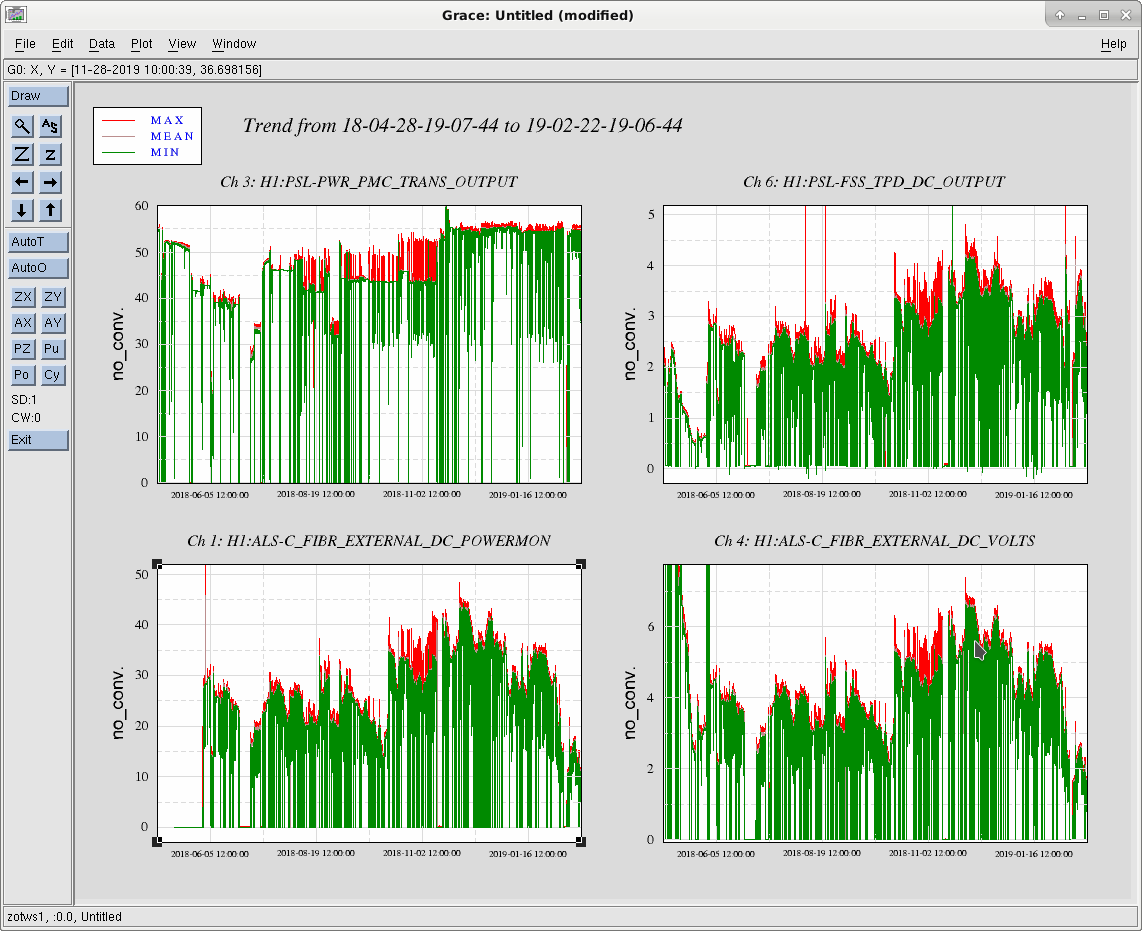
The astute reader will have noticed that with ~30mW input, there is ~6mW in reflection and 12mW or less available to the ALS fiber. The attached plot shows a 300 day trend of the PMC power, the reference cavity transmitted power and the power available to the ALS fiber. In general, the transmitted and ALS power are tracking until about 2 weeks ago, when the ALS power started dropping relative to the transmitted power. As of today, there is about a factor of 2 missing.
Attachment One: Peter's three FSS OLGs plotted together. Attachment Two: Full 30W Lock CARM, IMC, and FSS OLGs together. (FSS OLG not taken during full lock)
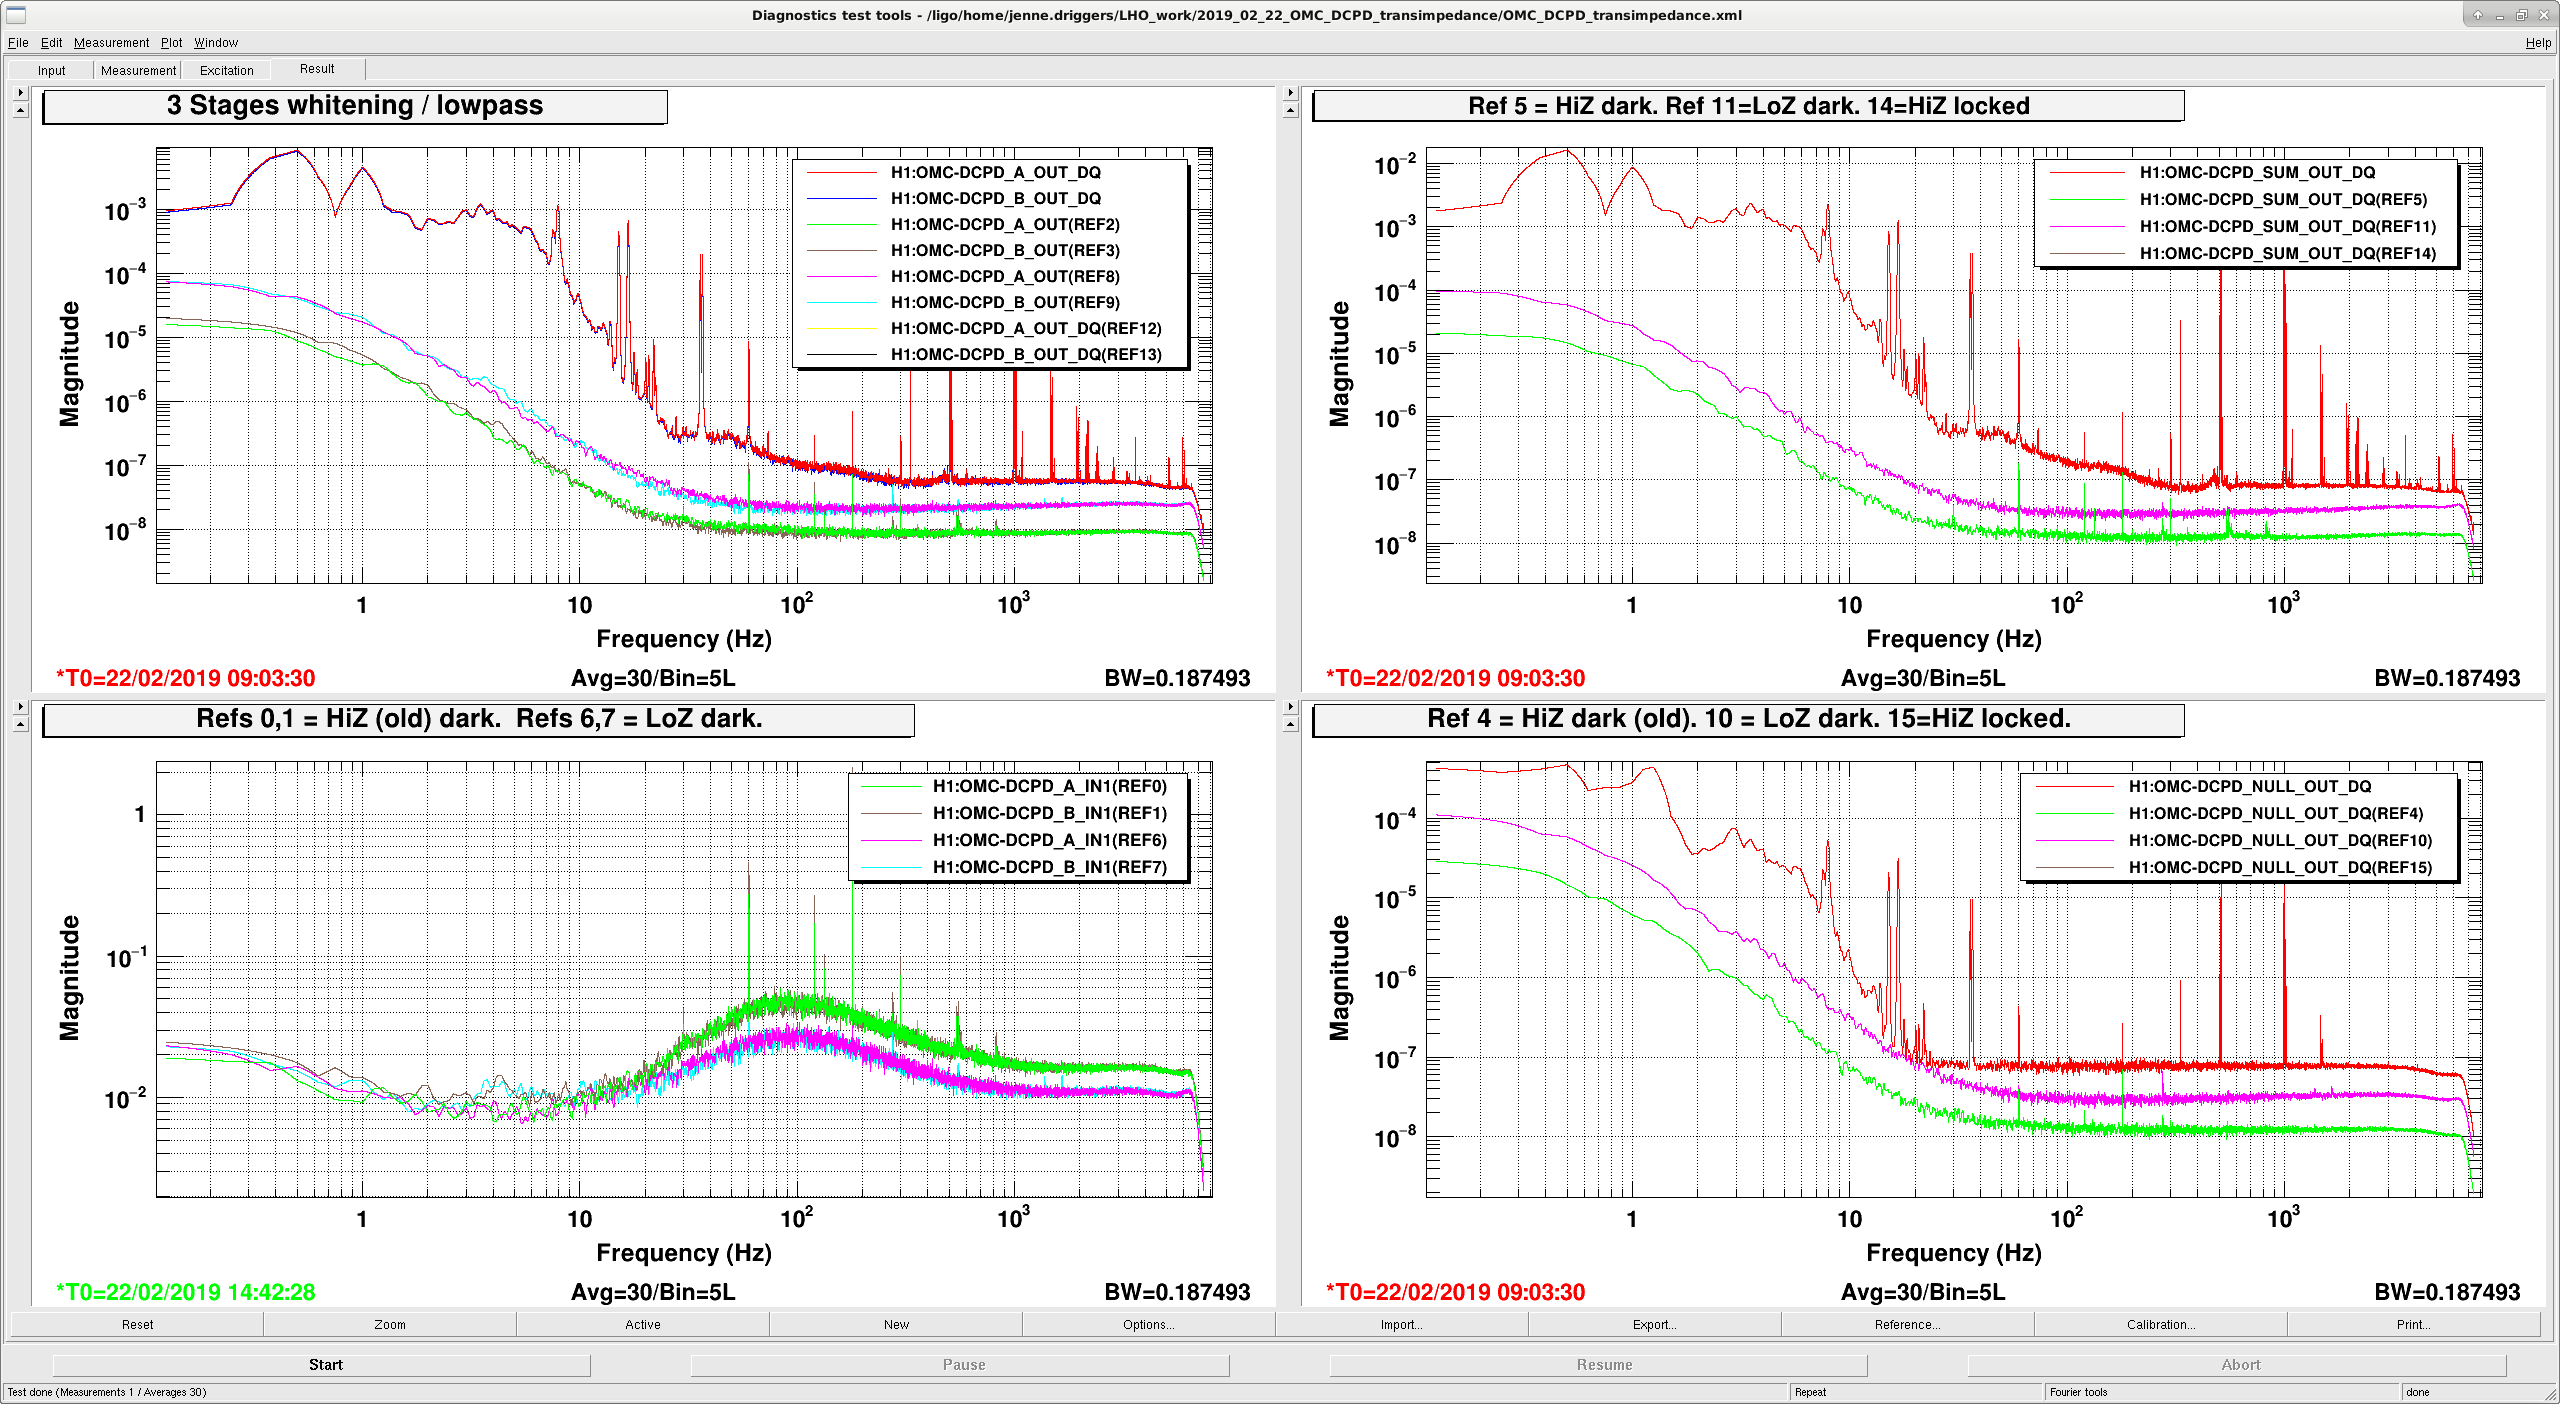
As a step toward trying larger DARM offsets, I have flipped the rocker switch on the OMC DCPD whitening chassis to its LowZ state. To match this, I have turned off the HiZ filter in the H1:OMC-DCPD_A and H1:OMC-DCPD_B filter banks.
Attached are some spectra showing the dark noise measured this morning in both the old HiZ and new LowZ states, as compared to last night's 30W lock at NomLowNoise. All of these spectra are taken with both stages of whitening on, as well as the lowpass. Green and brown are with the old HiZ settings, pink and cyan are with the current LowZ settings, and the red and dark blue (also refs 12-15 underneath the red and blue) are from last night's lock with the usual 20mA of light.
In prep_dc_readout, with OMC locked, I changed the height of the dither line from 750 counts to 630 counts, to match the OMC length UGF of 6 Hz measured 2 days ago.
We reverted these changes (dither amplitude, HiZ switch and compensation for HiZ) so that people can get to low noise tonight without redoing the feedforward.
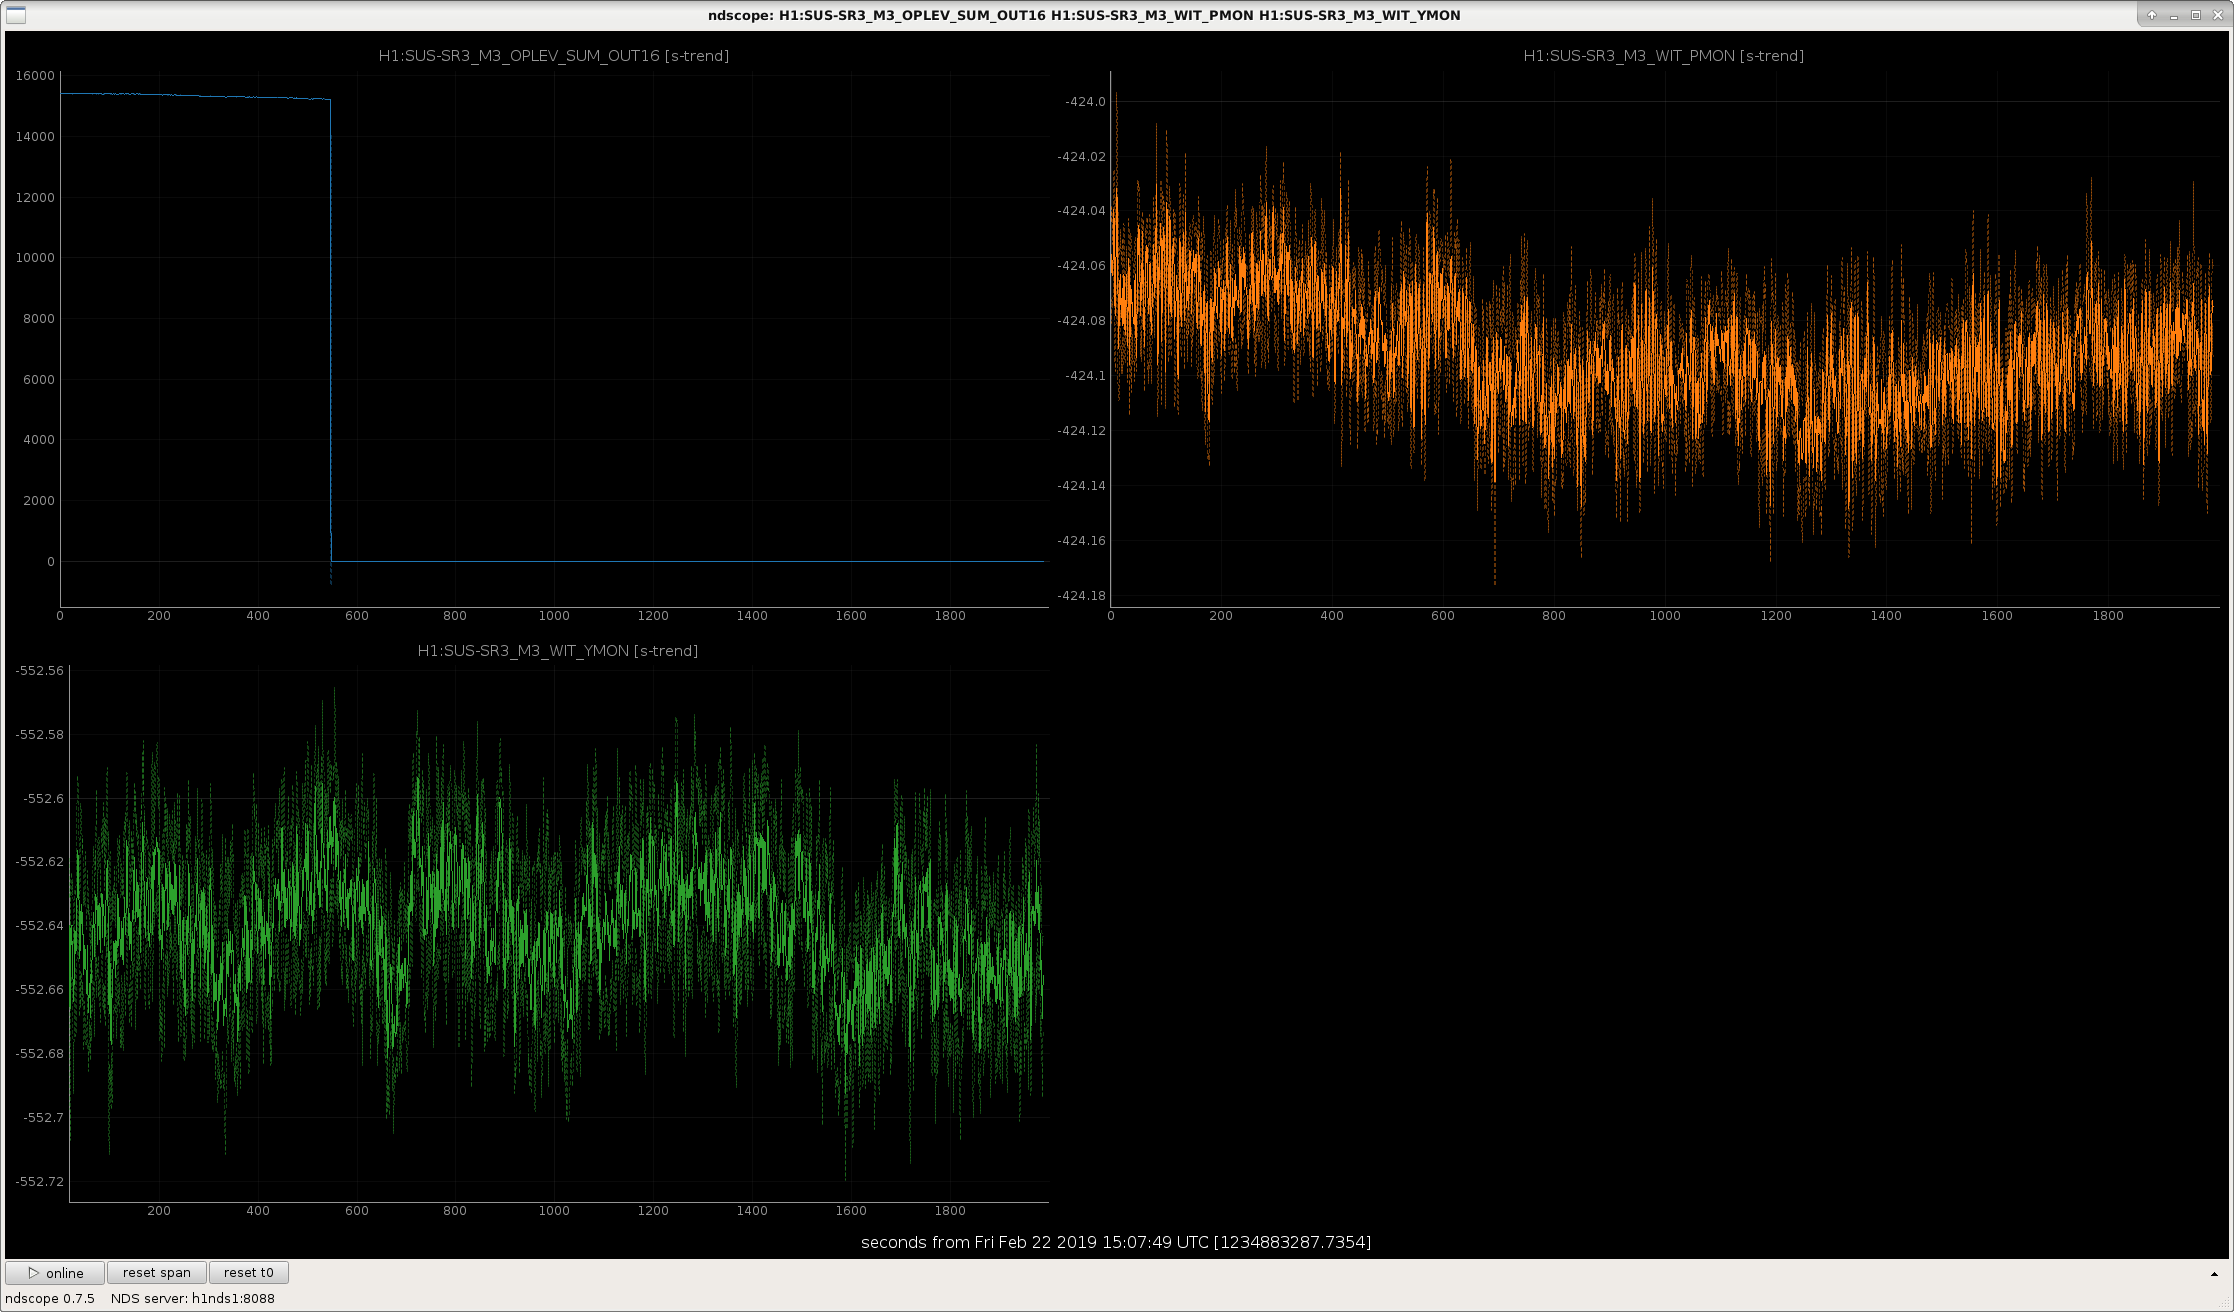
Just noticed a warning on DIAG_MAIN that SR3 oplev was low. SR3 is aligned, and I restored all SEI to their nominal status (clicked "recover EQ", and requested sensor correction to be WINDY), so there should be no reason for SR3's oplev to be low.
Attached is a plot of the Oplev sum, as well as the lowest stage OSEMs, showing that the optic didn't move, but the sum disappeared.
Recall that we do not use the SR3 oplev for any damping, so while we should fix this soon, we shouldn't break lock to do so.
Now associated with FRS Ticket 12394.
Will investigate at the next available opportunity, likely during the next maintenance window (2-26-19), unless this gets deemed a higher priority. Tagging this as AOS in addition to SUS (OpLev is technically an AOS system).
The laser is definitely dead. Unfortunately, due to a series of consecutive failures in the lab while tweaking our spare stock for glitch-free operation, we currently have no spare lasers; all of our spares (our 3 designated spares and 2 others) are currently getting refurbished. I have pinged the manufacturer for an update, will request a loan from 3IFO to use in the interim.
Georgia, Craig Tonight we locked on ETMX by increasing the L2 LOCK drive to 30 from 15 again. Sheila, Keita and Jenne have all been thinking about the DARM actuator stability, we decided to not duplicate their effort and try what worked last night. We were able to reach NLN with the attached settings (attachment 1). We retuned the MICH feedforward for our new actuator change. The guardian now turns on MICHFF FM5 "Feb 21", the filter in attachment two. If we return to a low PUM gain of 15, we will have to engage FM4 "Feb16b" instead. Georgia measured the 9 MHz RIN coupling to DARM, and found it to be high again (like the green in attachment one of alog 47008). This is after the original OMC PZT driver was reinstalled yesterday. I tuned the front-end calibration for higher PUM gain and adjusted the DARM ERR gain from 1.2 to 1.177 to get correct shot noise. Georgia shut the SQZ beam diverter to avoid the anti-squeezing we were injecting. This got us back to low noise with no squeezing, with 83 Mpc range reported (which is actually around 90 Mpc with proper calibration). The low frequency noise seems to be worse, this could be a result of the DARM actuator change not being properly calibrated, or real because of increased 9 MHz coupling. A 7.7 magnitude earthquake hit. We pressed the Really Big Earthquake button.
Tagging this with SEI & OpsInfo for JIm.
[Jenne, Georgia, Sheila, Craig, Dan, Danny]
We've lost lock a few times today while trying to increase the power, so that we can try the new DARM loop scheme (crossover shaping) that Sheila has cooked up. It turns out that the problem was an ezca connection error in the main part of the INCREASE_POWER guardian state, causing the ISC_LOCK guardian to freeze while trying to reconnect. However, before the error, ISC_LOCK guardian has already requested the laser power guardian to increase the laser power, which it starts to do. But then, since ISC_LOCK guardian is frozen, the DARM fringe offset is not being adjusted to match, and we lose lock.
Happily, the ezca commands that were causing trouble were setting the RPC filter states, but they don't actually need to be in the guardian at all, since we don't ever change them. So, they are now removed from that state, and we're almost ready to try increasing the power again.
This is another instance of the bug reported in FRS Ticket 12067. Not sure what other documentation exists on this (I feel like much more progress has been made, but not reported in *that* ticket).
This is an update on my previous entry 46952.
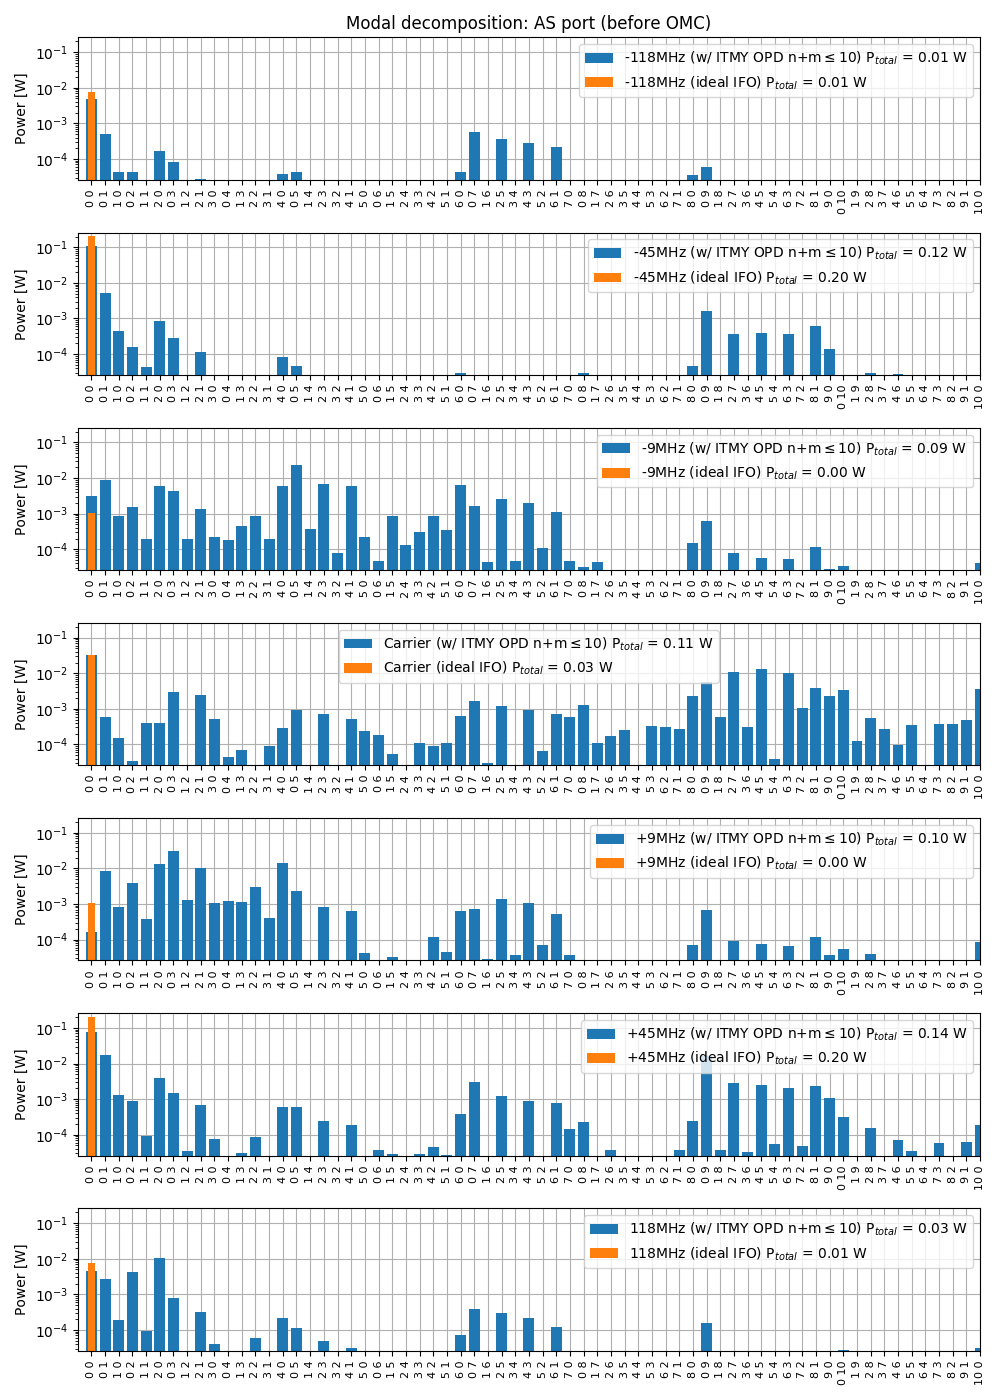
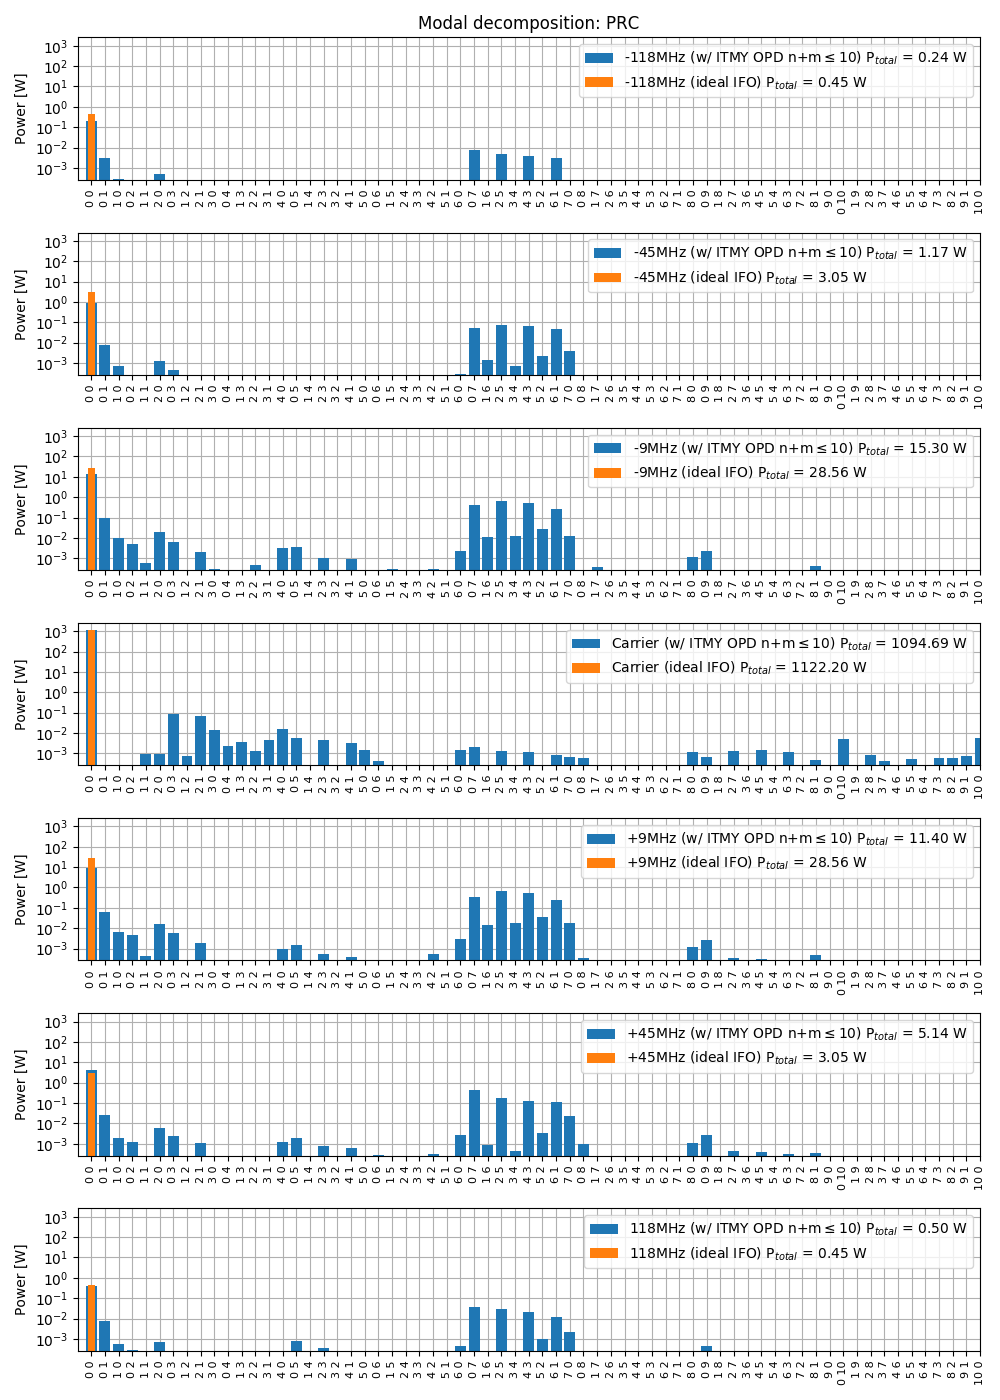
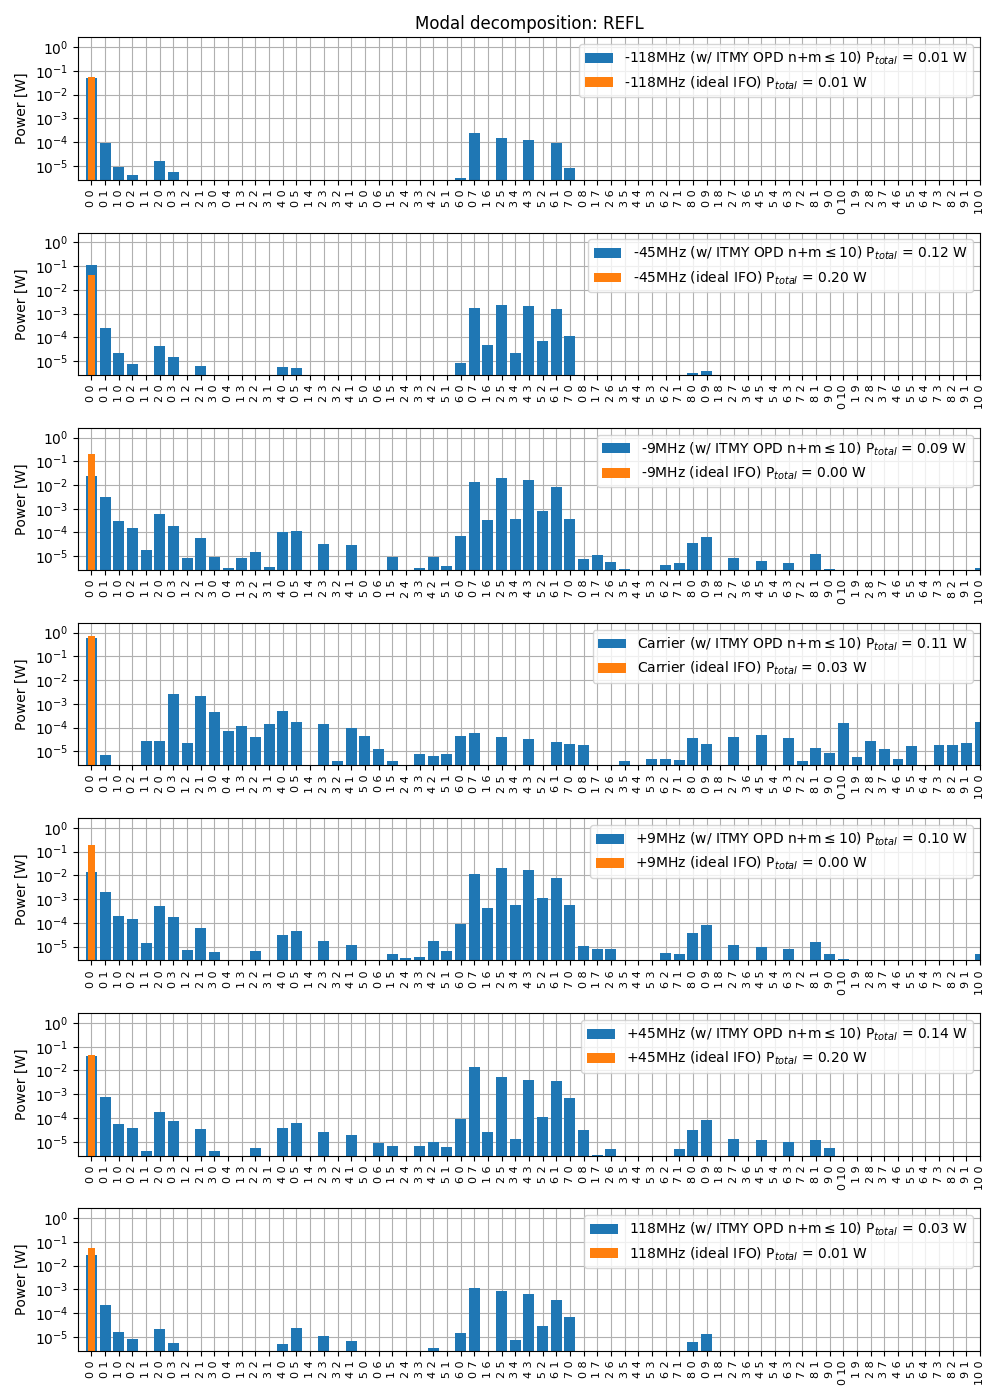
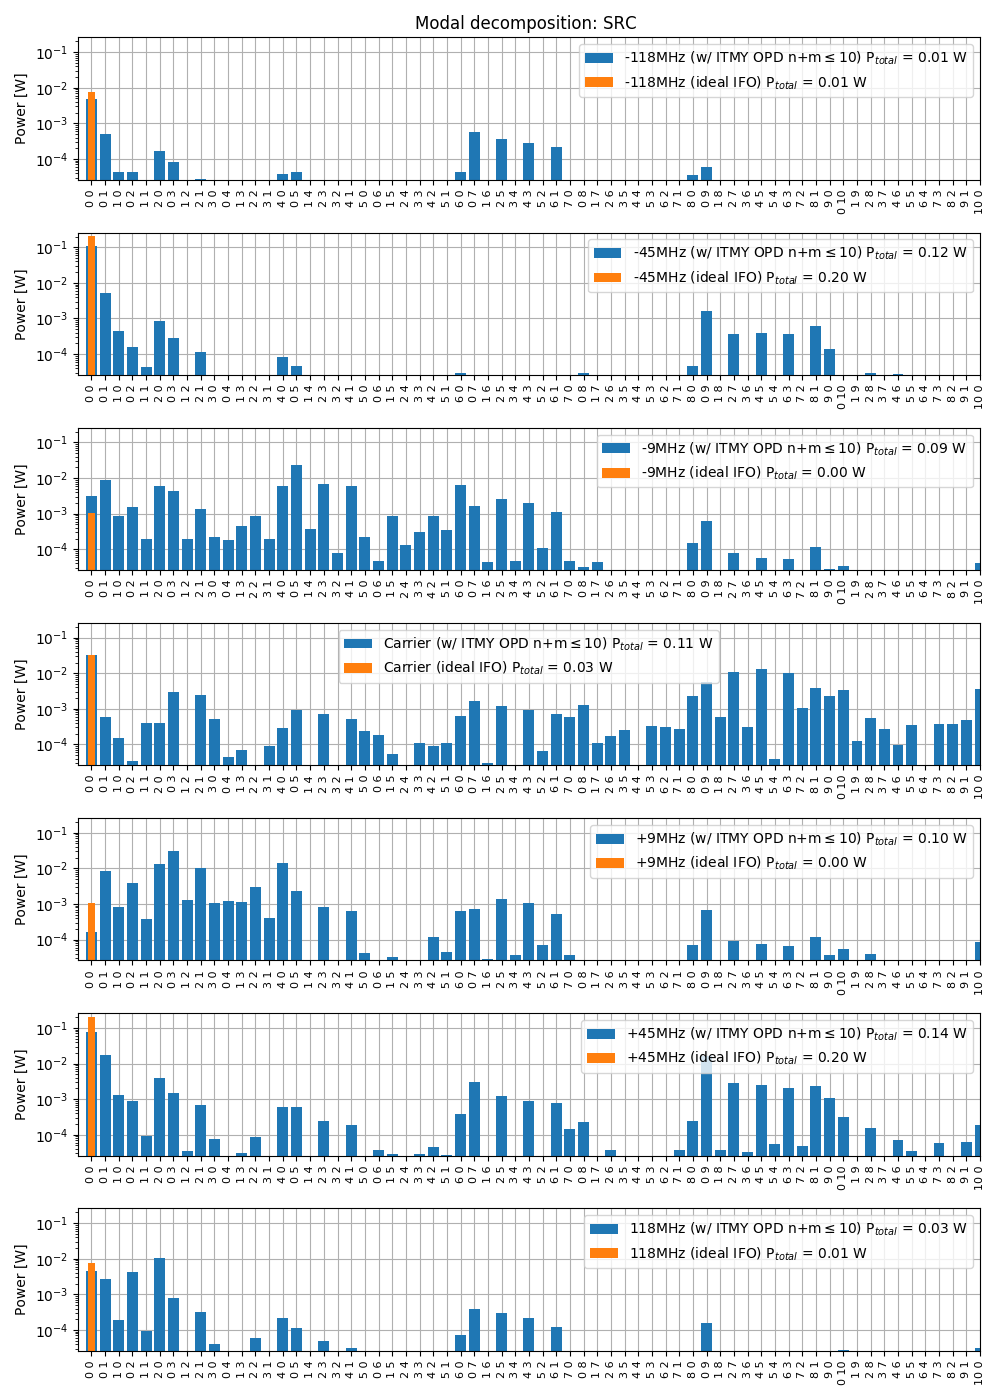
Using the optical path distortion measured by the HWS (provided by Aidan, see also 46127 and 46888) I simulated the mode content at various ports in a dual recycled Fabry-Perot Michelson interferometer. The simulation is done with MIST, using Hermite Gauss modes up to order 10, and locking the interferometer using simulated error signals. In the original entry 46952, the path distortion was about half of what we expect at 26 W (because the wavefront map provide by Aidan corresponds to a power step of about 15 W). So in the results considered here I multiplied the map by two.
Only the optical path distortion in the ITM is included, there is no deformation of the HR surface.
Each of the attached plots show the distribution of power into each modes, assuming 26 W of input power, 60ppm or round trip losses per arm. The orange traces are there for comparison, to show that in a ideal IFO, all power is in the fundamental TEM00 mode.
Interestingly, the point absorber seems to create some 9MHz sideband power in modes of order 9 at the AS port, which we believe are the culprit for the high RF9 modulation noise coupling.
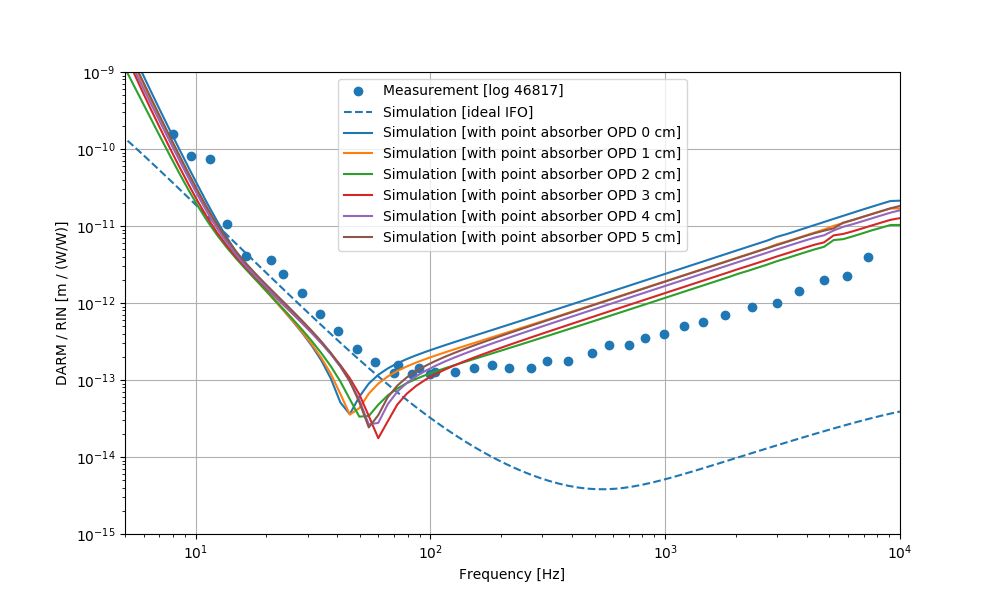
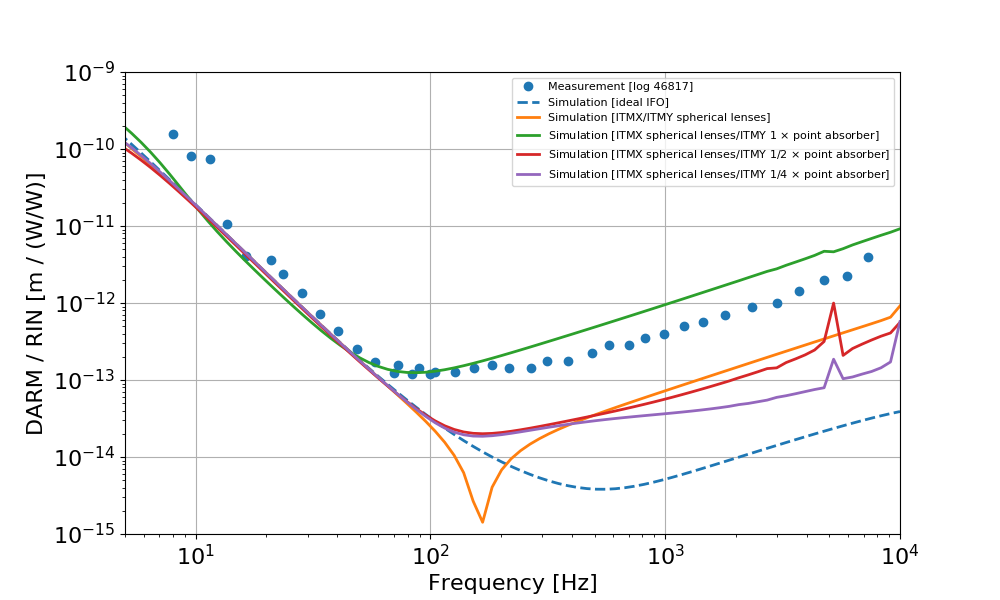
Using the same simulation described above, I could compute the coupling of input RIN to DARM. The result is shown below, compared with Craig's measurement from 46817. The distortion produced by the point absorber seems to explain qualitatively (even though not quantitatively) the increased coupling at high frequency. The magnitude of the coupling is larger in simulation, but roughly ok. The coupling scales with the amplitude of the optical path distortion, and it's likely to change if the point absorber is moved by a cm or two, probably within the uncertainty of the beam center position in the HWS map.
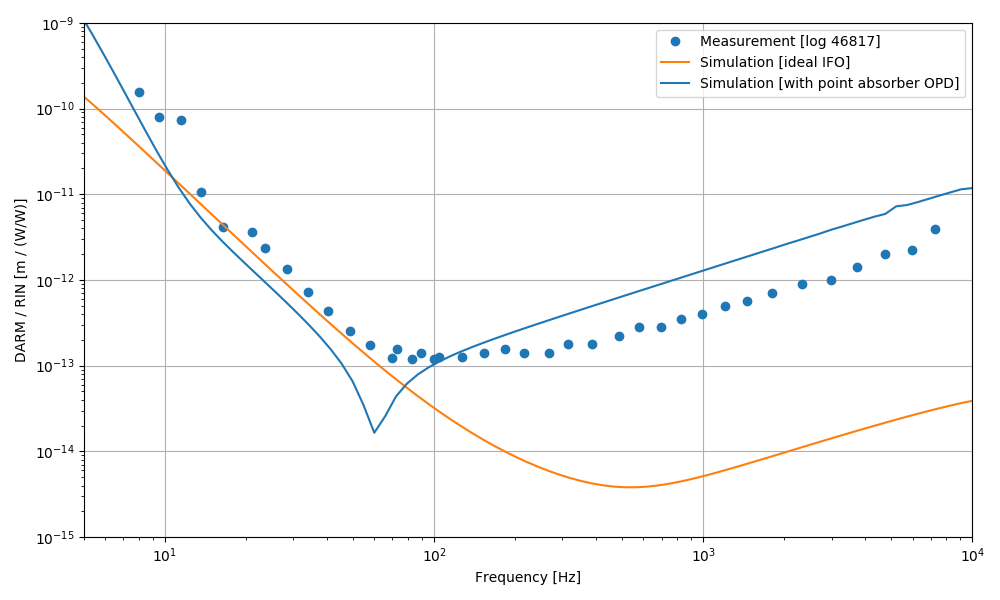
According to the simulation, there is about 1 mW of 9MHz sidebands power in the modes of order 9. Assuming that all of this mode is transmitted through the OMC, we can compute the DARM noise corresponding to sideband RIN:
DARM = SB_RIN * SB_POWER / (OMC_DC / DARM)
From 46985 I estimate a DARM noise at a level of DARM ~= 5e-20 m/rHz at 100 Hz. From the simulation I have OMC_DC / DARM ~= 1.2e10 W/m, from which
SB_RIN ~= 4e-7 /rHz
is the level of 9 MHz sidebands RIN that would explain the DARM noise, assuming it's all due to RF9 TEM9 mode leakage.
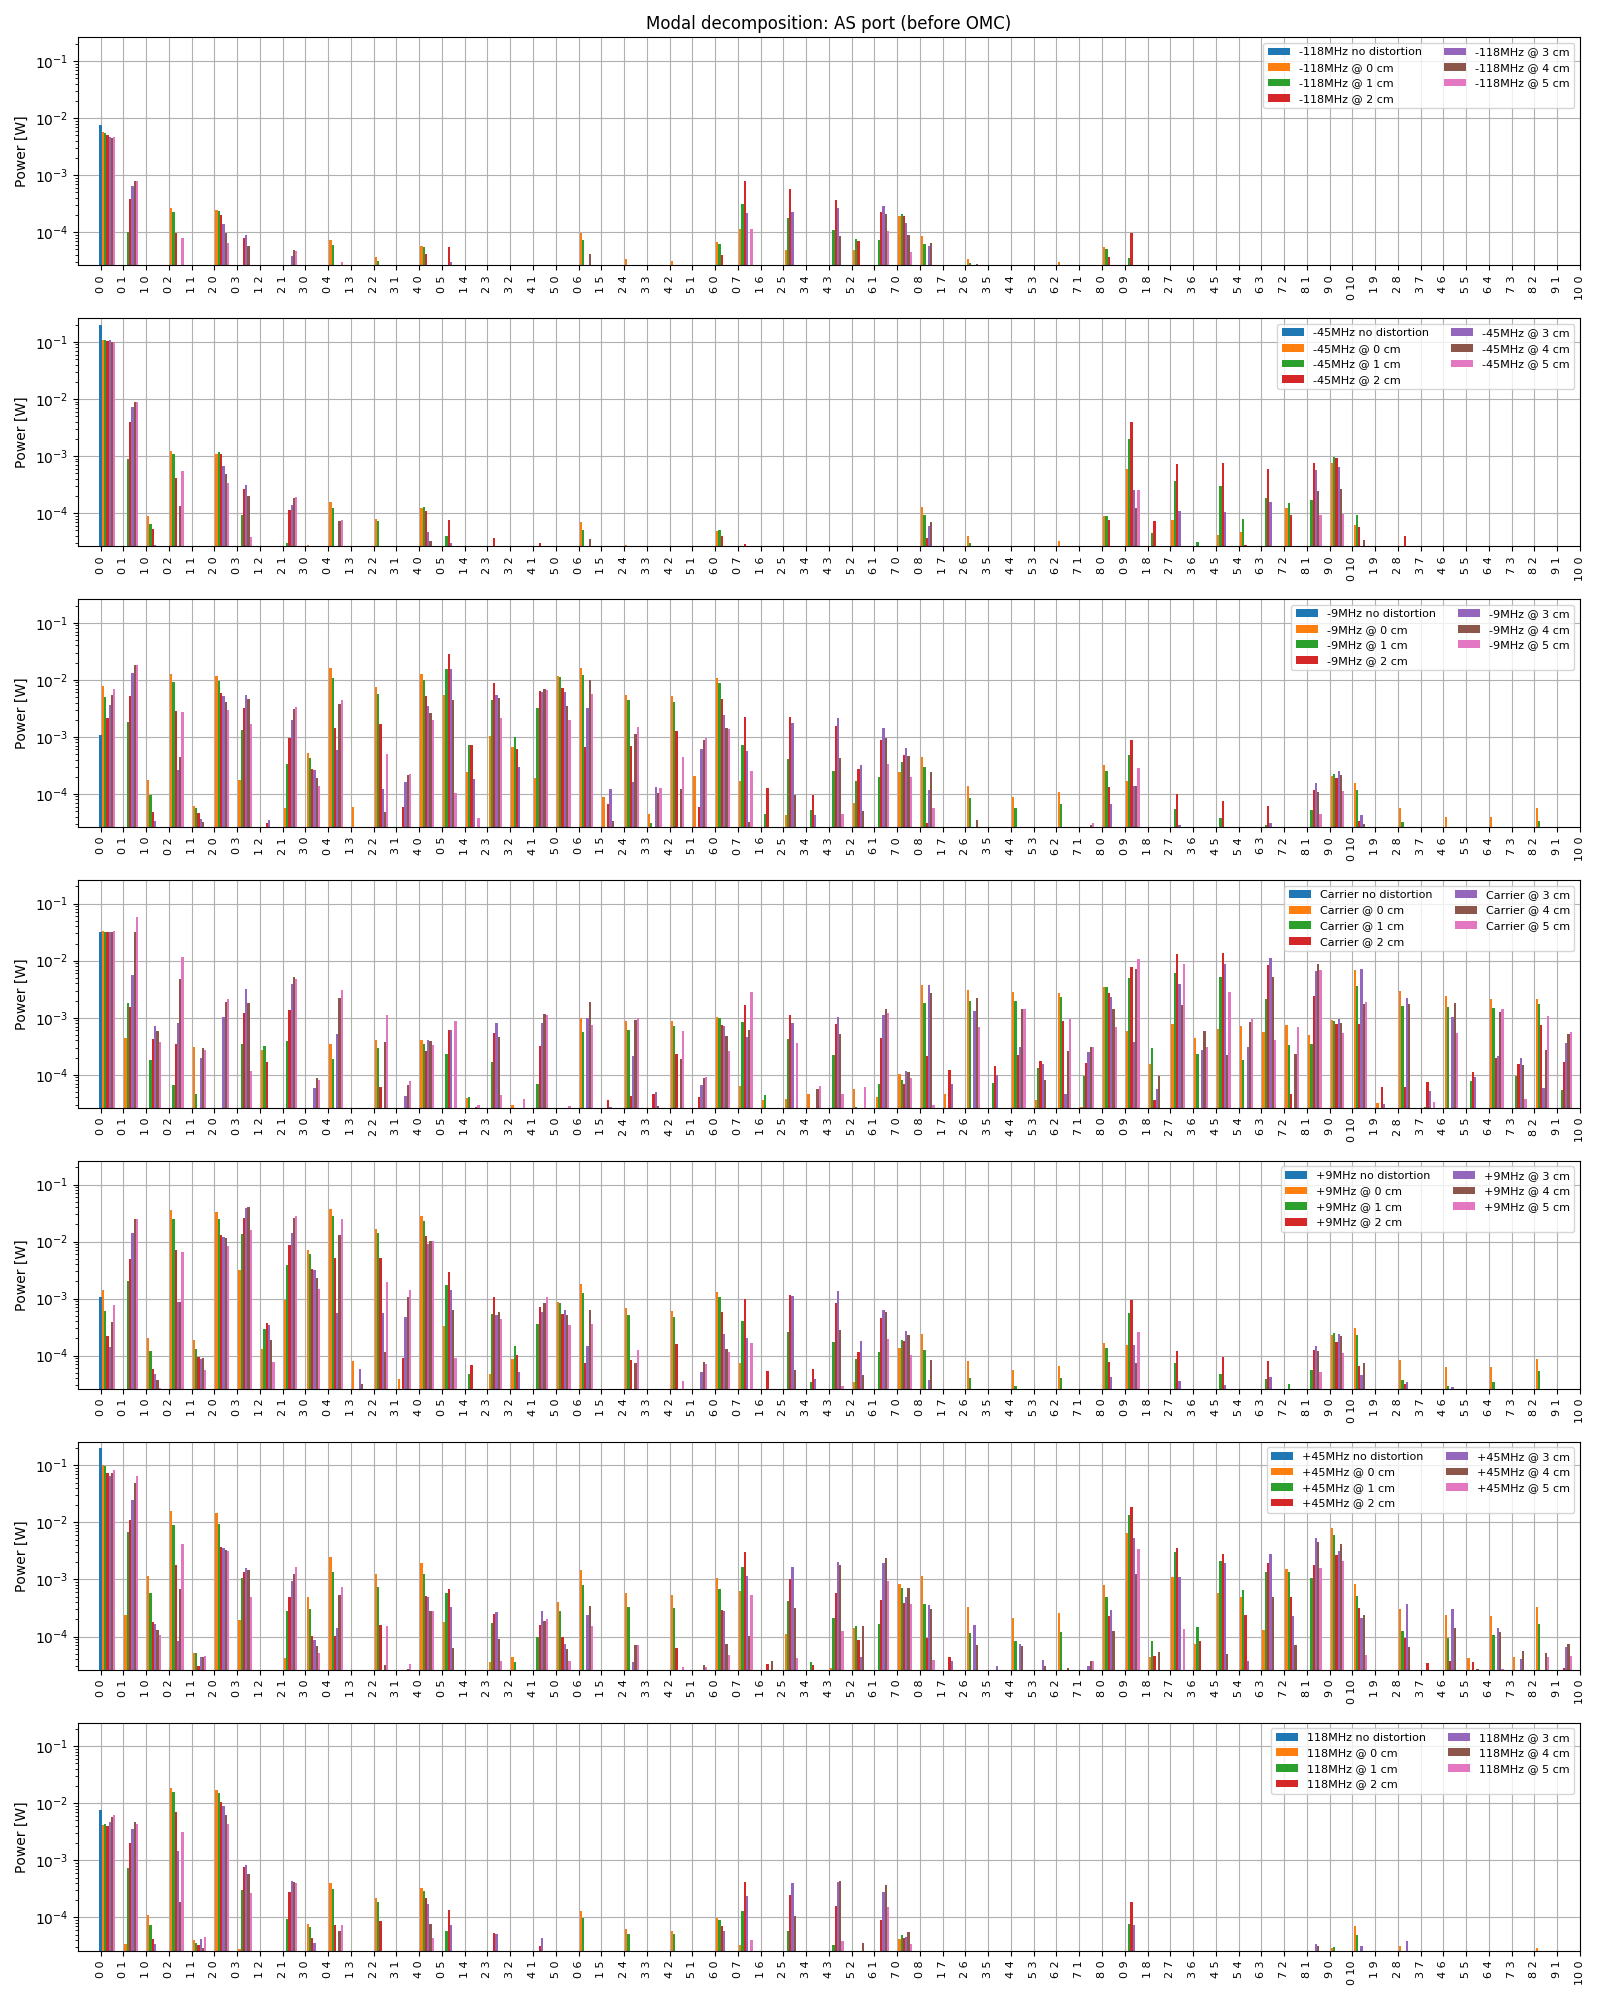
The position of the point absorber has, as expected, an effect on the simulation results. Here I started by centering the peak of the optical path distortion (OPD) at the center of the beam, and then move it to the side by steps os 1 cm, up to 5 cm from the center. I maintained the same peak amplitude of the OPD, so the shift does not take into account the change in the power that is actually absorbed. This simulation is just to get a feeling of how much the results change because of the uncertainty of the beam center position w.r.t. to the HWS frame.
The first plot shows that the coupling of RIN to DARM changes a bit, but not much, with the absorber position.
The second plot shows the mode content at the AS portfor the different positions. I realize this is a busy plot and hard to get much information out of it. I'll try to find a better representation soon.
CAVEAT: in all the simulations reported so far, I have included only the point absorber map on the ITMY substrate. To have a more realistic simulation, I should include the intrinsic and thermal lenses in both ITMs, as well as the effect of Ring Heaters and CO2 laser. Working on it.
Updates
In the figure below, the coupling from RIN to DARM is shown for three configurations
Sheila, Georgia, Craig
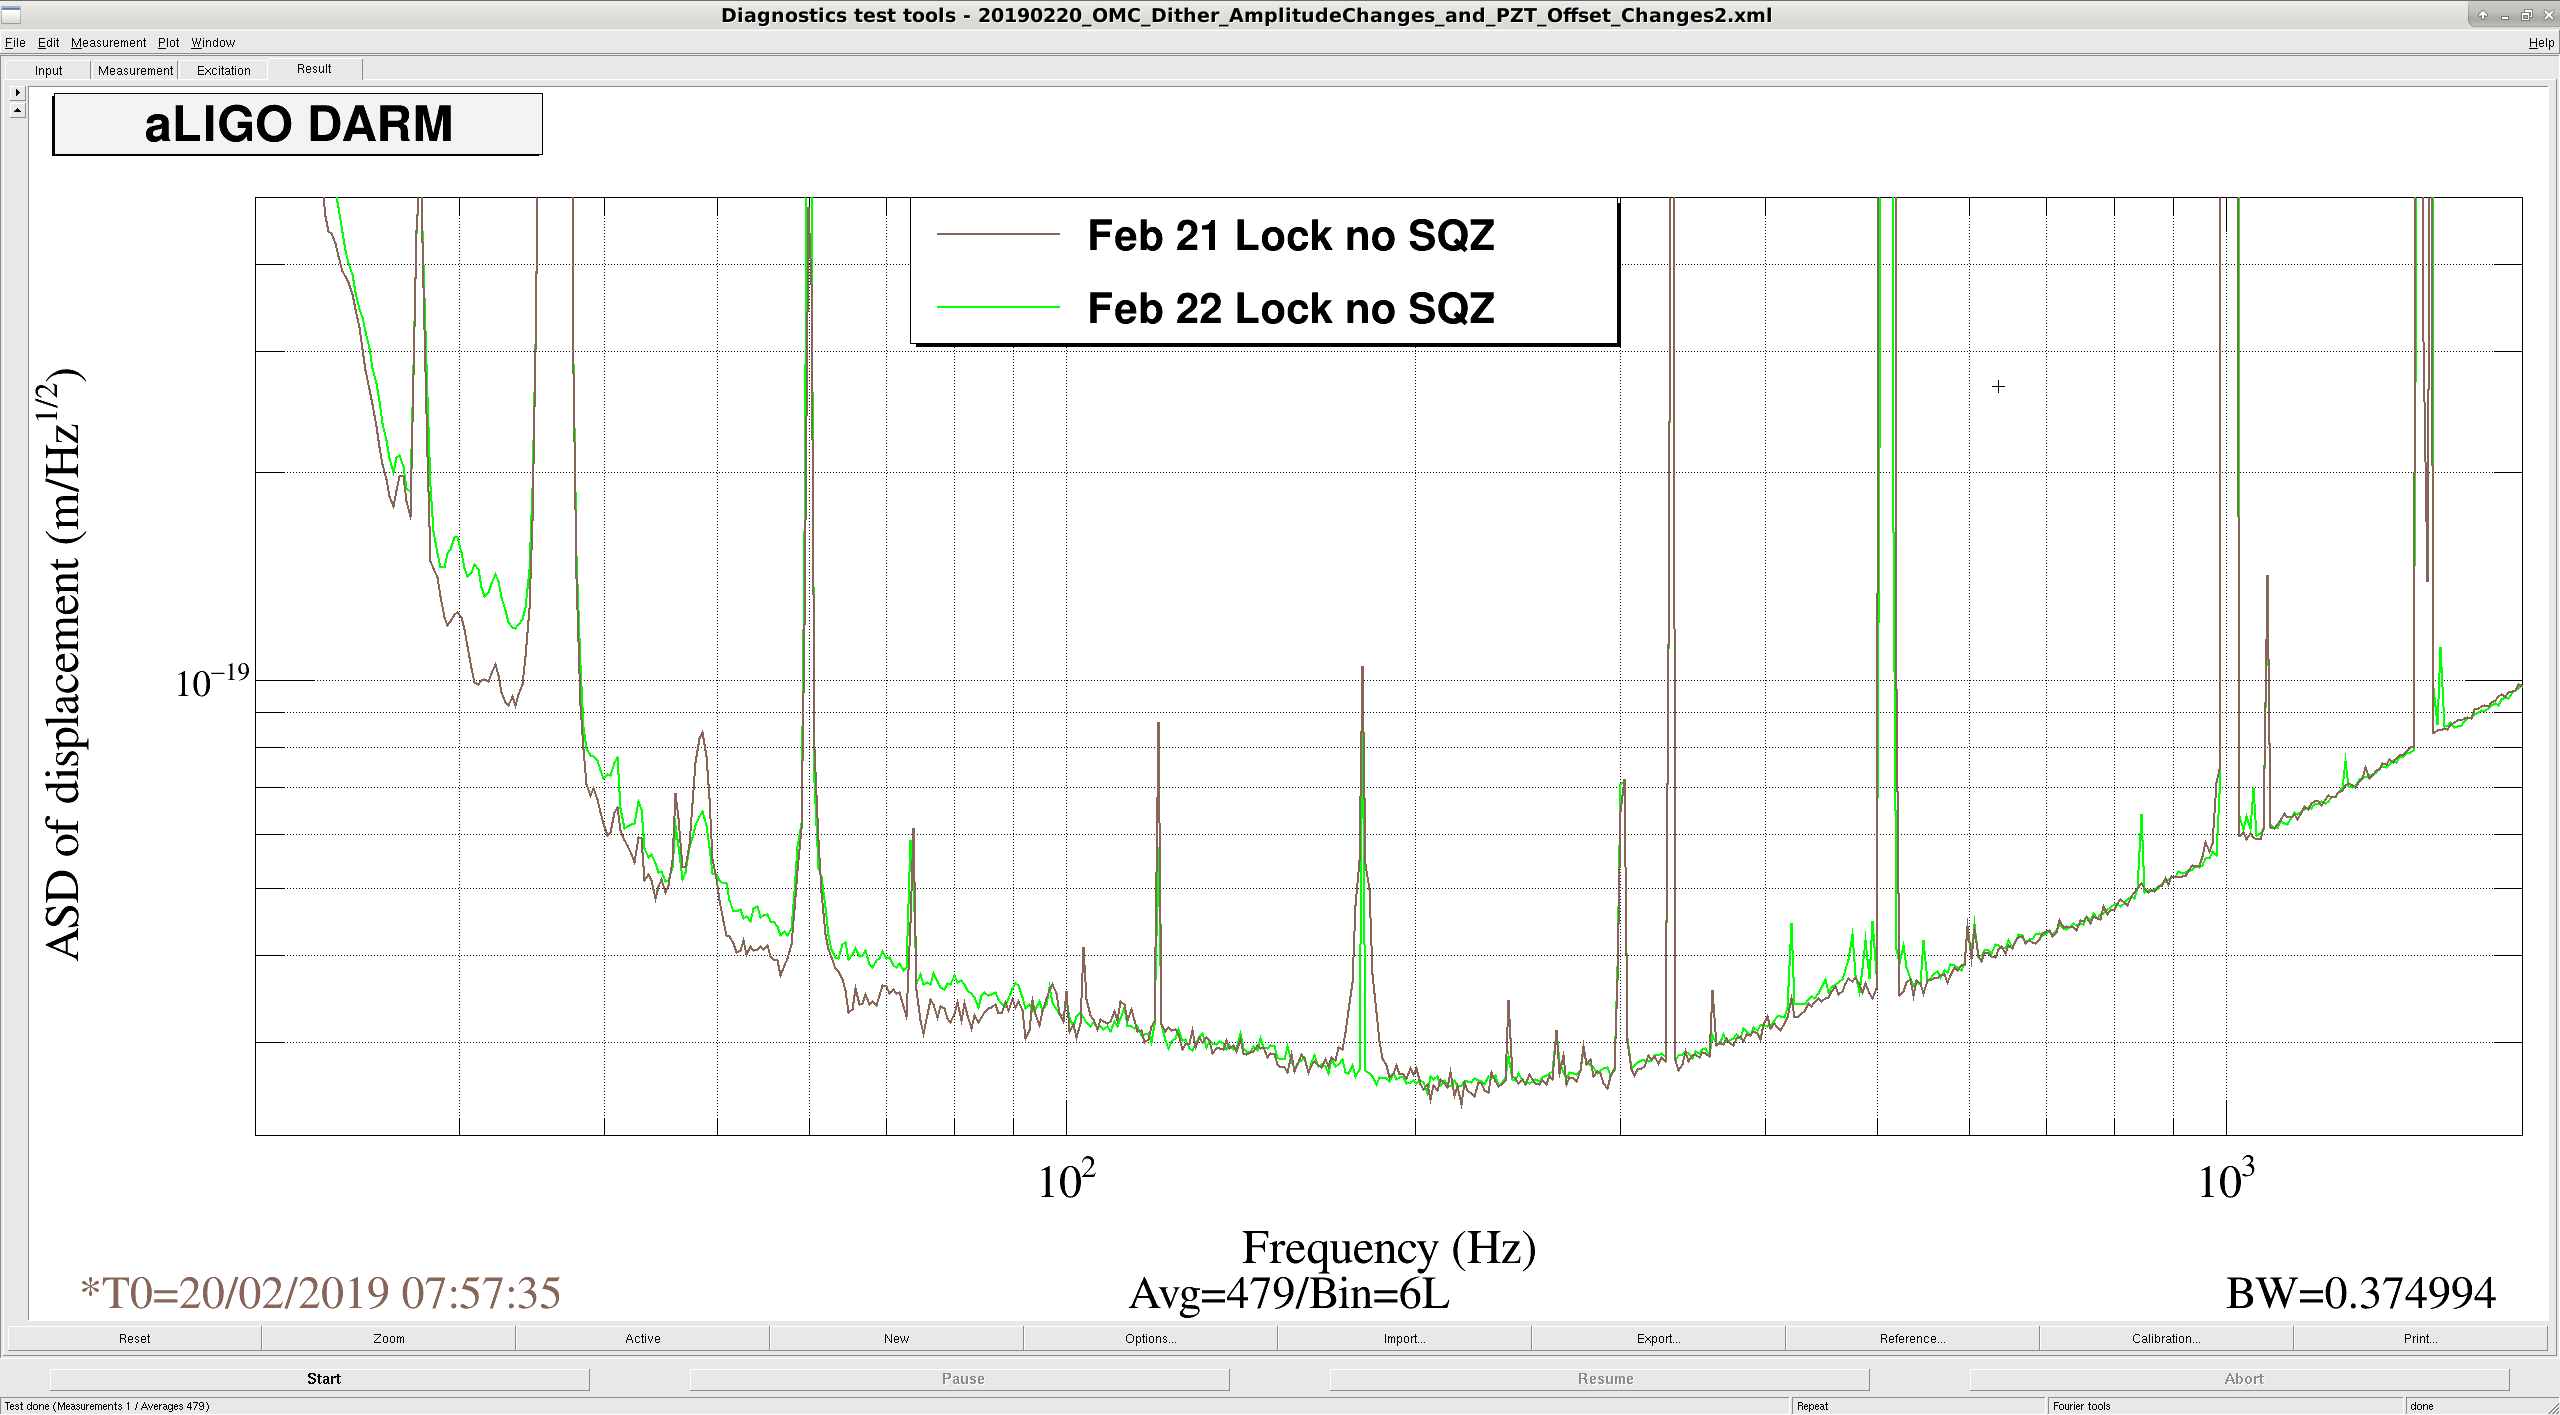
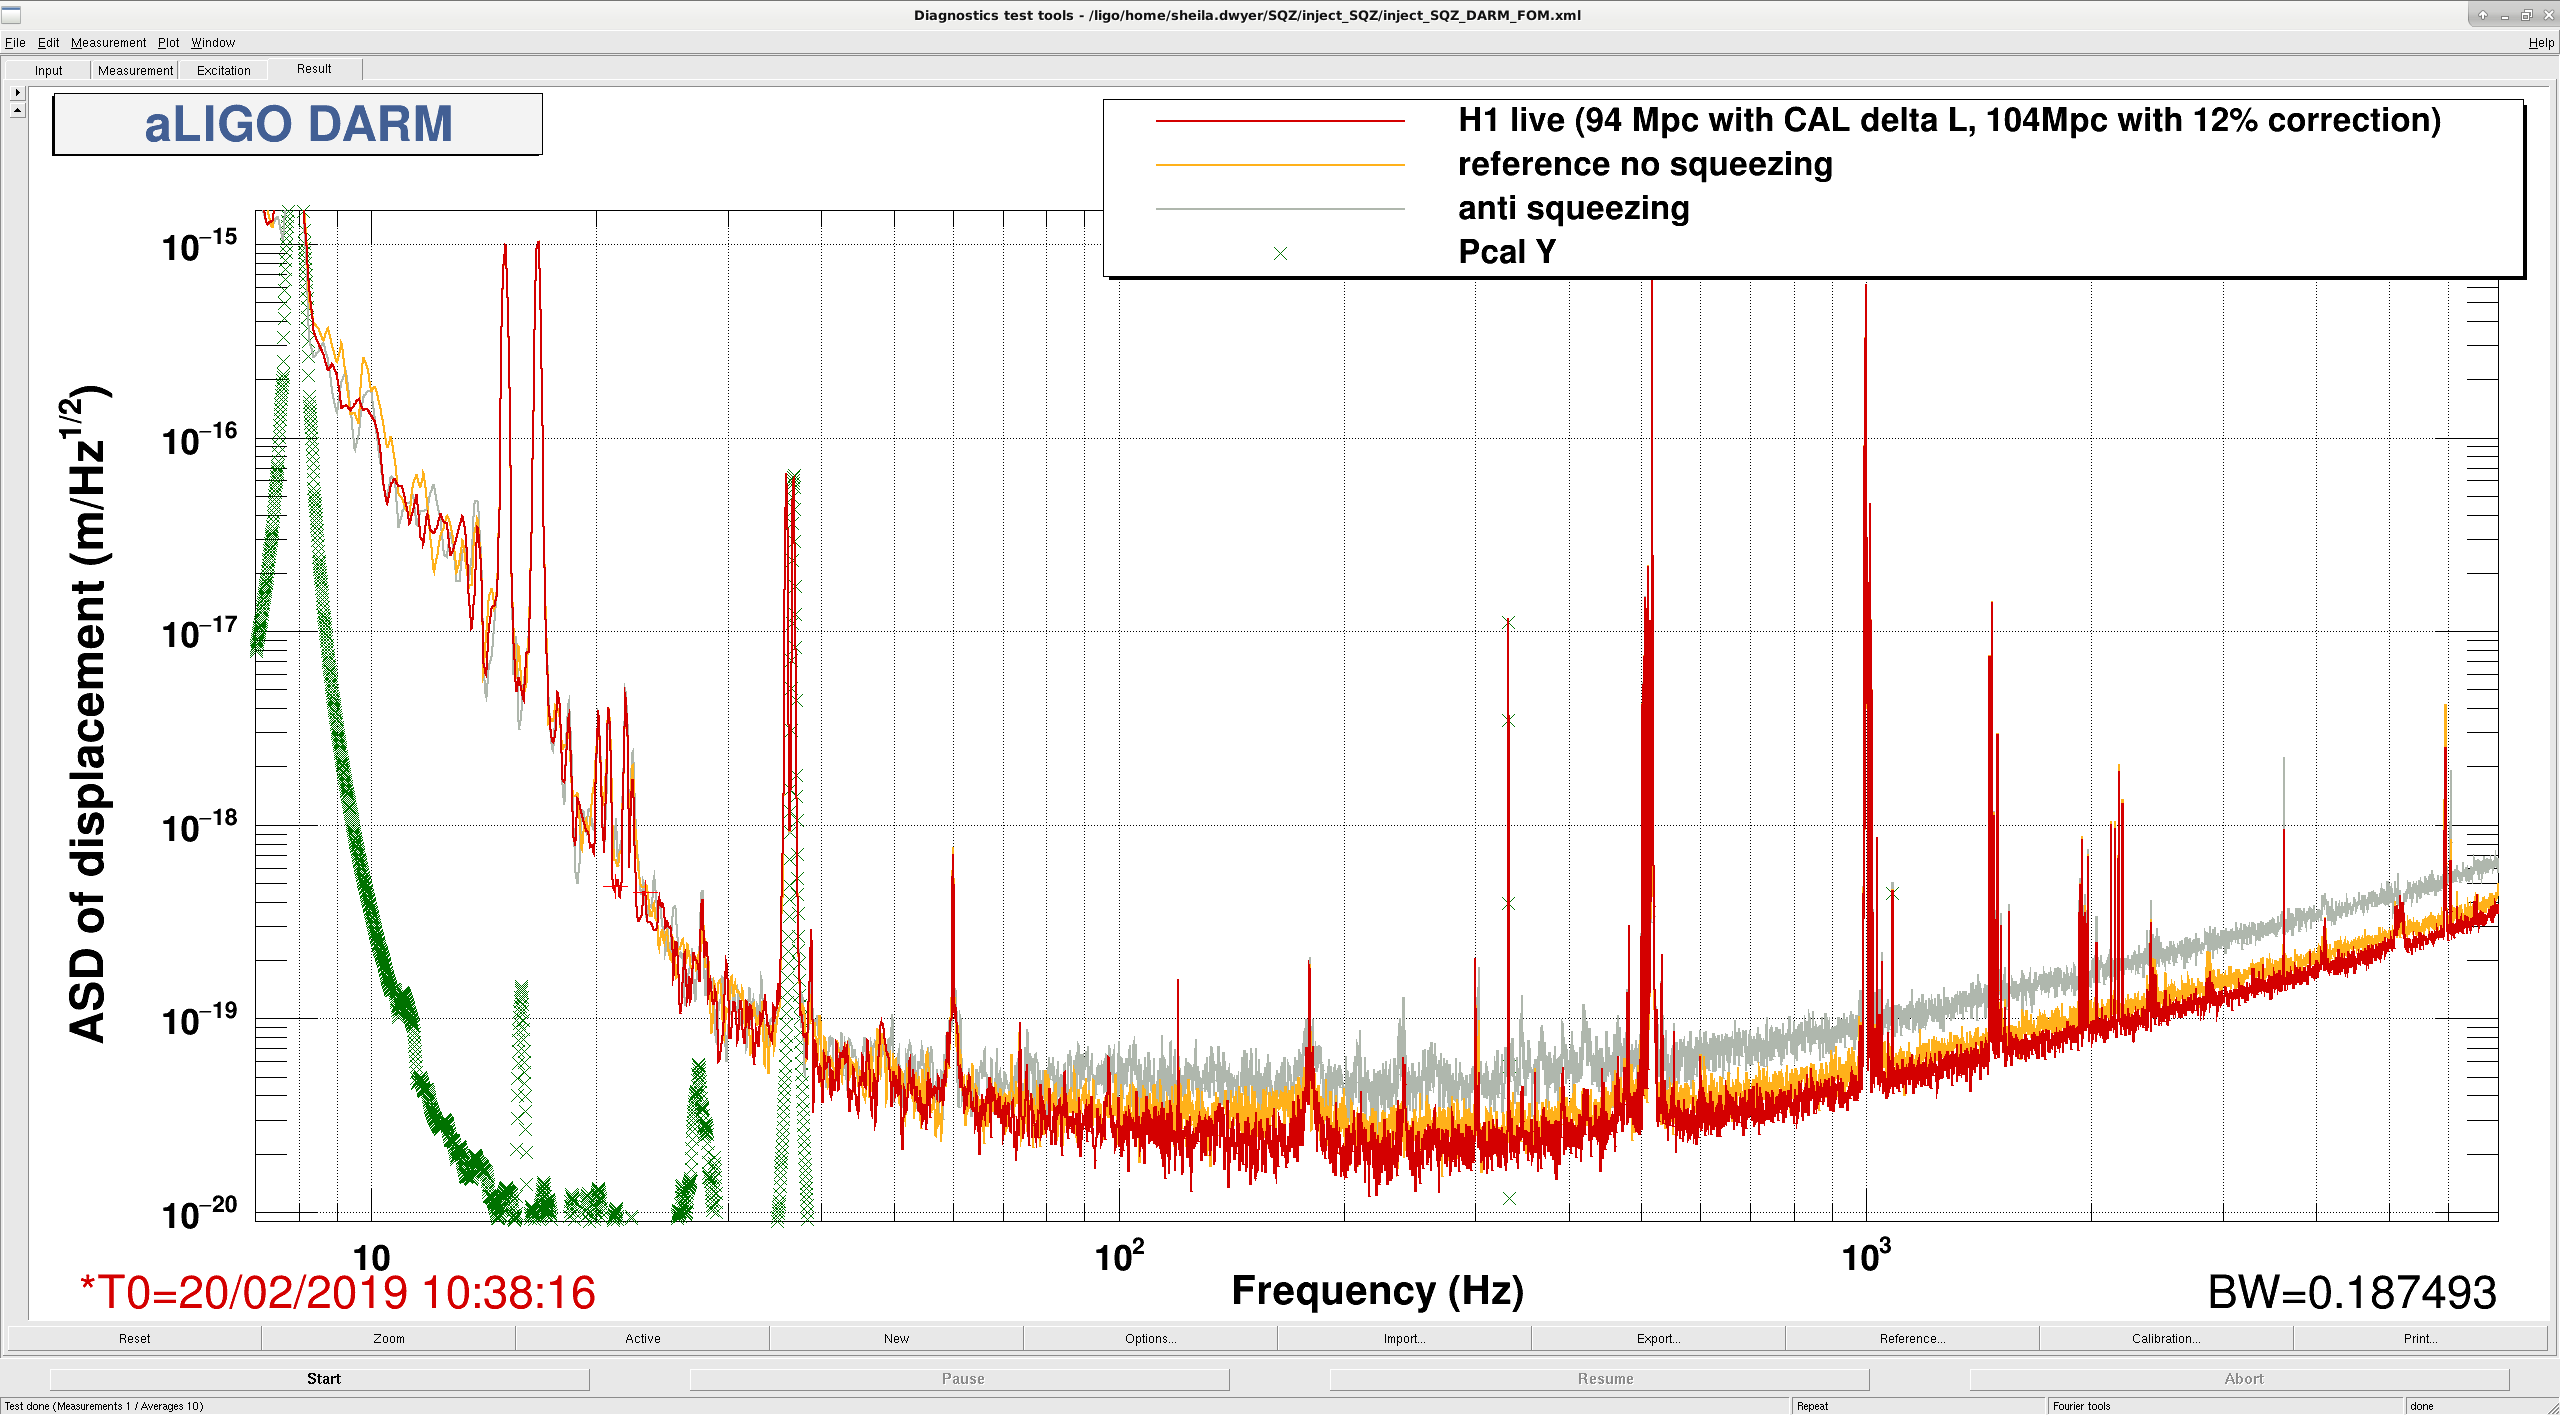
After improving the broad shoulders on the power lines by increasing the OMC dither, 47007, and finding that our 9 MHz coupling to DARM is reduced 47008 and that the DCPD cross correlation shows improved noise around 50-60Hz 47012, we decided to inject squeezing again since we know from 47006 that it can improve our sensitivity. The attached screenshot shows the reference, anti-squeezing and DARM with squeezing. The sensmon range is between 93-94Mpc, and we think that this is underestimating the range by about 12% according to the PCAL sweep that Jeff did this morning 47003.
Wonderful - very nice progress.
Great work!
Excellent news!
Great!
If it were safe to assume that the frequency dependent systematic error were the same between lock stretches (it's not), I could apply the same correction I'd done to the 2019-02-19 23:00 UTC lock stretch to this data. This is a false assumption (and, naturally, the quantification of time-dependent correct factors is back in to the realm of confusing non-functionality so I don't know *how* different parameters are), but hopefully at the ~few% level in response function change, and the effect on BNS range was mapped out in LLO:31156 to be also in the ~few% level. But y'know, because we're crazed to surpass the 100 Mpc BNS range, aka #KeepIt100, I've done the same analysis as was done in LHO:47003, multiplying the ASD at this time (Feb 20 2019 10:38:16 UTC, 1234694314, for 120 seconds) by the previous lock stretch's PCAL 2 DELTAL sweep, and computed the BNS range difference. As a testament to the hilarious comedy of life, the corrected range is 99.91 Mpc. (And note that I tried shifting the ~120 second time stretch by 15, 30 seconds on either side and the range went down to 99.5 ish, so somehow Sheila found a magically delightful time.) This ASD has not had any offline subtraction done, which I believe Team DetChar has been geared up to do. I've updated the function that generates these plots a bit, /ligo/svncommon/CalSVN/aligocalibration/trunk/Common/pyDARM correct_bns_range.py and I *know* that this function as-of-yesterday doesn't work in the control room. Regardless, I quote the exact command line used on my laptop configuration of python: python3.6 correct_bns_range.py --run='O3' --IFO='H1' --GPSstart='1234694314' --GPSend='1234694434' --PCAL2DARMTF='/ligo/svncommon/CalSVN/aligocalibration/trunk/Runs/O3/H1/Measurements/FullIFOSensingTFs/2019-02-19_H1_PCAL2DARMTF_A_PCALYRX_B_DELTALEXT_tf.txt' --PCAL2DARMCOH='/ligo/svncommon/CalSVN/aligocalibration/trunk/Runs/O3/H1/Measurements/FullIFOSensingTFs/2019-02-19_H1_PCAL2DARMTF_A_PCALYRX_B_DELTALEXT_coh.txt' --DARMmodelfile='modelparams_H1_20190219' --modelFunction='modelPars' --resultsTag='/ligo/svncommon/CalSVN/aligocalibration/trunk/Runs/O3/H1/Results/FullIFOSensingTFs/2019-02-20_H1_sensingFunction_BNSRangeCorrection' The data is committed to the CalSVN here: /ligo/svncommon/CalSVN/aligocalibration/trunk/Runs/O3/H1/Results/FullIFOSensingTFs 2019-02-20_H1_sensingFunction_BNSRangeCorrection.pdf 2019-02-20_H1_sensingFunction_BNSRangeCorrection_ASD.txt 2019-02-20_H1_sensingFunction_BNSRangeCorrection_PCAL2DELTALTF.txt
At the time of our excellent spectrum, the offline noise subtraction codes from DetChar (TJ Massenger & Derek Davis) and Calibration (Aaron Viets) gives us about 1.5 more Mpc, so we can say that we really did get above 100 Mpc - in fact about 101.4 Mpc. See, for example, a comparison of cleaned vs. pre-cleaned spectra: https://ldas-jobs.ligo.caltech.edu/~aaron.viets/H1_CAL_NoiseSub_20190220/H1_1234694144_1234698240_spectrum_comparison.png
[M. Wade, A. Viets]
I made a new GDS filters file to be installed tomorrow during maintenance. The main change is an improvement in the high-pass filters and a reduction in latency. The actuation filters were reduced in length from 6.0s (between 2 separate filters) to 3.5s (all one filter), which in theory should reduce the latency by 2.0s. The following changes were made to the design of the high-pass filters:
The filters file is in calibration SVN revision 6577 at this location:
trunk/Runs/ER14/GDSFilters/H1GDS_1234630818.npz
It was made using the script
trunk/Runs/ER14/H1/Scripts/TDfilters/H1_run_td_filters_1234630818.sh
The parameters file used was from the 2019-01-18 model:
trunk/Runs/O3/H1/params/modelparams_H1_20190118.py
The suggested configuration files for running this on the production and testing DMTs are:
trunk/Runs/ER14/GDSFilters/H1GDS_1234630818.ini
trunk/Runs/ER14/GDSFilters/H1GDS_1234630818_TEST.ini
The attached plots are:
1-2) Bode plots of the filters
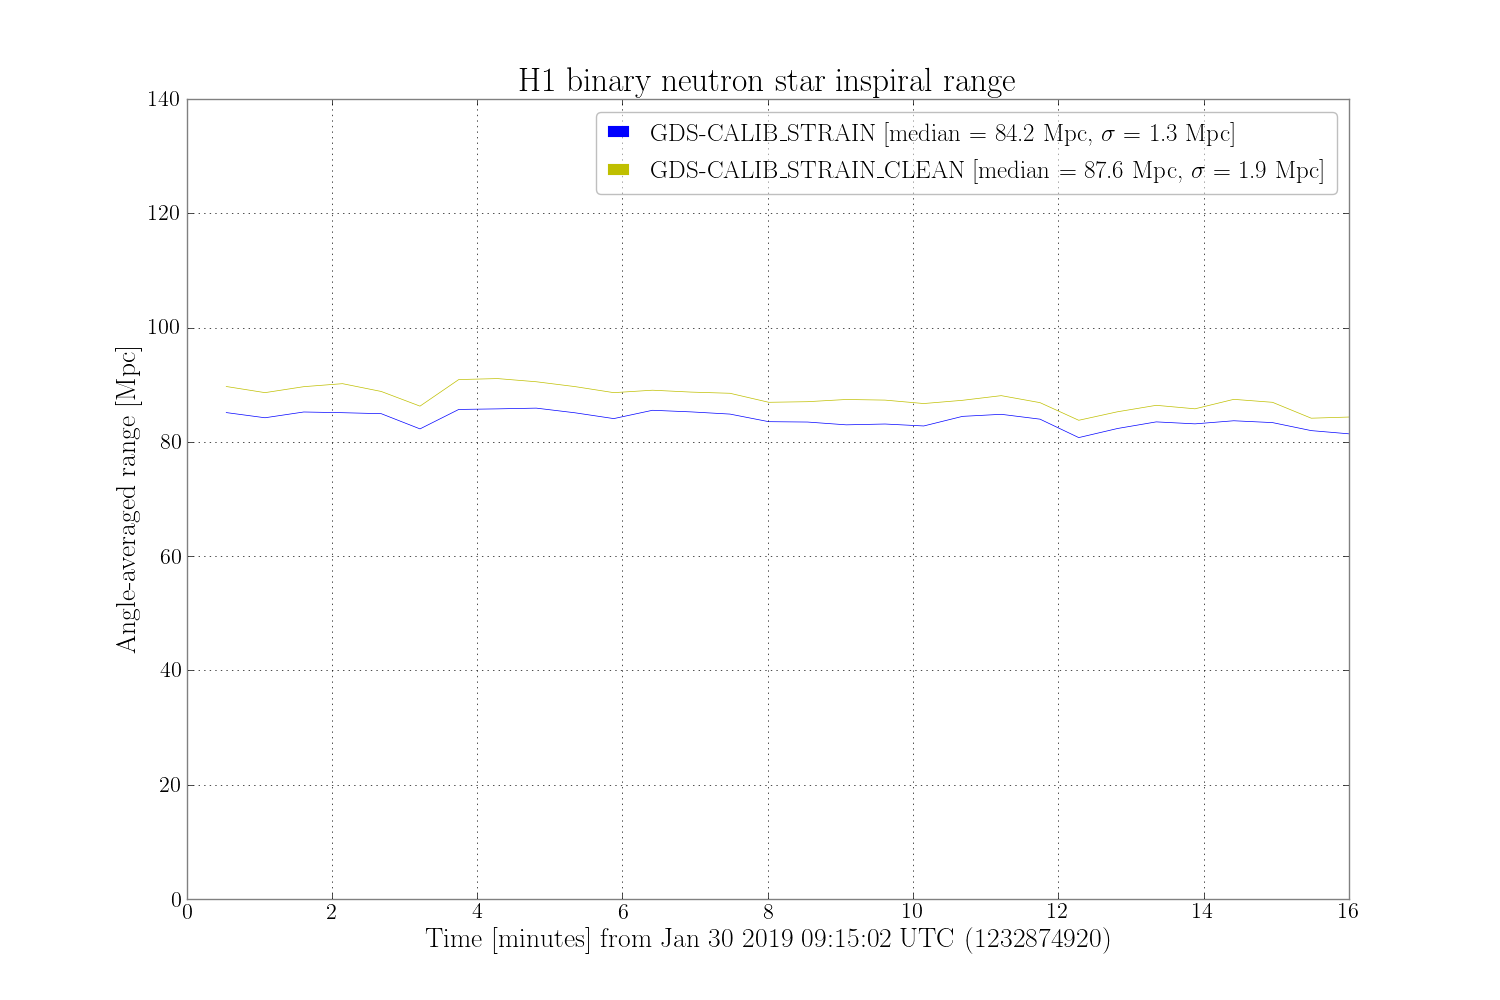
3) ASD spectrum comparisons showing GDS-CALIB_STRAIN and GDS-CALIB_STRAIN_CLEAN. Data was from 2019-01-30.
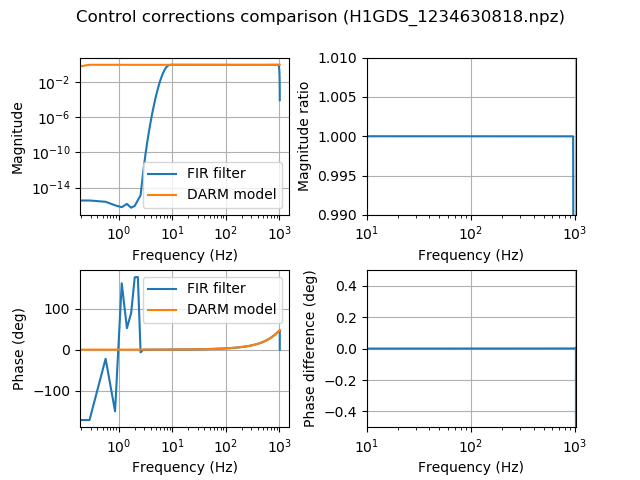
4-5) Comparisons of the frequency-domain model for the control corrections to the actual effect of the filters on the data. Data was from 2019-01-30.
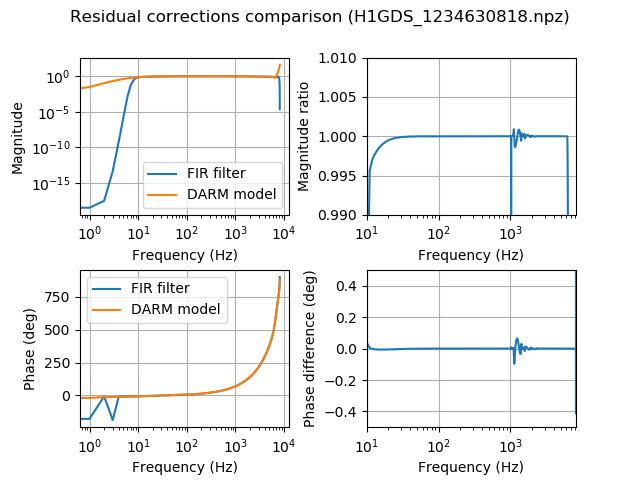
6-7) Comparisons of the frequency-domain model for the residual corrections to the actual effect of the filters on the data. Data was from 2019-01-30.
8-9) Comparisons of the frequency-domain model for the response function and GDS-CALIB_STRAIN / DARM_ERR. Data was from 2019-01-30. Note the significant discrepancies. One possible contributor is the fact that the front-end may not have been using this reference model during the time this data was taken from. It is likely there are problems with the GDS correction filters as well.
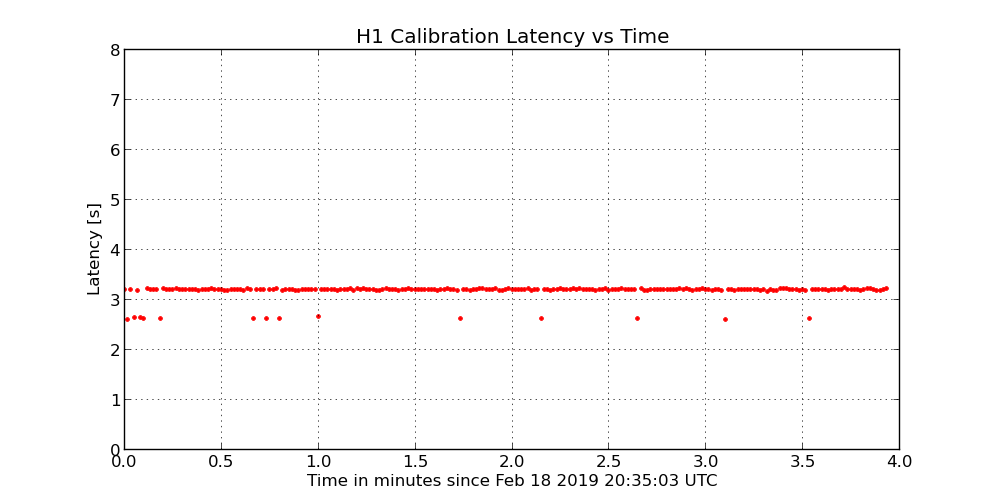
10) A plot of the latency of the pipeline when reading from shared memory on ldas-pcdev1.ligo-wa.caltech.edu for ~4 minutes of data taken earlier today. This does not include the 1.0s length of the frames.