With the upgrades to the hardware injection system, it's a good time to revisit the photon calibrator actuation function and inverse actuation filtering for hardware injections. LHO aLOG 46846 showed that there is an approximate 47% increase in the gain of the excitation point of the photon calibrator. The inverse actuation filter FM7 "cts/N" has been updated from an old value of gain(2.1537e+13) cts/N to the new value of gain(1.4677e+13) cts/N. This gain value was calculated from the DAC gain (20.0/2^18) x watts-per-OFS volts (0.13535 W/V) x newtons-per-watt (6.5980e-9 N/W) = 6.8134e-14 N/ct. The inverse of this is what is needed for the inverse actuation filter. LHO aLOG 37764 describes the Pcal actuation path in the last bracketed term. For the hardware injection path into the Pcal, the new user model actually includes one more 16k clock cycle delay so that the hardware injection path sees the following: V W N 1 m h [ 61 usec delay x 61 usec delay x AI(D) x 61 usec delay x ----- x AI(a) x --- x --- x sus.norm x ----- x --- x --- ] cts V W f^2 N m Attached below is the actuation function used by the CW hardware injections that takes into account these updates for the excitation point gain and the extra clock cycle delay. I also saved it to $CALSVN/trunk/Runs/O3/Common/Results/InverseActuationFilter/H1PCALXactuationfunction.txt. In the past, I had saved this with an appended "_withDelay" to the filename. That seems unnecessary when computing the actuation function, so below is the export of the transfer function that reflects the above equation describing the Pcal actuation function from the hardware injection excitation point CAL-INJ_MASTER_OUT. Finally, for transient injections that use the inverse actuation filter (described in further detail in LHO aLOG 27539), the uncompensated delay for the injections will be approximately 360 usec. The delay is a combination of the digital delays, as well as any residual phase effects from the approximated AI filtering and roll-off filters which would require time advances (not possible in Foton).
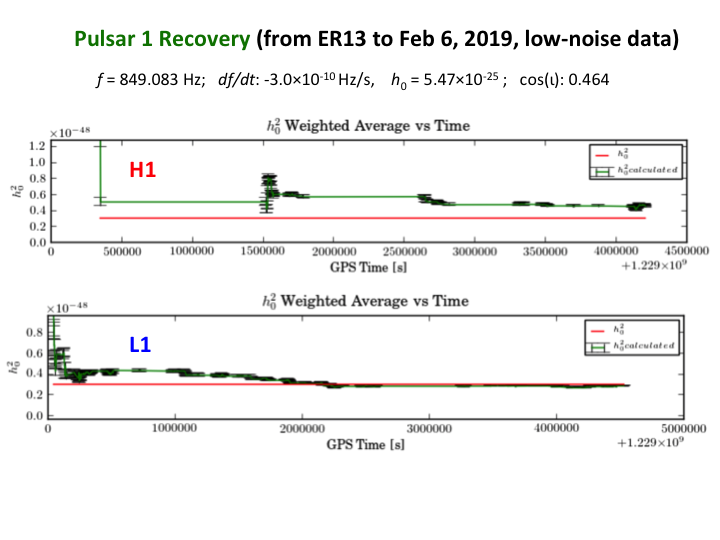
The need for the adjustment to the inverse actuation function used in CW injections is consistent with our recovery of too-large amplitudes in H1 data. Shown below is an example comparison of H1 and L1 recovered squared amplitudes from Jessica Leviton's monitoring program which runs daily on both observatory clusters. While the recovered central value for this loud injection agrees well with expectation in the L1 data, it has been converging to a value roughly 50% too high in the H1 data. Other loud injections show the same trend. (The underestimated vertical error bars shown on these plots should be ignored; the recovery program is under active development. The data points shown on each graph correspond to individual 30-minute low-noise SFTs for data collected when injections were running.)
h1tw3 is recording raw minute trends. We will be verifying the data over the next day or two. If the system looks stable we will request to replace h1tw1 with h1tw3. We had to shutdown h1fw2 last night. It is up again. This also gave us a chance to update the documentation around the daq broadcast switch that links all the daqd computers.
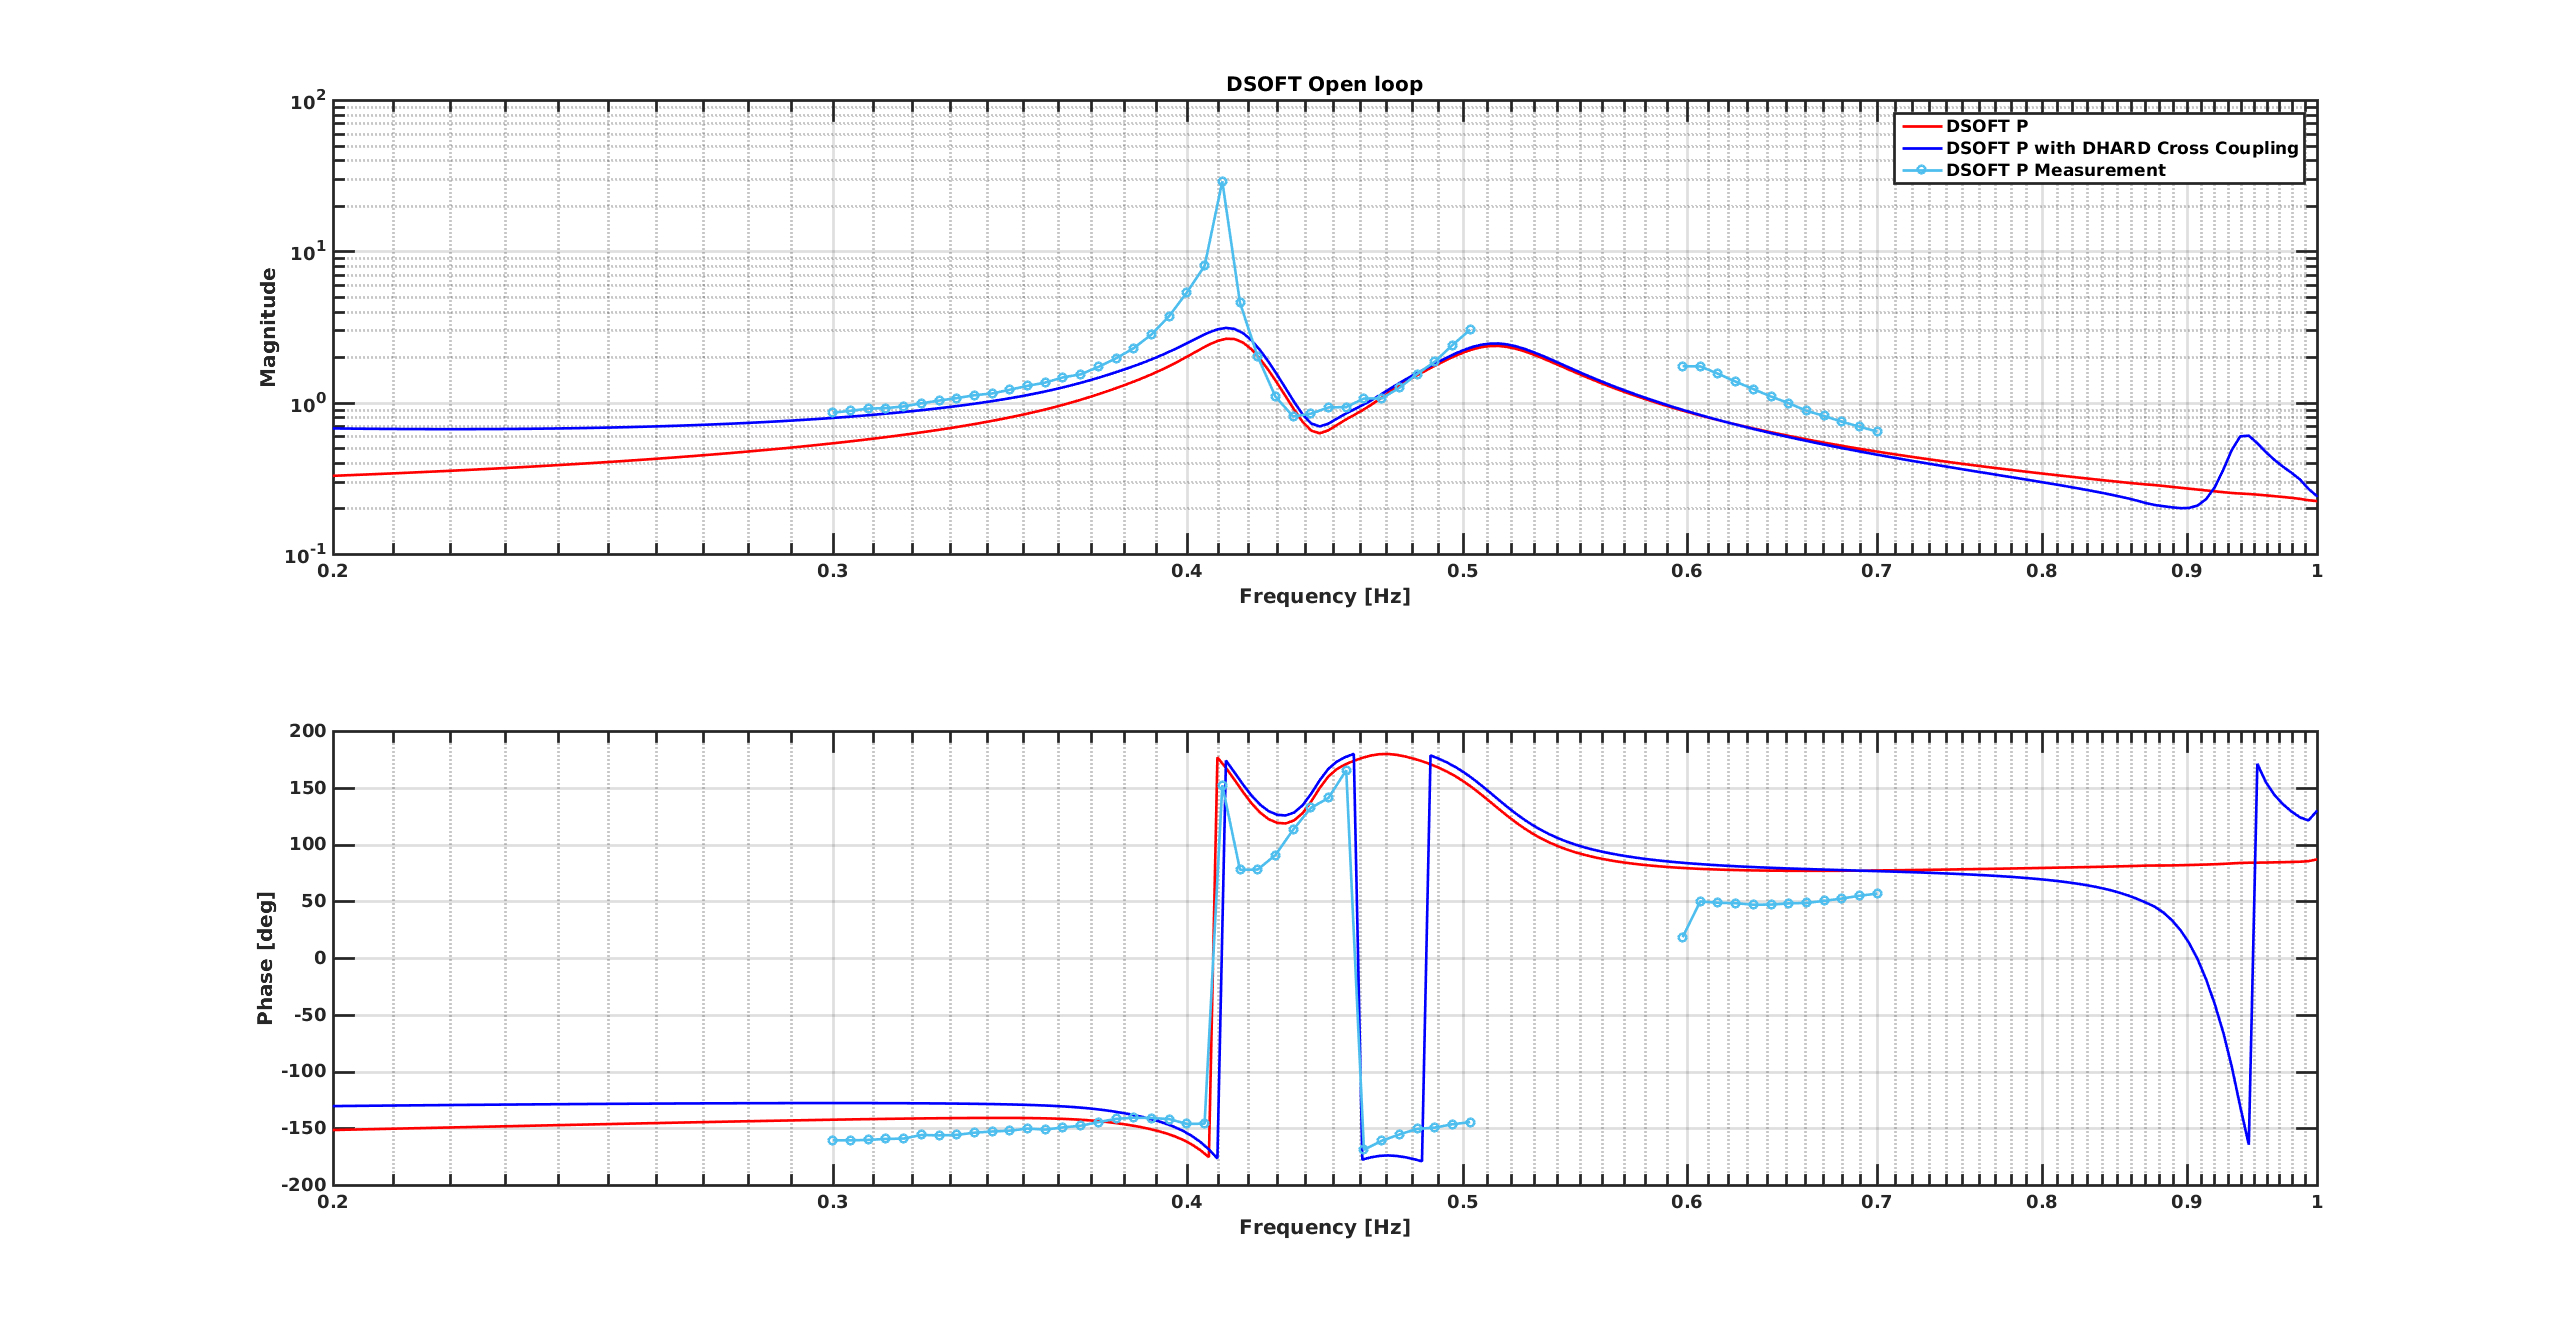
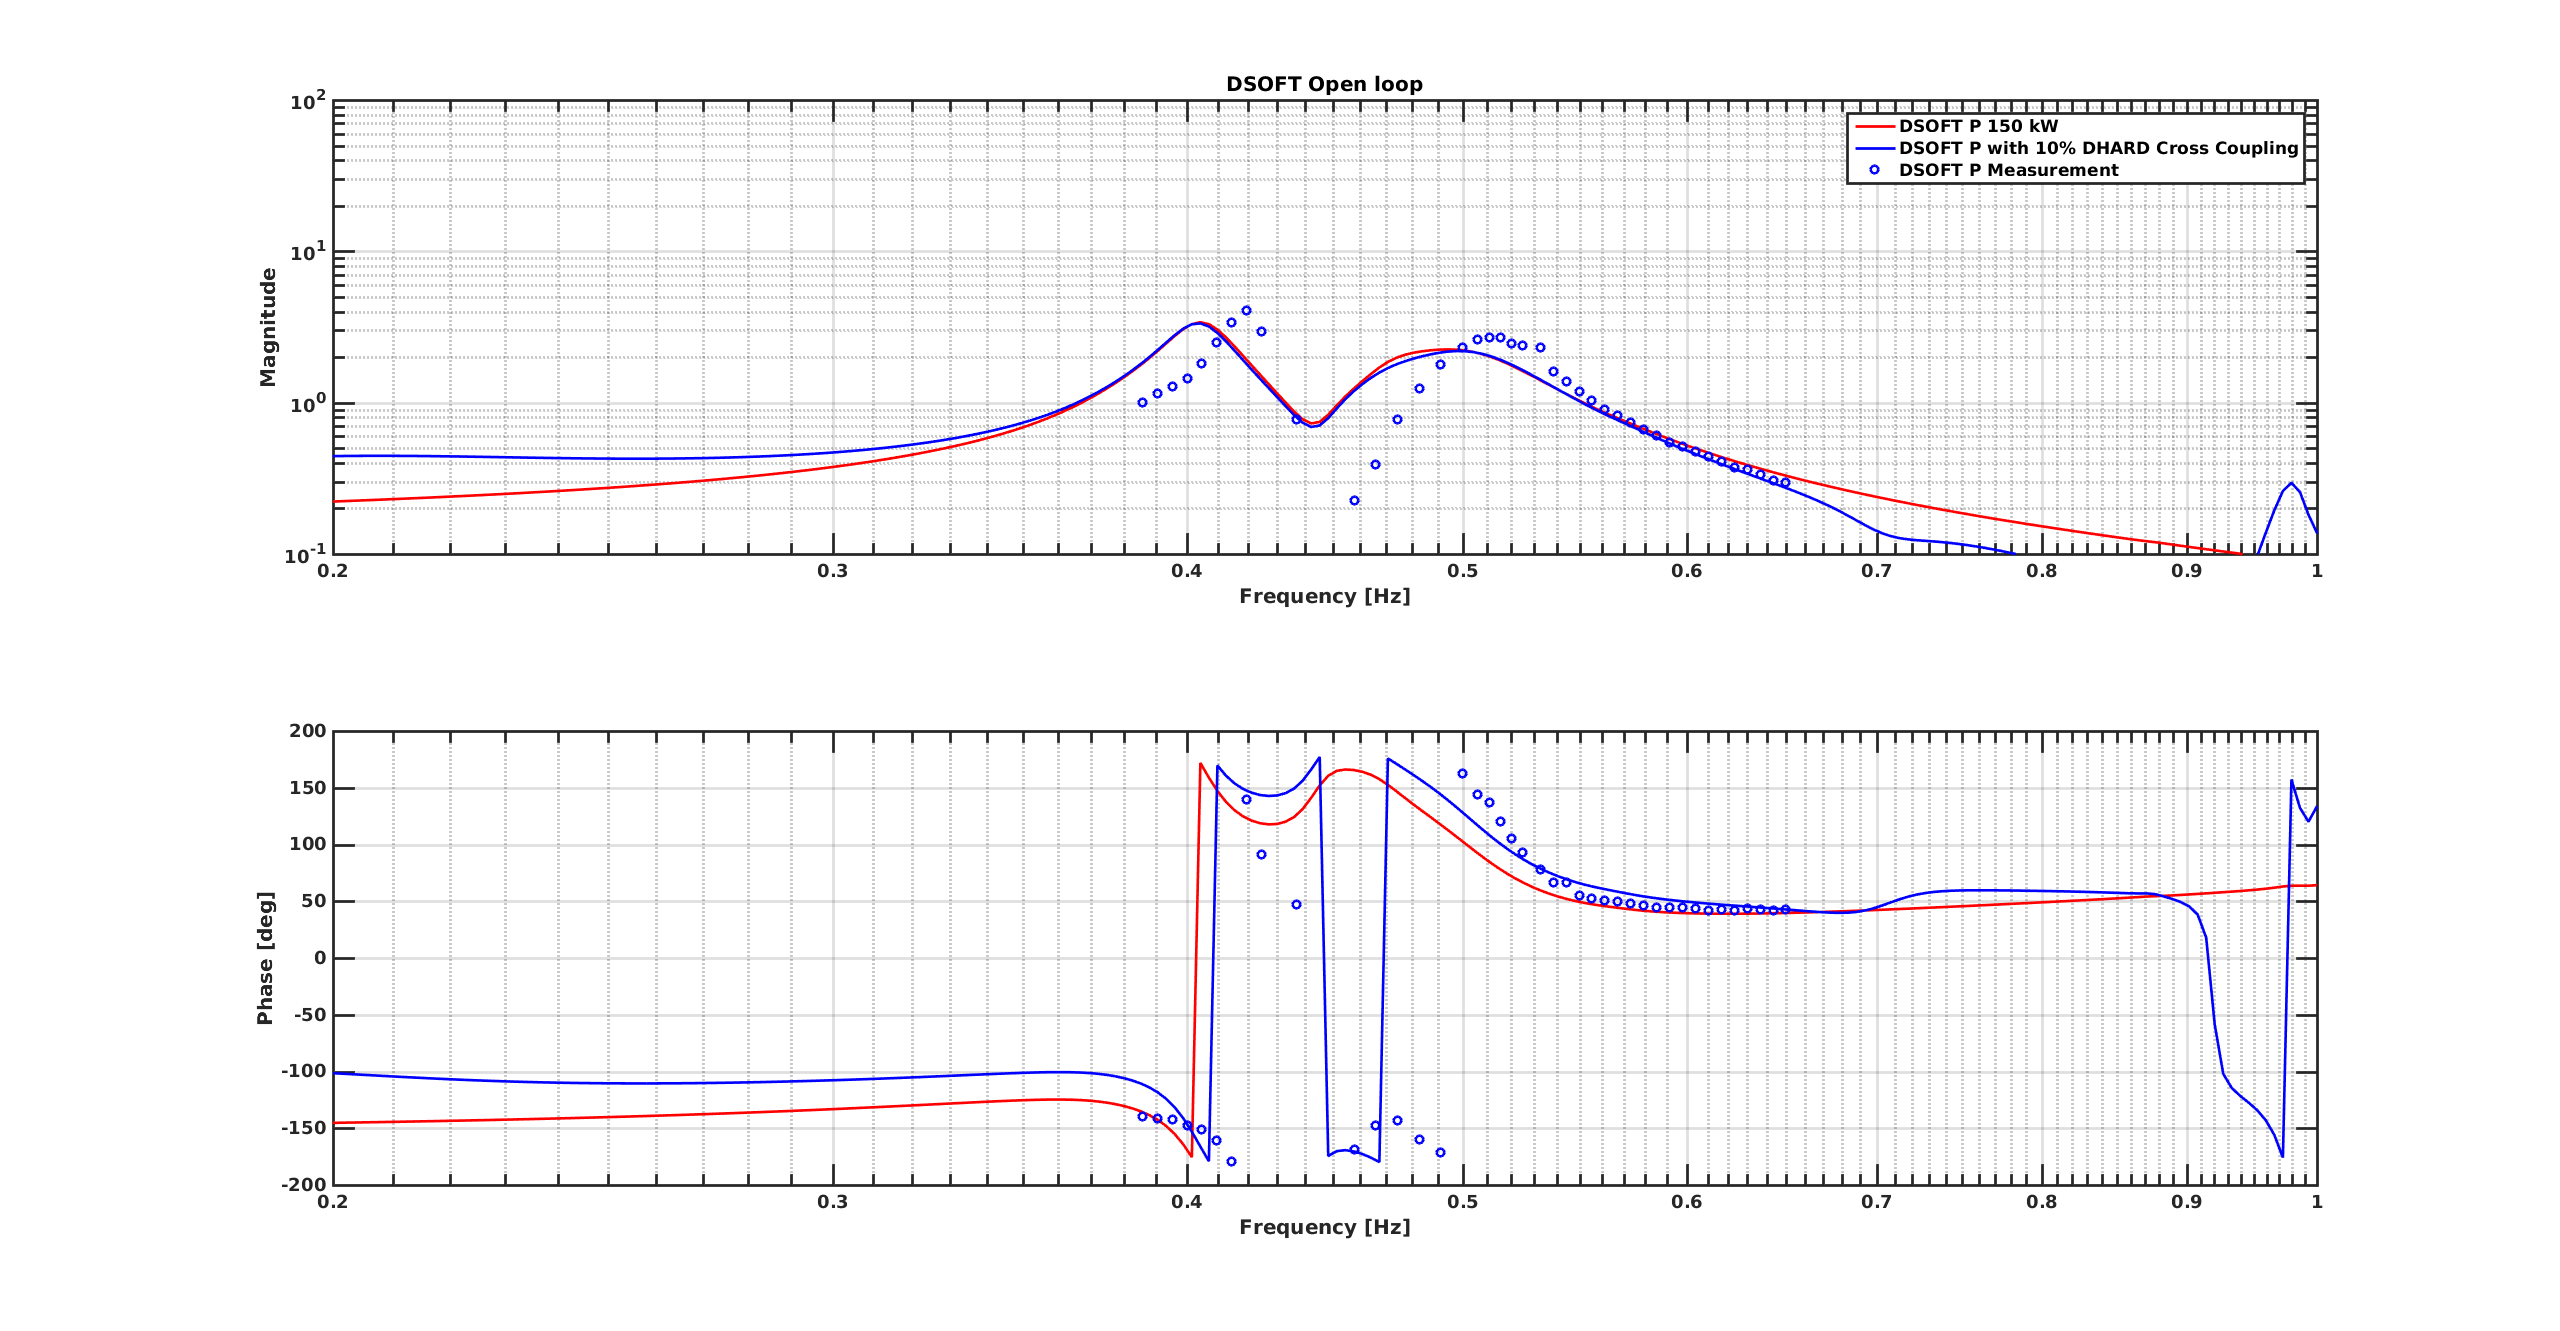
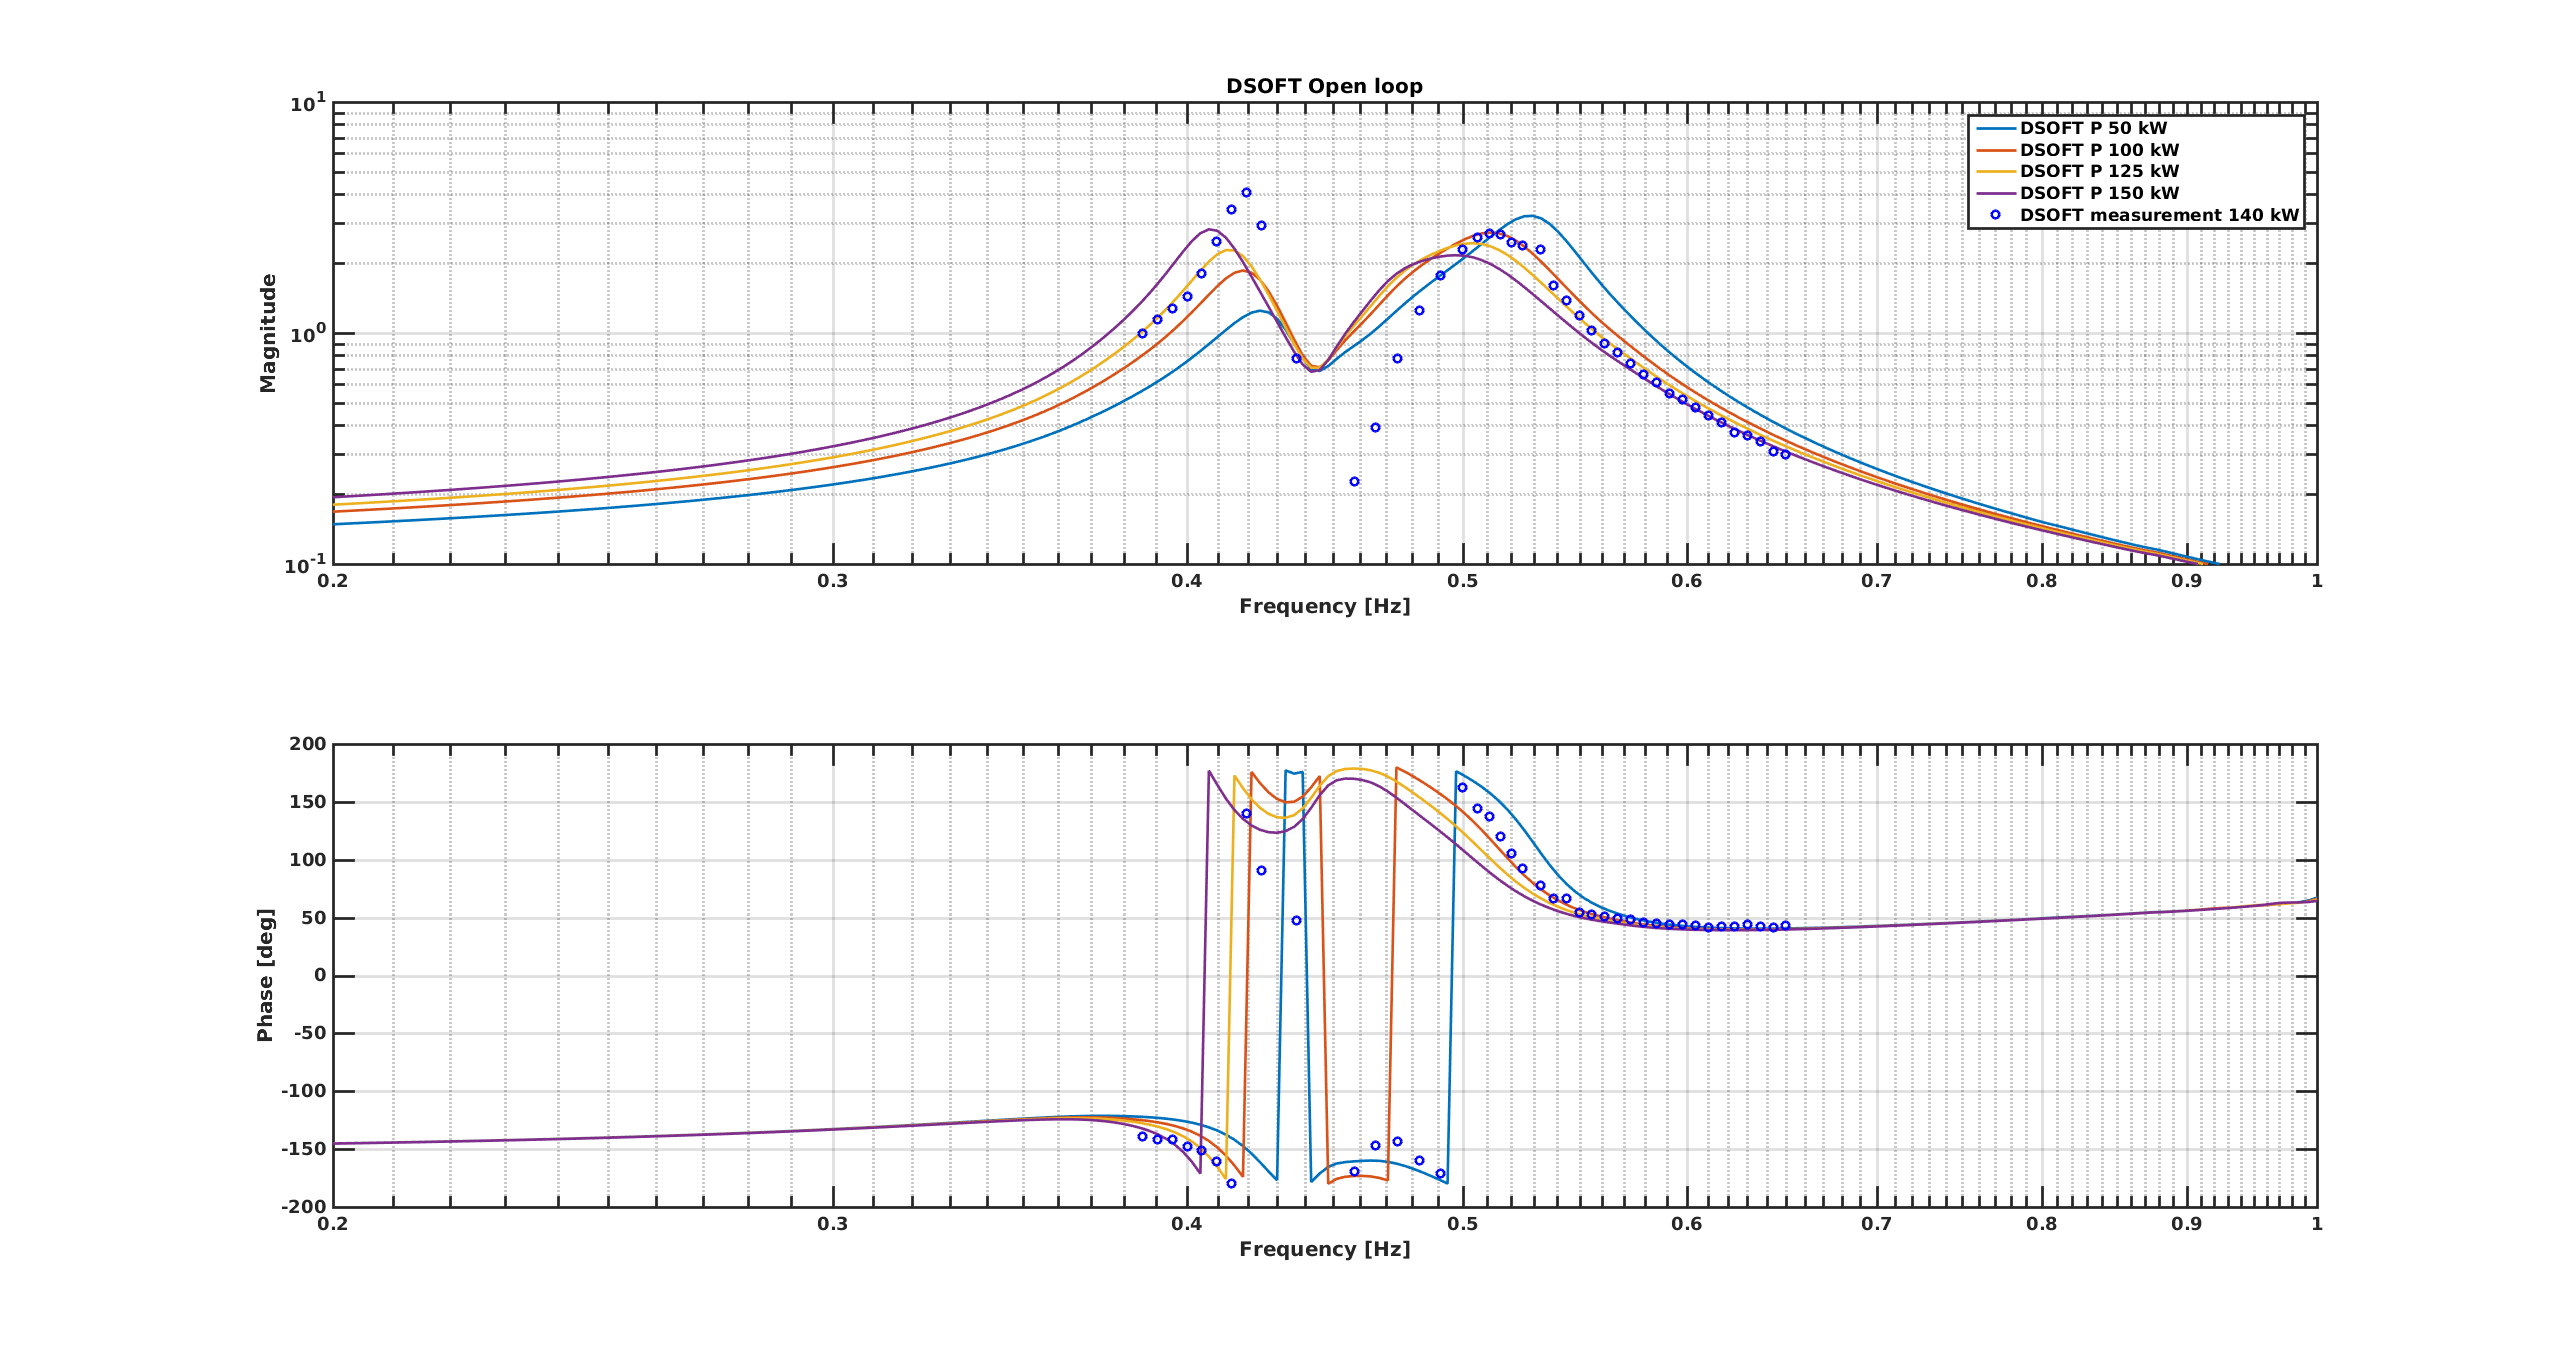
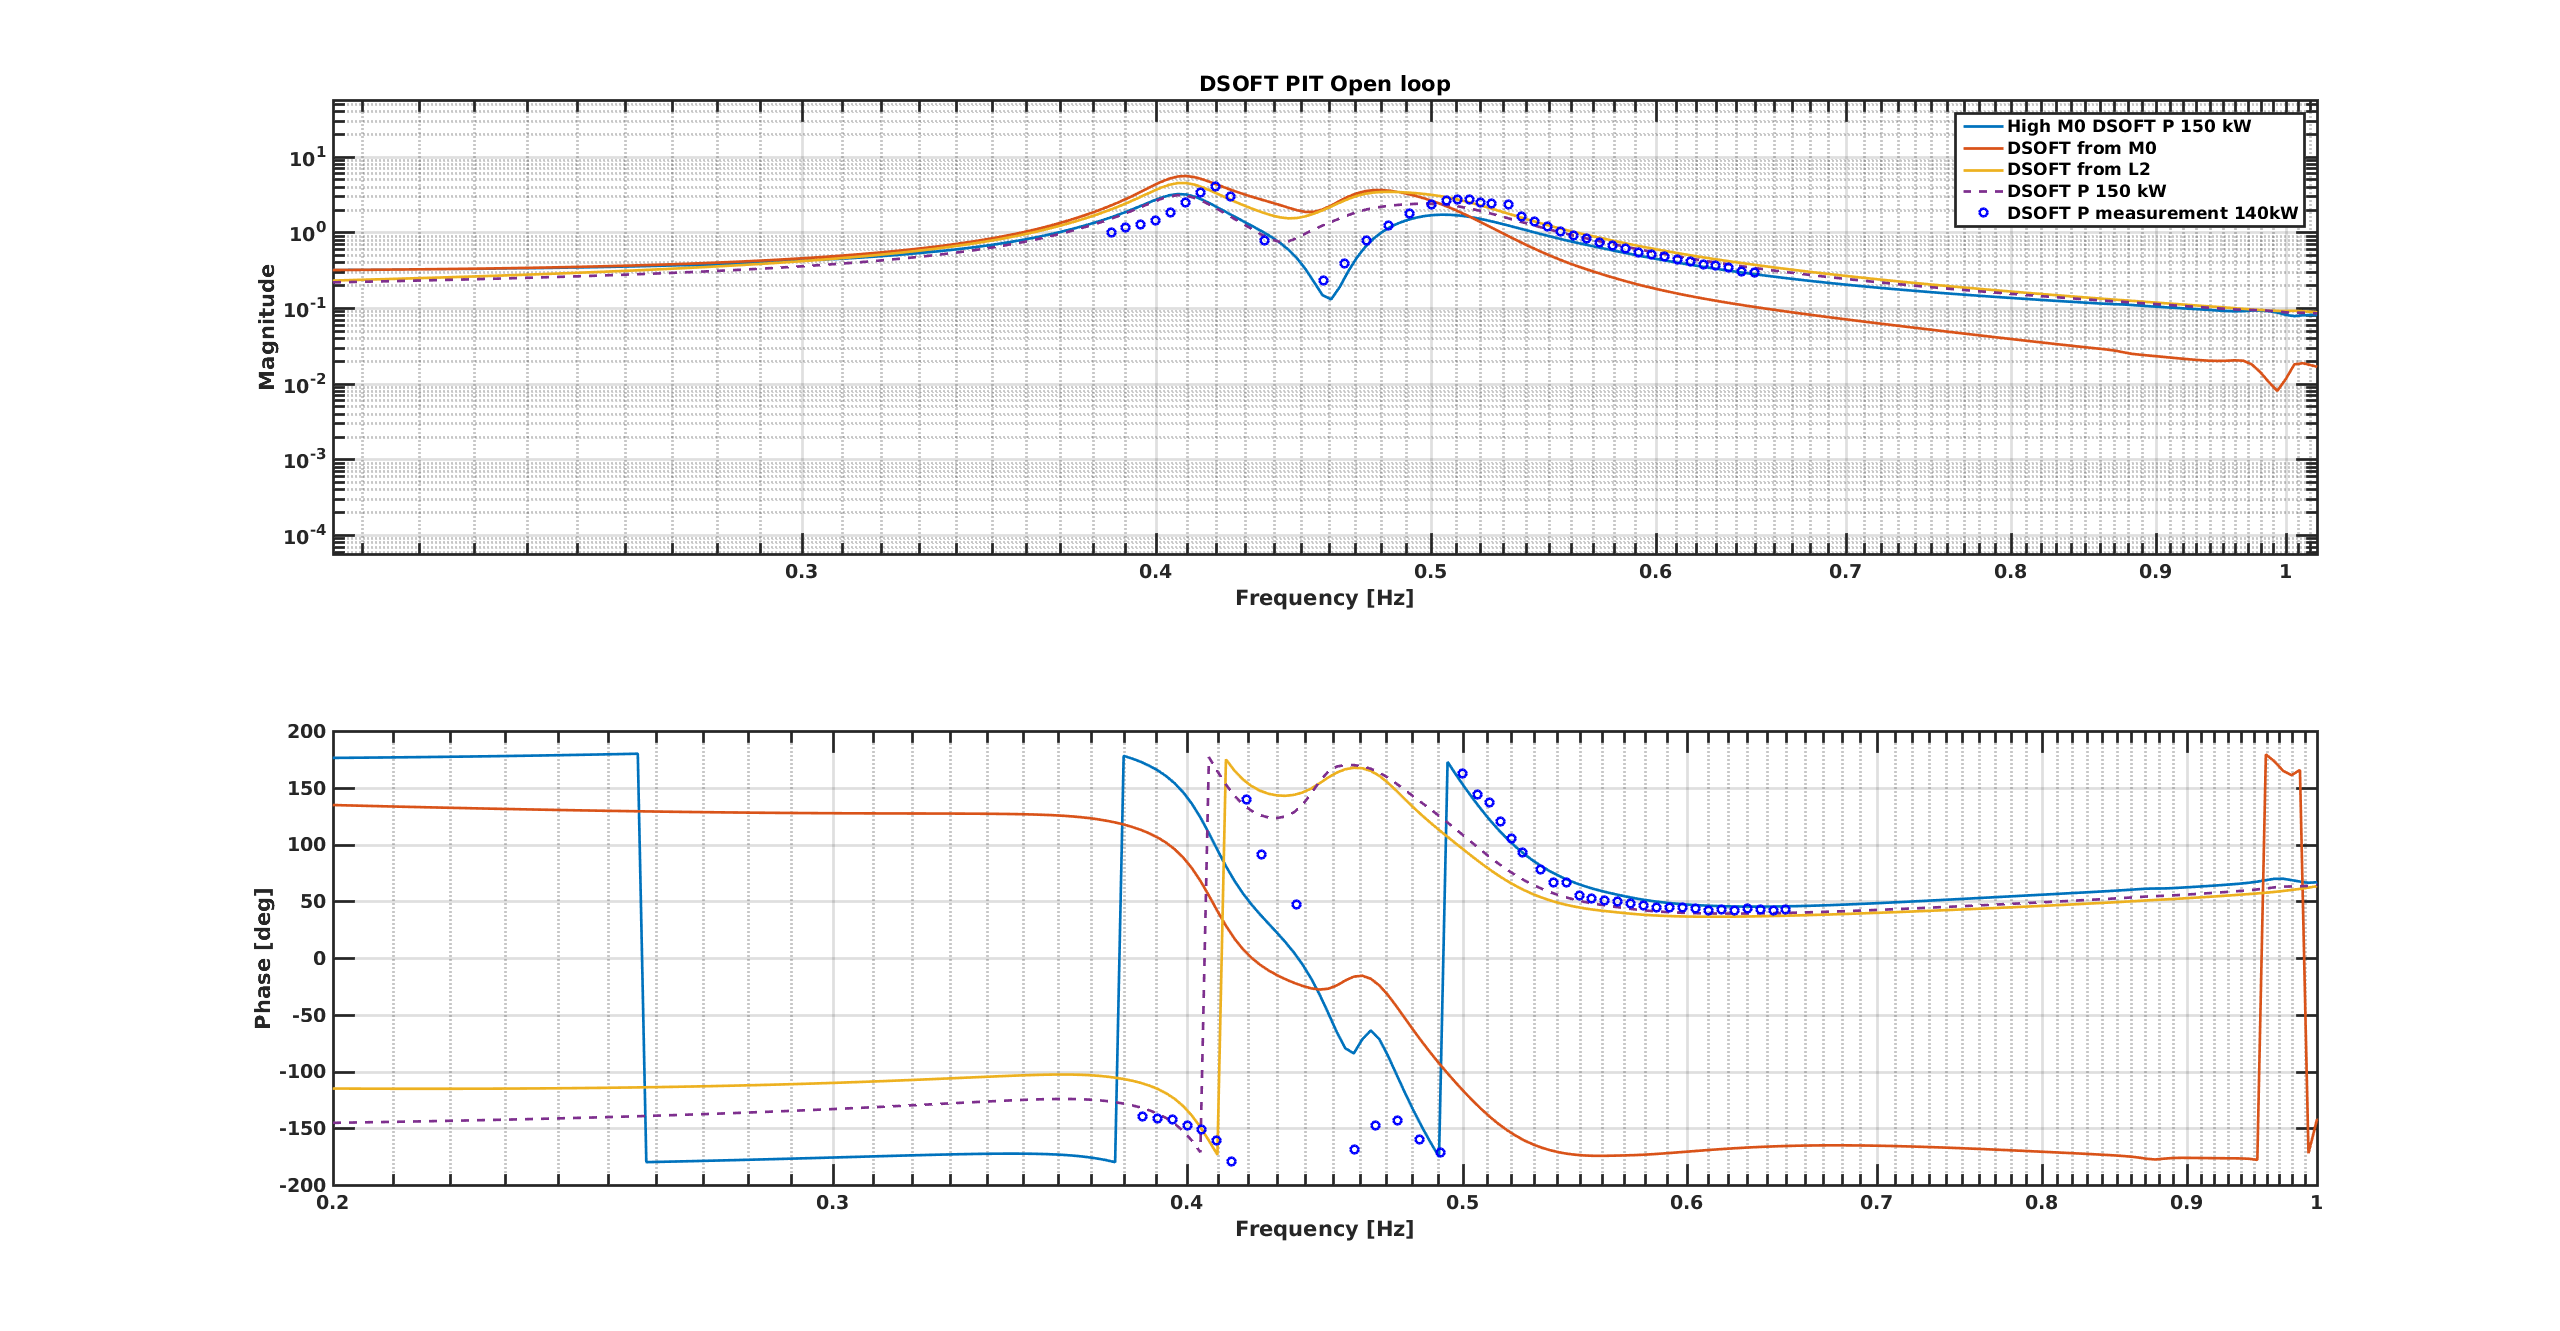
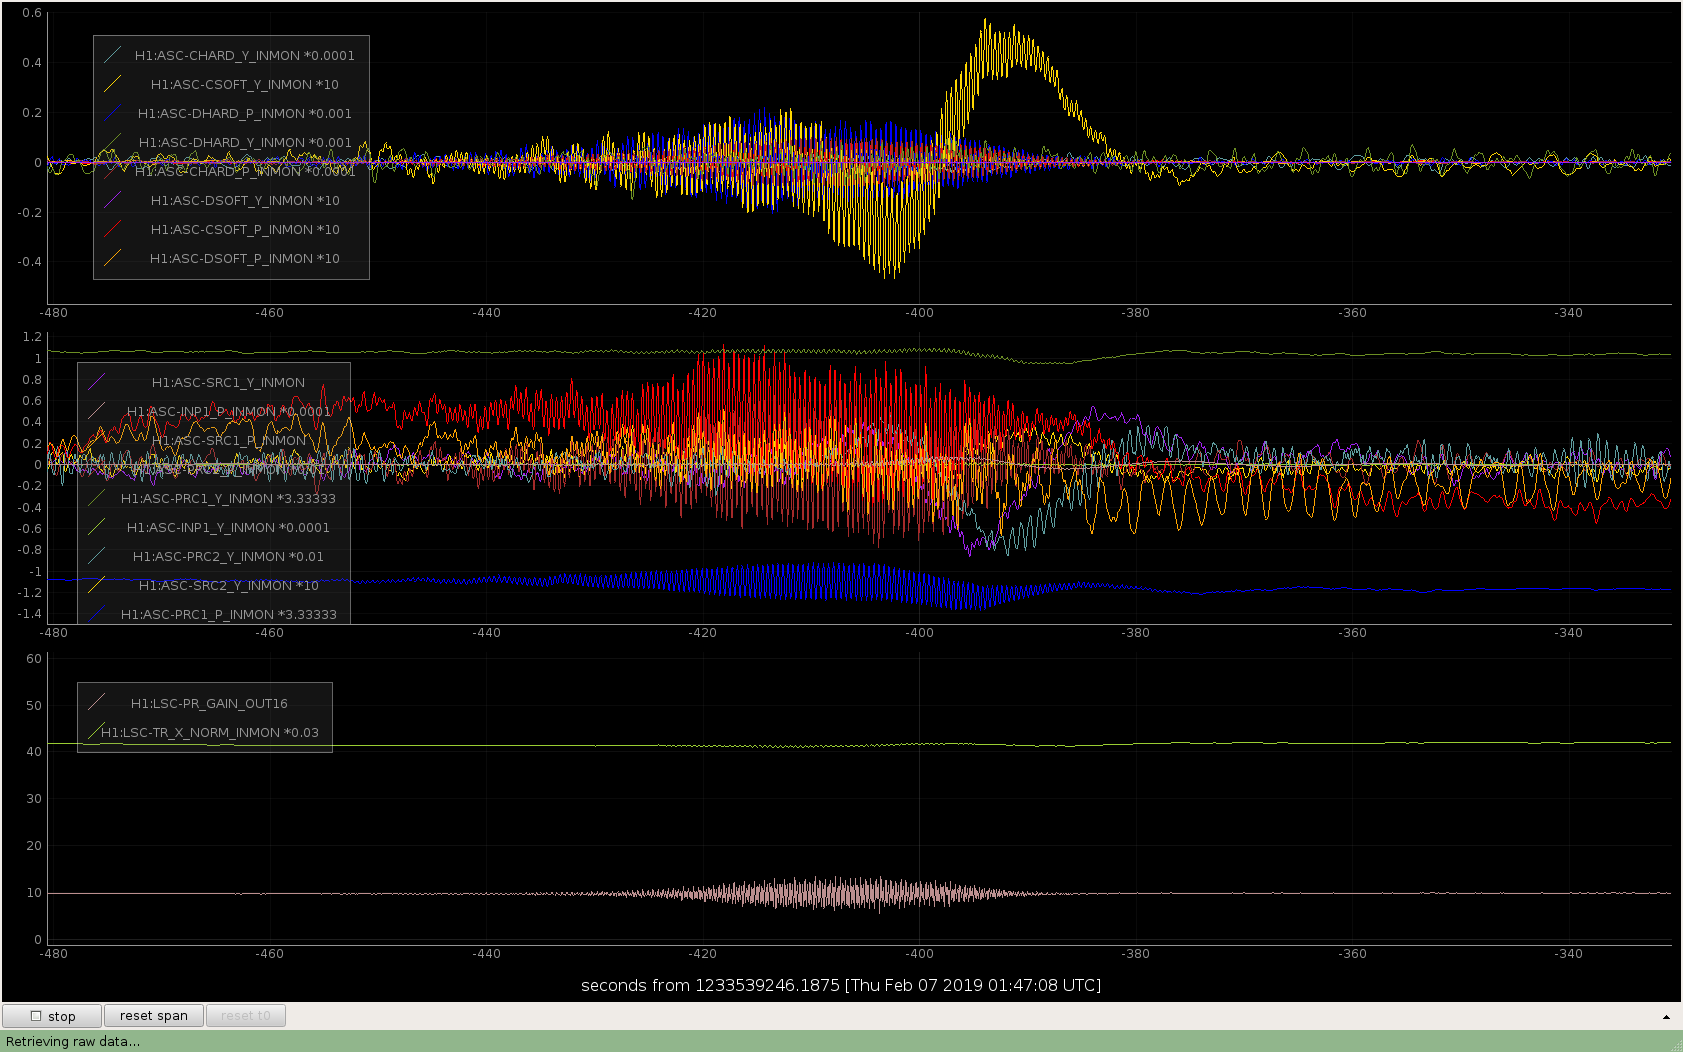
Over the last days, we did several measurements of the DSOFT and DHARD loops to investigate the oscillations that lead to loose lock. In particular 0.47 Hz and 1.1 Hz oscillations are seen frequently.
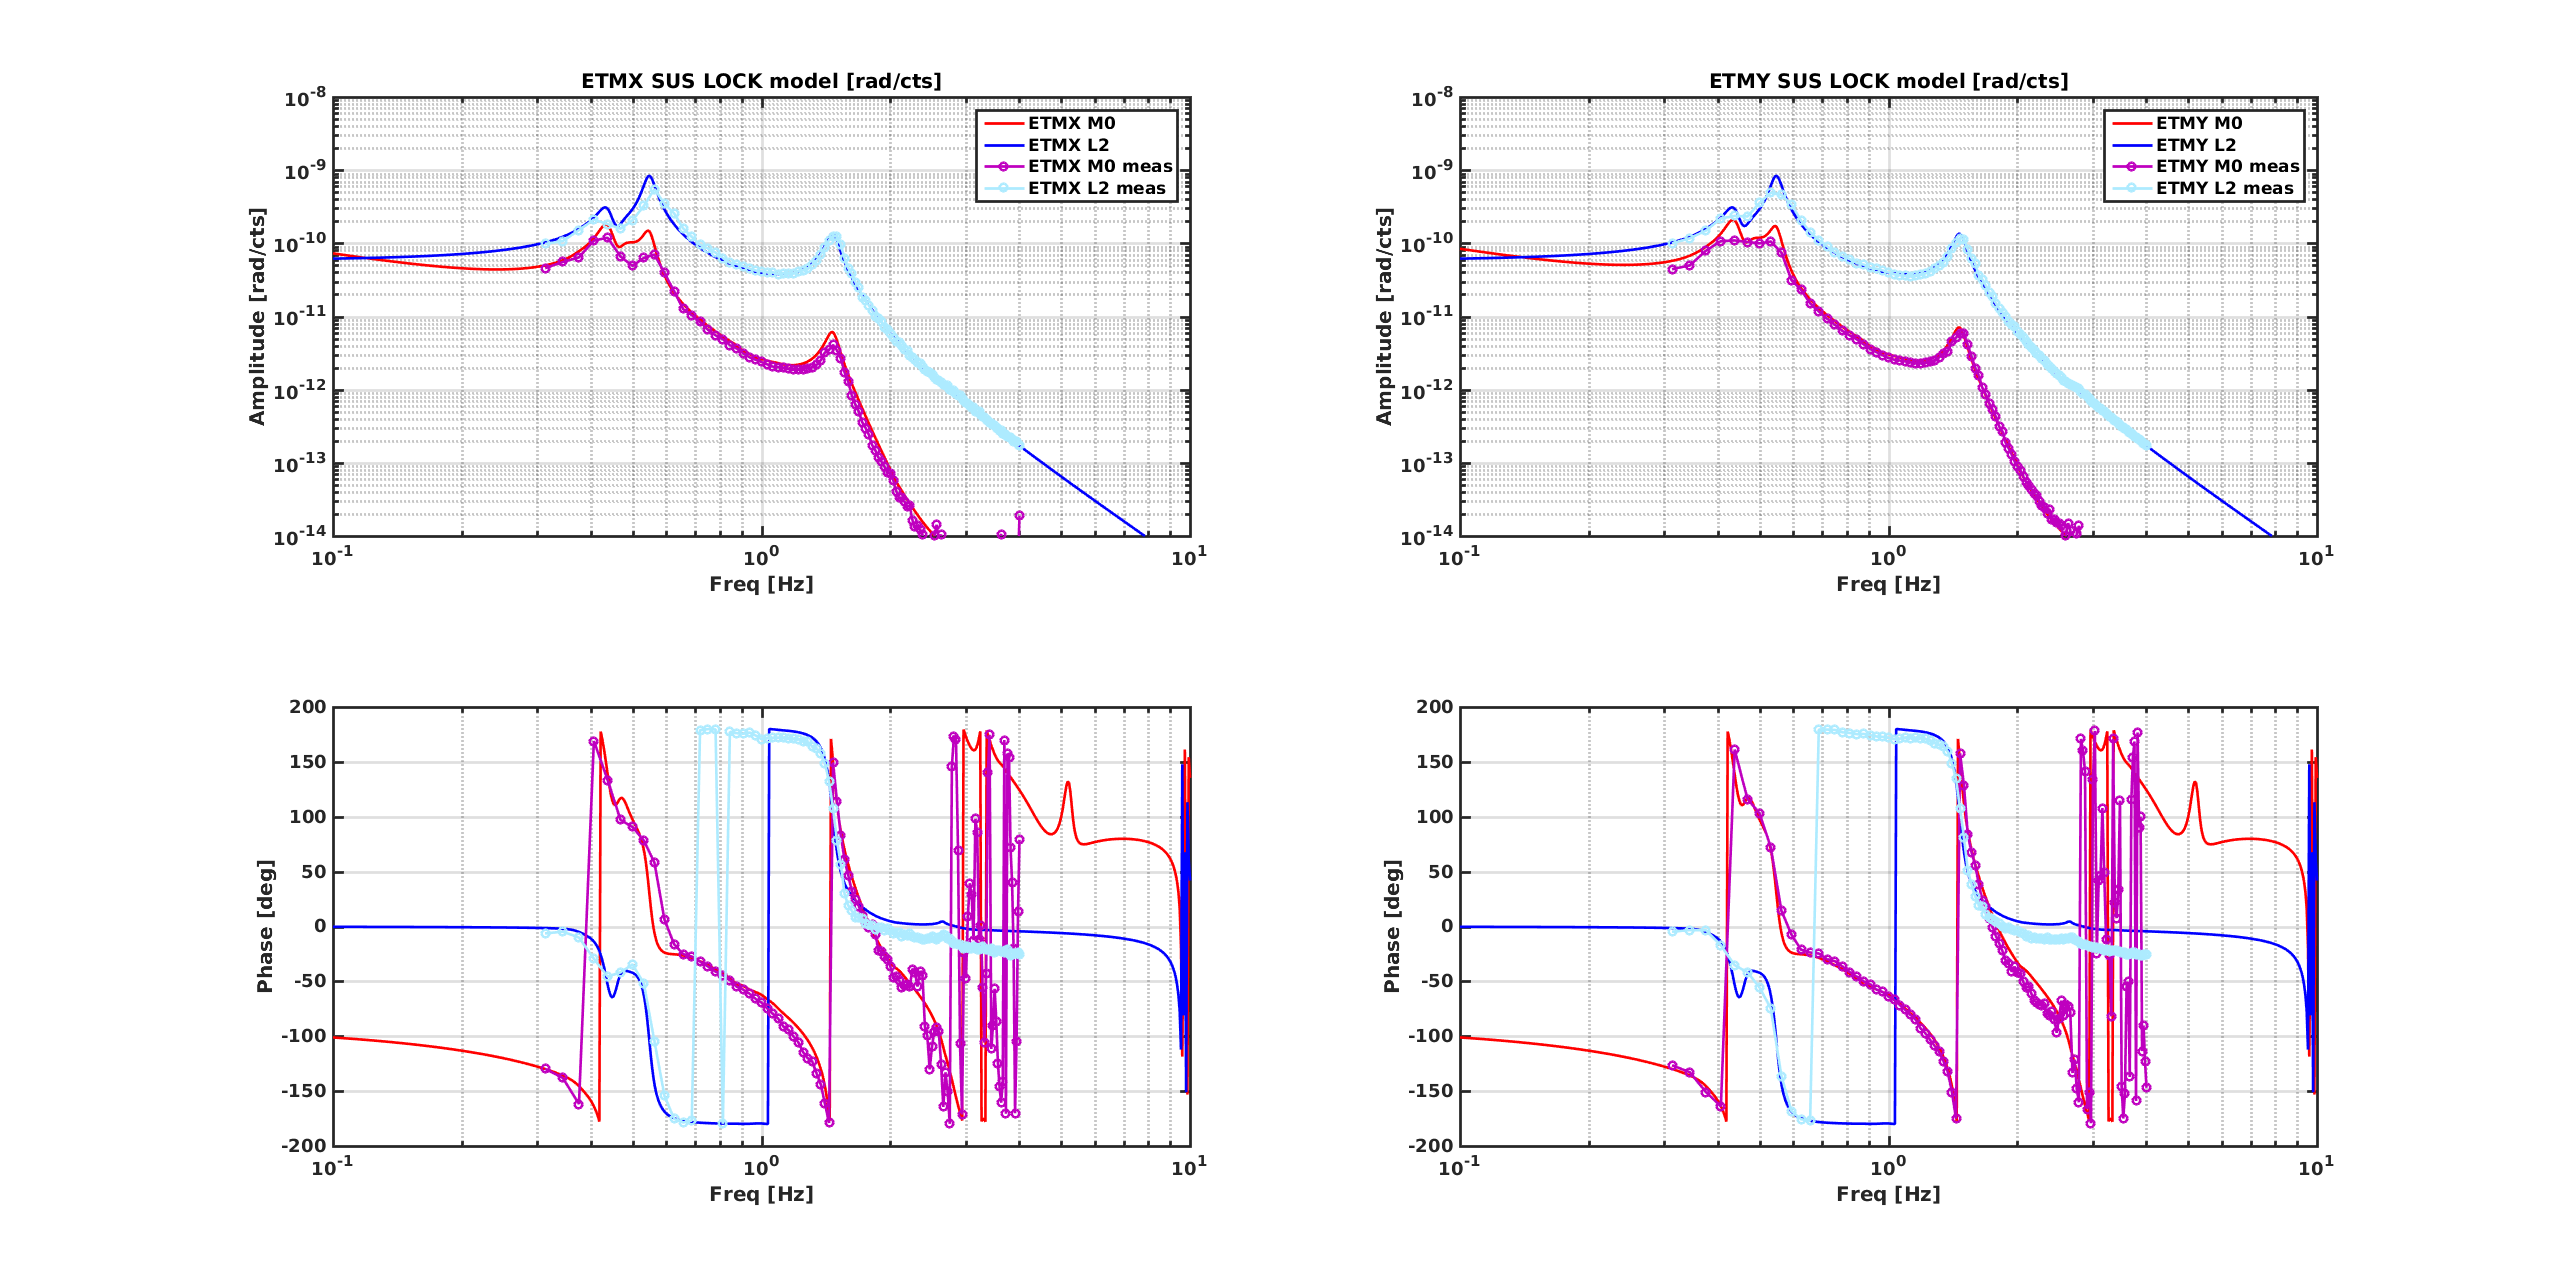
With the angular controls offloaded to M0, we first checked the cross-over frequency between M0 and L1. We drove the two stages through the hierarchical path and measured the angular signals with the oplevs. The model is in very good agreement with the measurements and we can extrapolate that the cross-over frequency is slightly above 0.1 Hz (see figure 1). We also check the angular LOCK filters in all test masses are the same, which is mostly true, expect for a gain difference in M0 ETMX P (see figure 2 and 3).
DSOFT P: The loop was measured at 20W without the Radiation Pressure Compensation (RPC) and without the RESG filter. We observed an unexpected phase shift around 0.46 Hz.
I would suggest to decrease the M0 gain by a factor 3 to decrease the crossover, and remeasure the loop to see if this removes the instability. I would also recommend to increase the gain if this is compatible with the noise coupling in the IFO.
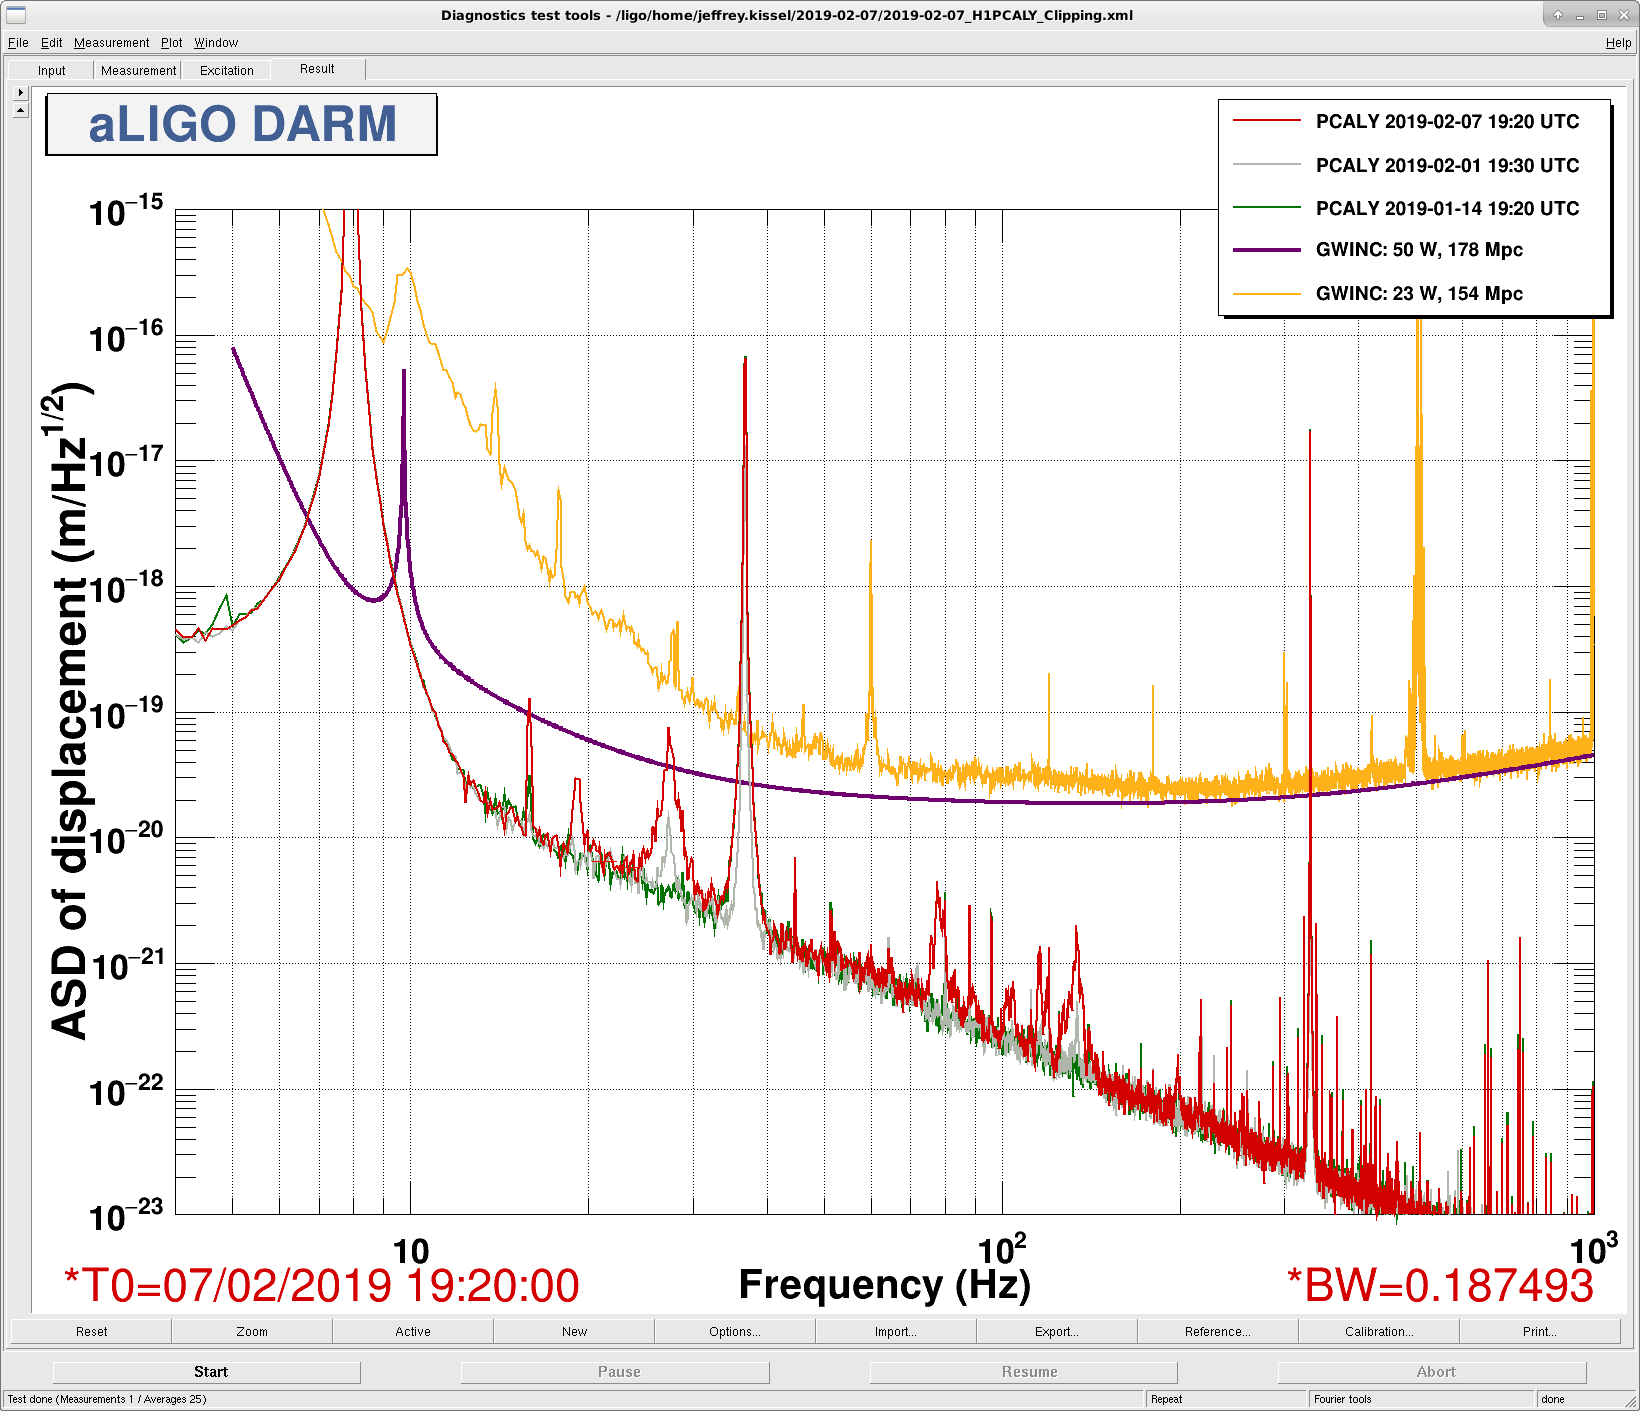
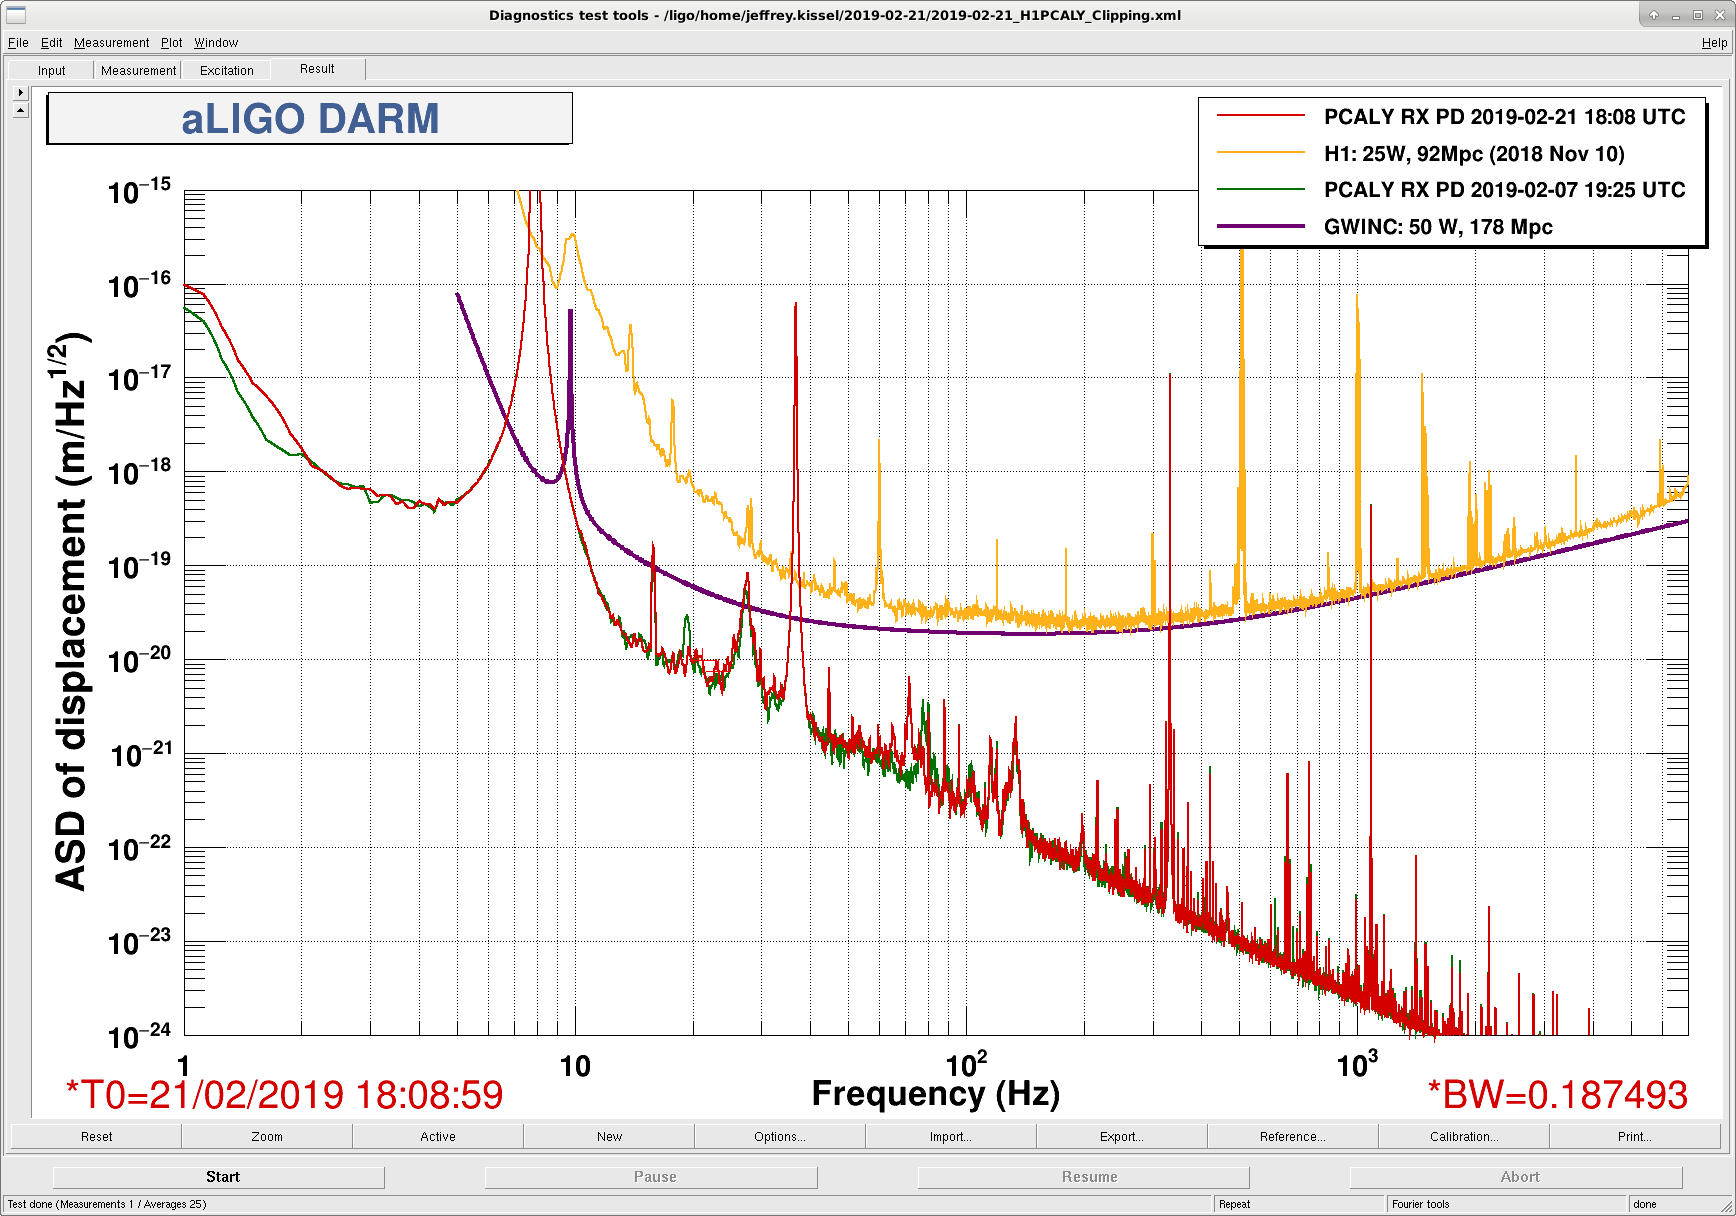
J. Kissel, The H1 DARM figure of merit on the wall constantly shows the H1 PCALY PX PD ASD calibrated into displacement, so it's easy to notice when it looks abnormal. Today (and for the past several days), the I've noticed that other peaks in the ASD besides those requested by calibration lines have returned, reminiscent of very-cold winter problems from 2017 (see LHO aLOG 33108, and FRS Tickets 8328 and Integration Issue 8481). Note that temperatures are also quote cold today, in the ~15 deg F range. This is to notify the PCAL team to investigate. Also @DetChar, the summary pages for the PCAL system, e.g. the 2019-02-05 PCAL Summary page appears to have a significant flaw in he calibration of the X- and Y-end ASD, off by a factor of about 1000. Further, the last two days on summary have failed, and the "clipping" pages (2019-02-06) are dead and/or a repeat of each other.
Still clipping. Interestingly (?) a few peaks have changed location. The main feature at 27.6 Hz is a little bit worse. There is no coherence with DARM (even though the ASD reports that the "displacement" is only a bit away from DELTAL EXTERNAL, and there's a completely coincidental feature around that frequency), so this is likely clipping on the RXPD side of things again.
Associated with FRS Ticket 12281.
I revisited a measurement from May 2016 (see LHO aLOG 27155) to determine the amount of watts impinging on the ETM per volts requested of the optical follower servo (OFS) this will allow for a calibration of the excitation point. To make this measurement, I injected a 2501.3 Hz calibration line on x-arm Pcal, then made a transfer function in DTT H1:CAL-PCALX_TX_PD_VOLTS_OUT / H1:CAL-PCALX_OFS_PD_OUT_DQ = 0.689888 V/V Using the Pcal force coefficient screen, there is a handy-dandy switch that fixes the input to be 1.0 counts in order to know the calculated force on the ETM in units of N/ct. For the x-arm Pcal TXPD, this value is 7.901e-13 N/ct Next, we want to convert this to N/V, so we divide by the ADC gain (6.103516e-4 V/ct) which results 1.2945e-9 N/V Finally, for our purposes, it is useful to recover watts-per-OFS-volt, so we multiply by the watts-per-newton factor c/(2*cos(theta)) = 1.2945e-9 (N/V) * 299792458/2/cos(8.5 deg) (W/N) = 0.1962 W/V Putting the pieces together, 0.689888 (V/V) * 0.1962 (W/V) = 0.13535 watts/OFS volts Compared to the May 2016 measurement (=0.0923 W/V), this value is approximately 47% larger.
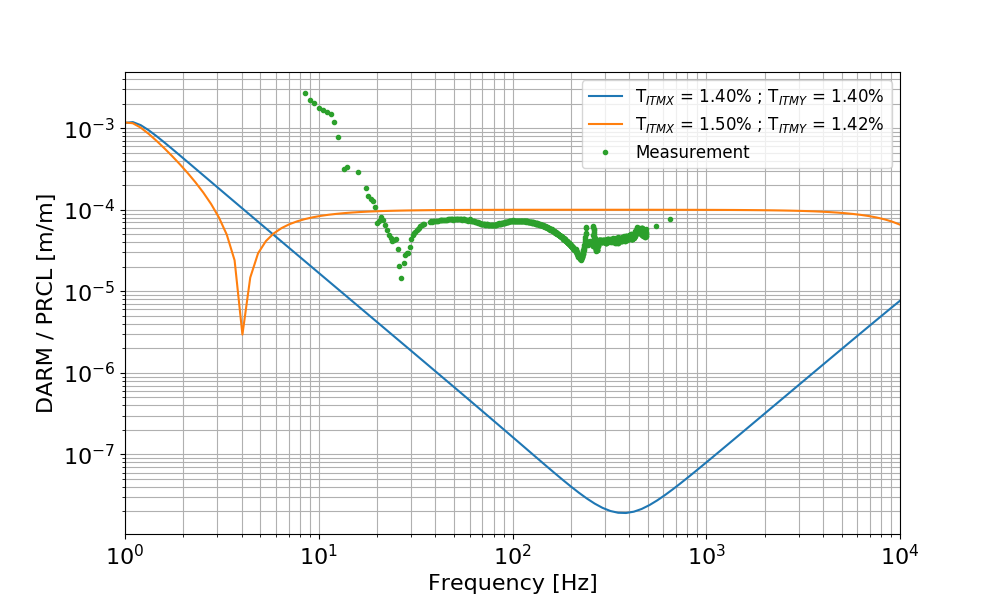
Another effect of the ITM reflectivity imbalance (which also causes the arm power imbalance reported in 46817) is that PRC length noise couples more to DARM.
I used the same simulation that predicted the arm imbalance and the RIN coupling to compute the transfer function from PRCL length noise to DARM. The results are in the plot below: blue is in the ideal IFO case (matched ITMs) and orange is with the ITM values we have now.
The green dots are a measurement performed yesterday night, by injecting at the PRM bottom stage and using the CAL model actuation calibration. The measurement matches reasonably well the simulation expectation, giving a flat transfer function with a level at about 8e-5, close to the predicted 10e-5. The simulation also reproduces the notch visible in the measurement, although at a different frequency. The notch in simulation is coming from the interference between the flat coupling (due to the ITM mismatch) and the radiation pressure coupling. I'm not sure yet how to modify the simulation parameters to move this notch. This might also be due to a cross-coupling between PRCL and SRCL, that is not modeled in the simulation since there are no feedback loops.
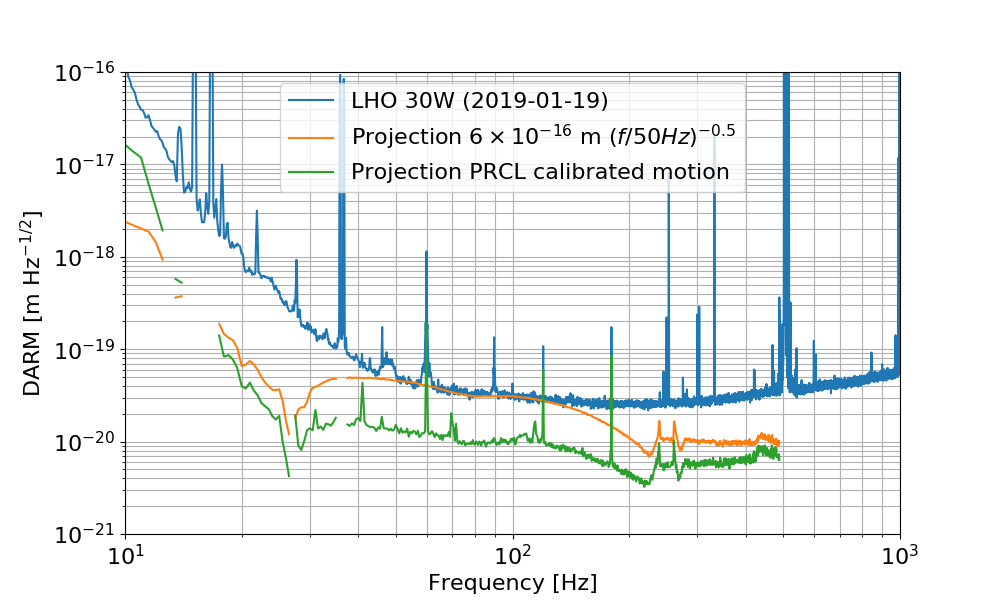
Using the measured transfer function, we can project PRC length noise into DARM. To match the DARM noise in th 50-100 Hz region, we would need a PRC length noise of about 6e-16 m/rHz at 50 Hz, with 1/sqrt(f) slope, as shown below. I used the calibrated PRCL signal from the CAL model to check this value: the reported PRC length noise is about 10 times smaller at those frequencies. The plot below shows the projection of PRC length noise into DARM using the measured TF, both for the artificial value quoted above, and for the estimated PRC length noise.
This seems too confirm that, even though the coupling from PRC length to DARM is much higher than in a ideal case, it's not a limiting factor.
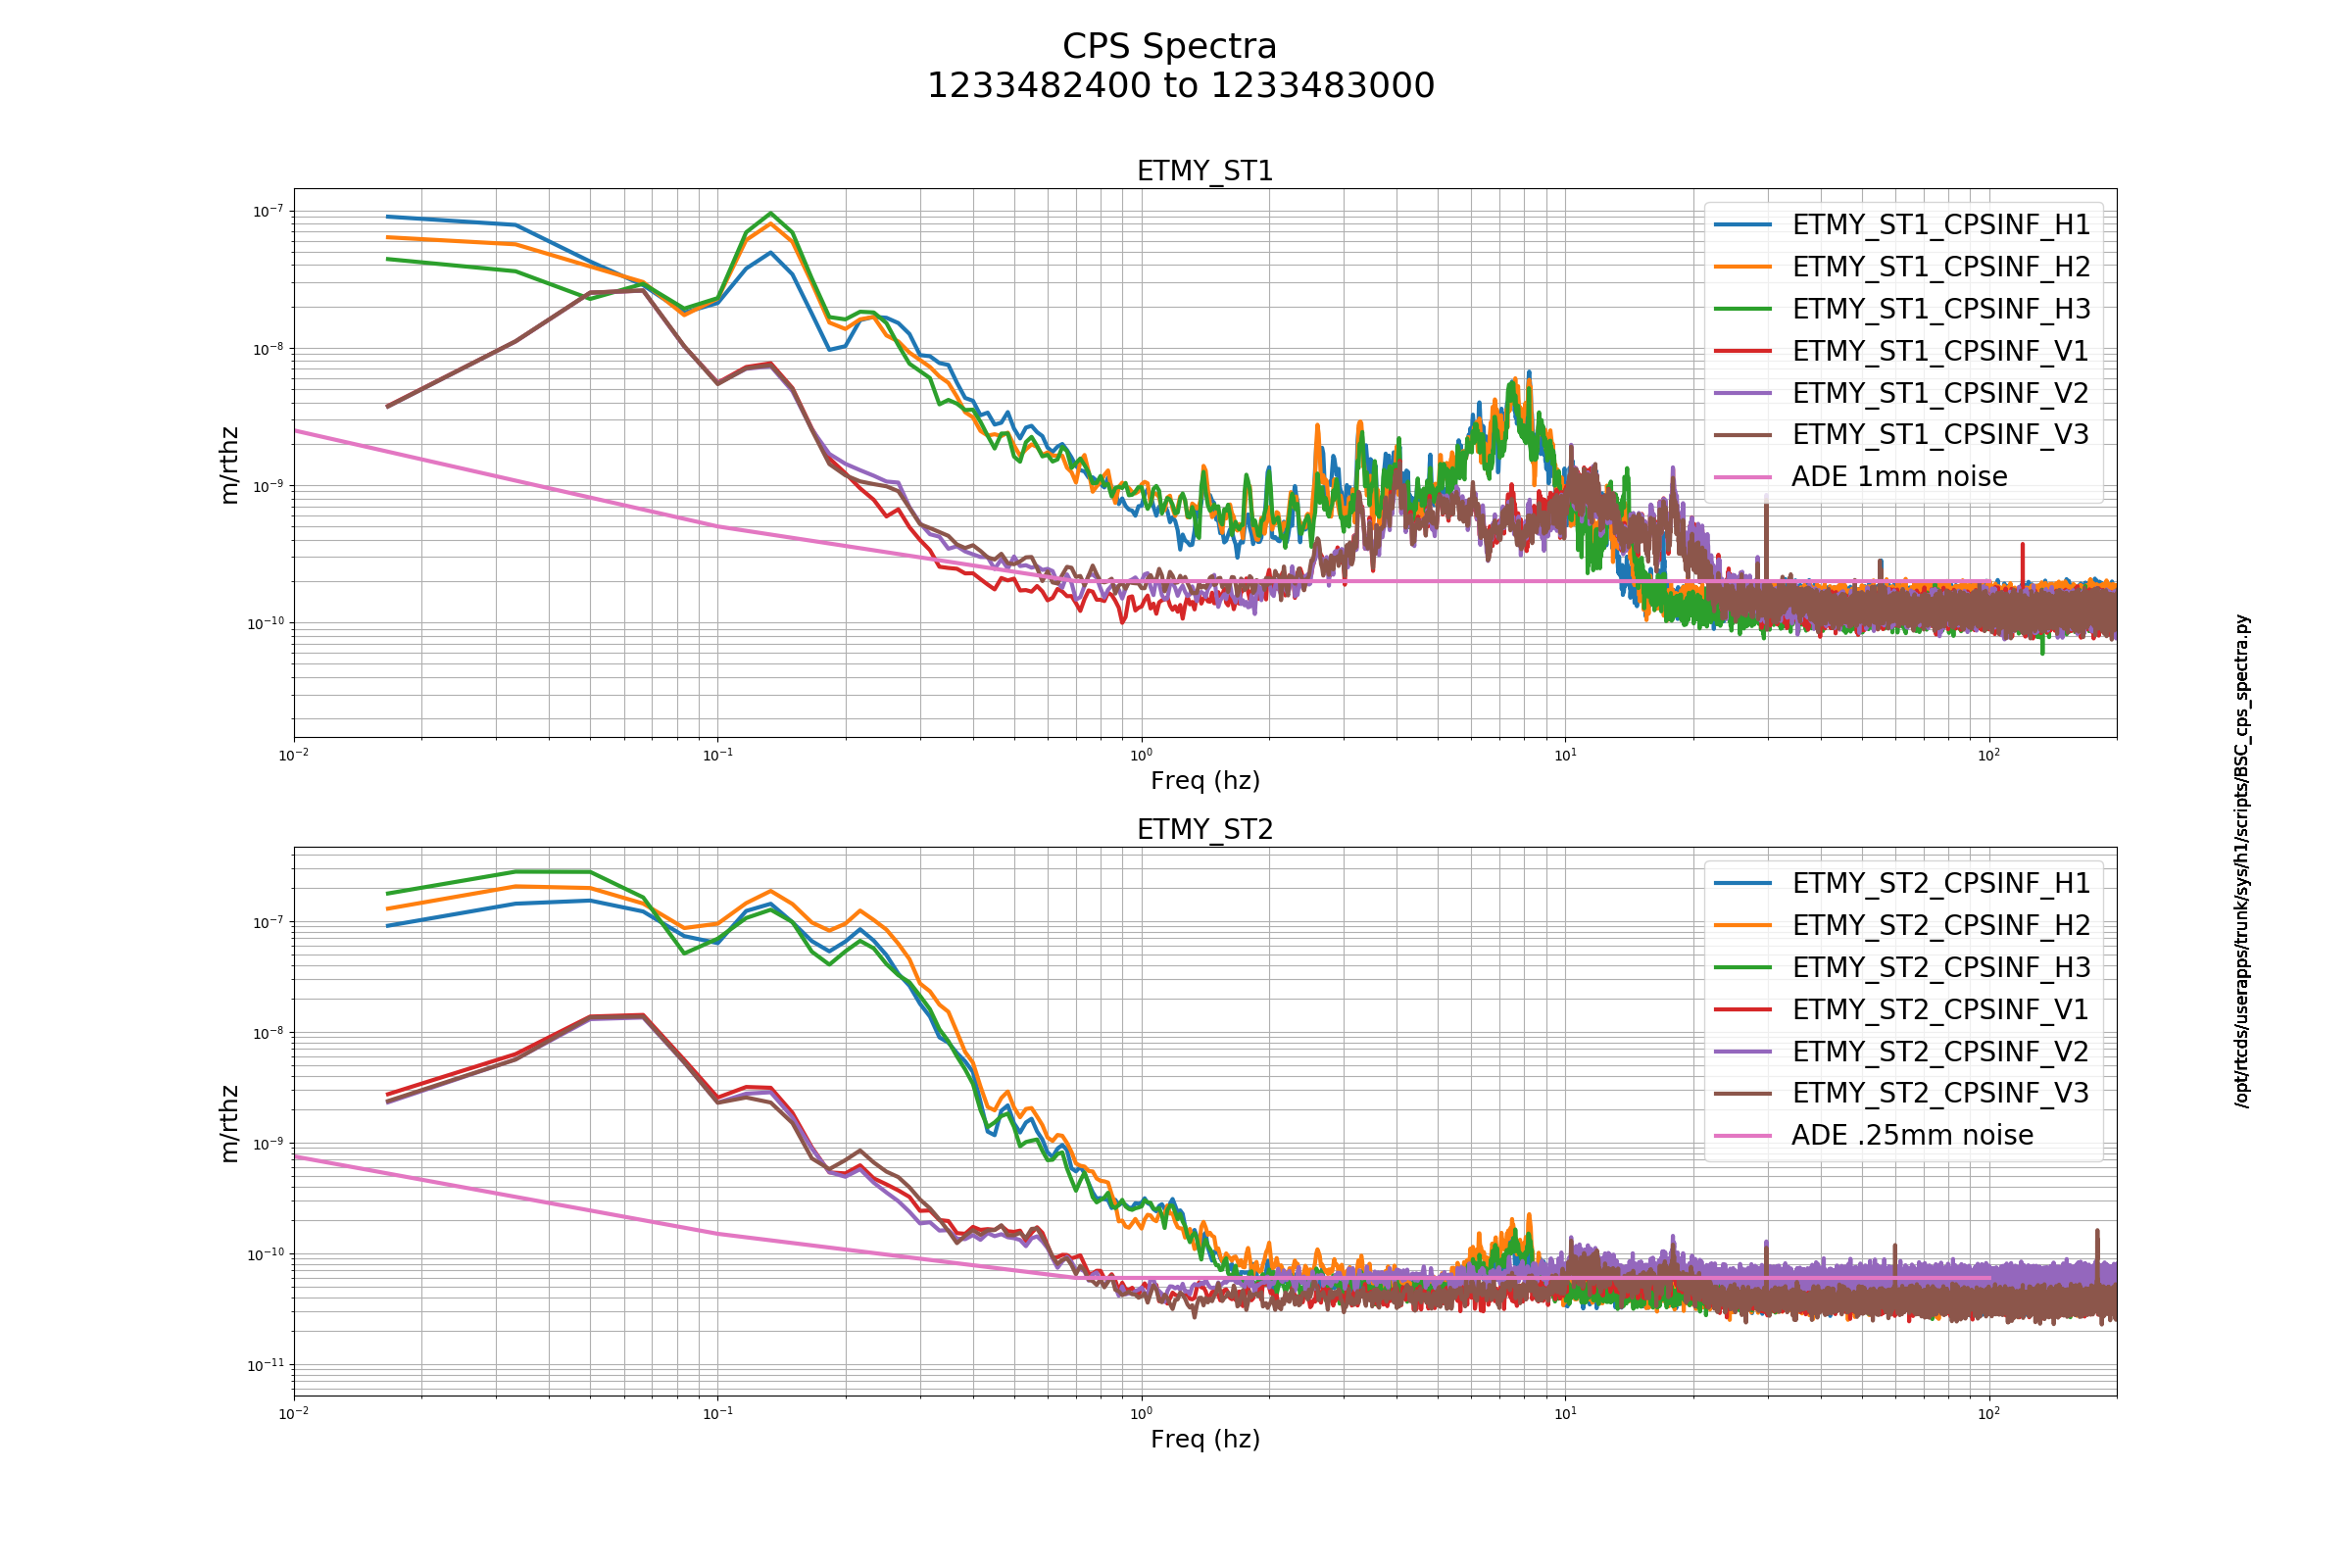
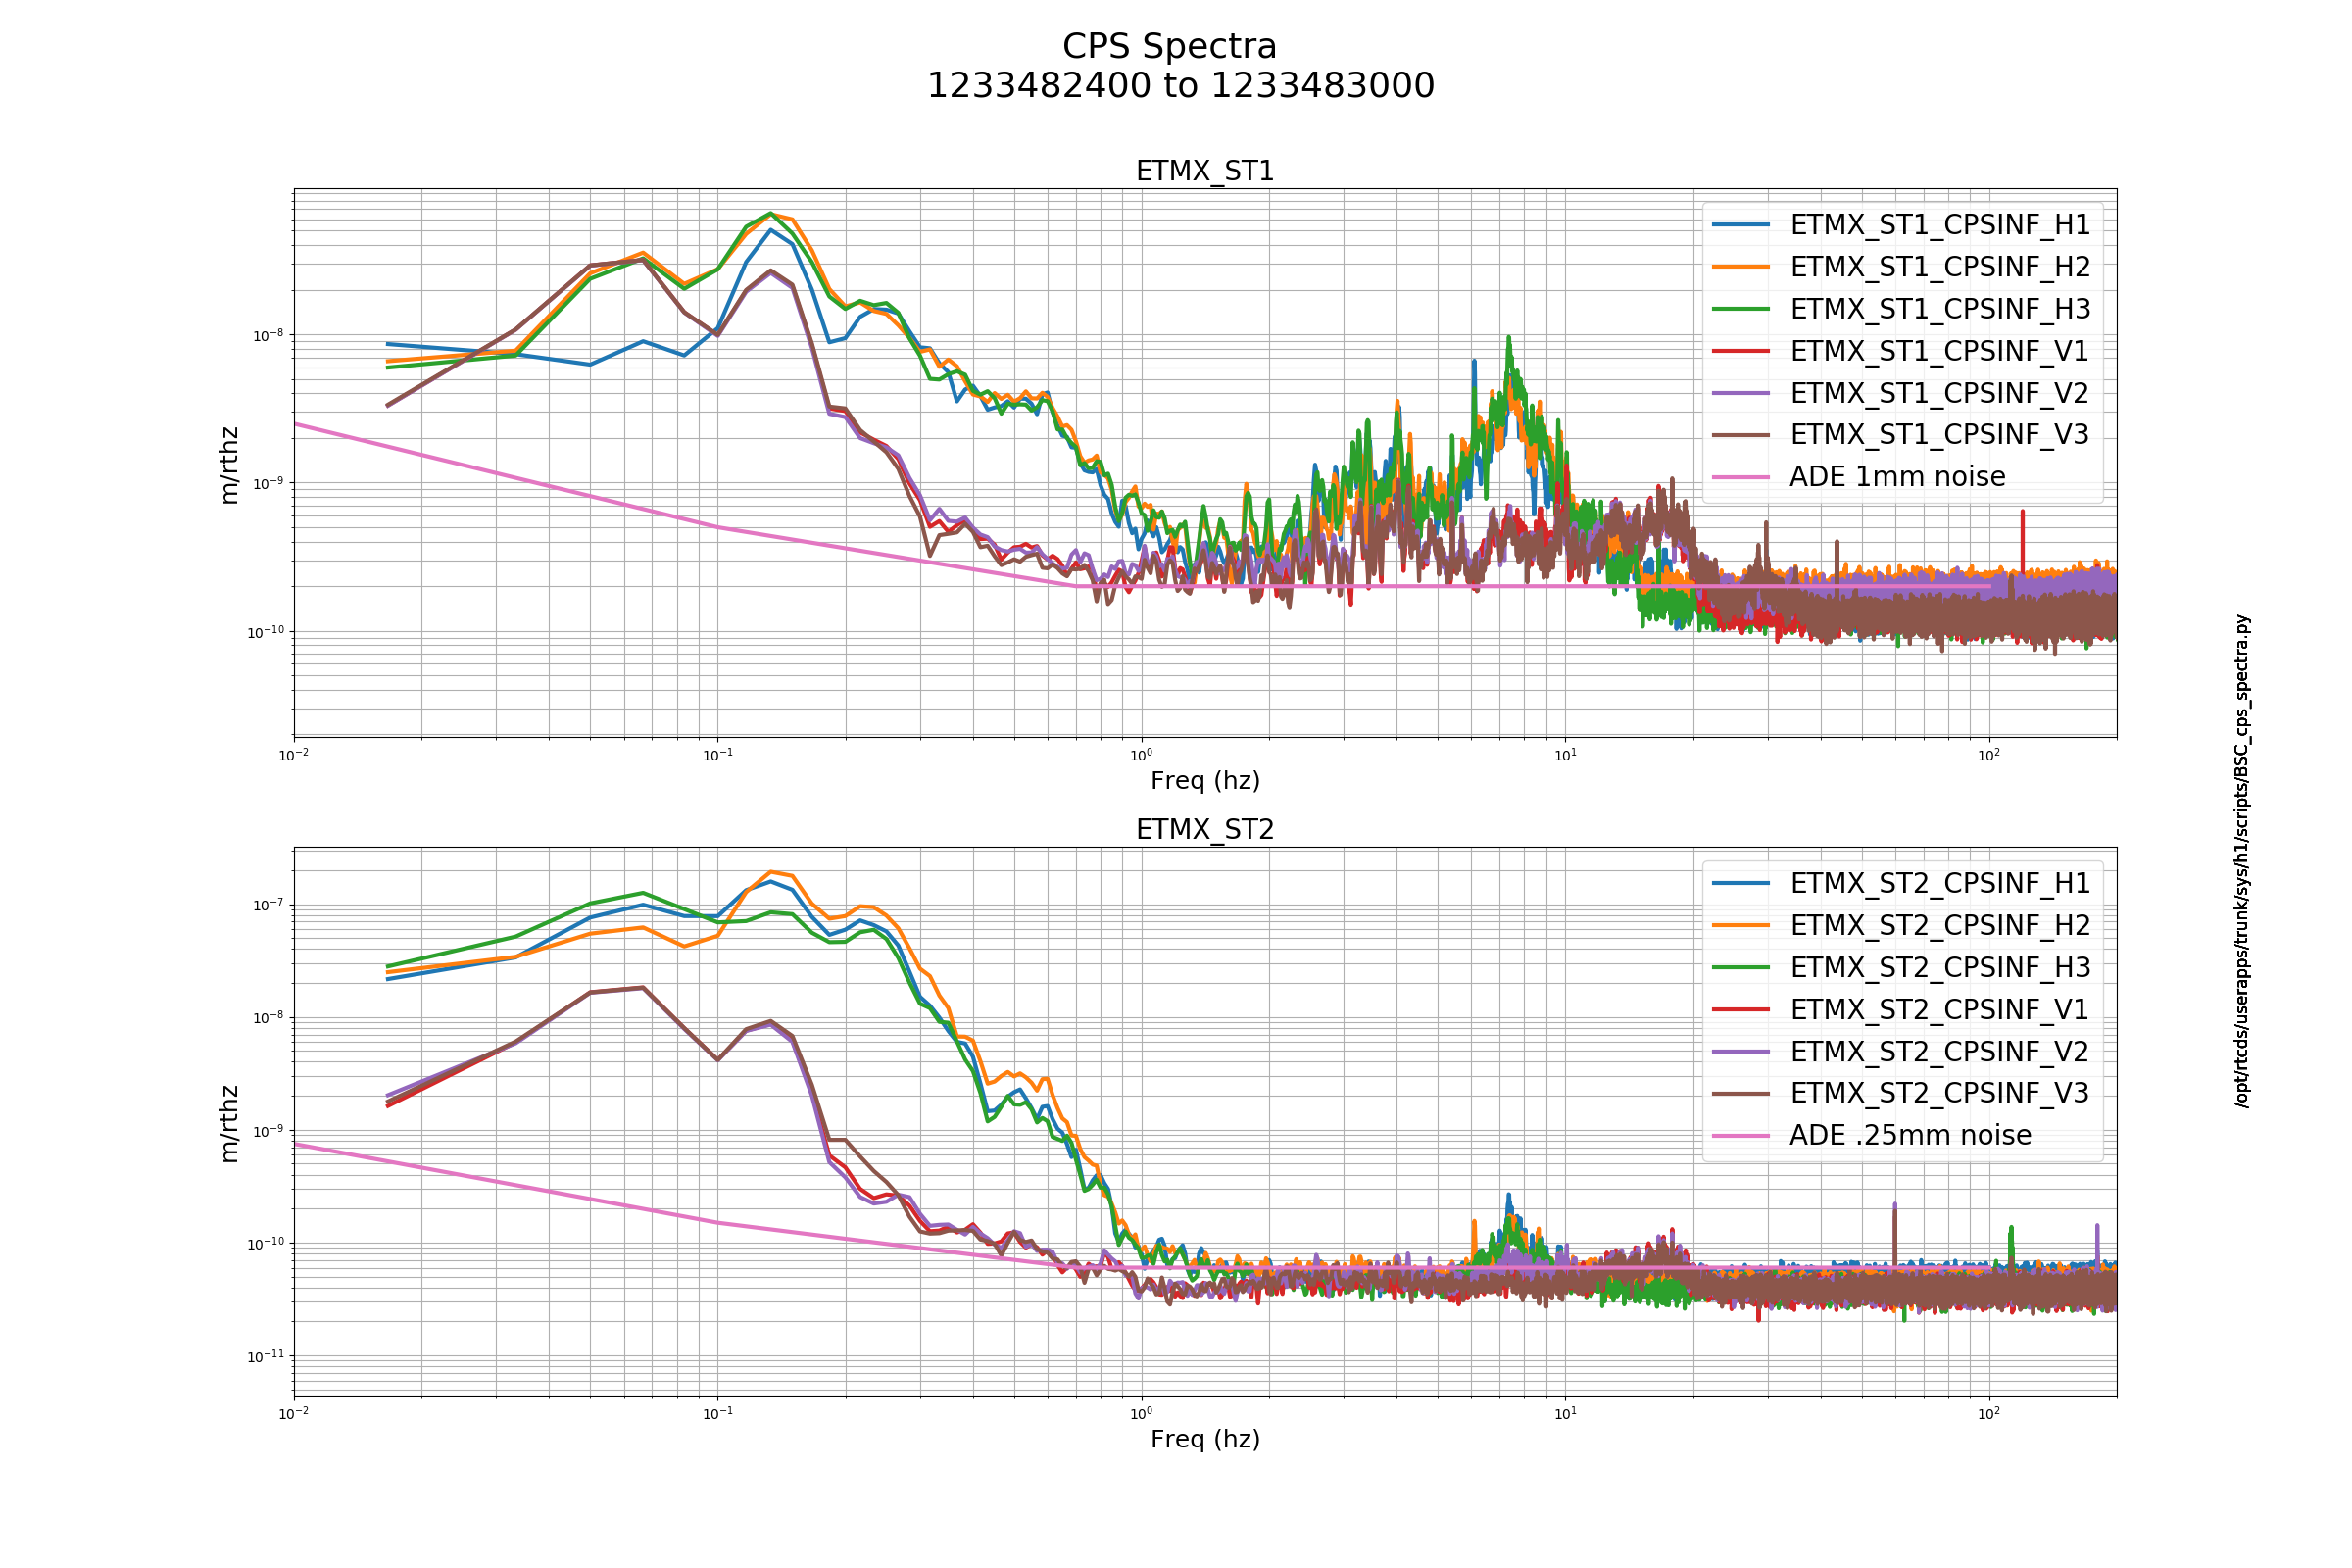
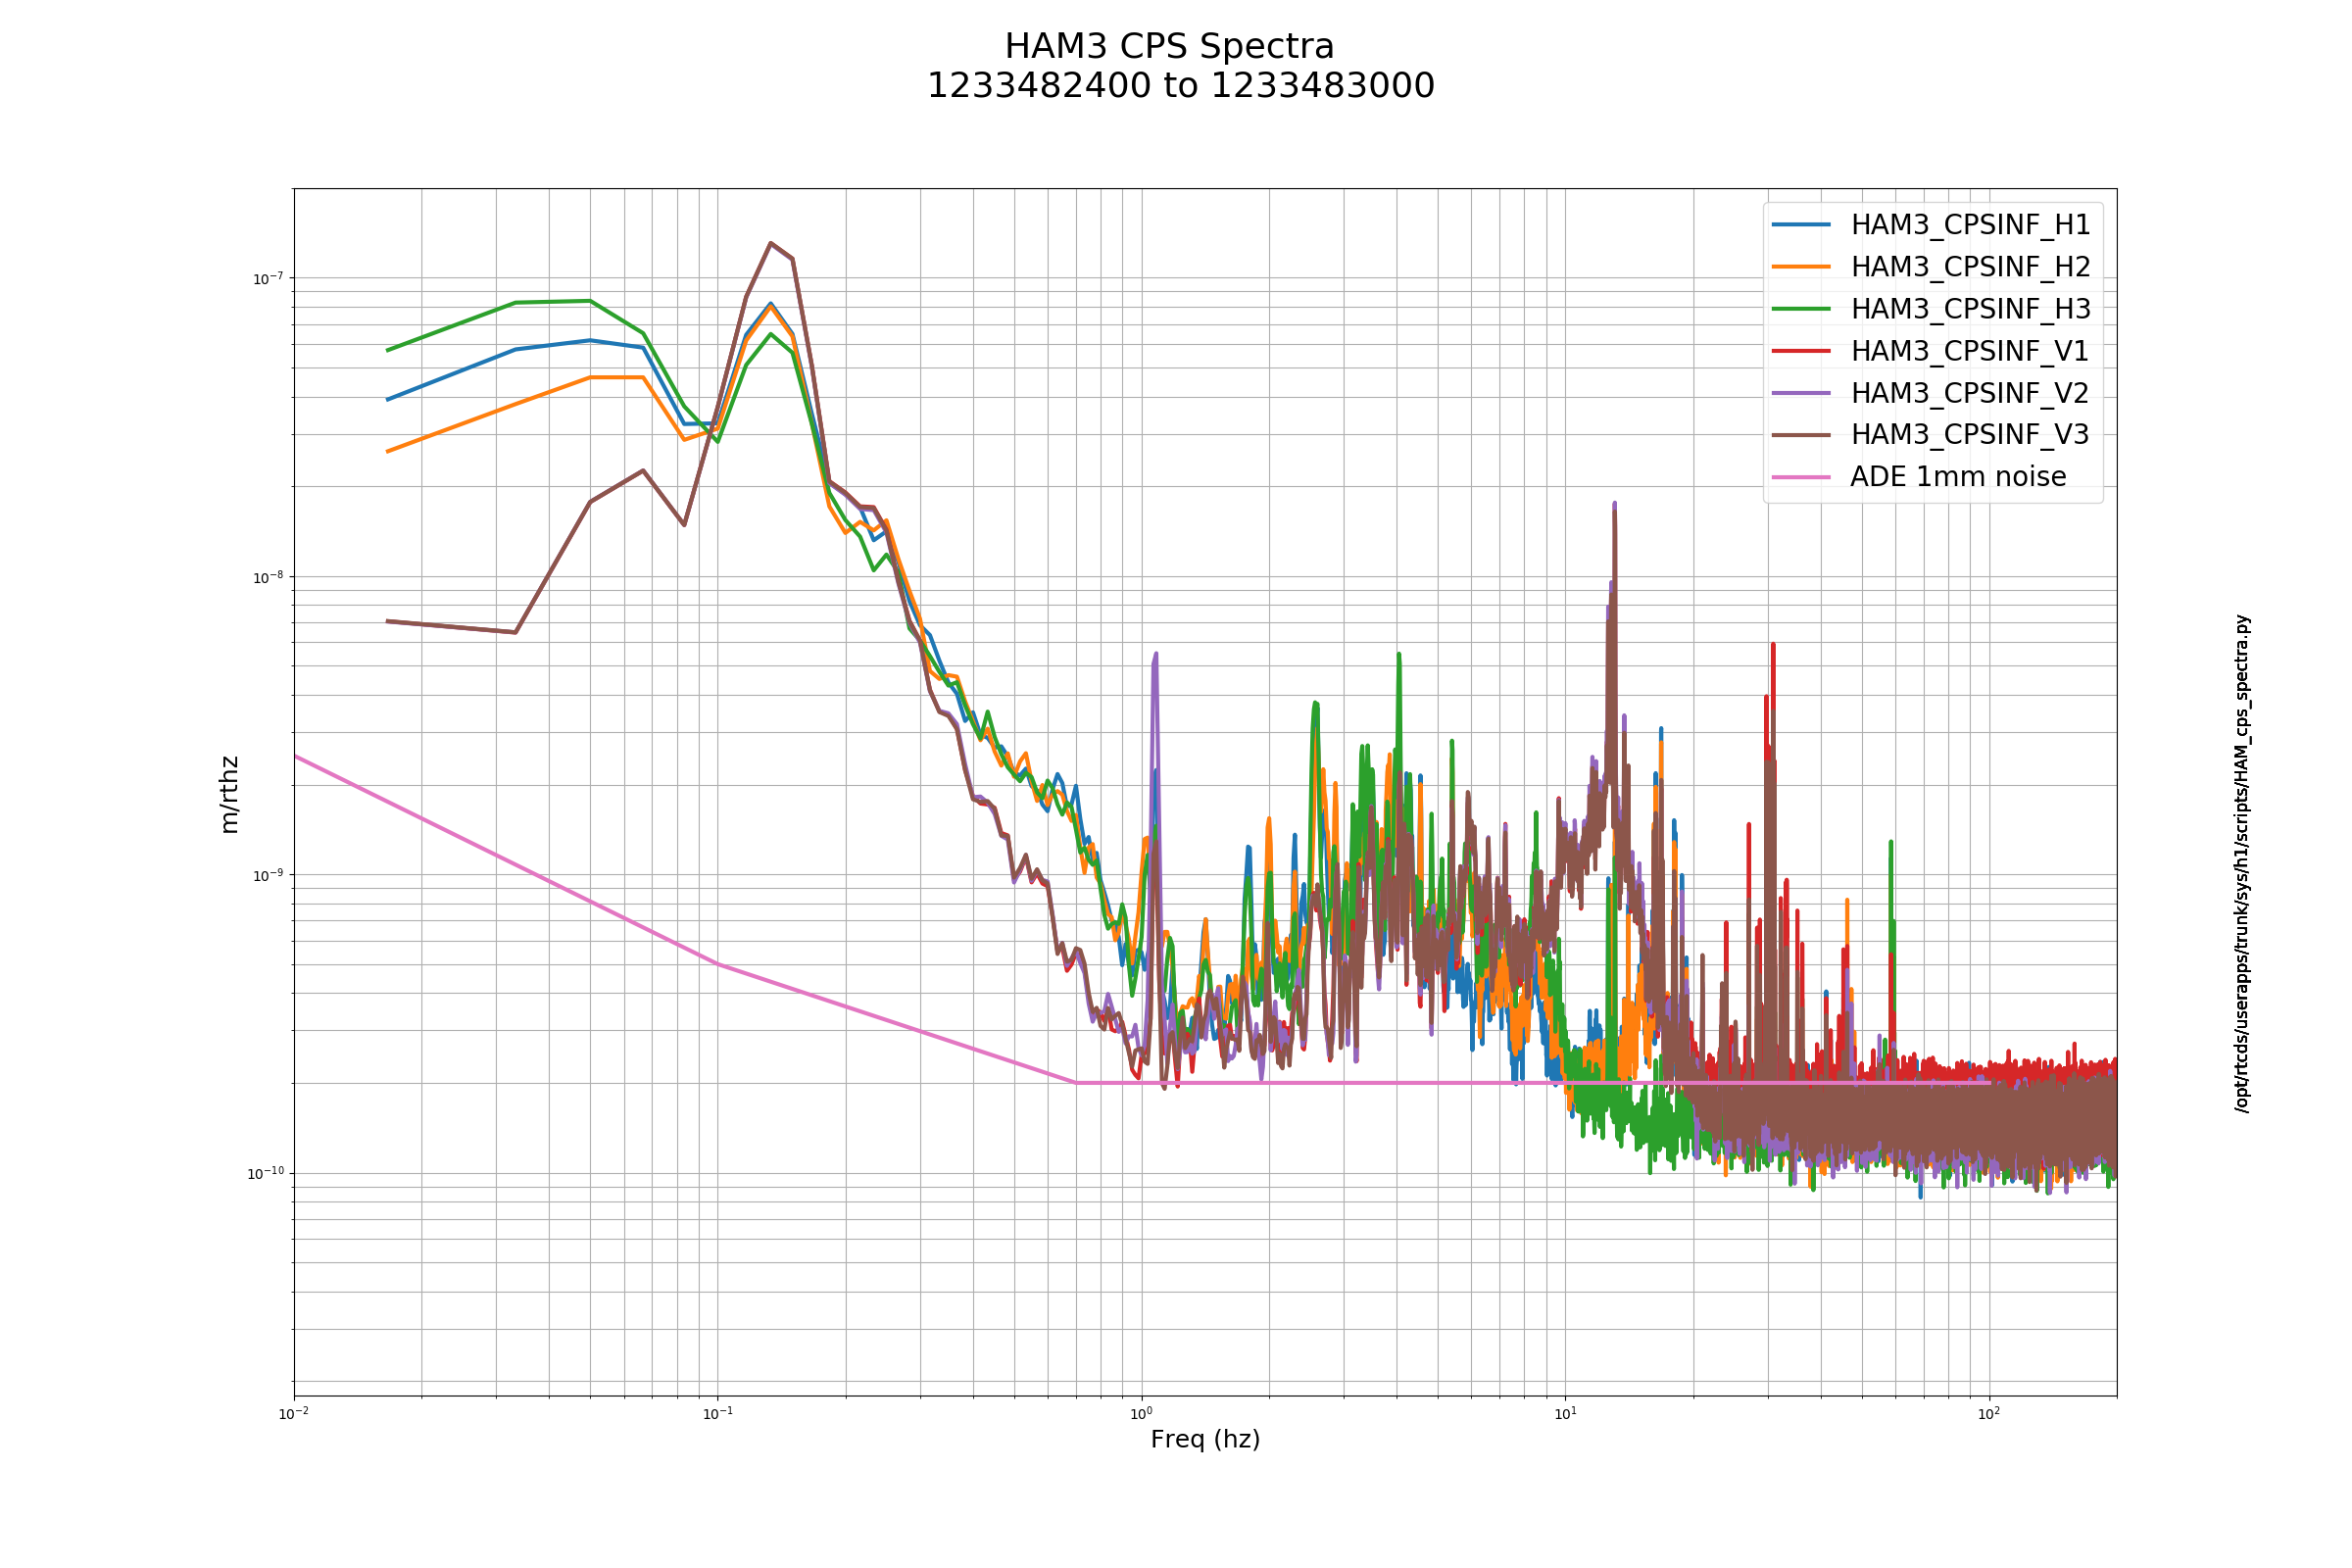
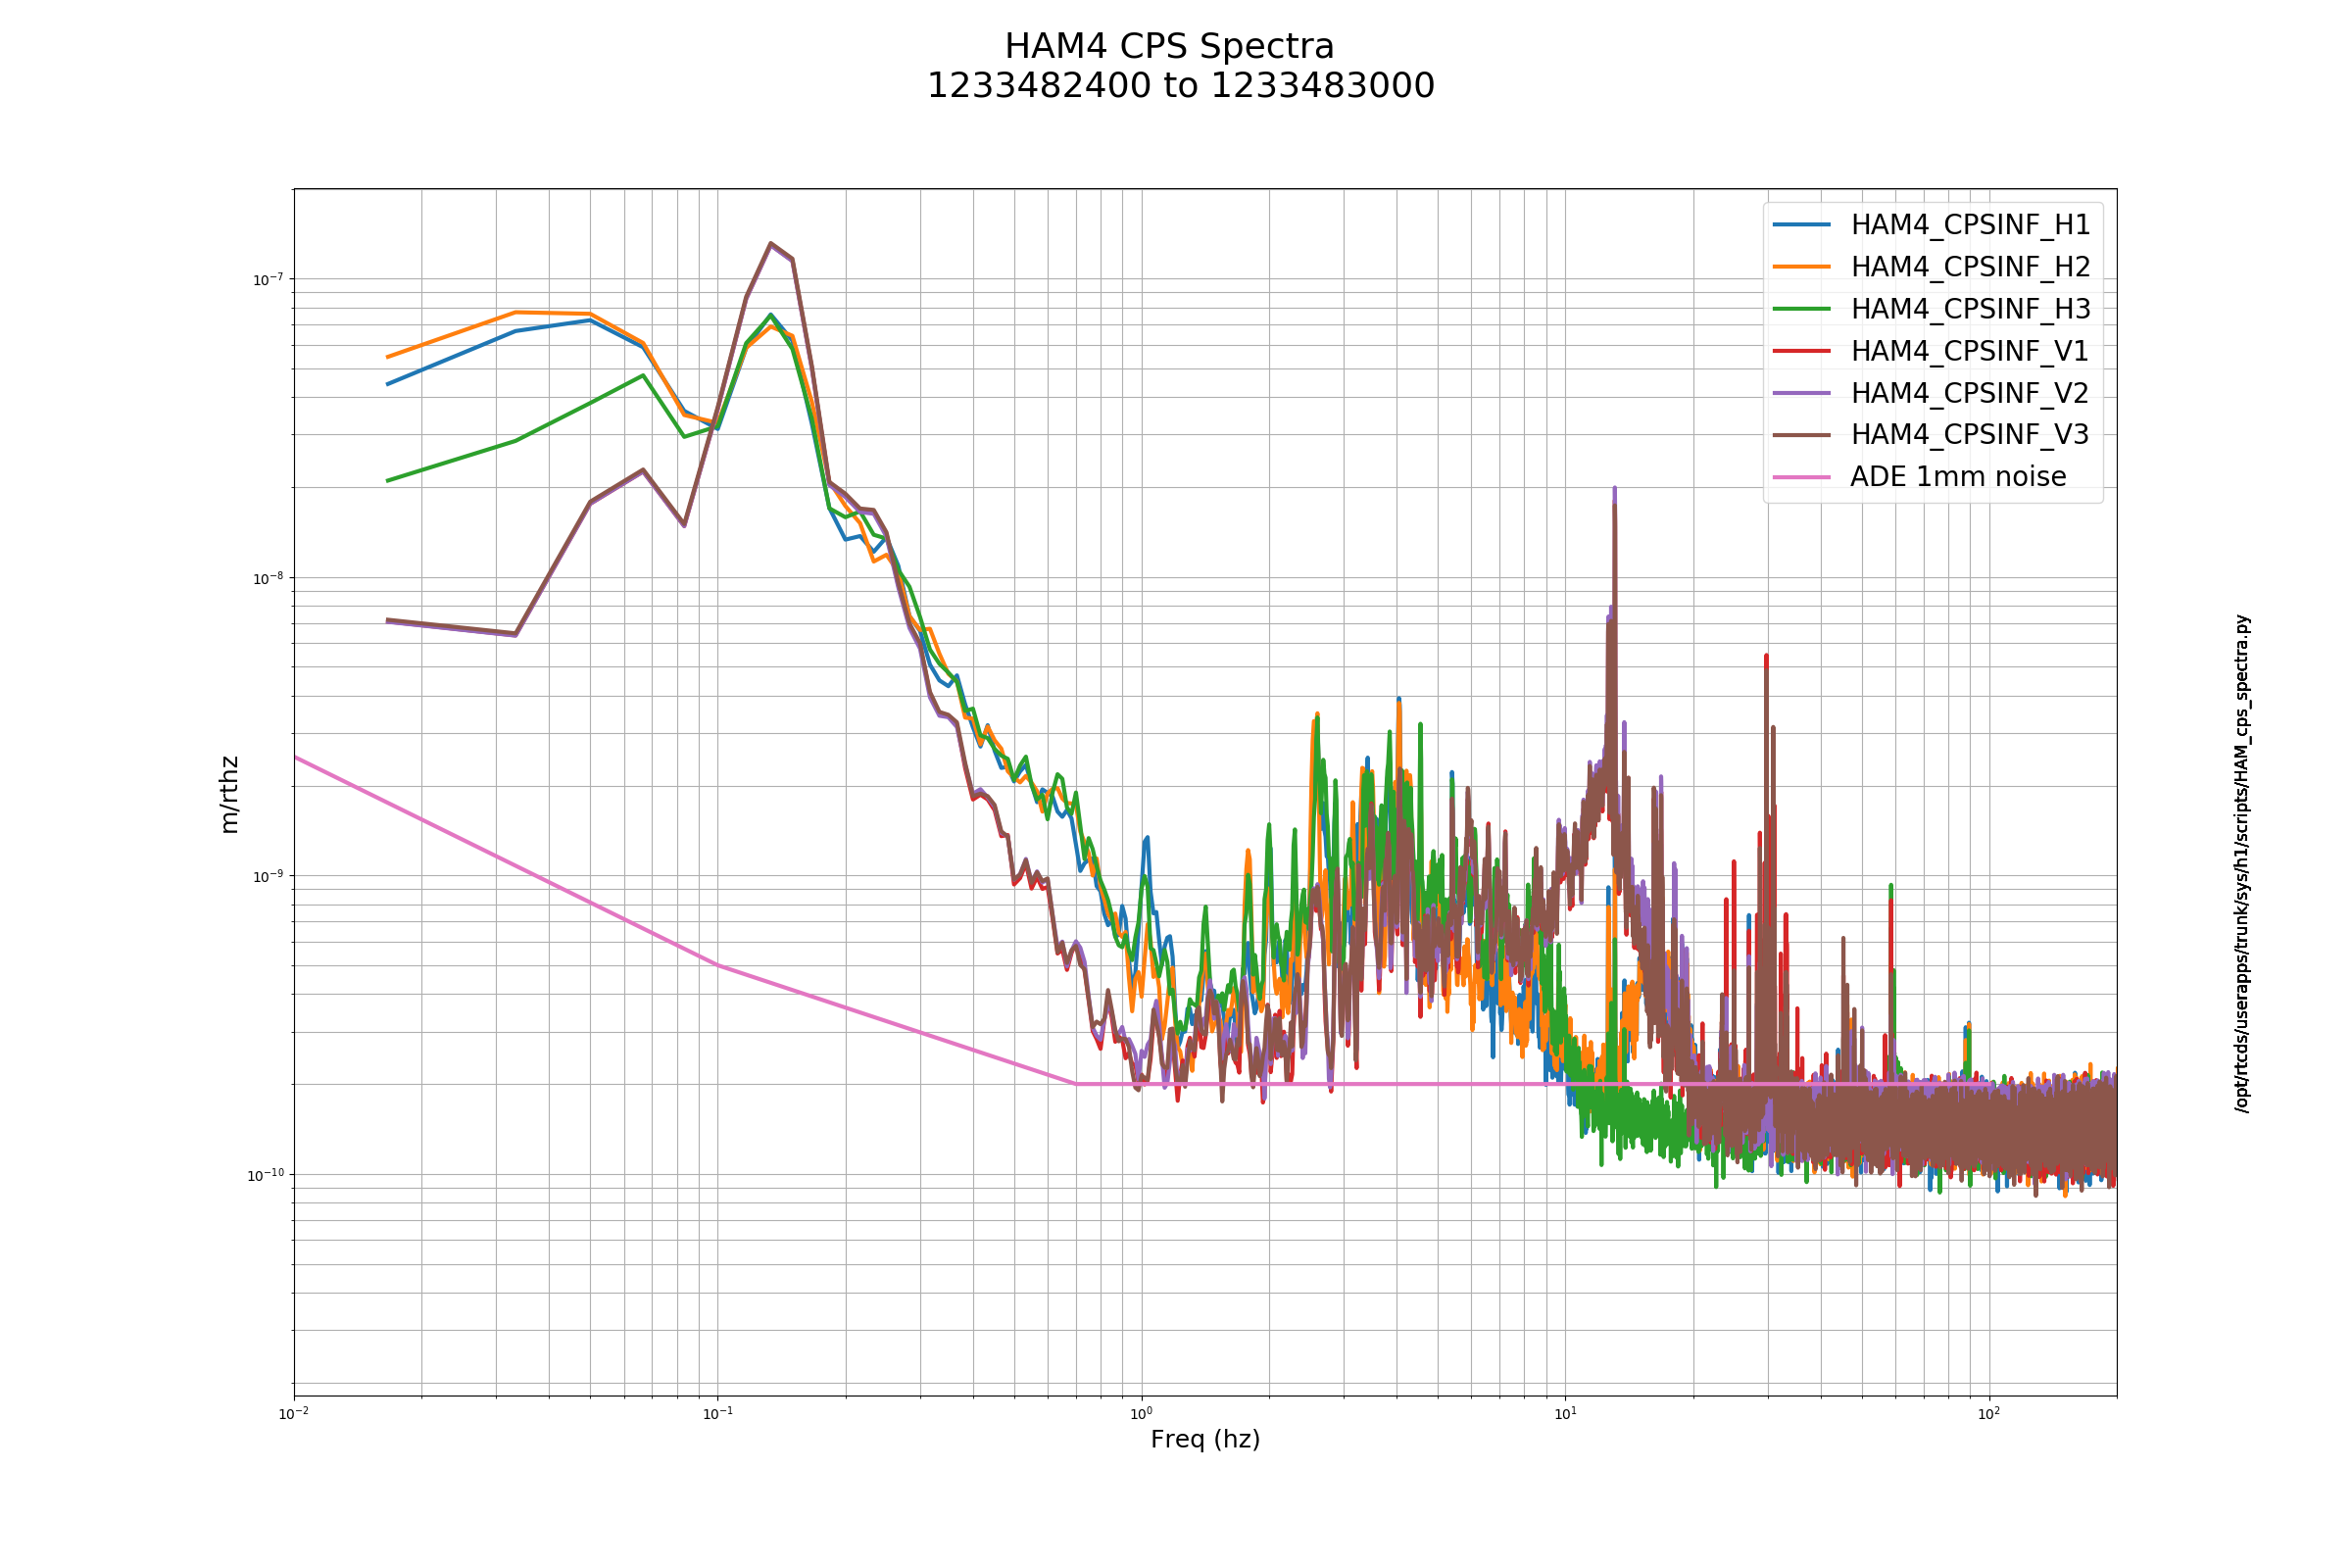
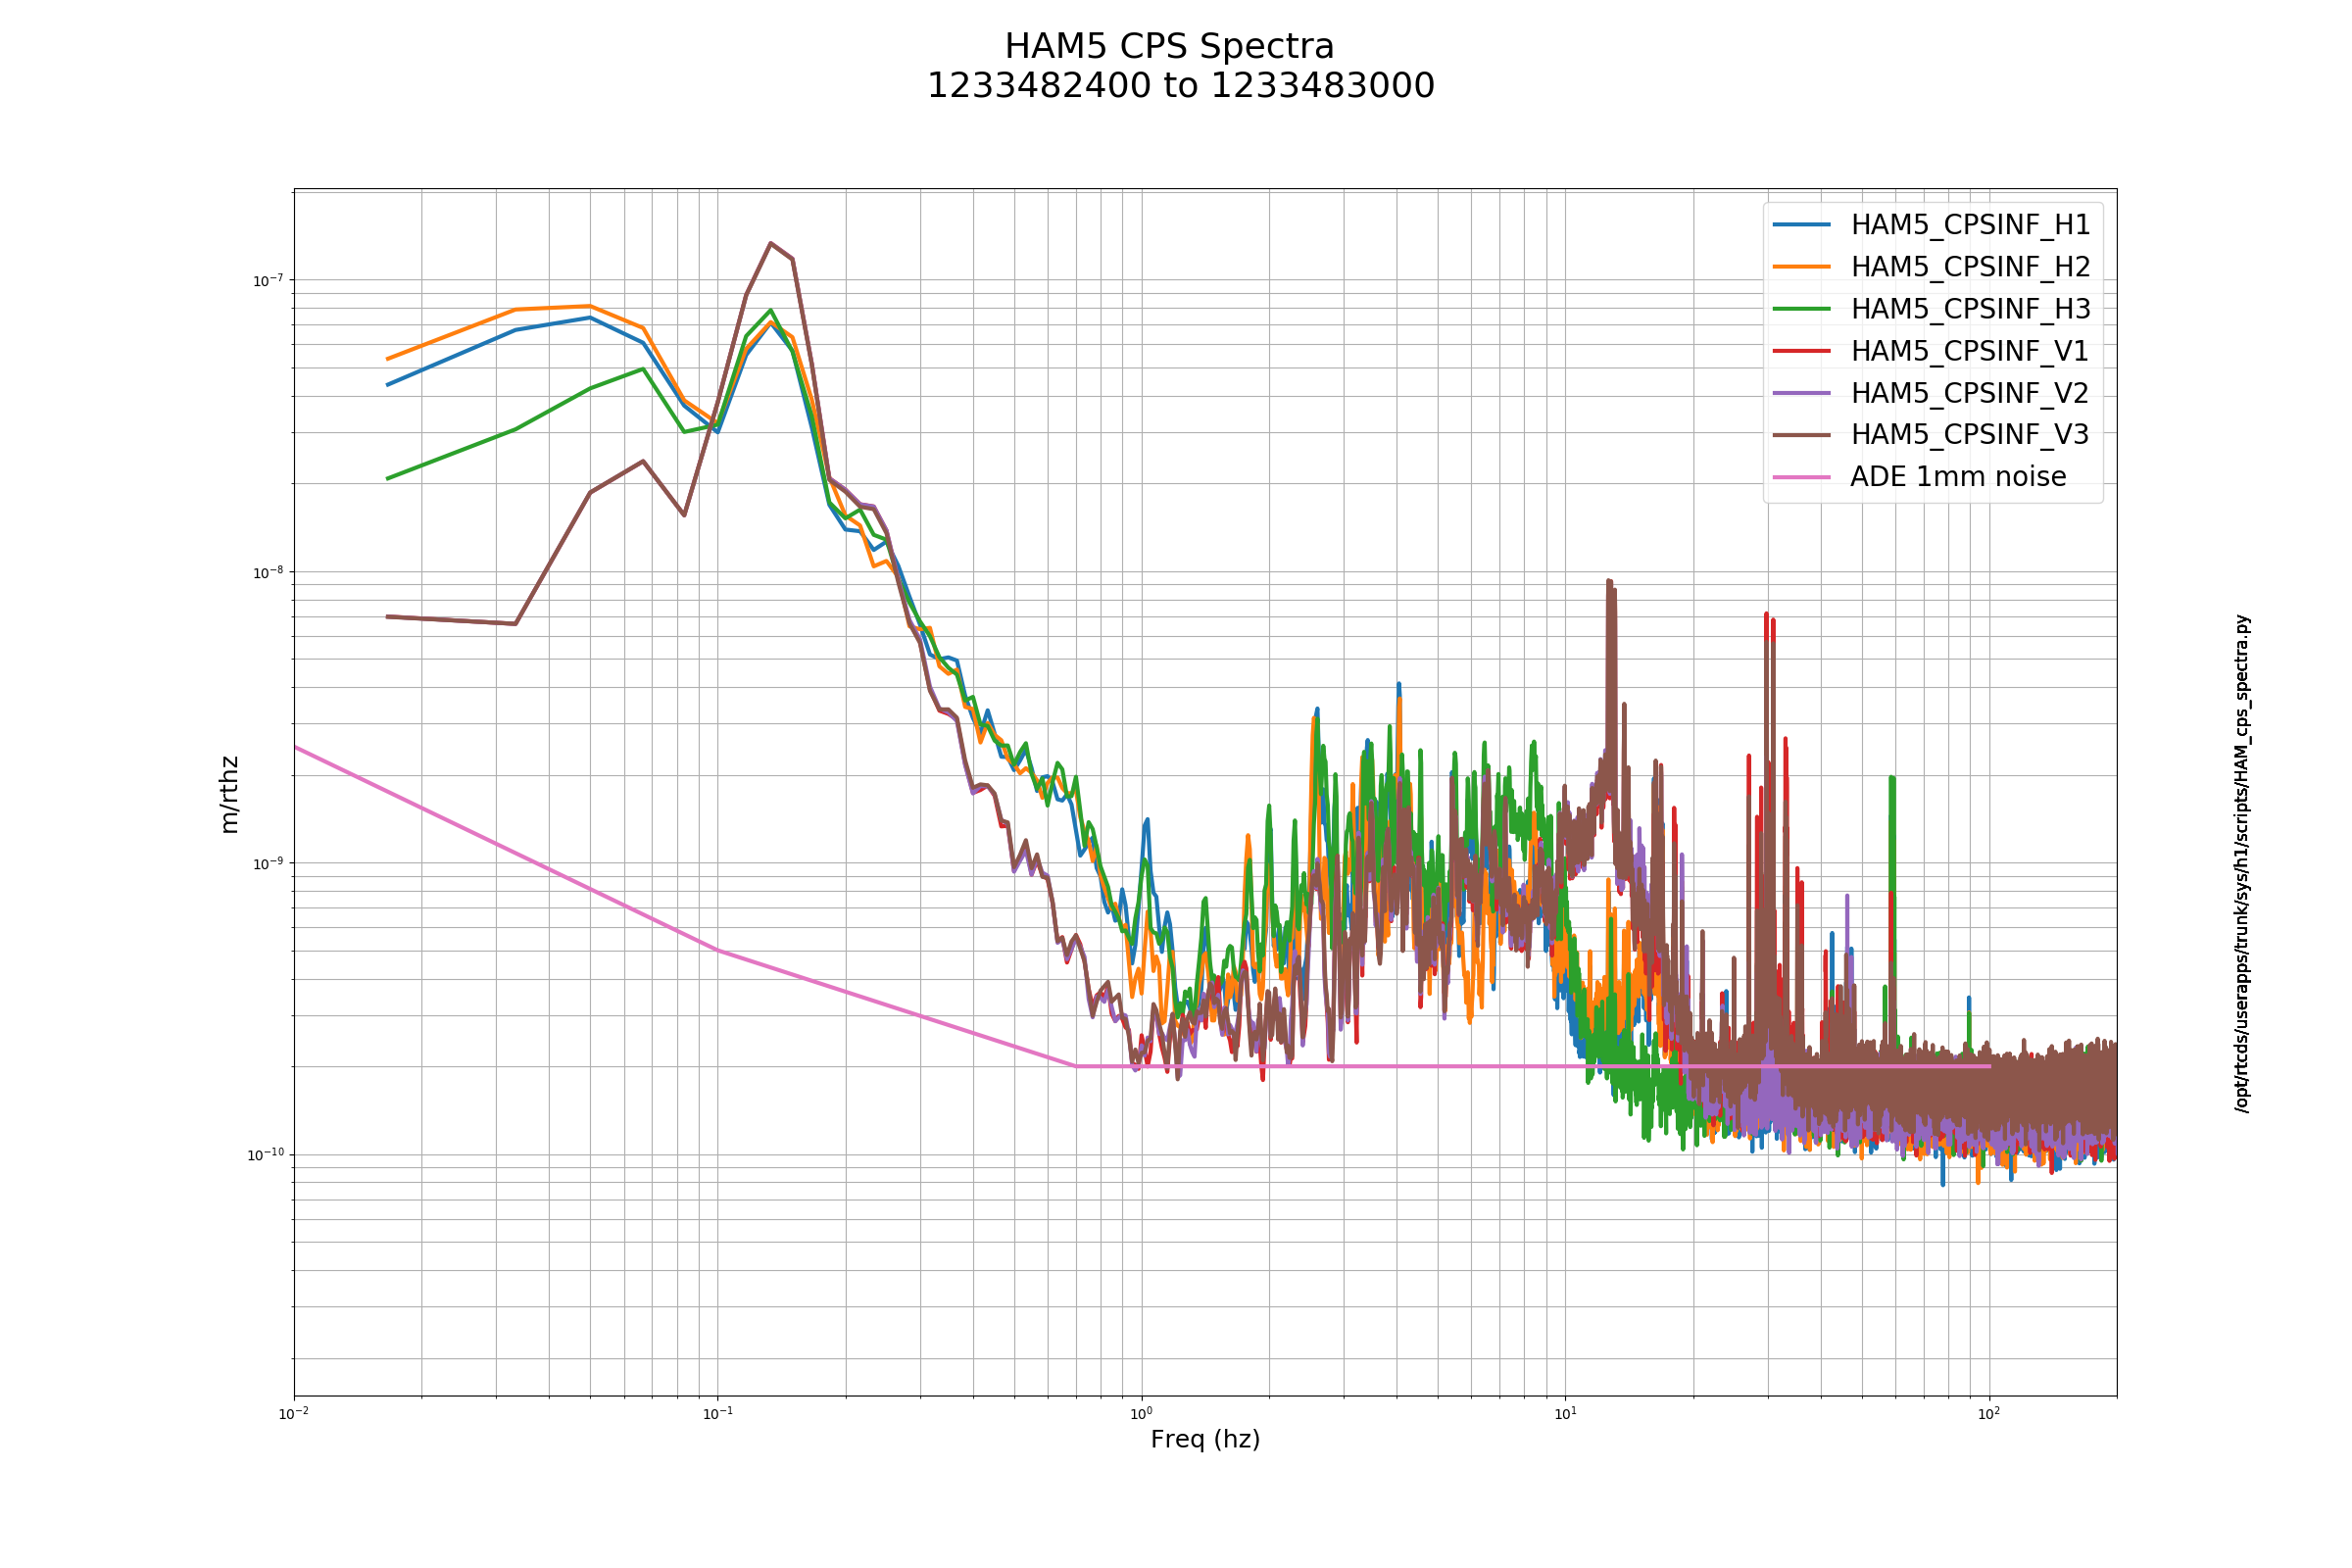
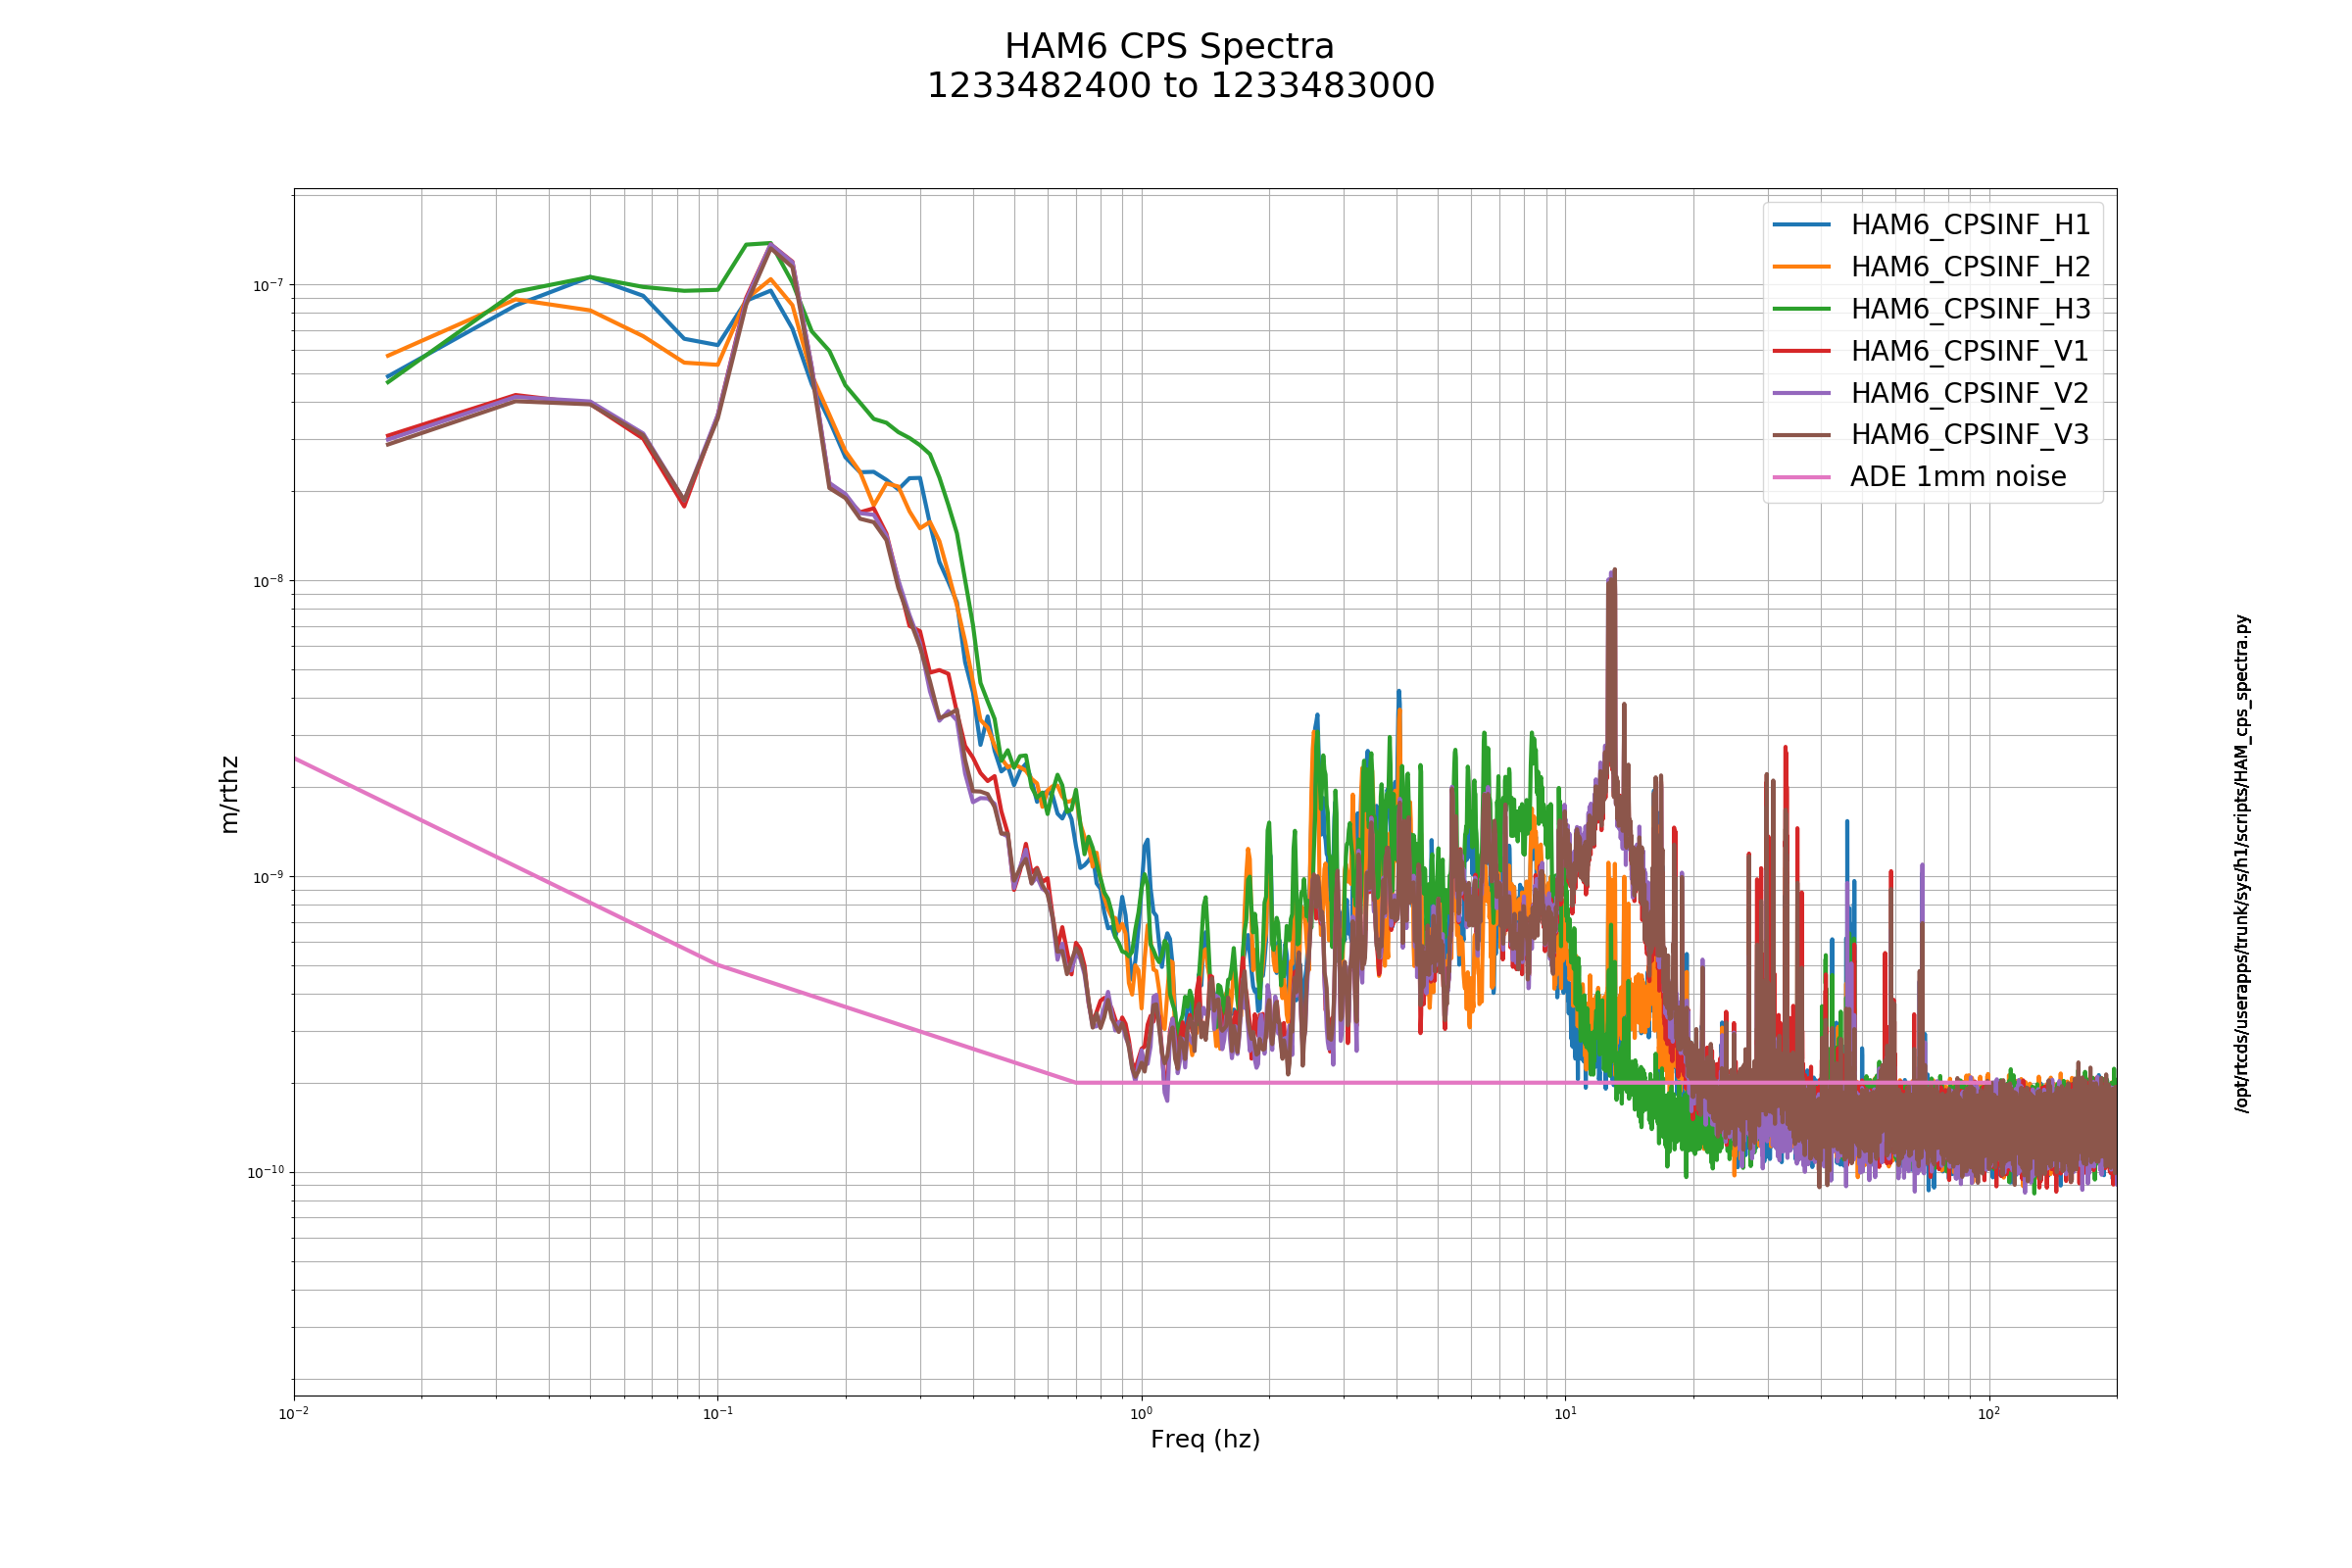
A few sensors have higher high frequency noise here and there, but nothing looks too bad yet.
Daniel, Nutsinee
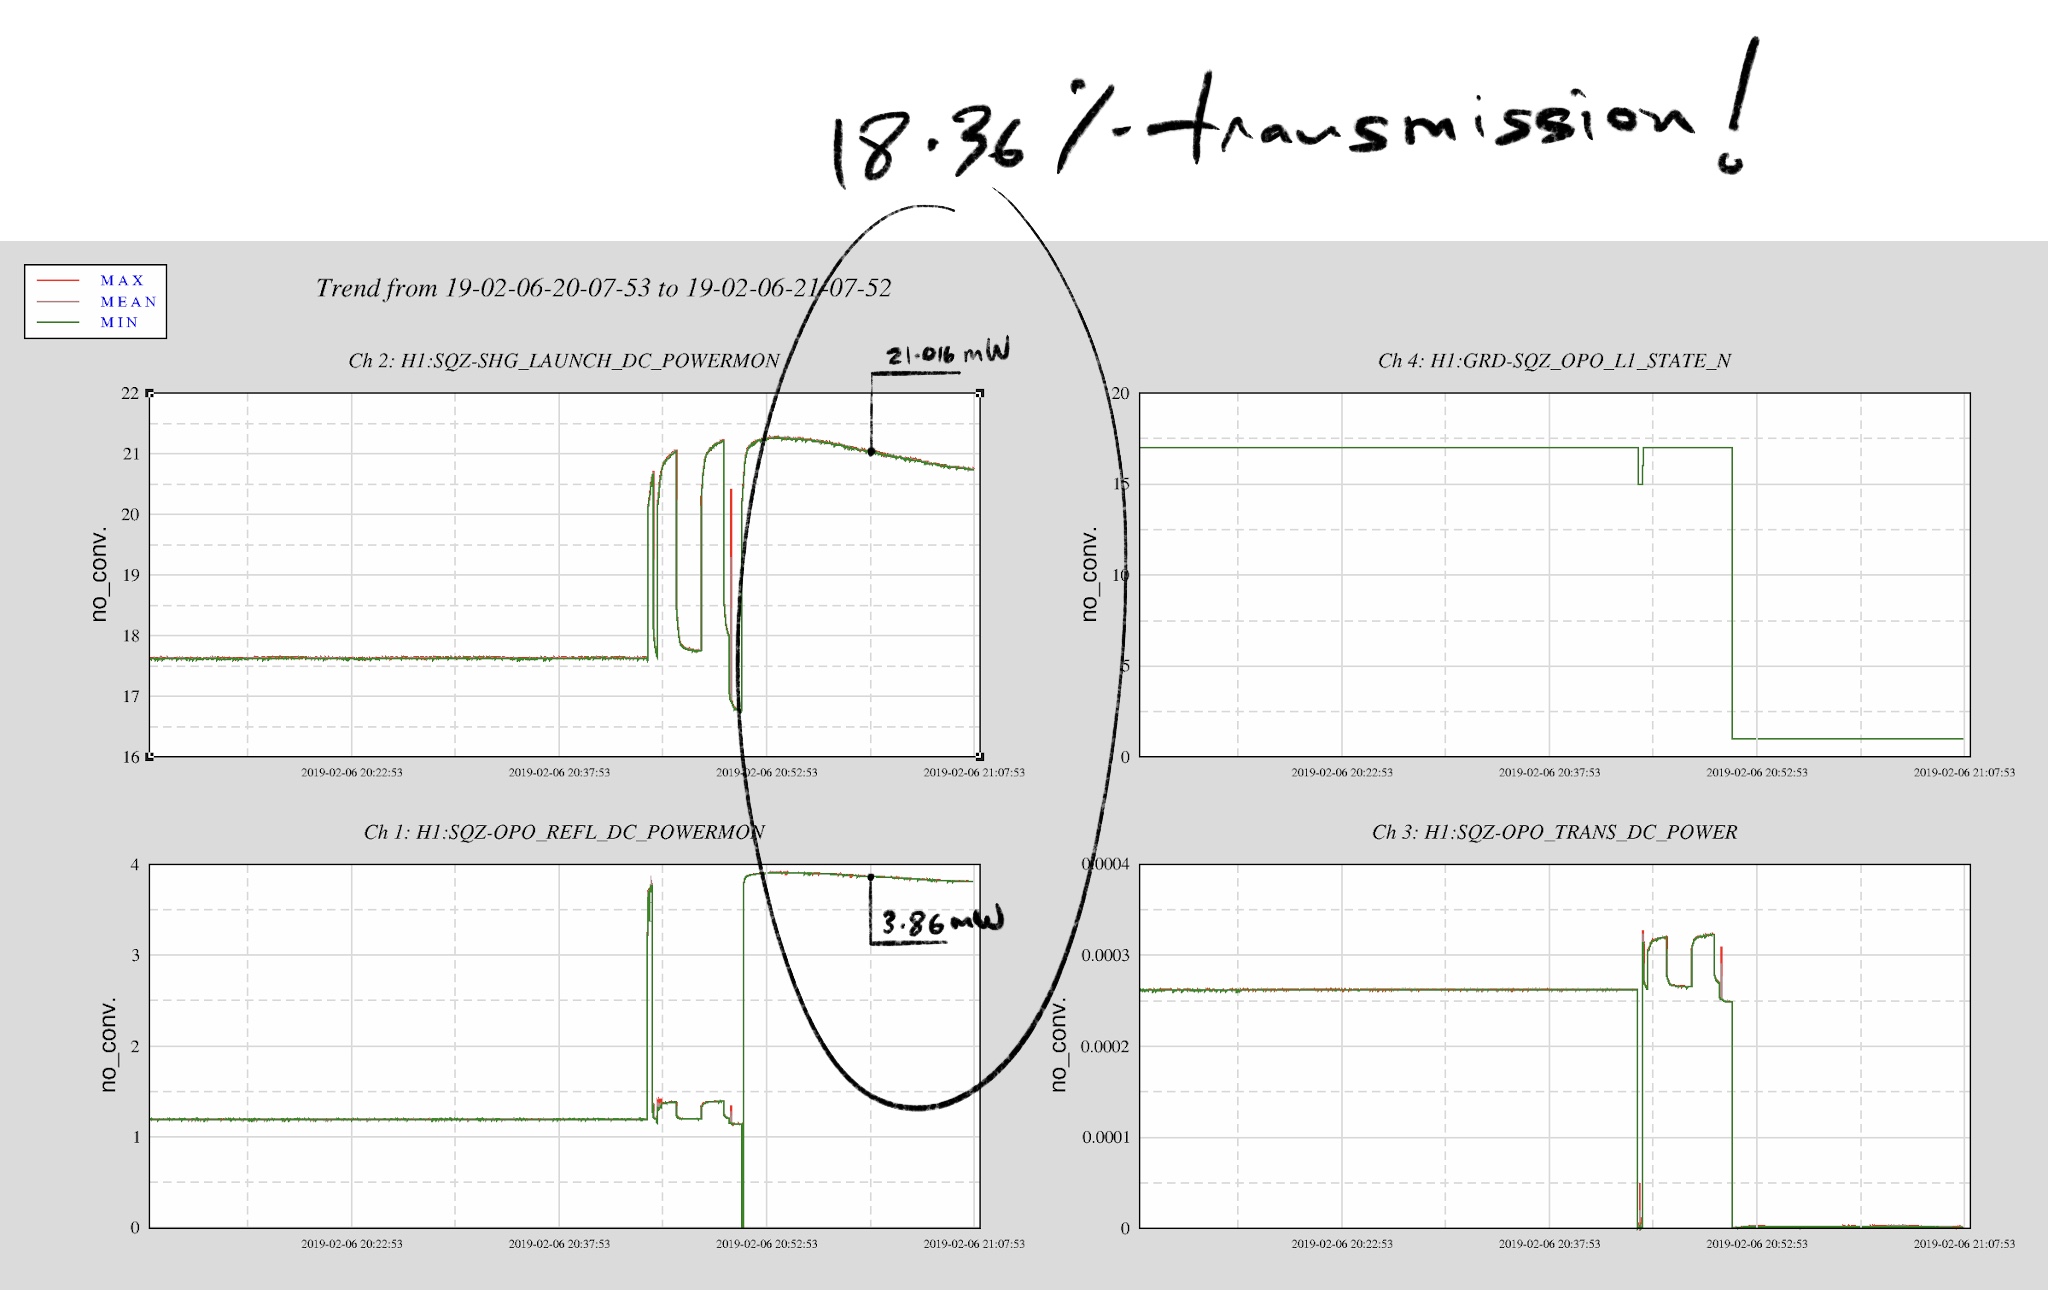
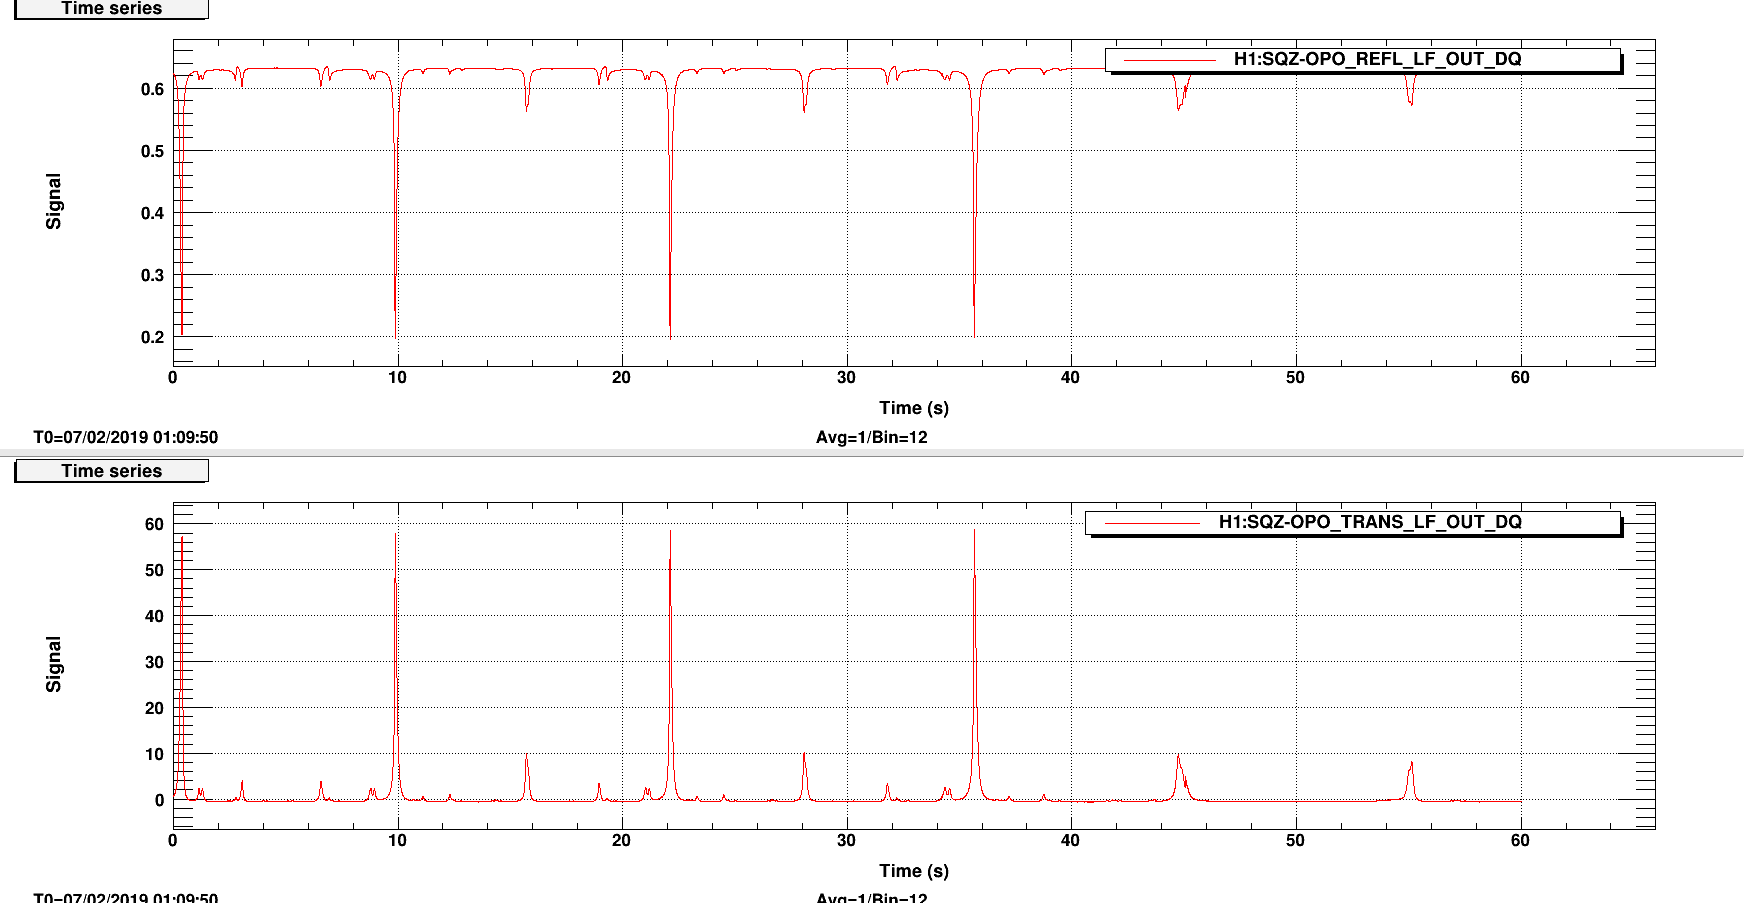
Today we saw the most green transmission we haven't seen in awhile. As of today we are back to 18% transmission (we have been at 13% transmission since beginning of January). Here's a plot looking at OPO REFL when OPO was unlocked and totally off-resonance.

This bizarre behavior happened very suddenly, today morning at 8:14 local was the clearest turning point. The intensity servo tried to engage but hit the limit because the set point was too far off from the actual OPO refl power.

Looking at the OPO scan it seems like TEM10 has just disappeared compared to alog46474. We now have 83% mode matched (was 78% back in January).
It appears that we have a self-align OPO cavity. I'll take that.
This is rather starting to sound like SBS (speculated as so by B. Lantz on the SYS fiber call). Im not sure of another mechanism that could move the modes like this over such a short timeperiod. Possibly a 01 acoustic mode pulling energy out of the 00 and moving it slighly into 01, while generating a reverse propagating stokes 01??
If/when it goes back to the lossy state, can you look at the retro-reflection from the fiber from your power monitor pickoff mirror?
Tweaked the alignment into the reference cavity. Transmission went from ~1.3 to 4.1.
whilst I was in the enclosure, the HEPA fans and AC tripped off. Don't know why. As a
result it may take the temperature inside the enclosure a while to settle. The pre-modecleaner
heater drive voltage nearing zero was the tell-tale sign that gave it away.
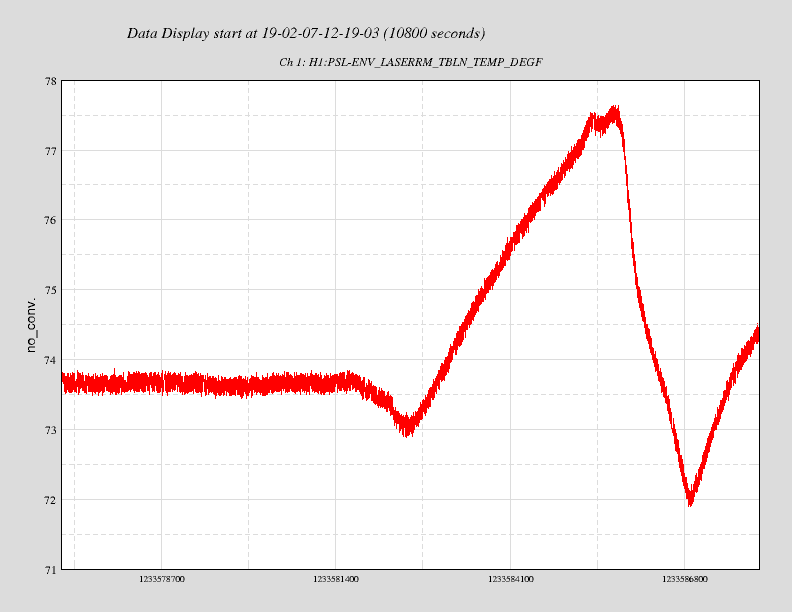
Attached is a plot of the room temperature around the time of the mishap.
is there a new FSS loop measurement to go with this increased cavity power (and increased optical gain)?
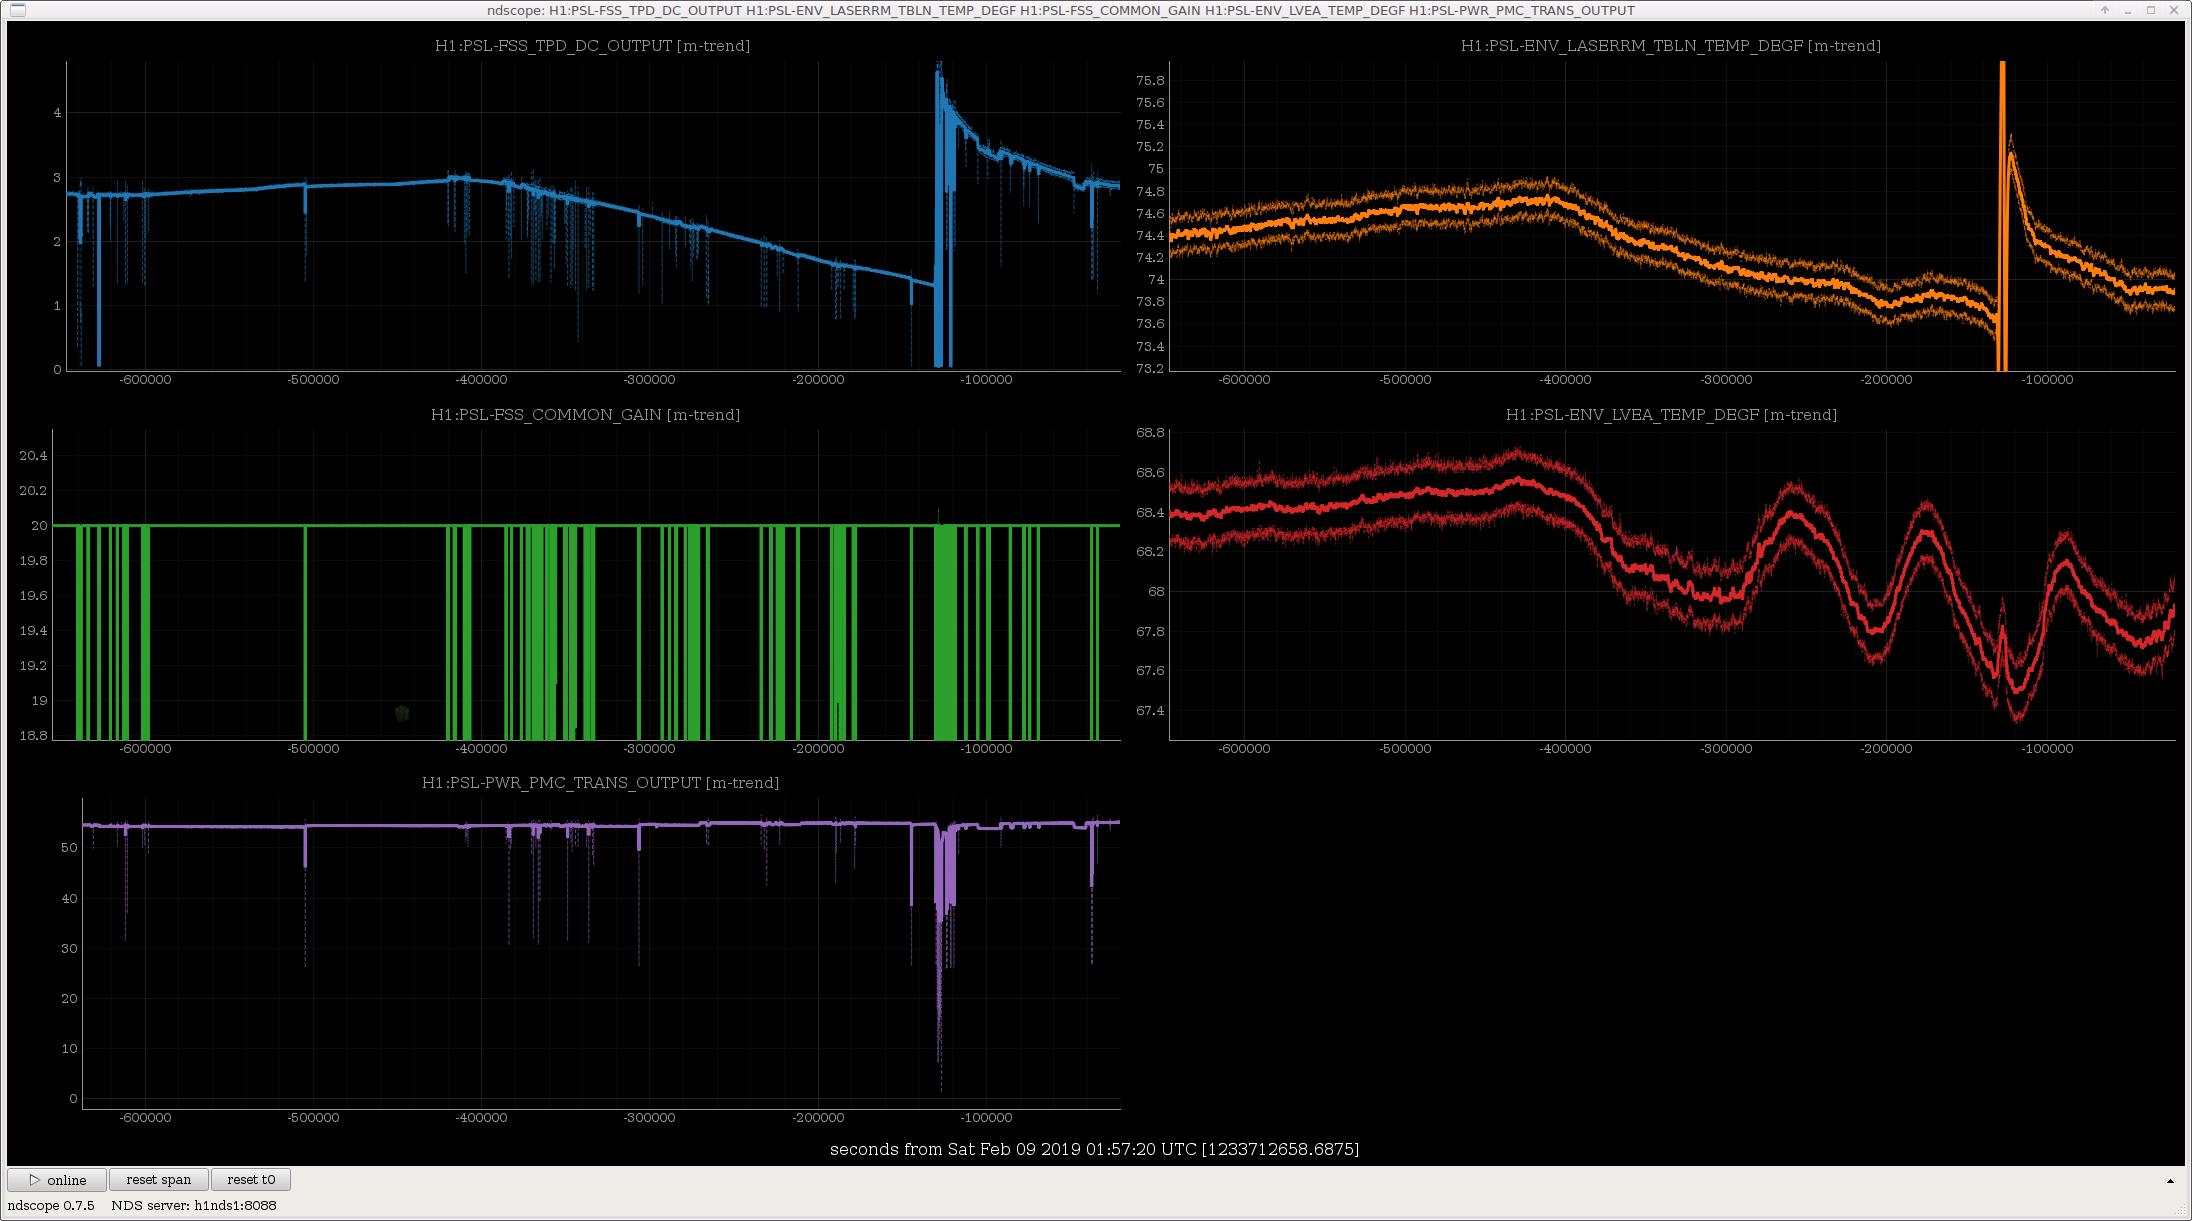
as I suspected, the FSS Common gain has not been adjusted to follow the drifting ref cav transmission, so the FSS UGF has been all over the map. Presumably, the transmitted light, which is used for ALS, is also changing by this large factor.
There is something in the reference cavity optical path which drifts way too much. A 1 degF change in the table temperature is making a 2x change in the cavity power.
You can see that Peter's tweak up happens with the temperature high and so the power degrades again as soon as he leaves the PSL and the temperature changes.
The PMC, on the other hand, has almost no temperature dependence to its transmission.
Options:
Filiberto, Dean, Daniel, Rich More to follow, but today we reversed the installation of the recently modified OMC Piezo Driver. Removing the driver fixed the broad 180Hz peak in DARM. There was a suspicion that the installation of the modified chassis was causing an increase in a broad peak in DARM (about 50Hz wide at 180Hz center). Initially, we terminated the inputs of the newly installed chassis, and removed the monitor readback cables used to monitor the newly enabled bias function (the possibility existed that there was a ground loop associated with the monitor cable). None of these attempts seemed to remedy the broad noise around 180Hz. We even speculated that the increased dither associated with the change to the new system may have manifested in an increase in the 180Hz component, but after reverting to the old chassis and observing a "normal" 180Hz component with the OMC locked, we increased the dither to see if the broad 180Hz noise came back, but it didn't. At this point, we must conclude that there is some aspect of the newly modified approach that causes an unfortunate addition of noise at 180Hz. There is a possibility that the observed noise may be related to the change in the source impedance associated with driving the second piezo with the new HV driver board. With this in mind, we have prepared an inline circuit that will emulate the output impedance of the new HV driver. We plan to insert this circuit tomorrow as a test. This device may yield insight into whether the addition of the second HV driver causes some form of environmental pickup in the wiring leading to the OMC that manifests in a broad 180Hz peak.
Thinking about this more, I suppose it is possible that by adding the second HV board to the OMC cavity, there might exist a greater susceptibility to power supply noise due to the low voltage (10VDC) that the second HV board's quiescent operating point was set to. In other words, it may be close to a rail, and the feedback loop has diminishing gain due to the circuit configuration, which might lead to higher power line harmonic susceptibility. I will check this on the newly constructed OMC driver. A simple mitigation if this is the case, would have been to command the second HV (the biasing amp) to a higher voltage away from the 0V lower rail. More to follow later, as this still seems like a priority to understand in terms of electronics.
The figure shows that there were a few small peaks in DARM during last night’s squeezing that were coherent with an accelerometer at ISCT6.
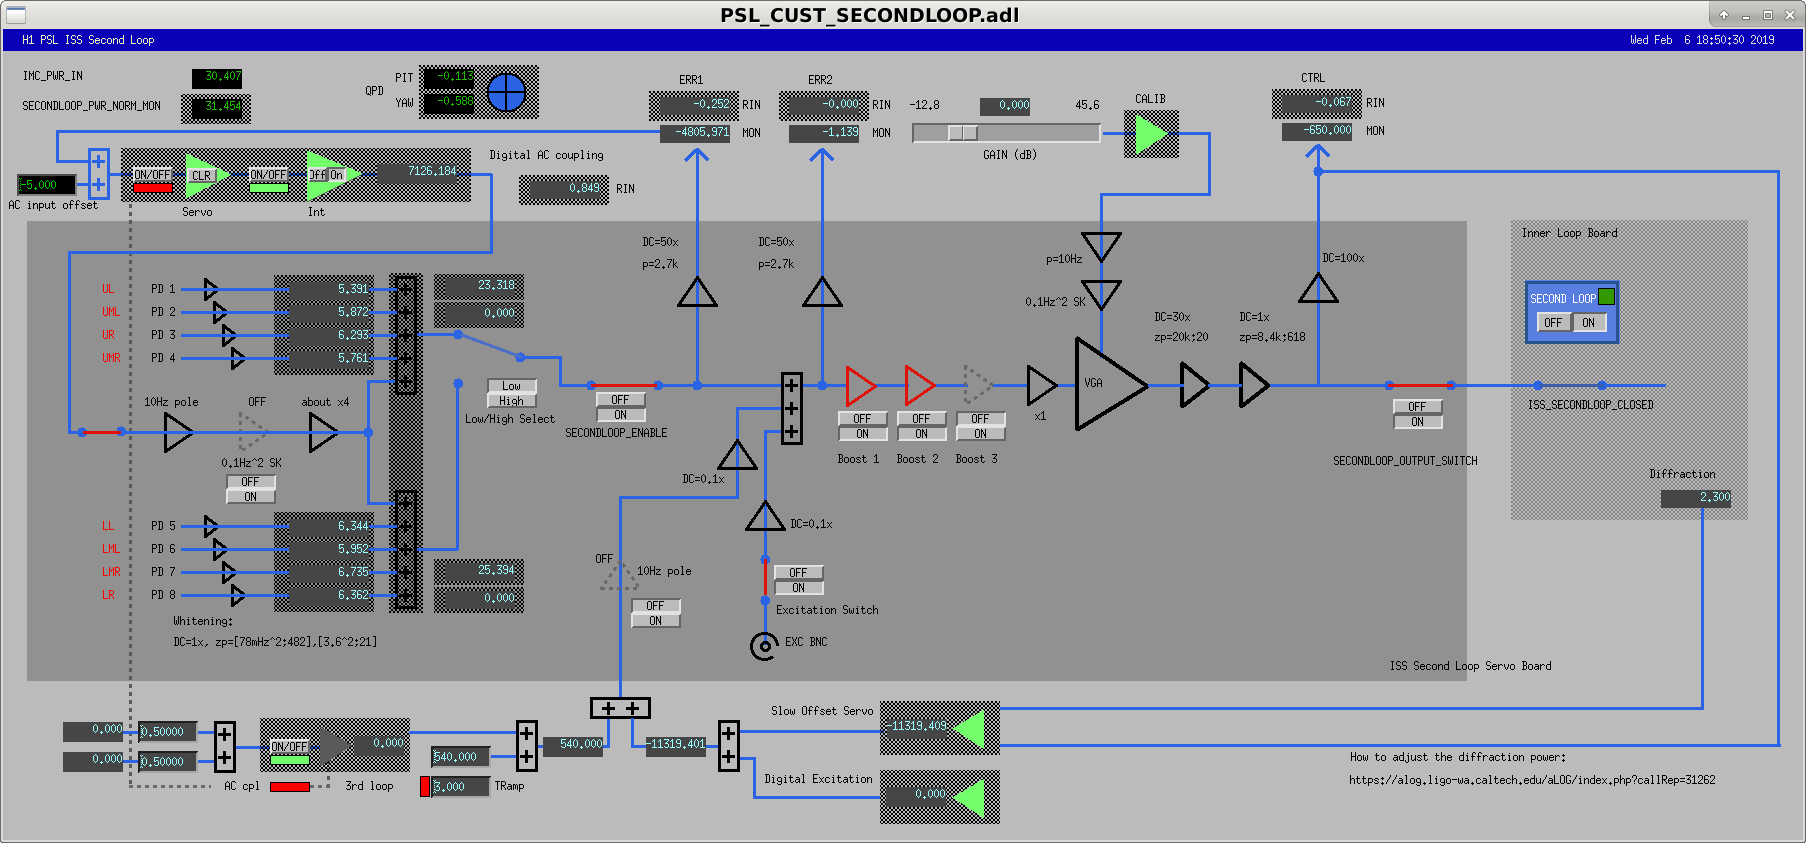
After the intensity projection yesterday Daniel asked me to look at the ISS OLG. Gabriele showed me how to take the analog ISS OLG measurements. We seem to be marginally stable (7 degrees phase margin) with the ISS loop where we nominally sit (OLG in attachment one, ISS Secondloop nominal medm screen in attachment two). Nominally, H1:PSL-ISS_SECONDLOOP_GAIN = 0 dB, and this is how I took the first measurement, the dark blue line in the plot. I increased the ISS SECONDLOOP GAIN by 6 dB (light blue), and then another 6 dB (orange). This gave us an additional 30 degrees of phase margin. The gain seems to not want to increase more, so I didn't push it past +12 dB. Looking at the ISS to DARM coherence at HF, it seems to be reduced from 0.5 to 0.2 now. This is good, but still needs to be reduced further if we are going to reap the benefits of squeezing.
The ISS second loop UGF used to be higher than this, right in the middle of the phase bubble.
See for example 45185
Increasing this gain needs some more thought. We failed to Increase_Power due to an ISS instability.
For now, we've just decreased the VGA gain slider back to 0dB, and are able to lock.
Sheila, Gabriele and I tried increasing the VGA gain by 1dB and decreasing the slow offset feedforward path by 1dB (with the goal of slowly stepping toward the 12dB that Craig used last night), but even that 1dB step made the ISS diffracted power go crazy. We'll need to relook at this in an IMC-only configuration.
Since the low ISS second loop gain is a problem for high frequency noise, but not at all a problem for locking stability or low frequency sensitivity, we're leaving it as it used to be for now.
We were stable at POWER_30W for a while, then we tried to go to LOWNOISE_ASC. A pitch instability rang up. I could fix it by changing DHARD_P gain from -42 to -60 and CHARD_P from 0.6 to 1.
I suspect CHARD is the culprit, since we changed the blend filter for the QPDs reducing the gain by 10 dB.
I did not put the CHARD and DHARD changes in the guardian, but the -10dB change in the CHARD_P blend is in the filter.
We have hardware to upgrade h1tw1. Our goal is to move it into production prior to O3. Today we got the disks sorted, physically connected it to the daq broadcast network and did what should be the last configuration. As it is the end of the day, we will start the service up tomorrow morning when we are around to observe it. h1fw2 (the test fw) was taken down today to take its slot on the broadcast switch. We will need to tweak the switch config later and enable more ports.
Evan G., Keita K., Jamie R., Dave B., We tested the transient hardware injection infrastructure to make sure that we could still run transient hardware injections. While the IFO was not in low noise, we successfully made a DetChar set of injections. These were injected starting at 1233537100. We saw the injection on the TRANSIENT filter bank and on the PCALX RX PD. The STATUS did change from 3 to 40 and back to 3. The value was displayed weirdly by DTT, ndscope and dataviewer, possibly because it is a uint32 data type, but we believe it is doing the right thing. The obs_channel_name variable in INJ_TRANS.py had to be updated to "GRD-IFO_INTENT".
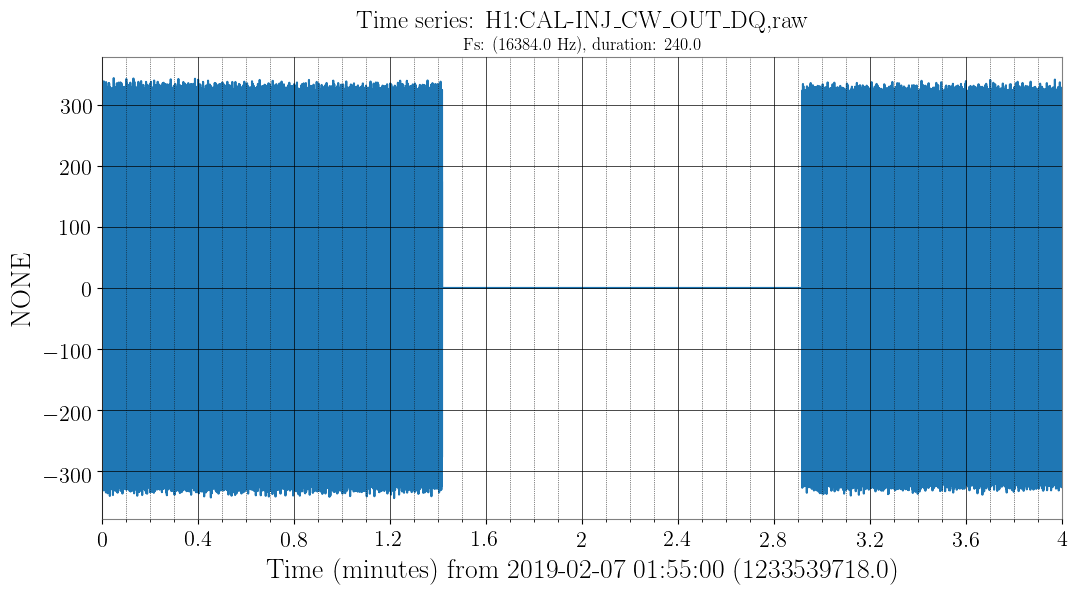
Since some of this work involved redefining the directory structure on h1hwinj1, I have recreated the RELEASE sym link to point to preO3_H1 and have restarted the CW injections to verify things still work, which they seem to do (see attachment).