Displaying reports 43481-43500 of 88617.Go to page Start 2171 2172 2173 2174 2175 2176 2177 2178 2179 End
Reports until 03:24, Friday 18 January 2019
H1 IOO (IOO)
cheryl.vorvick@LIGO.ORG - posted 03:24, Friday 18 January 2019 - last comment - 18:02, Monday 21 January 2019(46521)
measuring the beam spot location on CW1, the first optic in the IO Faraday

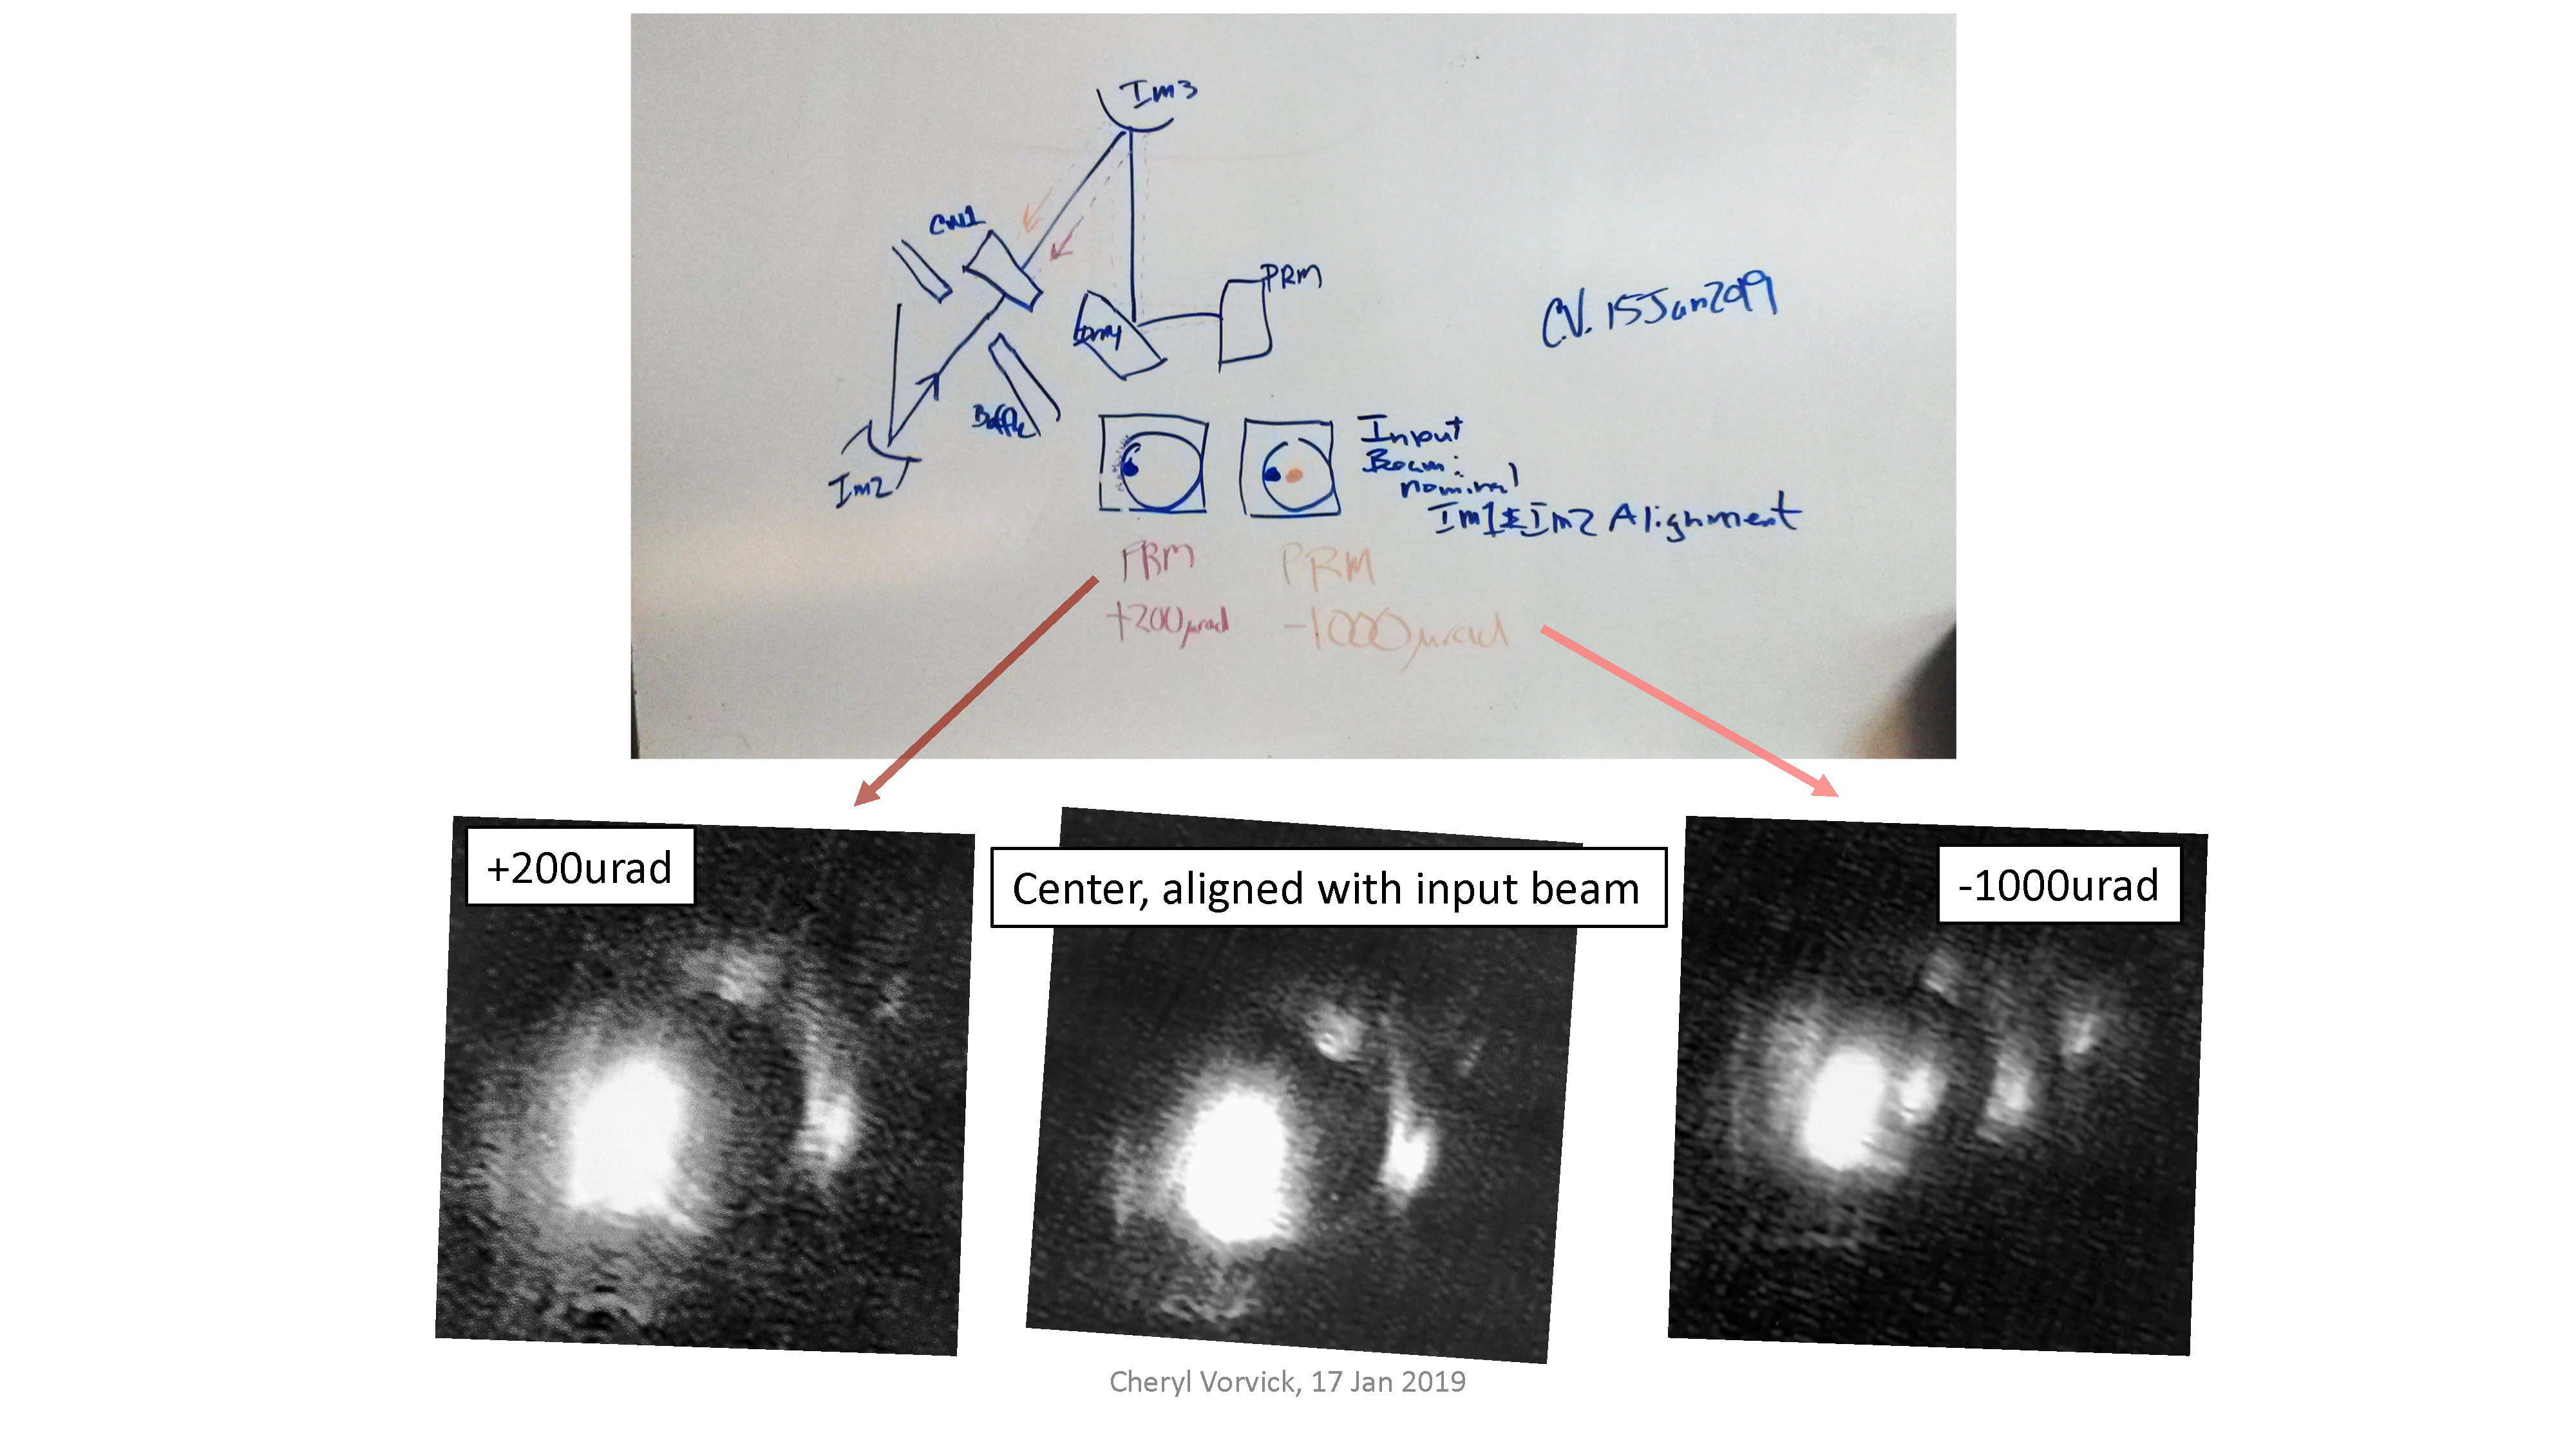
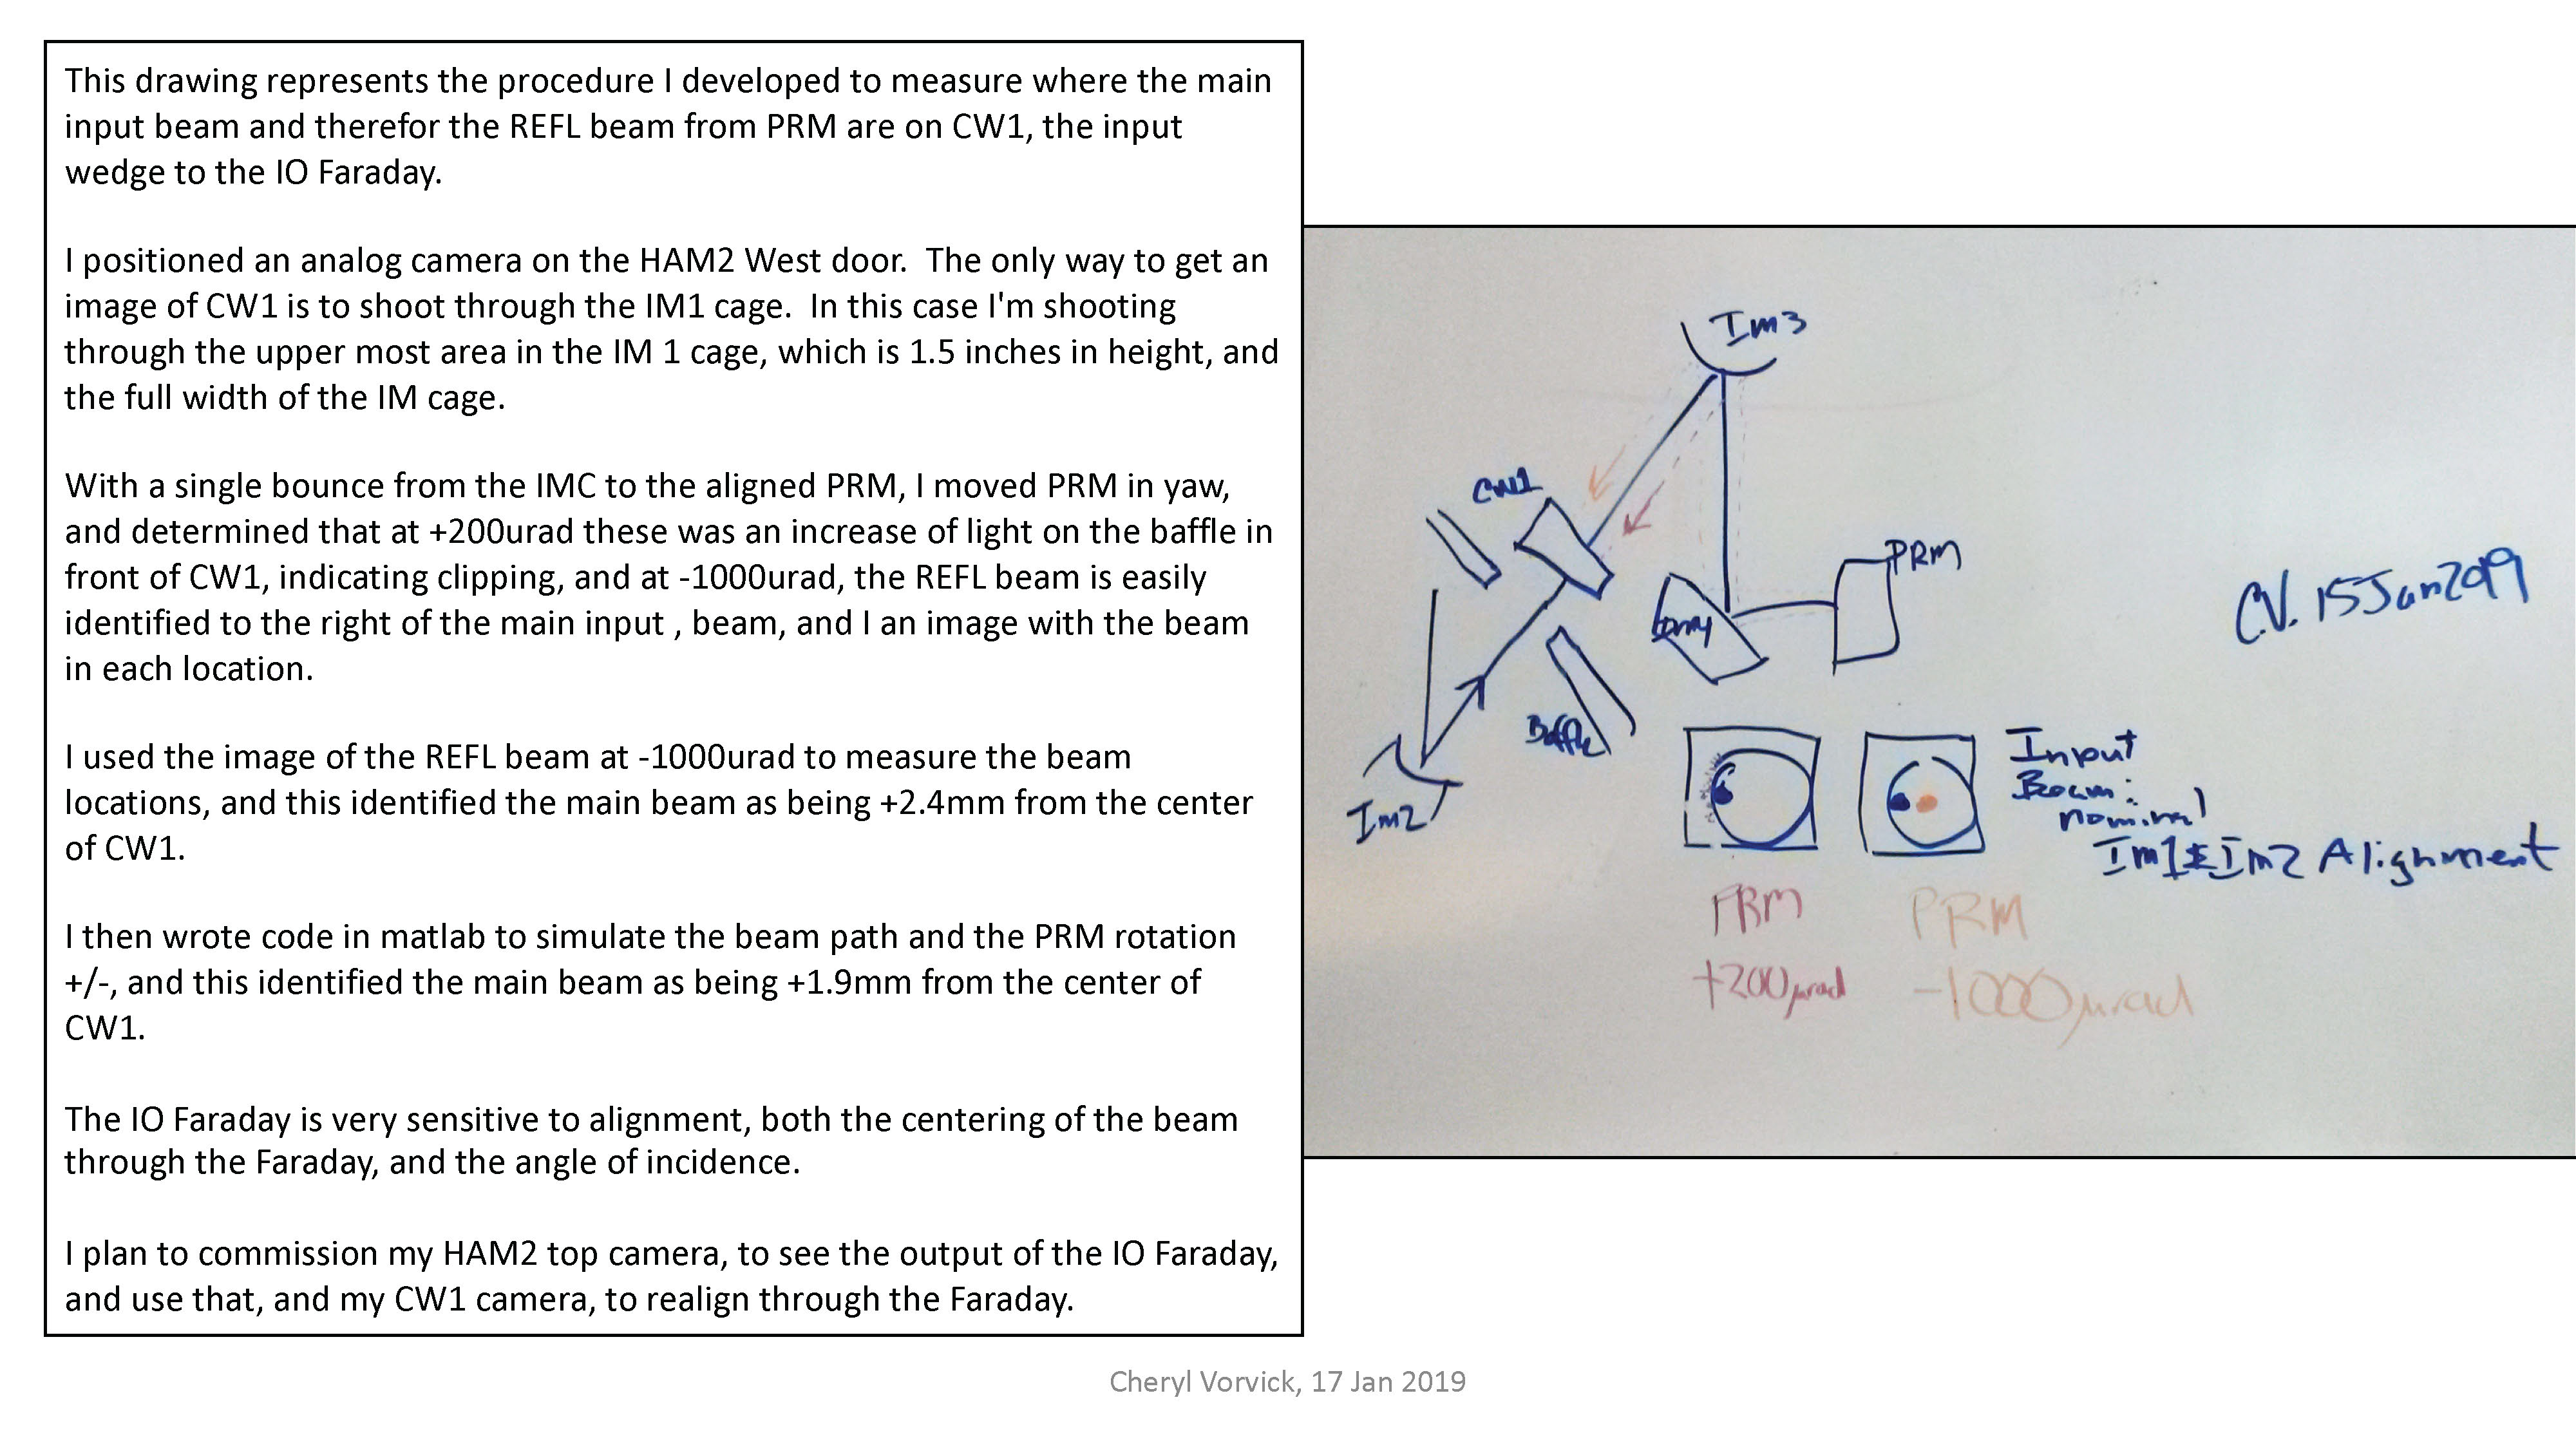
I put a camera on the HAM2 West door, which looks at CW1, the back side of the wedge, which is carefully aligned to shoot through the IM1 tower.

This week I developed a procedure to use PRM with a single bounce, to move the REFL beam on CW1, and and look for clipping.  The procedure revealed that when PRM is in it's aligned position plus an additional 200urad in yaw, there's an increase in light on the baffle, consistent with the REFL beam starting to clip.  With PRM at -1000urad, the REFL beam is clearly seen on CW1 to thr right of the main input beam.

Using the image and a beam path simulation I wrote in matlab, I've measured the main input beam to be between 2mm and 3mm from center.

I need to adjust my HAM2 top camera to improve the view of the IO Faraday output side, which is planned for next Tuesday, in order to realign through the Faraday, to correct the mis-centering at both the input and output Calcite Wedges.


compared to the main input beam, which I've used to identify the location of the main input beam on the wedge.  A diagram and images attached.
Images attached to this report
Comments related to this report
cheryl.vorvick@LIGO.ORG - 03:36, Friday 18 January 2019 (46522)

I've written up how I measured beam positions using images.  My measurements from the image are consistently about 20% larger than the beam path simulation.  Given the uncertainties in both methods, and and uncertainties in the beam path, I'm not concerned about the 20% difference. 

Both measuring methods identify the main input beam as 2+ mm from the center of CW1, which will effect the IO Faraday performance.

Non-image files attached to this comment
cheryl.vorvick@LIGO.ORG - 18:02, Monday 21 January 2019 (46557)

I've recalculated the centering of the main beam on CW1, after Keita identified my original calculation as low by about 10%.

My updated calculation shows the main beam as +2.2mm from the center of CW1, where I had originally posted +1.9mm.

The measured value from the image is +2.4mm, so the updated value of +2.2mm is now within 10% of the measured value.

Attachment is updated to show the change.
Non-image files attached to this comment
H1 ISC
thomas.vo@LIGO.ORG - posted 00:36, Friday 18 January 2019 (46519)
Some notes from locking tonight

Danny, Craig, Koji, TVo

We were hoping to run an SR3 Heater measurement and track the DARM cavity pole but we've been running into locking issues with microseisms at just under 1 um/s and winds around 30 mph.  At first there seemed to be some of those high frequency glitches in both ALS systems but they went away when we played with the TMSs (maybe it's a coincidence).

We manually aligned DRMI to get POP18 ~65 counts and POP90~15 which is the build-up levels we "normally" get but when we engage the ASC after locking DRMI 1f it pushes the beamsplitter till we lose lock which happened a couple times until we stopped at DRMI_LOCKED_PREP_ASC and manually tried to zero the MICH error signal, this seemed to help.  We were able to get up to NLN for maybe 15 minutes but ASC  rang up which I'm not able to tell which mode is starting it.  This makes our measurement hard because we were trying to wait for the IFO to reach thermal equilibrium (or at least 20-30 minutes) before turning on the SR3 heater.  We got back to NLN but lost it again with a relatively fast lock loss, I'm reminded of Craig/Koji's measurement of the PRCL UGF being closer to 30 Hz which might make it go unstable given our high useisms.

H1 General
cheryl.vorvick@LIGO.ORG - posted 16:21, Thursday 17 January 2019 - last comment - 16:29, Thursday 17 January 2019(46513)
OPS Day Summary:

TITLE: 01/17 Day Shift: 16:00-00:00 UTC (08:00-16:00 PST), all times posted in UTC
STATE of H1: Commissioning
OUTGOING OPERATOR: None
CURRENT ENVIRONMENT:
    Wind: 11mph Gusts, 9mph 5min avg
    Primary useism: 0.05 μm/s
    Secondary useism: 0.74 μm/s
QUICK SUMMARY:  PSL encoursion for FSS invest., visit to vault for PEM, DAQ restart

OPS Maintenance:

Images attached to this report
Comments related to this report
cheryl.vorvick@LIGO.ORG - 16:29, Thursday 17 January 2019 (46516)

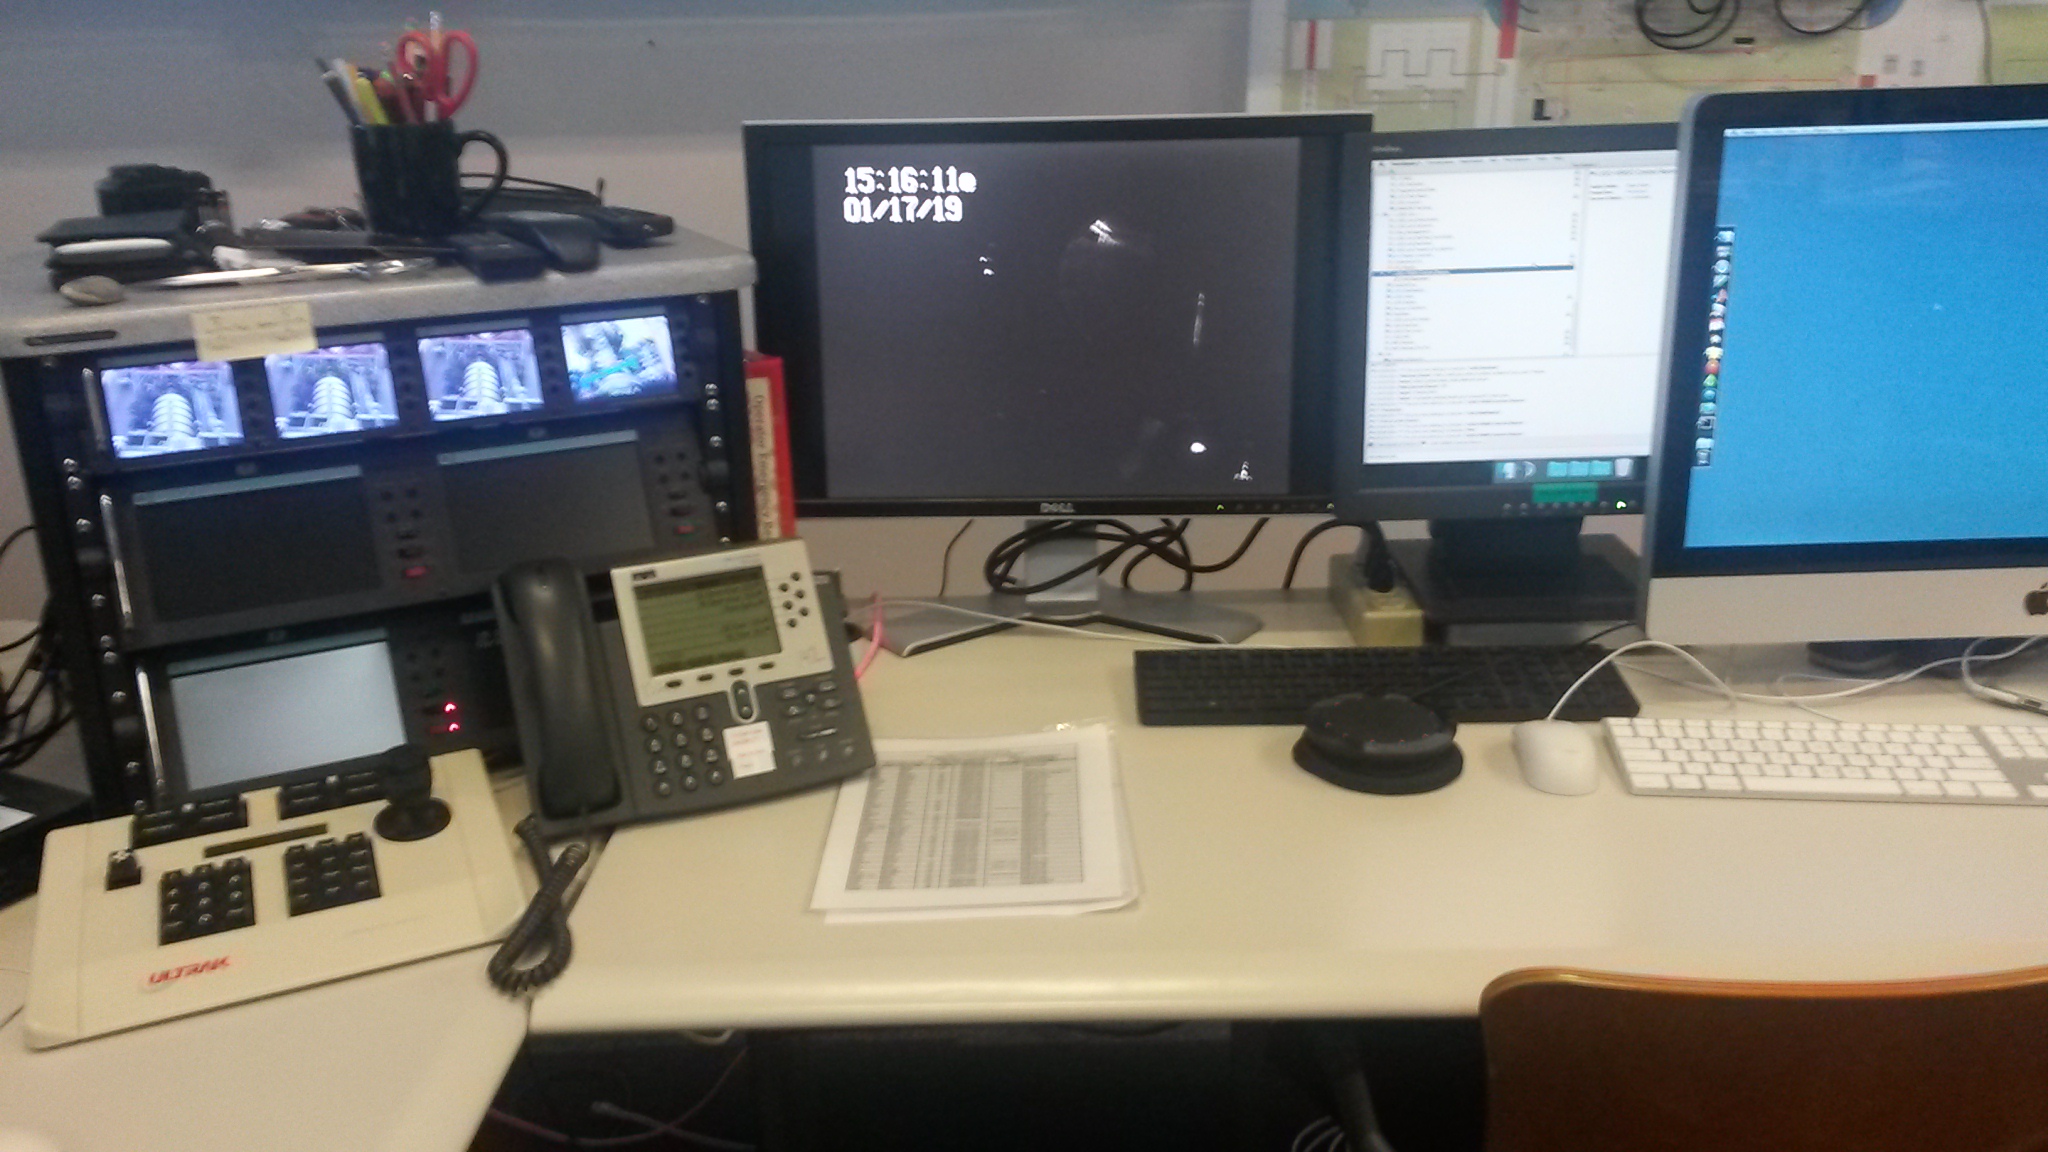
With Richard's helped, the large monitor for analog cameras is connected to the analog video feed, after I moved the monitor temporarily to the OPS area.  A picture of how it's set up is attached.

Images attached to this comment
H1 PEM
marc.pirello@LIGO.ORG - posted 15:51, Thursday 17 January 2019 (46514)
Tracked down and repaired X-LEMI gain issue.
Filiberto C, Marc P, Robert S

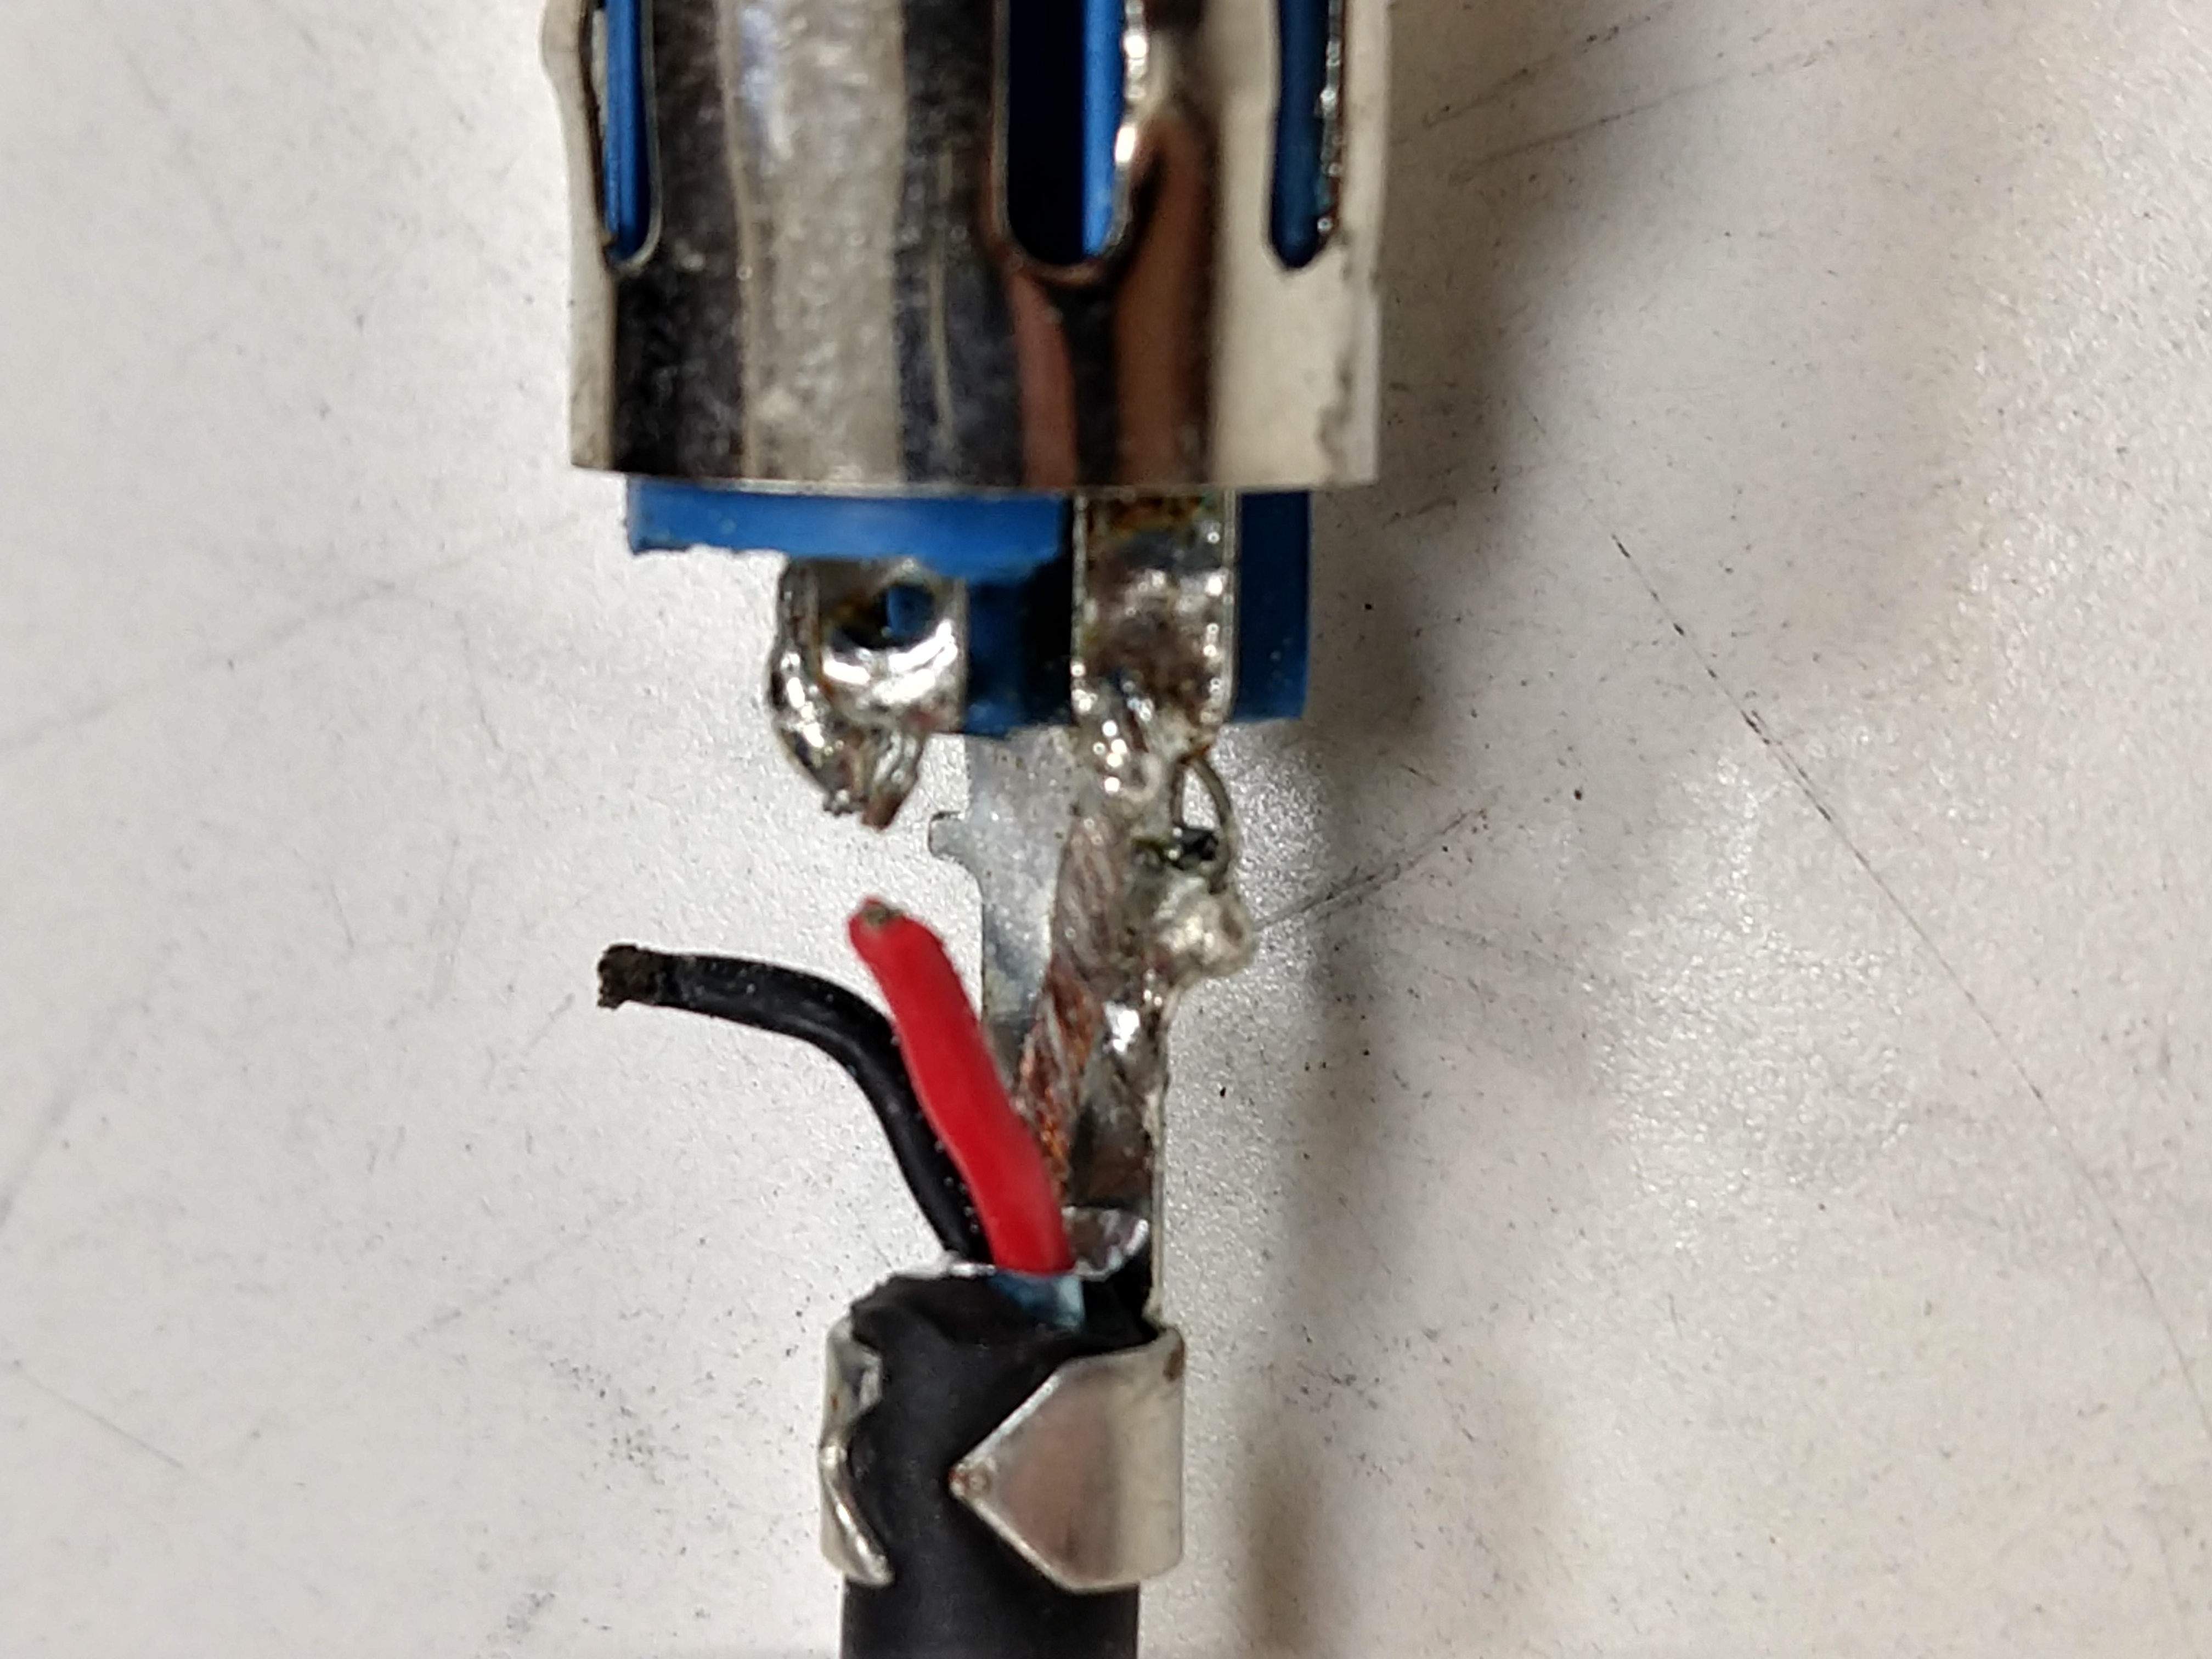
We tracked the failure to an XLR cable that runs between the LEMI breakout black box and the FIBOX.  Upon inspection we found that the connector had two broken internal wires.  We repaired and reinstalled the cable and everything looks goodish.  There is still a 300Hz - 500Hz lump on the X channel which we hope will go away once the LEMI has a few days to warm up.  Attached is an image of the broken connector.
We verified that the lump originates upstream from the FIBOX.

Images attached to this report
H1 SEI (SEI)
cheryl.vorvick@LIGO.ORG - posted 15:27, Thursday 17 January 2019 (46512)
SEI seismometer mass check - Monthly: FAMIS #8060

For T240s:

Averaging Mass Centering channels for 10 [sec] ...
2019-01-17 15:24:39.368344


There are 5 T240 proof masses out of range ( > 0.3 [V] )!
ETMX T240 1 DOF X/U = 0.357 [V]
ETMX T240 1 DOF Z/W = 0.319 [V]
ETMX T240 2 DOF Y/V = -0.539 [V]
ITMX T240 1 DOF X/U = -0.309 [V]
ITMY T240 3 DOF Z/W = -0.401 [V]


All other proof masses are within range ( < 0.3 [V] ):
ETMX T240 1 DOF Y/V = 0.273 [V]
ETMX T240 2 DOF X/U = -0.191 [V]
ETMX T240 2 DOF Z/W = 0.225 [V]
ETMX T240 3 DOF X/U = 0.262 [V]
ETMX T240 3 DOF Y/V = 0.222 [V]
ETMX T240 3 DOF Z/W = 0.245 [V]
ETMY T240 1 DOF X/U = -0.062 [V]
ETMY T240 1 DOF Y/V = 0.264 [V]
ETMY T240 1 DOF Z/W = -0.021 [V]
ETMY T240 2 DOF X/U = 0.018 [V]
ETMY T240 2 DOF Y/V = -0.059 [V]
ETMY T240 2 DOF Z/W = -0.04 [V]
ETMY T240 3 DOF X/U = -0.032 [V]
ETMY T240 3 DOF Y/V = -0.057 [V]
ETMY T240 3 DOF Z/W = 0.166 [V]
ITMX T240 1 DOF Y/V = 0.119 [V]
ITMX T240 1 DOF Z/W = 0.119 [V]
ITMX T240 2 DOF X/U = 0.147 [V]
ITMX T240 2 DOF Y/V = 0.148 [V]
ITMX T240 2 DOF Z/W = 0.235 [V]
ITMX T240 3 DOF X/U = -0.24 [V]
ITMX T240 3 DOF Y/V = 0.137 [V]
ITMX T240 3 DOF Z/W = 0.033 [V]
ITMY T240 1 DOF X/U = 0.201 [V]
ITMY T240 1 DOF Y/V = 0.142 [V]
ITMY T240 1 DOF Z/W = 0.159 [V]
ITMY T240 2 DOF X/U = 0.174 [V]
ITMY T240 2 DOF Y/V = 0.243 [V]
ITMY T240 2 DOF Z/W = 0.211 [V]
ITMY T240 3 DOF X/U = -0.065 [V]
ITMY T240 3 DOF Y/V = 0.21 [V]
BS T240 1 DOF X/U = -0.001 [V]
BS T240 1 DOF Y/V = -0.086 [V]
BS T240 1 DOF Z/W = 0.256 [V]
BS T240 2 DOF X/U = 0.061 [V]
BS T240 2 DOF Y/V = 0.238 [V]
BS T240 2 DOF Z/W = -0.037 [V]
BS T240 3 DOF X/U = 0.058 [V]
BS T240 3 DOF Y/V = -0.163 [V]
BS T240 3 DOF Z/W = -0.17 [V]


For STSs:

Averaging Mass Centering channels for 10 [sec] ...


2019-01-17 15:26:33.360168
There are 1 STS proof masses out of range ( > 2.0 [V] )!
STS A DOF X/U = -7.959 [V]


All other proof masses are within range ( < 2.0 [V] ):
STS A DOF Y/V = -0.885 [V]
STS A DOF Z/W = -0.314 [V]
STS B DOF X/U = 0.325 [V]
STS B DOF Y/V = 0.373 [V]
STS B DOF Z/W = -0.38 [V]
STS C DOF X/U = 0.314 [V]
STS C DOF Y/V = 0.257 [V]
STS C DOF Z/W = 0.603 [V]
STS EX DOF X/U = -0.077 [V]
STS EX DOF Y/V = 0.298 [V]
STS EX DOF Z/W = 0.236 [V]
STS EY DOF X/U = 0.315 [V]
STS EY DOF Y/V = -0.153 [V]
STS EY DOF Z/W = 0.649 [V]


H1 SEI (SEI)
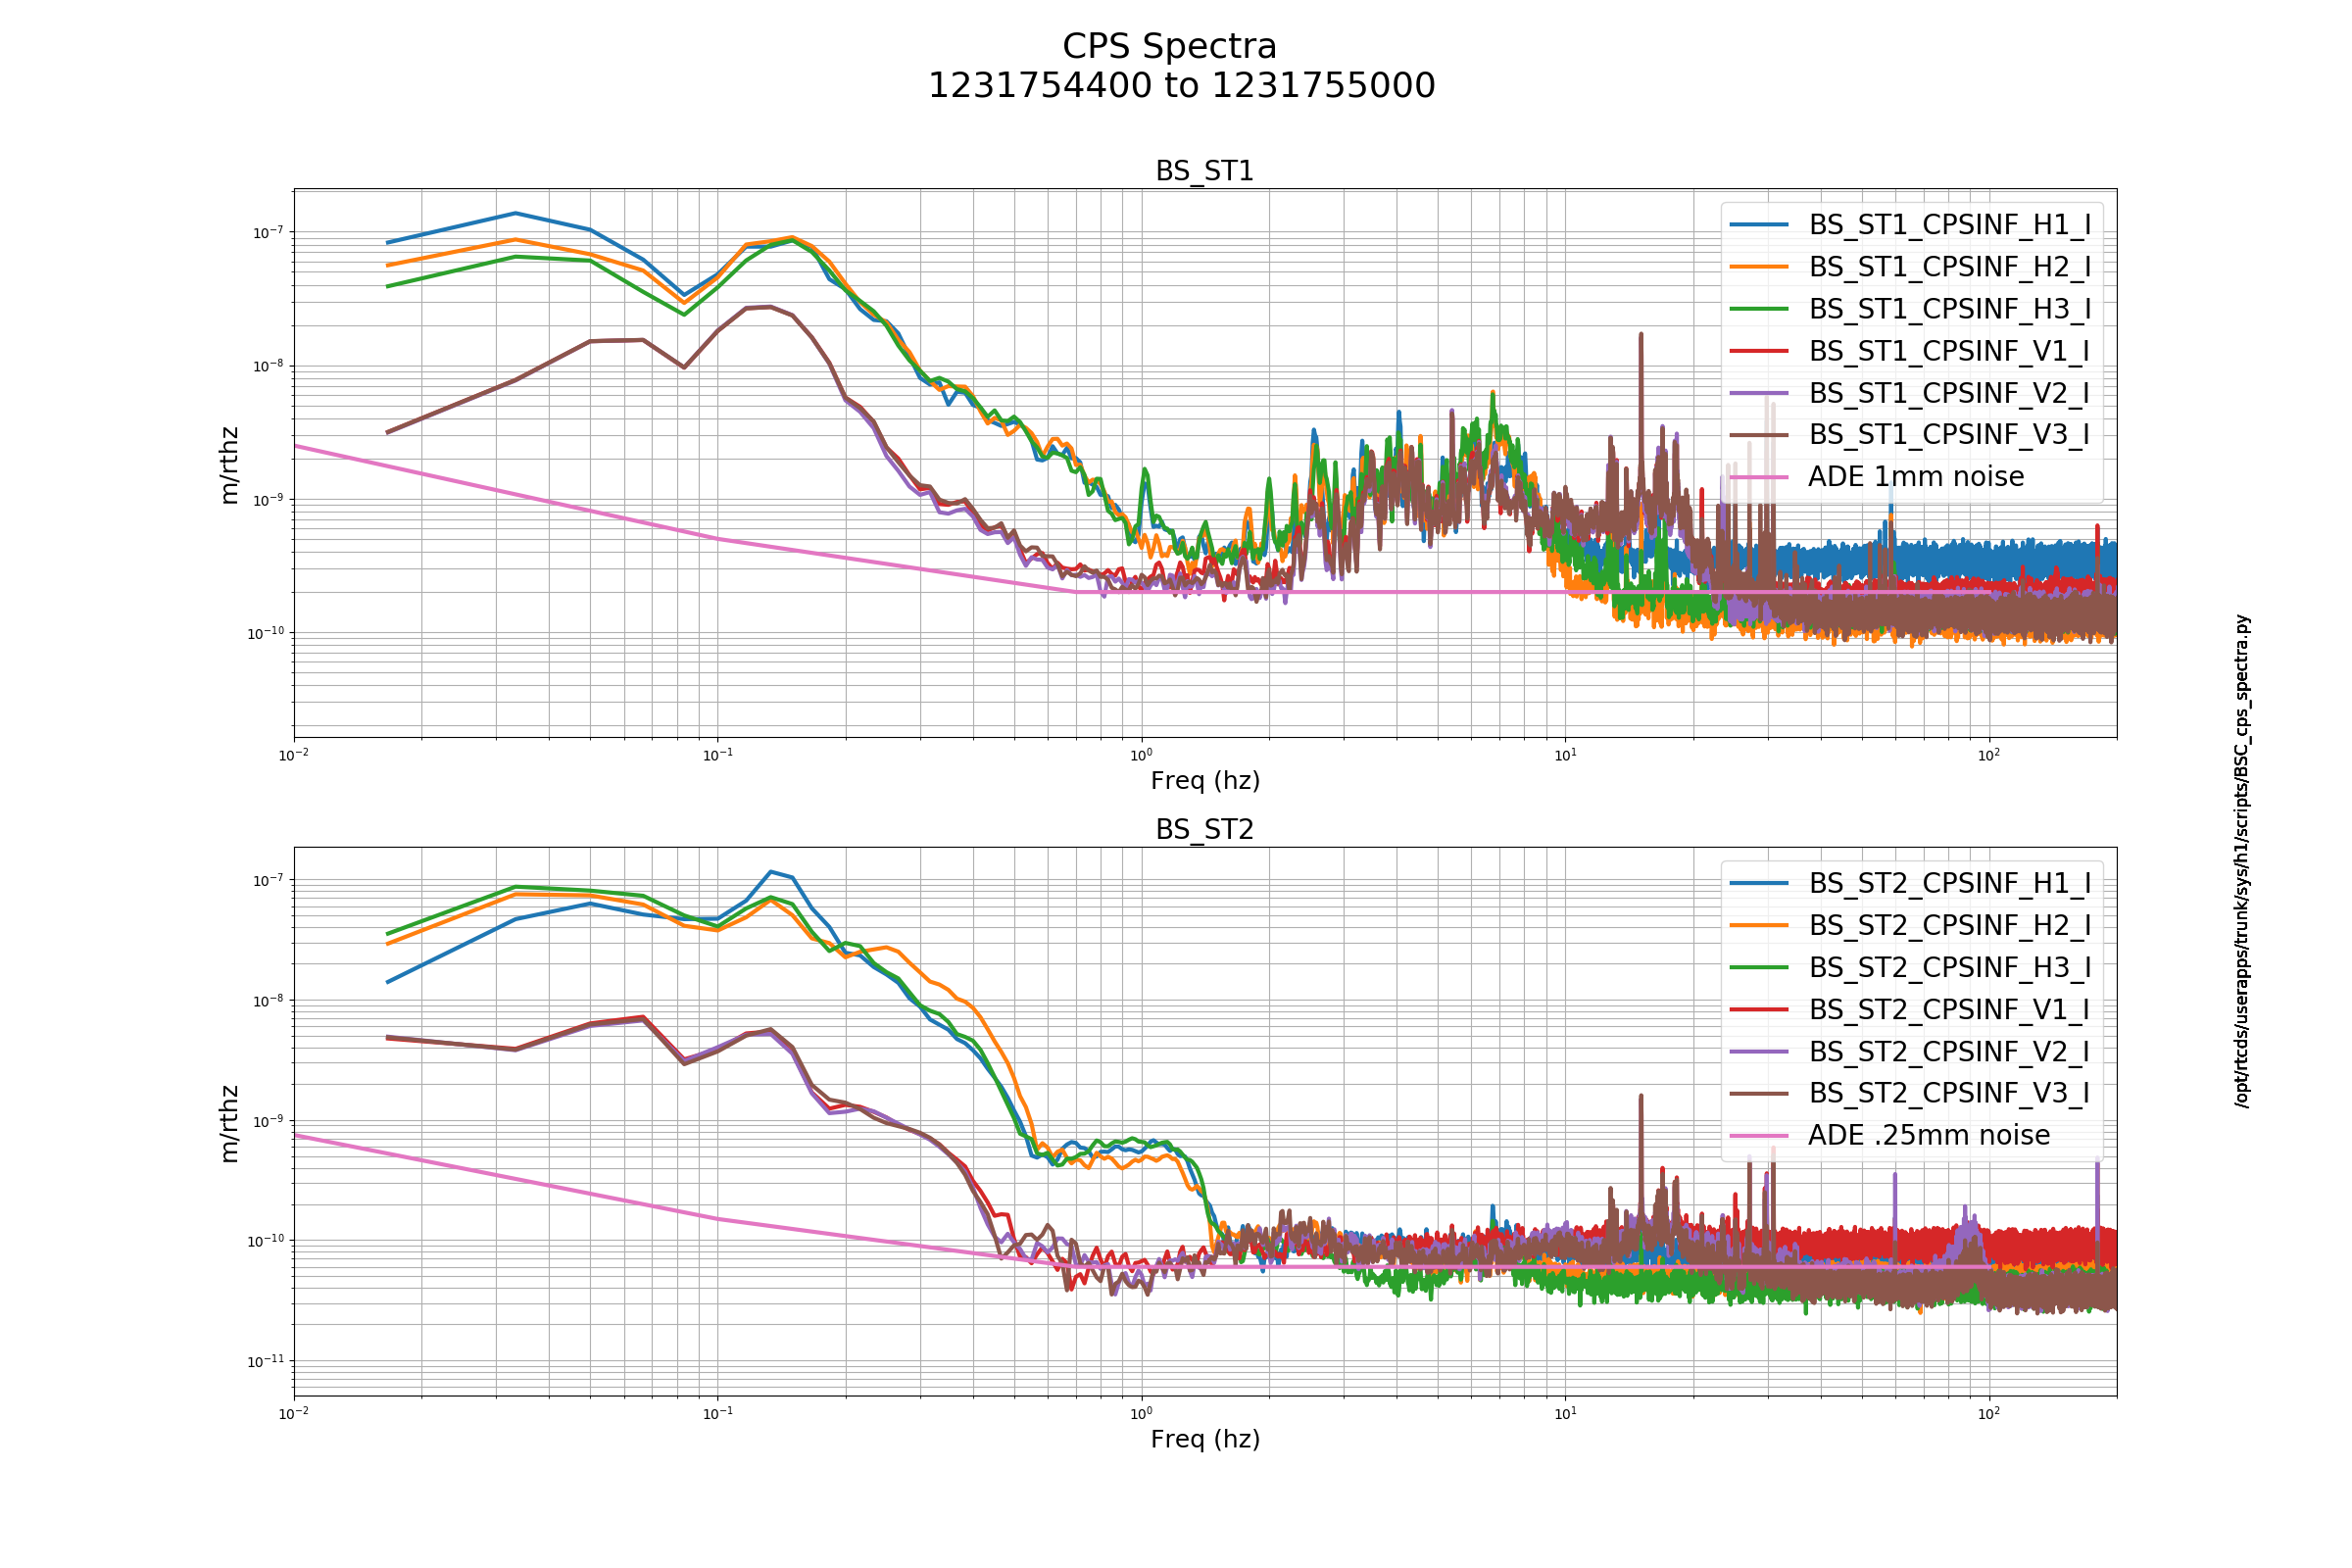
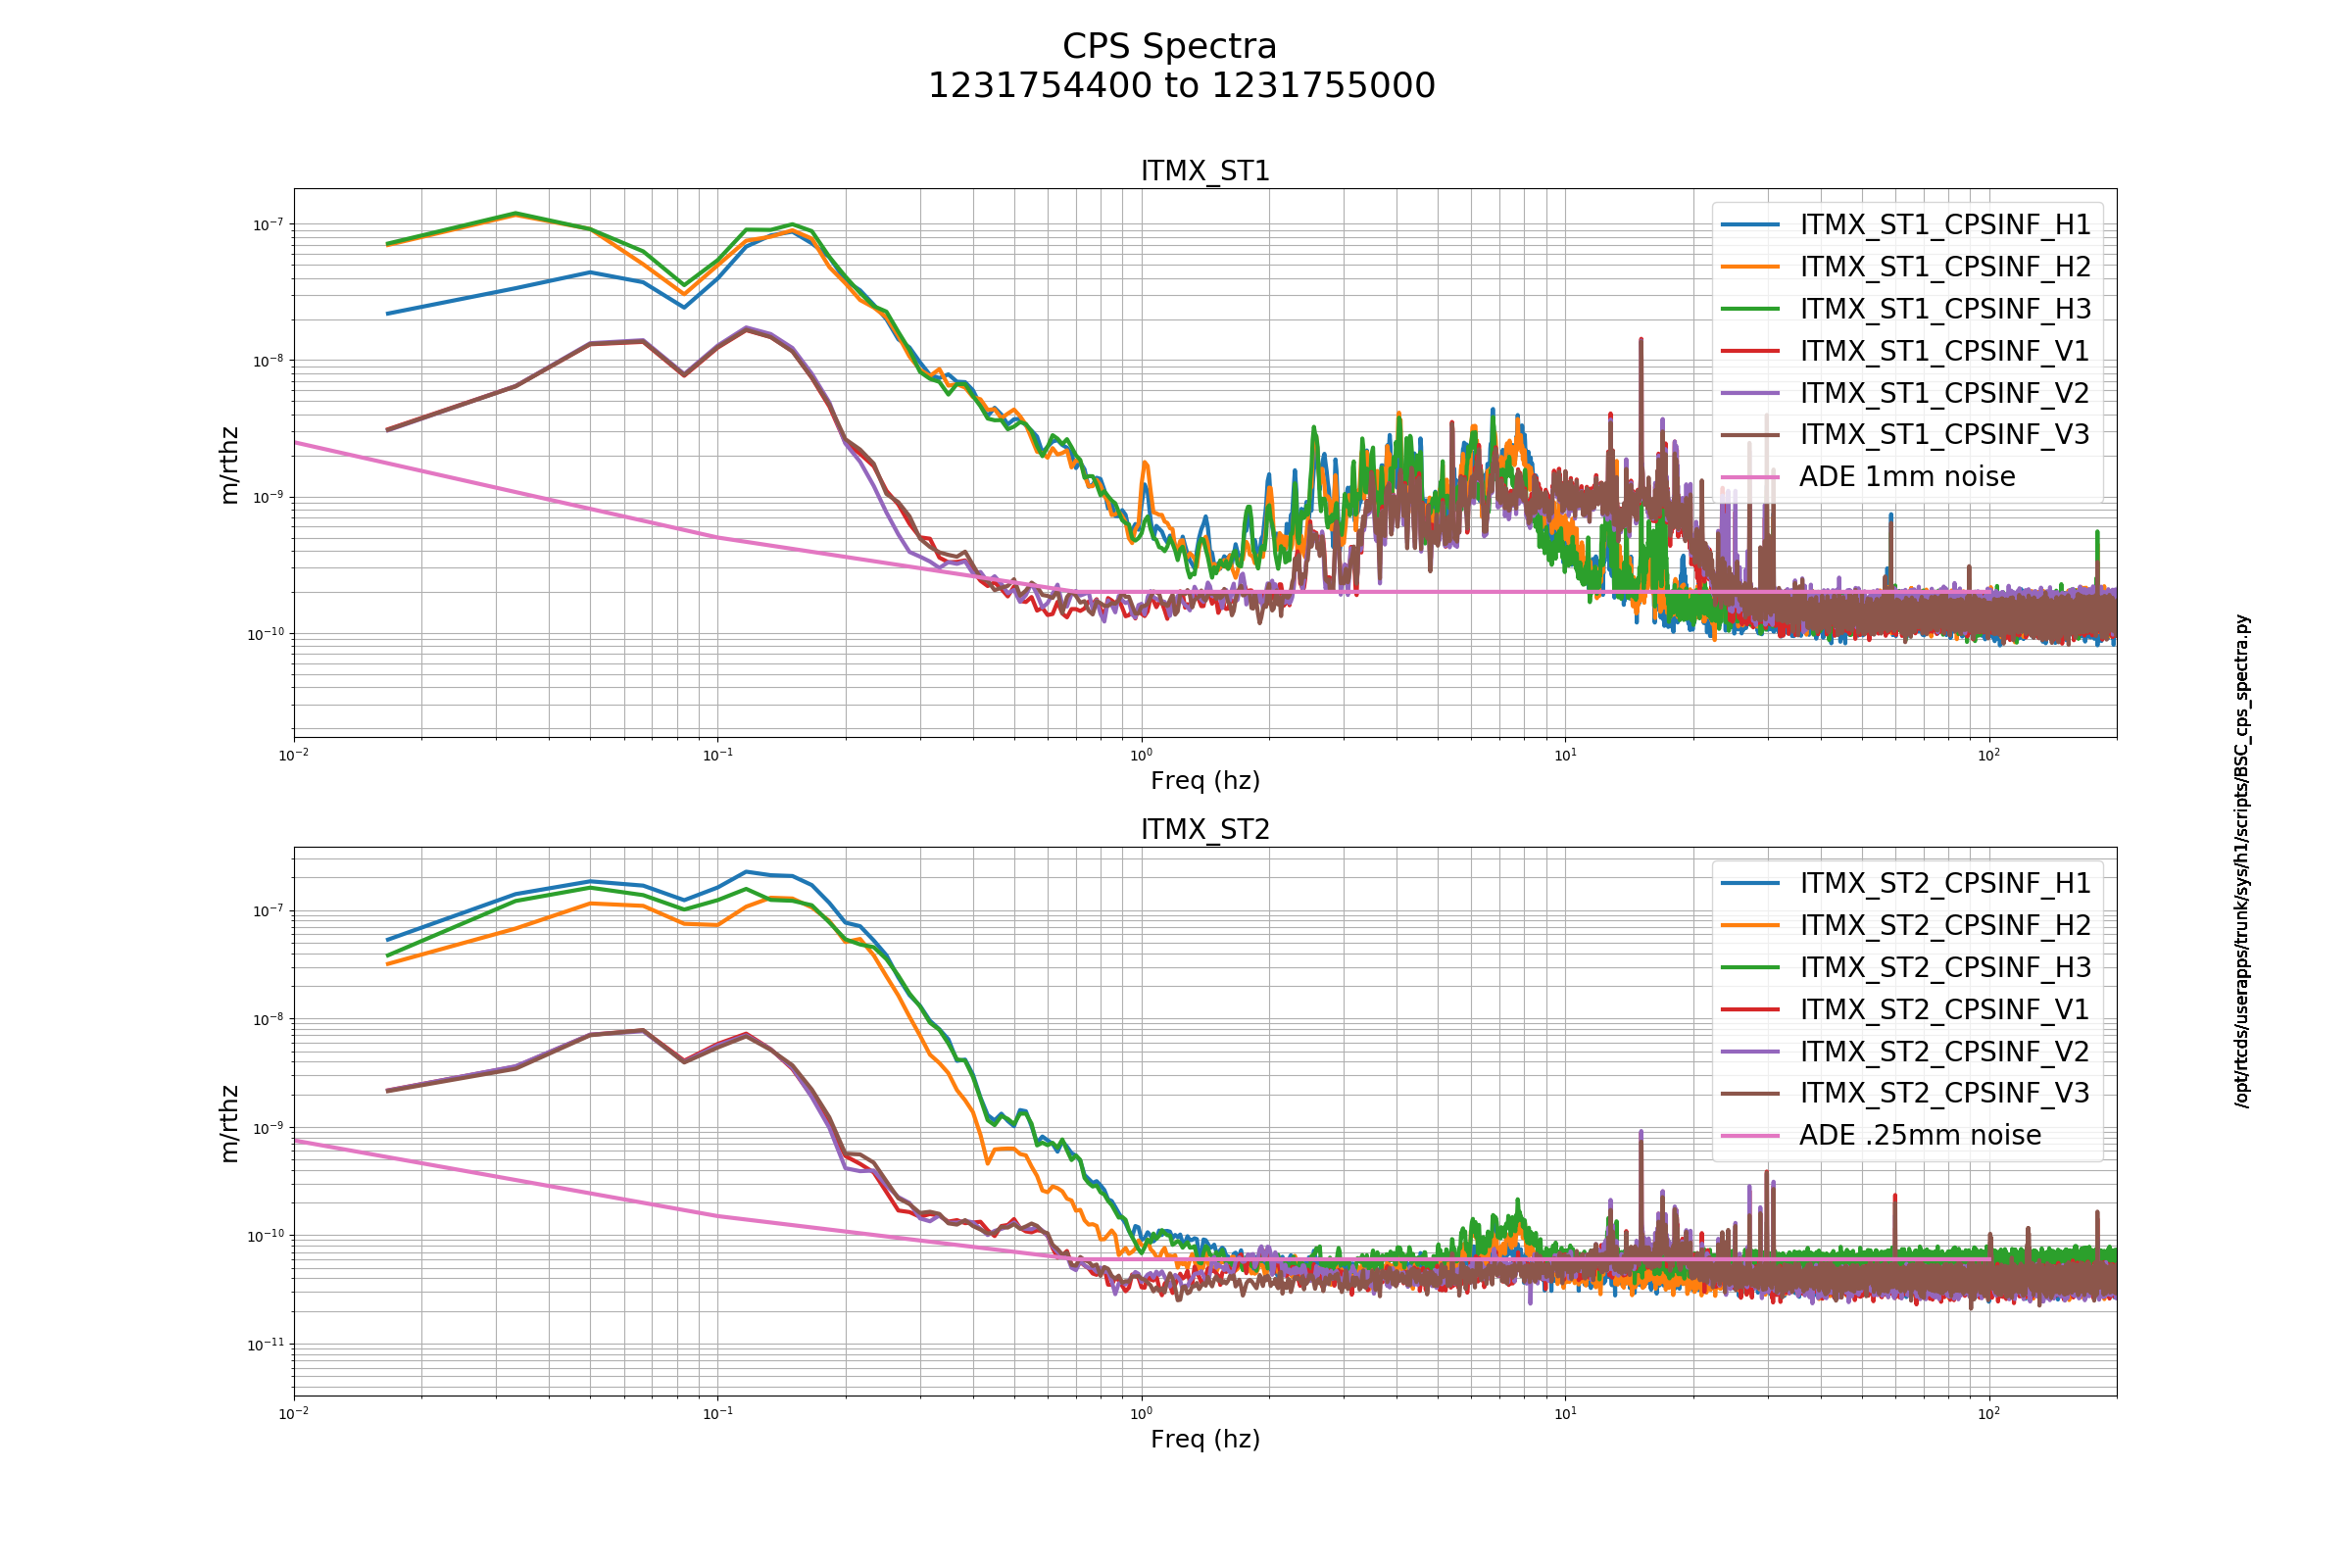
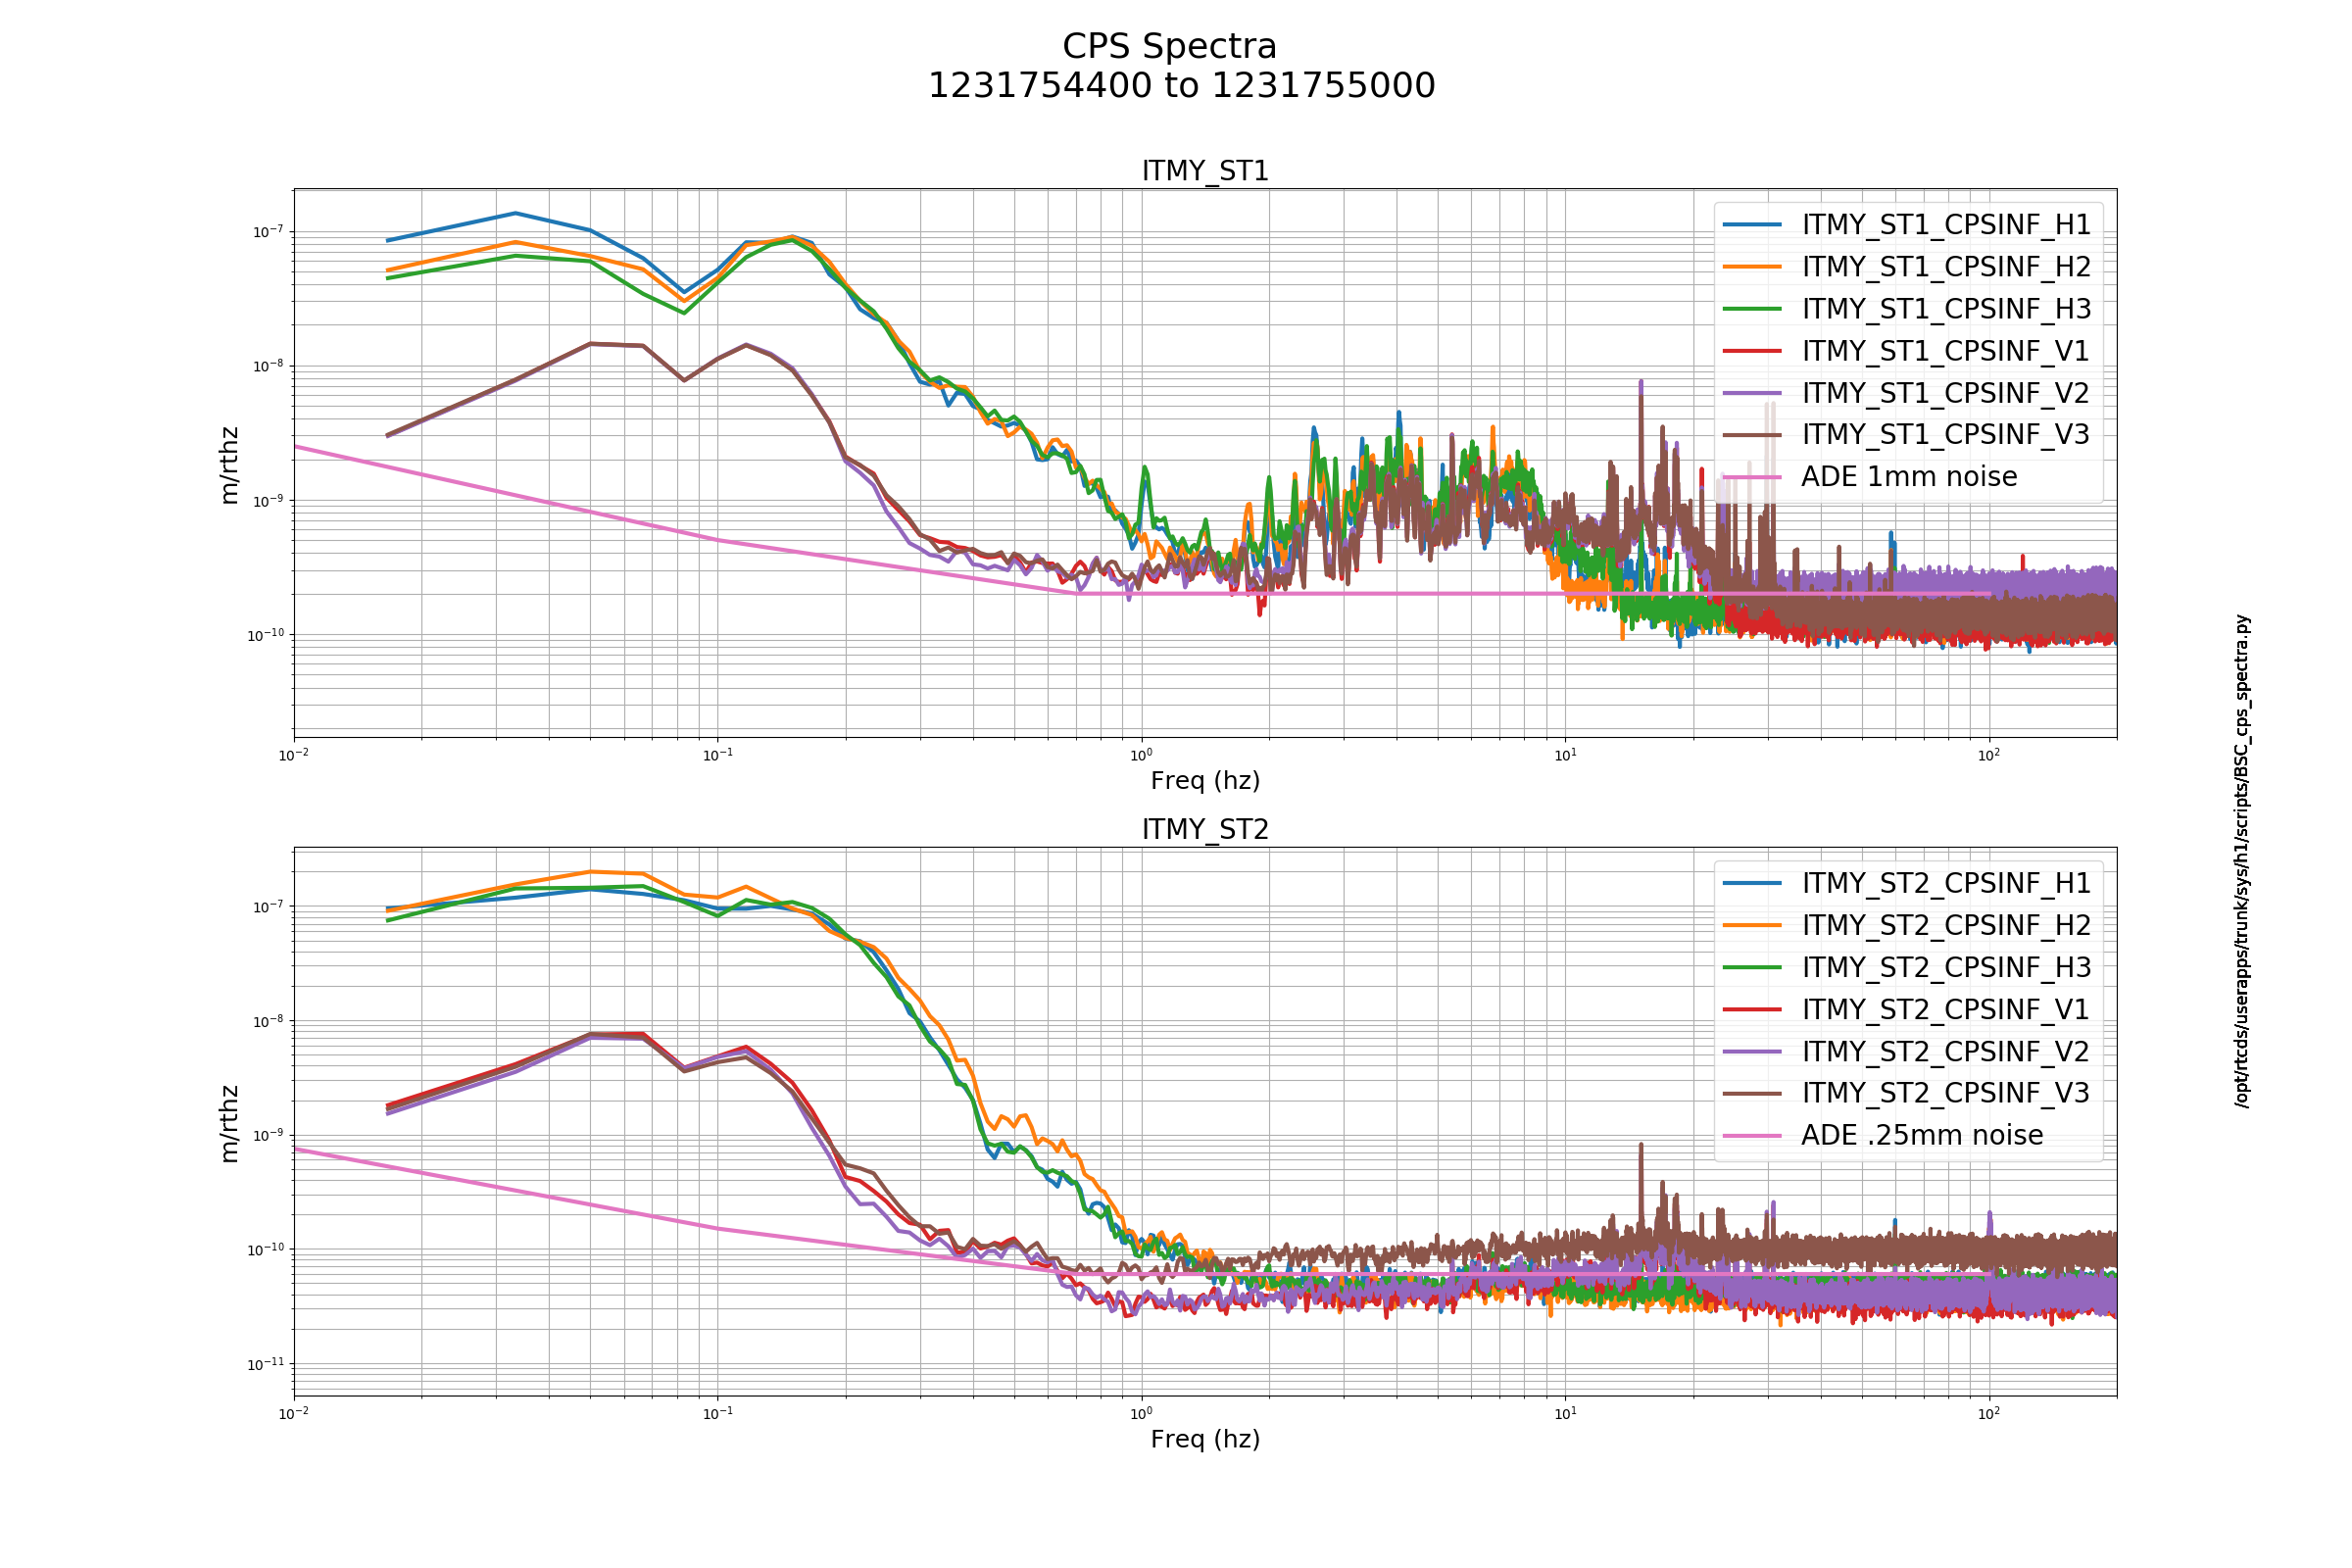
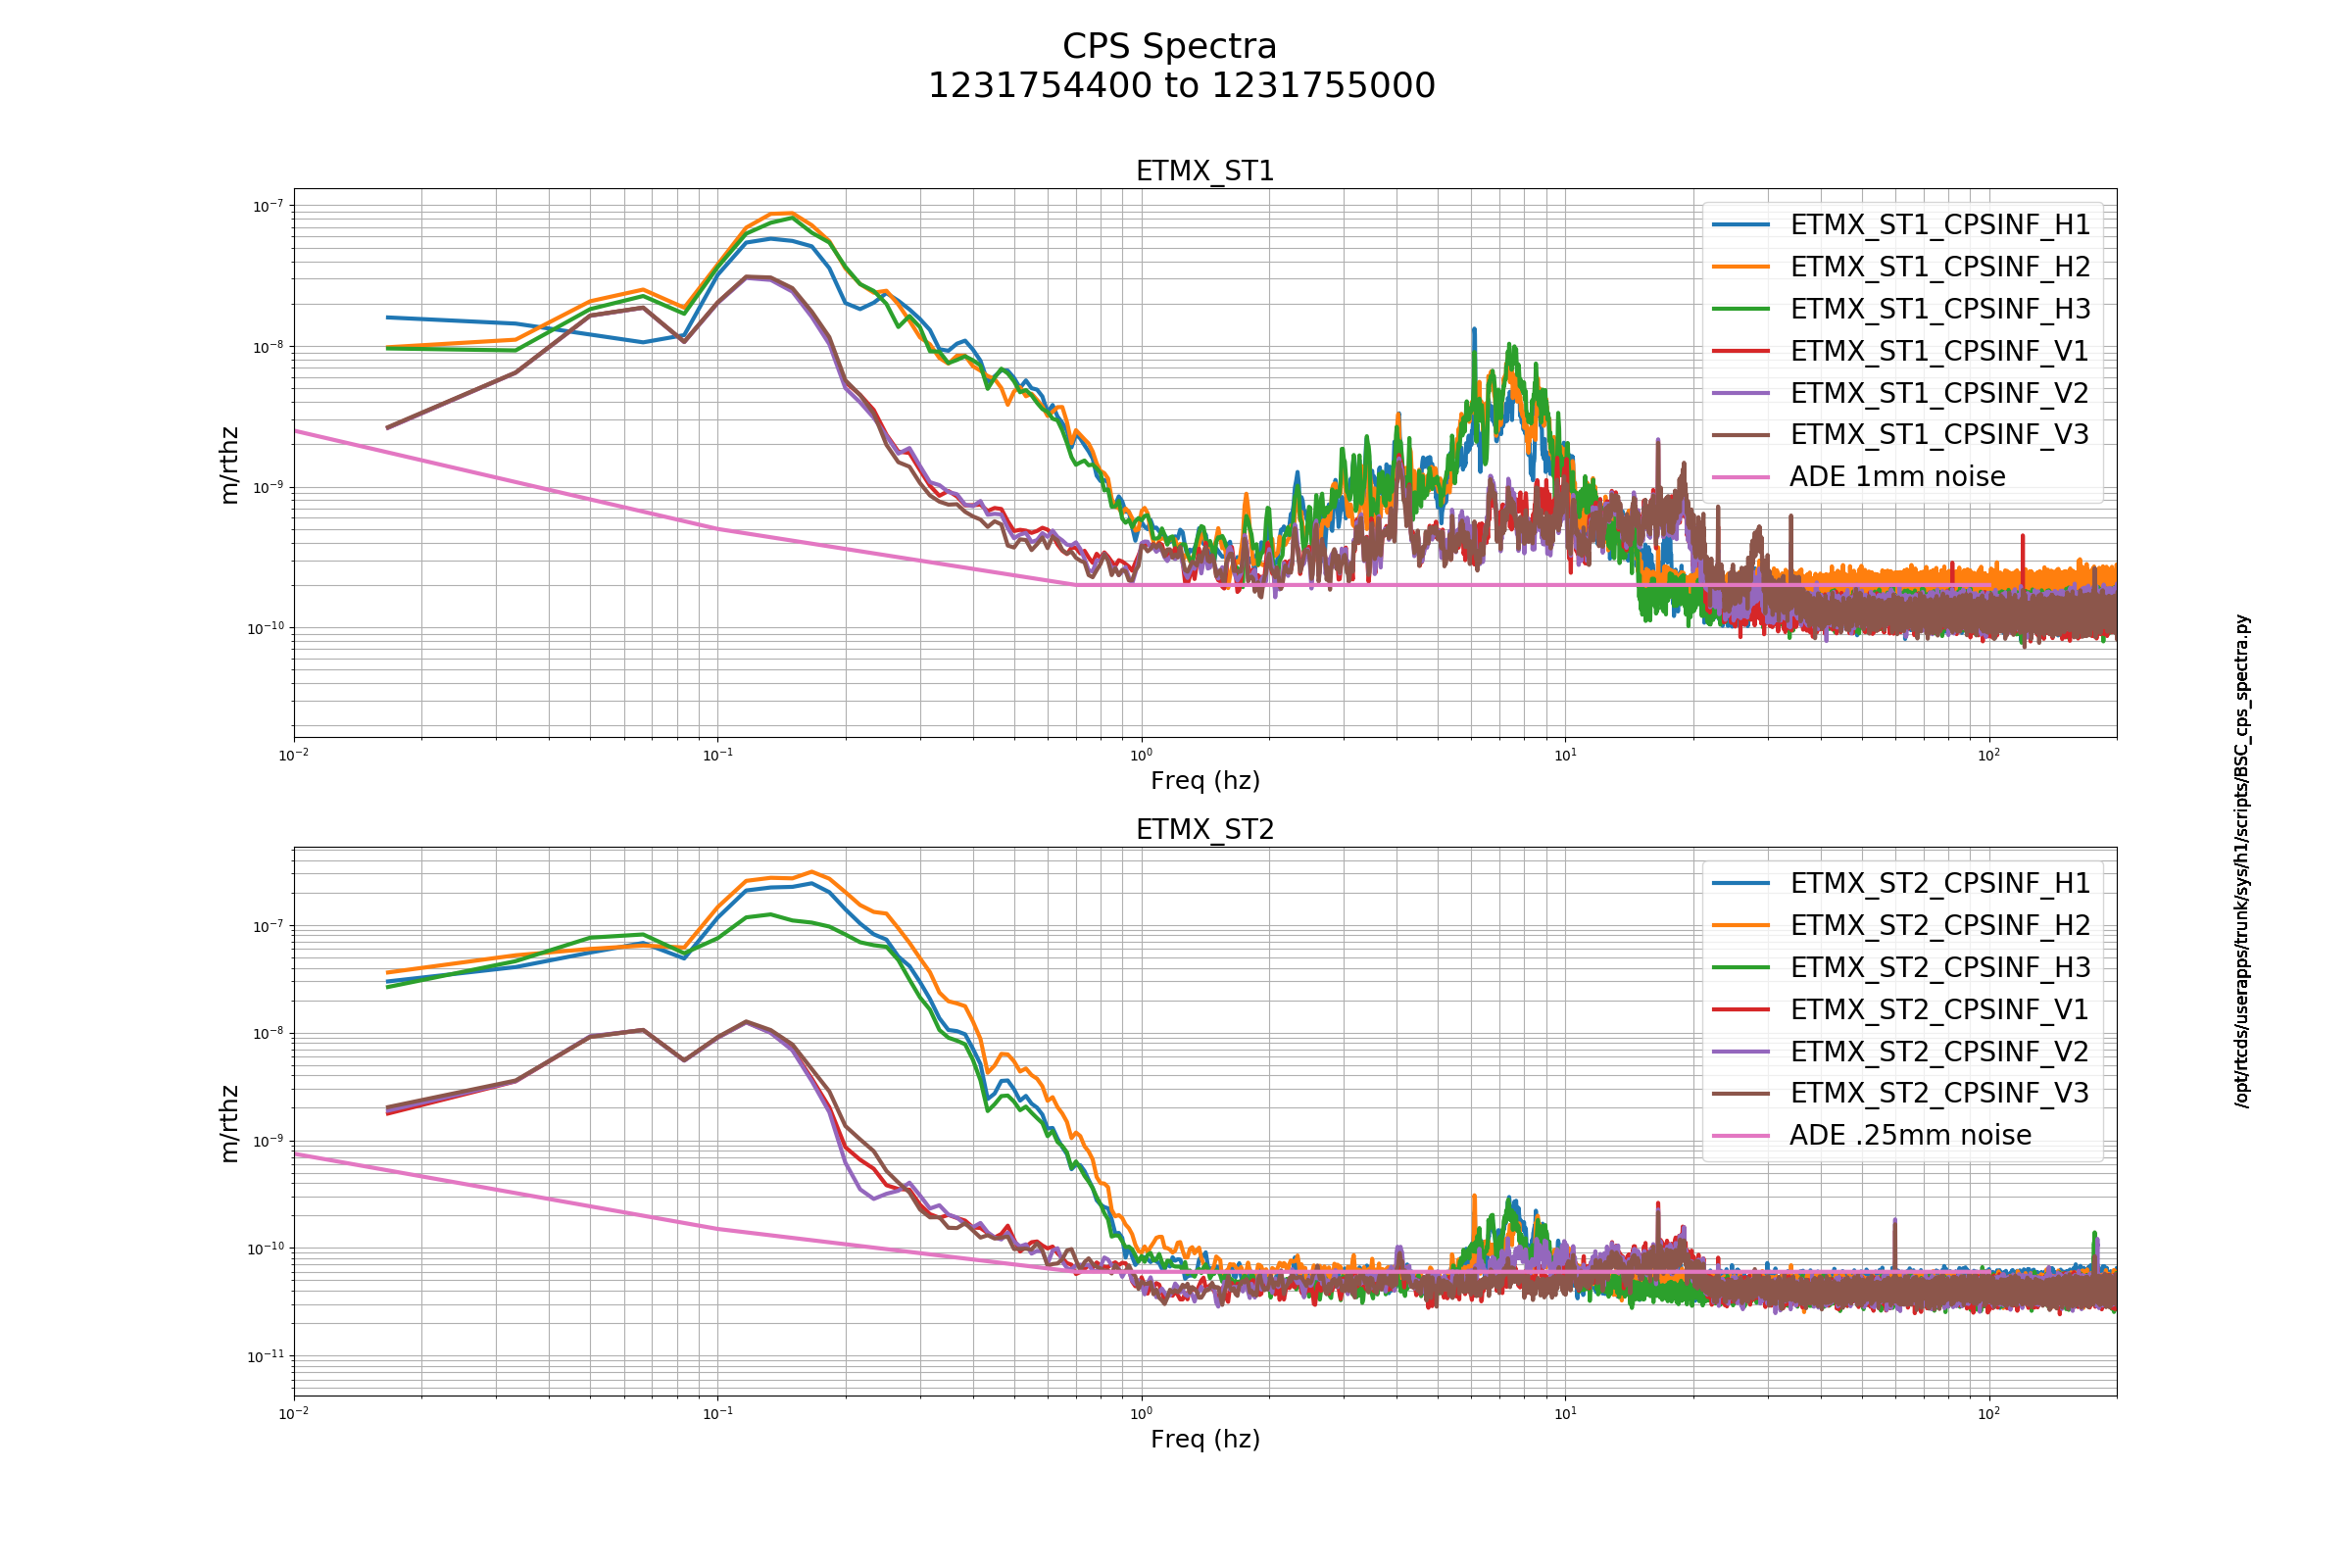
cheryl.vorvick@LIGO.ORG - posted 15:18, Thursday 17 January 2019 (46511)
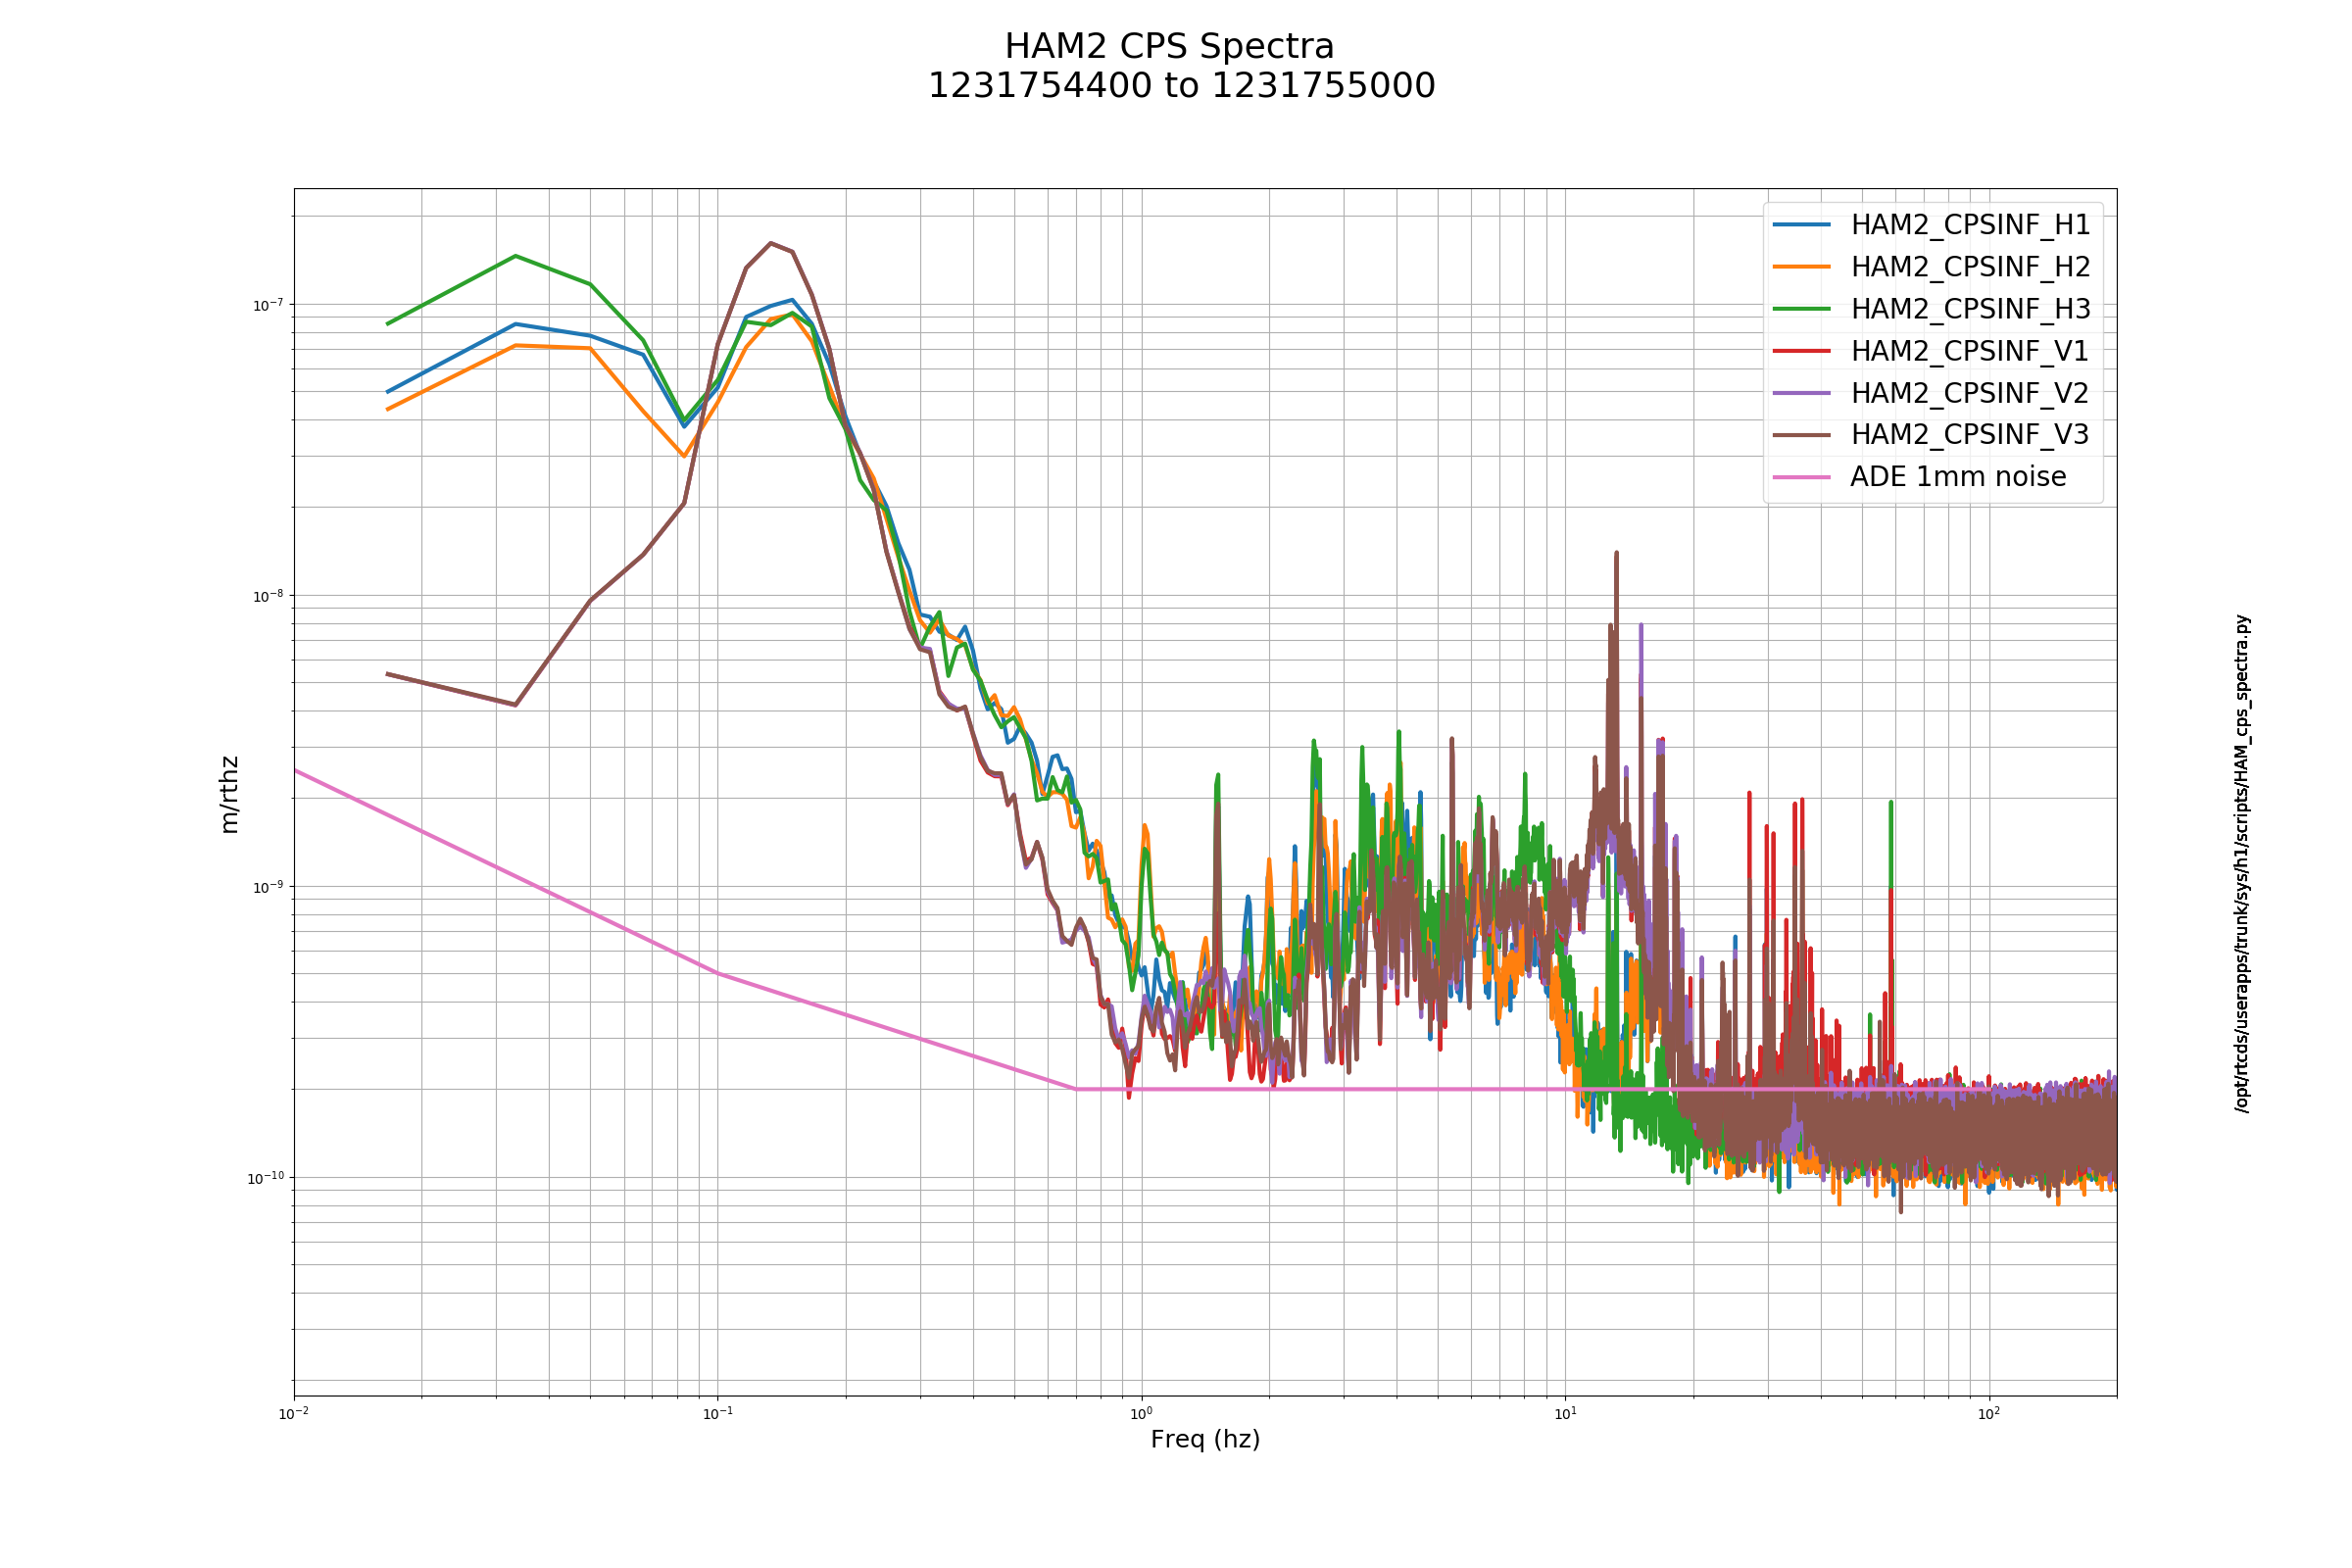
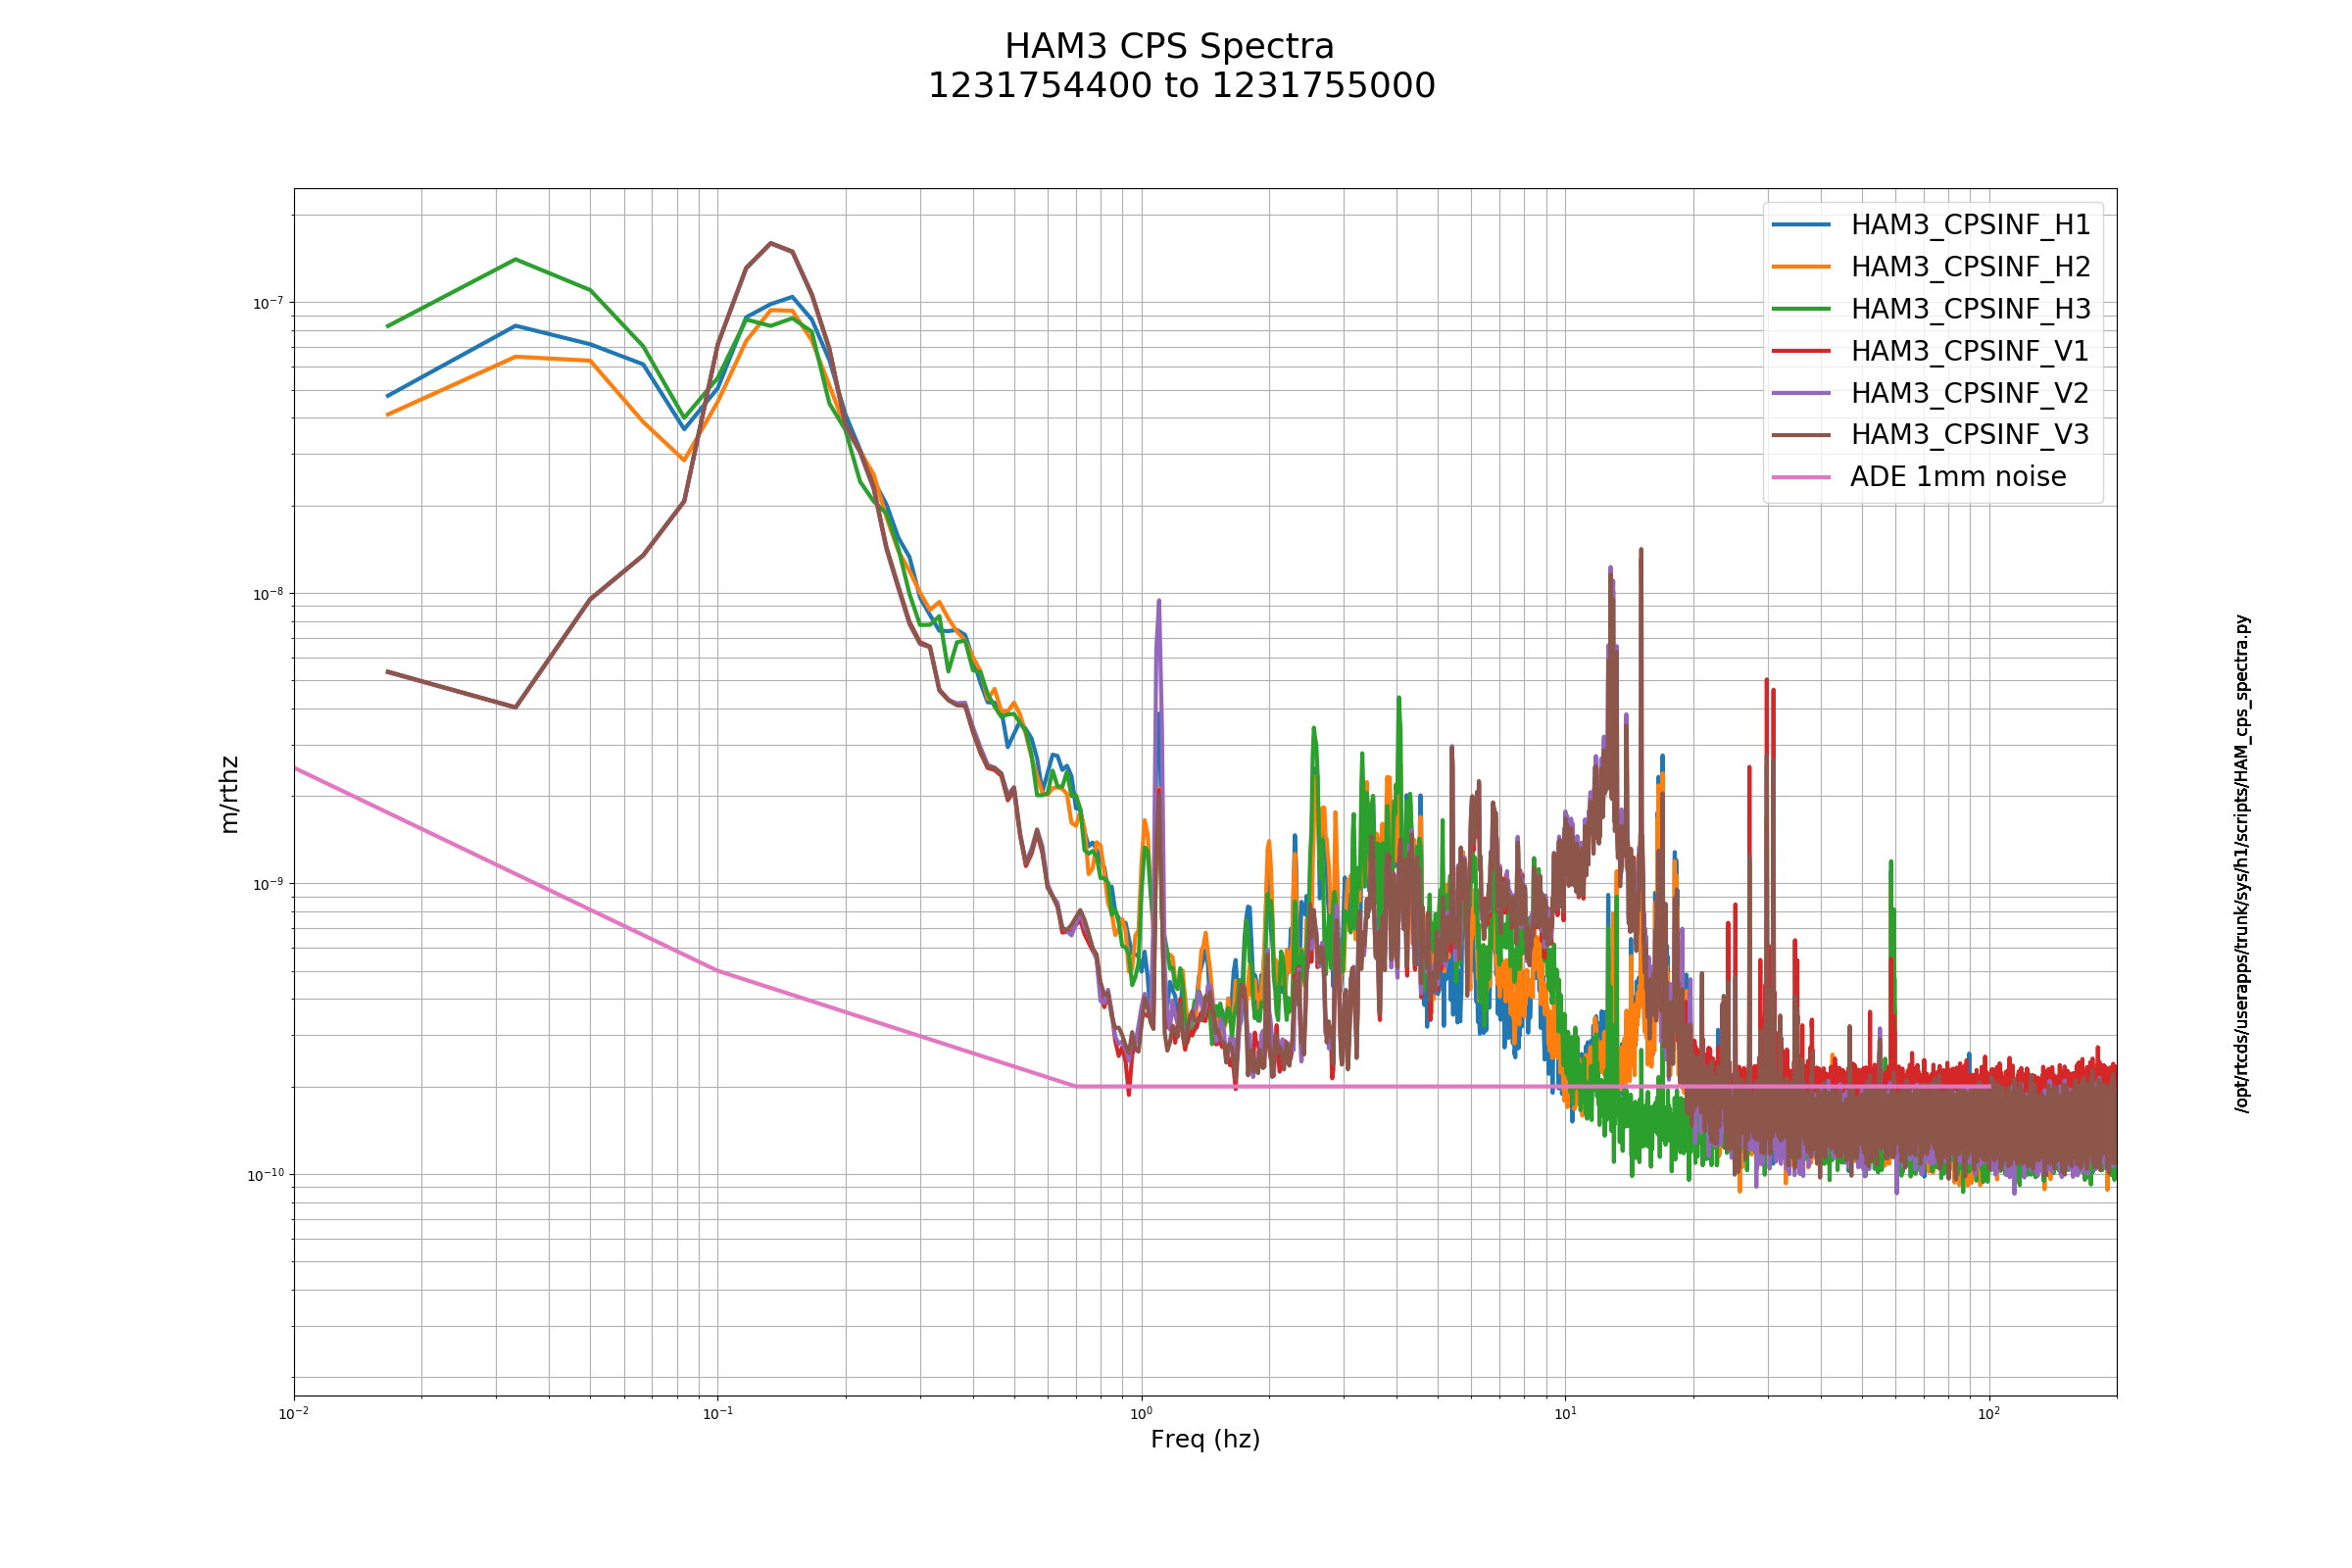
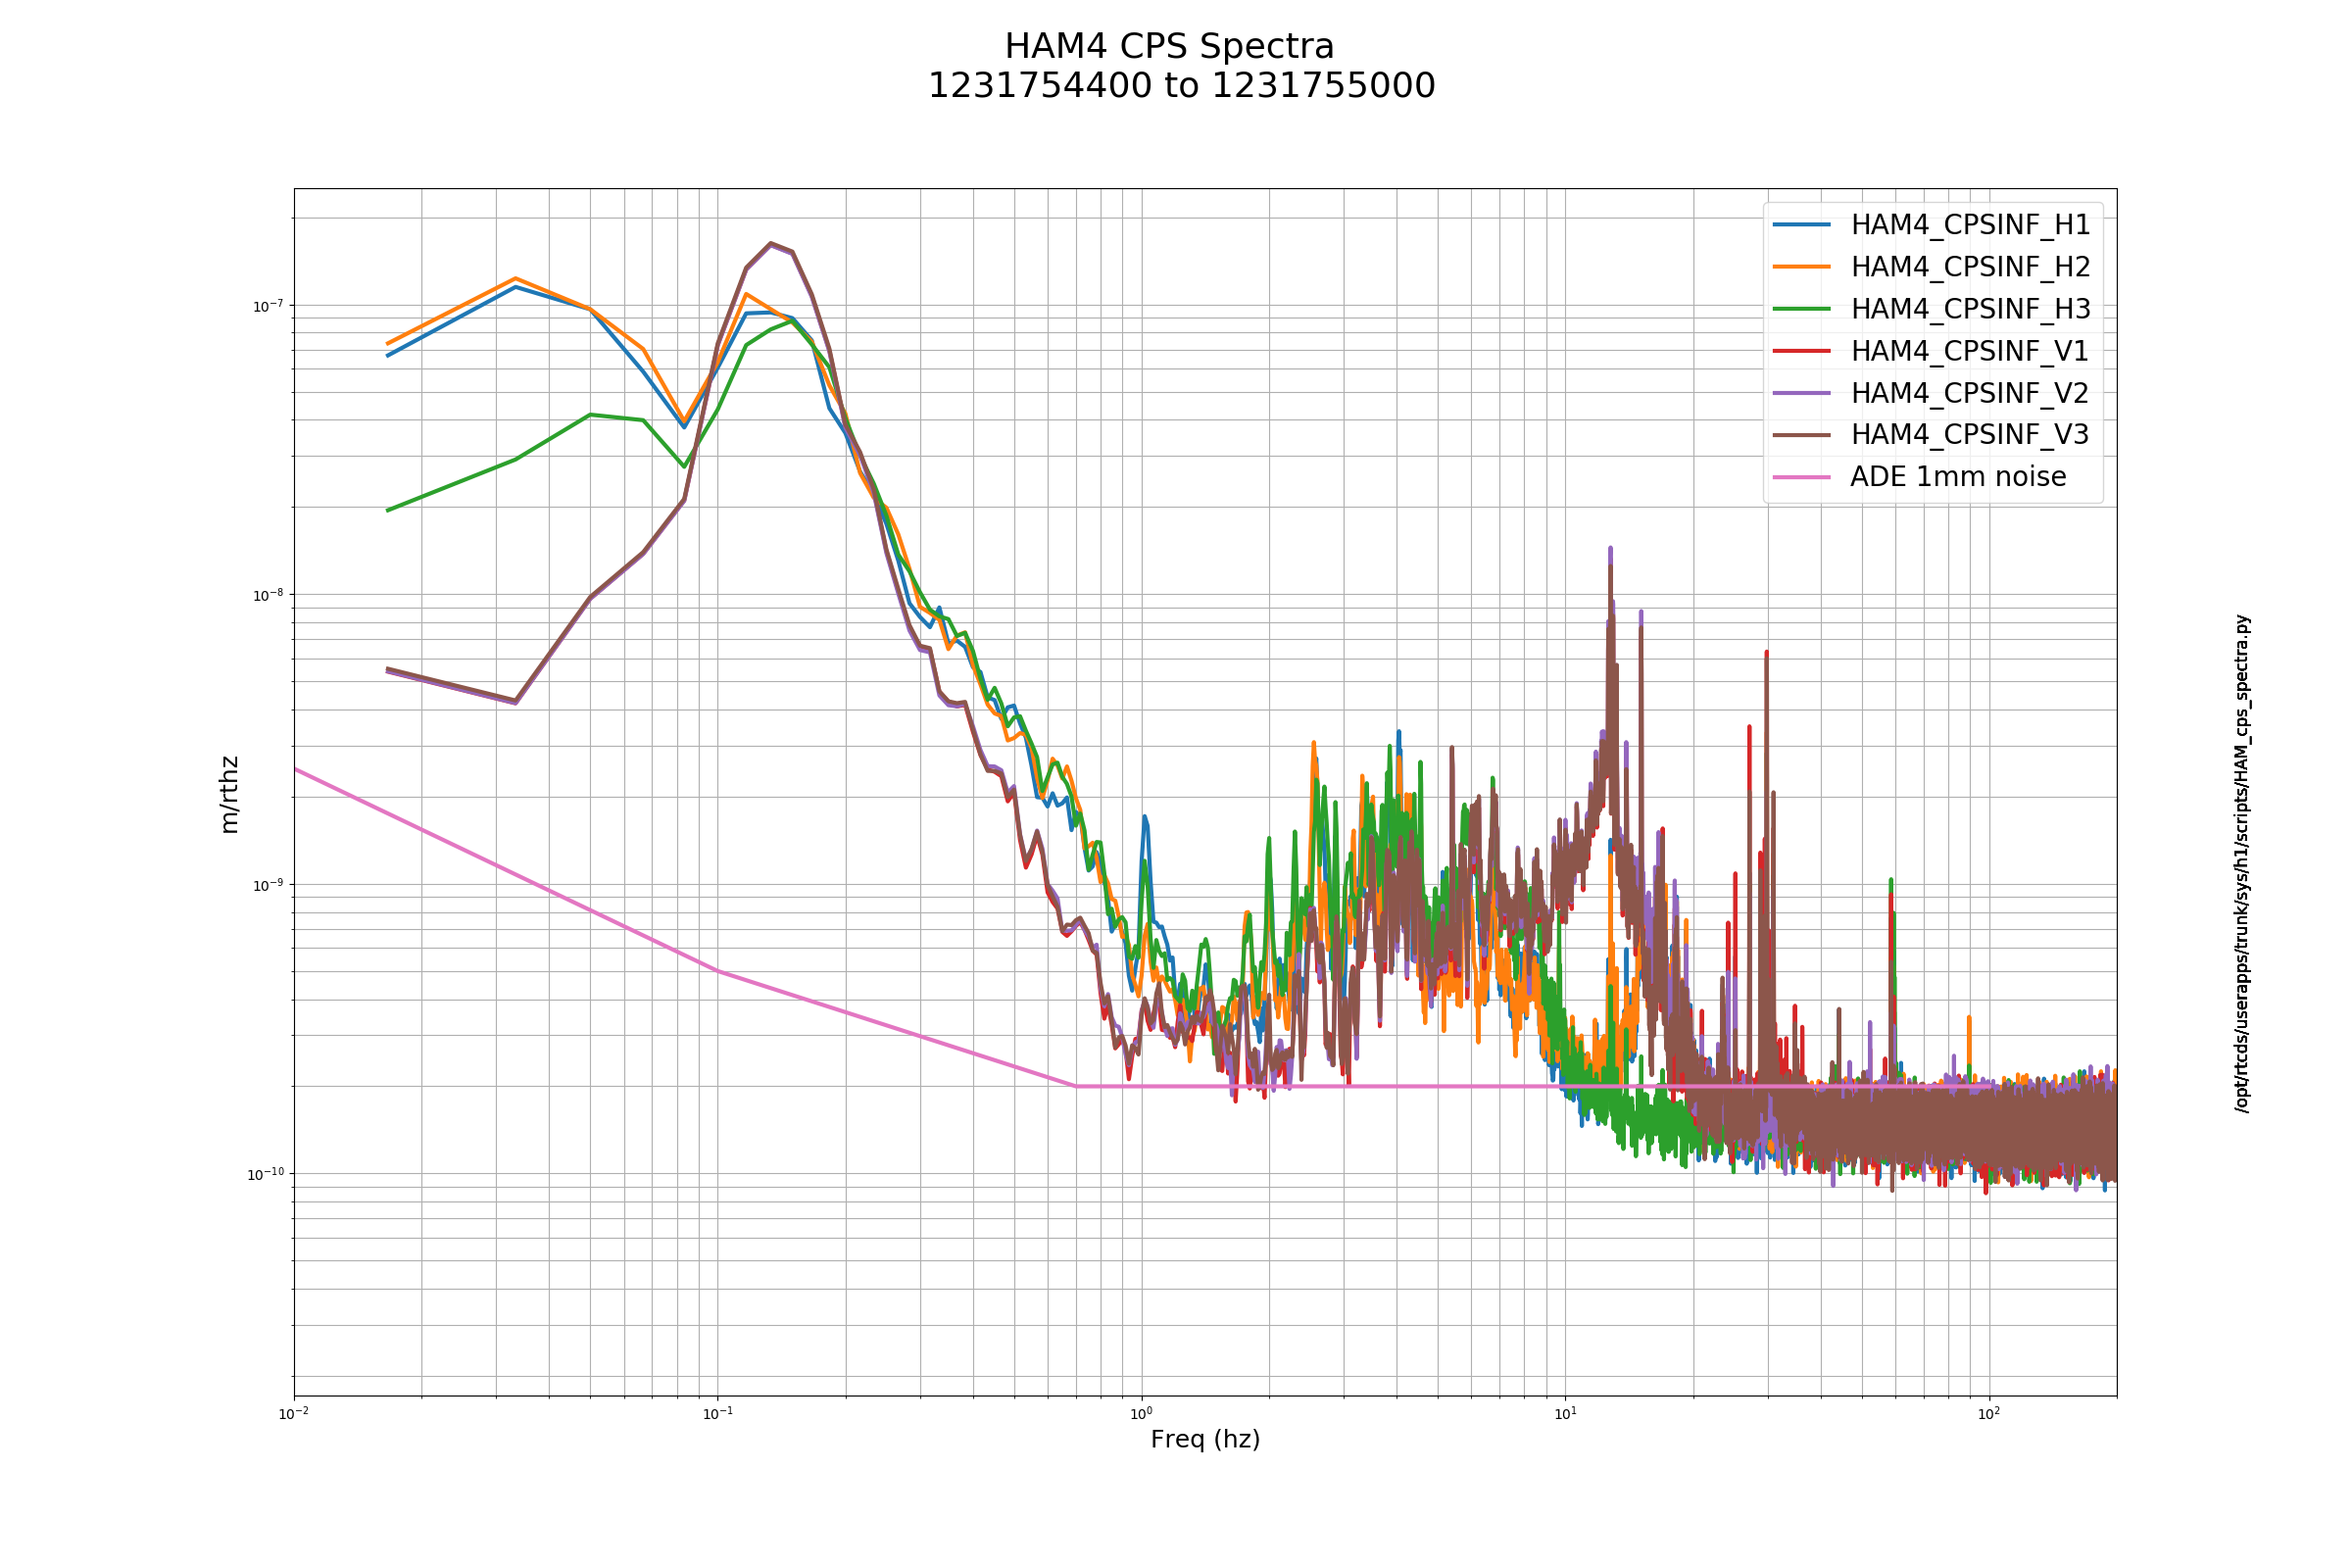
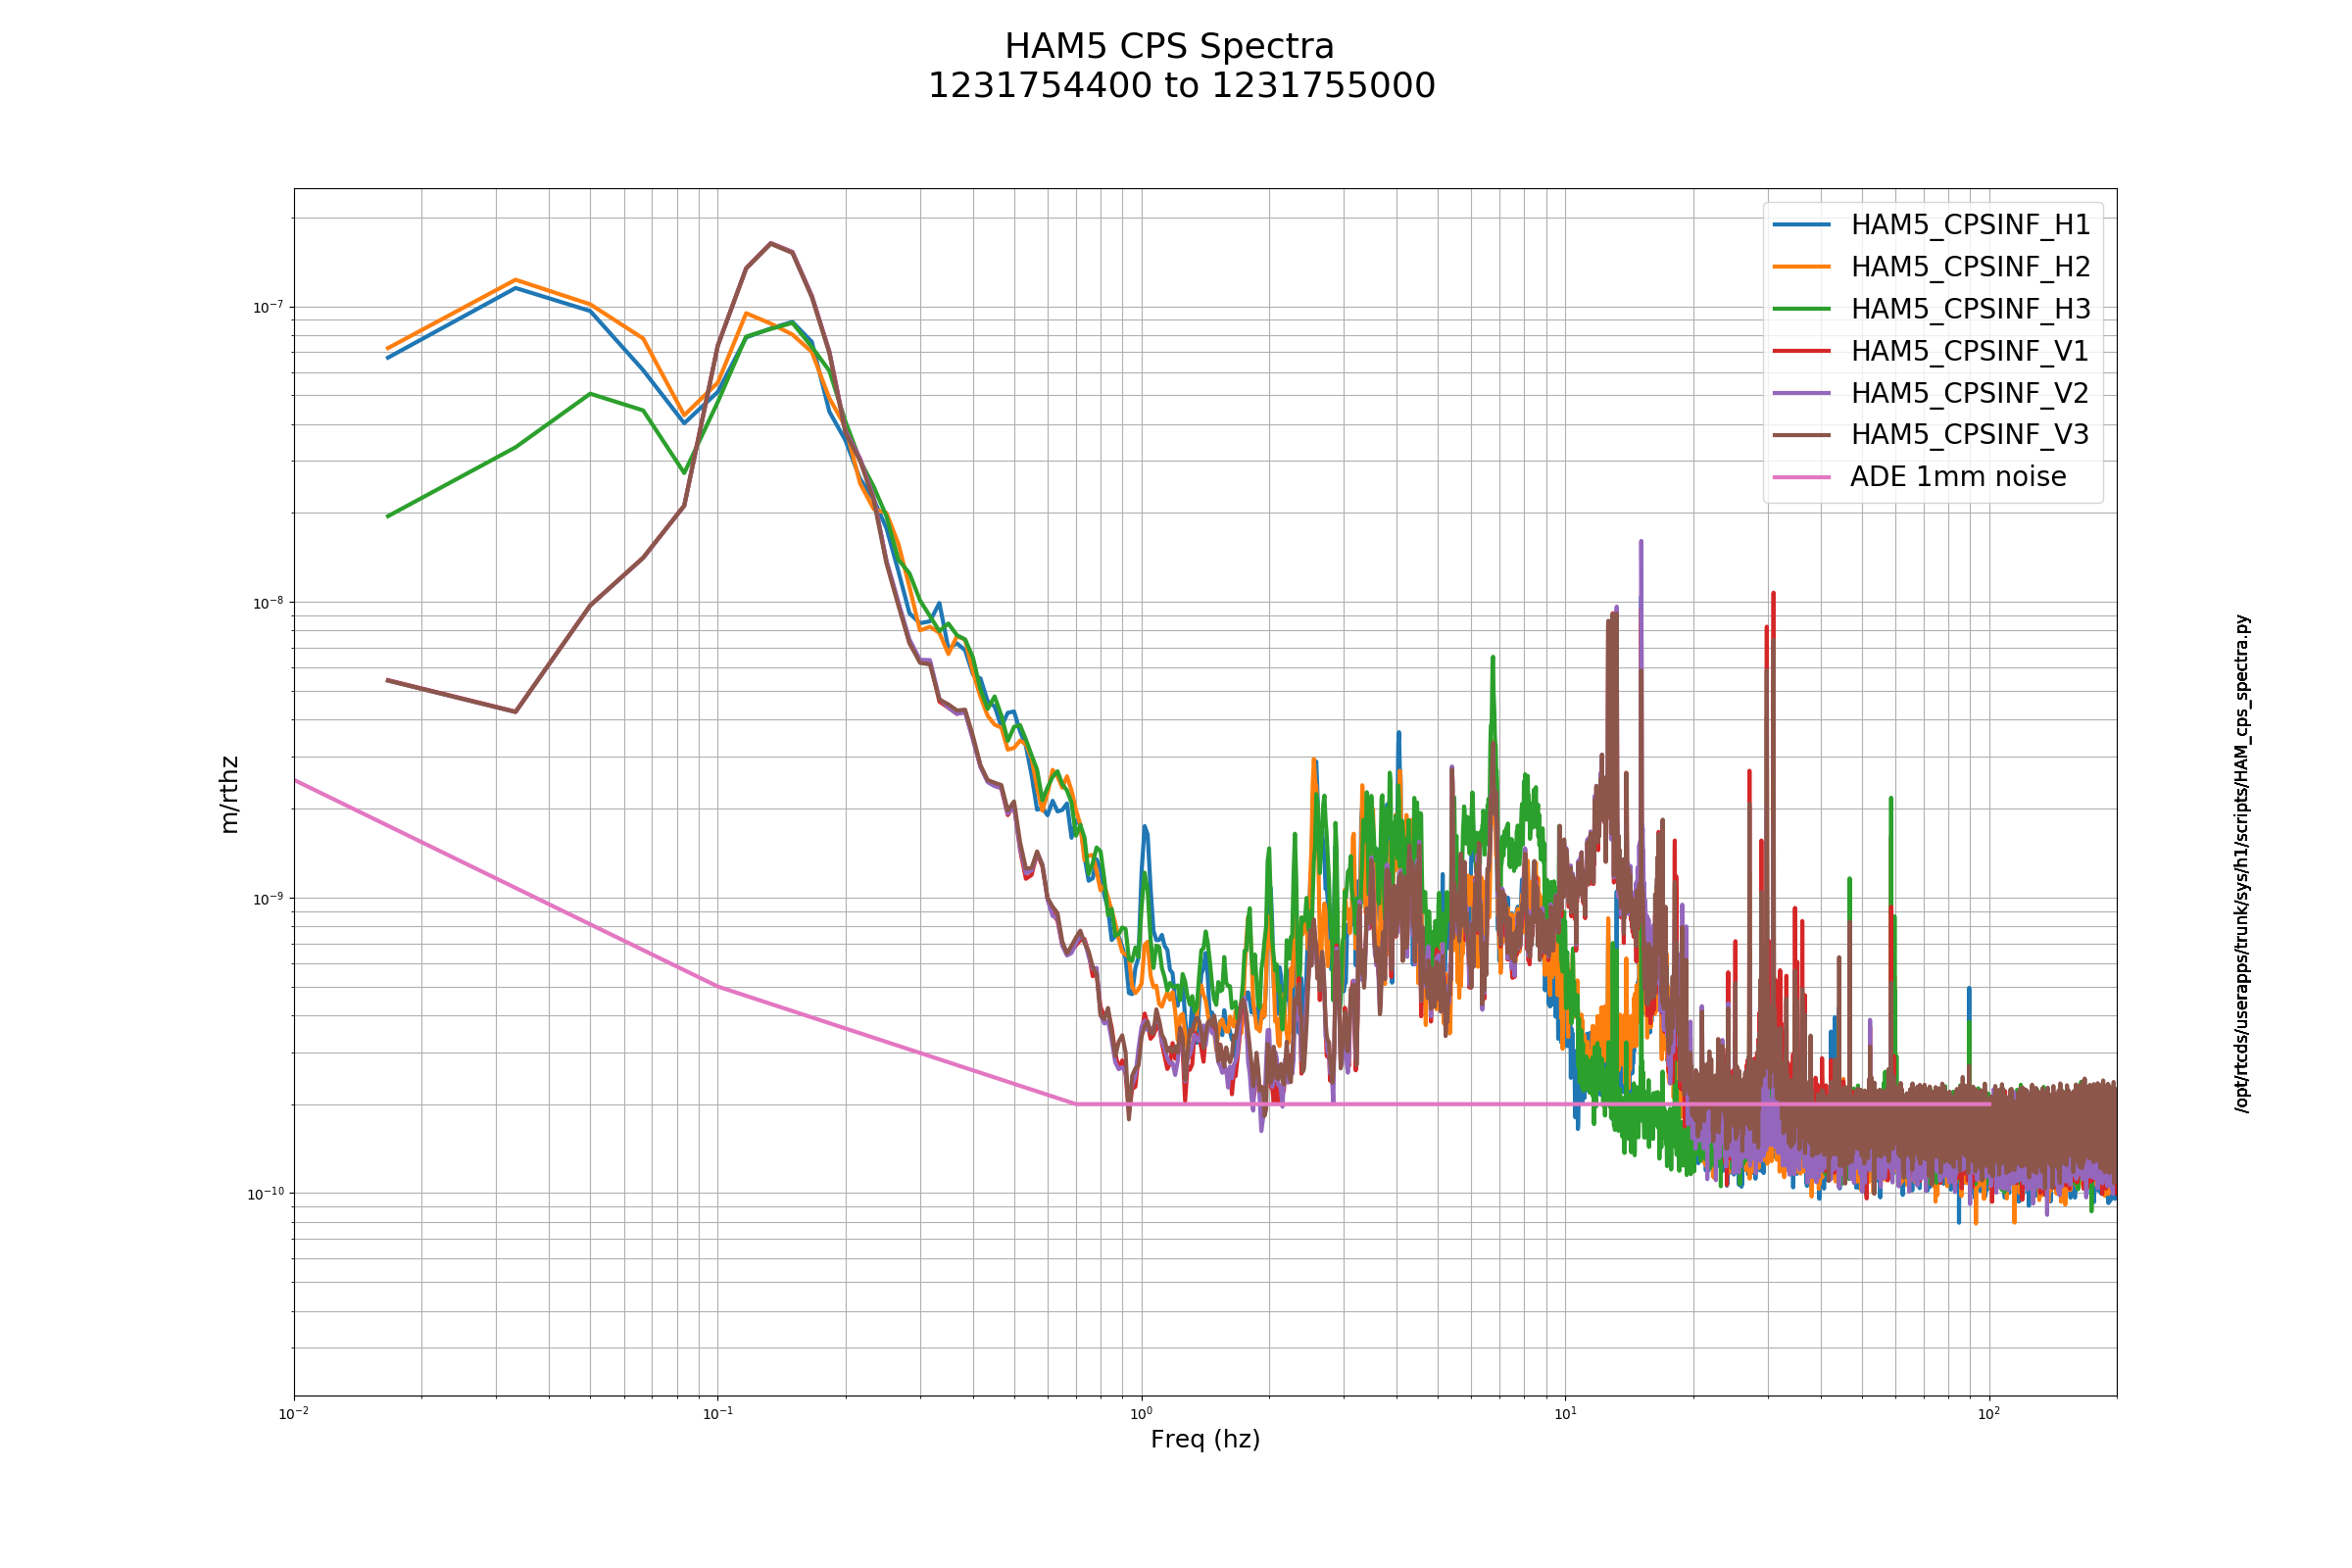
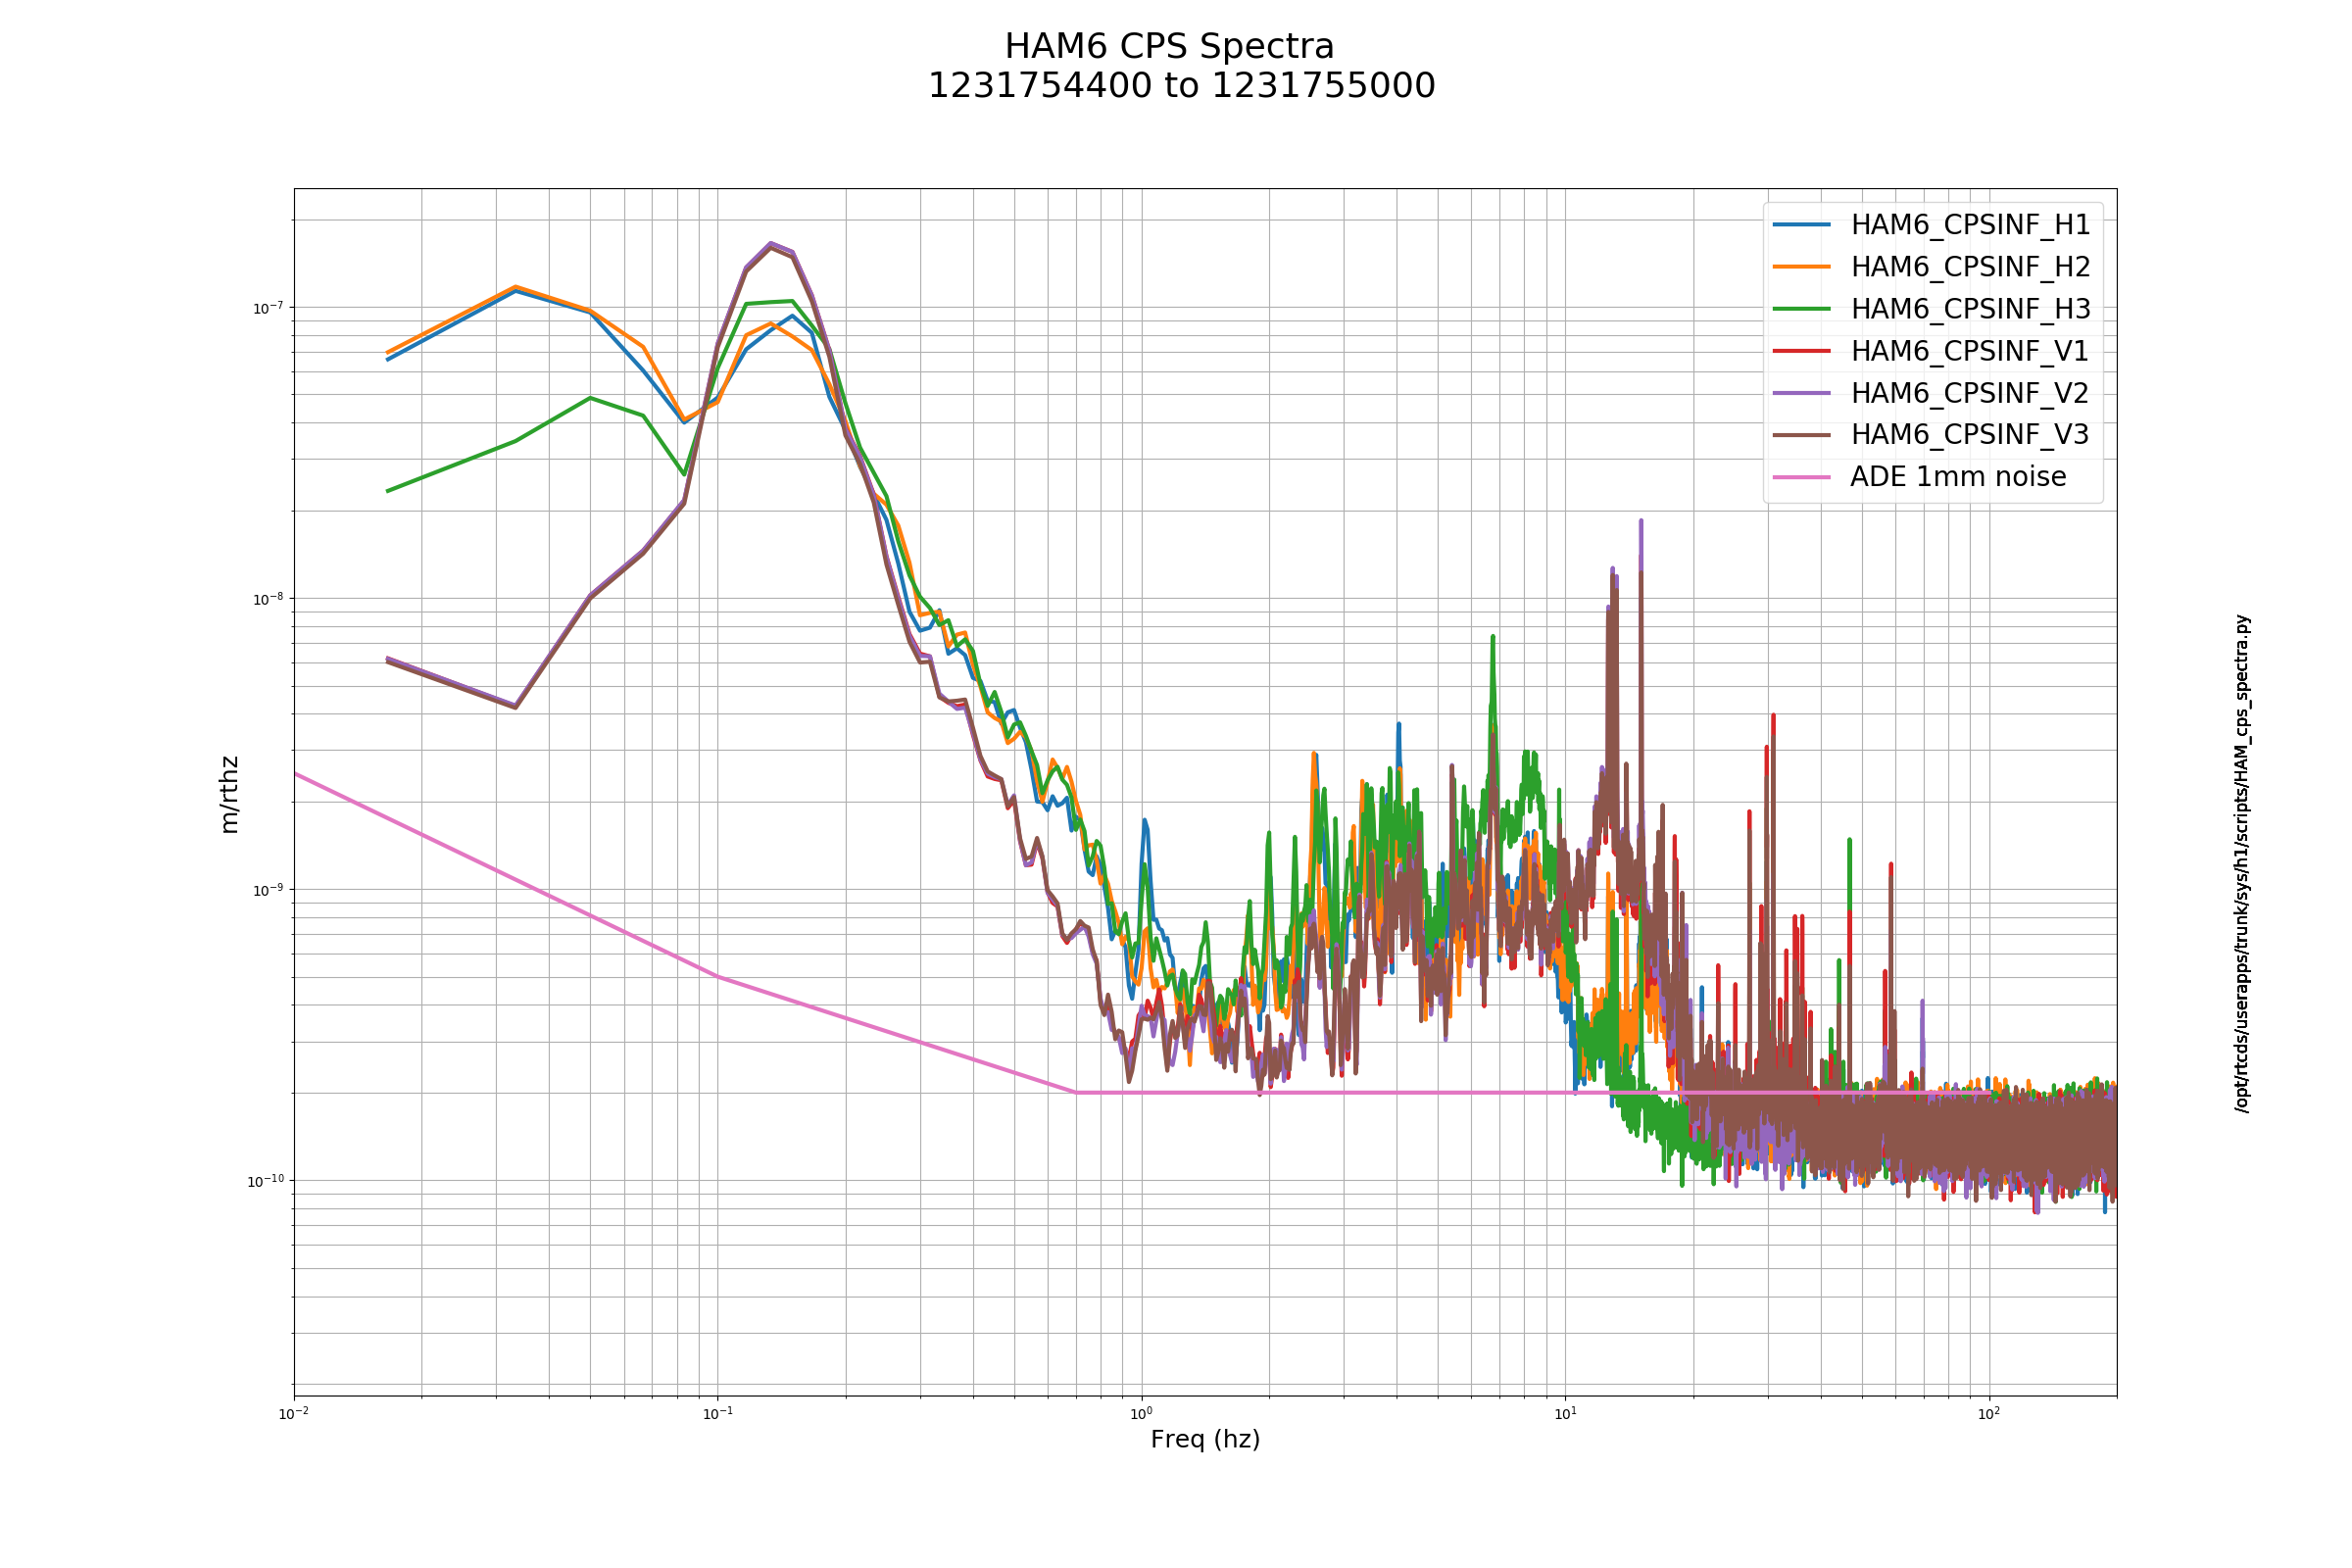
H1 ISI CPS Noise Spectra Check - Weekly: FAMIS Task 8087
Images attached to this report
H1 SQZ (SQZ)
lisa.barsotti@LIGO.ORG - posted 14:01, Thursday 17 January 2019 (46504)
Simple H1 range projections with squeezing

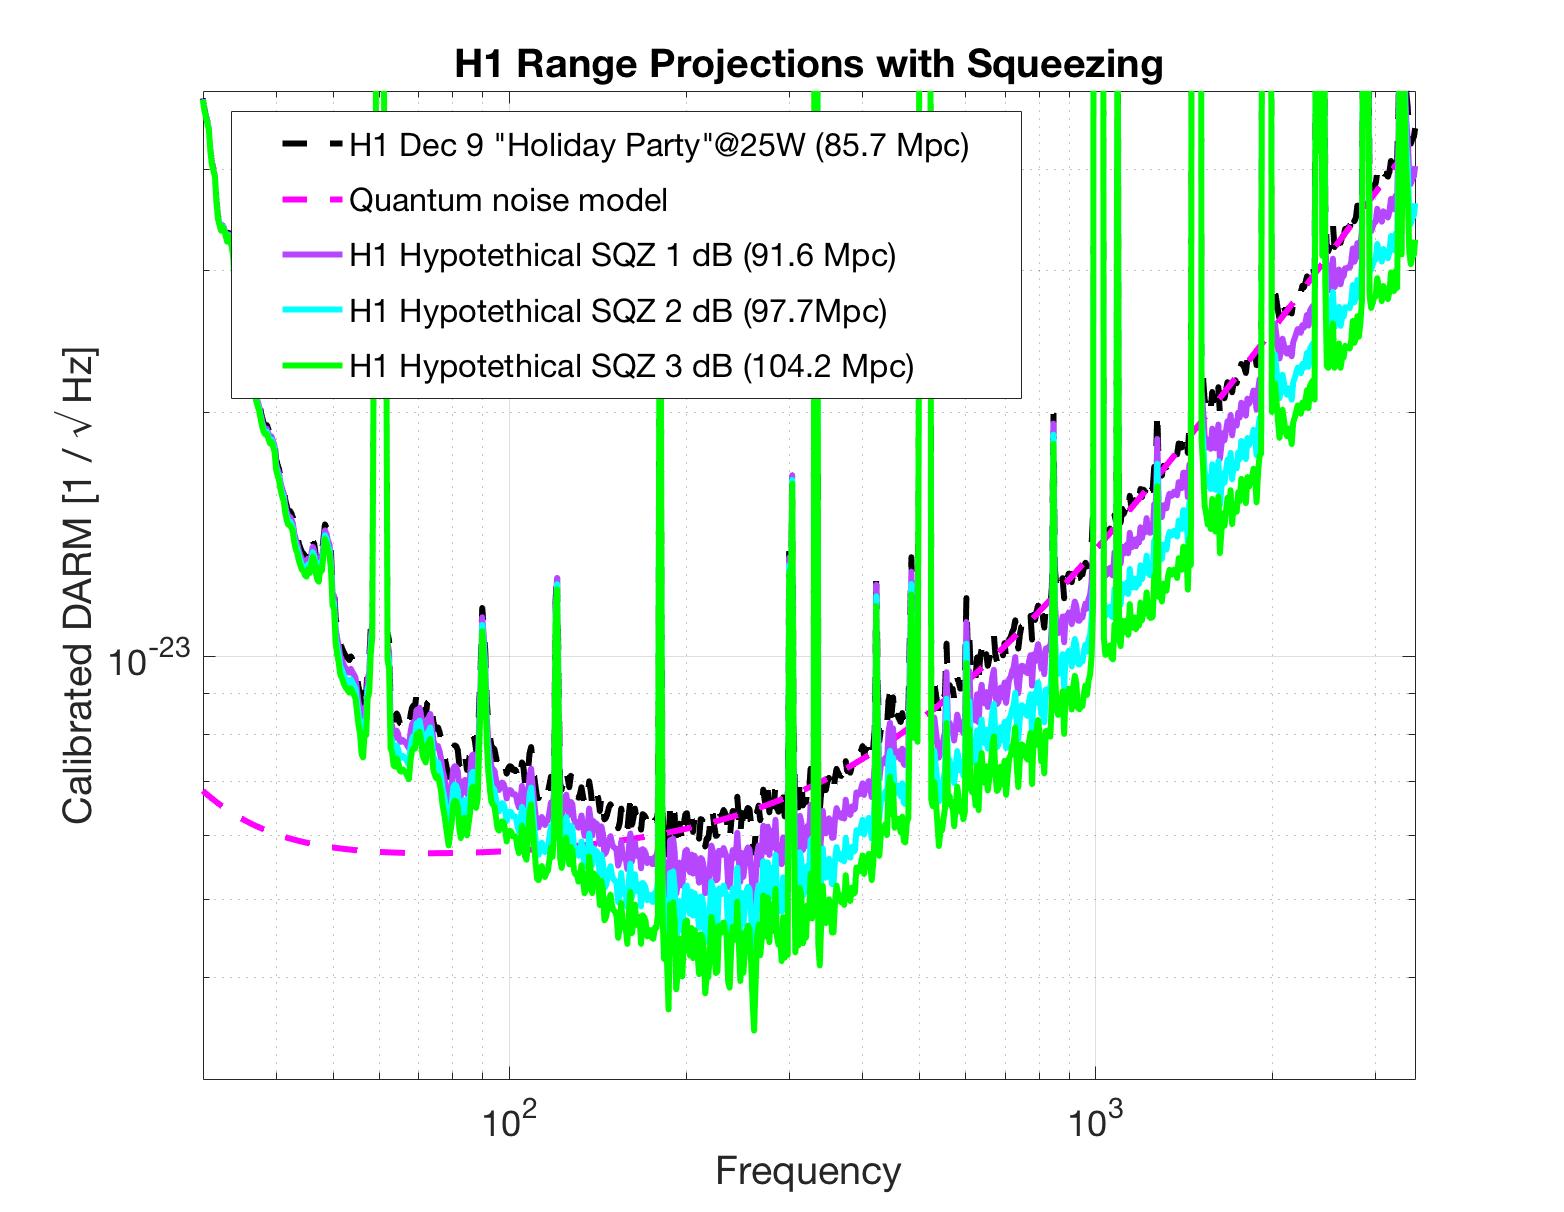
I have been asked what would be the H1 range operating close to the best performance seen so far, with squeezing injected. Here I quantitatively improve my immediate answer ("not 120 Mpc"). 

I made a very simple projection by rescaling an approximate H1 shot noise model by 1, 2 or 3 dB of squeezing (I ignored radiation pressure here). To be clear: the squeezing projection doesn't rely on any loss model, I am only showing the improvement for these hypothetical levels of measured squeezing.

Data set: I used the Dec 9 "Holiday Party" data (200s starting at 2018-12-09T2:45UTC) assumed H1 was shot noise limited around 1 kHz and matched a gwinc model to shot noise. Jeff kindly provided the calibration to convert H1:CAL-DELTAL_EXTERNAL_DQ to strain (with some uncertainty ~10%). At that time SensMon was reporting 90 Mpc - gwinc on averaged data gives, as usual, 5% less range (~86 Mpc).

The plot shows a:

Images attached to this report
H1 CAL (CAL, CDS)
jeffrey.kissel@LIGO.ORG - posted 12:40, Thursday 17 January 2019 (46508)
More Bug Fixes in Conditioning / Smoothing of Time Dependent Correction Factors of Calibration
J. Kissel, (and remotely, J. Betzwieser)
WP 8054

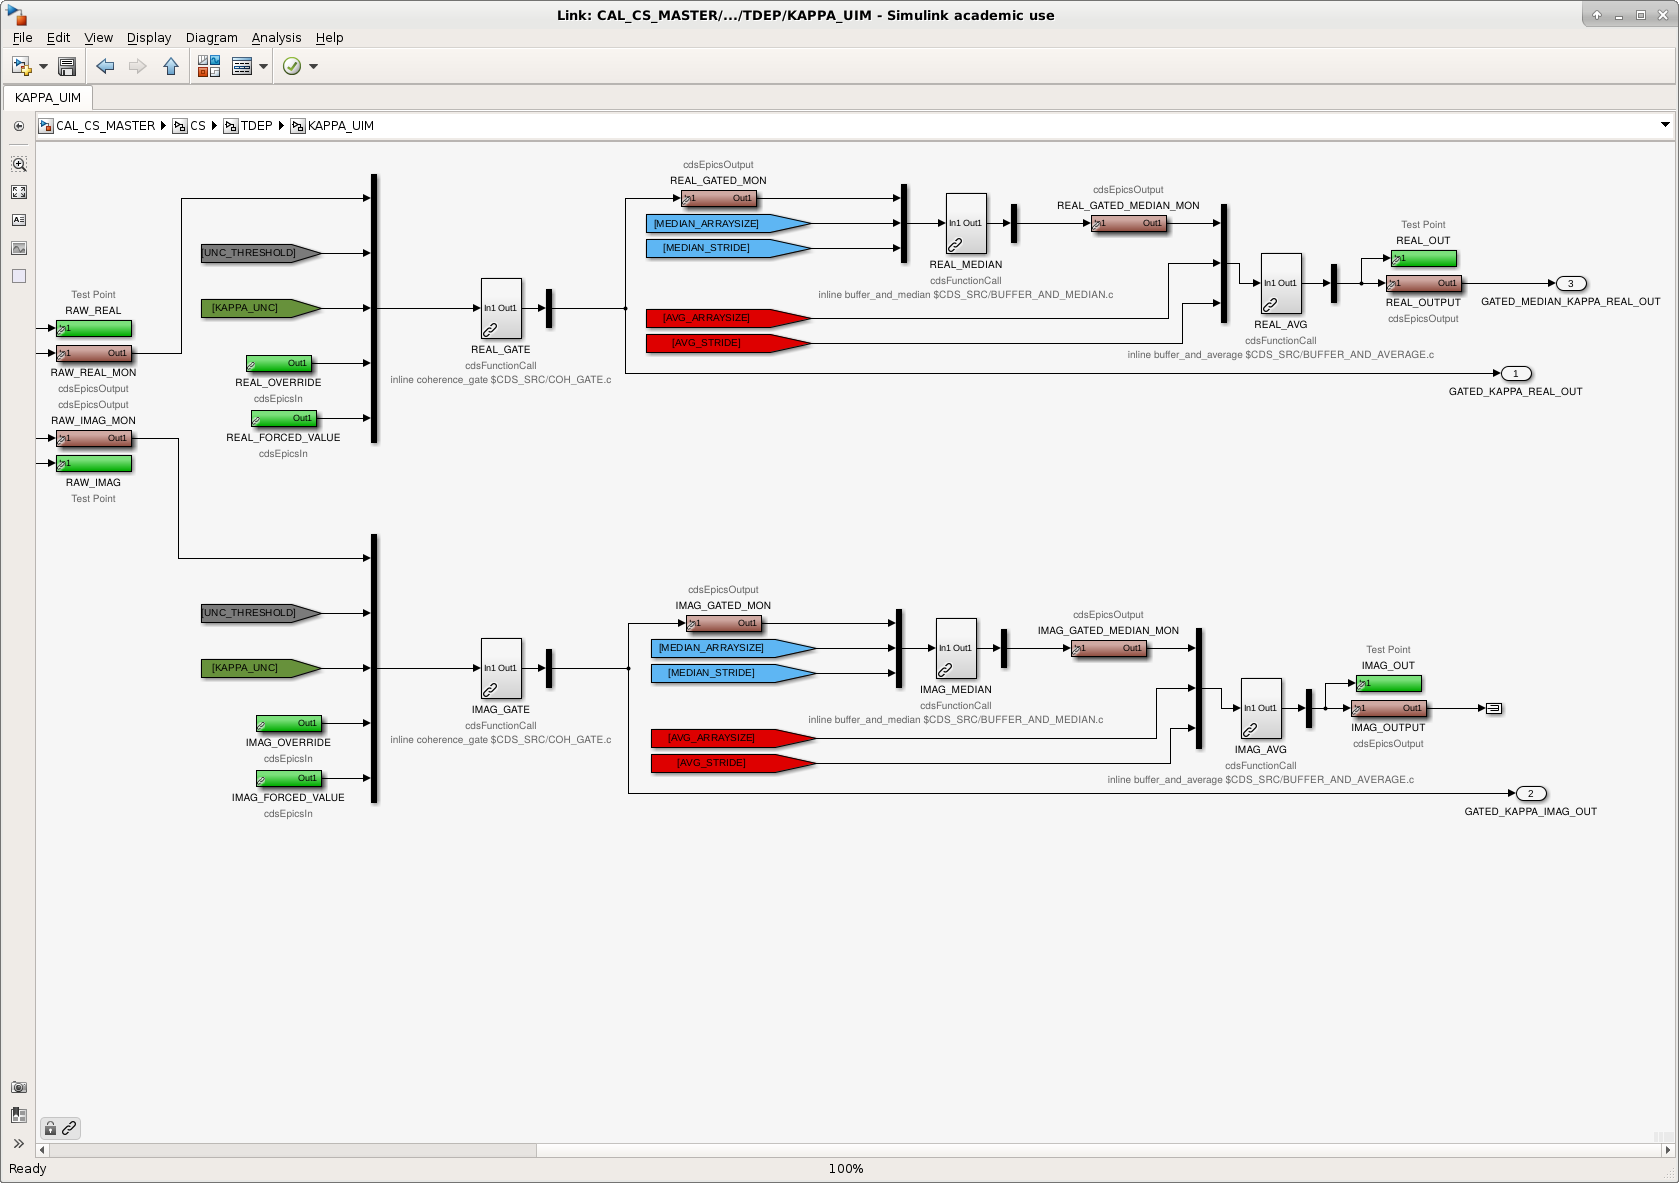
Joe had identified some further bugs in the user-developed code that conditions the time-dependent correction factors calculated in front-end calibration pipeline, namely:
 - the median-ing function,
    /opt/rtcds/userapps/release/cds/common/src/BUFFER_AND_MEDIAN.c
 - and the average-ing function,
    /opt/rtcds/userapps/release/cds/common/src/BUFFER_AND_AVERAGE.c
and their calls and parameters inputs to them in the TDEP block of the front-end code library part,
    /opt/rtcds/userapps/release/cal/common/models/CAL_CS_MASTER.mdl

Check out the details in LLO aLOG LLO aLOG 42794.

I've svn up'd the above mentioned codes and part, and have installed them, rebooting the h1calcs model. This did NOT require a DAQ restart. 

Stay tuned for confirmation of goodness (though Joe confirms that things look good at LLO after these changes).
Images attached to this report
H1 ISC
sheila.dwyer@LIGO.ORG - posted 12:27, Thursday 17 January 2019 - last comment - 17:04, Tuesday 22 January 2019(46507)
9 MHz RIN measurement

Jenne Sheila

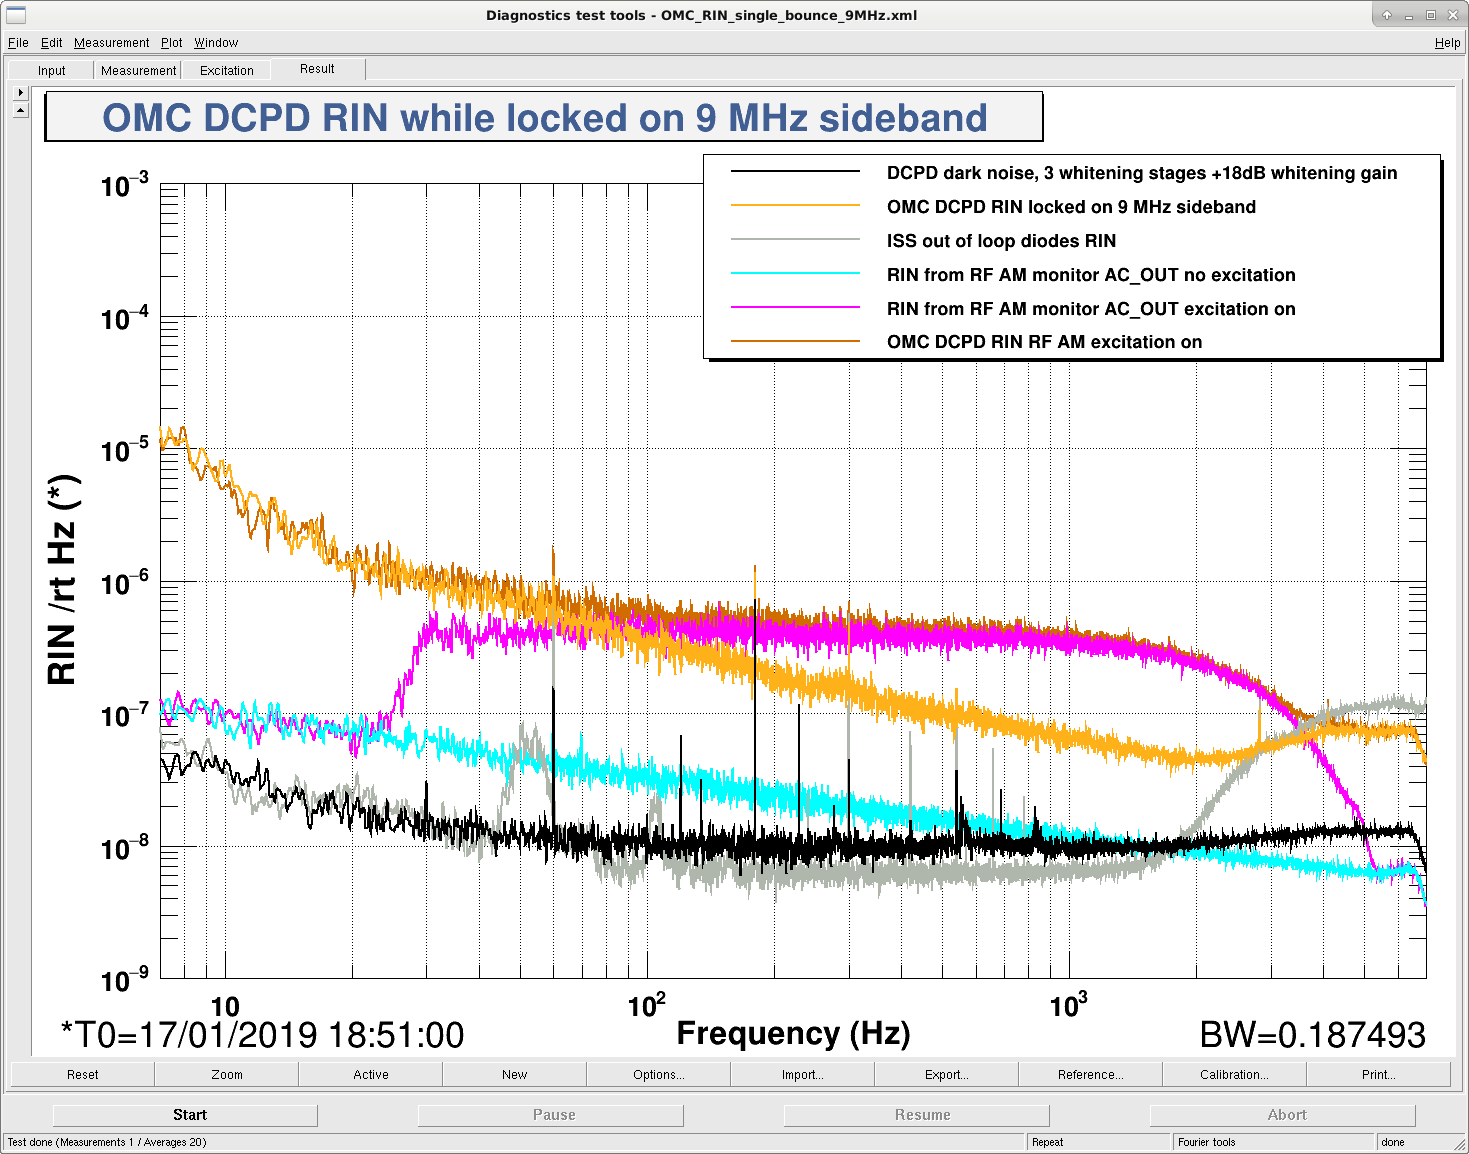
Summary:

We measured the RIN on the 9 MHz sideband 00 mode through the OMC, and see that it is about a factor of 10 higher than the RIN predicted by the RF AM monitor.  

Details:

The first time I tried this measurement, we were limited by the OMC DCPD dark noise 46197.  These are the steps we followed this time:

The OMC DCPD signals (and dark noise) are calibrated into RIN here taking into account the extra 18dB of whitening gain.  The EOM driver channel is normally calibrated into RIN assuming that the drive level is 17dBm according to Daniel, so this is divided by 3 because we are using 27dBm out of the EOM driver here. 

The measurement with the excitation on shows good agreement between the RF AM monitor and the measured amplitude noise, so these calibrations are OK.  We also have OK clearance above dark noise and the intensity noise seen by the ISS. So there is some additional source of intensity noise on the 9 MHz sidebands.  


Images attached to this report
Comments related to this report
koji.arai@LIGO.ORG - 15:51, Thursday 17 January 2019 (46515)

I was wondering what can add the RFAM more than we measure at the driver. Here are some speculations/thoughts

PeterF suggested (in an email) that the EOM matching circuit can pick up a stray radio field. If it is an ambient radio field, is the RF RIN gets better for a higher drive level (and worse for a lower level)? If the additional noise is proportional to the drive (i.e. the radiation is coming from the driver), the RIN is independent with the drive level. How can we add such a smooth broadband noise at the EOM...?

How about optical processes?
If the IMC PDH locking has the offset (e.g., due to static offset or rms offset by the AO path), this induces FM to AM conversion. Does the number make sense?
Is the modulation frequency matched with the IMC length? This can cause the modulation frequency noise to RFAM coupling.

---------

Note: The 9MHz drivers (see S1500125 or S1500126) cannot produce 27dB output. The 9MHz drivers saturate at about 24dBm setting. Of course, the injection is telling us the plot is true.

anamaria.effler@LIGO.ORG - 17:04, Tuesday 22 January 2019 (46584)

See equivalent L1 measurement in LLO alog 42928.

H1 CDS (PEM)
david.barker@LIGO.ORG - posted 11:51, Thursday 17 January 2019 - last comment - 14:50, Thursday 17 January 2019(46506)
BRS STS seismometers added to h1pemey, DAQ restarted

The STS seismometer located in the BRS enclosure at EY were added to h1pemey model. They have been top-named to retain their ISI subsystem association. The three channels were added to the DAQ at 256Hz acquisition rate

+: fast channel H1:ISI-GND_STS_ETMY_BRS_ENC_X_OUT_DQ added to the DAQ
+: fast channel H1:ISI-GND_STS_ETMY_BRS_ENC_Y_OUT_DQ added to the DAQ
+: fast channel H1:ISI-GND_STS_ETMY_BRS_ENC_Z_OUT_DQ added to the DAQ


h1pemey and DAQ were restarted.

Comments related to this report
jim.warner@LIGO.ORG - 14:50, Thursday 17 January 2019 (46510)PEM, SEI

These channels are the revived versions of the STS in the BRSY enclosure. Last I check the DOFs for these channels still weren't wired to agree with the ground STS outside the enclosure, but Robert said he would sort that out for me while he was at EY this afternoon. Currently, the BRS_ENC_X is ETMY_Y, BRS_ENC_Y is ETMY_Z and BRS_ENC_Z is ETMY_X, so this data won't be easy to deal with until the wiring gets fixed.

H1 General
cheryl.vorvick@LIGO.ORG - posted 10:25, Thursday 17 January 2019 (46502)
OPS Morning Update:

TITLE: 01/17 Day Shift: 16:00-00:00 UTC (08:00-16:00 PST), all times posted in UTC
STATE of H1: Commissioning
OUTGOING OPERATOR: None
CURRENT ENVIRONMENT:
    Wind: 10mph Gusts, 8mph 5min avg
    Primary useism: 0.09 μm/s
    Secondary useism: 0.77 μm/s
QUICK SUMMARY:

H1 DAQ (DAQ)
stefan.countryman@LIGO.ORG - posted 09:33, Thursday 17 January 2019 (46500)
Found a couple of minor Timing System MEDM issues, fixed one (needs SVN commit)

Yasmeen Asali, Dave Barker, Jamie Rollins

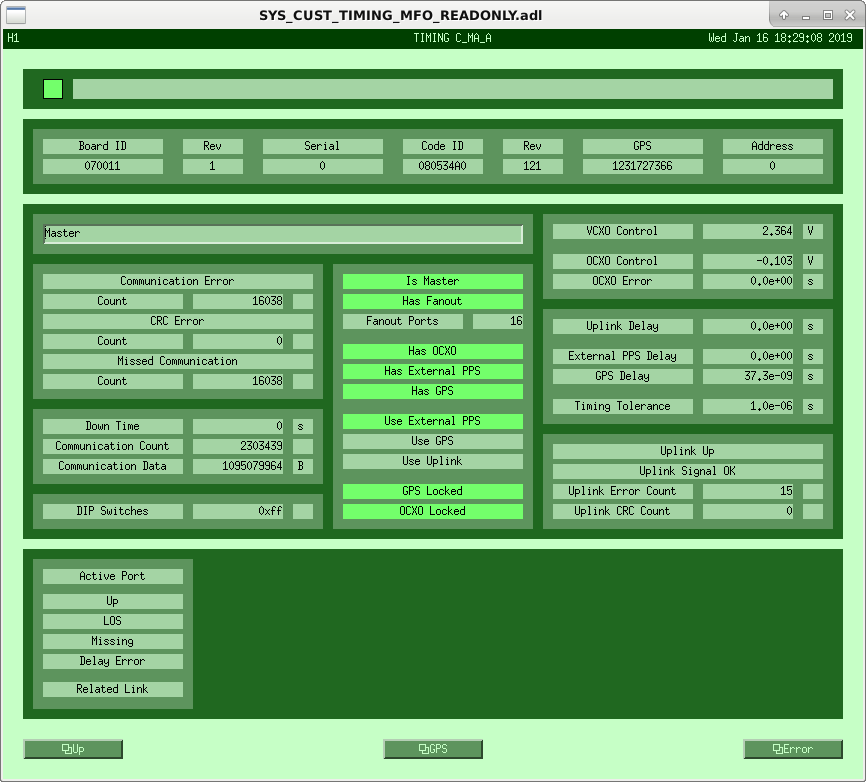
We found two problems with the Timing System MEDM screens:

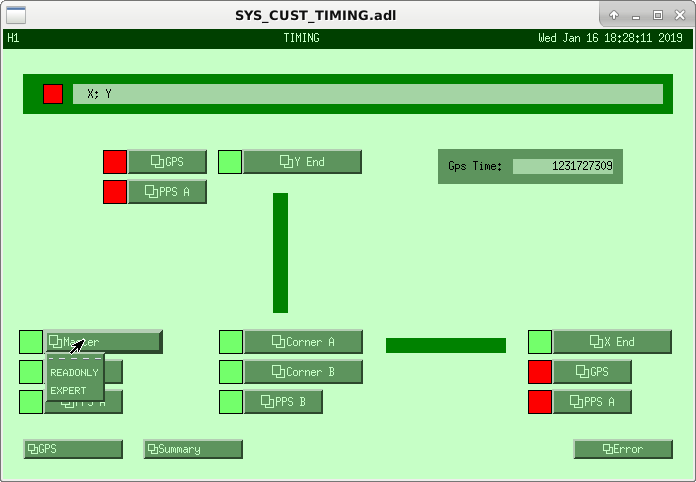
  1. Yasmeen noticed that the Timing Master in READONLY mode will not display any of the fiber ports at the bottom. In EXPERT mode, the ports do display. Strangely, this is not a problem on the RemoteMEDM viewer. This should probably be fixed, though it is not a high priority obviously. Screenshots of one of the differences attached as well as a picture of the READONLY/EXPERT option button.
  2. I noticed that the 1PPS summary pages still had the wrong labels. I fixed this in the MEDM macros but could not SVN commit due to permissions. If you could commit this, I'd appreciate it! (Attempted) commit message below:

Update 1PPS Second Labels in MEDM summary screens

The 1PPS Summary screens, accessible at the bottom of the Timing overview
MEDM screen (SYS_CUST_TIMING.adl), had incorrect descriptions for the
1PPS timing diagnostic signals. The following screens under the summary
button have been fixed:

MSR Comparator/Frequency Counter
CER Comparator/Frequency Counter
EX Comparator/Frequency Counter
EY Comparator/Frequency Counter
--This line, and those below, will be ignored--

M    SYS_CUST_TIMING_MSR_CFC_macro.txt
M    SYS_CUST_TIMING_CER_CFC_macro.txt
M    SYS_CUST_TIMING_XEND_CFC_macro.txt
M    SYS_CUST_TIMING_YEND_CFC_macro.txt


Images attached to this report
H1 DAQ (DAQ)
stefan.countryman@LIGO.ORG - posted 09:14, Thursday 17 January 2019 (46499)
Went to EX to check GPS Clock antenna cable type

Ana, Yasmeen, Madox, Richard McCarthy

H1 PSL (PSL)
peter.king@LIGO.ORG - posted 08:10, Thursday 17 January 2019 - last comment - 17:55, Thursday 24 January 2019(46498)
FSS measurements (continued)
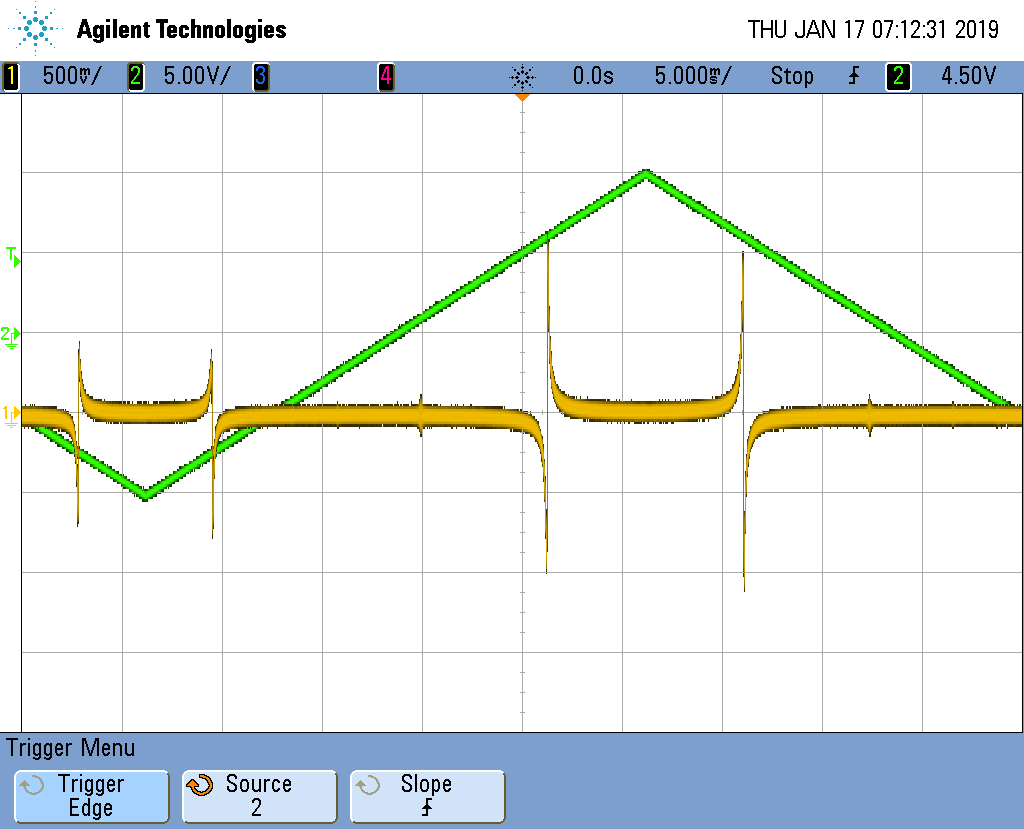
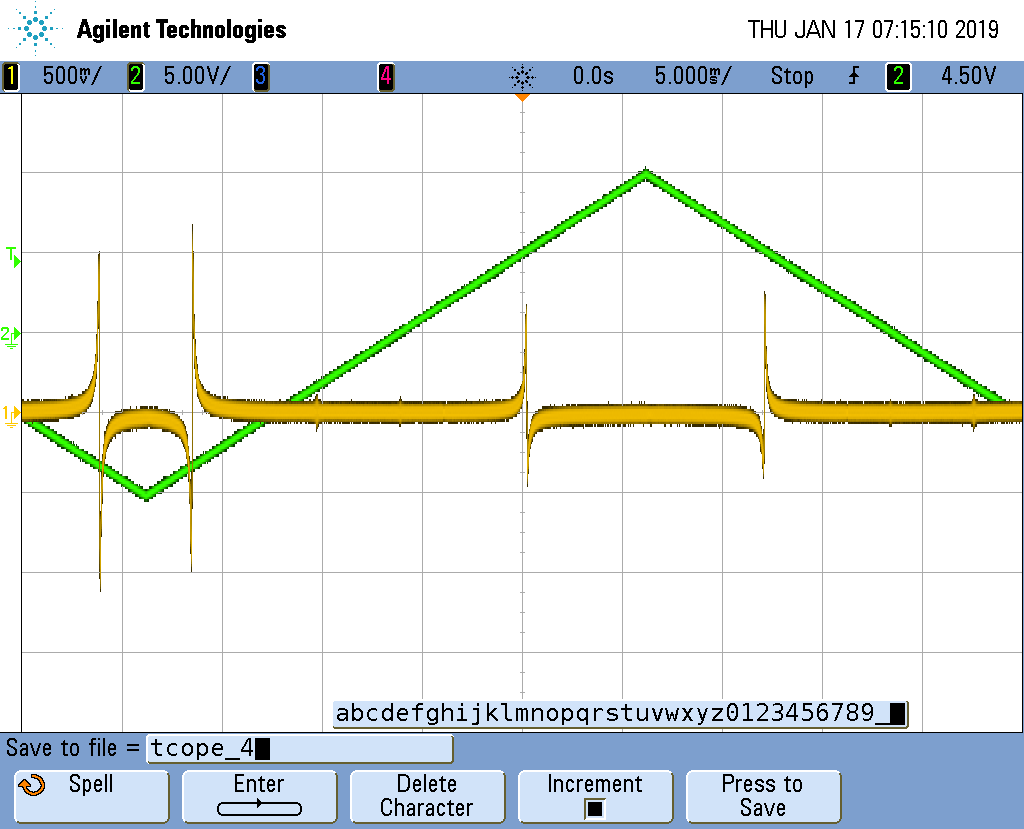
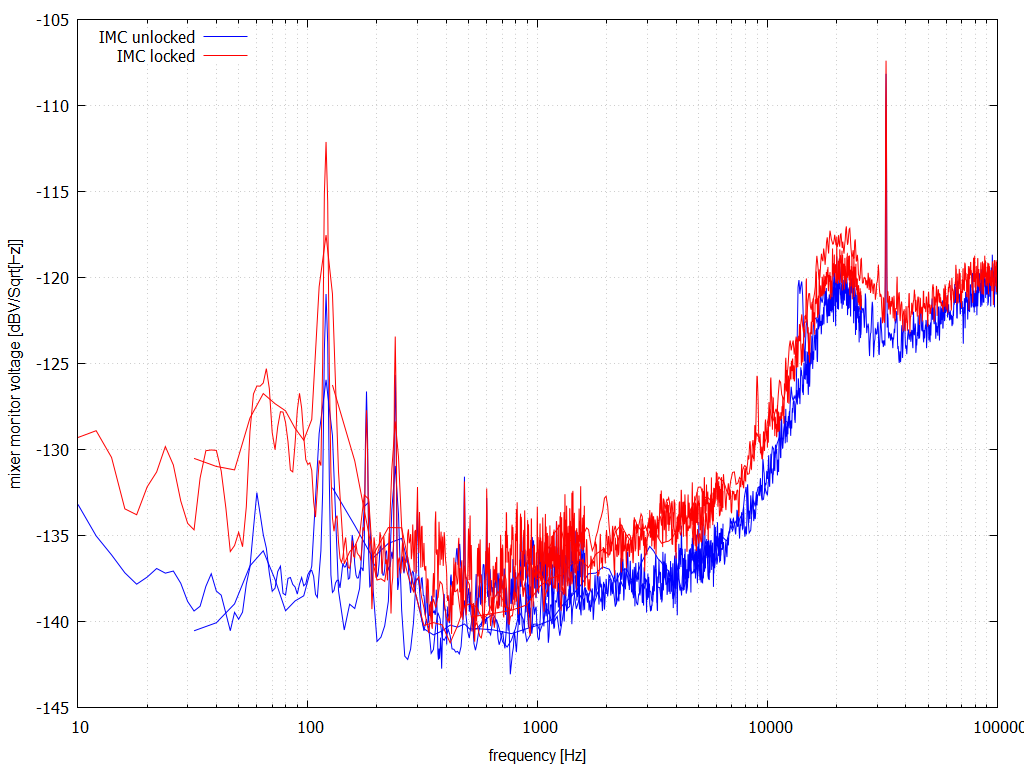
Following on from yesterday's attempt.  I made transfer function and spectra measurements with the input modecleaner locked and
unlocked.  In summary, there wasn't too much difference in the noise spectra above 100 kHz with the input modecleaner locked
or unlocked.

    Attached are transfer function measurements when the input mocdecleaner was unlocked and locked respectively (IMCULKD1.tif,
IMCLKD1.tif).  The noise spectra measurements are IMCULN1.tif and IMCLN1.tif respectively.  The mixer calibration was measured
to be 1.93/77.4 V/kHz.

    More to follow ...
Images attached to this report
Comments related to this report
peter.king@LIGO.ORG - 11:44, Thursday 17 January 2019 (46503)
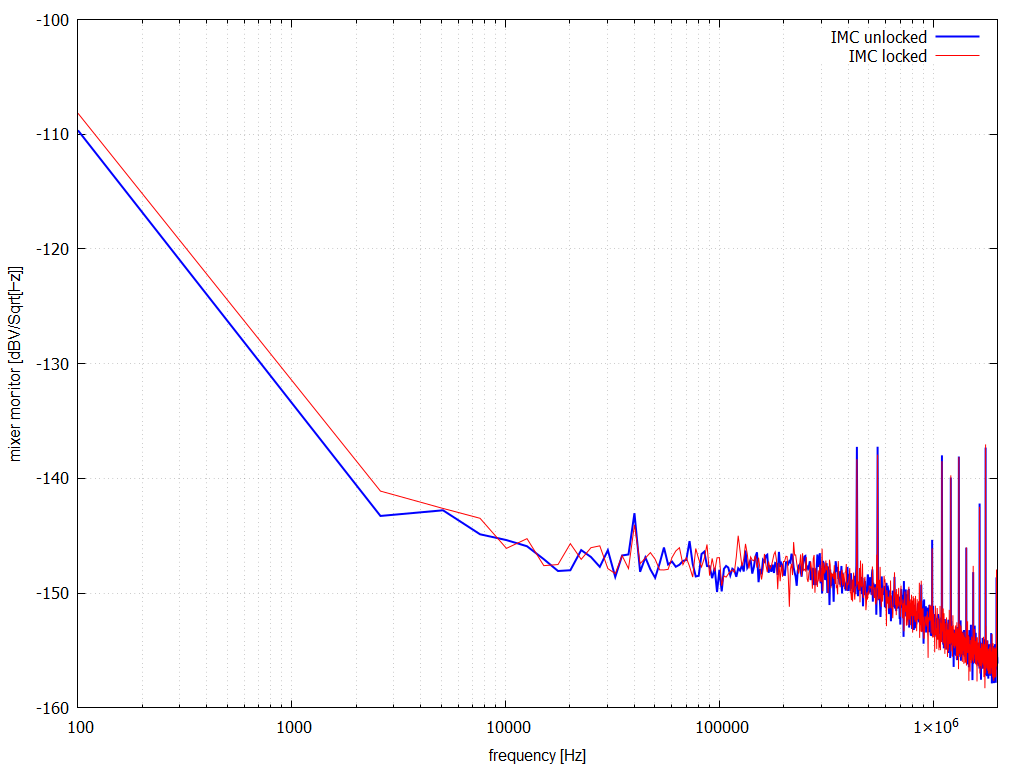
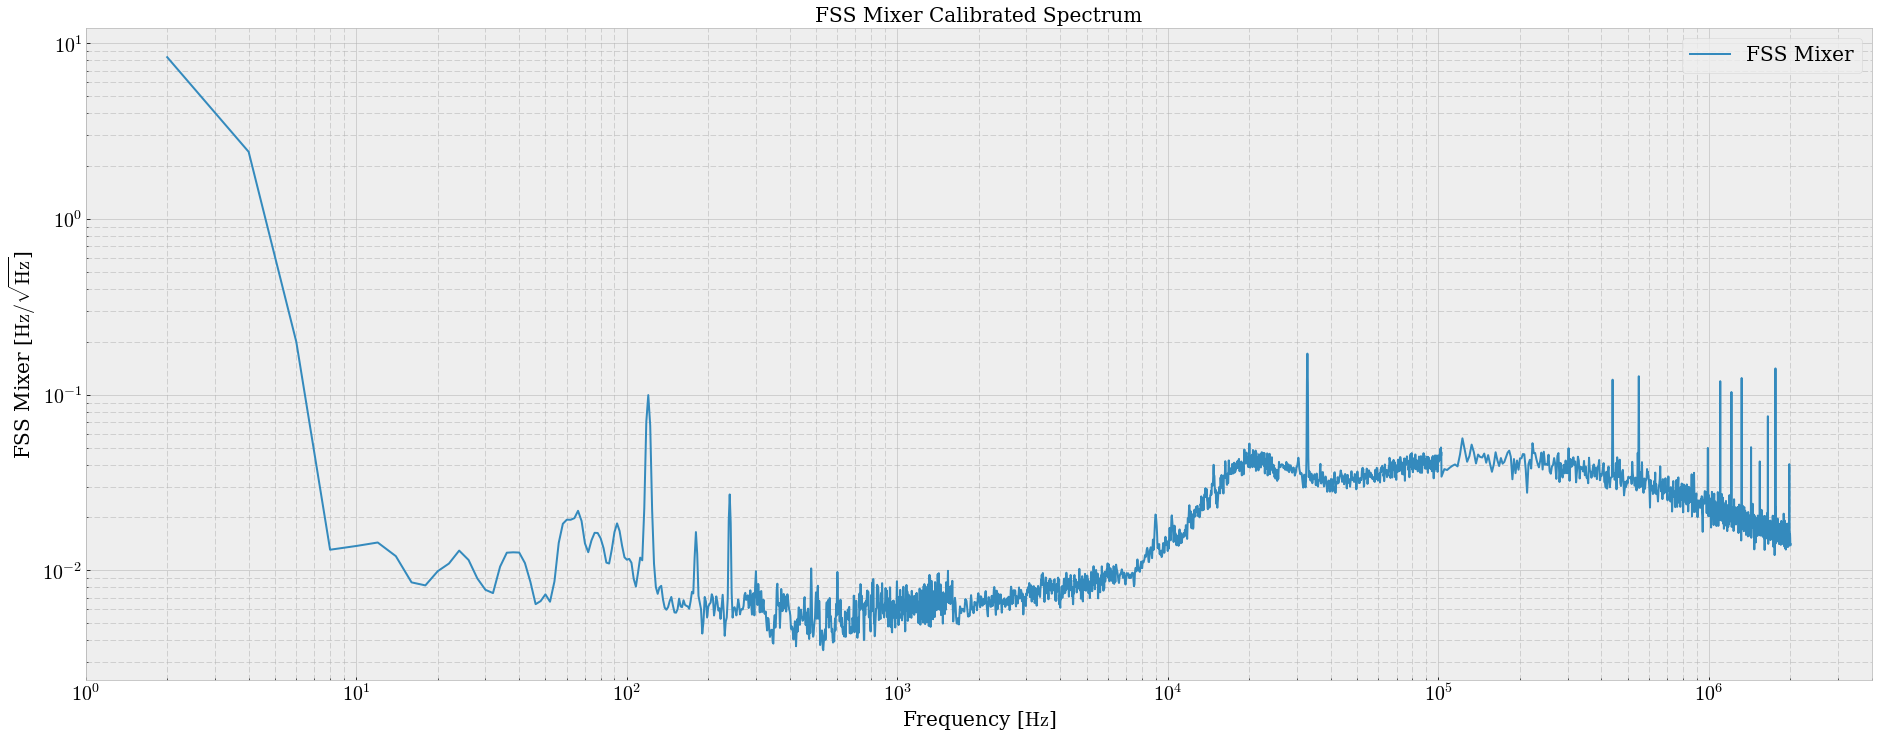
mxr_imc.txt: FSS mixer monitor signal from 100 Hz to 2 MHz, measurement taken with 4395A and active probe
             plotted as hfmxr.png

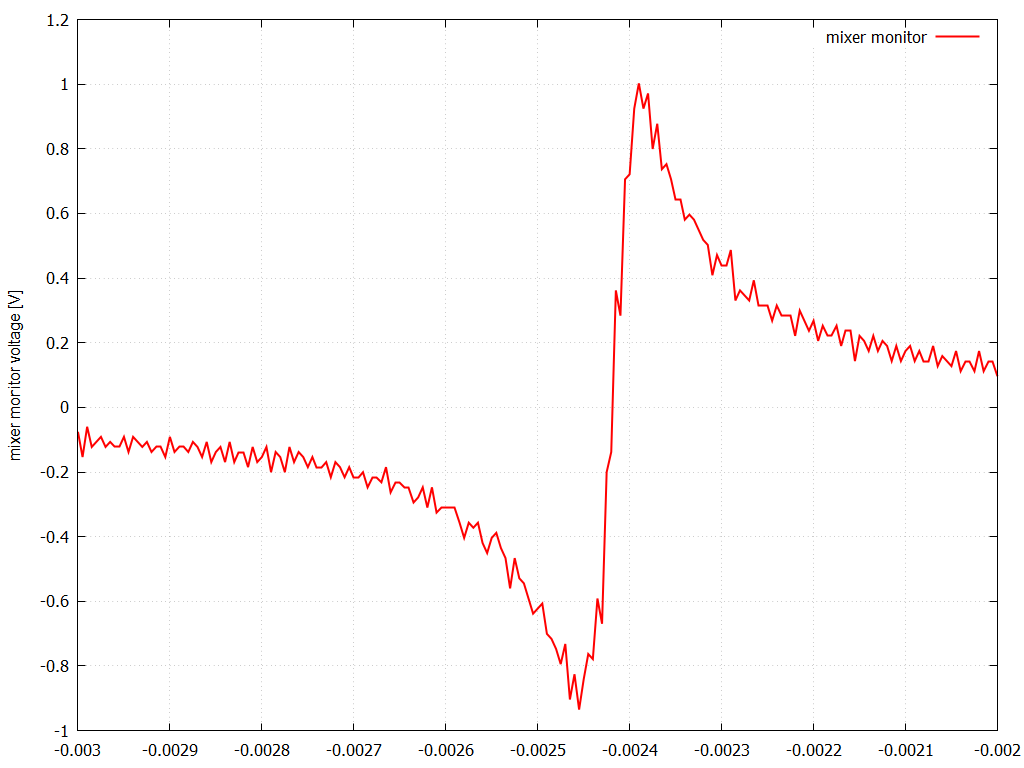
c1.txt: mixer monitor signal at the carrier, zoomed in
        plotted as carrier.png

MXR[1-4].txt and MXRIMCL[1-4].txt: FSS mixer monitor signal from 10 Hz to 100 kHz, measurement taken on
                                   SR7855, plotted as mxr.png
Images attached to this comment
Non-image files attached to this comment
craig.cahillane@LIGO.ORG - 17:55, Thursday 24 January 2019 (46631)
I stitched and calibrated Peter's FSS mixer data with IMC locked from the SR785 and Agilent together, multiplying the Agilent spectrum by a factor of 25 to get them to match up.
Images attached to this comment
H1 ISC (ISC)
craig.cahillane@LIGO.ORG - posted 04:35, Thursday 17 January 2019 - last comment - 11:37, Friday 18 January 2019(46495)
Locking tonight
Koji, Craig

- We ran the RF9 modulation depth change test Sheila asked us to do.  Koji will post an alog about those results.

- Koji had me lock the OMC with PZT2 at only 2 volts, rather than the usual ~40 V, for +9MHz 9th order HOM considerations.

- We measured the PRCL OLG after full thermalization at high power, and got a 30 Hz UGF.  This seems much lower than what was reported by Jenne a week ago.

- I carried the laptop in with me as I made my way down to the PSL racks.  
This time, I was able to make it without causing a lockloss, but when I got there the SR785 GPIB was gone, and when going to get it from the squeezer bay, while walking between HAM2 and HAM3 I killed the lock.
The area directly in front of the door in the LVEA, between HAM2 and HAM3, is the most sensitive to walking around, according to IMC_F.  Stepping on the lower tier floor directly inside of the LVEA door seemed to produce the largest response in IMC_F, including during my first excursion to the PSL racks.

- We reached nominal low noise again, but lost it within ten minutes, probably due to some CHARD, DHARD pitch ringup.  

- We reach NLN a third time, and this time held it for two hours, during which I was able to get to the PSL racks and measure all CARM spectra.  We eventually lost lock due to a super slowly growing ASC 0.9 Hz oscillation (lost lock about an hour after the ringup started).

- Had to readjust TMSY alignment in pitch significantly to get the guardian to continue locking in FIND_IR.
Comments related to this report
koji.arai@LIGO.ORG - 05:17, Thursday 17 January 2019 (46496)

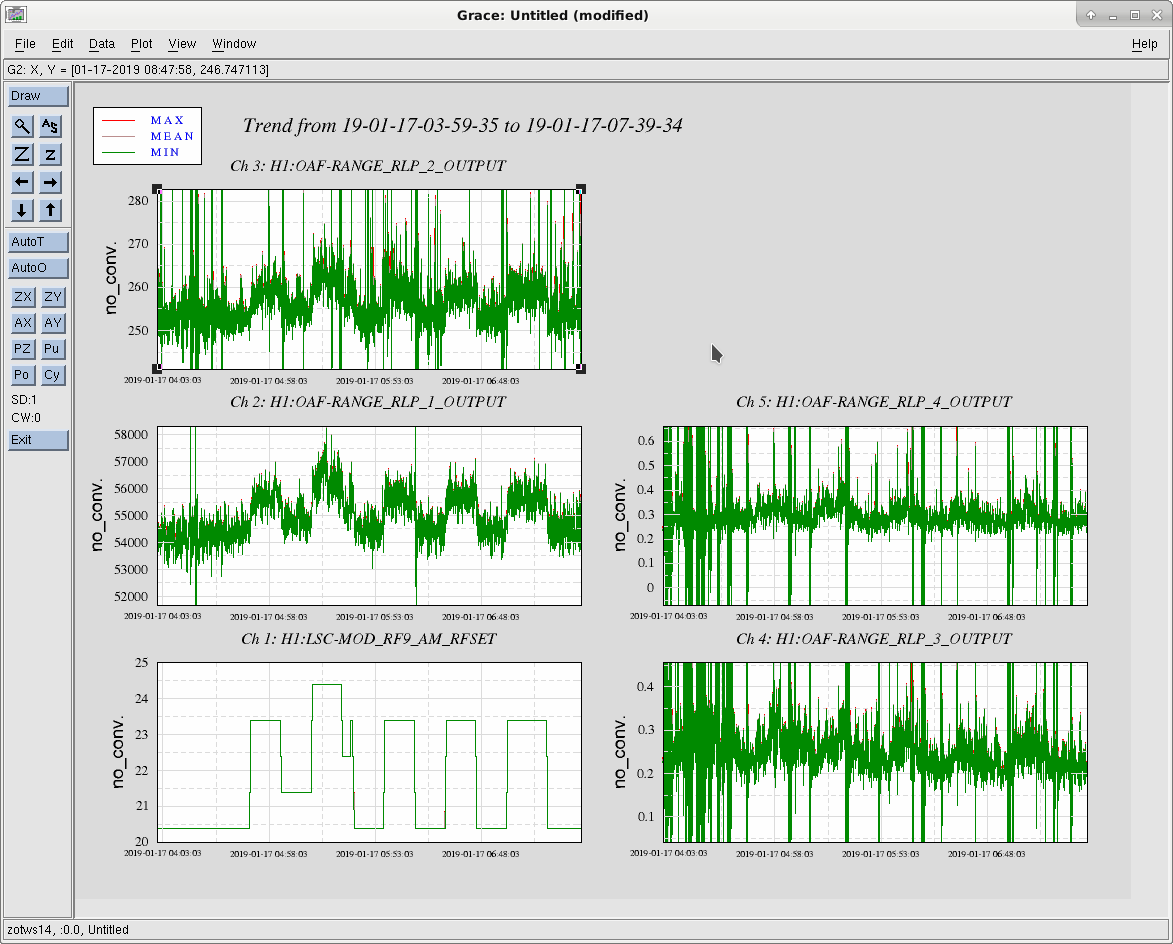
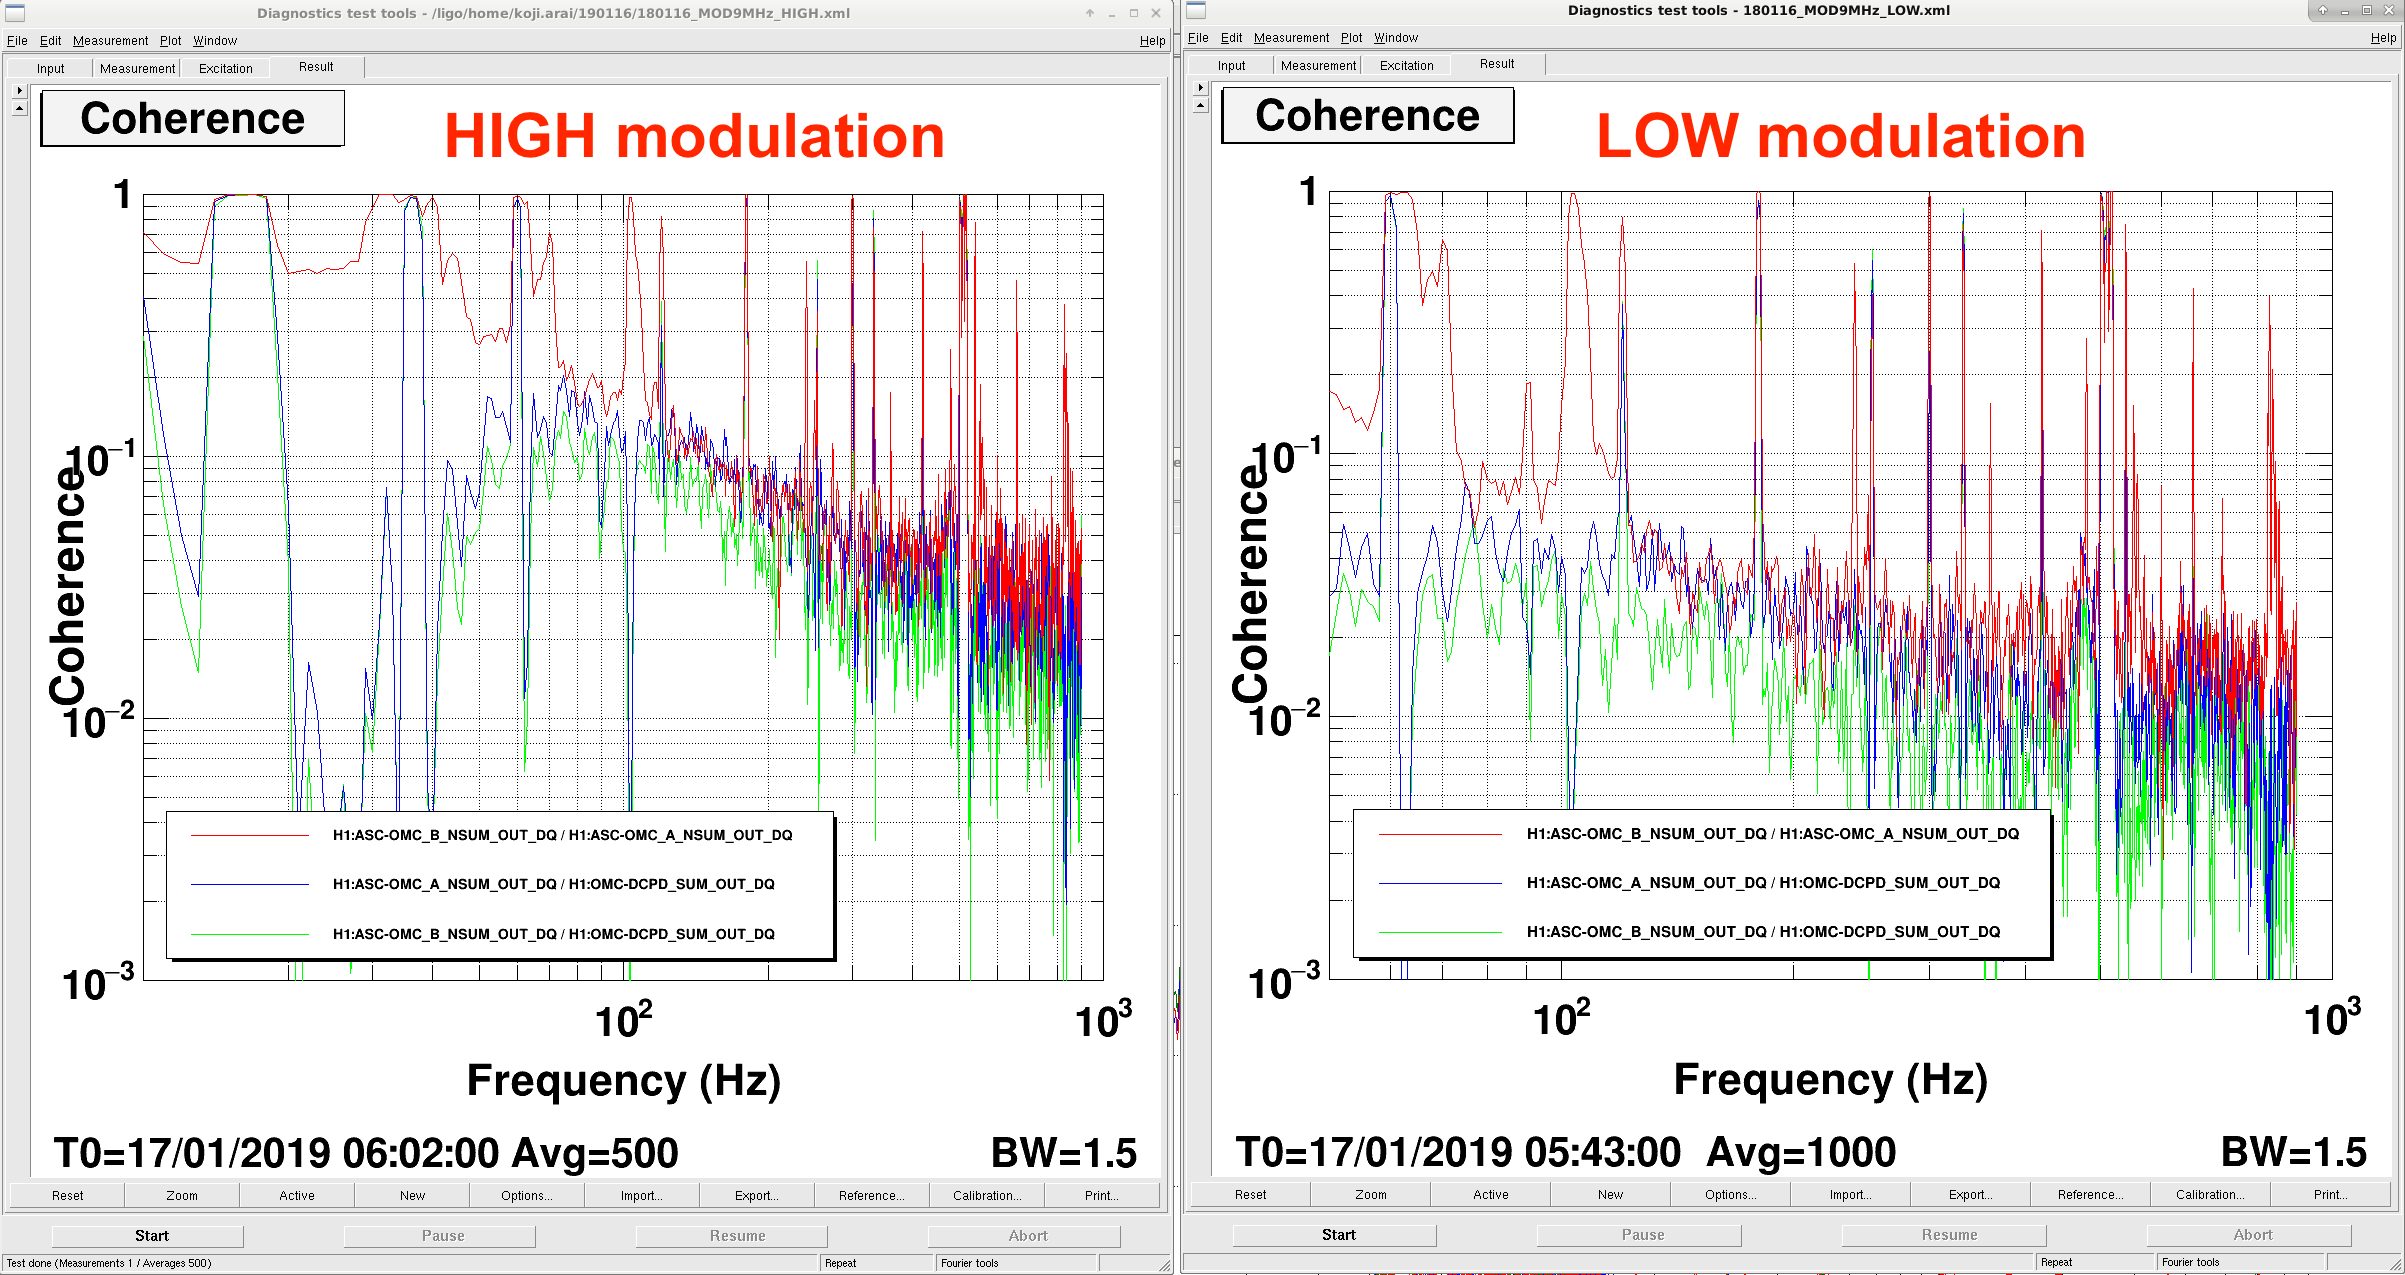
We started the modulation of the modulation depth from 4:48 UTC. I'd say the data from 5:43 UTC is clean. (Attachment 1 Left Bottom Plot). The modulation power for 9MHz was switched between 20.4dBm (LOW) and 23.4dBm (HIGH). We could clearly see that the DARM noise power in each monitored frequency band (Other plots in Attachment 1, RLP1: 10-20Hz, RLP2 20-29Hz, RLP3 38-60Hz, RLP4 60-100Hz, RLP5 100-450Hz). Interestingly, the change of the noise power is visible even at the lower frequency (10-20Hz) although the change is small (~4%) and difficult to confirm with the power spectrum.

The coherence between DCPDSUM and OMC QPDs (as well as the coherence between the QPDs) were measured both in the HIGH and LOW states.

Attachment 2:
High modulation depth: 17/1/2019 6:02:00 UTC~ 1HzBW 500AVG
Low modulation depth: 17/1/2019 6:15:00 UTC~ 1HzBW 500AVG

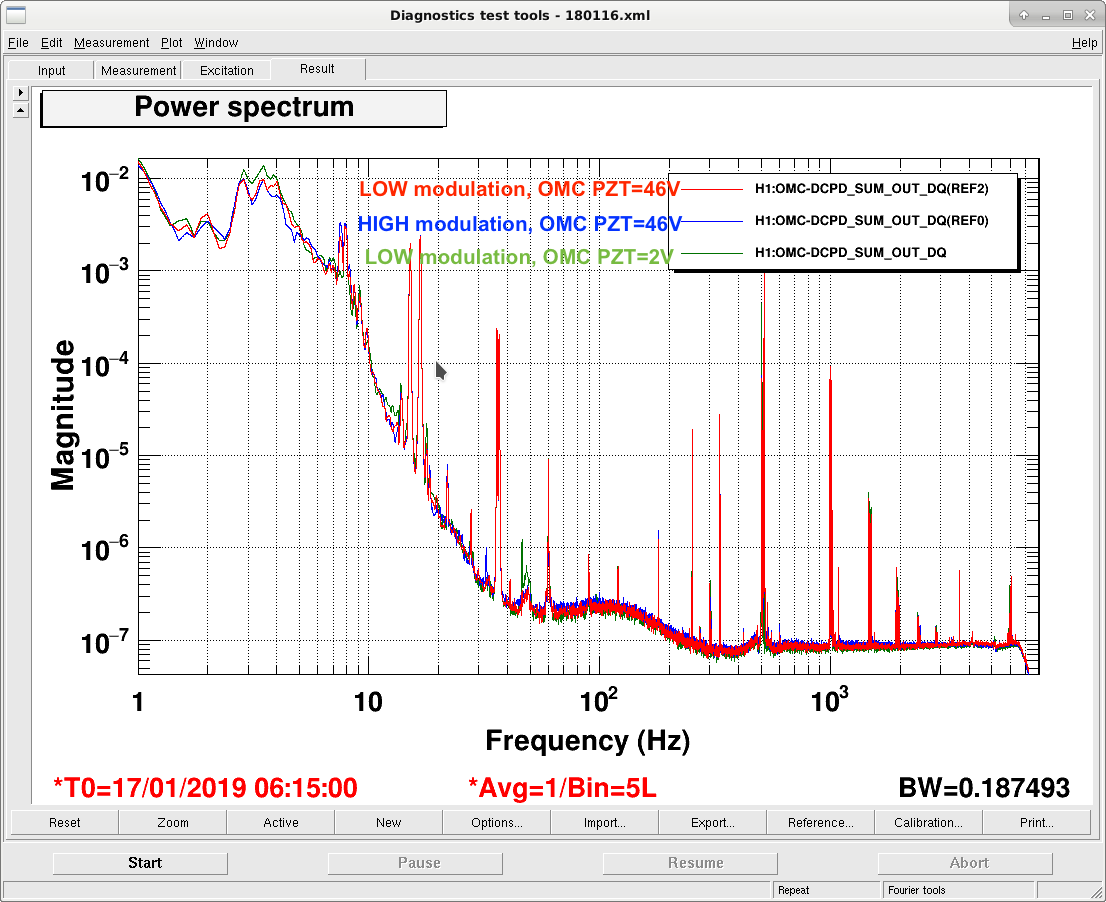
The comparison of the OMC DCPD spectra (=DARM) is shown in Attachment 3. Here we added another plot with the low modulation and OMC PZT Voltage around 0 (i.e. One FSR away from the nominal locking point). This gave us ~85Mpc, probably because of slightly better rejection of 9MHz SB by the OMC (not so certain).

We took the relatively glitch free data for the high modulation state between 17/1/2019 7:01:45UTC~7:13:45UTC.

Images attached to this comment
koji.arai@LIGO.ORG - 17:02, Thursday 17 January 2019 (46517)

As the OMC QPD signal contains the carrier TEM00 too, the coherence between DCPD and QPDs can not be completely zero. I have not yet estimated the quantitative limit what the minimum coherence we can realize by eliminating the 9MHz noise.

sheila.dwyer@LIGO.ORG - 11:37, Friday 18 January 2019 (46529)

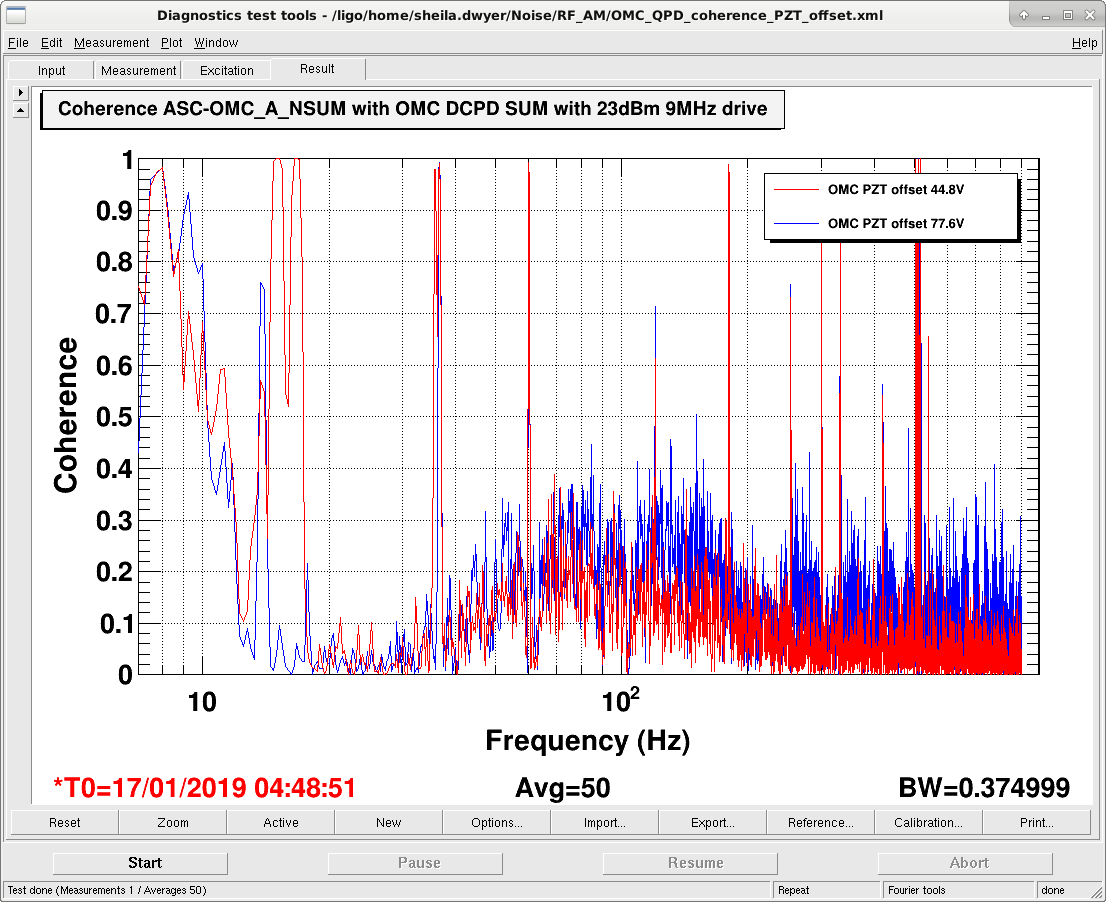
Here's a comparison of two times when the 9 MHz modulation depth was increased to have 23dBm at the driver, with different OMC PZT offsets. 

The first time is Jan 16th at 6:40:30 UTC, with an OMC PZT2 monitor readback of 77.6 V, the second time is Jan 17th at 4:48:51 UTC with PZT2 at 44.8 Volts. 

The coherence between the OMC QPD and the DCPD's is lower for the lower PZT voltage, which fits with Koji's model that the 9 MHz is reaching the DCPD's through the higher order mode which has an OMC resonance close to the carrier resonance.

Images attached to this comment
H1 ISC
daniel.sigg@LIGO.ORG - posted 16:37, Wednesday 16 January 2019 - last comment - 12:44, Thursday 17 January 2019(46482)
QPD calibration

Added a few filter modules to the ASC-OMC_A and ASC-OMC_B QPD segments to account for the calibration:

Comments related to this report
daniel.sigg@LIGO.ORG - 12:44, Thursday 17 January 2019 (46509)

WFS DC Calibration

Added new filter modules to the ASC-AS_A/B, ASC-REFL_A/B and ASC-POP_X WFS DC segments to account for the calibration:

  • FM5: "–20dB" is the inverse of the whitening gain that can be selected on the front panel of the WFS Interface chassis
  • FM6: "cts2V" calibrates counts into Volts 6.1035E-4
  • FM7: "trans" goes from Volts to Amps and is the inverse of the transimpedance gain. The later is 1000Ω including the differential amplifier.
  • FM8: "A2W" goes from Amps to Watts.
    • For an InGaAs diode at 1064nm this is 1/0.8 = 1.25 (used).
    • For a silicon diode at 532nm this is 1/0.3 =3.333.
    • For a silicon diode at 1064nm this is 1/0.16 = 6.25.
  • FM9: "milli" goes to mW (multiplies by 1000)

The front panel gains are set to high (+20dB) for the AS WFS, and low (0dB) for the others.

H1 ISC
sheila.dwyer@LIGO.ORG - posted 19:08, Monday 14 January 2019 - last comment - 11:46, Thursday 17 January 2019(46413)
HAM1 hepi injections

I did some injections on HAM1, for comparison with 42694 and 42722

I reduced the amplitude compared to 44856, so these excitations aren't showing up in DARM, but people can look for them in the REFL WFS and table top L4Cs.  

The Z excitation started at 2:11:50 UTC, was stopped after a large glitch at 2:23 UTC Jan 15th. 

The X excitation started at 2:27 UTC, but there were several large glitches.  a relative glitch free time was from 2:37-2:44, the excitation continued until 2:44 UTC. 

The Y excitation started at 2:55 UTC, and was on until 3:06.  We had to turn the dither lines back on partway through that because the PRC1Y was slowly going unstable. 

Comments related to this report
jenne.driggers@LIGO.ORG - 18:19, Tuesday 15 January 2019 (46454)

I know Gabriele is looking at how these compare H1 vs. L1, but just a preview of how much HAM1 motion is affecting our ASC signals...

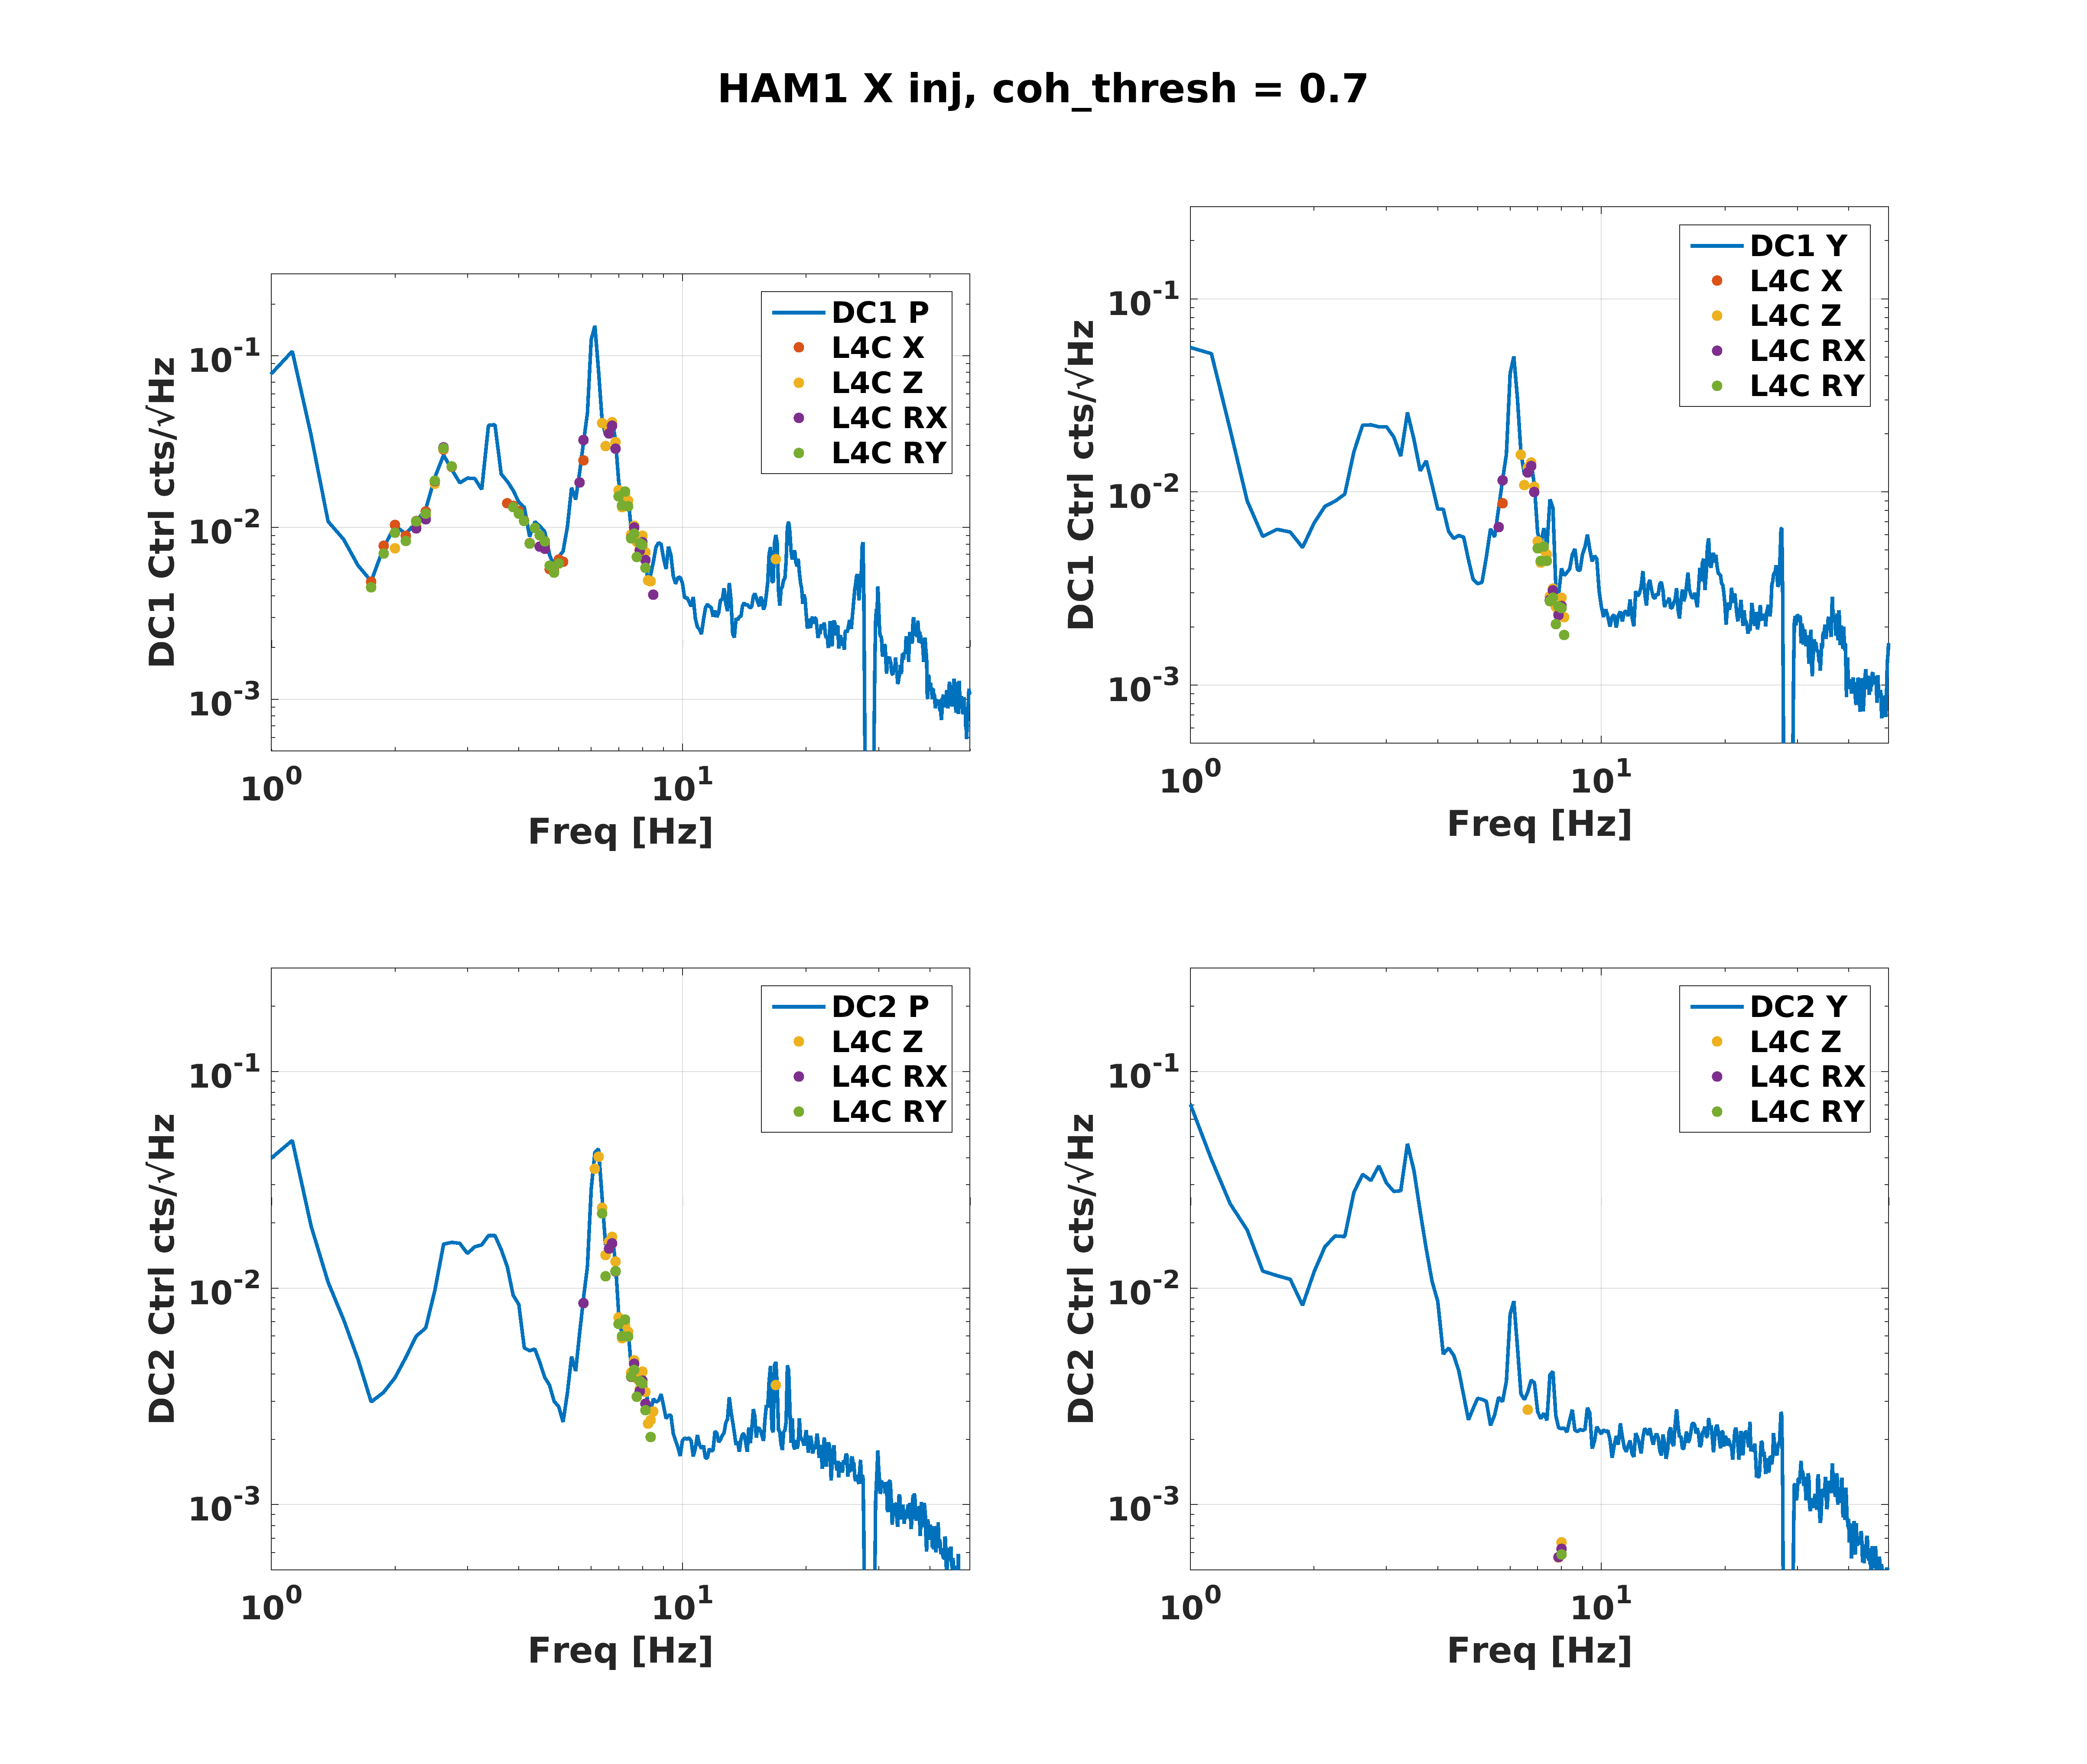
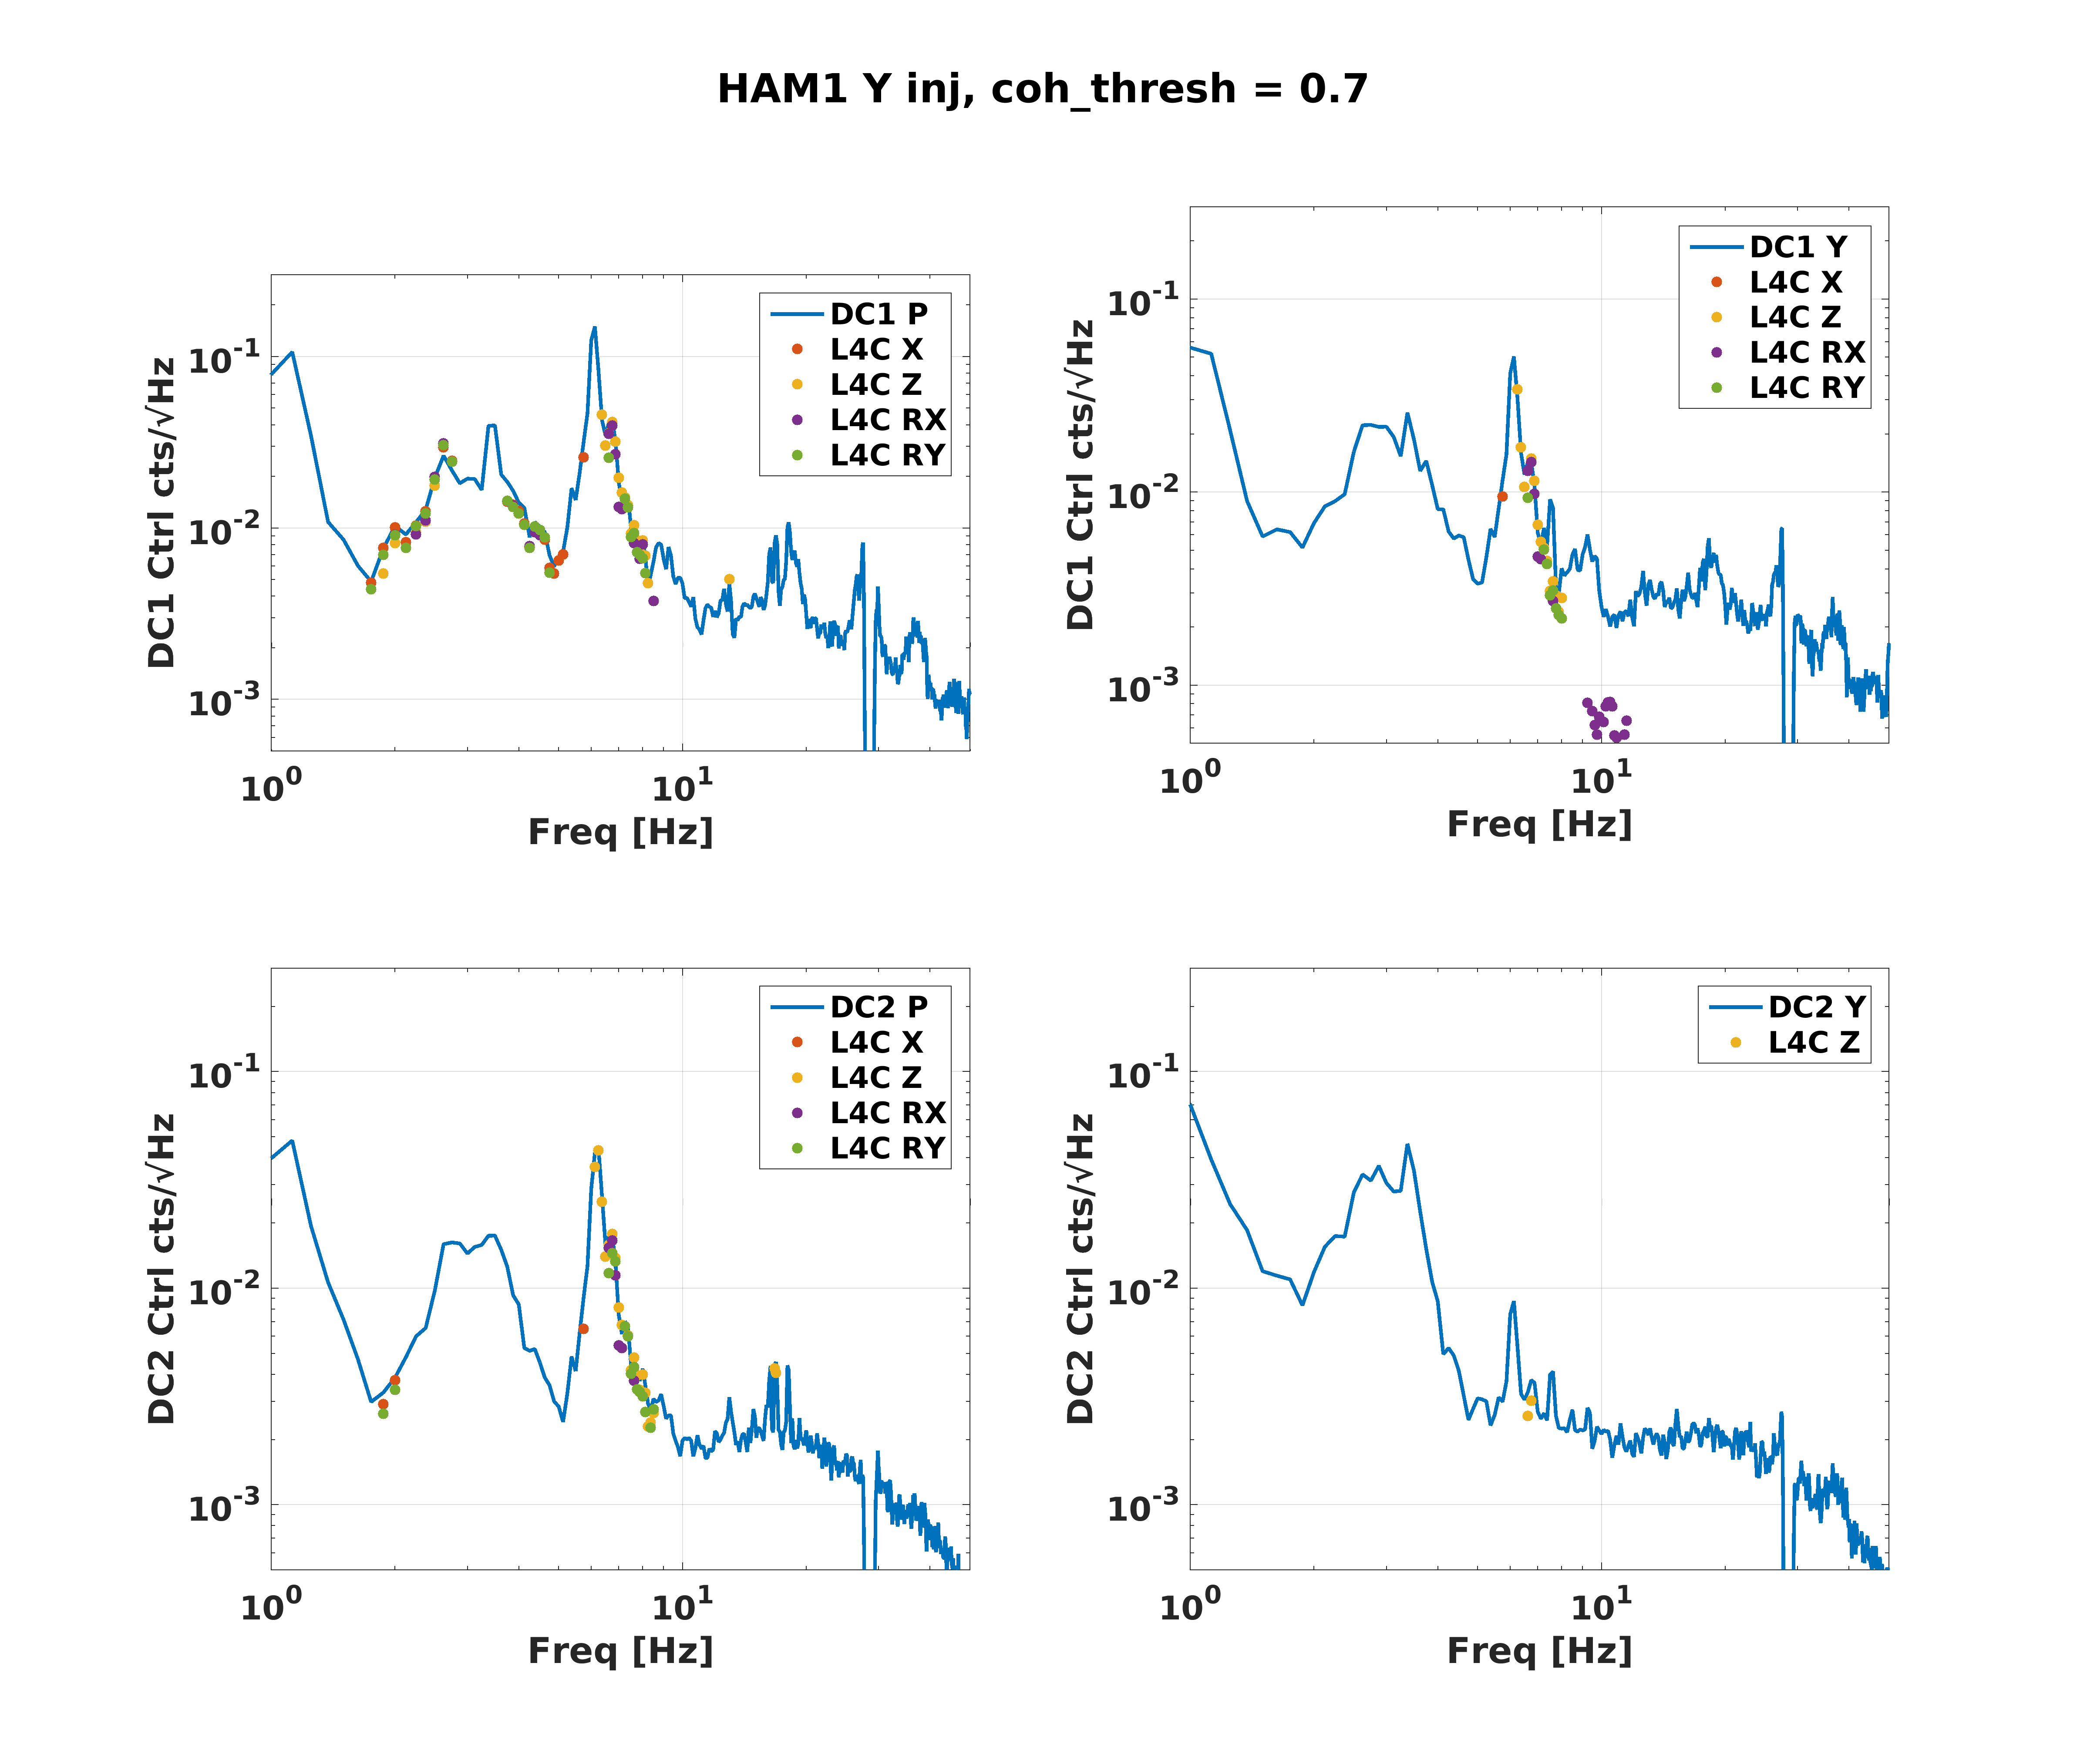
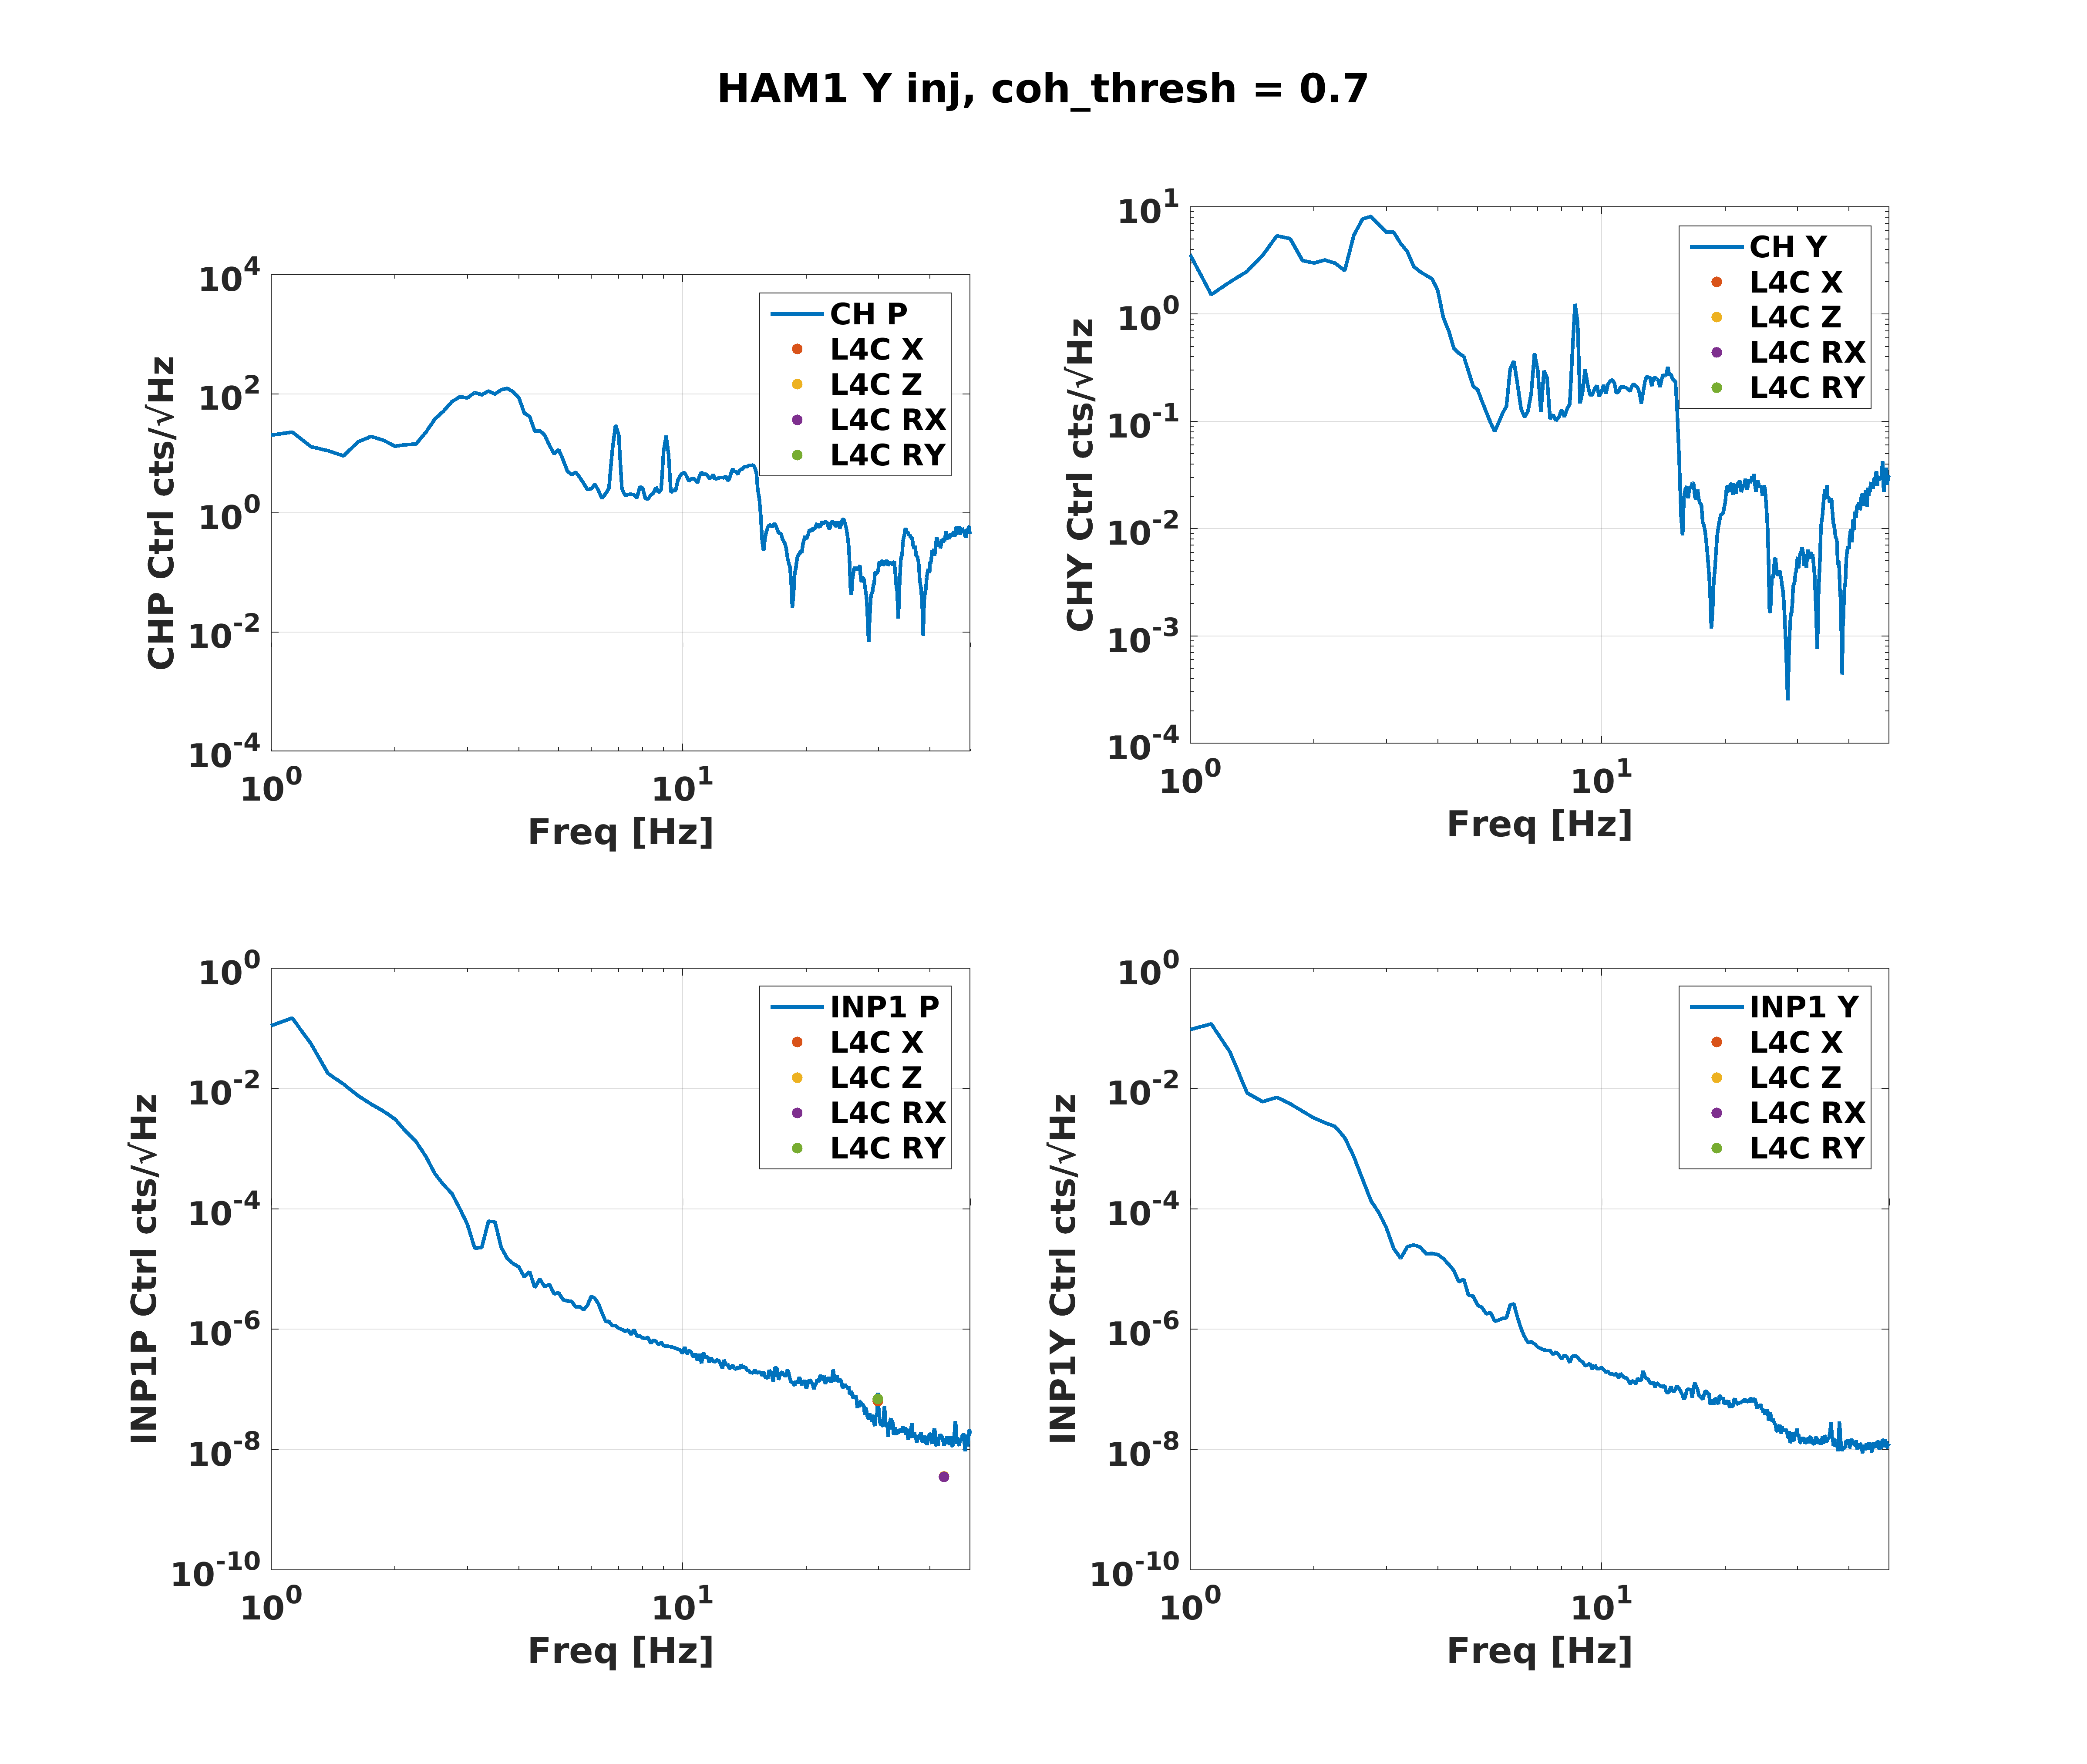
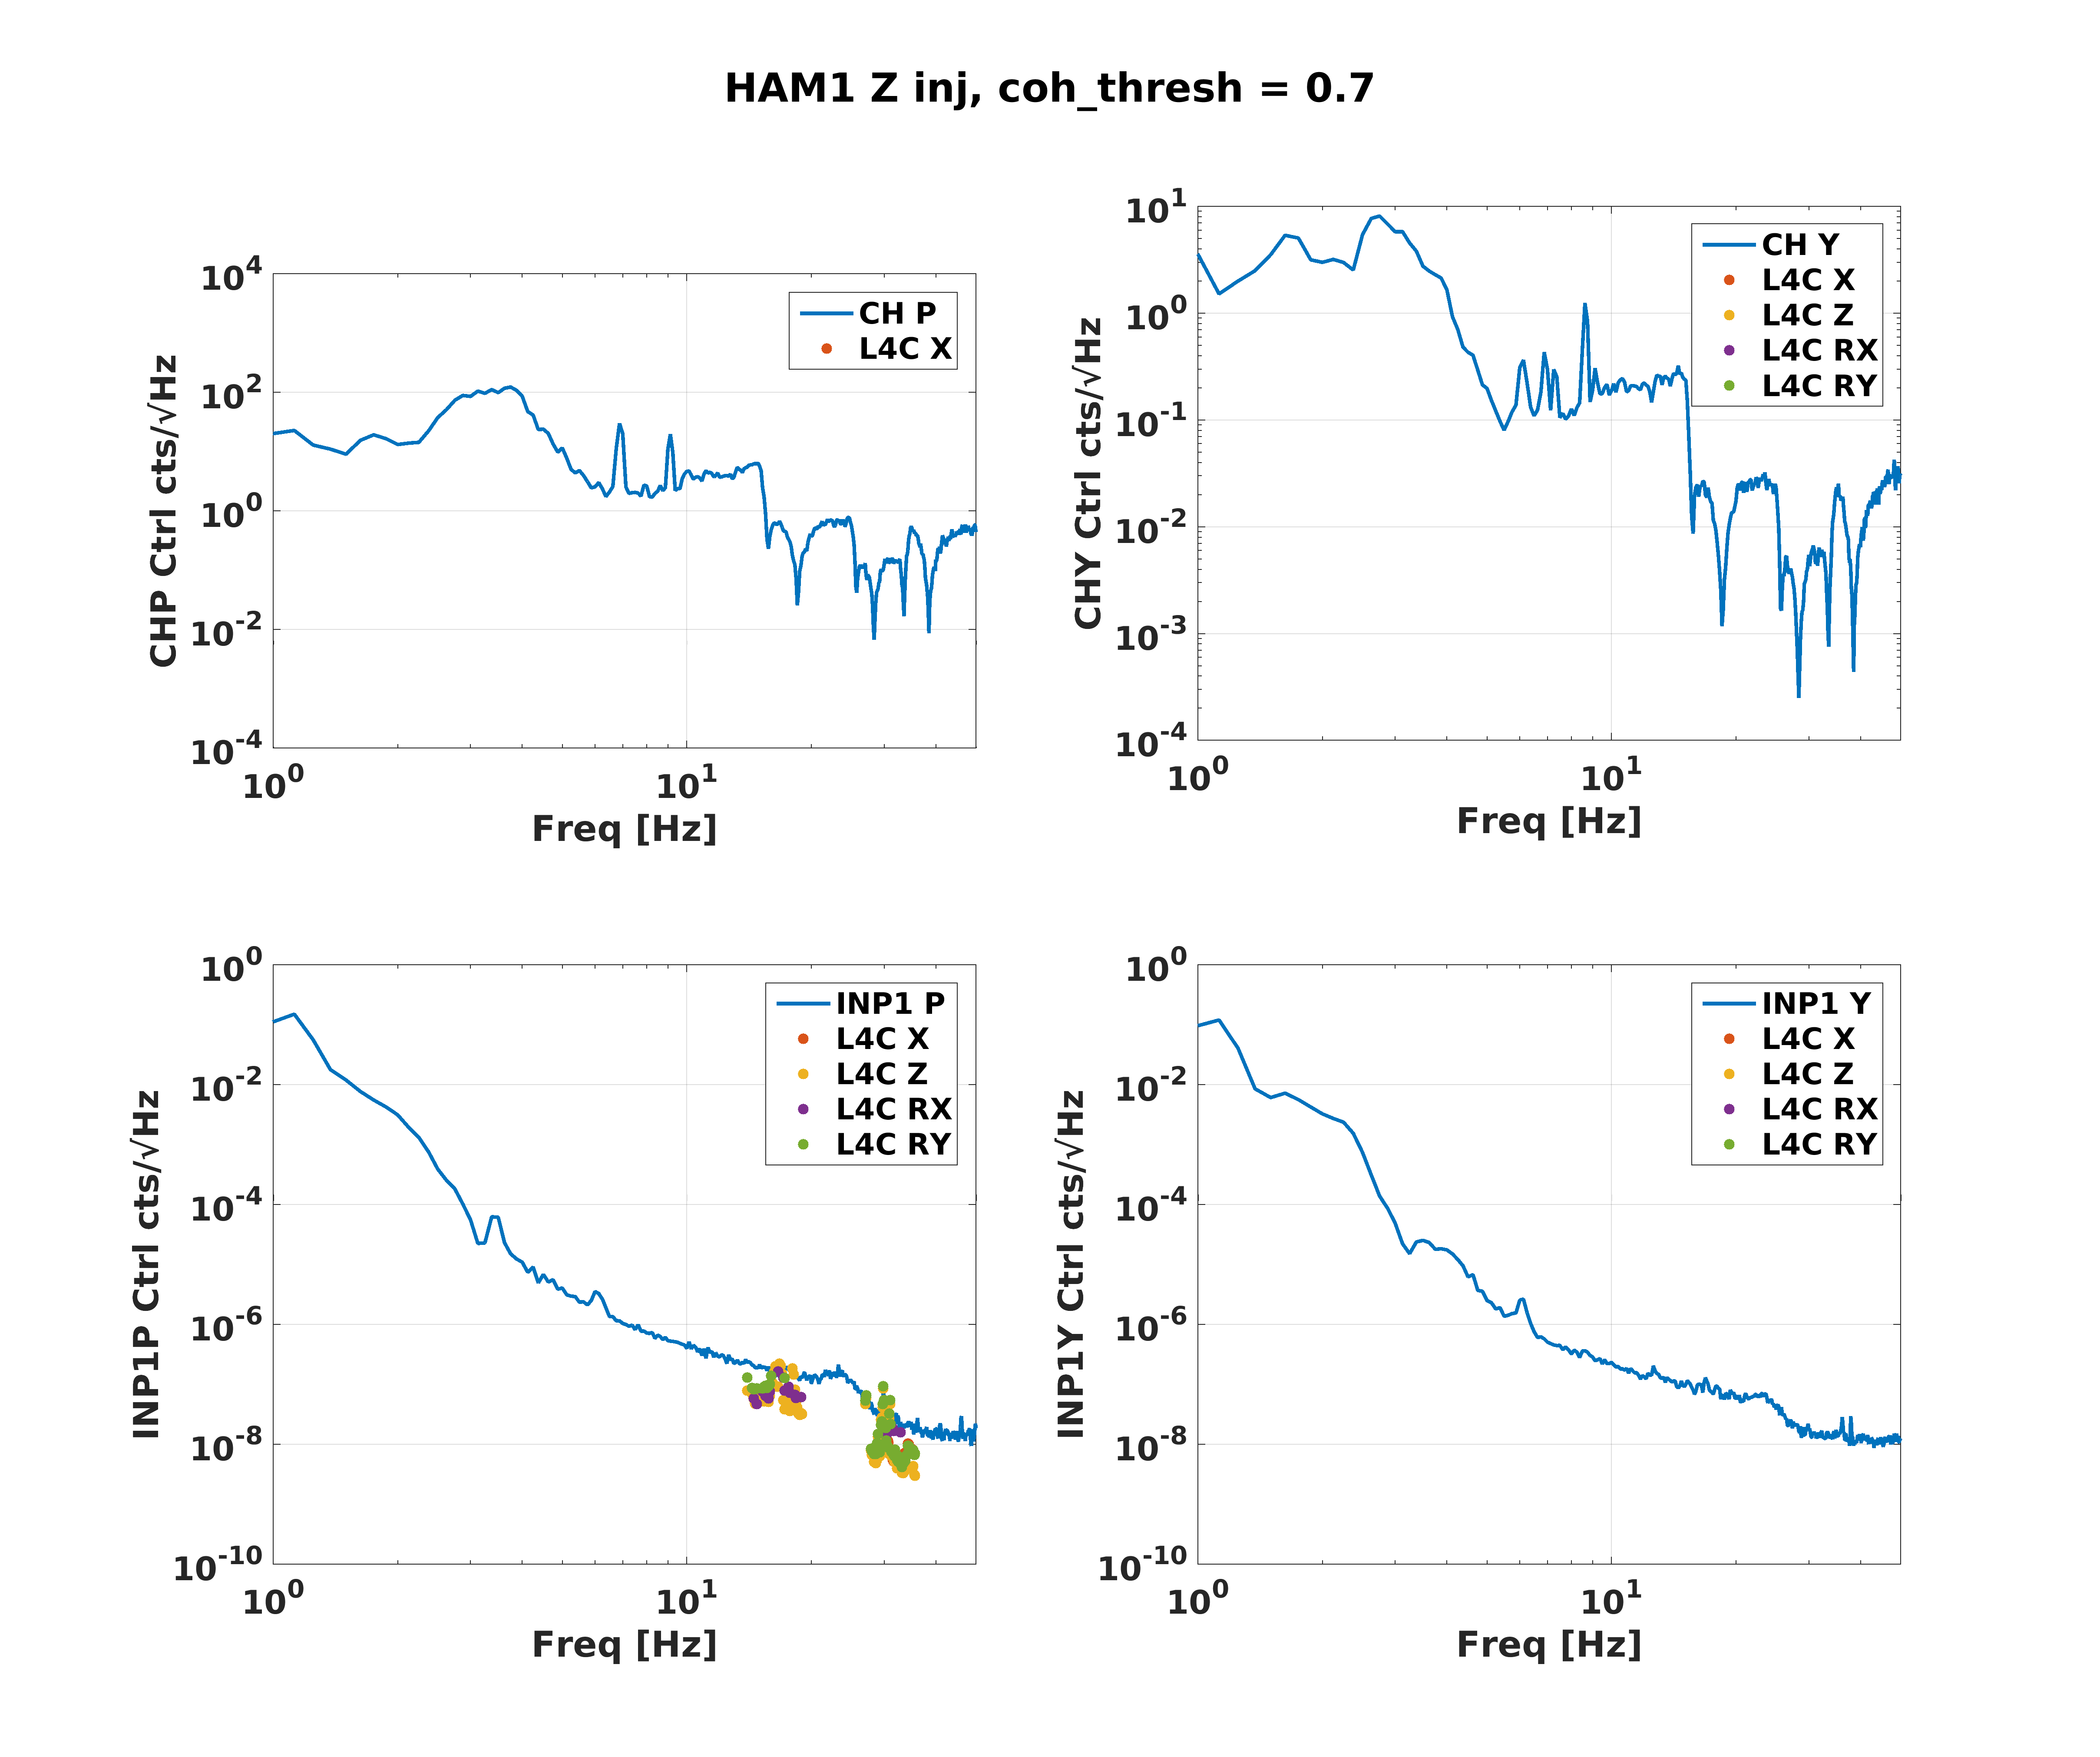
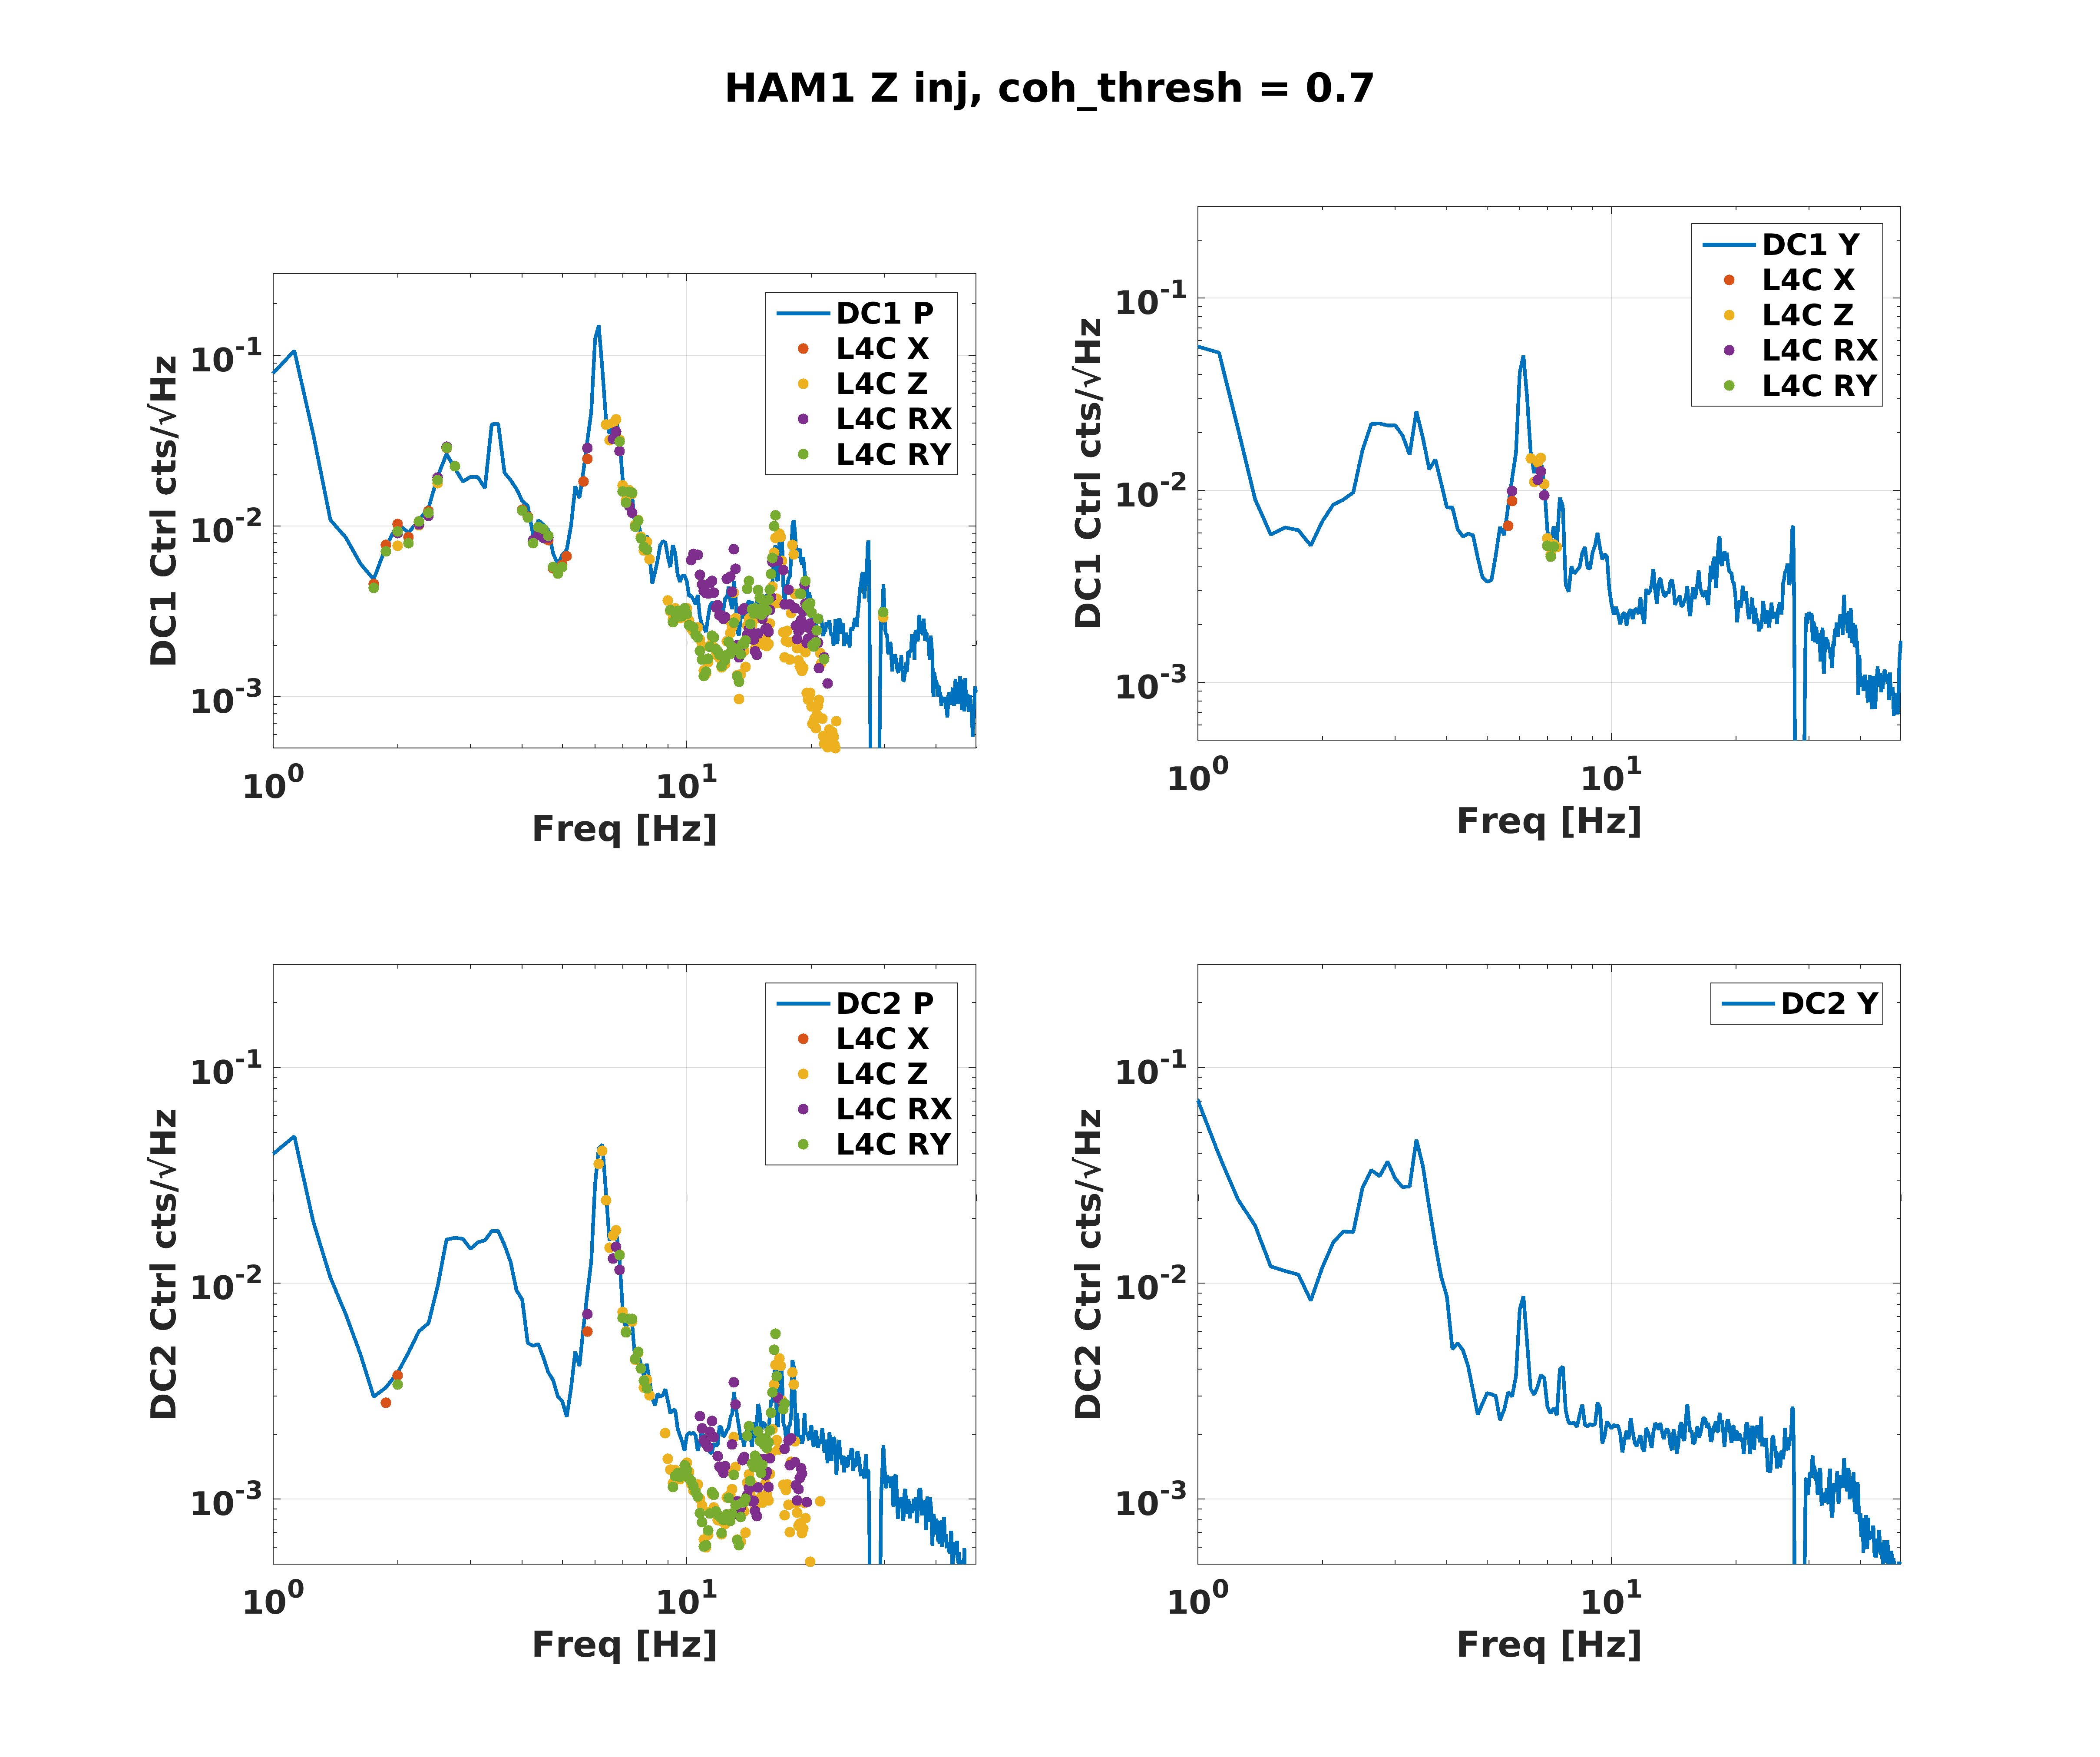
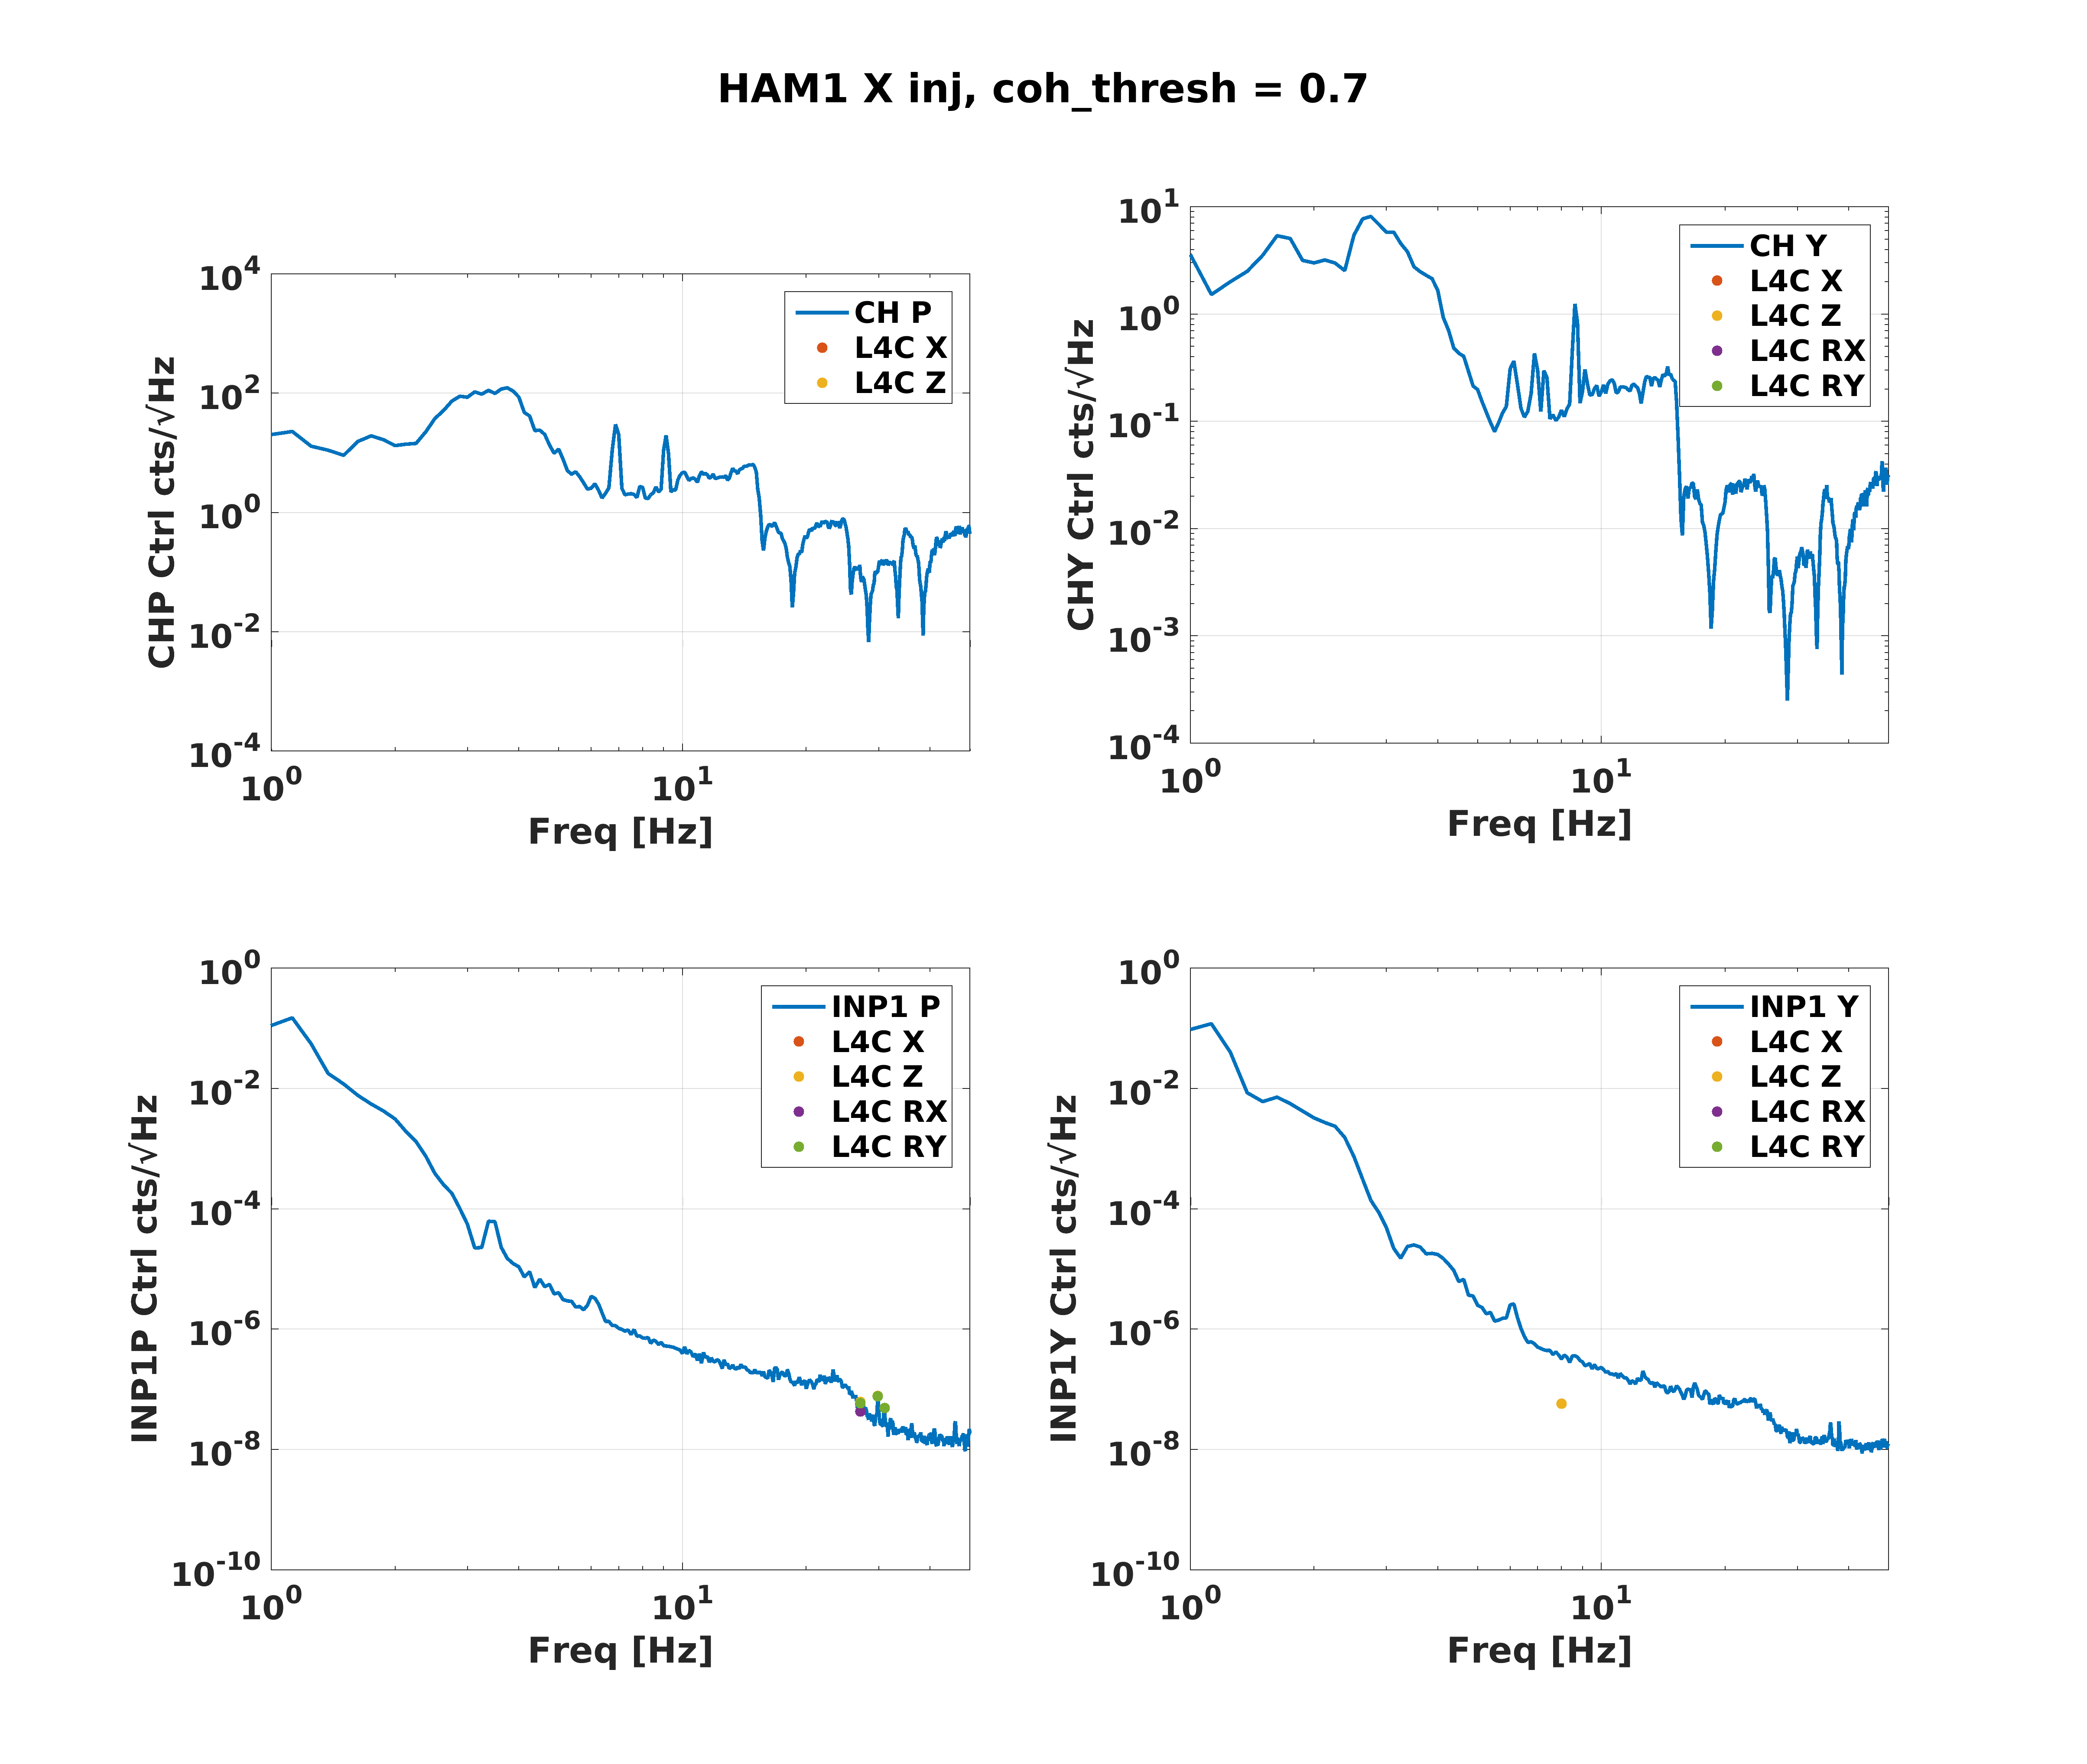
I've taken the times that Sheila posted above, and gotten the transfer functions from the tabletop L4Cs to the different ASC degree of freedom control points (they are saved at a faster rate than the error points, although the error points are easier to calibrate).  Then projected the quiet non-injection tabletop motion onto each degree of freedom. 

Attached are 6 plots, looking at the DC centering loops and the WFS (CHARD and INP1), for the 3 different injection directions.  The WFS themselves don't really see much with the table motion, but the DC centering loops in pitch are seeing a lot of this table motion.  This is in contrast to LLO, who needs to use the tabletop L4Cs to feedforward to CHARD.  None of the table motion is affecting the centering loops above about 20Hz.  The L4C projections are only displayed in the plots if there is anywhere in the transfer function that has coherence during the injection above 0.7. 

The ability to feedforward the L4C signals to the ASC has not yet been implemented, since without that data it wasn't clear which DoFs needed it the most.  LLO hard-codes the ability to feedforward to CHARD only, which we don't want to do since that's not a degree of freedom that is bothered by the table motion.  Note however that the sender parts are now in the SEI model, so if we decide to implement feedforward, it will only require an ASC restart, not any SEI restarts.

Images attached to this comment
gabriele.vajente@LIGO.ORG - 11:46, Thursday 17 January 2019 (46505)

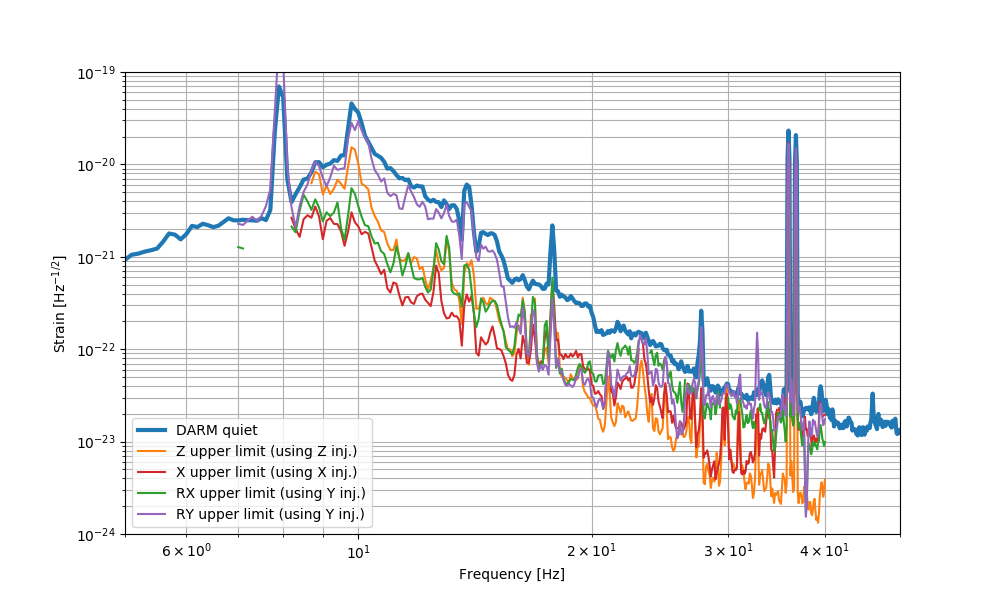
Since the injections are not strong enough to be seen in DARM, all we can do is compute upper limits, as shown below. 

Images attached to this comment
Displaying reports 43481-43500 of 88617.Go to page Start 2171 2172 2173 2174 2175 2176 2177 2178 2179 End