[Keita, Jenne]
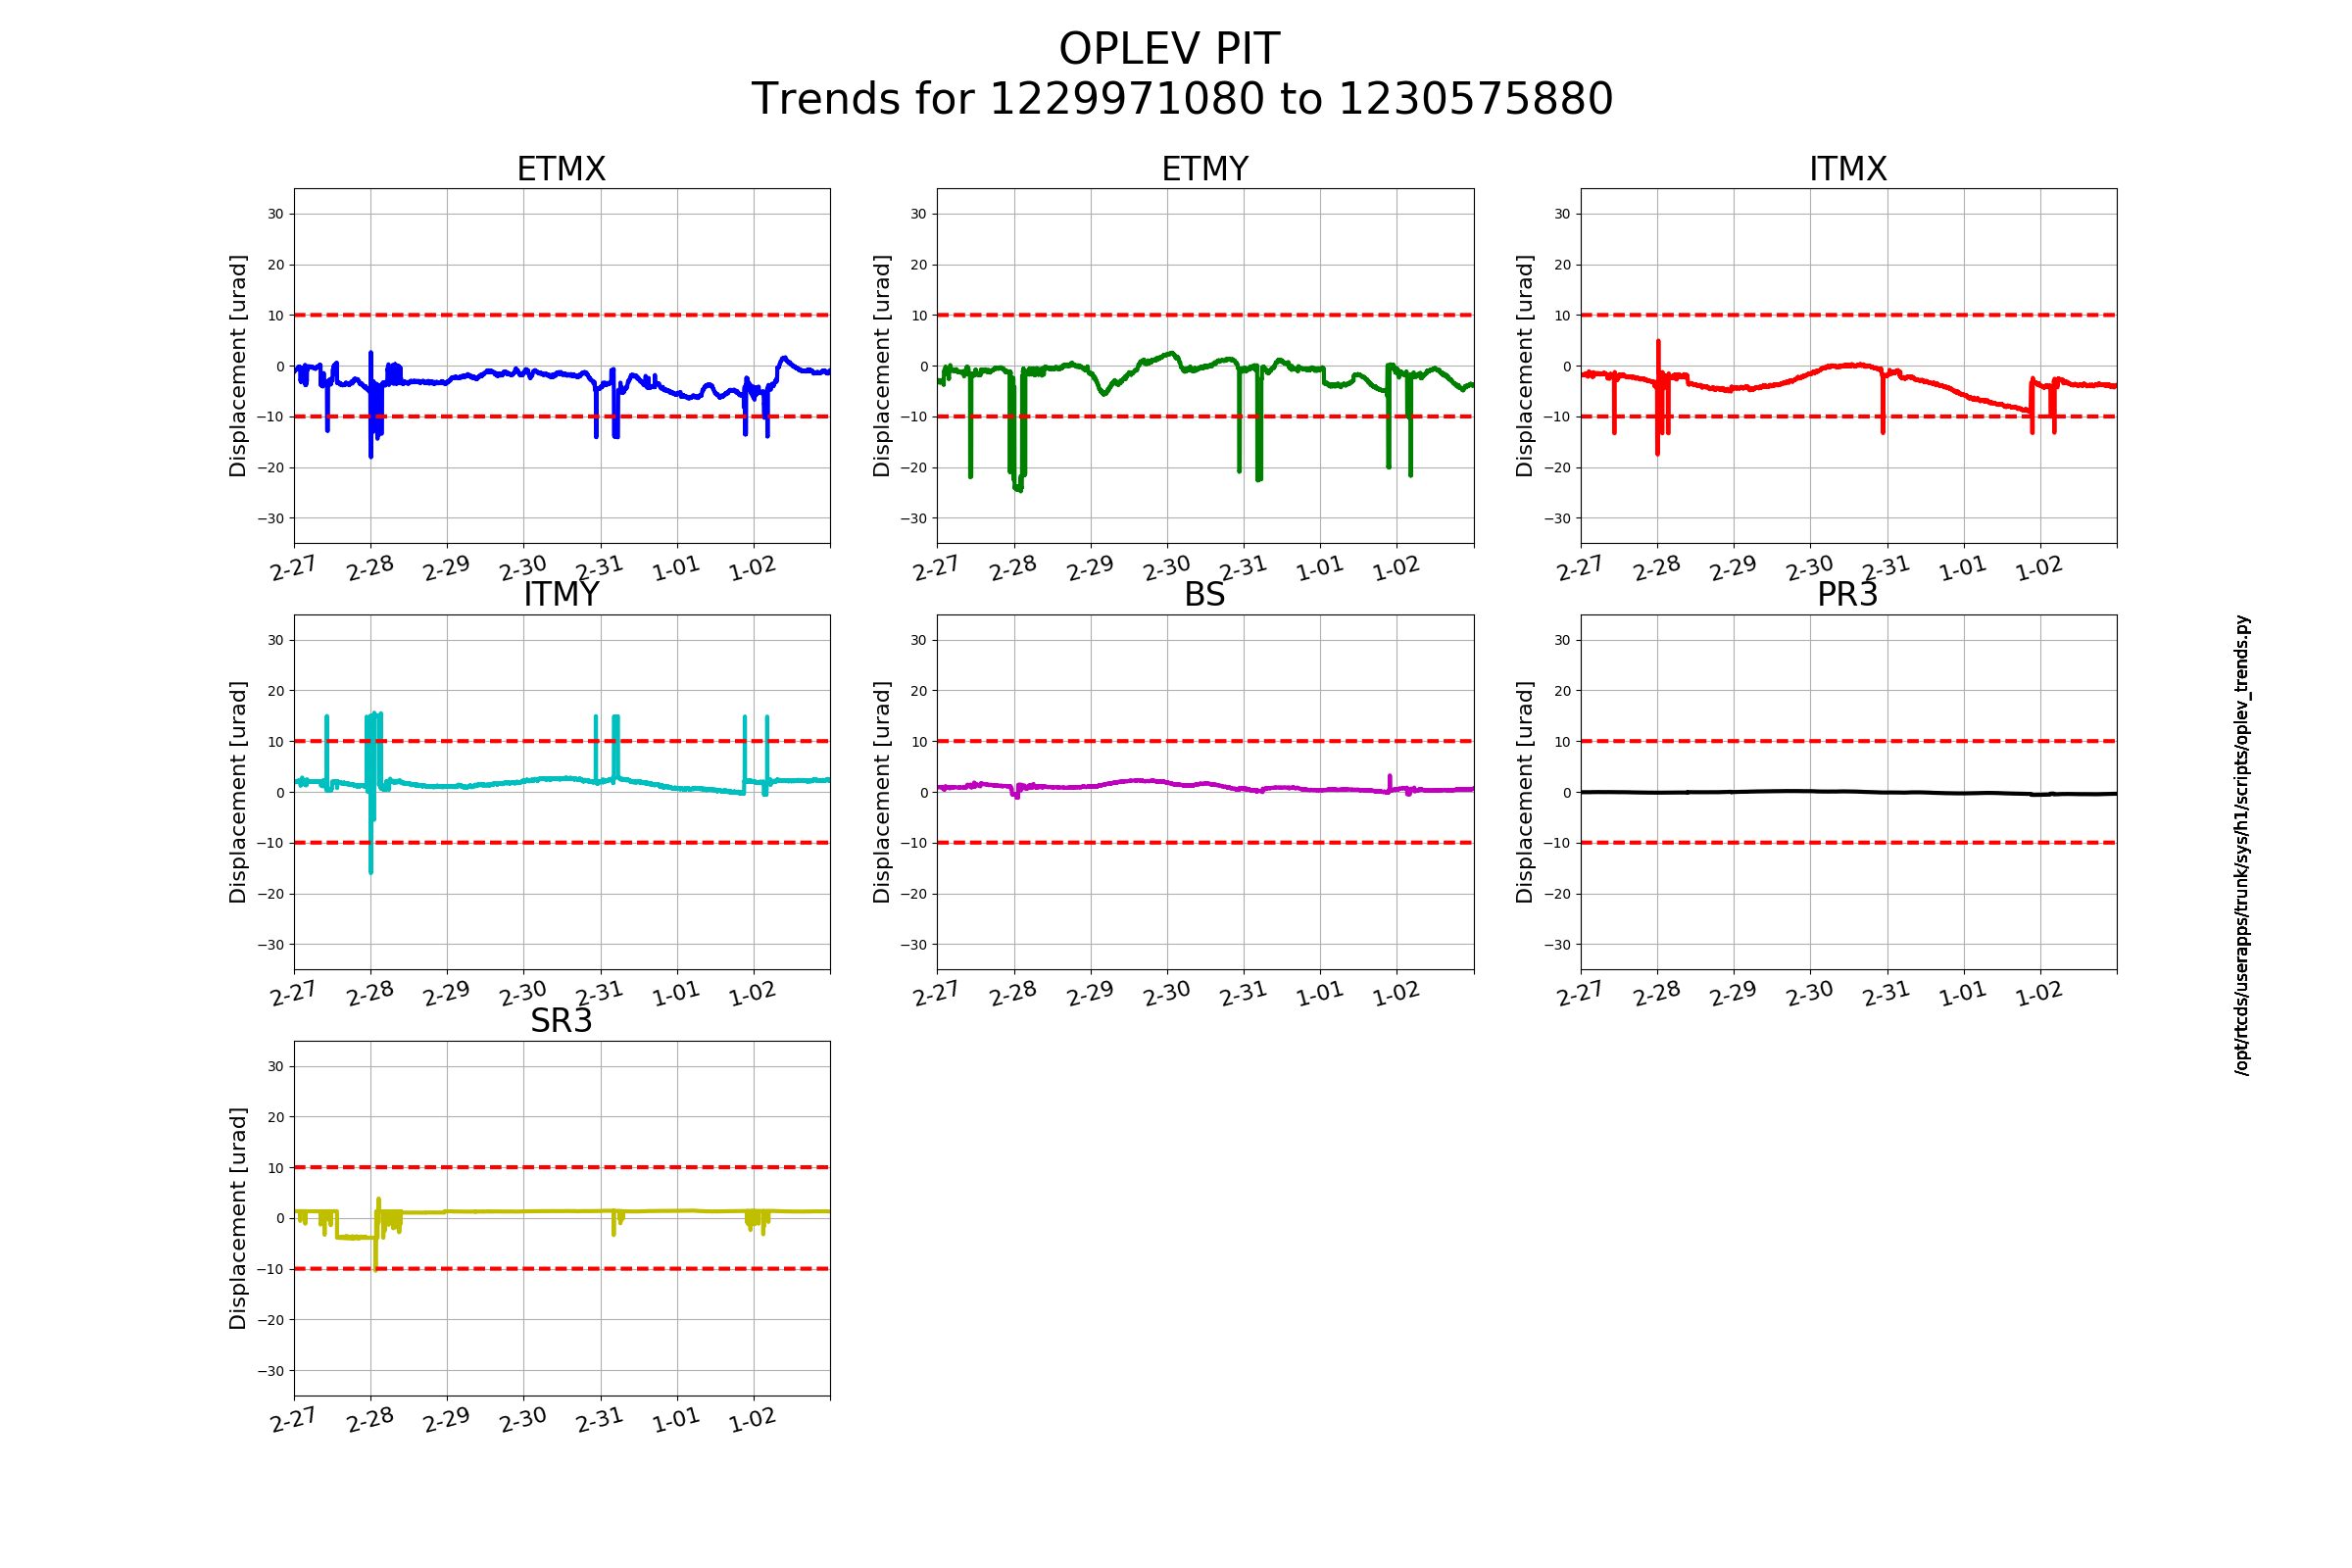
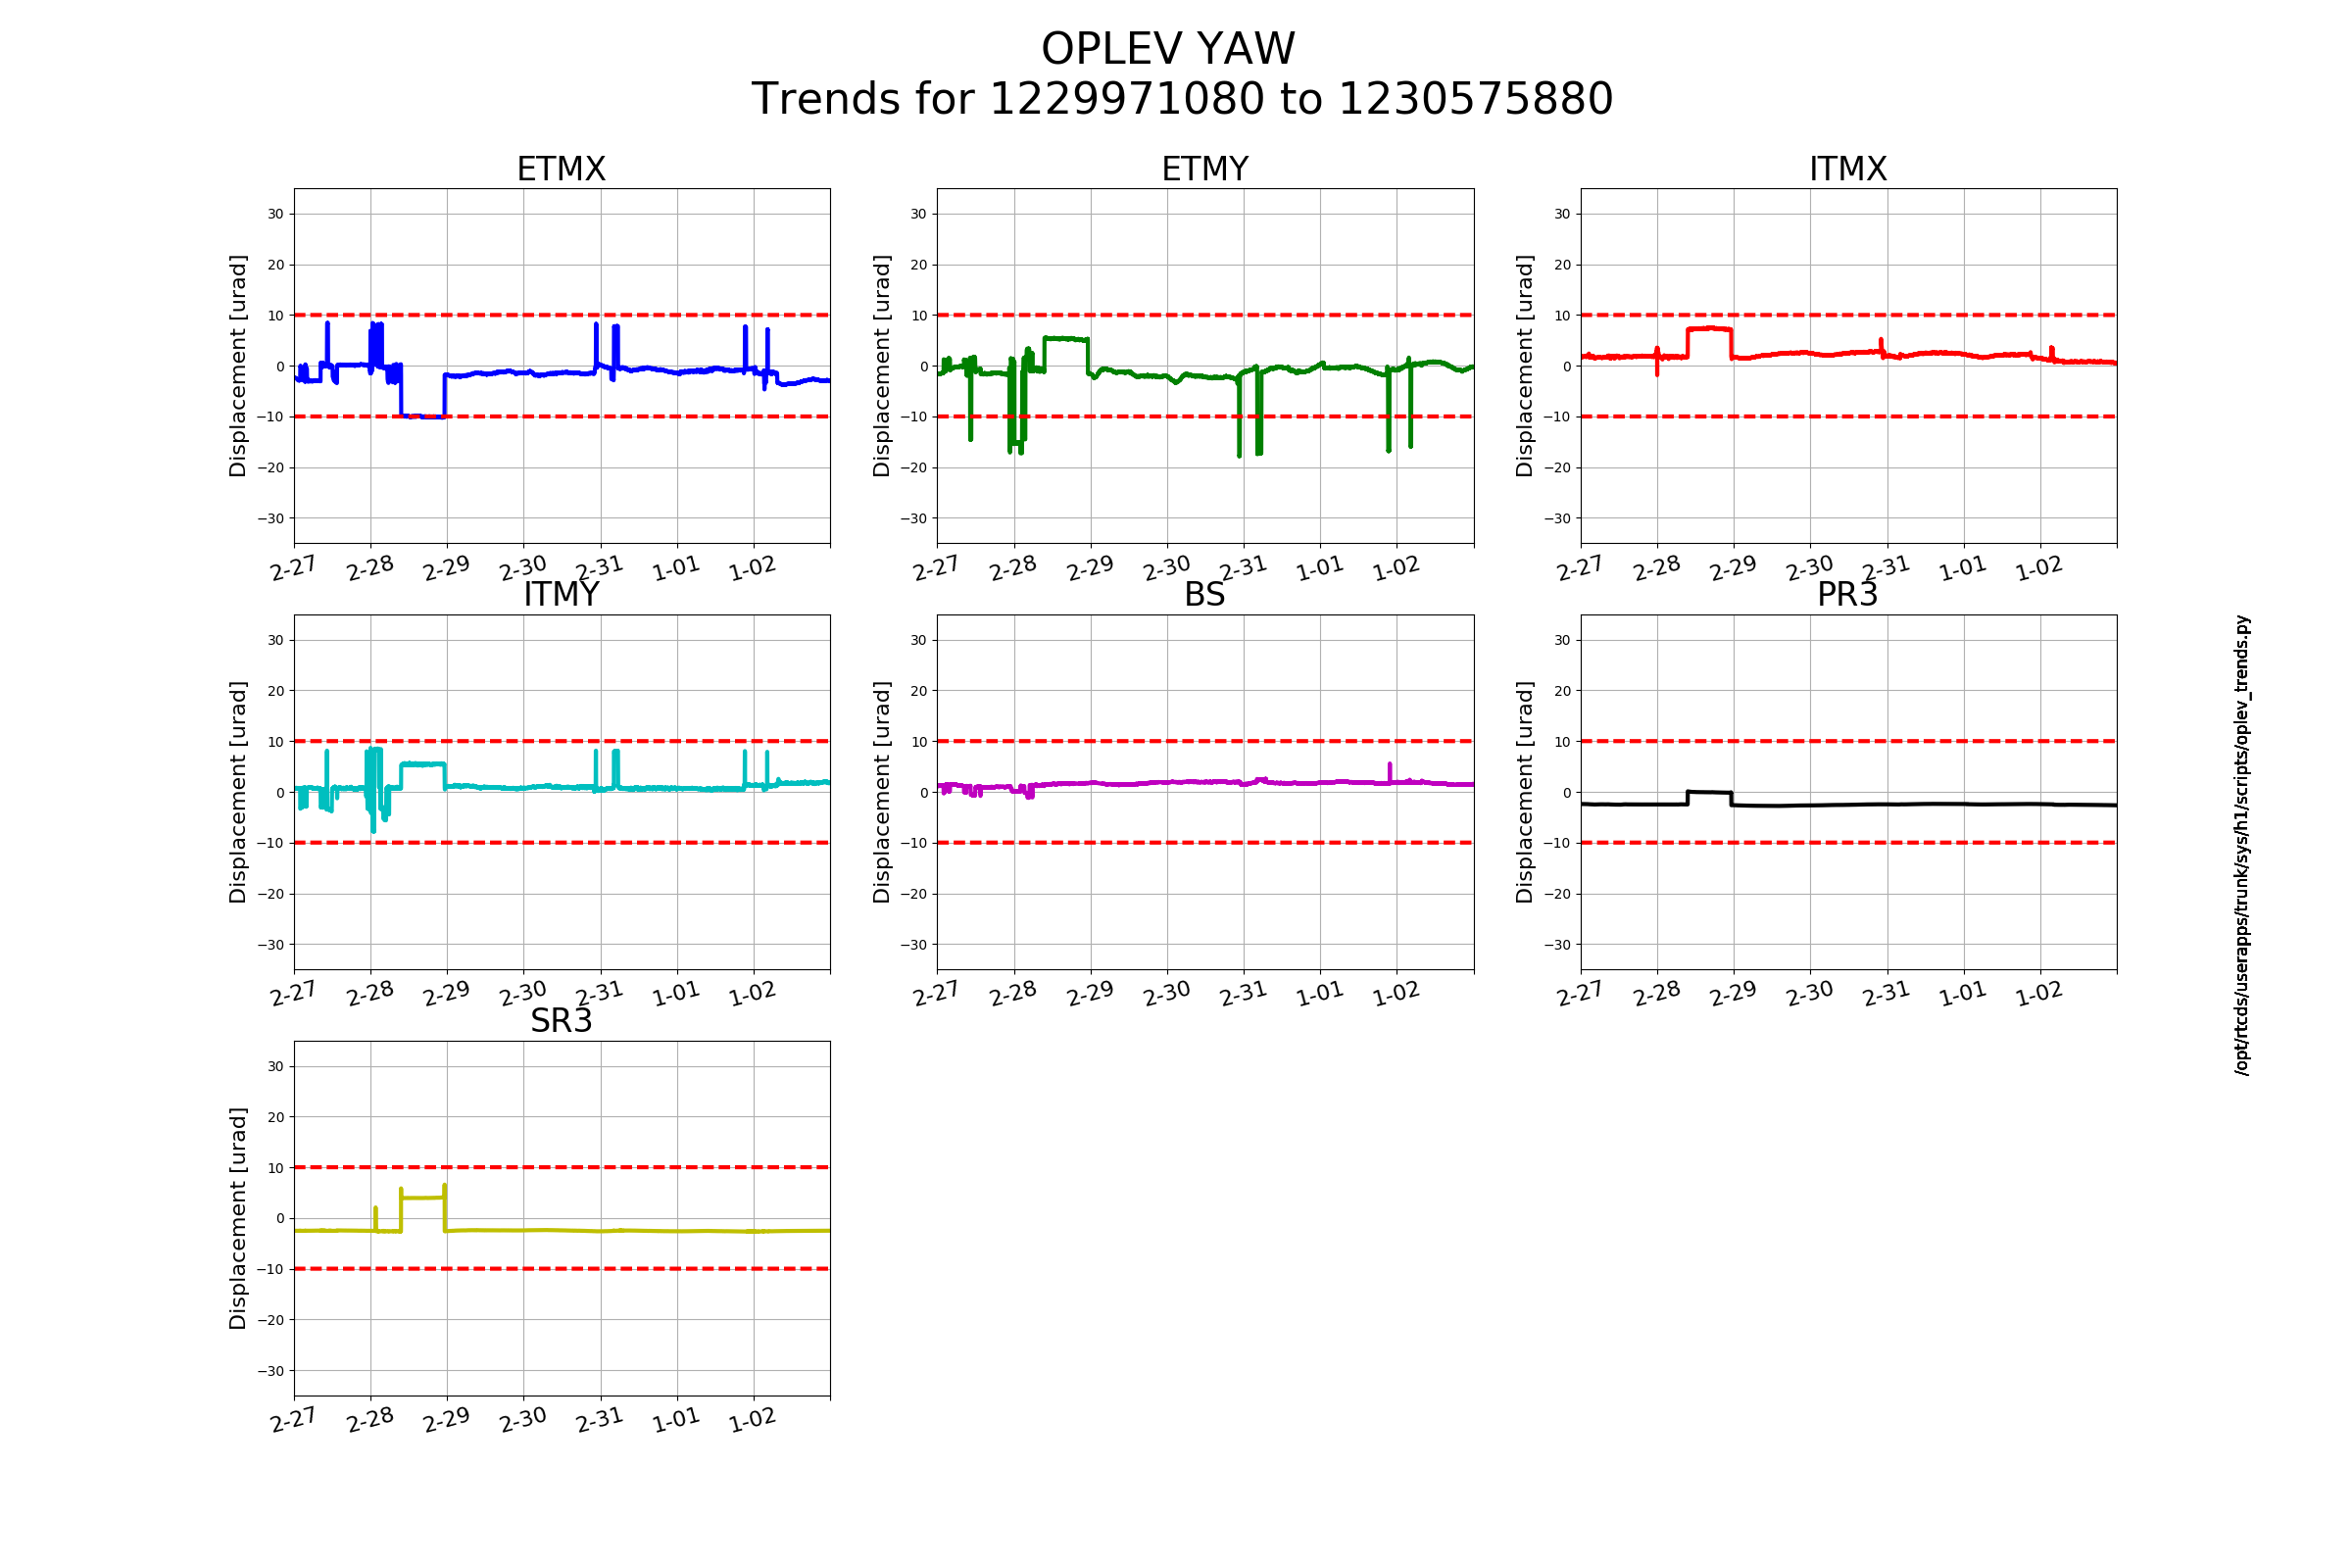
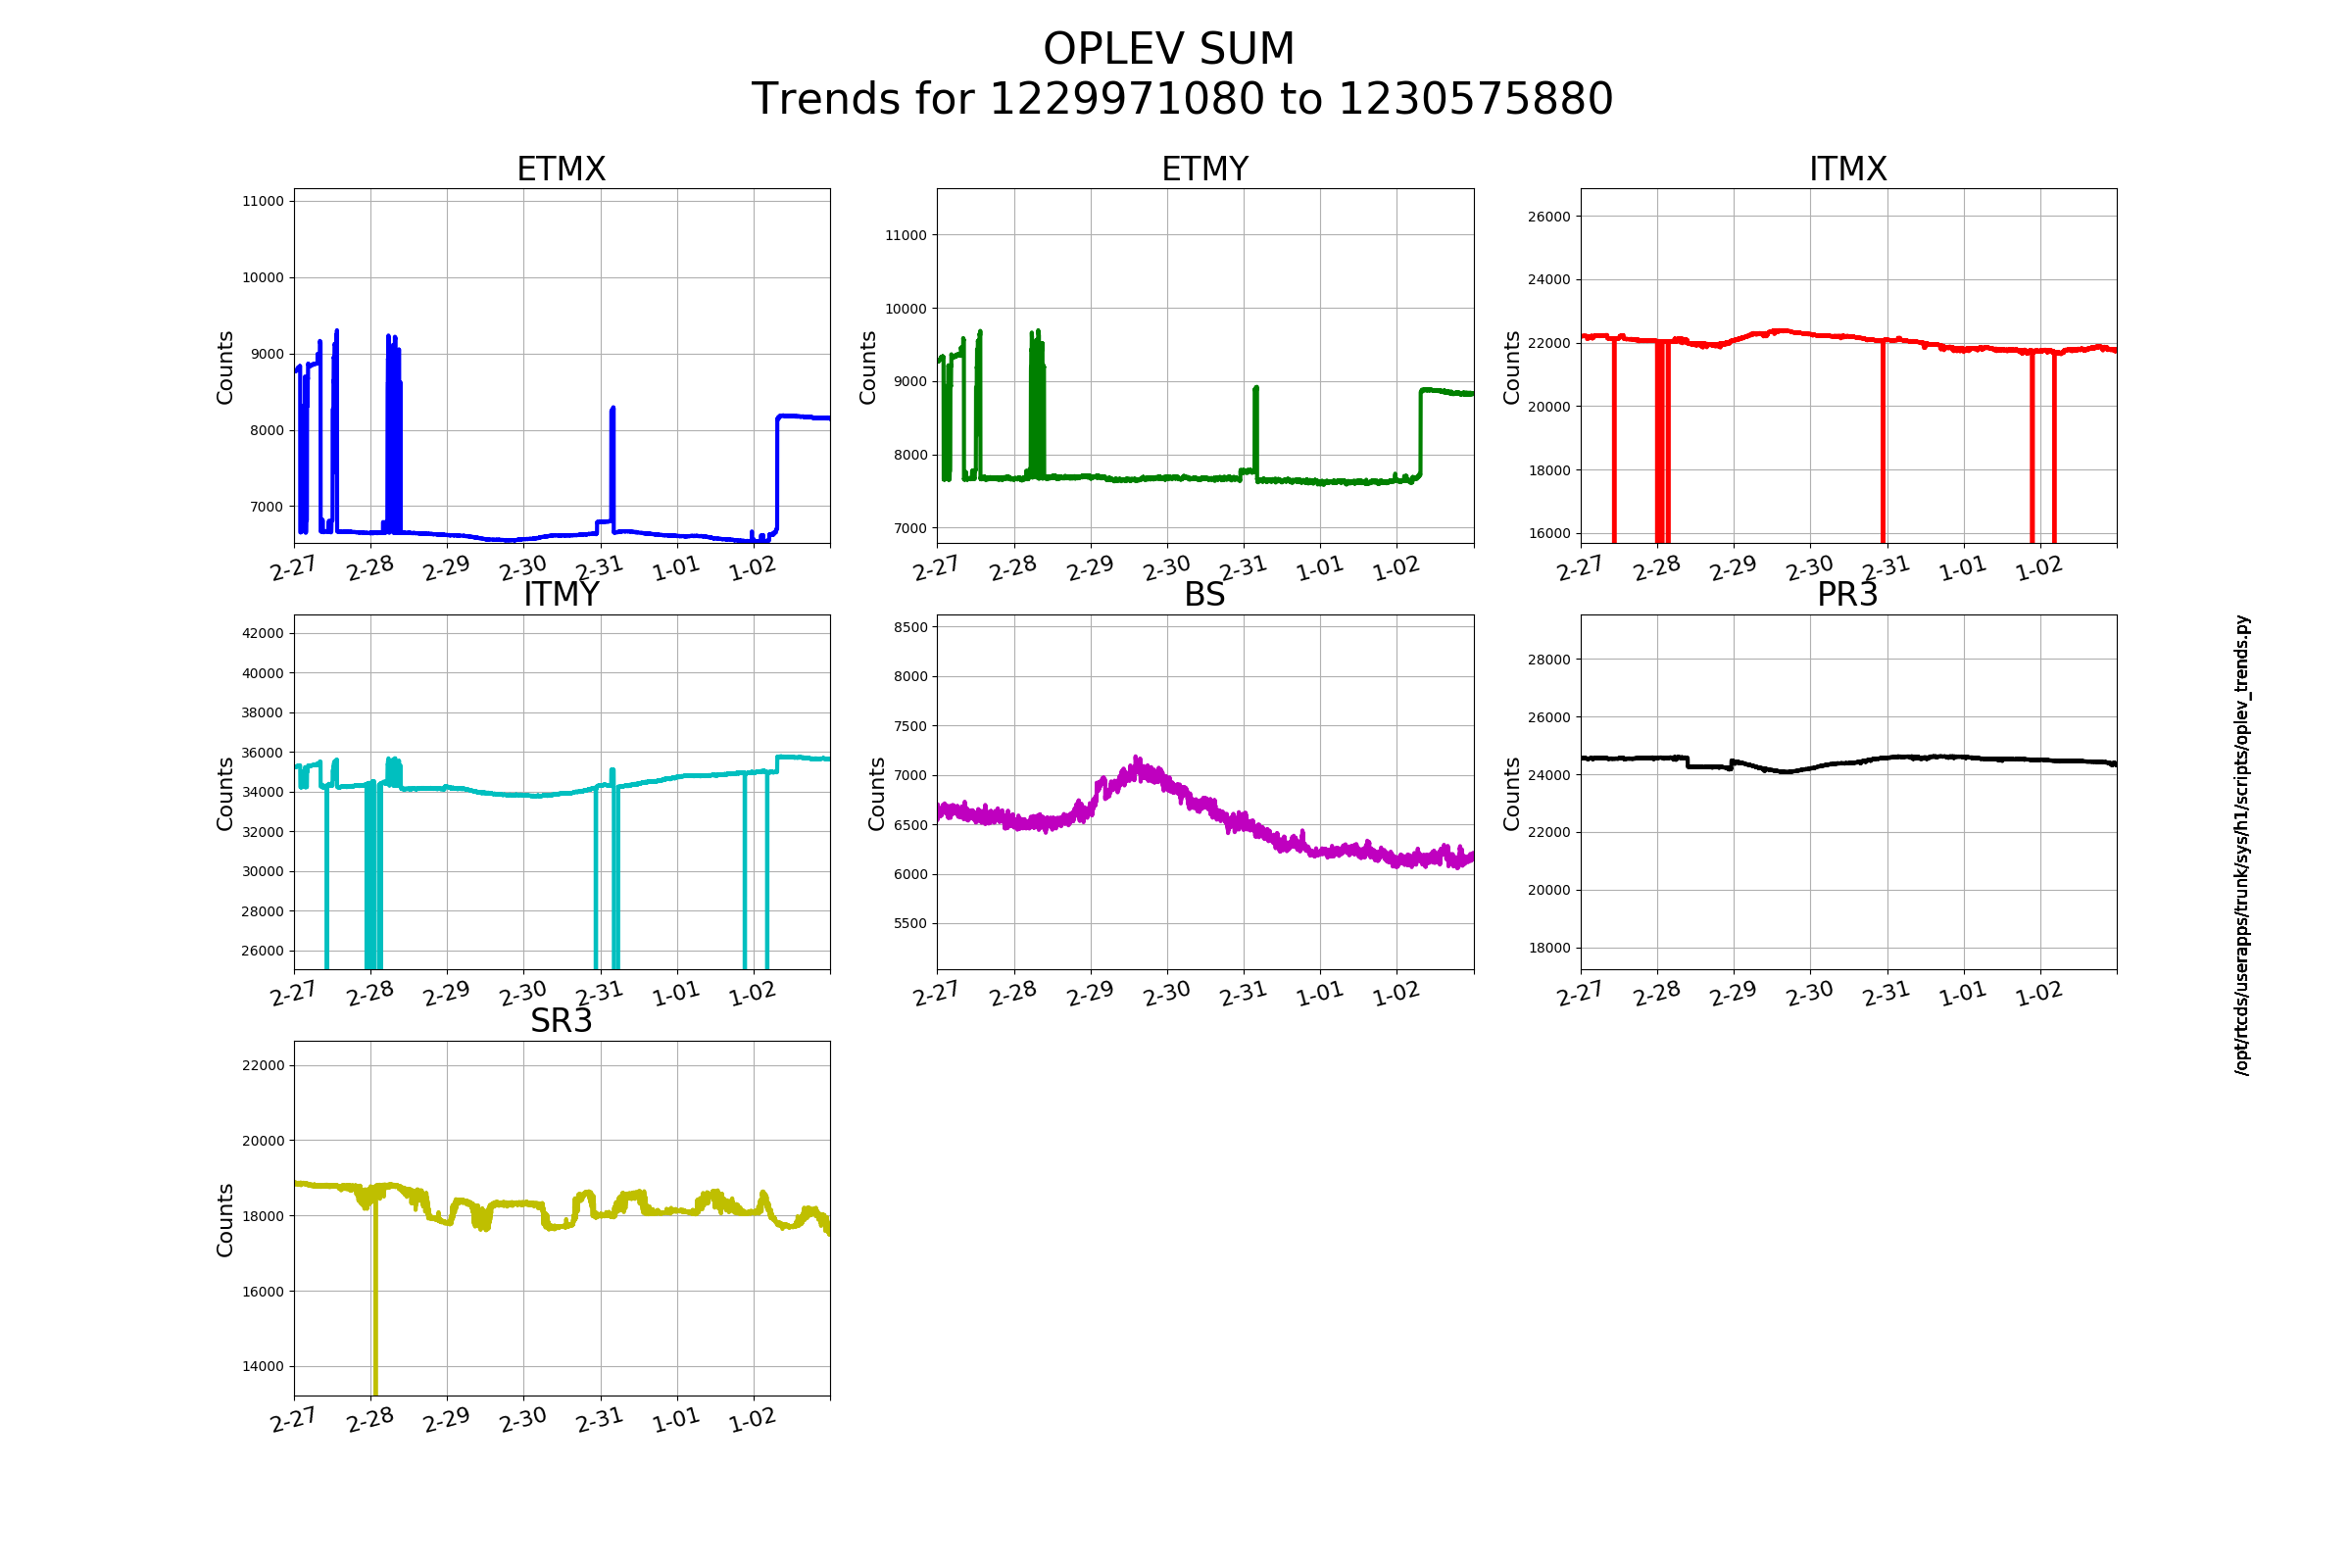
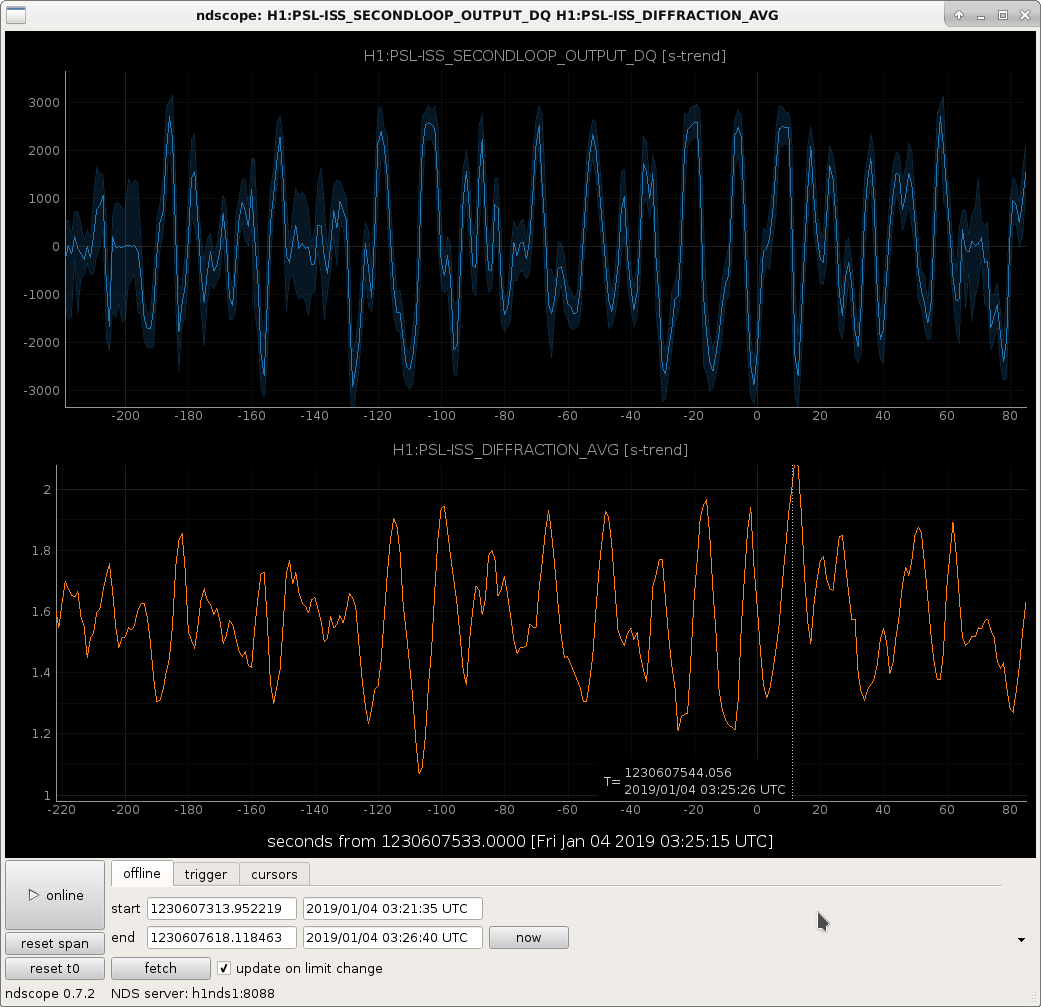
Keita and I have been trying to figure out what is going on with the ISS that is causing the diffracted power to oscillate so largely the past few days. When the IMC is locked, the ISS first loop, with the slow part of the second loop board but not the "second loop" as you would normally think of it, is causing the diffracted power to oscillate more than 1.5%. This is very large compared to what it ought to be.
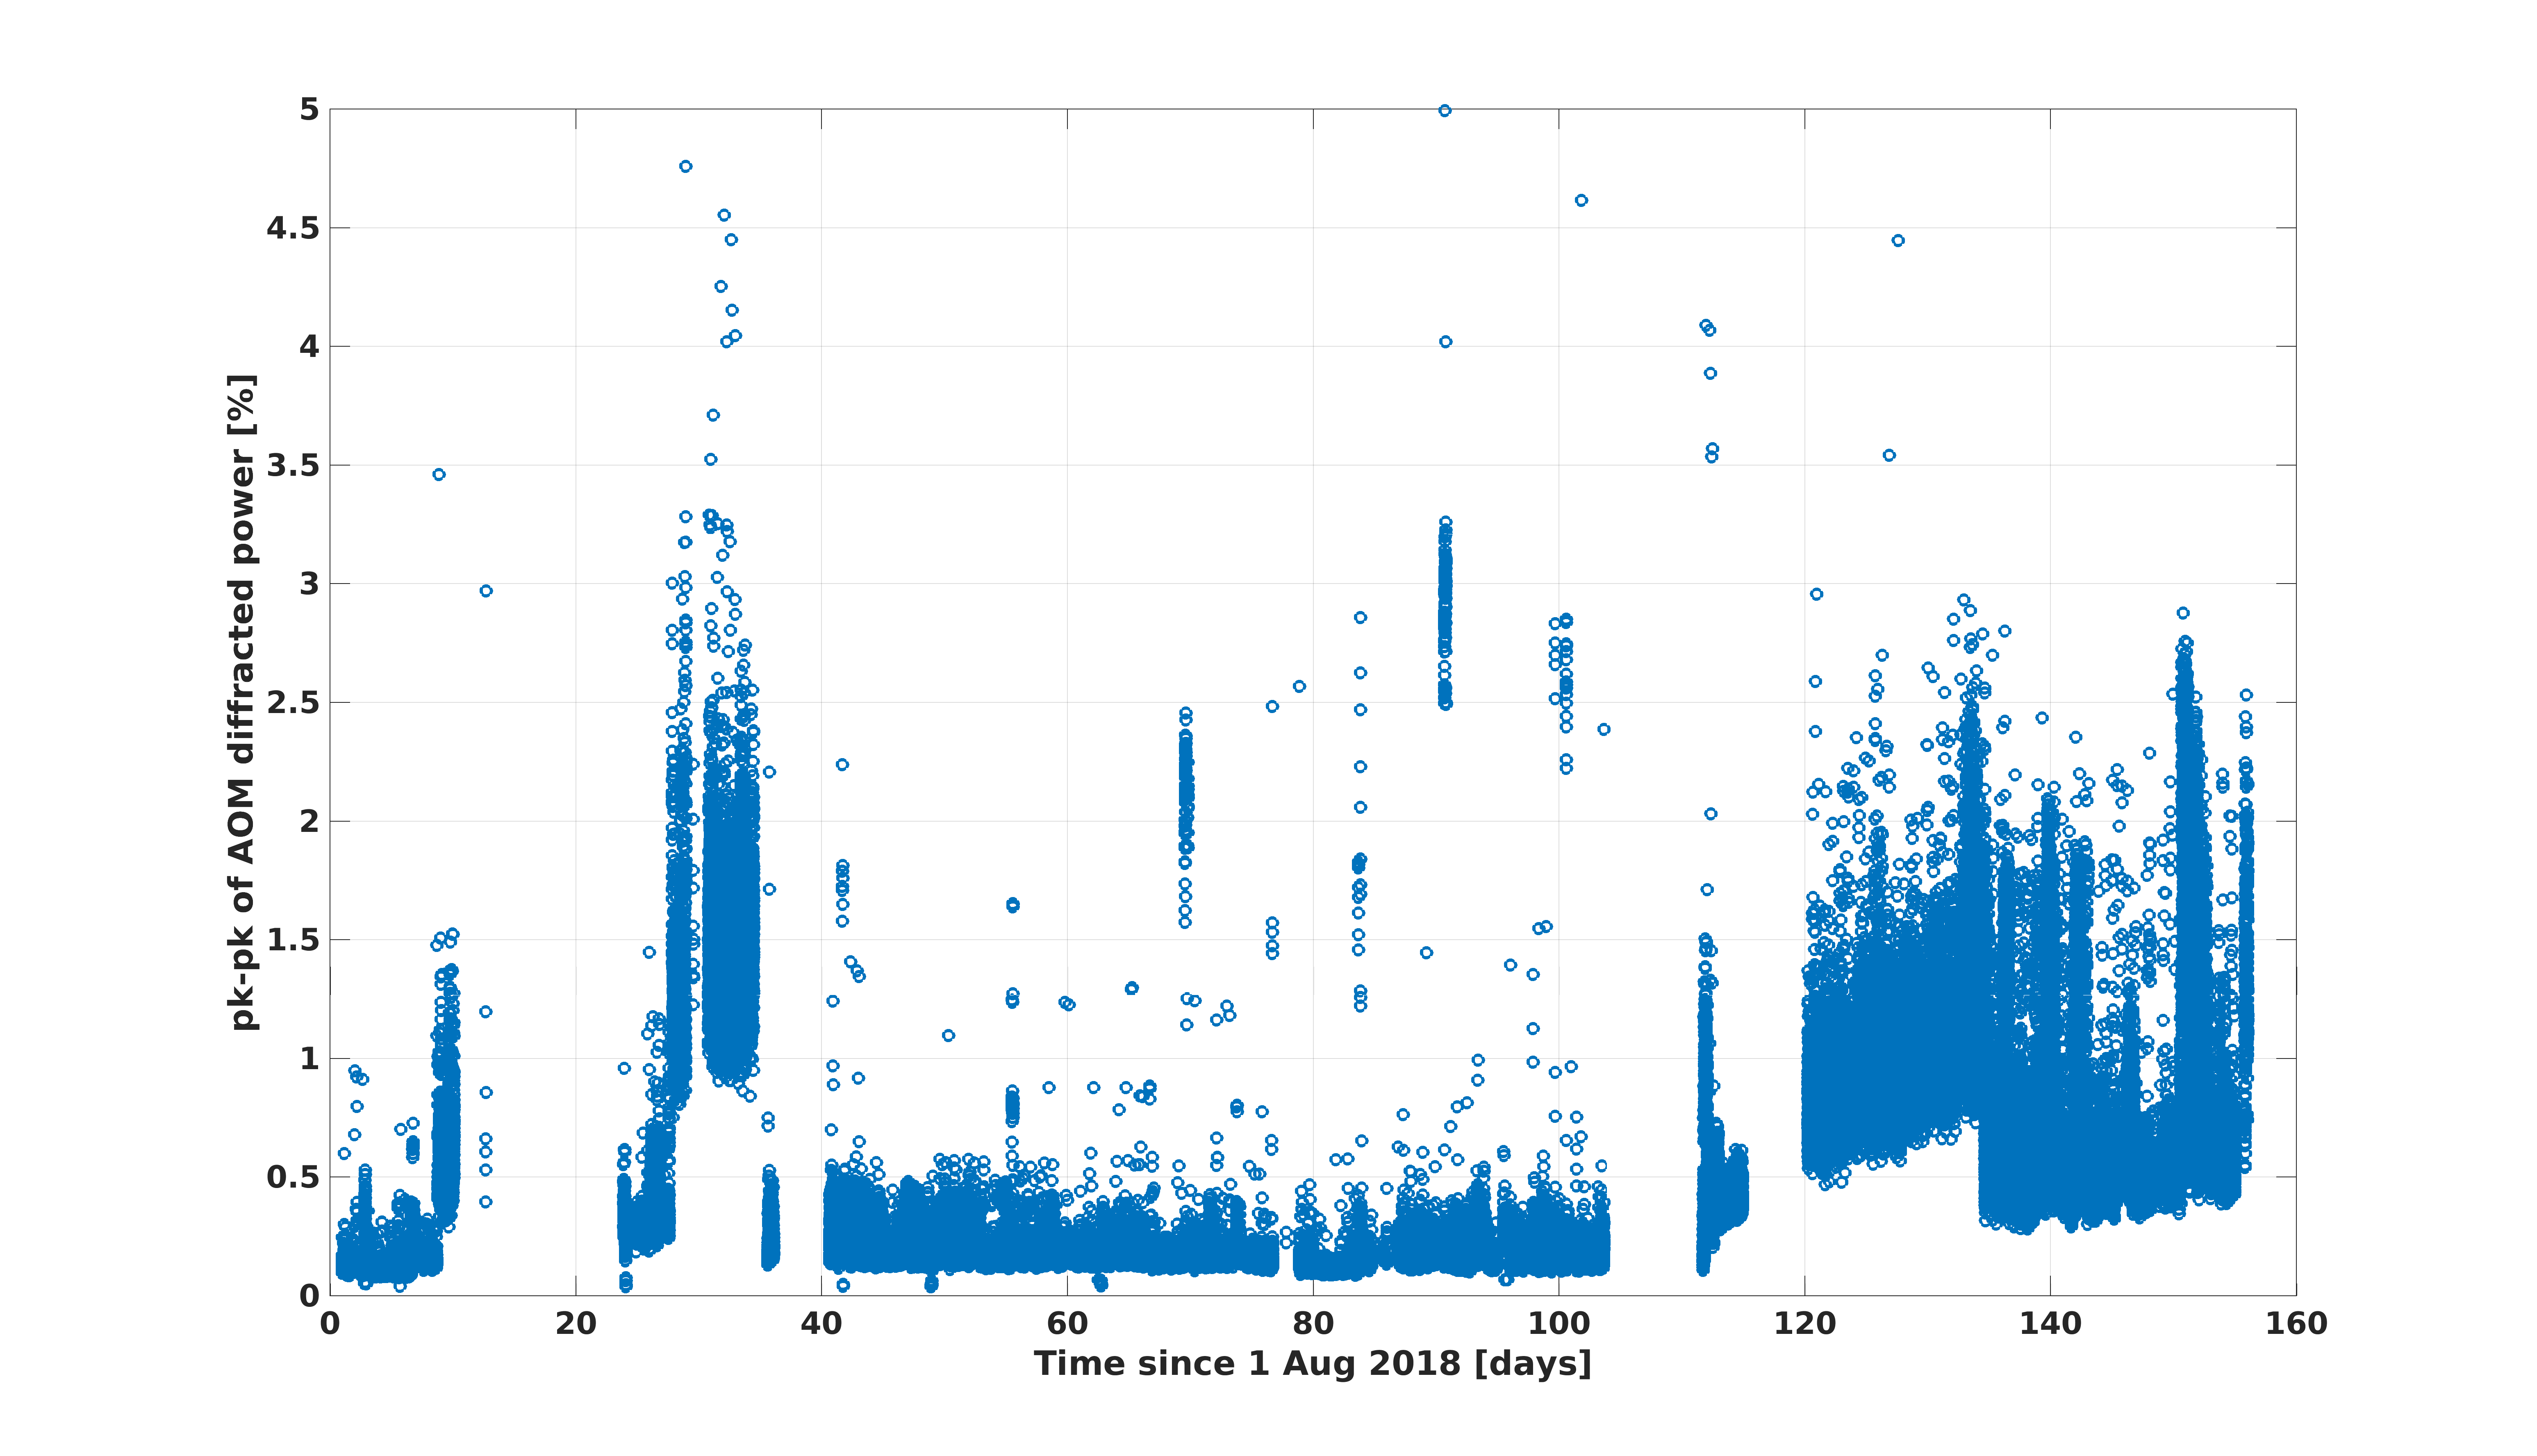
In the attached plot, I have the peak-to-peak values of the diffracted power, from August 1st 2018 through yesterday. I'm using the max and min of minute trends, so this won't catch if some short period of time has a small pk-pk value, but will see larger trends. Data is only plotted here if the first loop is closed, the second loop is open, but the second loop is sending signal from the slow loop over to the first loop (yes, the ISS is confusing...). That is, this should represent times when the IMC is locked, or we're trying to acquire IFO lock, but not times when the second loop is actually feeding back using IMC transmitted power (this is engaged in guardian once DRMI is locked).
You can see that there was a time in ~September that the diffracted power oscillations were high, but then they got better. Since the beginning of December, the peak-to-peak value hasn't been near it's normal small value.
It seems like the second loop board is picking up more noise somehow, somewhere, and is feeding that through the slow portion of the board to the AOM. When we turn off the output of the second loop board, we immediately see that the diffracted power becomes nice and smooth and quiet (we tried this briefly yesterday). Still under investigation, but something is definitely not right.
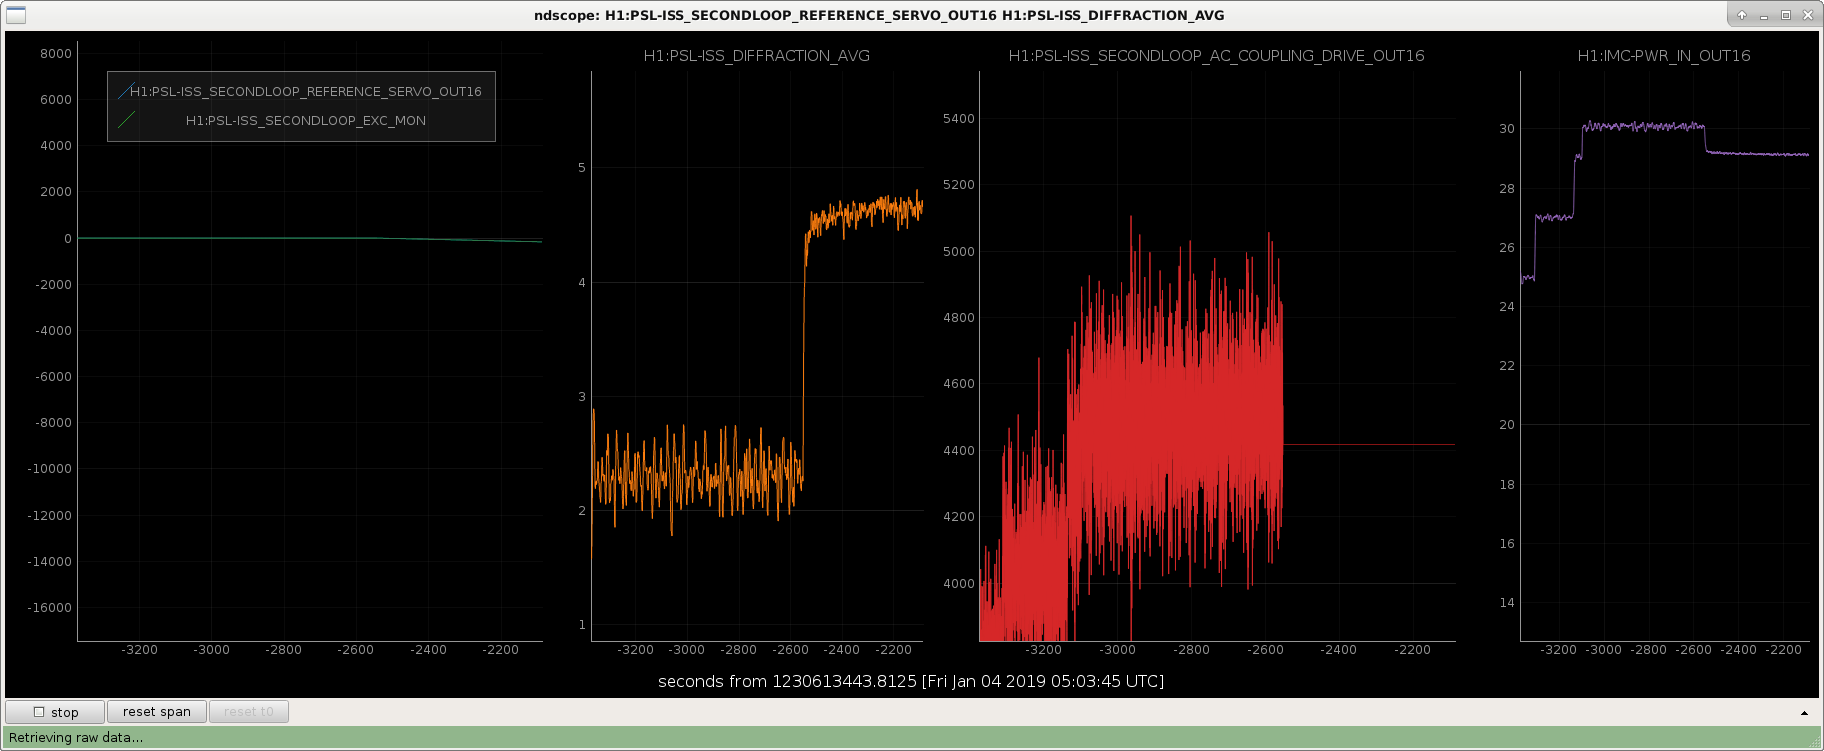
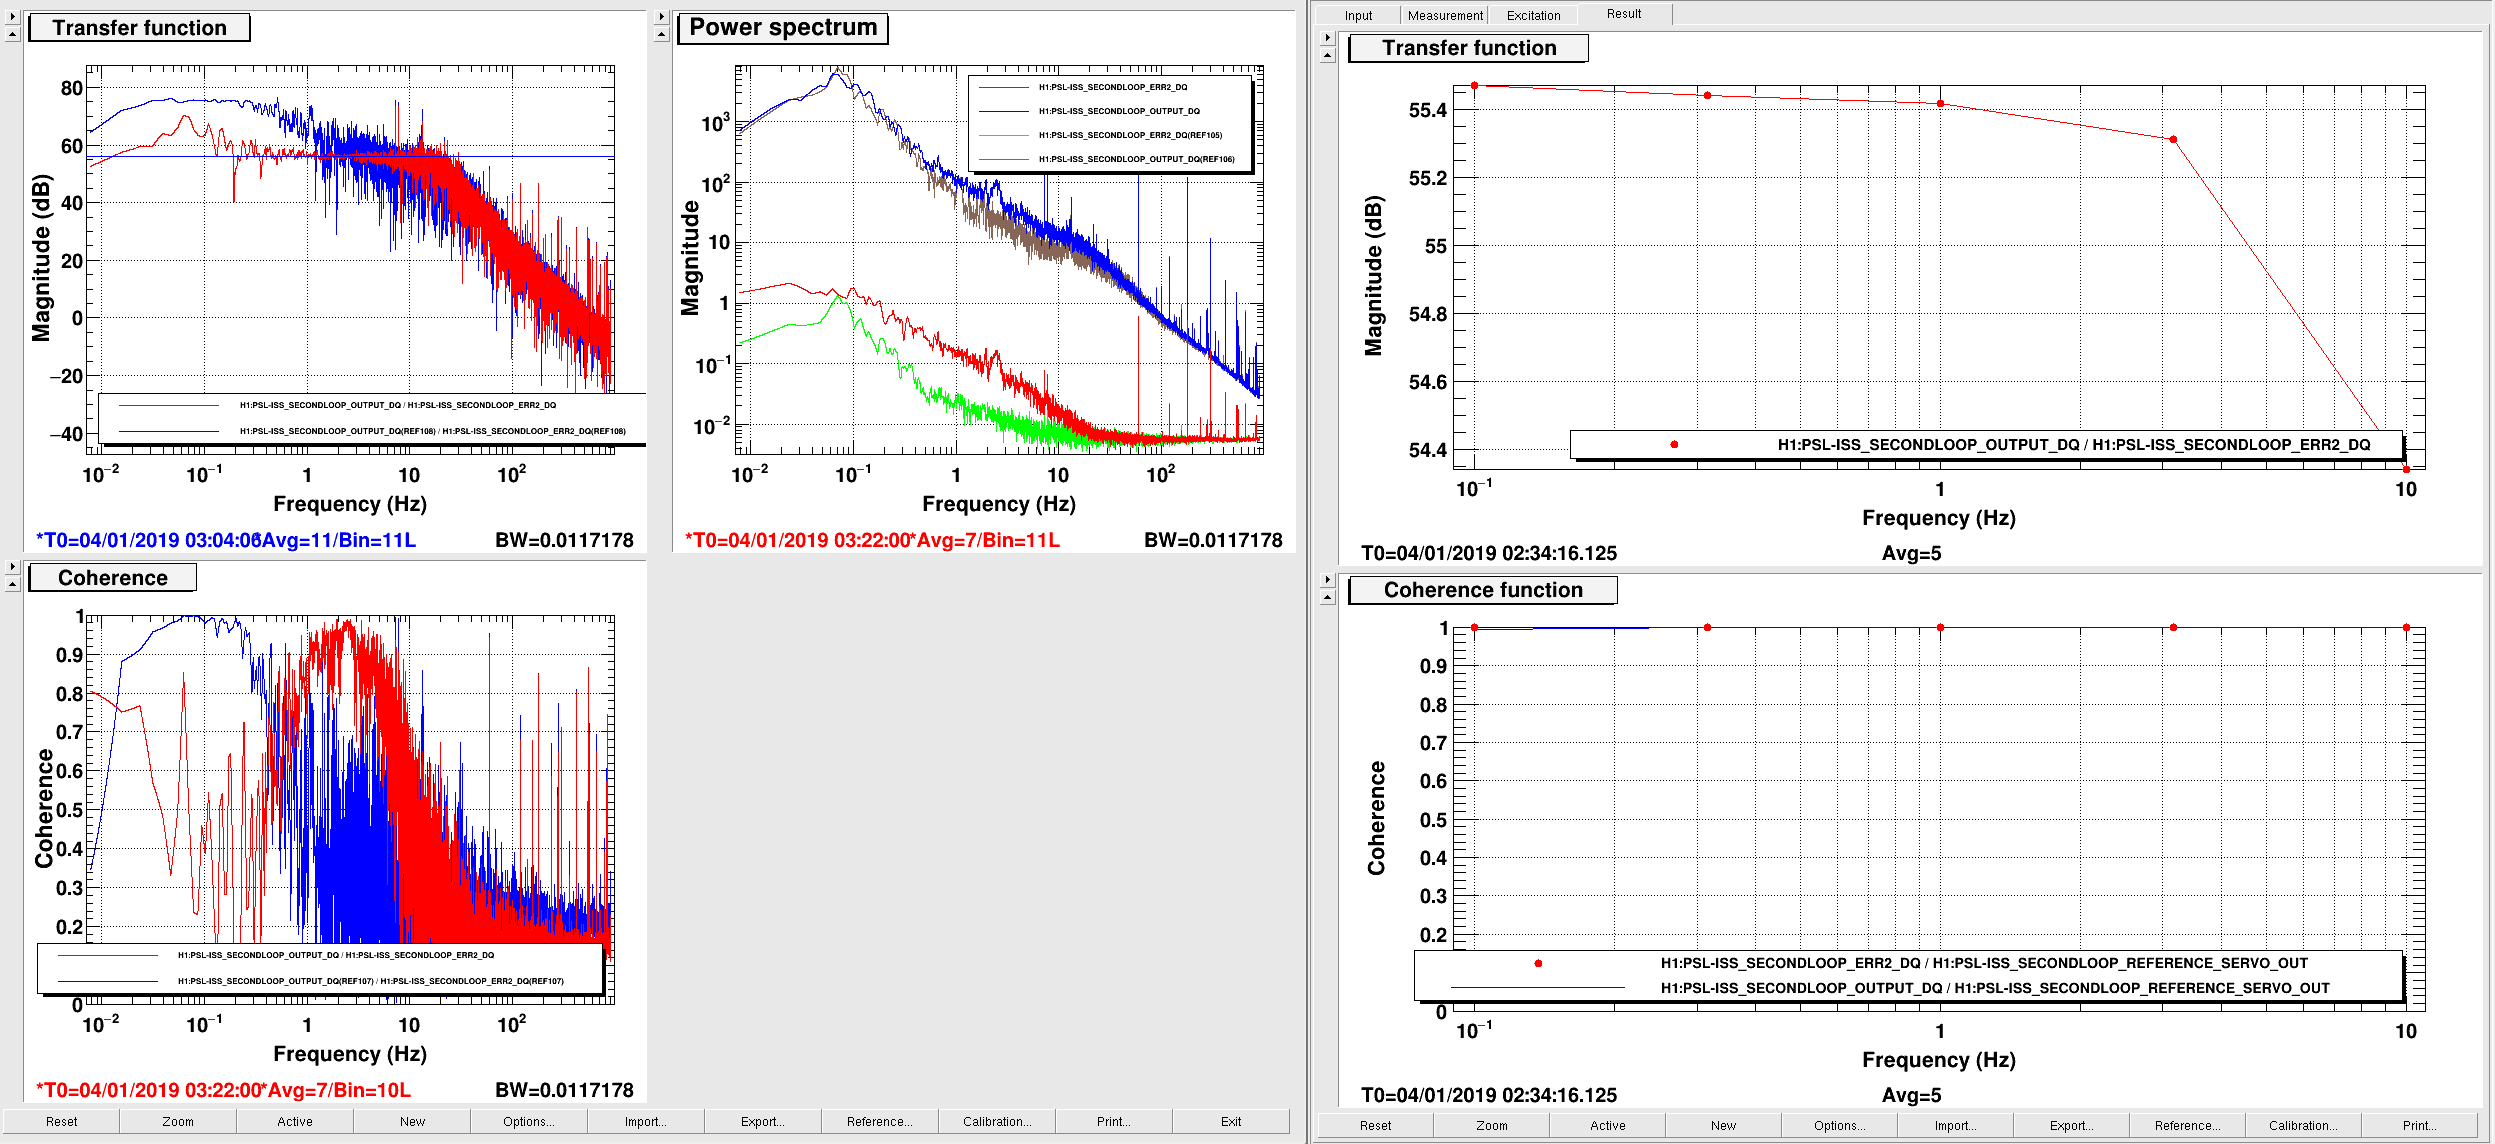
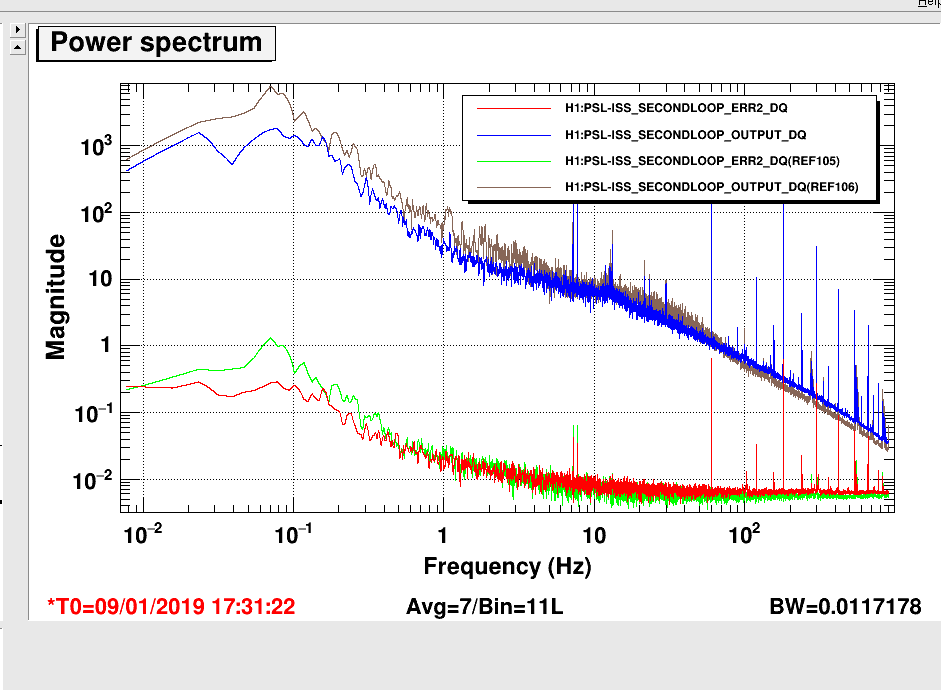
First attachment shows that the 2nd board output is pushing the 1st loop board when both the output switch in the 2nd loop board and the 2nd loop enable switch in the 1st loop board are on, even when the 2nd loop itself is open and even when slow offset servo is off, i.e. even when the 2nd loop output is entirely driven by the noise of the board itself. (The plot was taken when the slow offset feedback was on but the 2nd loop was off, but slow offset on/off doesn't make much difference if at all.)
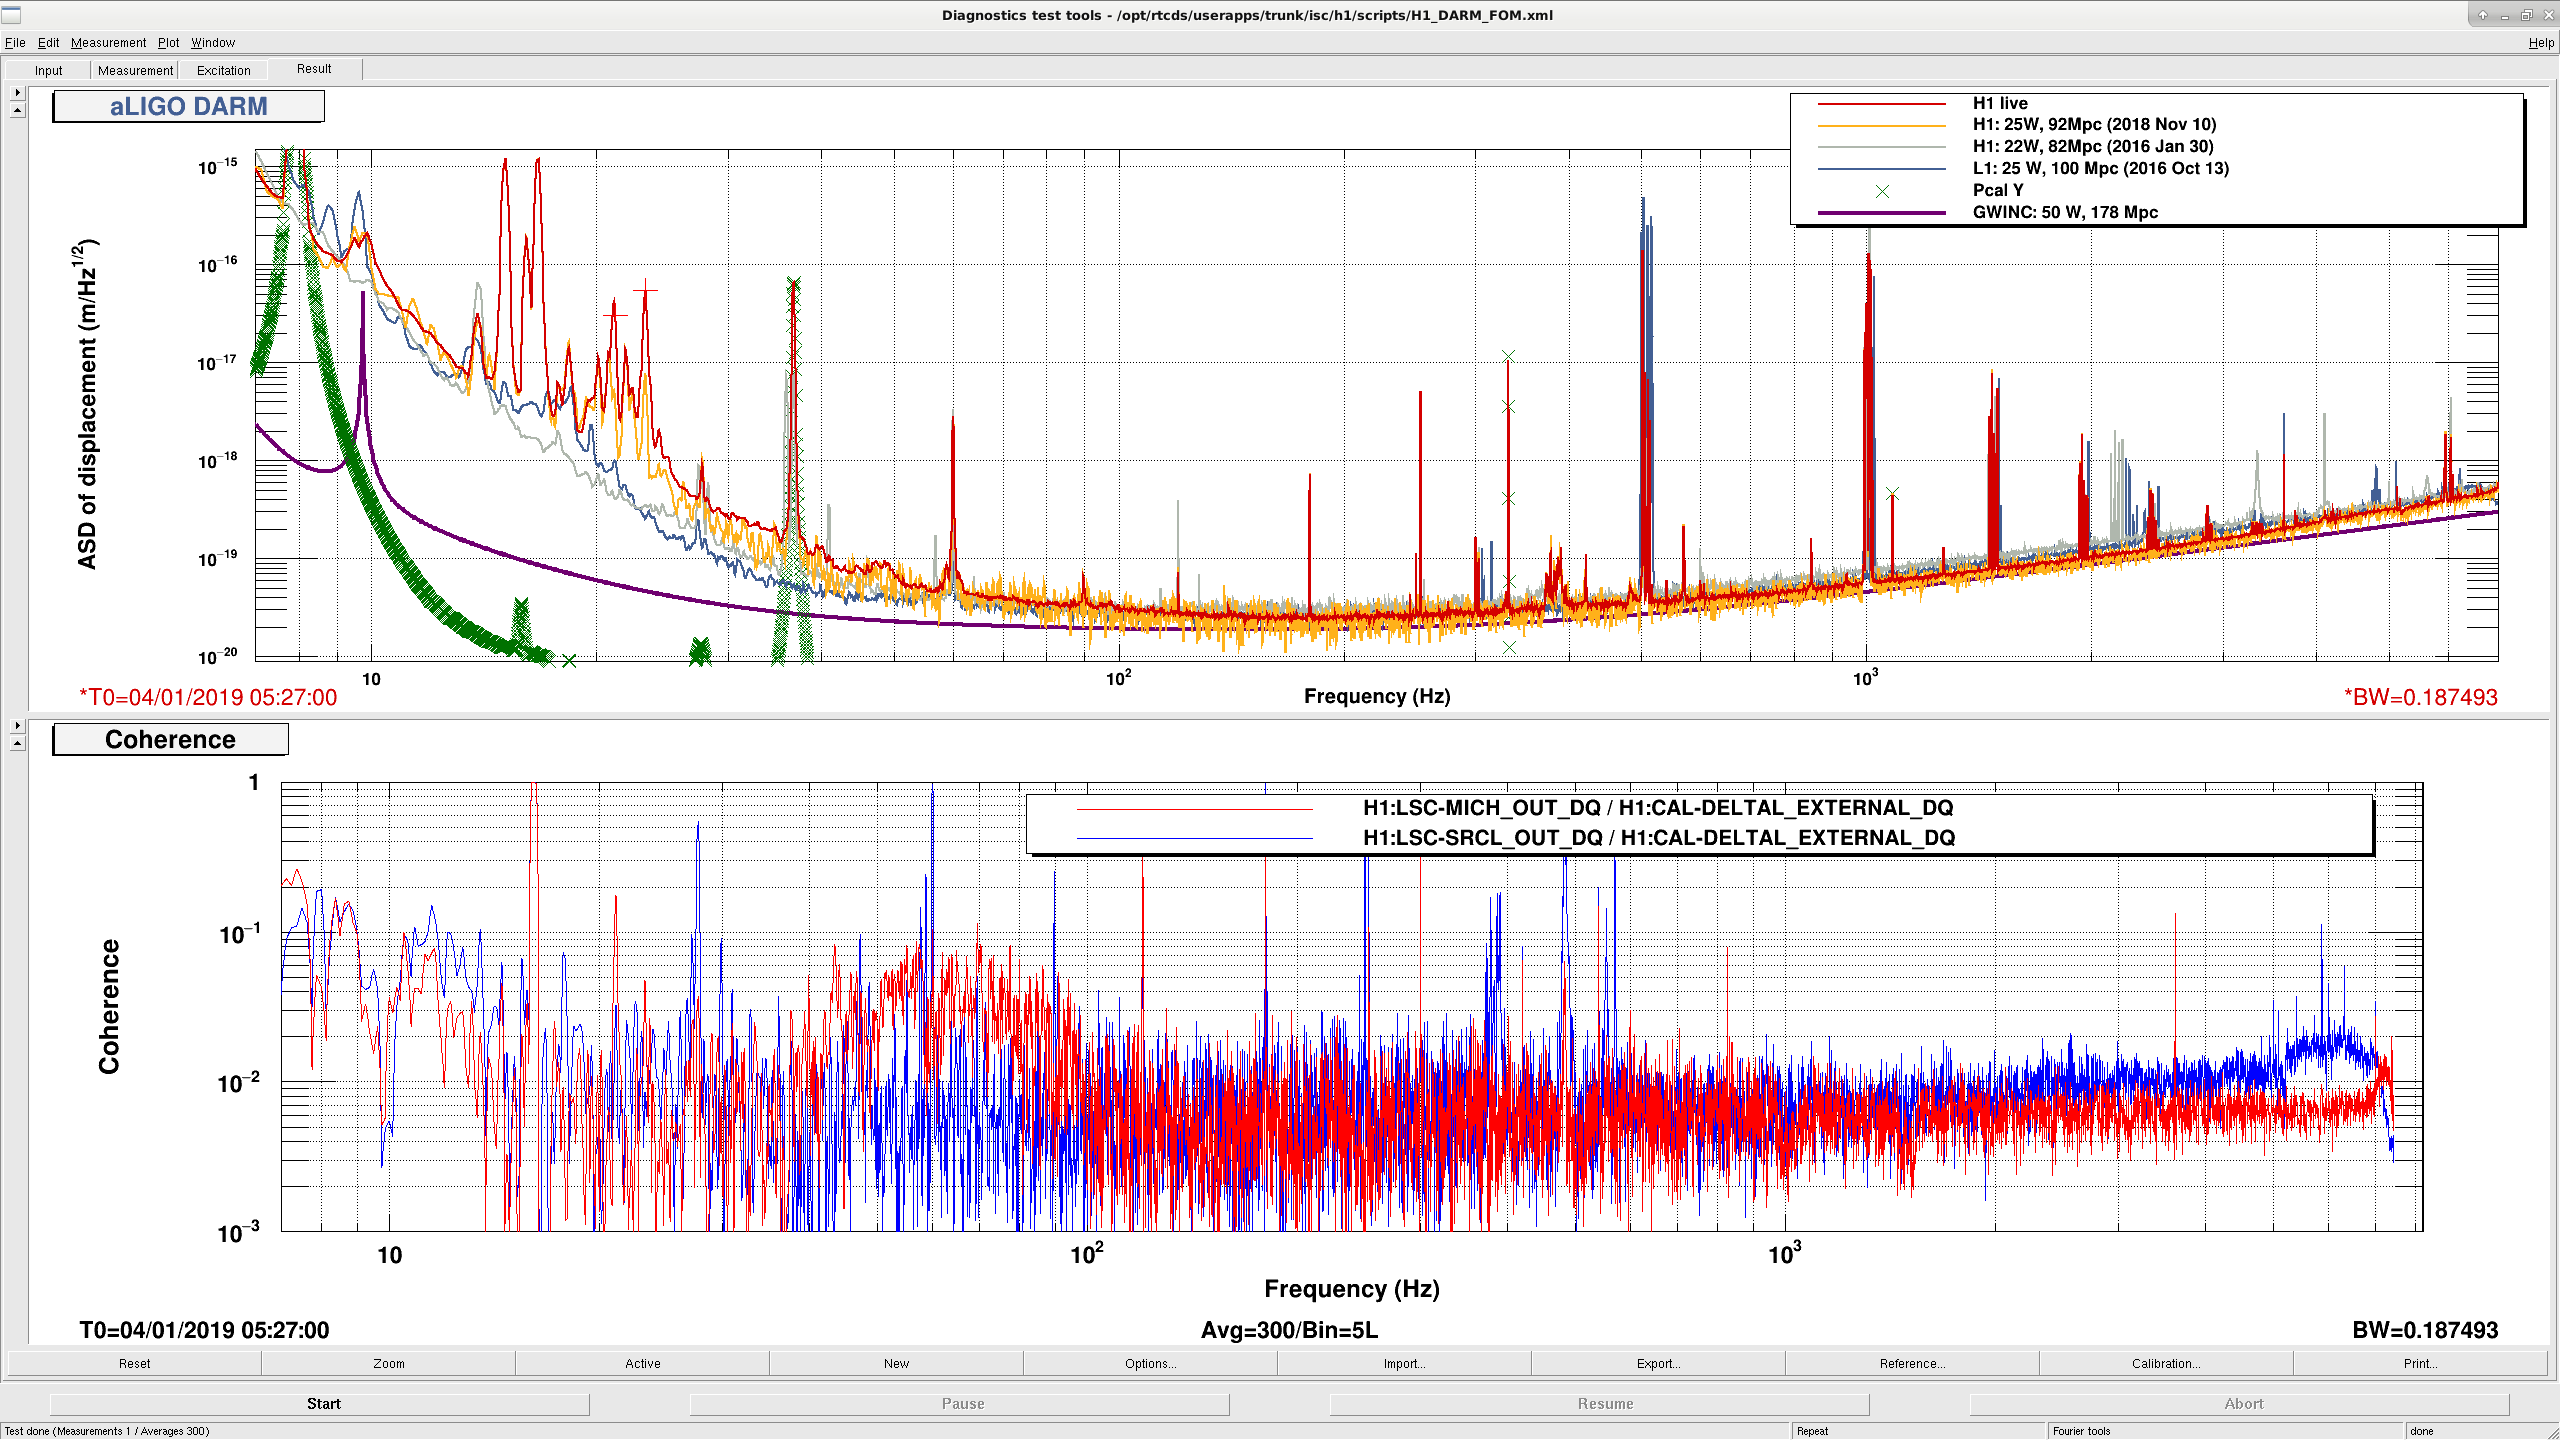
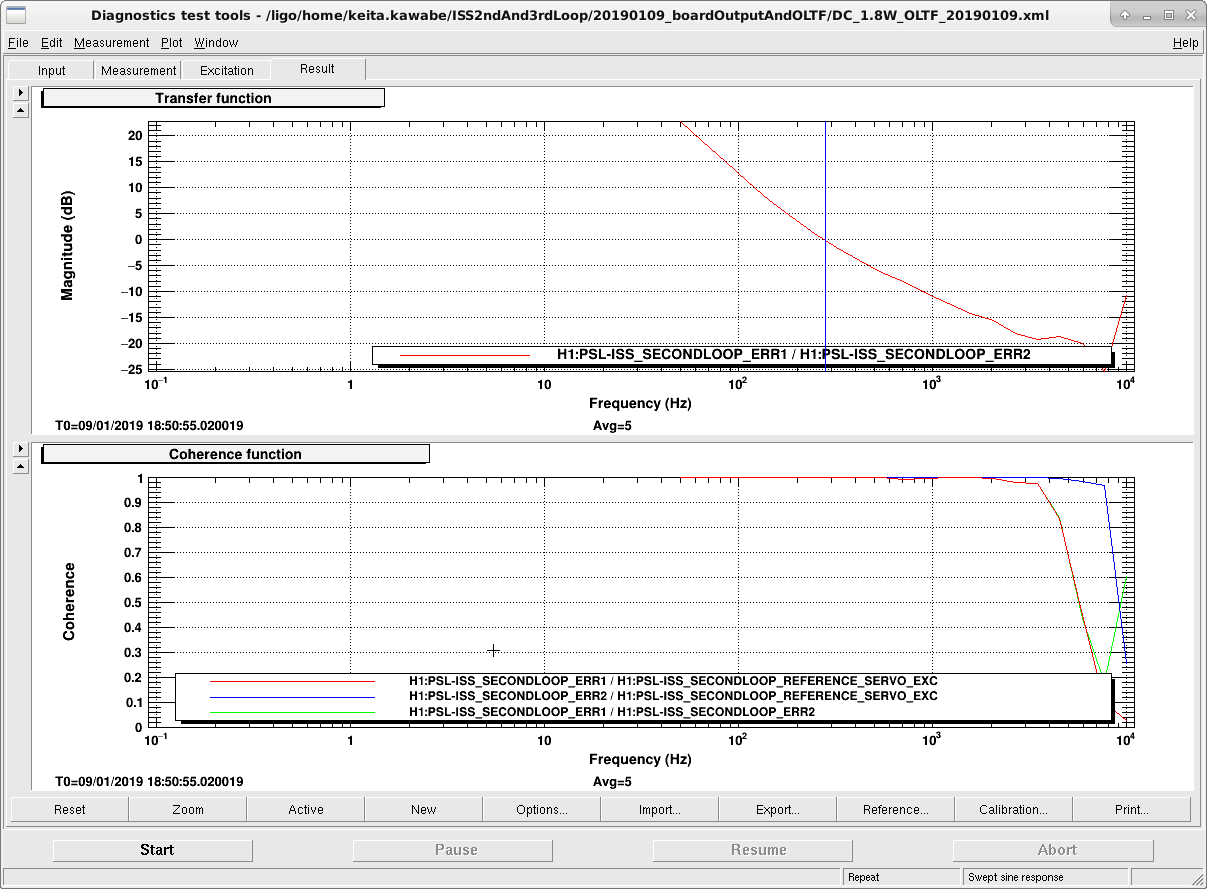
Second attachment shows that the board is either generating or picking up some noise at around 0.1Hz downstream of ERR2, driving the board output. Let me explain.
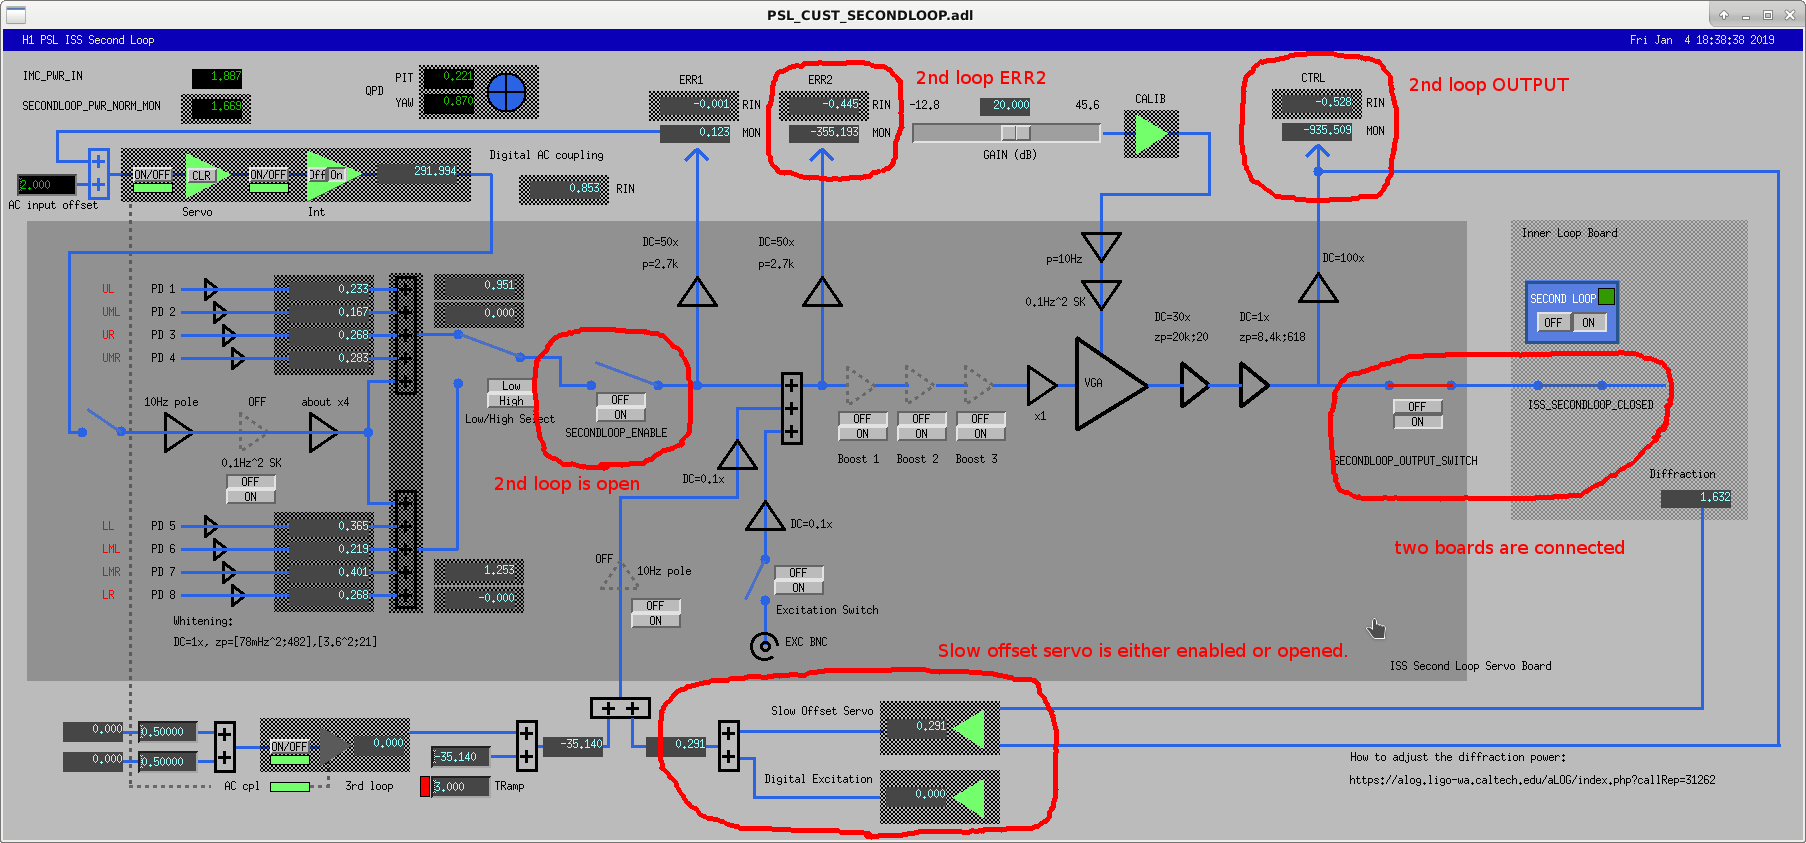
On the left is the non-driven noise transfer function from ERR2 to OUTPUT. ERR2 is the error point readback downstream of the summation point for the slow offset feedback. Live and ref traces show the slow offset feedback on (live) and off (ref). See the third attachment to see the board configuration and to understand which channel is what.
Without slow offset feedback(left of the left plot, blue), the coherence at 0.1Hz is almost 1, but the transfer function, which is supposed to be 56dB for f<20Hz, is about 20dB larger than it should be.
With slow offset feedback (red), the coherence at 0.1Hz goes down but instead the coherence becomes high at a few Hz, and where the coherence is high the transfer function is 56dB (red). That's because the board output didn't change for f<0.5Hz or so with or without slow feedback (right top panel of the left plot), but ERR2 increased for f<10Hz when slow offset feedback was on, and this was also visible in the board output in [1, 10] Hz.
When you make a driven TF even when slow feedback is on (right of the left plot) it was right at 56dB, though.
All these mean is that ERR2 (when slow feedback is off) and OUTPUT see the same noise peaking at 0.1Hz (because coherence is 1) and that the noise cannot be present in the board upstream of ERR2 i.e. summation point output (because TF is not 56dB). The noise in OUTPUT is a real problem and it seems to have become worse recently, judging from people's complaint.
Noise in ERR2 is probably not a real problem as that is not causing the OUTPUT to swing, at least not as of now. ERR2 monitor is merely picking the same noise somehow, quite possibly it's picking up the OUTPUT directly.
I don't have any explanation for the noise shape peaking at 0.1Hz.
[Daniel, Keita, Jenne]
Marc and Richard are looking into whether we have a spare ISS Second Loop chassis (it sounds like we do), to swap in. The output of the current board is drifting a lot, about 30mV pk-pk (it's roughly 10,000 counts that we are seeing on the monitor, which translates to about 30mV at the actual board output once you take the 100x gain of the monitor into account).
This noise is being introduced between the 1st and 2nd boosts. Engaging either boost 2 or boost 3 seems to amplify the noise, and the output (H1:PSL-ISS_SECONDLOOP_OUTPUT_MON) moves by a huge amount. However engaging only boost 1 does not amplify the noise. With only boost 1 engaged, the offset is increased as expected, but the pk-pk output drift is back to about 10,000 counts. We had also changed the output gain (H1:PSL-ISS_SECONDLOOP_GAIN) and saw that the noise is amplified by that gain. Since this gain is after the 3 boosts, we started working toward the input of the board, and tried engaging the boosts one at a time, as described above.
Keita had a look at the schematic (D1600298), and the current suspicion is that the switch for boost 1 is busted. Perhaps when we're requesting that boost 1 be off (bypassing the opamp stage), the switch is still a little bit connected to the output of the opamp stage, so we're getting weird feedback loops that shouldn't exist. This weird feedback loop could be how the error point monitor (H1:PSL-ISS_SECONDLOOP_ERR2_MON) is coherent with this noise, since that monitor is at the input to boost 1.
If we have a chance today (otherwise it'll happen tomorrow) we'll swap in the spare ISS second loop chassis, and can confirm the problem with the currently-installed chassis, and replace that switch.
Other observations are that if we significantly increase the gain of the slow reference servo, we can suppress the noise that is being introduced between the boost stages. However, that would mean that the reference servo is marginally stable, so we don't actually want to run like that. (And, anyway, we want to fix the problem, not just work around it). Also, Sheila and Keita were able to DC couple the ISS second loop on Thursday (alog 46229), and when the loop was DC coupled the noise was again suppressed.
For our current lock, we have the Second Loop board entirely disconnected from the First Loop board (switches H1:PSL-ISS_SECONDLOOP_OUTPUT_SWITCH_MON and H1:PSL-ISS_SECONDLOOP_CLOSED are both open).
So much for the broken switch theory.
I and Fil changed the chassis (old one: S1700062, new one: S1700063) but it seems like the noise didn't change much if any. In the attached, current traces are now and references are with the old board.
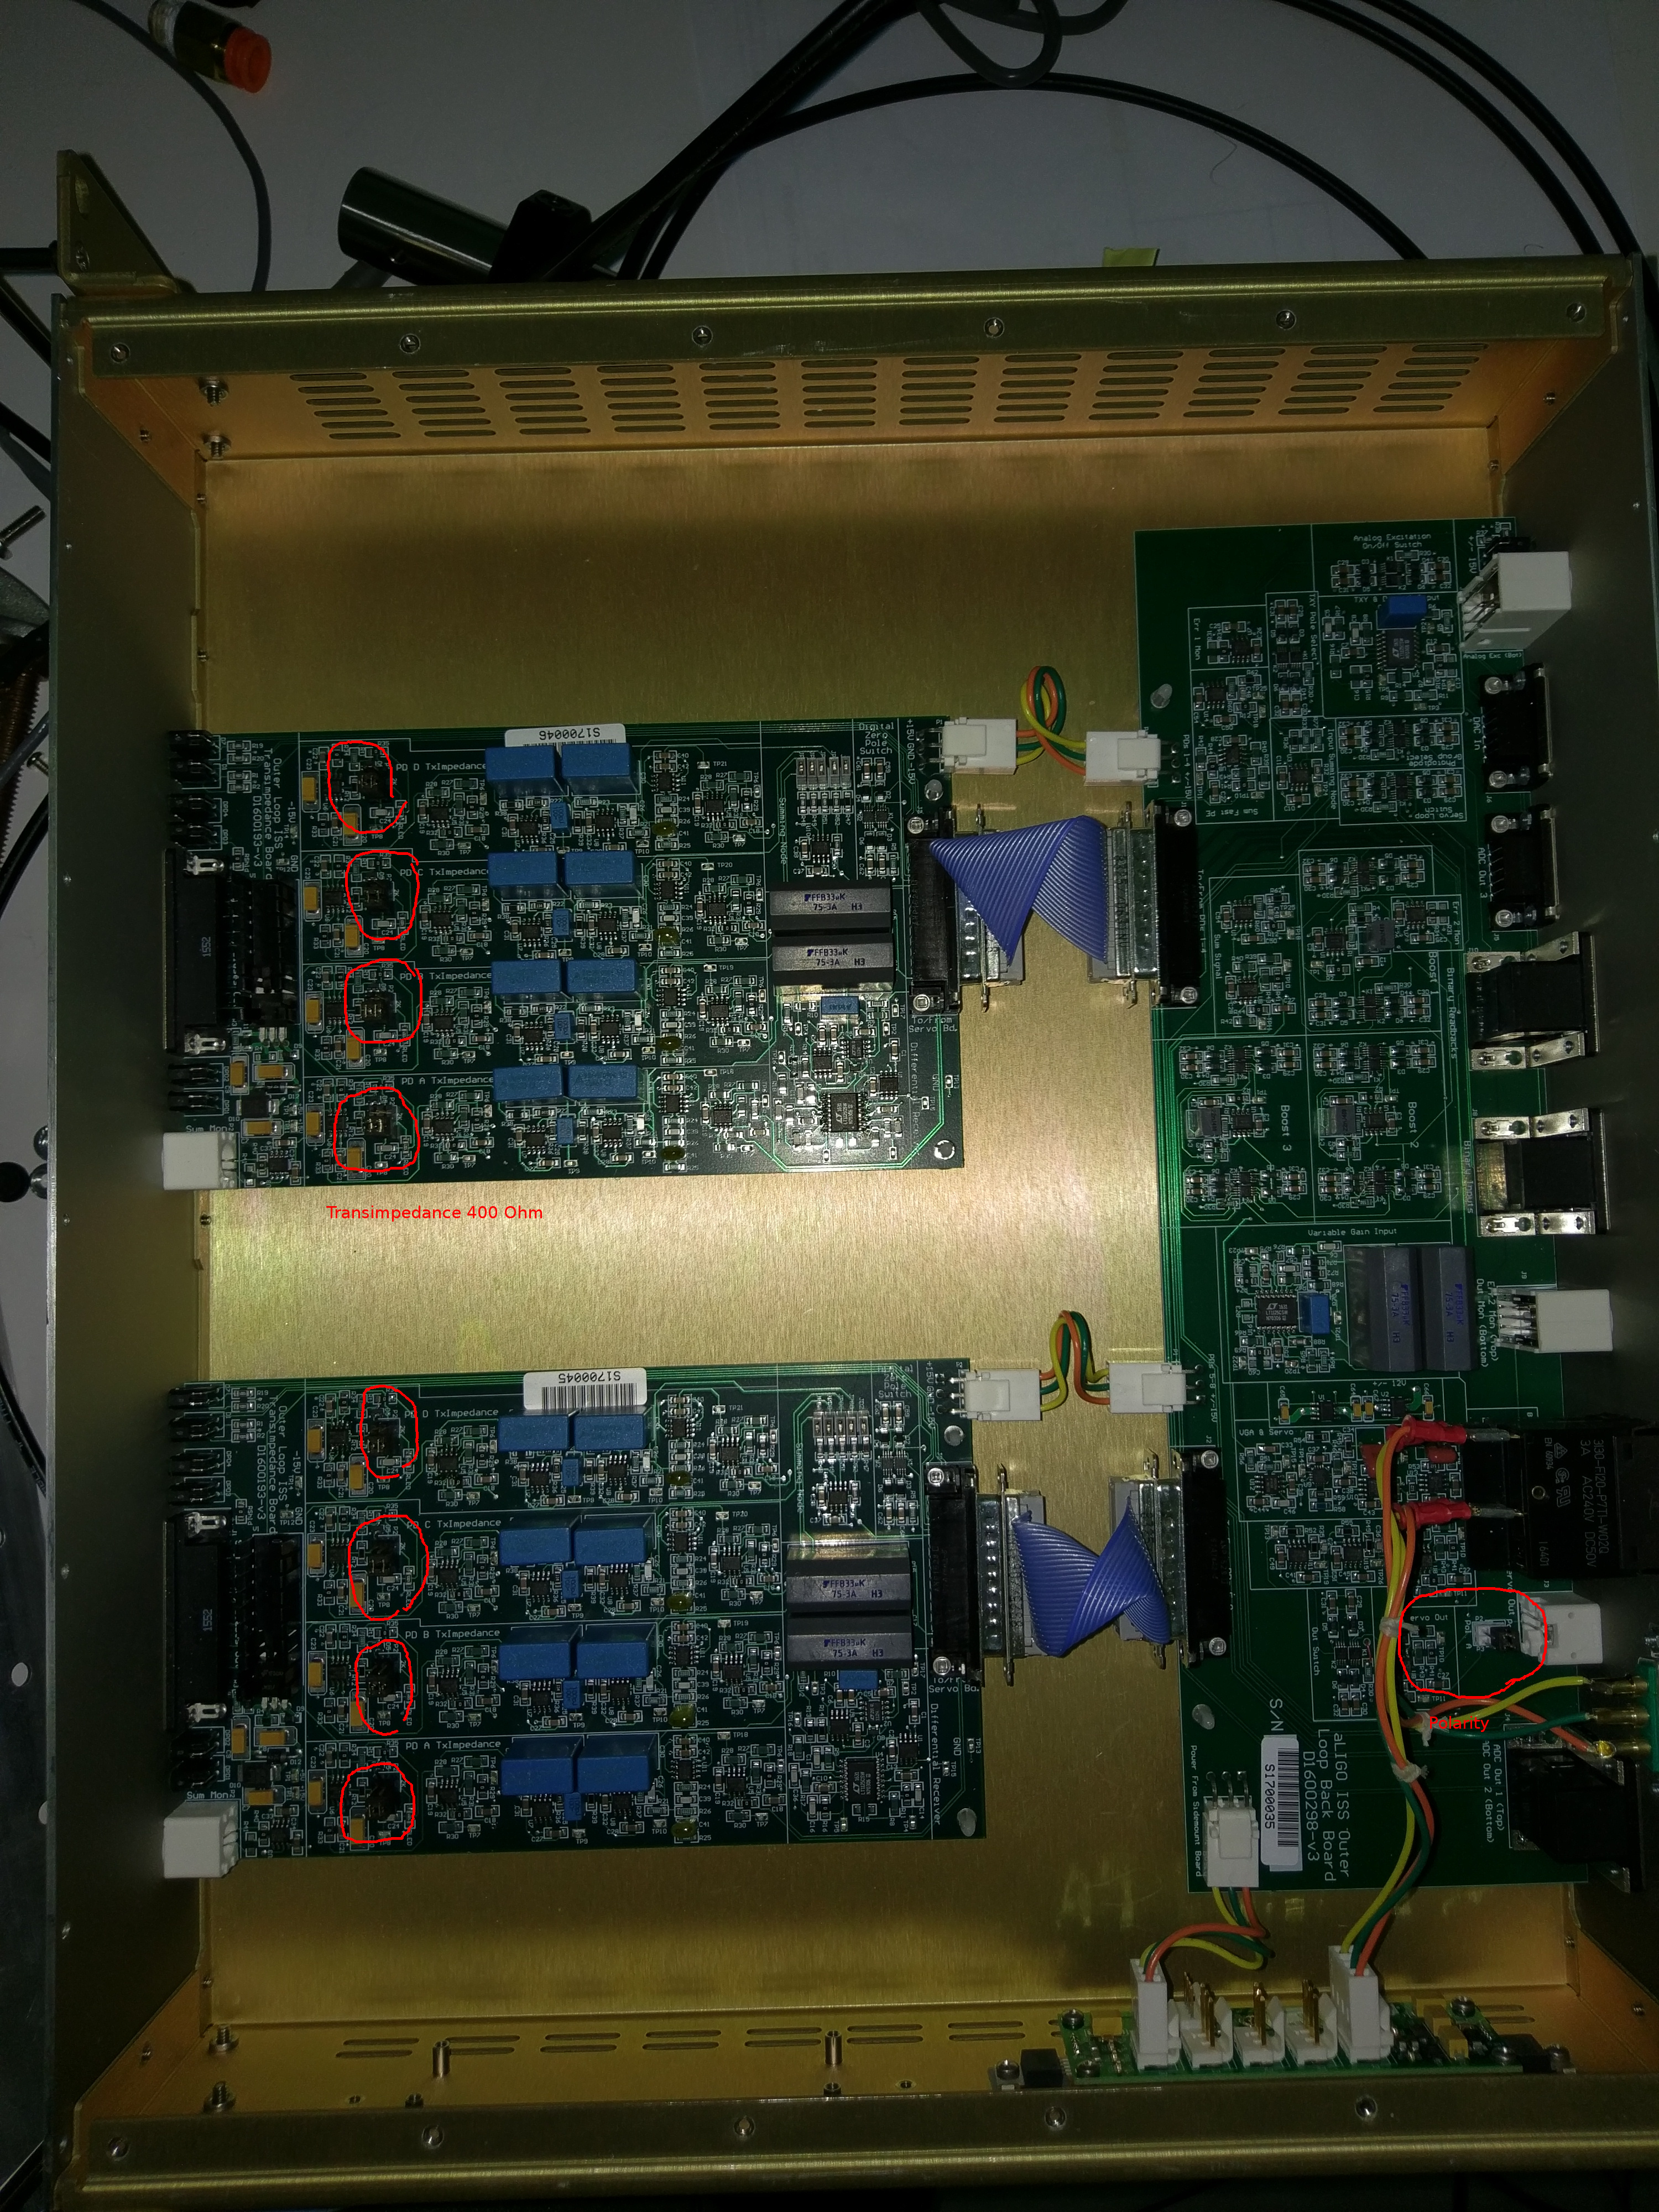
BTW, just for documentation purpose, attached is the photo of the boards with jumpers for correct transimpedance (400 Ohm) and output polarity.
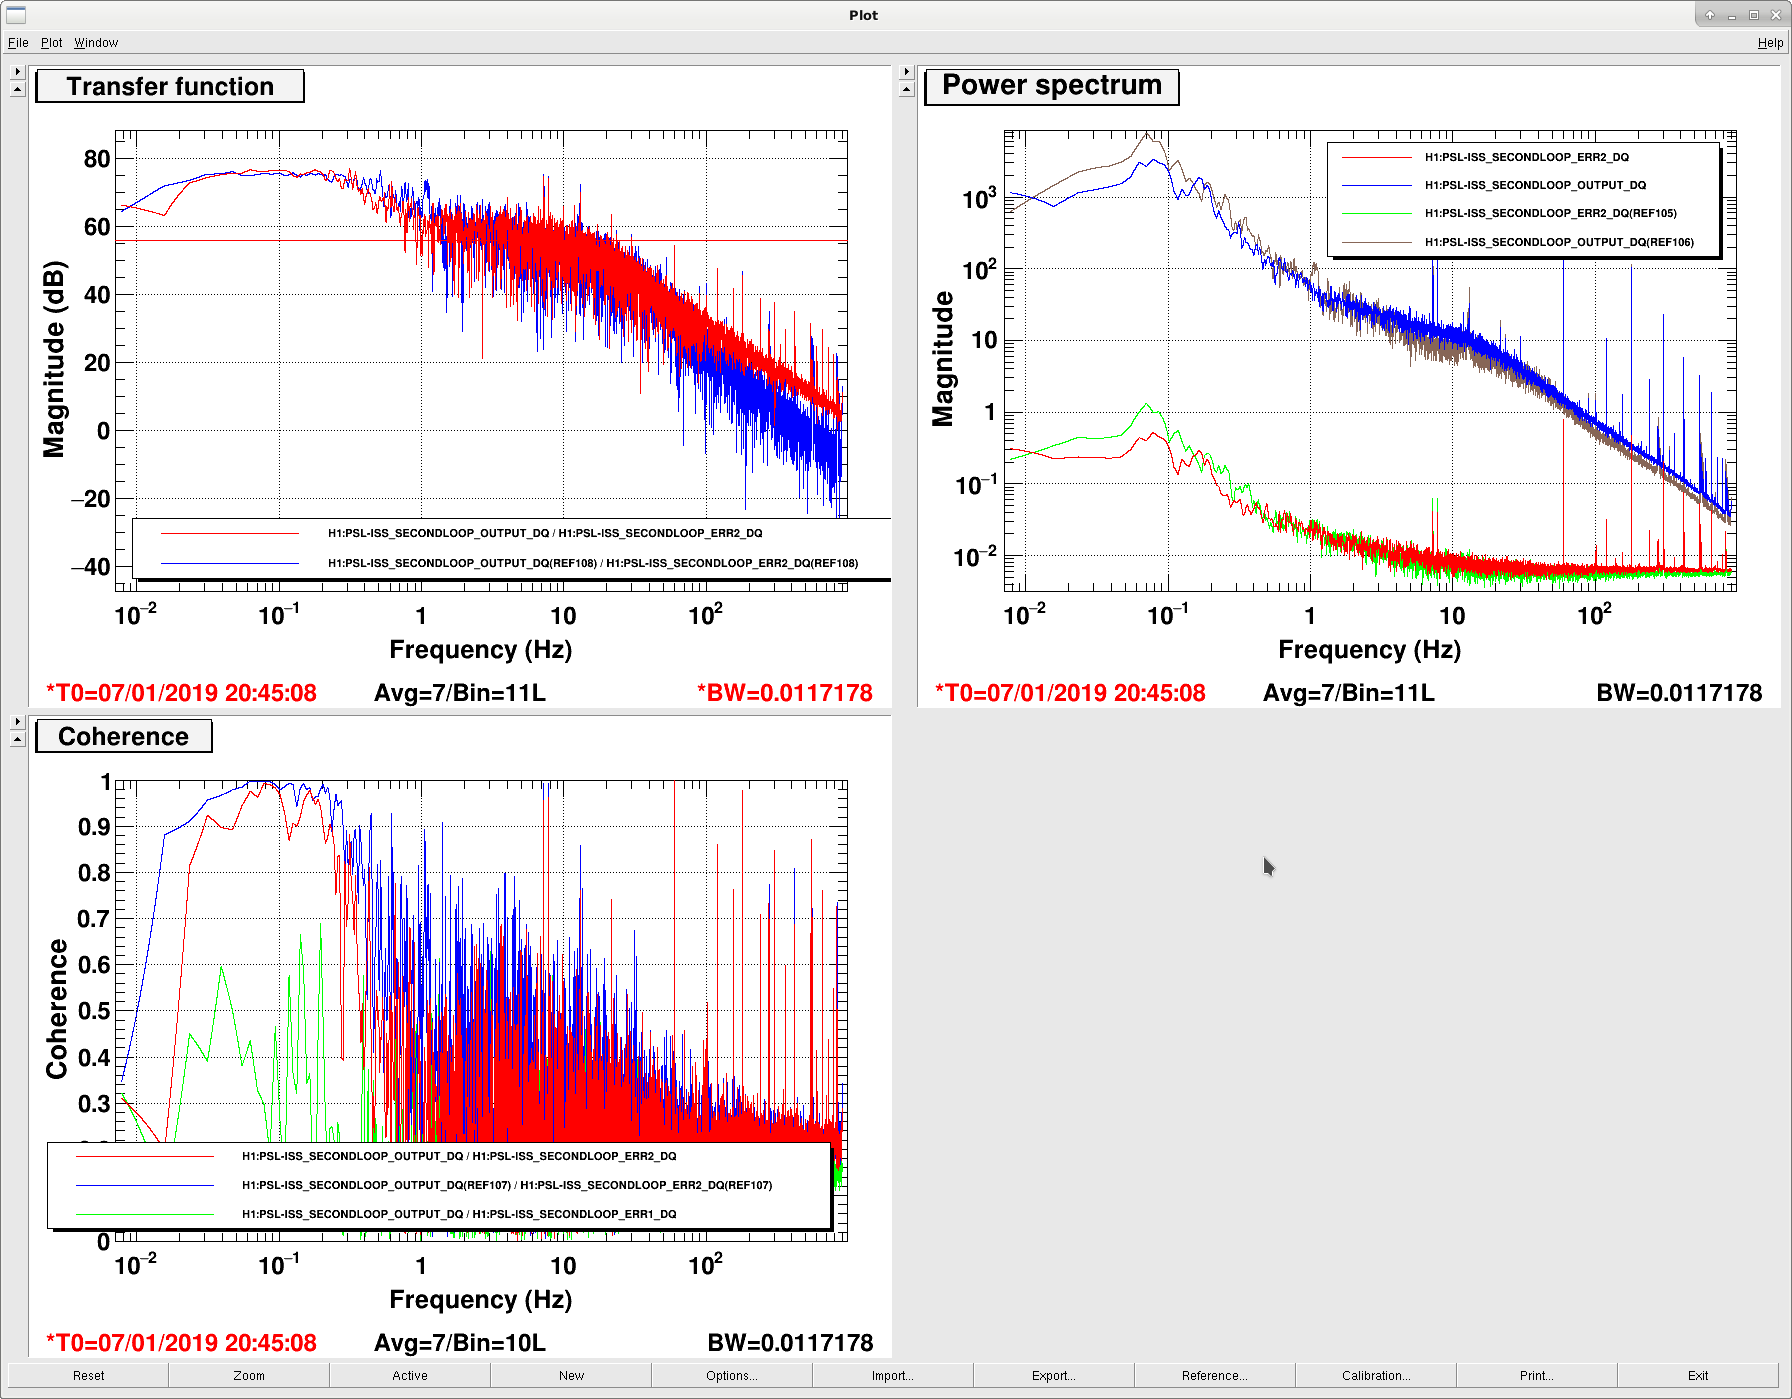
Note that the noise goes up and down on its own. Today at random time I measured the board output and the peak at 0.1Hz was much smaller than it used to be though it's not gone either (1st attachment).
Also as a side note, ISS 2nd loop gain is too small, though this is not related to the problem discussed in this thread (2nd attachment).
At 2W, DC coupled, no boost, with 20dB slider, UGF is about 280Hz, and the UGF will only increase to about 4.7kHz or so at 30W, but we should push it to 10 or 20kHz (that's what we did in O2).
Since increasing the slider before DC coupling will only worsen the problem discussed in this thread, we need to think about increasing the slider after DC coupling the loop.
Marc Daniel
The output offset shifts seen in the installed units cannot be reproduced in the shop. There, the unit seems to be at least 10 less "shifty."
We discovered an unused OpAmp in a 4 device package that wasn't connected to anything (U2B on D1600298). Not a good idea, since it could be oscillating and effect the devices in the same package.
Things to consider in D1600298:
- Connect the output of U2B to the negative input and ground the positive input.
- Reduce the input gain of the TXY digital input even further by replacing R77 with 100k.
- Increase the upfront gain by changing R32 (may also require an OP37 for U3).
- May need to compensate by decreasing the gain later, for instance, by increasing R54.