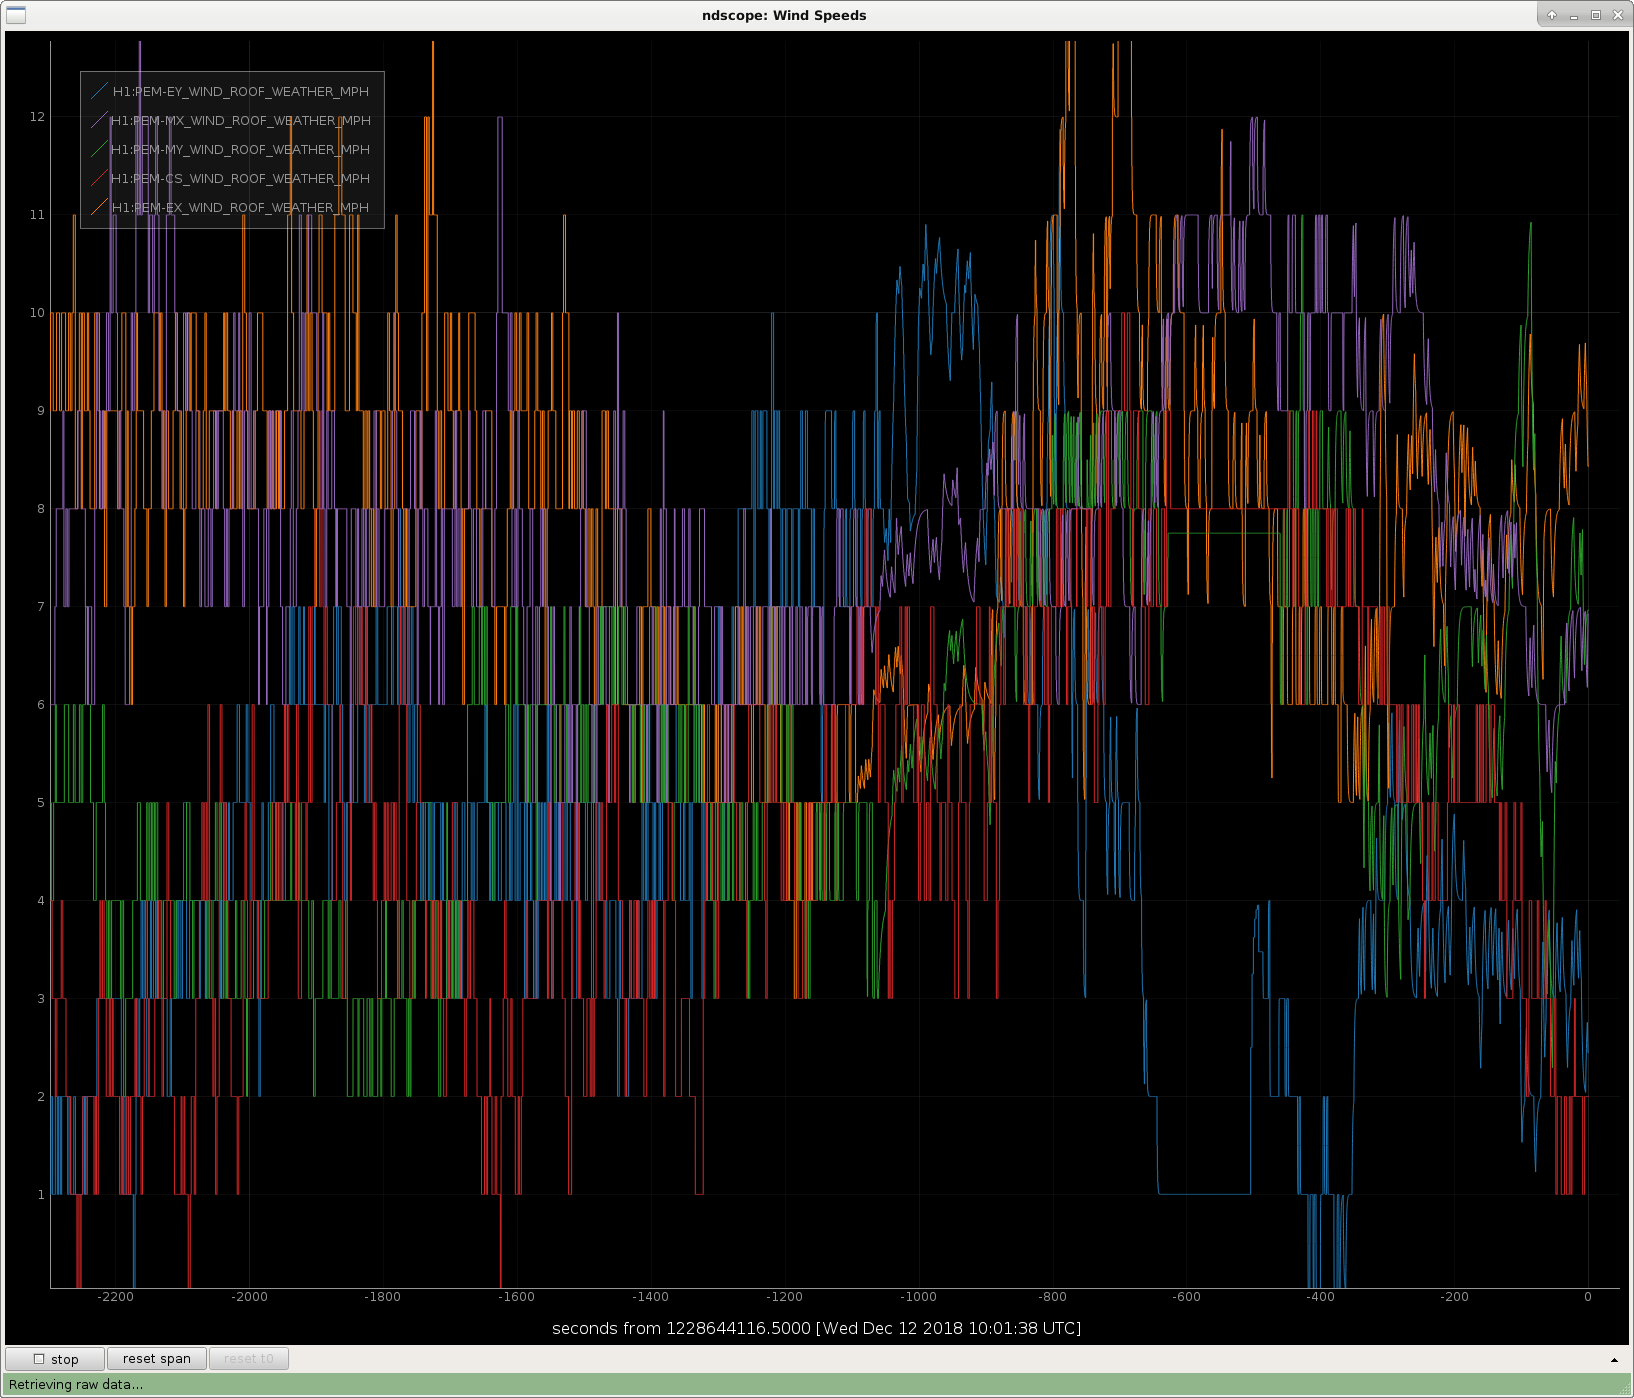
We have been having locklosses due to the glitches which seem very similar to the ones that happened when we had a laser safety tag hitting the ALS fiber in the HVAC wind. This seems to have started or gotten much worse on tuesaday. We looked at fibers in the MSR, and they are still in their protective tubes.
Does anyone know of work on Tuesday which might have changed something near the ALS fibers?
At the PSL rack, there is still a laser safety tag which is zip tied to the fiber and hanging off of it, causing strain. I temporarily set this to rest on one of the chassis, but it would be good to remove the tag from the fiber if we can.
After I touched the fiber the polarization arriving at the end station was wrong. If looks as though the polarization controller has been in error since Tuesday maintence. I am not sure what the polarization error means, but it cleared when I turned the box on and hit the reset button.

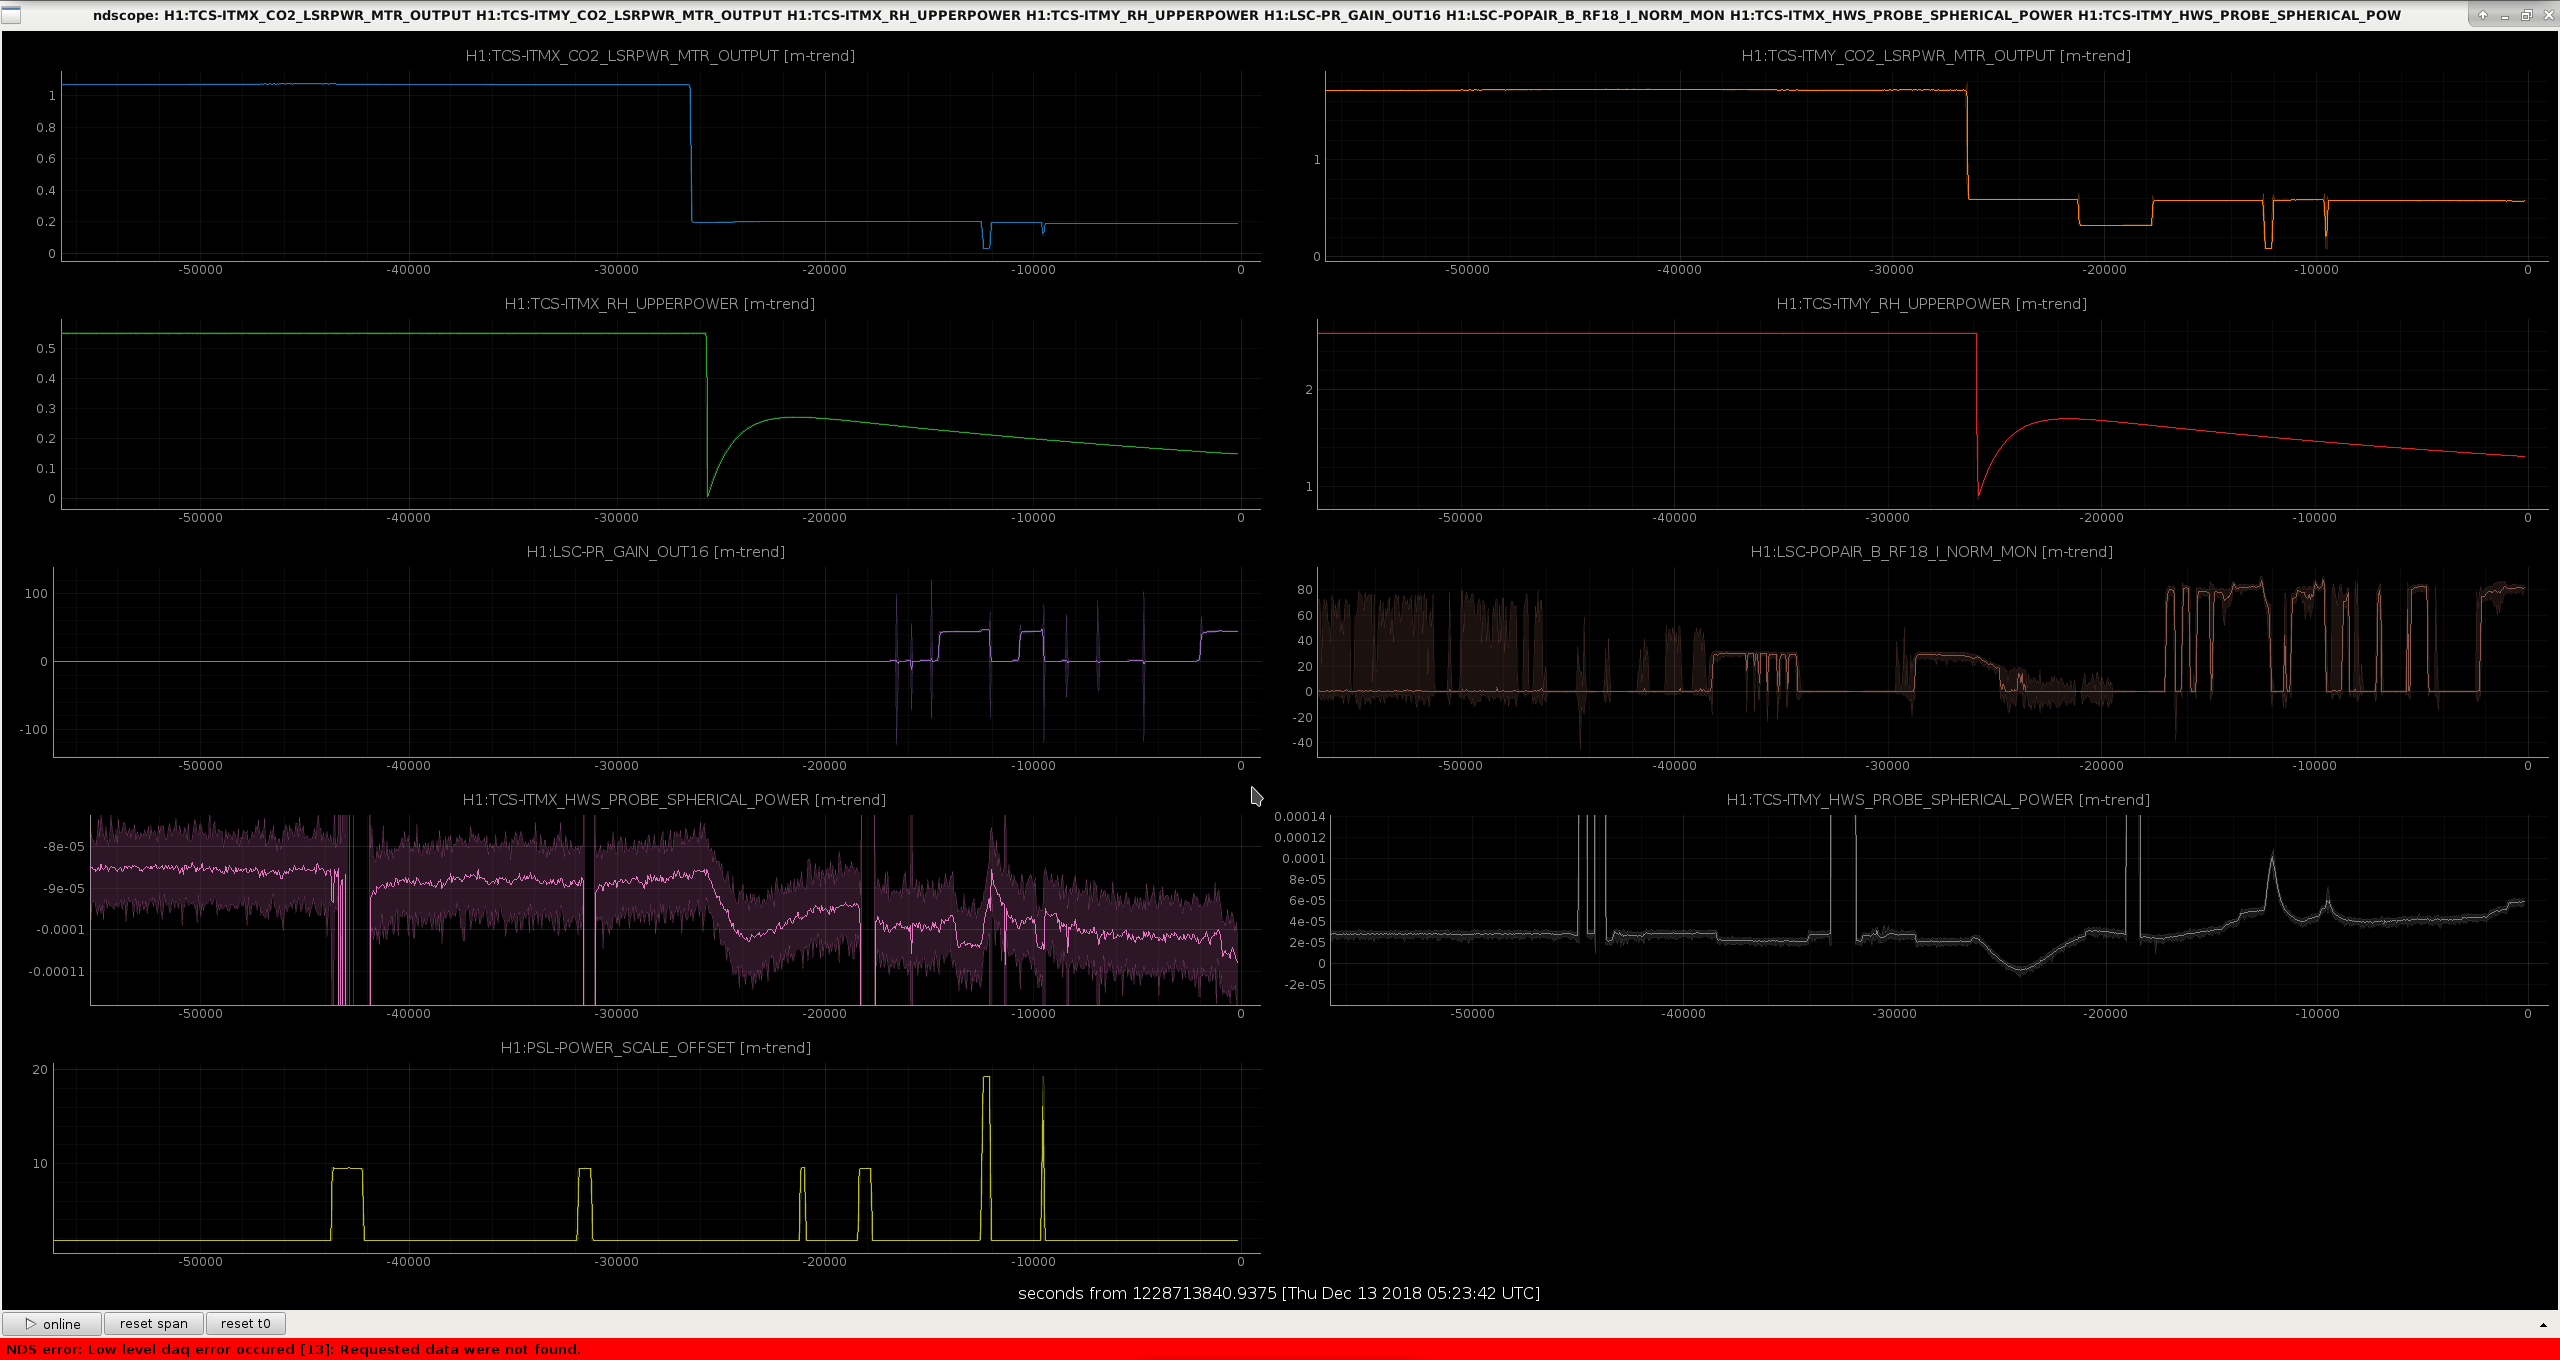

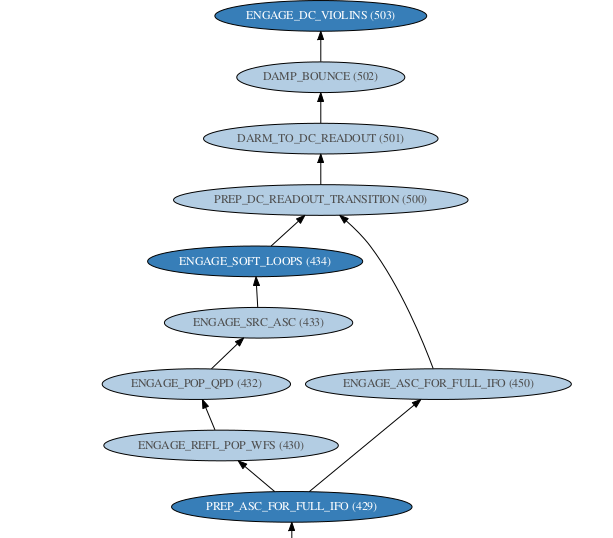


tried some arm alignments and more fiber polarization settings and different seismic guardian states, but the ALS is not keeping locked long enough to get through the DRMI sequence. Need to debug ALS glitches.