Rolf, Keith, Jonathan, Dave:
The Dolphin driver version used by the front end IPC system was upgraded from 5.4.2 to 5.7.0.
DOCS: Rolf and Keith's Gen 2 Dolphin installation document DCC-T1800016 and our installation wiki DolphinDriverUpgrade
Procedure was:
Before any driver changes, yesterday I compiled all models to create a clean H1.ipc file. At this point we discovered h1susmc[1,2,3] build issues due to a modified M1 sub-block which was fixed by Jenne.
Backup all the old 5.4.2 driver files.
Stop the dolphin networkmanager on h1boot1, disable auto start of user models.
Install the new 5.7.0 driver. Apply LIGO customizations.
Compile and install all of the front end models. Compile the h1cdsrfm long-range-dolphin switch code.
Stop all models (/etc/kill_models.sh on each Dolphin machine), h1psl0, sus-aux and mid-station pem exempted.
Stop dolphin node manager on all dolphined machines.
Start 5.7.0 Dolphin network manager on h1boot1. At this point nothing is running on the fabric.
Reboot h1lsc0 as a test node. Remember models do not auto start at this time.
At this point we ran into startup issues, which Keith was able to remotely diagnose and fix. Many thanks to Keith for his quick support.
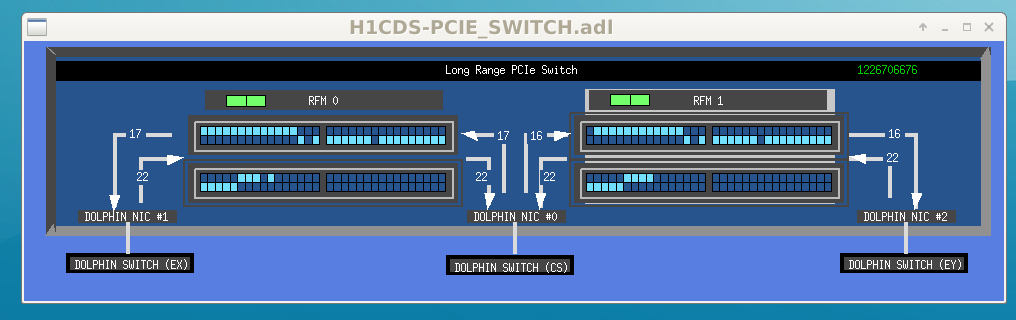
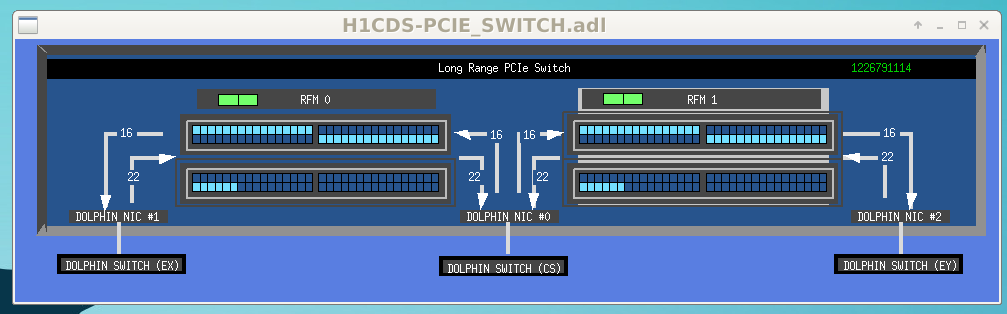
Each dolphined machine was rebooted, and we monitored their progress on the Dolphin administration GUI (see attachment).
Started the new h1cdsrfm code, the cleaned up H1.ipc file has filled in the gaps resulting from previous IPC misnaming and false starts in models (see attachments).
Once all the Dolphined machines were running, we still had a single node error. We realized that this was h1psl0 running the old drivers. These could not be removed because the iop model was locking them. Jonathan came up with the good idea or removing h1psl0 from the dis_hosts.conf file for now. We can add it back before O3 when the Dolphin IPC is needed for ISS third-loop operation.
At this point the Dolphin fabric was clean. We then started all the user models (except for PEM, SUS-AUX and MID-PEM)
A DAQ restart was required due to model changes for h1hpiham1, h1susmc[1,2,3] and h1susopo. A modified h1psliss filter file (resulting by the make-install) was reversed.
CDS Overview and IPC_STAT overviews are GREEN. All SWWD's were untripped and IFO operations continued around 14:30 PST.