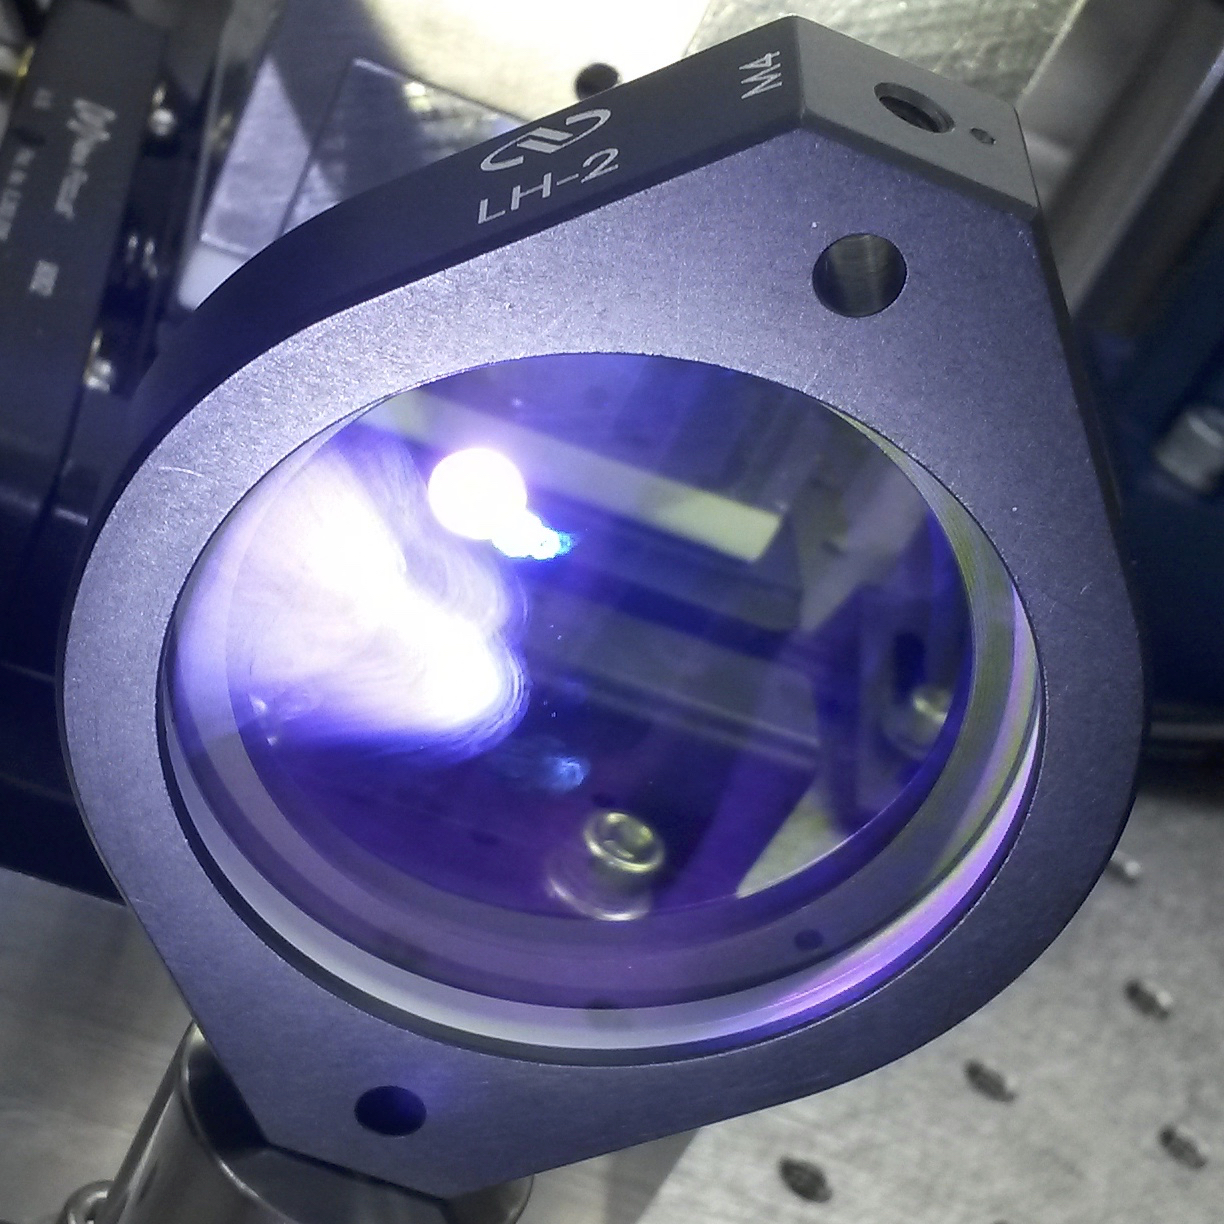
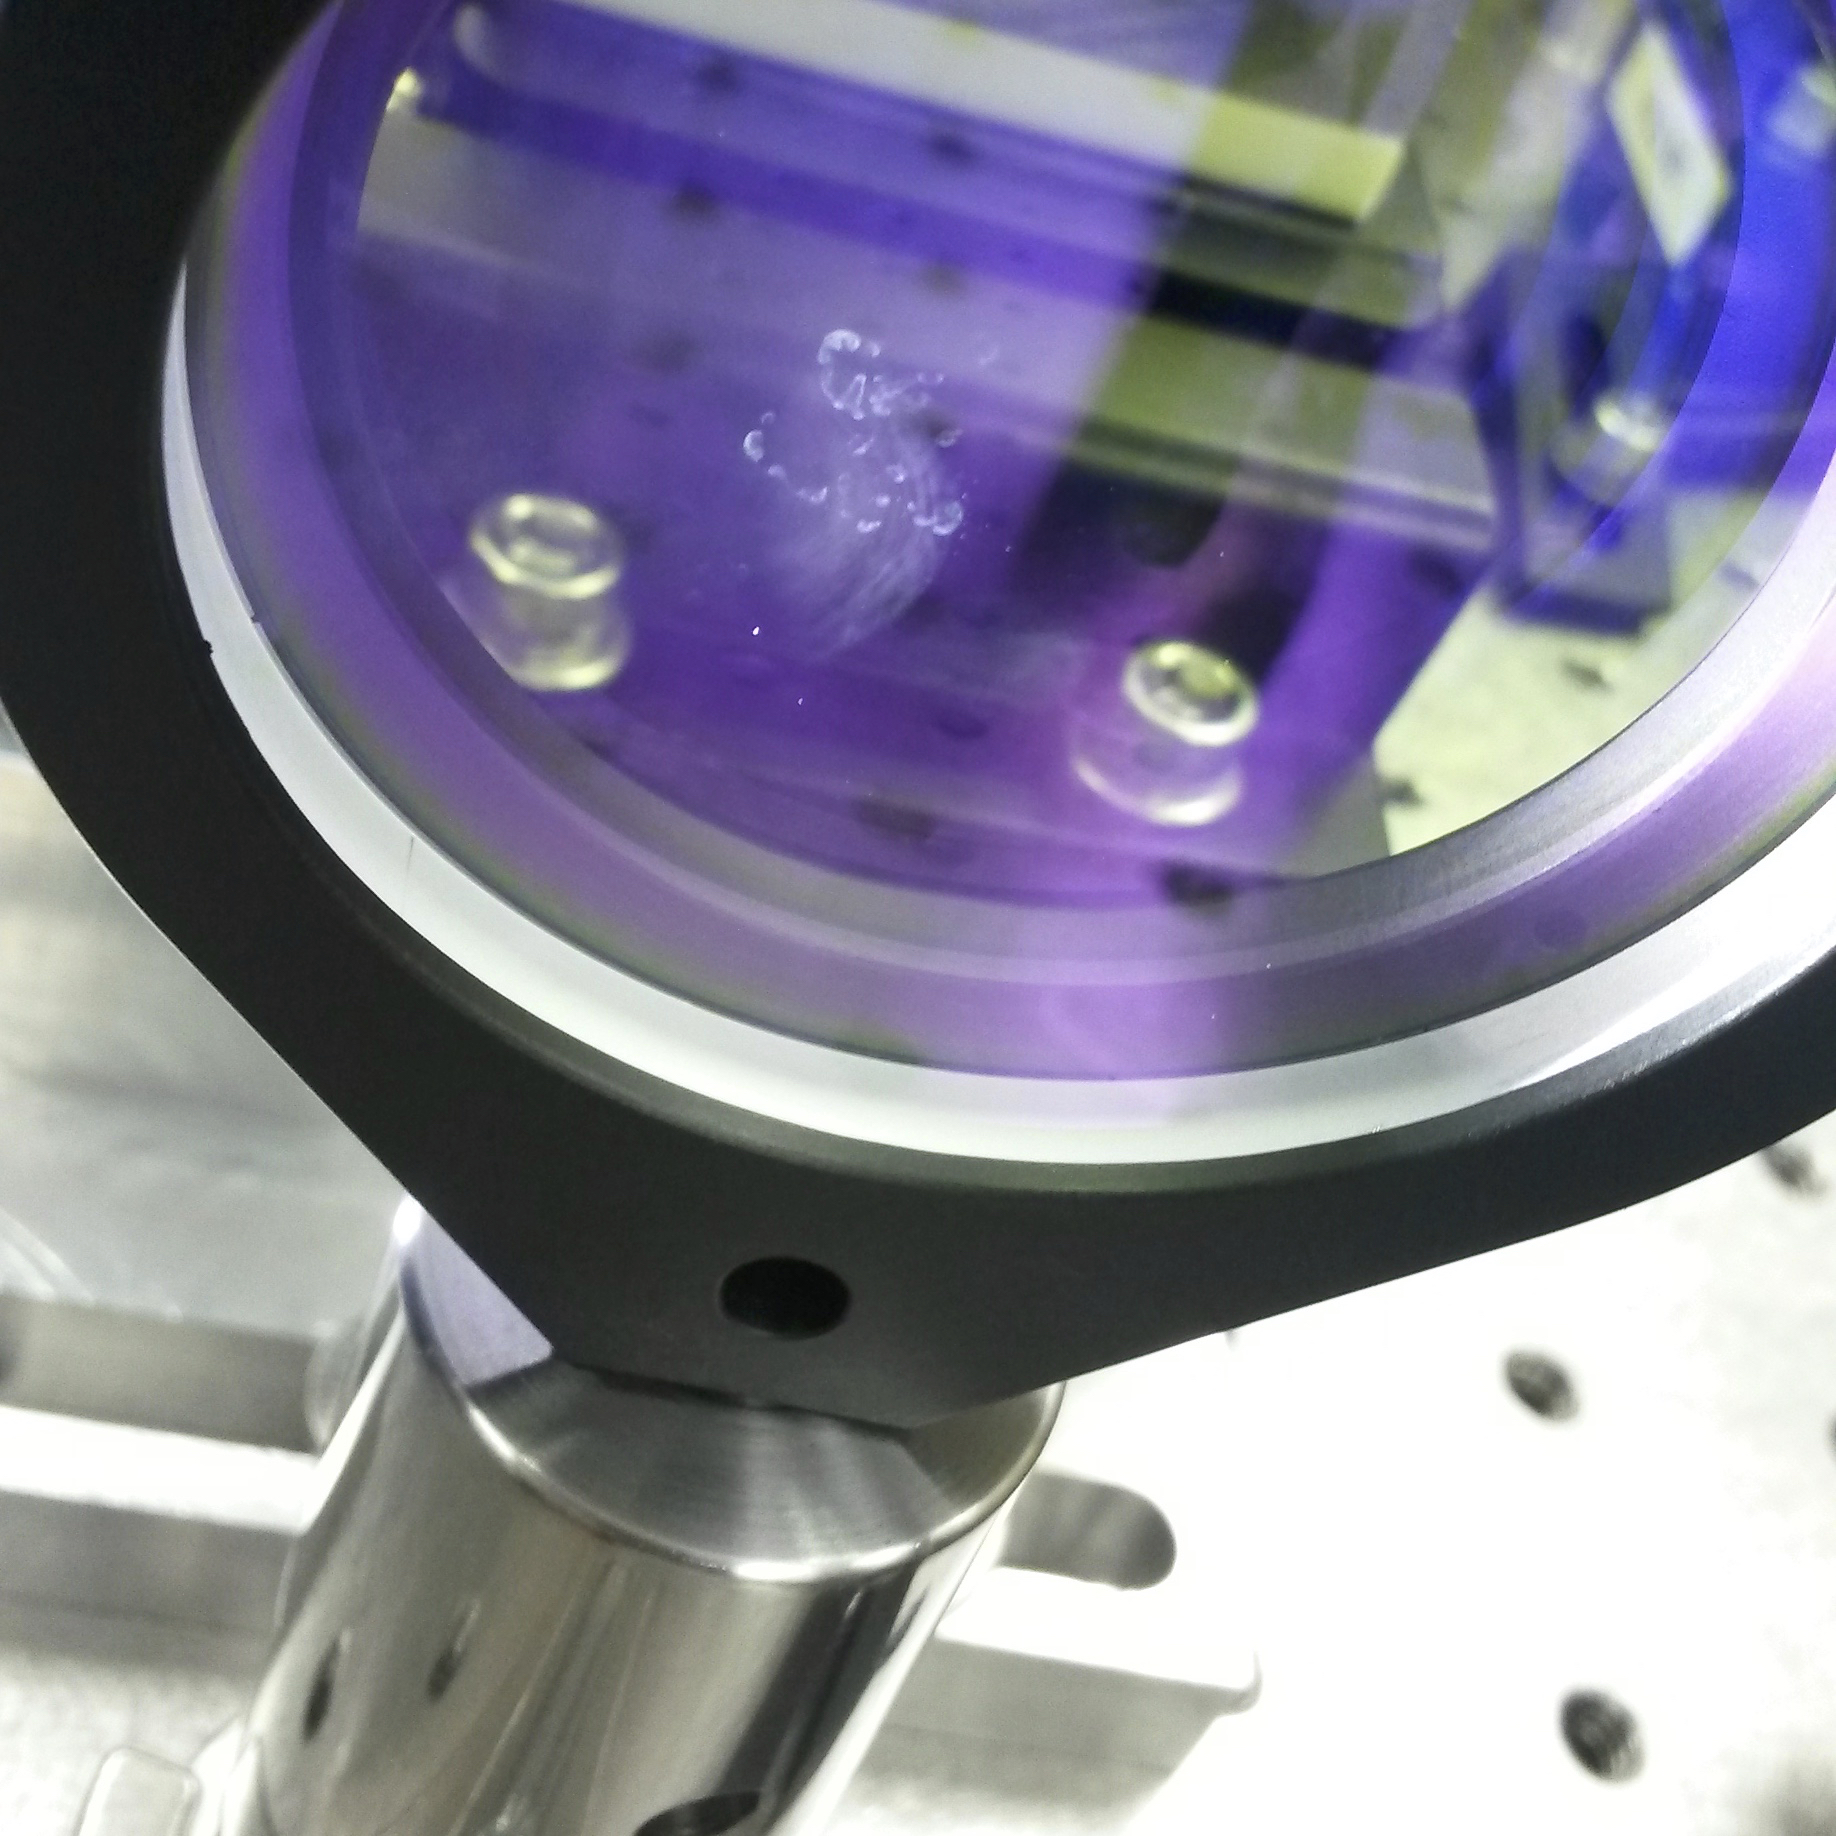
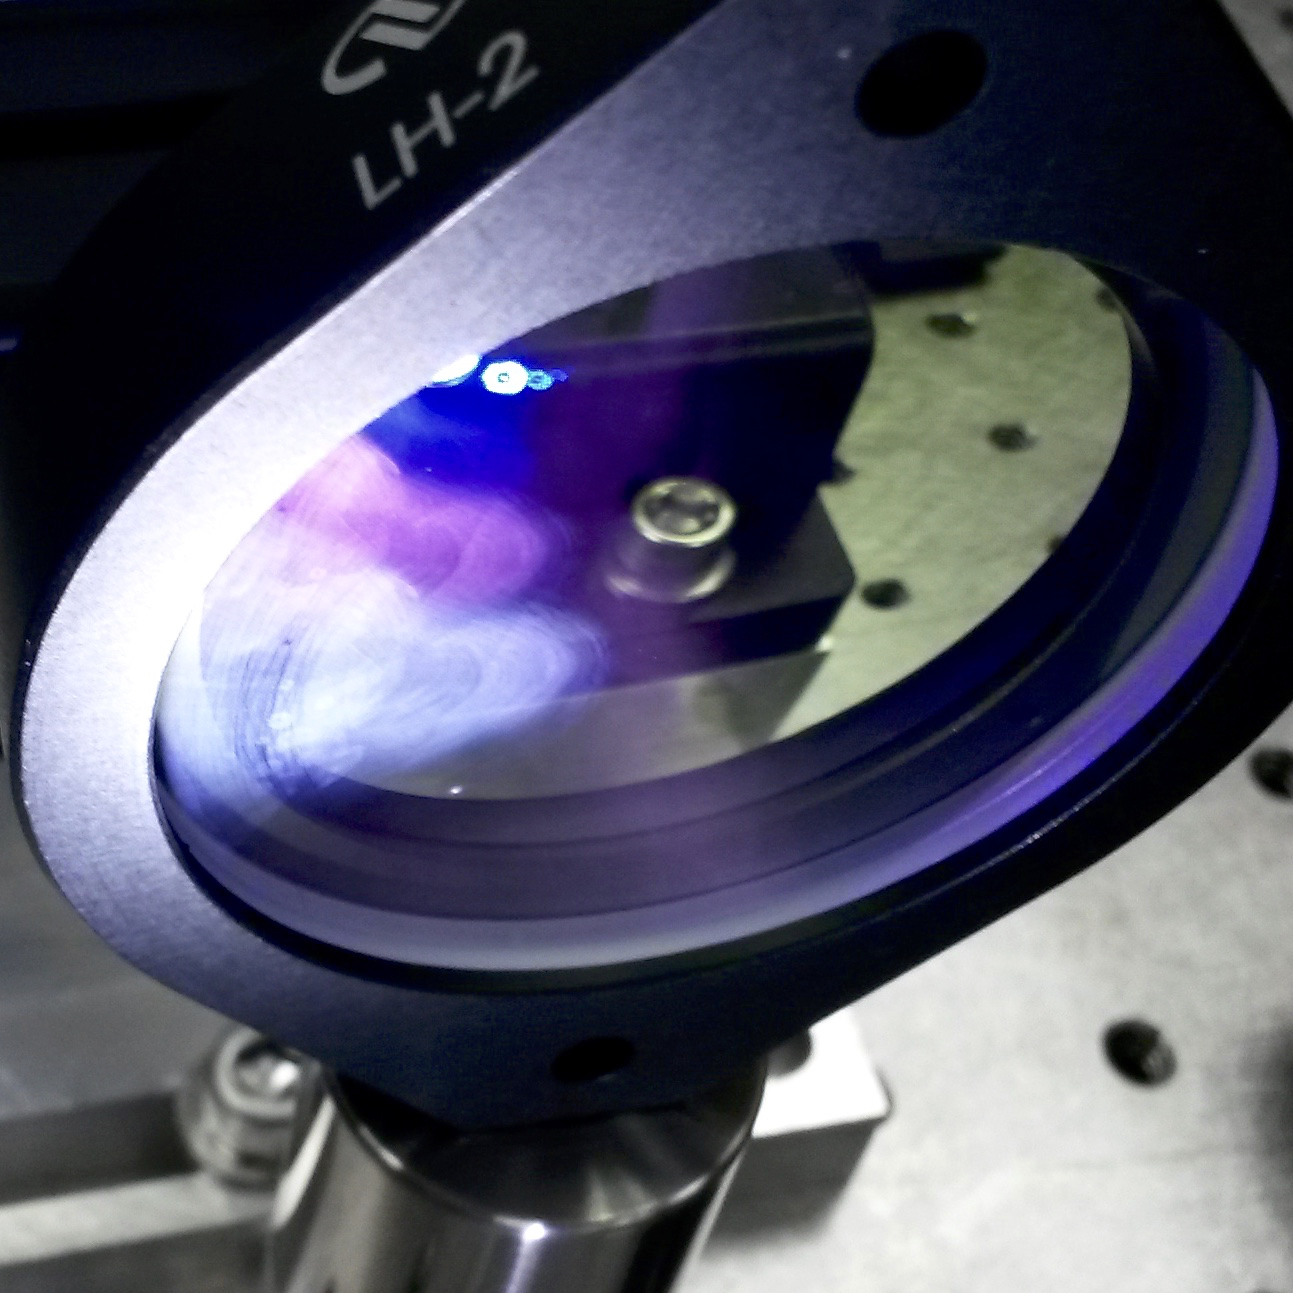
I inspected the optics in the IO path on the PSL, and discovered that L1, the first lens after the EOM, has one easily identifiable area on the surface near the EOM, and two easily identifiable areas on the surface away from the EOM, that are contamination/damage to the coating. Two areas are at or close to the center of the optic, the other area is about 1/8th of the optic that is covered in what looks like a thick film.
The first three images attached are of L1:
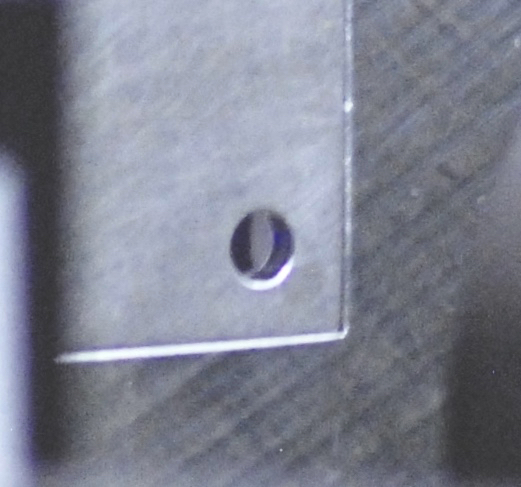
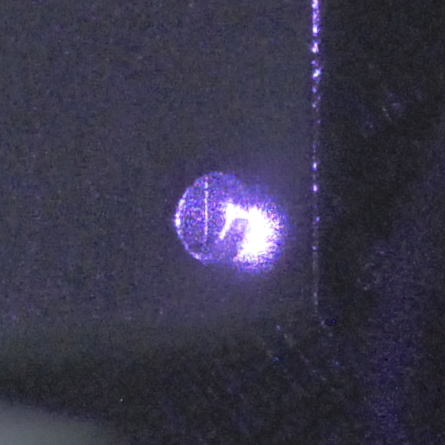
With L1 being very close to the EOM output, I was not able to see the output face of the EOM crystal, so this still needs ot be inspected, and the best opportunity to do this is when L1 is replaced. The EOM crystal surface sits within a few mm of housing aperture, so it can be seen through the EOM housing.
The last two images attached are of the EOM output aperture and crystal:
I talked to Daniel, and he saw the images, and we talked about replacing this lens after recovering the IMC, so next week or later, and before O3.
Chris S., Gerardo M., Kyle R.
We put the north door back on BSC10 this afternoon. Particles counts were < 100 for the displayed sizes at the time the soft cover was removed.
Inspection revealed two areas of missing viton from the outer O-ring. Viton was not stuck to the door in the corresponding area of the door flange thus indicating that, most likely, this had happened in the past. Since this outer O-ring had been leak tight leading up to this most recent door cycle, we went ahead and reused this blemished O-ring -> but helium leak tested this shortly after pumping down the annulus volume - just to be sure :)
Measured dew point of purge air entering the Y-end was -45C and exiting was -32C (just prior to start of pump down).
With the Y-end vacuum volume having been "blown down" to atmospheric pressure and 15 minutes after starting the pump down I noticed PT410's indicated pressure was >820 torr -> Gerardo was then able to adjust the "ATM" potentiometer on PT410 such that it then agreed with the pirani gauge at the turbo inlet.
J. Oberling, P. King, J. Bartlett, R. Savage
Following on from yesterday's plumbing work, today we concentrated on recovering the 35W FE, the 70W amplifier, and completing the remaining items from FRS 10753.
This morning, Peter recovered the 35W FE without much fuss and also installed the new solid block base for the 70W amplifier. He and I recovered the 70W amplifier, also without much trouble; we tweaked beam alignment for a compromise of power and beam quality and were able to return the beam very close to what it was before the new base installation. We then proceeded to take a beam propagation measurement to use in PMC mode matching. This was necessary as the installation of the new amplifier base resulted in the 70W amp moving closer to the PMC by ~1/2", which in turn will have an effect on PMC mode matching. At this point we broke for lunch.
The final part we needed to complete the chiller work (an adapter for installation of a throttling valve on the supply line out of the chiller) arrived today, so this afternoon Jeff and I installed the valve. After leak checking and leak fixing, we fired the chillers up and all was well.
Rick and I then balanced the flows and pressures out of the crystal chiller. To do this we completely opened the new external bypass Jeff installed a couple months ago and completely closed the chiller's internal bypass; this internal bypass being open was what was causing the very high operating pressure (70 psi!) for the system. In this configuration the chiller had a flow of 38 lpm. We then used the throttling valve to reduce the overall chiller flow to 18.7 lpm (keep in mind that the external bypass was still completely open, so almost all of that water was flowing through the bypass, not the PSL manifold). We then slowly closed down the external bypass to provide a pressure drop for the PSL manifold, therefore letting water flow through the various cooling circuits. As it stands right now, the flows and pressures of the PSL cooling system are:
Please keep in mind that most of that chiller flow is still going through the external bypass. This is an absolutely huge improvement as prior to this work we were running with a manifold inlet pressure of 70 psi (!!!). At this point I returned to the enclosure to return it to "Science Mode" so Robert can assess if all of this plumbing work made a difference in PSL table vibration. Tomorrow we will begin mode matching the PMC, with our goal being >50W transmitted power with the ISS ON.
One small, but important, clarification.
The high supply- and return-side pressures observed earlier were not due to the internal bypass being open. They were due to the 50 psi pressure drop across the heat exchanger due to the high total flow (internally bypassed, externally bypassed, and through the laser circuits) going through the heat exchanger (on order 30 lpm) inside the chiller on the return path to the open reservoir.
Similar pressures were observed with the internal bypass closed but the external bypass open, also giving about 30 lpm through the heat exchanger.
Closing the internal bypass valve, reducing the pump output flow by about a factor of two using the throttling valve, and adjusting the flow through the laser circuits using the external bypass valve allowed us to set the desired flows through the laser circuits while reducing the overall system pressure.
This scheme was developed in consultation with J. Riebock, an engineer at TechnoTrans, US rep for the chiller manufacturer.
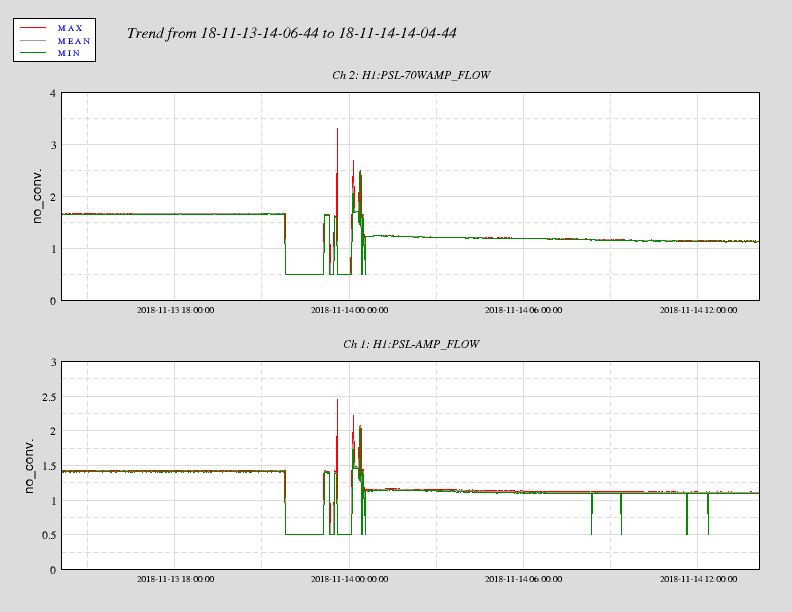
Front end and neoVAN flow rates for the past day. Clear reduction of flow rates observed after the plumbing work. Still settling out I would think. The 4 excursions in the front end flow rate are probably bubbles making their way through the system.
[Sheila, Fabrice, Nutsinee, Terry, Haocun]
Summary:
We have OPO coupling 89% 00 mode, alignment >~95%, mode matching >~95% and polarization mode ~2%.
I will add more details with numbers later.
Detailed measurements:
These numbers are the best ones we tried to take because the signal was noisy in air.
Calculation:
Here's a picture of the scan. Will go back and save the data properly later.
h1lsc code update
Daniel, Dave:
A new h1lsc model was installed. DAQ restart was required.
Slow Controls, new C1-PLC2 code
Daniel, Dave:
a new h1ecatc1plc2 was started this morning. Its INI file was updated in the DAQ. Its SDF system was restarted (h1sysecatc1plc2sdf) and the new channels were ACCEPT-MONITORED.
WP7098 h1tw0 offload
Dave:
The offloading of raw minute trends from h1tw0 to h1ldasgw0 completed this morning. h1nds0 was reconfigured to serve these data from their new location.
EY Dolphin crash.
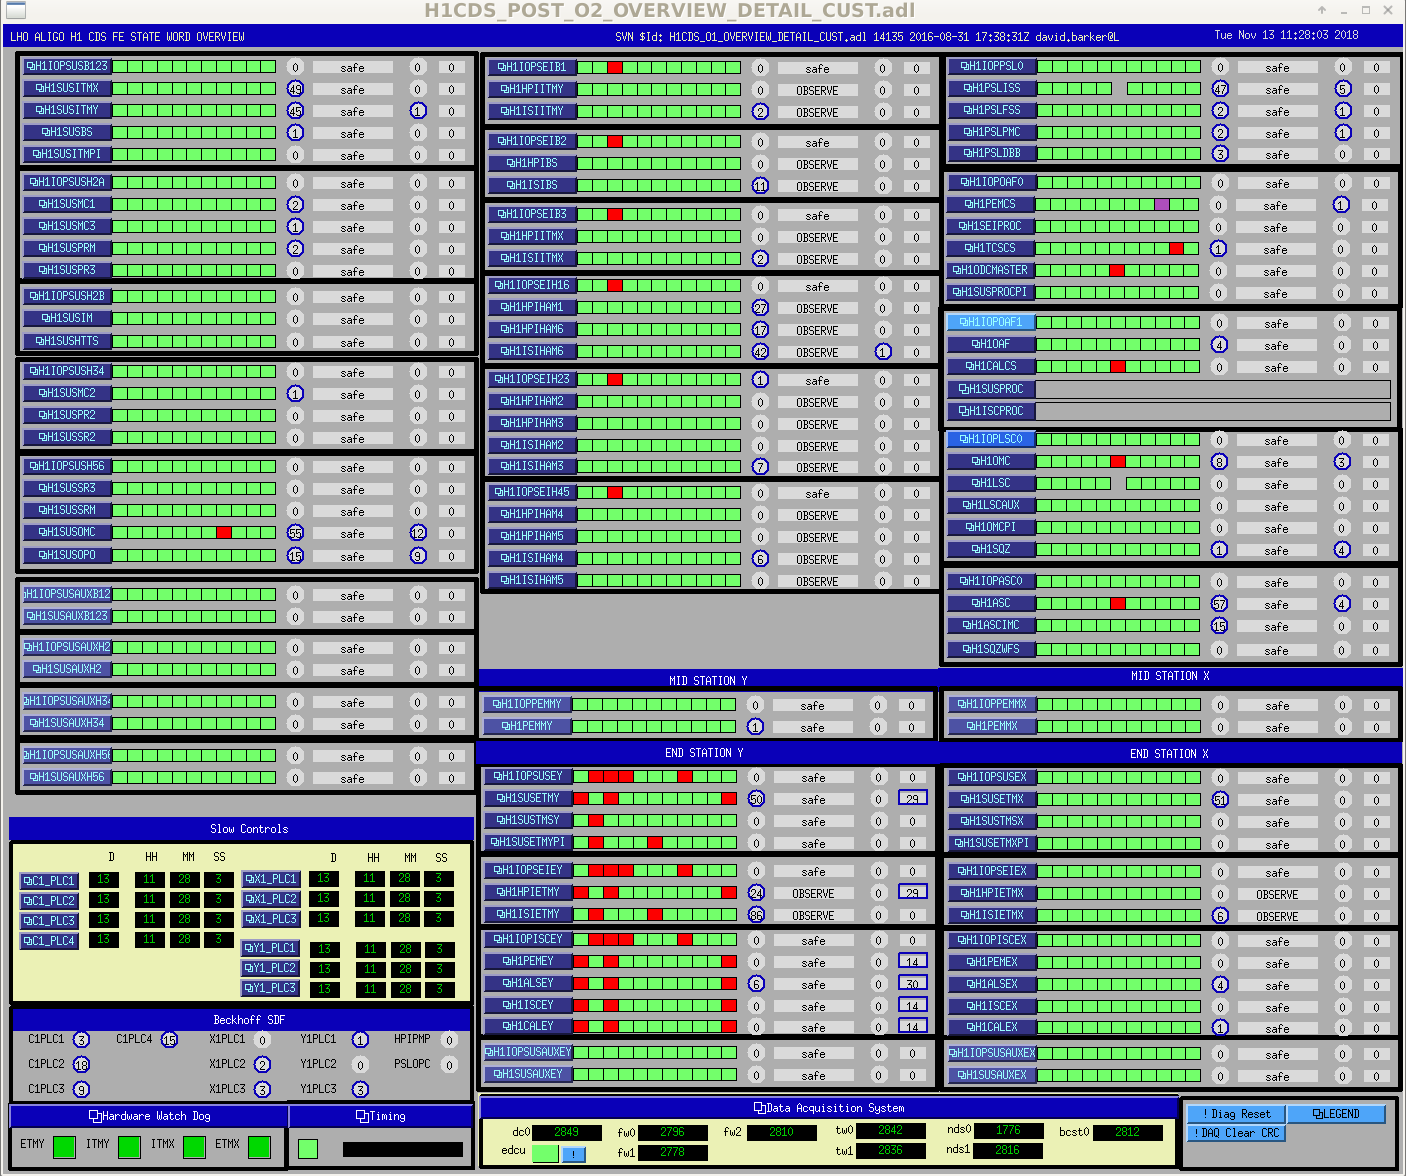
At 11:04 for reasons unknown, EY suffered a Dolphin crash. It is unsure if it was related to BSC10 in-chamber work. All models were restarted on h1susey, h1seiey and h1iscey.
TMSY ring up.
Betsy, Hugh, Ed, Dave:
over the lunch hour TMSY rang up and tripped the SWWD. Investigation is continuing.
DAQ Restart:
Dave:
For h1lsc, h1ecatc1plc2 and h1nds0 changes.
TITLE: 11/13 Day Shift: 16:00-00:00 UTC (08:00-16:00 PST), all times posted in UTC
STATE of H1: Corrective Maintenance
INCOMING OPERATOR: None
SHIFT SUMMARY
LOG:
16:20 HAM2 SEI re-isolated
16:22 re-isolated BS sei
16:30 Betsy and Fil out to EY
16:57 Jason out to PSL
17:07 Richard to Ends to check grounding
17:15 Norco on site for LN2 delivery - #76 CS-X
17:16 Laser Hazard
17:22 Sheila out to LVEA- joining Terry at HAM6
17:31 Norco on site for LN2 delivery - #79 N-MX
18:08 Nutsinee out to LVEA - HAM6
18:09 Marc out to LVEA - HAM6 and PSL/ISC rack area WP#7940
18:15 Set EY sei for in-chamber work - ISI to Offline_HEPI on ... tripped anyway
18:38 Dave B resetting LSC and then DAQ (in 5)
19:09 EY system crash - Dave B investigating the cause
19:15 Peter back
19:25 Jason back for lunch
19:18 Richard out to EY to investigate sys crash
19:49 Richard back
19:58 Dan and Dan out to LVEA - ITMY Hartmann table
20:20 Pepsi on site
20:55 Sheila, Terry, Haocun, Fabrice and Nutsinee back
21:15 Dan and Dan back
21:35 Jeff B and Marc P out to LVEA - Jeff for tools; Marc for a chassis
21:40 Jeff back
21:46 Sheila out to LVEA - HAM6
21:52 Cheryl out to PSL
21:56 Fil out to CER
22:03 Terry out to LVEA - HAM6
22:06 EY ISI re-isolated after stage 2 trip
22:23 Nutsinee out to LVEA - HAM6
22:41 Peter back
22:51 Marc back
23:03 Richard out to CER
23:03 Chris S back from EY - doors back on
23:08 Chandra out to EY
23:16 Richard back
23:49 TVo out to LVEA - ITM OpLevs showing no sum
The phase frequency discriminator (PFD) and both IQ demodulators in the corner have been upgraded with the local oscillator (LO) modification and in the case of the IQ Demods their power interface board has been upgraded to allow more readbacks. End Stations and and some spares remain to be upgraded.
S1000771, S1000772 Demods
S1000761 PFD (this was completed here ALOG43041)
I verified that the I outputs of the demodulators for REFL_A and REFLAIR_A are hooked up as I channels in the DAQ. For both demodulators the I channels is sent to the summing board. This is consistent with alog 44378.
I also verified that the remote controls for the IMC-REFL/LSC-REFL_B dual delay line phase shifter are working correctly.
Continuing work on this, all installed chassis have been upgraded.
End X PFD - S1000758
End X Demod - S1000778
End Y PFD - S1000759
End Y Demod - S1000779
Spares are still being worked on awaiting parts.
FRS 10543
Verified ALS and PCAL lasers were keyed off.
~9am - Kyle, Gerardo, Chris Removed last 4 WBSC10 door bolts and removed the door
~9:20am - In-air, prior to anyone entering chamber, Fil performed HiPOT testing - ALL 5 ESD connections PASSED the 1kV test
~9:30am - Travis and Betsy entered chamber, locked the PUM mass, removed the CC horizontal witness wafer from under the QUAD
Test for continuity of all 5 ESD connections with Fil from the feed-through to the solder joints at the AERM (copper wire grounded to QUAD structure leg) - ALL 5 PASSED
~9:45am - Decided to repair LR connector anyway due to questionable hardware in the connector (incorrect sized inner pins)
ISI and Suspensions unlocked (except PUM carefully)
Disconnected connector after removed from PUM clamp
Wiggle test of pins and receptacles of the ESD connector - all seemed good, strong, not pushed in...
Cut off LR and performed retermination with all new parts per E1800147-v3, including new center pins, and proper crimping. Half of the work was performed wth my right and Travis' left hand since the short pigtail off of the AERM out the back of the QUAD had very little working room.
NOTE - Although there looked to be some crimping, Fil could easily pull off the outer sleeve PN-100909 from the receptacle. We did not see any other short symptoms such as wire fragments, over crimping, etc. (And, it passed today.)
~11:10am Finished retermination of LR and reassembly of connector, remounted in clamp, unclamped PUM, freeing ETMY reaction chain fully
~11:20am Rechecked continuity in same manor as above - ALL 5 ESD connections PASSED, Rechecked HiPOT at 1kV - ALL 5 ESD PASSED
~11:30am Gave the ETMy a quick N2 blow (barrel, gap, HR, AR as best we could without ACB swing back, etc. Saw the "typical" amount of particulate and features.
~12pm - Decided with Daniel to not "fix" remaining 4 connectors because 1) it was taking much longer to do with everything floating and 2) they aren't broken
Started transfer functions of ETMy Main and Reaction, and TMSy - all look ok
~1:30pm Hunted for chamber closeout signouts from cog engineers.
~2pm Door going on
Jeff B handled this. No water was needed as chillers are currently OVERfilled.
Can't see purge pressures via these gauges. Could be misleading if this detail gets forgotten.
This is why we changed the wide-range gauge on HAM6 from the pirani style to triple gauge with capacitance diaphragm to accurately measure pressures as chamber is vented up to air. This triple gauge still utilizes a pirani to turn on/off the hot cathode filament.
At 11:04 most models stopped running at EY. We are currently unsure if this is a Dolphin crash or caused by electrical work at EY.
Interestingly in addition to the expected corner station IPC errors, all SEI frontends have an ADC error on their IOPs.
And to answer the question of what is special about the seismic IOP models: they all have Dolphin receivers.
However, h1susitmpi is a 64kHz user model with Dolphin receivers.
TITLE: 11/13 Day Shift: 16:00-00:00 UTC (08:00-16:00 PST), all times posted in UTC
STATE of H1: Corrective Maintenance
OUTGOING OPERATOR: None
CURRENT ENVIRONMENT:
Wind: 6mph Gusts, 4mph 5min avg
Primary useism: 0.03 μm/s
Secondary useism: 0.25 μm/s
QUICK SUMMARY:
14:15 Peter out to PSL - remounting 70W amp
14:30 Chris S out to LVEA - HAM6 scaffold
15:07 Chris back
15:30 Bubba and Chris out to LVEA- set HAM6 end cap door down on pallets'
16:00 Jeff B out to LVEA
Sheila, Georgia
I had a look back at a few locks on Friday and Saturday, to compare in which frequency bands we made improvements. On friday we went from roughly 80 Mpc (Friday morning), to roughly 83 Mpc (Friday evening), for reasons we're not really sure of. With Saturday's power up to 30 W (edit: note the lock stretch I looked at the IMC_PWR_IN reads 26 W rather than 30 W) the range increased to ~93 Mpc.
First attachment left plot shows the DARM spectra, and the right plot shows the cross correlation spectra, red is a ~93 Mpc lock, blue is a ~83 Mpc lock, mint is a ~80 Mpc lock. Note the 93 Mpc lock I chose is before we ran A2L and brought the low frequency noise back down.
Shot noise improves with increasing power, but between all 3 locks we also see an improvement in the uncorrelated noise. Going from 80 Mpc to 83 Mpc this improvement is seen from 60-250 Hz; going from 83 to 93 Mpc the improvement is mostly in the 90 - 200 Hz region. I had to hunt around to find long enough lock stretches with no glitches, and I have belatedly realised that the particular 93 Mpc lock I picked out is while Stefan and Peter were increasing the OMC DCPD current, which might contribute to this difference.
I used Sheila's range integrand calculator to compare the different frequency-bands' contributions to the overall range. The top plot of the second attachment shows the DARM spectra again, and the bottom is the integrand. Ignore the sharp dips - between these three locks we had different combinations of calibrations lines turned on and off. The third attachment shows the cumulative range as a function of frequency for these three locks, and the difference in the cumulative ranges going from 80 to 83 Mpc, and from 83 to 93 Mpc. These show most of the improvement going from 80 to 83 MPc was in the 35 - 100 Hz band, while powering up it was in the 80 - 300 Hz region. The improvement in shot noise above 250 Hz doesn't contribute very much to the range.
For reference, the lock times I used started at:
~80 Mpc, t0 = 1225827083
~83 Mpc, t0 = 1225864223
~93 Mpc t0 = 1225937394
There were a couple of problems with the times I chose. There was a glitch included in the 80 Mpc time which contributed to the extra noise at 80-400 Hz. The 93 Mpc time included times where the power on the OMC DCPDs was changed. I've re-run these scripts with new times, new integrands shown in the first and second attachments. The improvement from 80-83 Mpc is now less dramatic, there's little change in the DARM spectrum for the new 93 Mpc time, though looking at the detchar summary page the range here was maybe closer to 90 Mpc. New plots, with new times in the legends, attached.
===
Daniel was concerned about the validity of the calibration going from 22 W to 30 W. We turned the cal lines off on Friday morning and didn't turn them on again until Sunday evening so we cannot compare the PCAL lines ot the spectrum. We looked at the OMC DCPD sum spectra to see if any changes between locks were seen there, see third attachment.
At high frequency the locks are all different due to different CARM gains yielding different frequency noise couplings, with the most severe coupling in the 26 W (90 Mpc) lock. This might explains why we have more sensitivity improvement in the bucket than at high frequency while powering up.
From 80 Hz - 1.5 kHz all three OMC-DCPD_SUM spectra line up, indicating we are limited by some sensing noise. We're not sure why the noise has this shape, if it's shot noise why is it so lumpy?
If the DARM plant changed significantly between these three locks we'd expect to see a change in the DCPD sum output, that we don't see such a change supports the reported increase in range. I've also included a dark noise plot from a time when the power out of the IMC was 0W.
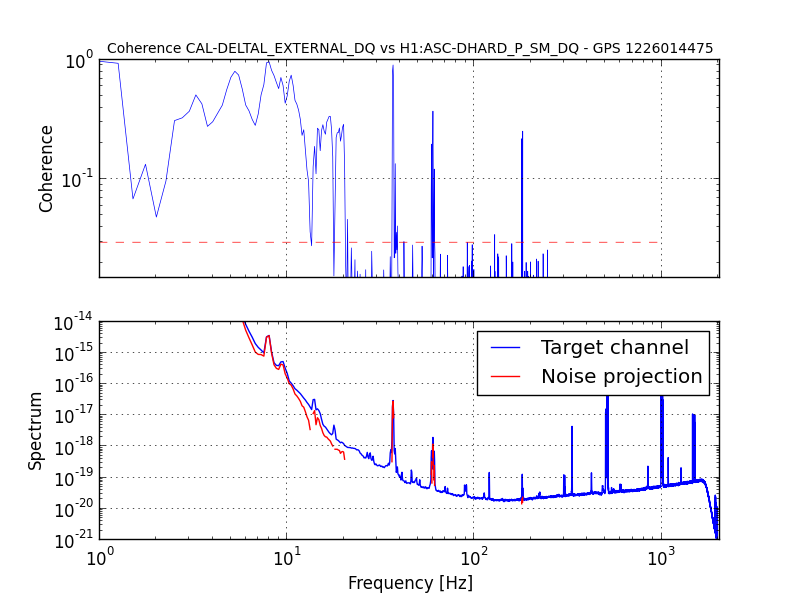
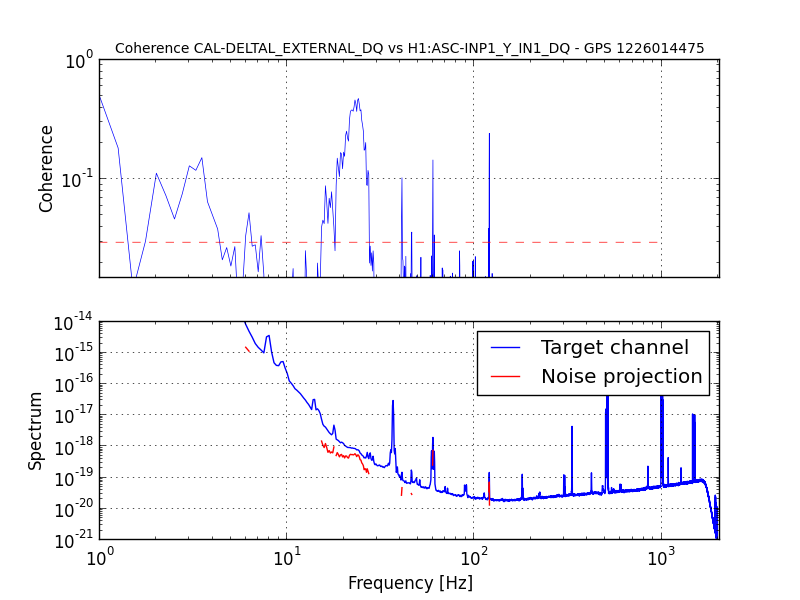
I ran BruCo on 400 seconds of data following each of the GPS times reported above:
https://ldas-jobs.ligo.caltech.edu/~gabriele.vajente/bruco_lho_80Mpc/
https://ldas-jobs.ligo.caltech.edu/~gabriele.vajente/bruco_lho_83Mpc/
https://ldas-jobs.ligo.caltech.edu/~gabriele.vajente/bruco_lho_90Mpc/
From a first look, here's a comparison:
|
Frequency band |
Difference |
|
20-27 Hz [93Mpc is worse than 83Mpc] |
93Mpc data is worse: more coherence with ASC-REFL_A_RF45_I_YAW |
|
29-38 Hz [83Mpc is better than 80Mpc] |
DHARD_Y more coherent in 80Mpc than 83Mpc |
|
Peak at 48 Hz |
no hint |
|
70-100 Hz |
REFL_A_LF_OUT coherence gets smaller fro 80 to 83 to 90 Mpc |
|
>100 Hz |
no hint |
I looked at the frequencies of all of the discernable peaks around the 60Hz line (60.0078 Hz here), during the time of the ~93Mpc lock (starting at 1225937394). As Sheila has mentioned, the 0.4Hz stuff is the biggest, but there are several others that are visible, that we could attack. I've grouped them roughly by peak height:
| Peak height group | Peak frequency [Hz] | Delta from 60.0078Hz [Hz] |
| 1 | 59.5781 | 0.430 |
| 1 | 60.4219 | 0.414 |
| 2 | 59.4688 | 0.539 |
| 2 | 60.5234 | 0.516 |
| 2 | 59.5078 | 0.437 |
| 2 | 60.3902 | 0.383 |
| 2 | 59.6641 | 0.344 |
| 3 | 58.9141 | 1.094 |
| 3 | 61.1016 | 1.094 |
| 4 | 61.0703 | 1.063 |
| 4 | 59.0234 | 0.984 |
| 4 | 59.3906 | 0.617 |
| 4 | 60.5625 | 0.555 |
| 5 | 61.0078 | 1.000 |
| 5 | 60.9766 | 0.969 |
| 5 | 59.125 | 0.883 |
| 5 | 59.2422 | 0.766 |
Solving the 1.1Hz line on HAM3 (which is also getting into SRCL and other DOFs) will definitely help reduce these wings. If we fix that, and the 0.4Hz stuff, then we'll be in much better shape.
The LSC model has been prepared to accommodate the new REFL_B photodetector. This includes
A corresponding change to the TwinCAT code has also been prepared.
The changes in the TwinCAT code were loaded.
Medm screens were added and updated.
Chamber Cleaning starting before 8 (Christina, Vanessa, Karen.) VE venting volume around 8am (Chandra.) Venting completed and East Door removed ~9:30, Kyle Gerardo, Bubba.) Dust Monitor counts 30 & 30 in clean room just before door removal. After removal, Dust counts in chamber 10 & 10.
Fiber change out from ~10am to 12:40: Old fiber & Feed Thru removed, Test fiber/FT installed/removed, Real deal fiber/FT installed. Feed Thru bolts remains just snug (Sheila, Fabrice, Haocun, Nutsinee.)
SQZ has gone hazard and work continues.
There was no dust witness wafer to be seen from the east door. We'll put one in at close out for the future.
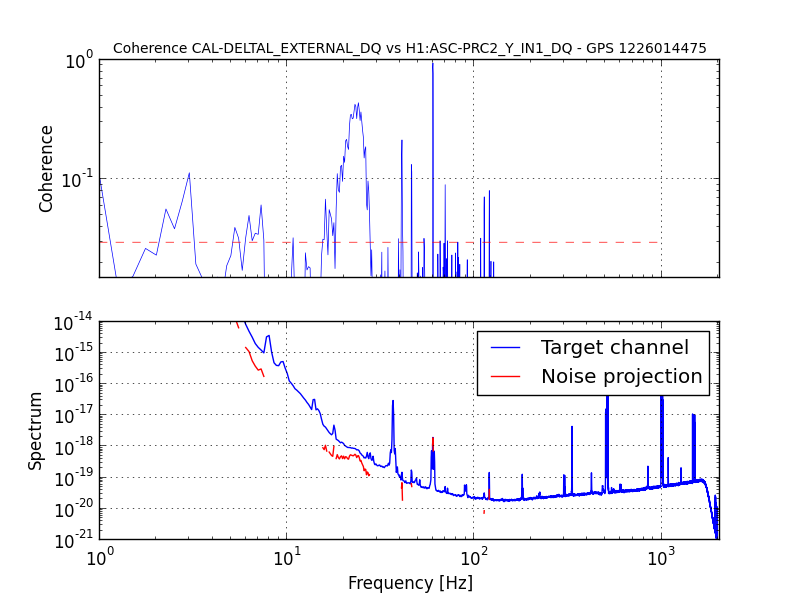
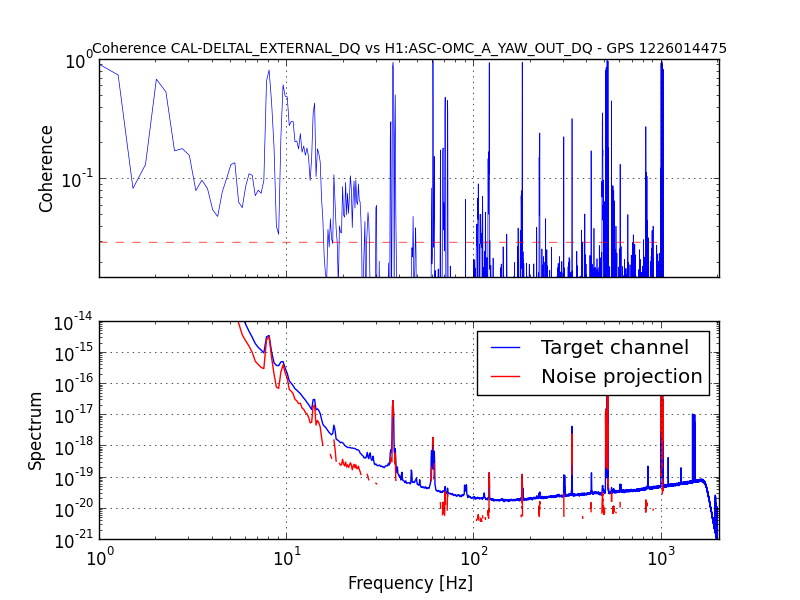
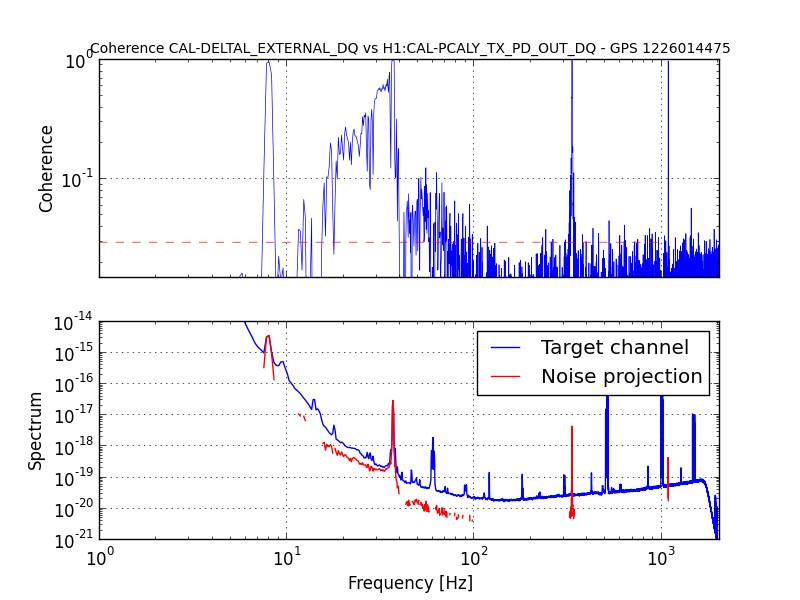
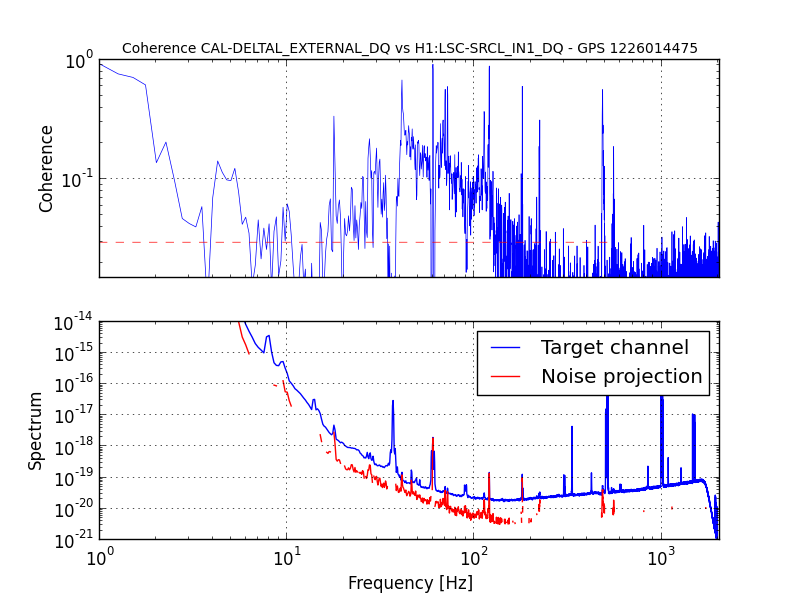
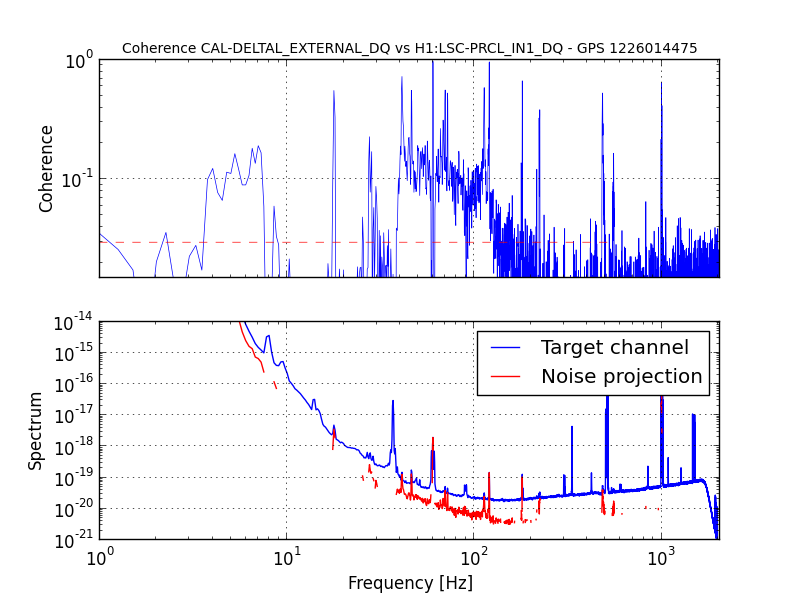
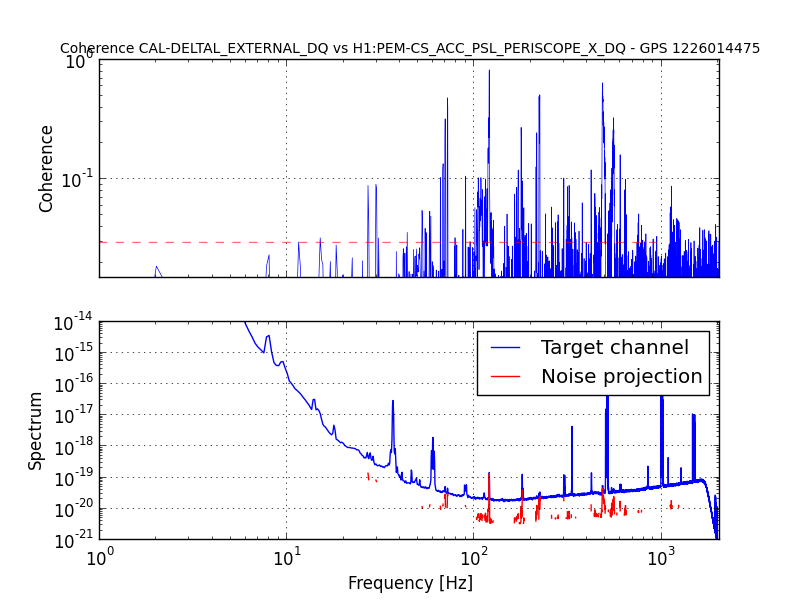
https://ldas-jobs.ligo.caltech.edu/~gabriele.vajente/bruco_1226014475/
Thanks Gabriele, this will be useful. Just want to say for the record that the calibration was wrong during this time, we don't believe our sensitivity was really 100 Mpc.
Too bad, that would have been good. Nevertheless, the coherences are still significant and similar to what reported for earlier lock stretches.
The Pcal lines at the Y-end were turned on at ~1226014752.1 GPS sec (around 277.1 sec after the start of this bruco run) and there was no ramp up of the amplitudes of the lines. The high coherence we see around 30 Hz with PCal singal seems to come from sudden turn on of the lines and also due to spectral leakage. If I calculate the coherence for the first 270 secs or last 120 secs I don't see any such excess coherence.
I was looking at the time when all ISIs were damping after yesterday's earthquake near Iceland.
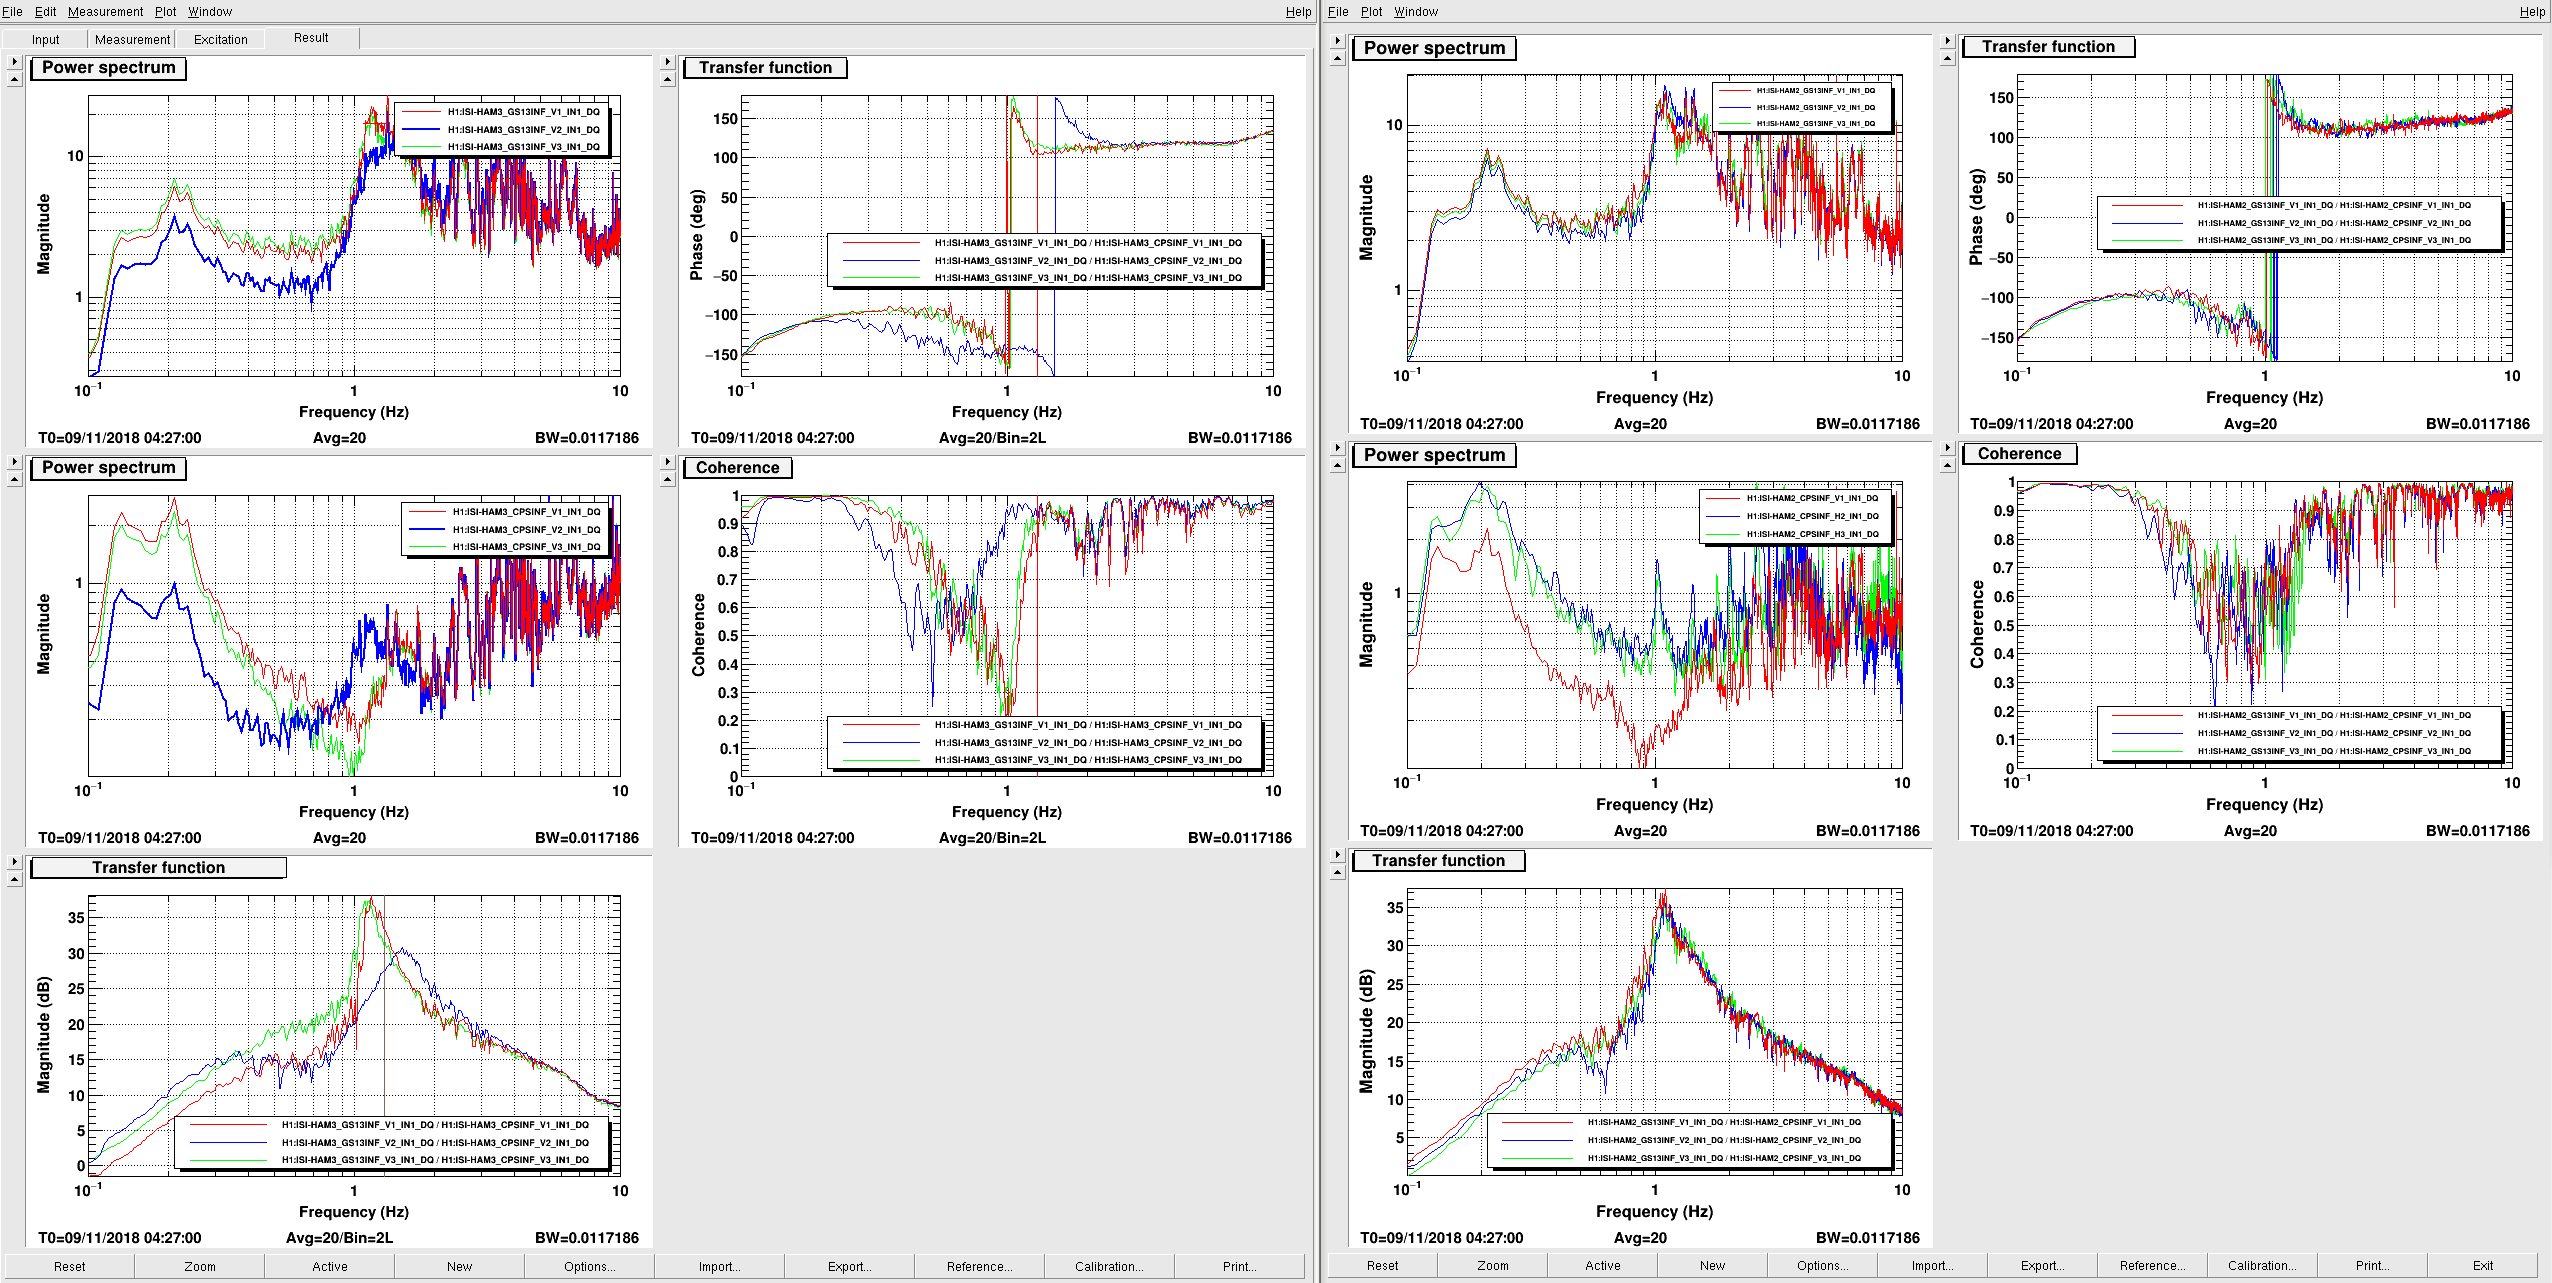
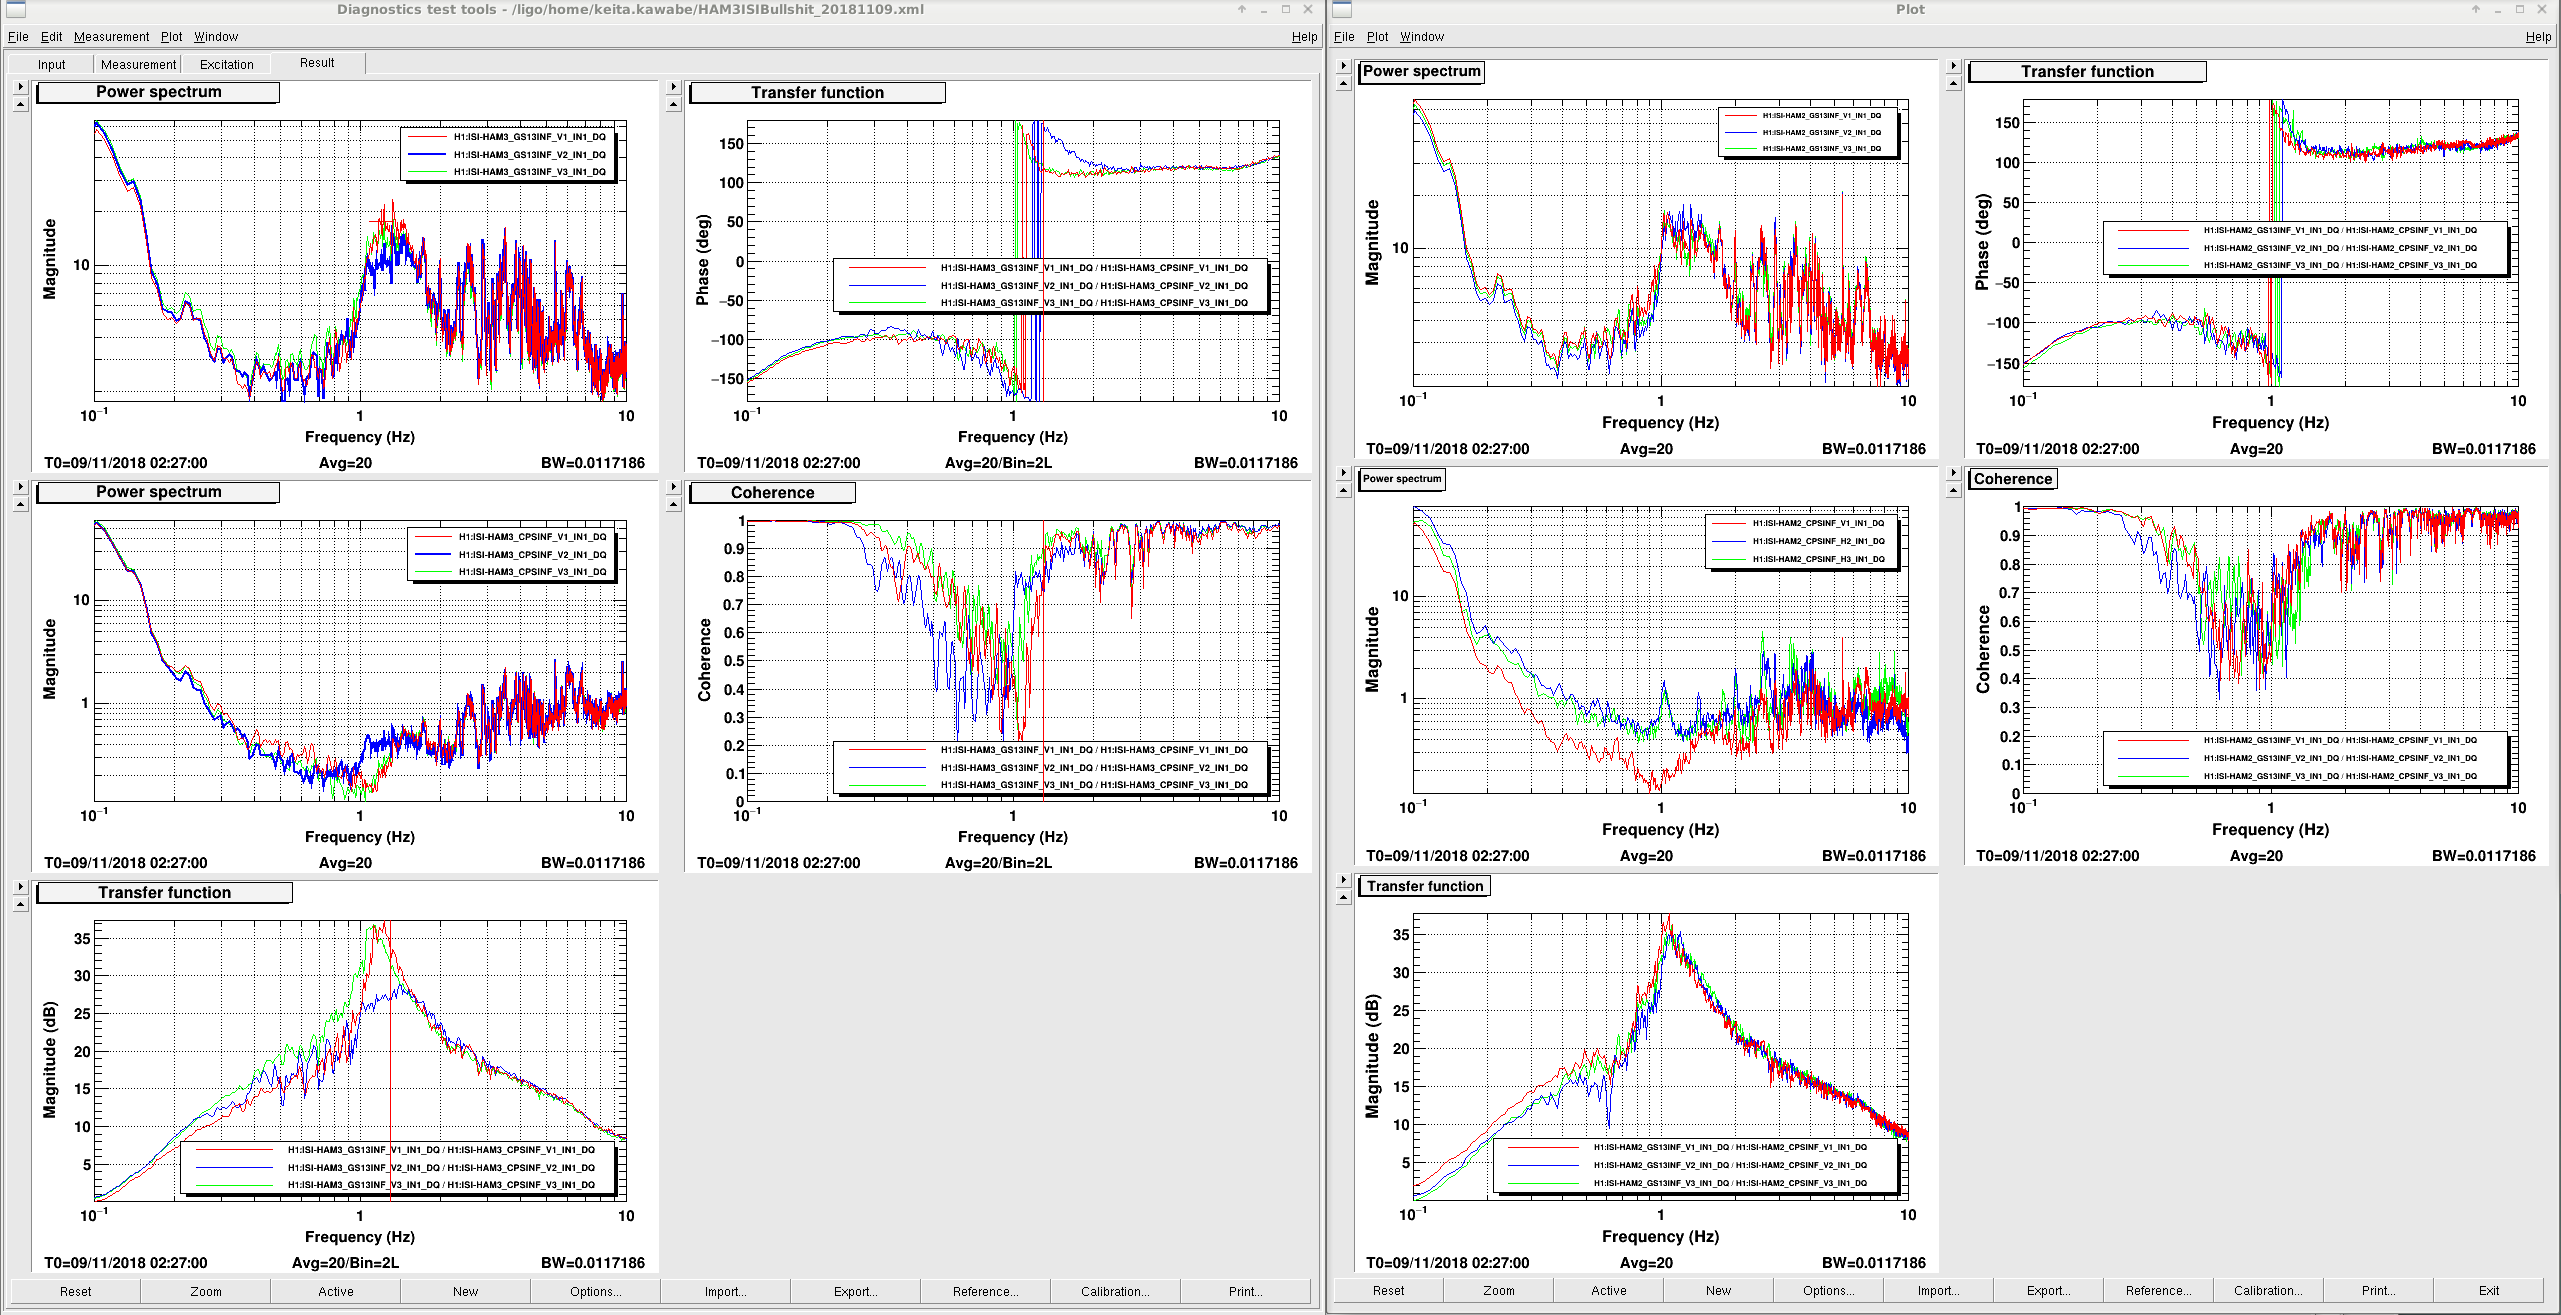
I looked at the CPS to GS13 sensor to sensor response (e.g. CPS V1 to GS13 V1 etc.) to find out that HAM3 V2 CPS to GS13 transfer function looked completely different from everything else, and that this could be amplitude dependent.
In the first attachment, left is HAM3 and right is HAM2. HAM3 V1, V3, HAM2 V1, V2 and V3 are all look similar, but the Q of HAM3 V2 TF is much lower even if you only look at frequencies with reasonable coherence.
The second attachement is Jim's injection TF (alog 45134) with rearranged panels etc. to see the same quantity as my plots. Only HAM3 sensors are plotted. Interestingly, all TFs are similar but they are all totally different from my first plot in amplitude.
For example, just look at both plots at 1.3Hz or so (vertical markers in my plot) where the coherence was decent. Jim's GS13 amplitude is ~500 times as large as mine, but CPS is only 50 times as large. As a result Jim's HAM3 V1, V2, V3 TF are about 20dB larger than my HAM3 V1, V3, HAM2 V1, V2 and V3.
It seems as if the GS13 response might be dependent on the excitation level, and that the small amplitude response of HAM3 V2 is very different from others.
The last attachment is the same as the first one, except that the first one was 2 hours after the EQ, this is right after.
It would be useful to repeat Jim's measurement with smaller excitation at some point.
Peter asked if it were possible to run the HAM3 ISI without the V2 GS-13. It is possible, but it's a bad choice. V2 is key to distinguishing between the vertical motion and the RY motion - the dominant contributor to SUSpoint motion from 0.7 - 10 Hz (see HAM2 motion) . I put some stuff in the attachment. for factors of 10, do check w/ Jim about the state of the analog gain. I think 'fishy' is a good word choice here. also note that the V2 CPS is 'fishy' as well.
I still think it would be useful to do a driven TF of the local motion with the isolation controls off, and compare to the measurements from the build-time. See pg 37 of the phase 1 testing report, E1000314.