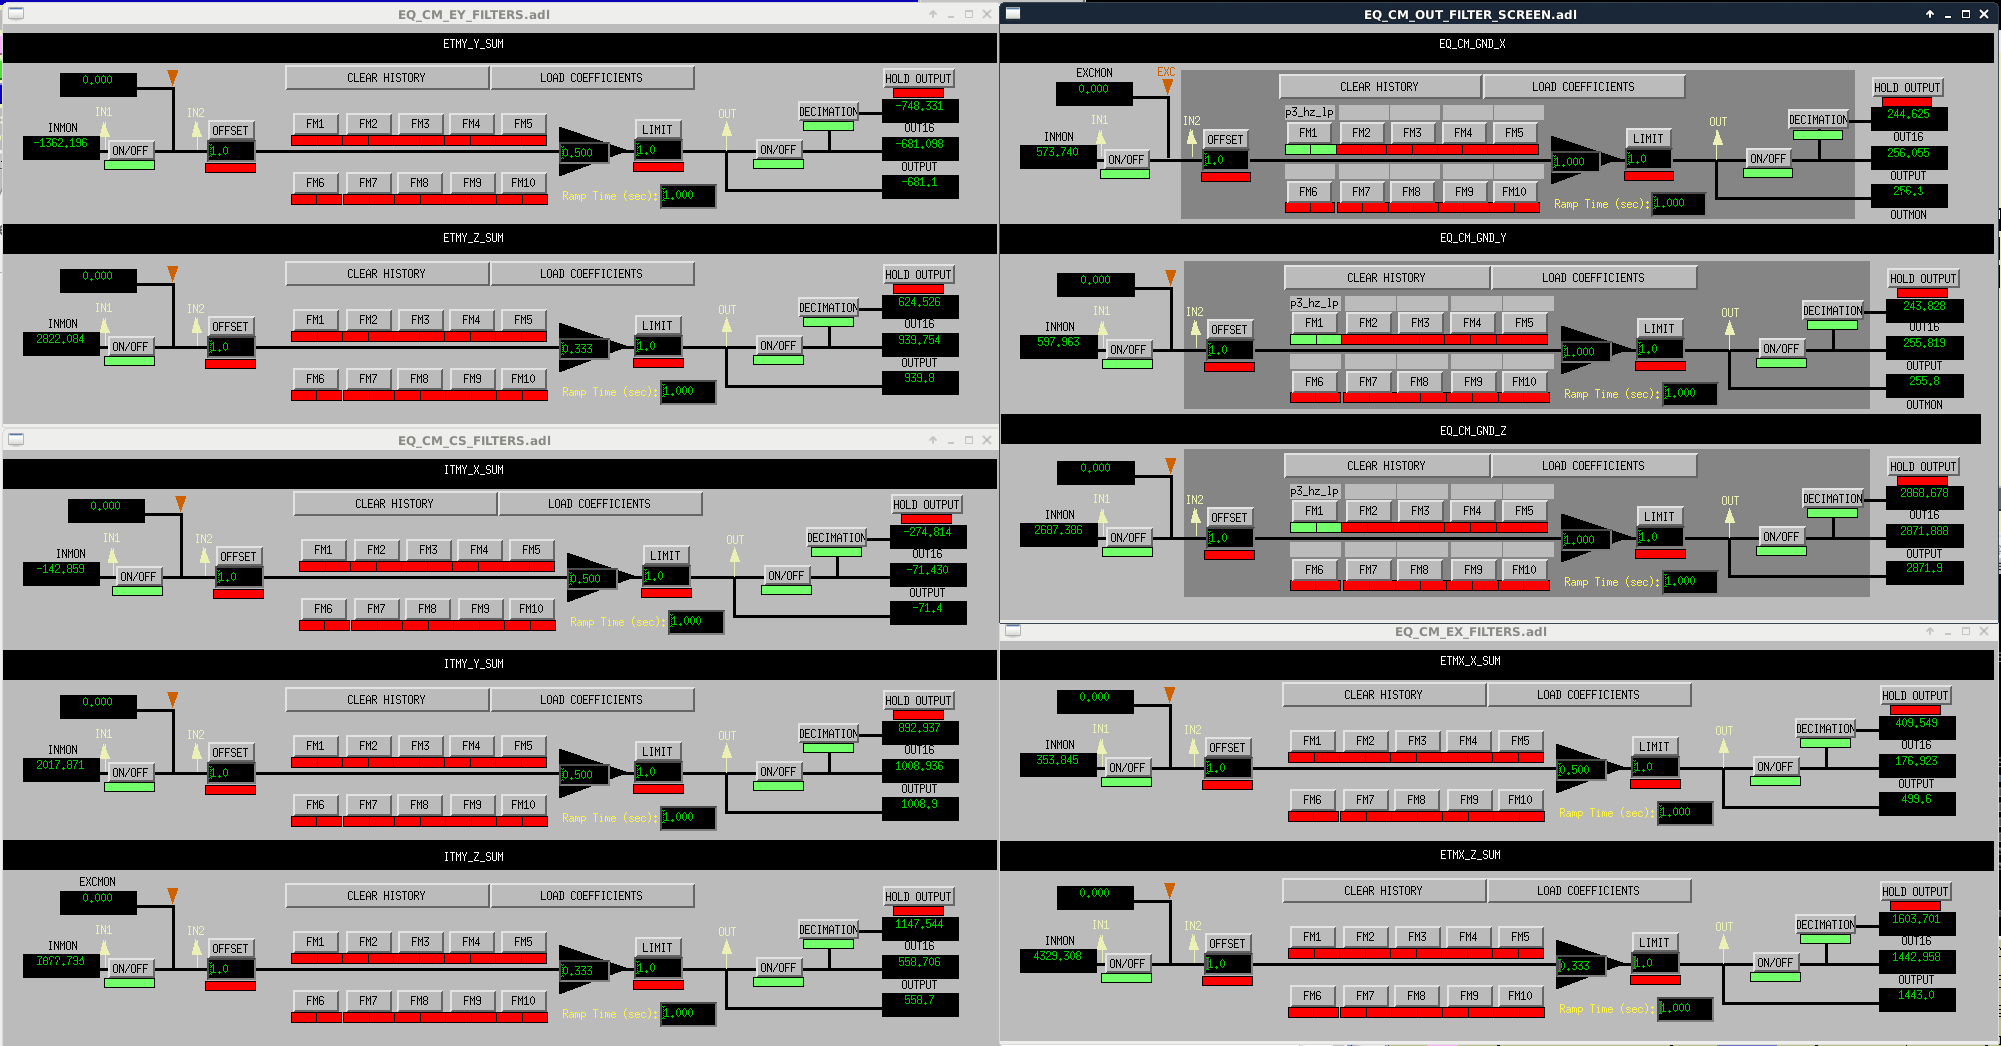
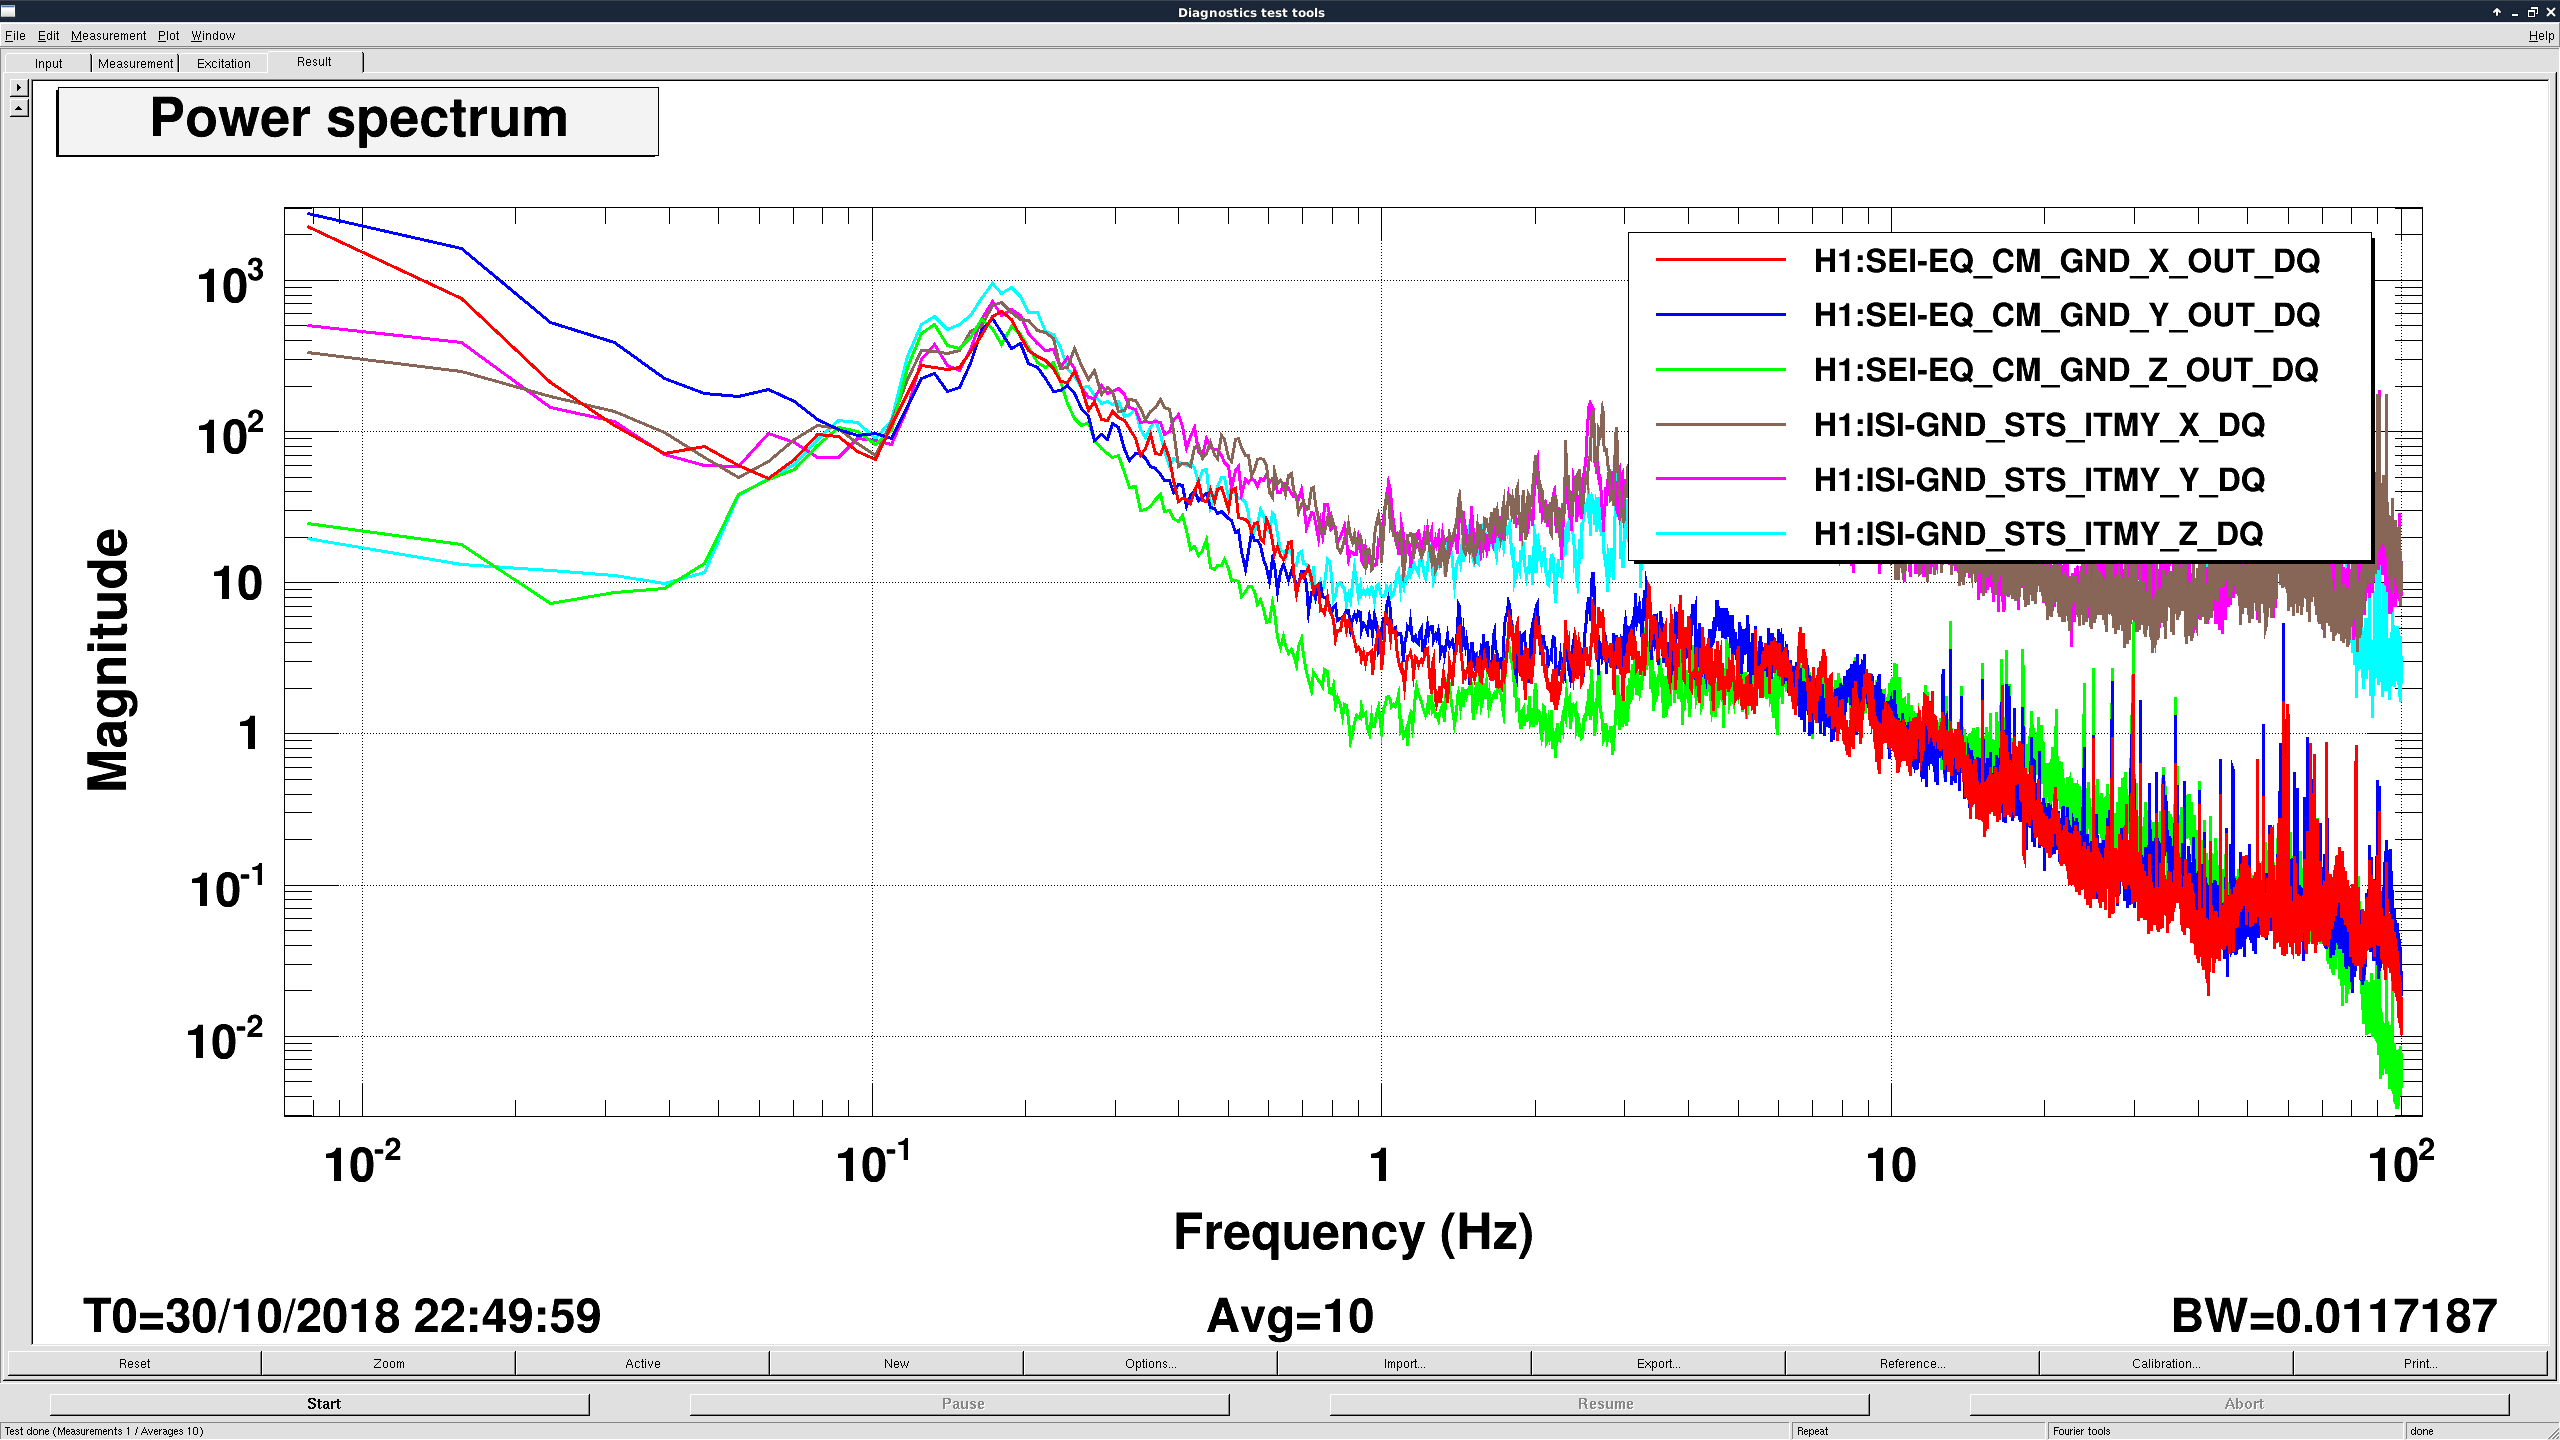
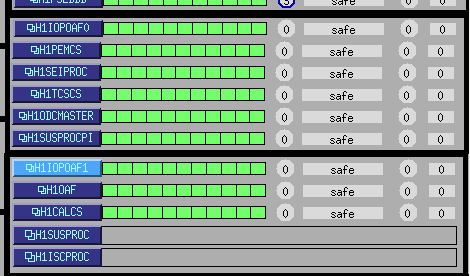
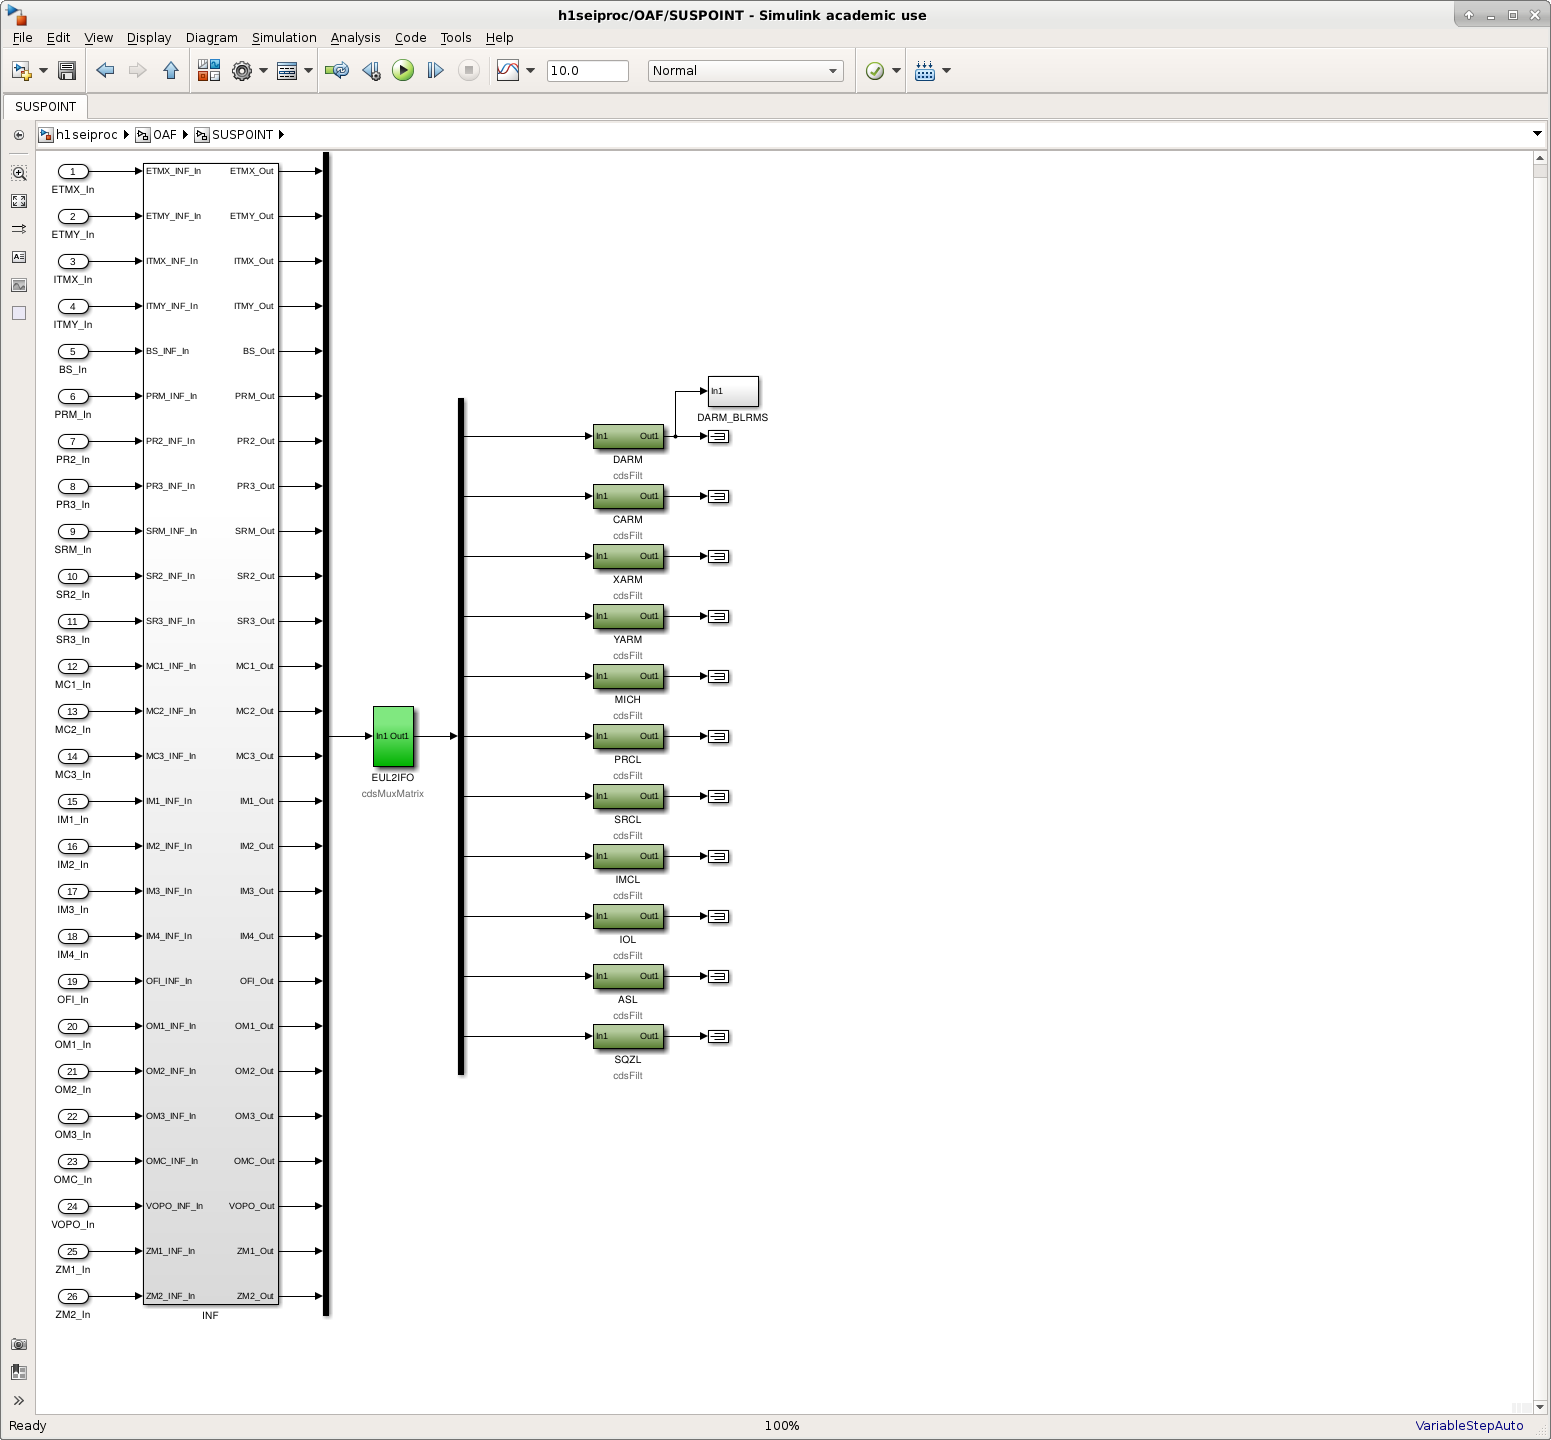
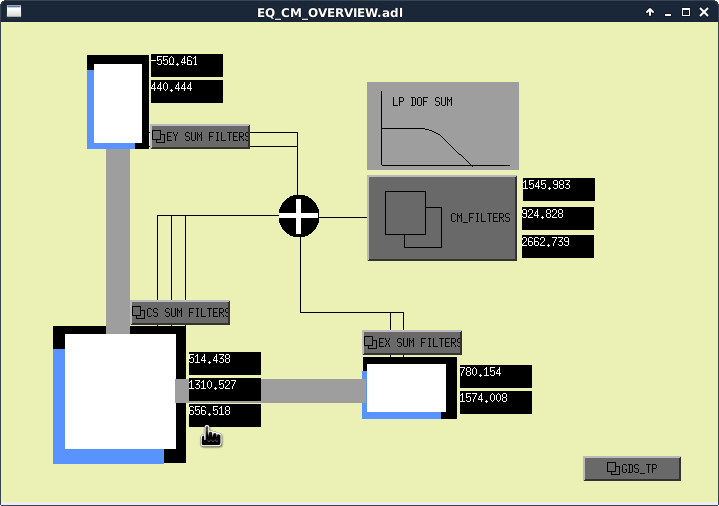
Jeff posted this earlier, but Dave and he were able to get the SEIPROC model running today, with some code intended to calculate common mode motion and the moved OAF suspoint code. I have thrown together a some quick MEDMs to make it easier to interact with the EQ common mode calculations and I've installed a some filters so we can start looking at signals to make sure they make sense. First attached image is the overview medm I put in, you can reach it from SEI->Eq Common Mode Overview. It's just a cartoon of the site to give an idea of where the signals originate and what we do with them, and could use some more detail. I also made four filter over view screens, 3 for seismometers for each station, one for the common mode signal, show all together in the second image. The idea is we will take the beamline and z signals from each endstation (the sum channels) average each dof (i.e EX-X/2+IY-X/2, or EX-Z/3+IY-Z/3+EY/3) then lowpass that average to estimate the common mode motion, then subtract that common motion from the sensor correction. BrianL describes in more detail in this doc. I've also added the .3hz low pass Brian suggests, so we should now be calculating a signal we want for the subtraction. There are no receivers in any ISI or HEPI models yet to do the subtraction, so we can't test yet. But the asds of the signals seems reasonable so far, see third attached plot. The EQ_CM channels are the lowpassed averaged ground singals, below .3hz they mostly look pretty similar to the ITMY ground seismometer, which is in nm/s.
The move of the OAF suspoint calculations blew away the the epics records that combined the different suspoint motions to calculate cavity lengths. JeffK said that he had written a script to fill them in, but I couldn't find it in the alog, so I eventually just put them in by hand. All settings have been accepted in the seiproc sdf.
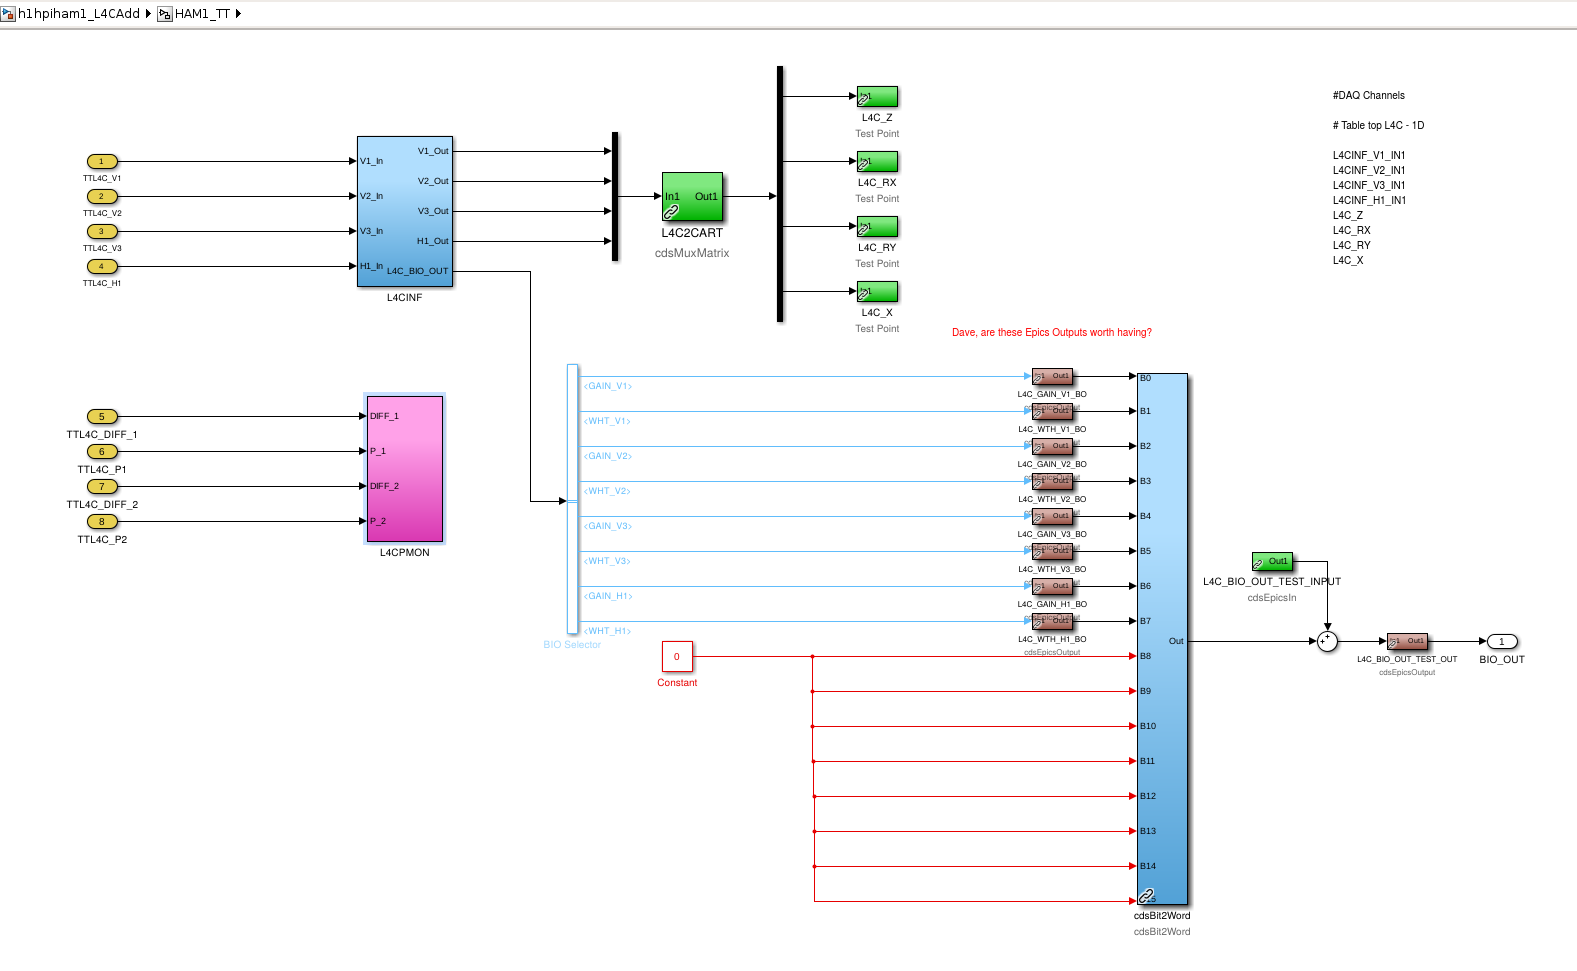
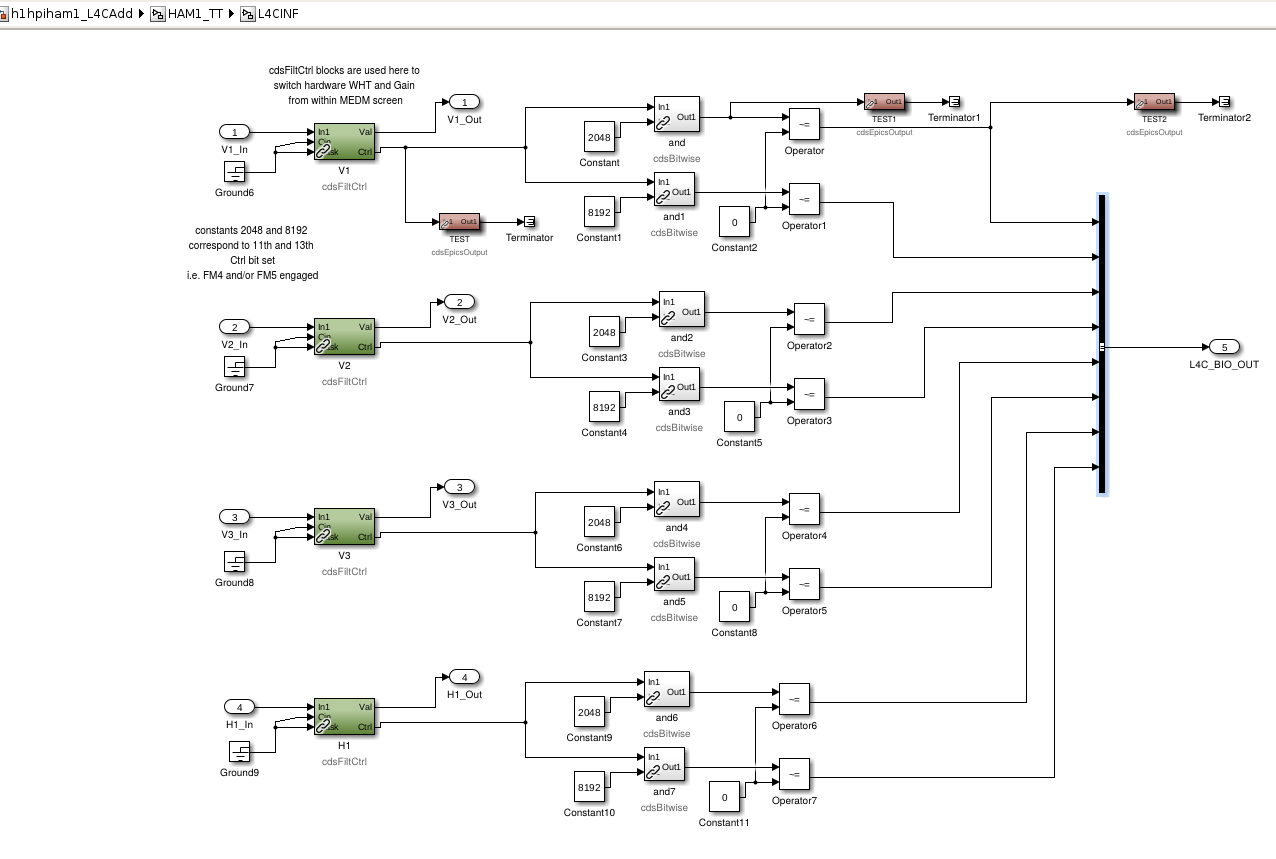
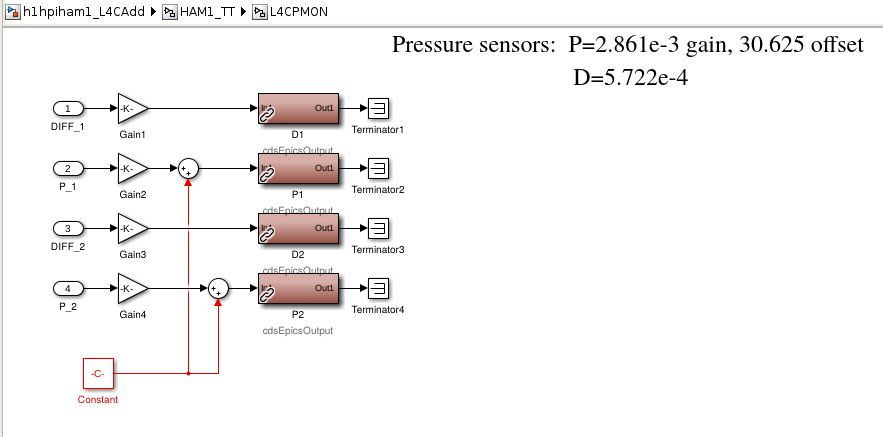
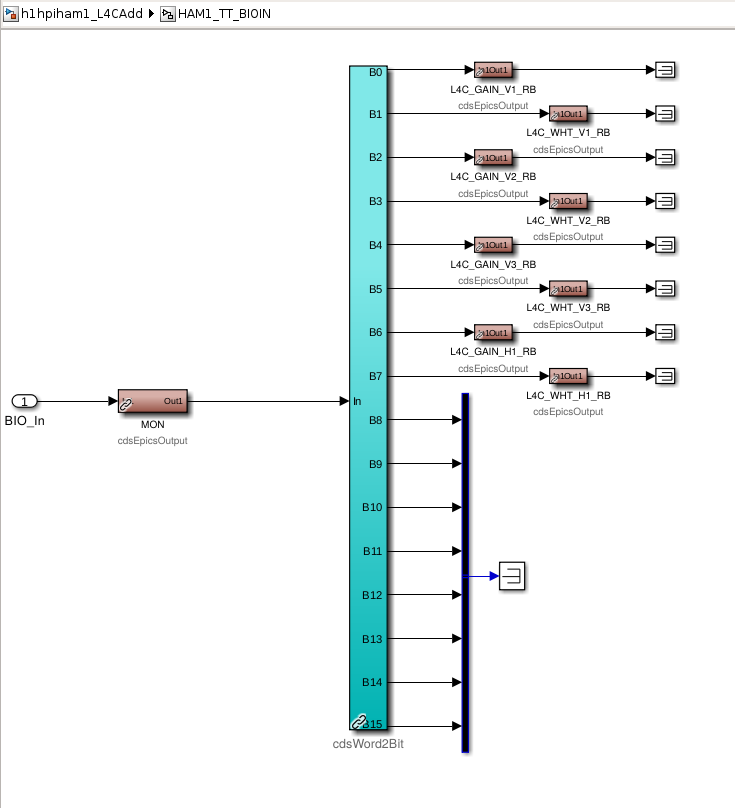
Here are the updates I propose to the H1 HPI model to get the L4Cs into the system. I've matched L1 pretty closely but as I am including 4 versus 2 sensors and the L4C gain & whitening control, putting everything at the top level was a bit messy so there will be some subtle name differences.
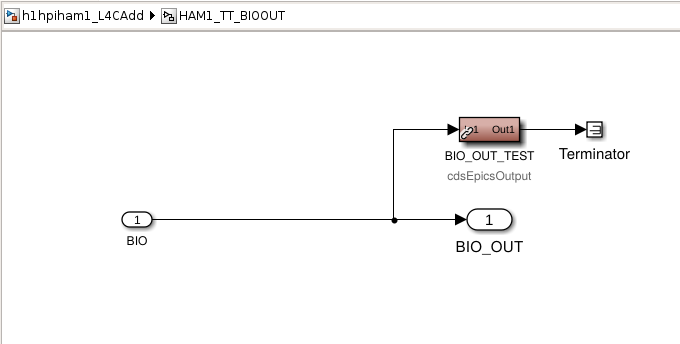
The first six attachments shows the model changes everything starting at the H1:HPI-HAM1 top level as HAM1_TT. The paths are included in the snaps to help guide. It is pretty simple so I wouldn't worry too much, he says. DaveB looked it over and made sure the code compiles and the wiring is correct.
The last attachment shows the Binary interface page from D1101584 and attachments where we'll plug in to talk and listen to the sensor interface chassis.
I think I'll get rid of the TT_BIO_OUT block as that signal is already recorded in the TT block.
E. Goetz, J. Kissel ECR E1800246 Evan and I are beginning to use the recently upgraded time-dependent correction factor calculation system (installed two weeks ago; see LHO aLOG 44507). MEDM screens have been revamped, and or understanding of the DARM loop model is now complete enough that we have inklings of hope for success. We've been filling in demodulators that are new, and/or that had been lost from name changes, and entering in EPICs records that represent the O3 model for the first time. As such, we want to explore the functionality, so we've turned on one of the biggest changes between O2 and O3 -- the separation of correction factors for the upper stages of the QUAD actuator -- kappa_PU is now kappa_P and kappa_U, so we now have an independent measure of the actuation strength changes for the PUM and UIM stage. Yes, we don't *expect* these gains to change much, but we have been bitten by sudden changes in electronics before (e.g. the PUM driver swap right after New Years 2017 in the middle of O2 LHO aLOG 32799). You will now see two new calibration lines in the DELTAL EXTERNAL asd -- at 15.1 Hz driven from the ETMY UIM, and 16.7 Hz driven from the ETMY PUM. (and technically, you could say there's only *one*new* line -- we've deleted the DARM calibration line, which used to calculate kappa_PU, so you could consider that moved frequency, not a new frequency). We retain -- only for a few more days -- the ETMX ESD line 35.9 Hz (will be moved 19.1 Hz), the PCAL line at 36.7 Hz (will be moved to 17.9 Hz), and the PCAL line at 331.9 (will be moved to 433.7 Hz). We want to be sure we can reproduce O2-like results with the current line frequencies that were present in O2 (which which looks like it is only a few days away), and then we'll change the rest. These line frequencies were determined against several criteria (see LHO aLOGs 44892 and 44590). The point is that (a) these are below most data analysis group's search band (most start their search at 20 Hz), and (b) we'll likely end up subtracting them anyway, so you won't even see them the GDS-STRAIN ASD for O3.
14:16 UTC Chris S. starting at end X supply fan room to grease fans. In order end X, mid X, mid Y, end Y 14:27 - 16:12 UTC Corey running charge measurements 14:36 UTC SEI config to SC_OFF_NOBRSXY 14:37 UTC Ran dust monitor check. All report OK. 15:00 - 15:38 UTC Kyle to end Y to start pumps on BSC10 15:14 UTC Vanessa to LVEA 15:29 UTC LN2 delivery 15:35 UTC Set HAM 2 ISI to DAMPED. Ed and Filiberto to HAM1,2 for cabling 15:42 - 18:43 UTC TJ, Thomas to LVEA, opening HWS table, taking pictures 15:44 UTC Jason to PSL enclosure, DBB work 15:56 UTC Cheryl to PSL enclosure 16:10 - 17:22 UTC Hugh to end stations, HEPI maintenance 16:10 UTC Marc to join Fil 16:17 UTC Jim to end X, BRS 16:18 UTC Jeff J. to LVEA, safety inspect 16:25 UTC SUS ETMX, TMSX to safe. Dave, SUS ETMX model restart, 20 bit DAC 16:25 UTC Corey to join Cheryl 16:27 UTC Vanessa to endX, endY 16:33 - 17:13 UTC Bubba to LVEA, 3IFO inspection 16:38 UTC h1calcs model change 16:42 - 18:50 UTC Chris to LVEA, forklift charging, etc. 16:44 UTC Christina, forklift by VPW 16:58 UTC Richard to mechanical room to look at heater circuits 16:58 UTC Terry to ISCT6 16:59 - 18:58 UTC Dick to ISC racks, RF measurements 16:59 UTC Nutsinee to ISCT6 17:08 UTC Jeff J. to end Y, safety inspect 17:22 - 17:30 UTC Hugh to LVEA to locate tools near squeezer bay 17:30 - 17:40 UTC Tour in CR 17:31 - 17:57 UTC Richard to mechanical room 17:40 - 18:06 UTC Gerardo to mid and end stations, checking for filters on fan exhaust 17:50 UTC Ed, Filiberto done, heading to end X to terminate cables 17:52 UTC HAM2 to isolated 17:54 UTC Dave, Jeff restarting ETMY SEI model 18:10 UTC Observatory mode to preventive maintenance, thought I had earlier 18:12 UTC Greg, DMT update 18:14 - 19:01 UTC Ed and Fil at end X, cable work, turning HV off 18:18 UTC DAQ restart 18:39 - 19:11 UTC Dave to end Y 19:20 UTC Pepsi truck through gate 19:23 UTC Corey, Cheryl and Jason done in PSL enclosure 19:30 UTC Observatory mode to locking 19:41 UTC DAQ restart 19:45 UTC ISI config to WINDY, starting initial alignment 20:27 UTC Restarted video0 20:42 UTC Greg M. done calibration update 20:58 UTC Observatory mode to commissioning 21:53 - 22:33 UTC Gerardo to end X fan room
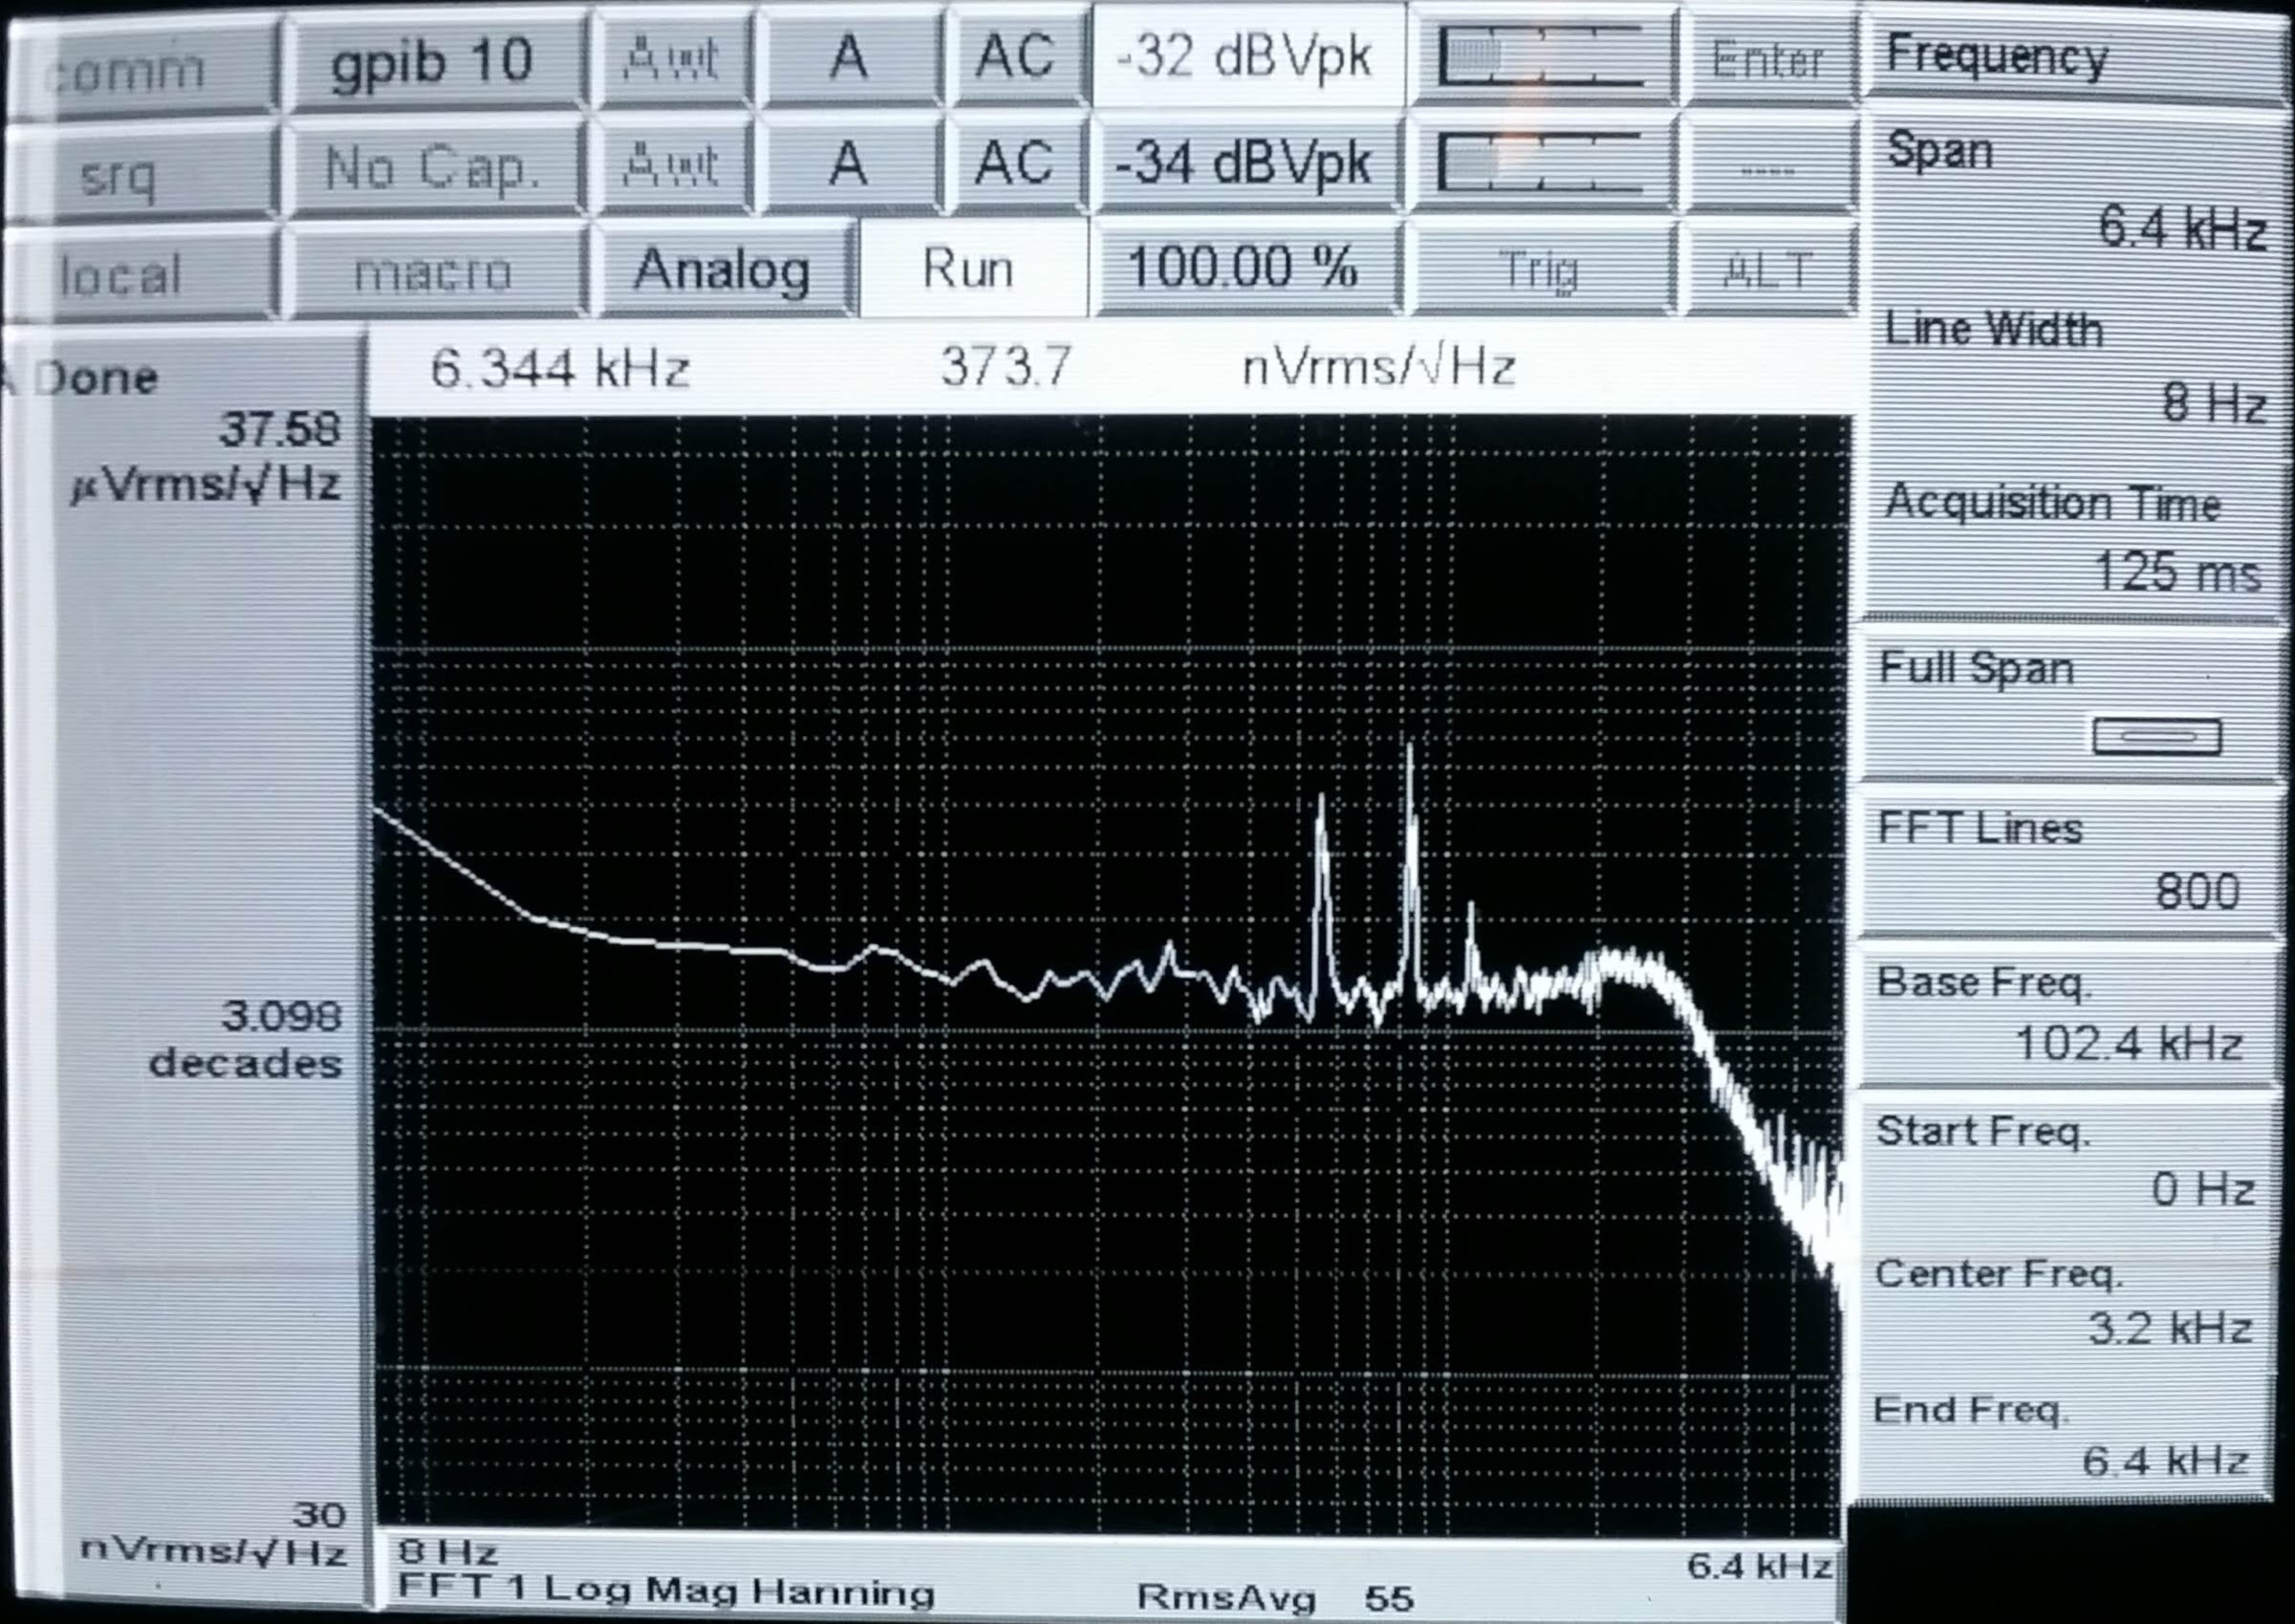
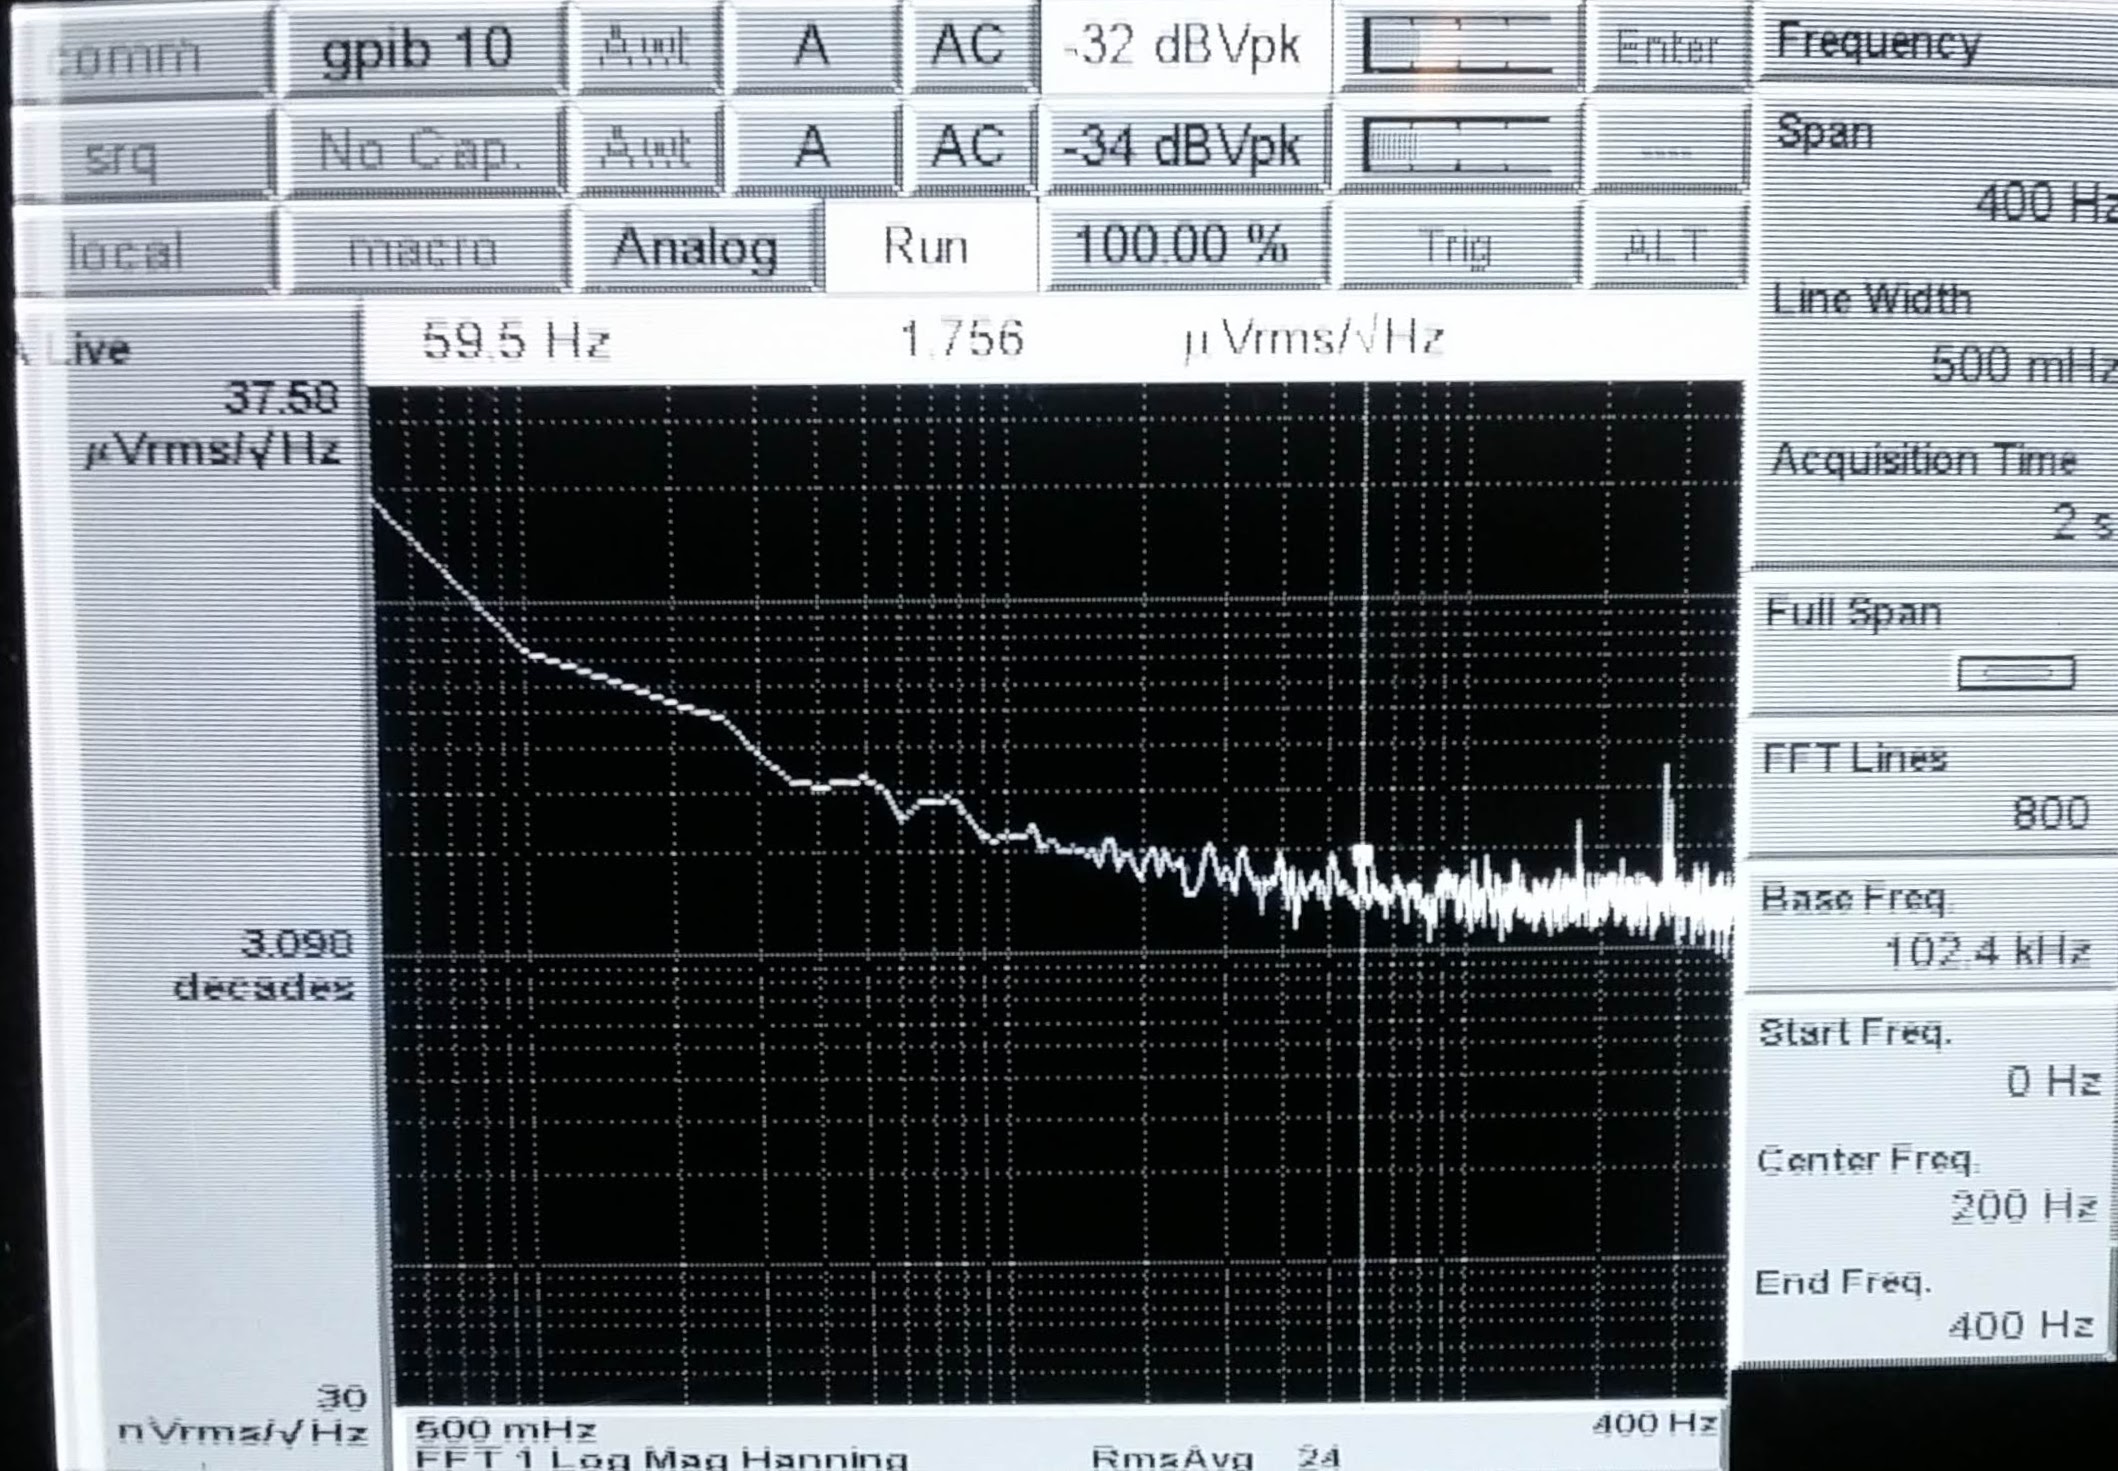
On the weekend, I measured the voltage noise on the ITMX and ITMY ring heaters. I found no evidence of a ~1 Hz peak (the Hartmann scan frequency at that time).
To do the measurement, I put a 25-pin breakout board in between the RH driver box and the cable. There are 3 conductors each for the positive and negative current drives. I used the SR785 with floating input (very important) and hooked up channel 1 through a single BNC to mini-grabber to the +/- pins of the breakout. Since the 785 is floating, the ring heater driver does not short to ground.
We noticed earlier that the coupling of the RH to DARM doesn't depend on the heating state of the ring segment. The differential voltage noise across the RH is ~1-2 uV/rHz in the 10-100 Hz band. This measurement didn't find any lines from the Hartmann camera, so either its not coupling through the RH, or the Hartmann power supply infection causes a common mode variation. This could be checked by measuring the voltage of one leg of the RH relative to rack ground with the floating SR785.
The next step to do, in ring heater noise budgeting, is to directly inject some noise onto the RH. This can be done with the same breakout connection; just disconnect from the driver box and drive directly into the RH using the SR785, or more flexibly, take a DAC output, buffer through a battery powered SR560 and use its 50 Ohm output to drive the RH from the control room.
Summary
Today I concentrated on resurrecting the DBB. The short version is it's still not quite working right. Despite what appears to be much better mode matching than previous, the DBB PMC still refuses to lock. I think more work needs to be done regarding tweaking the mode matching solution, but I ran out of time to complete this during today's maintenance window; this work will continue next week. In addition to the DBB work, I also realigned the bullseye PD.
Details
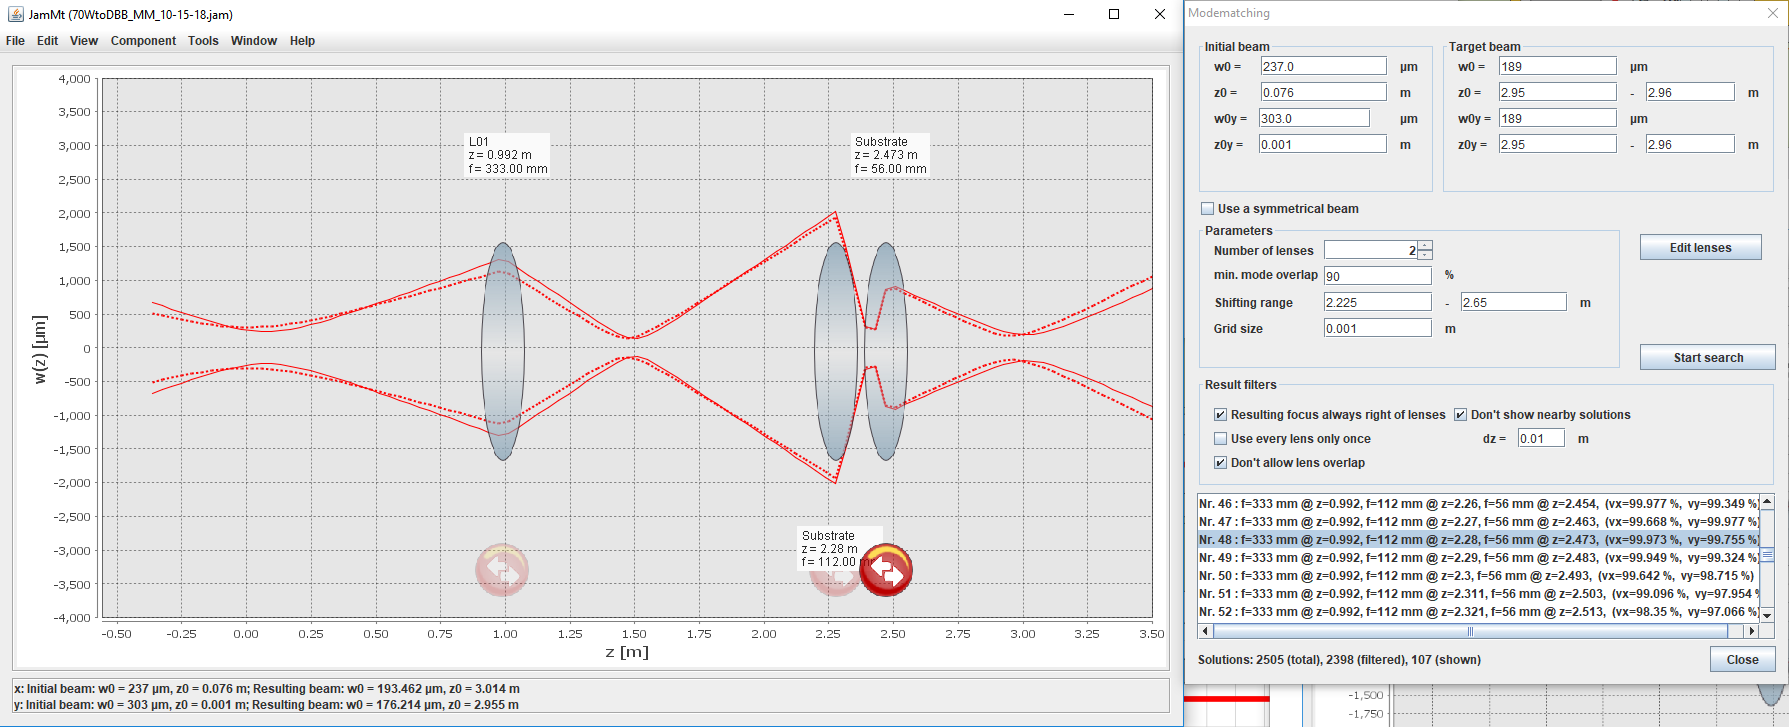
I began by implementing the mode matching (MM) solution shown in the first attachment (the solution is highlighted in the mode matching tool on the right side of the picture, Nr. 48). The lenses used have focal lengths of f1=100mm and f2=50mm (which becomes 112mm and 56mm, respectively, for a wavelength of 1064nm). I then tweaked the DBB PMC beam alignment and the positions of the MM lenses to minimize the associated peaks in a FSR scan (2nd and 3rd attachments, explanation below).
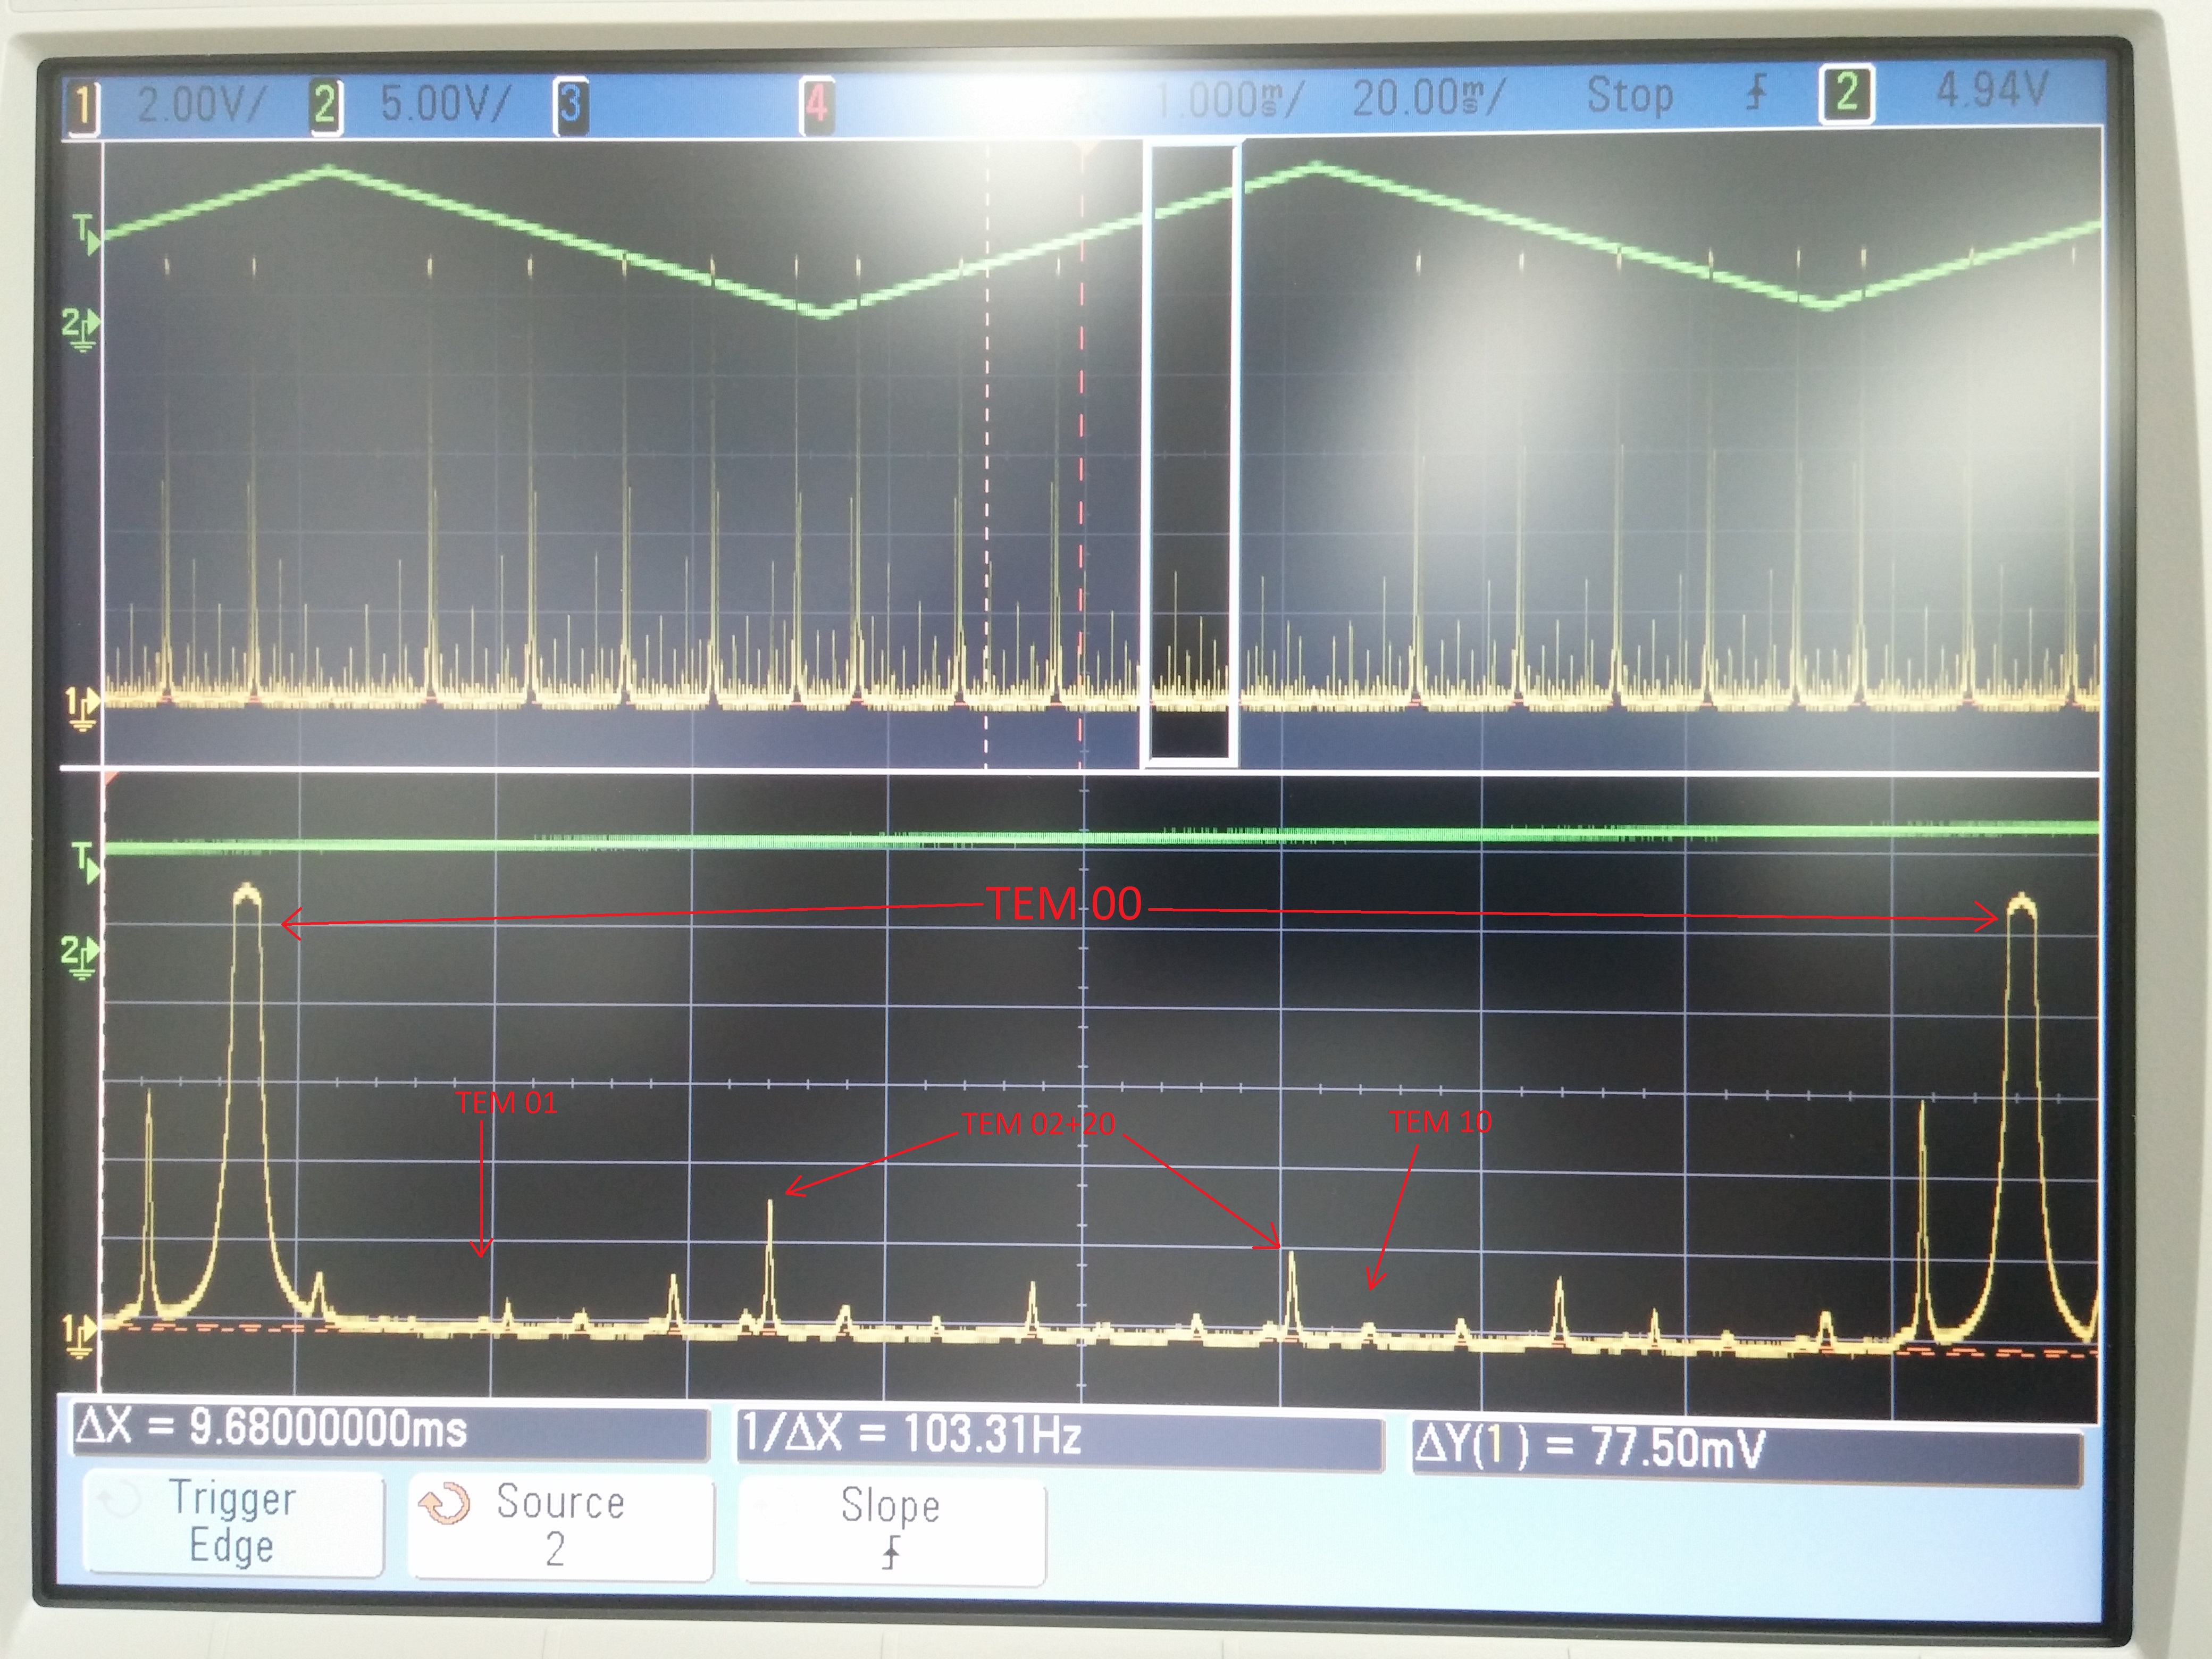
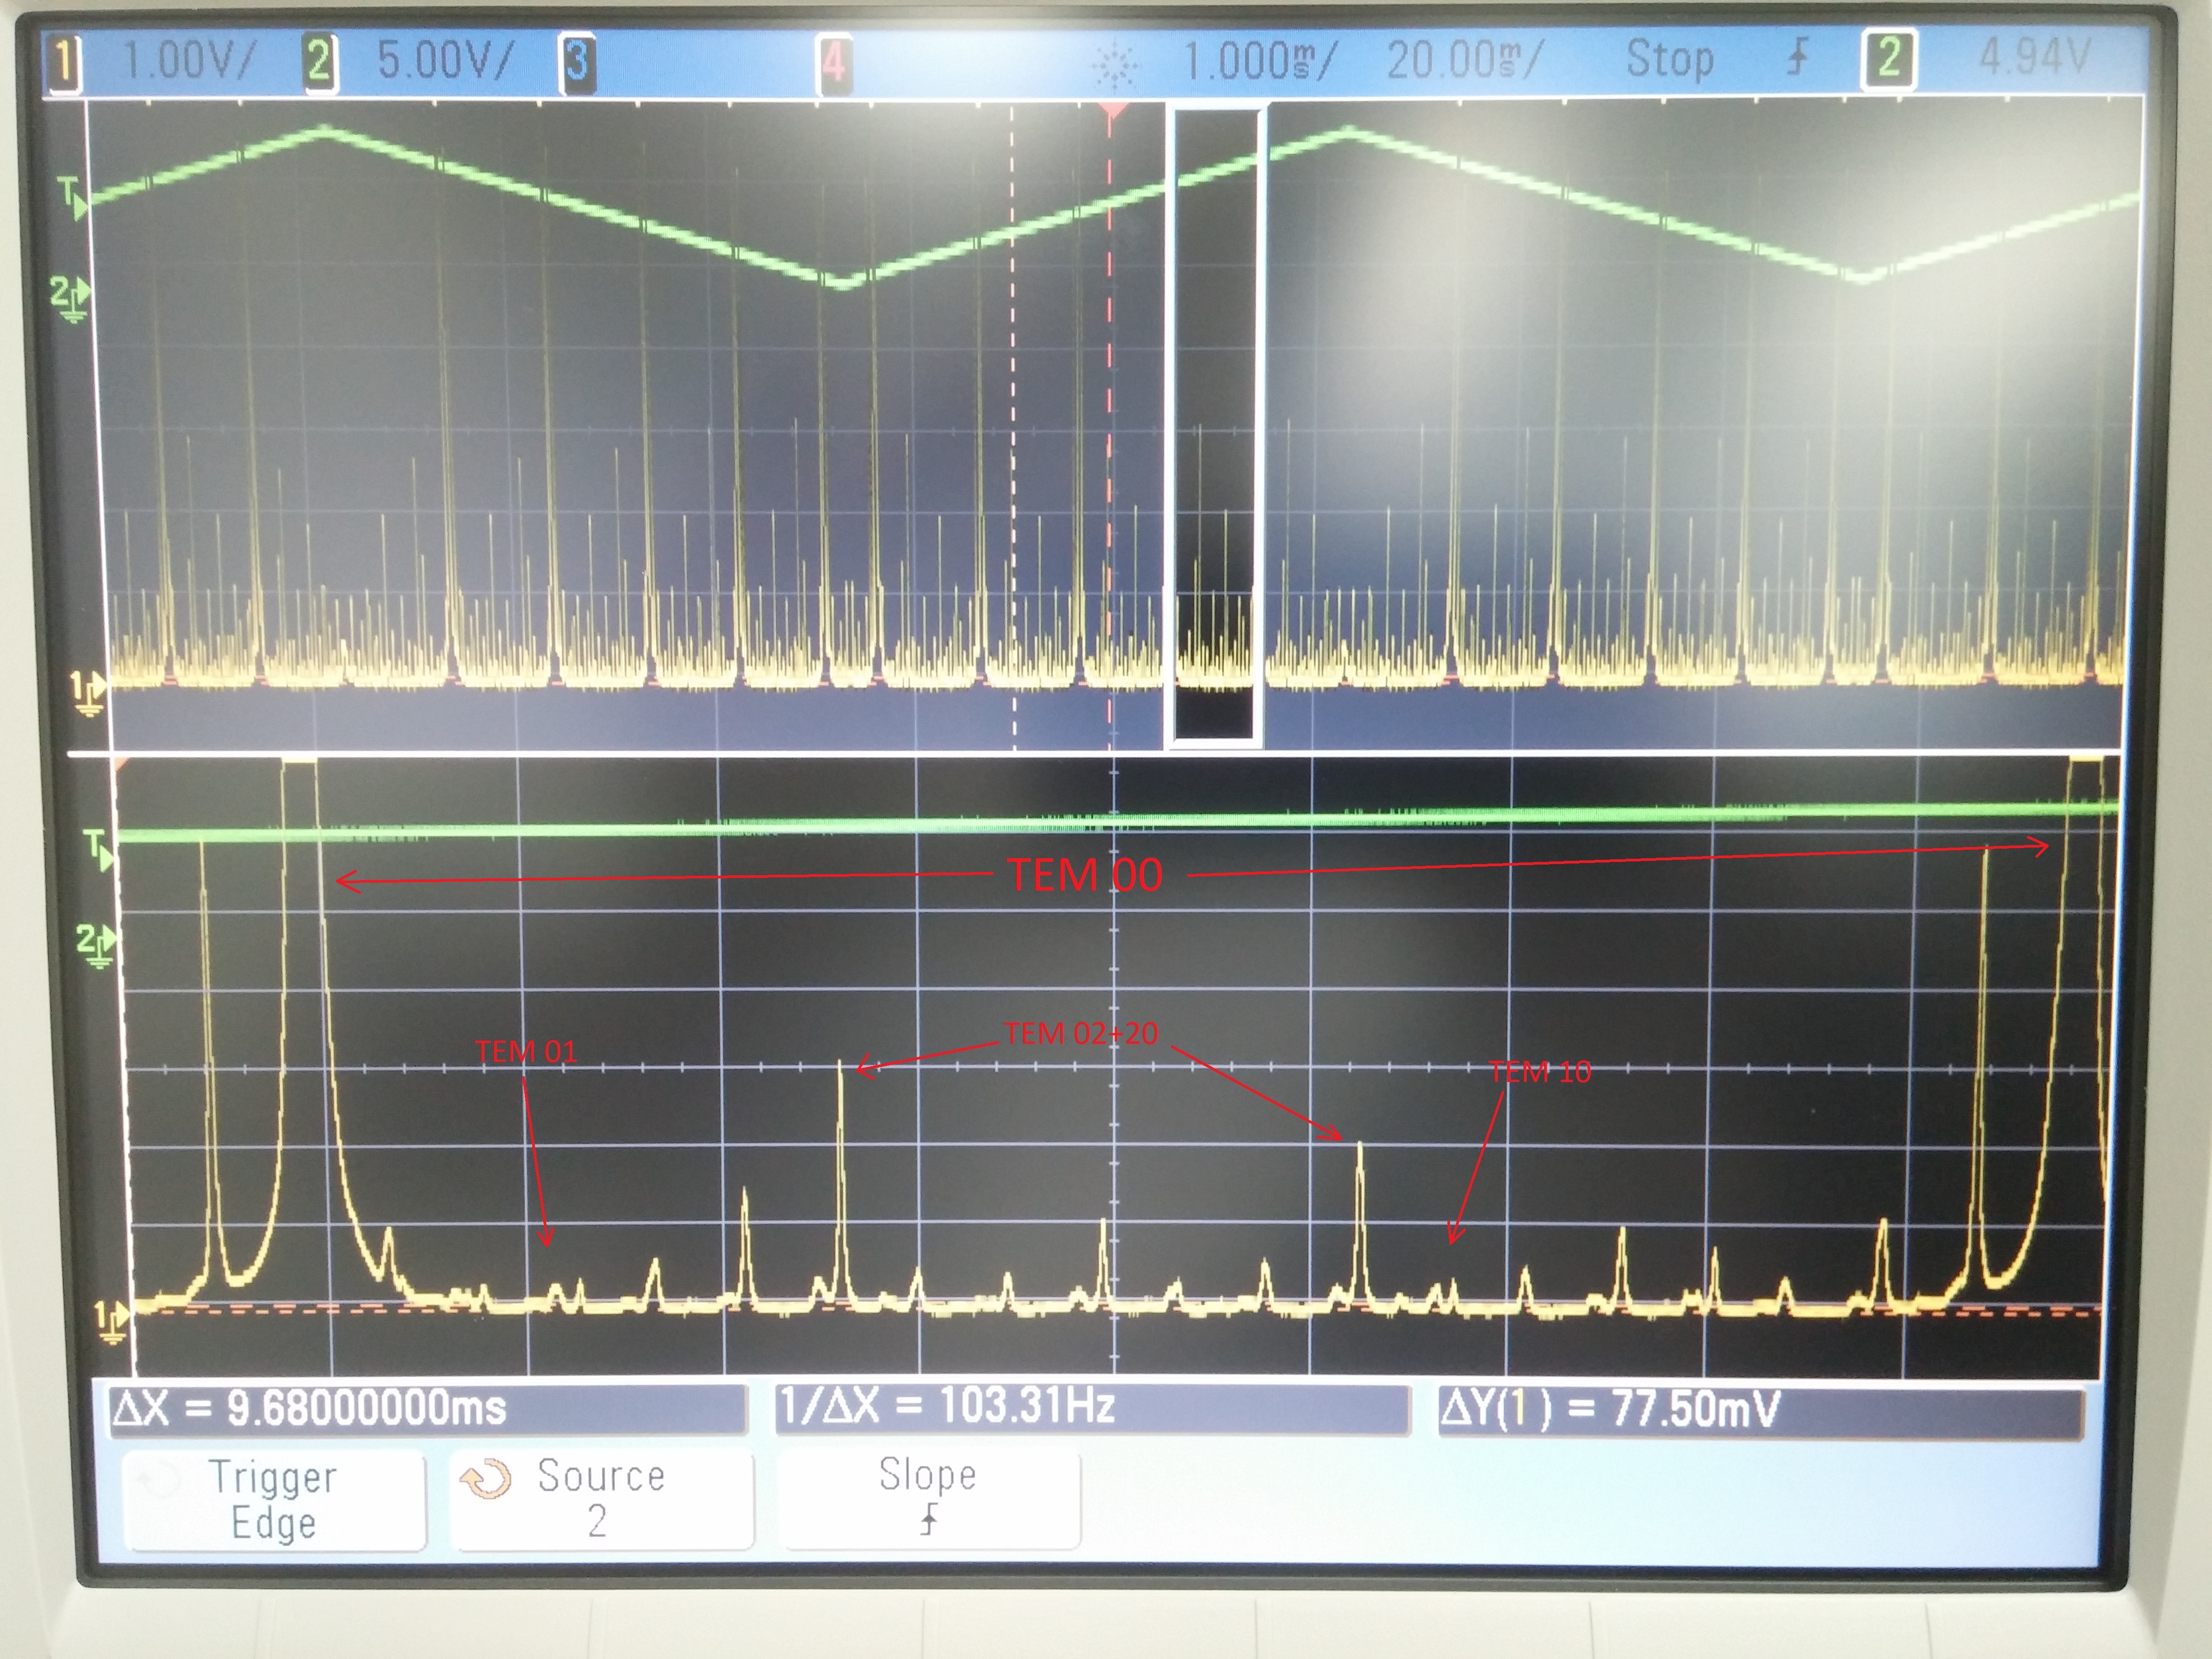
The second attachment shows a scan of a single FSR for the DBB PMC. This was taken by scanning the DBB PMC PZT at 10Hz and feeding the 40dB output of the DBB PMC's transmitted PD into an oscilloscope; the scope was triggered off of the PZT's ramp signal. The third attachment is the same scan, just zoomed in (I changed the V/div from 2.0V to 1.0V on the scope). I have also labeled the peaks we generally worry about when aligning and mode matching the DBB. The TEM10 and TEM01 peaks are minimized via alignment (as is standard for an optical cavity), while the TEM20+02 peaks are minimized via MM. As can be seen, the alignment peaks are almost gone (but not entirely, as I was focused on tweaking the MM solution; eliminating the alignment peaks is the last thing to do for the DBB and can be time consuming), but there are a number of extra peaks that I don't recognize from the last time I did this for the HPO (early 2016). These other peaks are higher-order modes that are resonant in the DBB PMC (and could be what is keeping the DBB PMC from locking). I was able to minimize a number of these peaks (there were many more when I started vs. when I finished) by tweaking the MM lens positions, so I think there is more work to do there. What is worrying to me though is the large peak directly to the left of the TEM00 peak. I don't know what this peak is, and I could not get it smaller. This peak was not present when I began tweaking the MM lens positions, it showed up as I was performing the position tweaks; in other words, while I was minimizing the MM peaks (and eliminating many of the other extra peaks along the way) this one just kept growing. This will hopefully be addressed as I finalize the MM solution next week, .
As a last test, I hooked up an old CRT monitor to the DBB PMC's CCD camera and scanned the cavity with a scanning frequency of 0.01 Hz to view the output modes (very slow so the output modes can be seen, any faster and they fly by too fast for visual identification); I see many radial modes that look to me like higher order Laguerre-Gaussian modes, indicating that there is more MM work to do. I am encouraged by the fact that this MM solution seems to be viable with some tweaking. The last one we attempted didn't work, at all (the resulting focus was ~8 inches short of where it was supposed to be...). To be continued next week.
In addition to the DBB work, I also realigned the bullseye PD. I noticed last week that there appeared to be no light on this PD (my apologies, I informed Jenne and Shiela of this but completely forgot to alog it). The beam path for the bullseye PD had been co-opted at some point for taking 70W amp beam propagation measurements, and had not been restored. In light of this, I restored this beam path and aligned the beam onto the bullseye PD; it is now ready for use. In the future (and this applies to myself as well), should this beam path be needed for any temporary purpose (such as taking a beam propagation measurement for the 70W amplifier) we need to be sure to restore it so the bullseye PD can actually be a useful diagnostic tool.
WP7890 20bit DAC install h1susetmx
Richard, Jeff K, Dave:
The fifth 18bit DAC was replaced with a 20bit DAC card. h1iopsusex and h1susetmx models were modified accordingly. After h1susex was powered back on we noticed that h1iscex had suffered a Dolphin induced ADC-timeout problem (IOP model still running, all user models stopped). This did not apply to h1seiex. I restarted h1iscey models.
WP7826 move h1calcs model
Jeff K, Dave:
h1calcs was stopped on h1oaf0. The files: rtsystab, testpoint.par and H1.ipc were edited to change h1calcs' location from h1oaf0 to h1oaf1. Jeff made the MDL change. The model was started at its new location and mx_stream was restarted on h1oaf0 and h1oaf1. A SHMEM IPC from h1calcs to h1odcmaster no longer exists, so h1odcmaster was edited to remove this IPC receiver and restarted.
WP7891 install h1seiproc
Jeff K, Jim, Dave:
The new h1seiproc model was started for the first time on h1oaf0. Some functionality of the h1oaf model has been relocated to seiproc.
First the new, smaller h1oaf model was installed. The rtsystab file was edited to add h1seiproc, as was the DAQ master file.
h1seiproc was started for the first time. All was well except that the ISI RFM channels from EX and EY were in error.
We tried restarting all h1oaf0 models, ISI at ETMY, and h1cdsrfm but the RFM errors persisted.
We then recompiled and restarted h1isietm[x,y] and the RFM errors went away (perhaps these models had been built to get the H1.ipc file entries, but an install was missed?).
Starting the new end station ISI code precipitated a code restart sequence as IPC changes made recently as part of the consolidation work required other senders/receivers to be removed. When the dust settled we had rebuilt and restarted end station ISI, PEM and SEI-PROC multiple times. During one h1pemey restart the h1iscey computer unexpectedly locked up. The local console was showing the log-in prompt, but the computer was unresponsive to SSH or keyboard input. I pressed the front panel RESET button to reboot it. A later h1pemey restart had no such issues.
h1lsc DAQ Loaded to negate make-install made on Friday
Dave:
After backing out Friday's h1lsc make-install and recovering the original DAQ-INI file, the GDS_TP was latched with a DAQ-modified warning. Pressing the "DAQ RELOAD" button cleared the warning.
DAQ restart
Dave:
three DAQ restarts during the course of the day for variaous reasons:
new h1seiproc
modified h1oaf, h1calcs, h1odcmaster, h1isietmx, h1isietmy, h1pemex, h1pemey models
edcu file for h1cdsrfm epics channel trending
fixed h1seiproc DQ channel list
WP7888 ISC_LOCK model code
Deferred until next week
WP7885 Solaris upgrade for h1fw1's system
Deferred until next week
Overview screen updated to show h1calcs move to h1oaf1 and h1seiproc added to h1oaf0
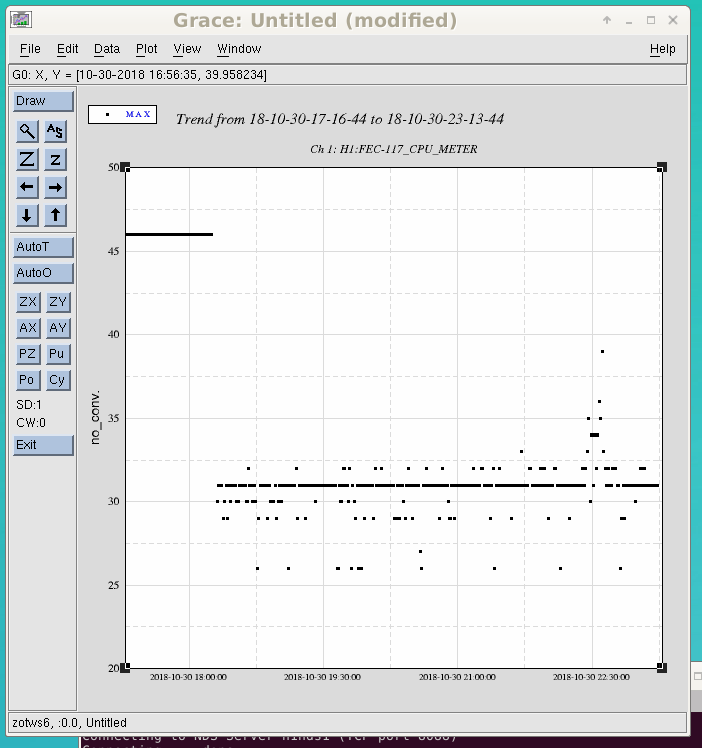
attached minute trend plot (cpu-max) shows speed up of h1calcs model when it was moved from h1oaf0 (V1 12-core) to h1oaf1 (V4 8-core).
Pulled in power cable for Faraday camera that was installed by Gerardo/Cheryl, alog 43705. Camera was left on temporary power supply since removal and installation of power cable might effect camera alignment.
Came in a early to squeeze in ETM charge measurements. Here are some notes:
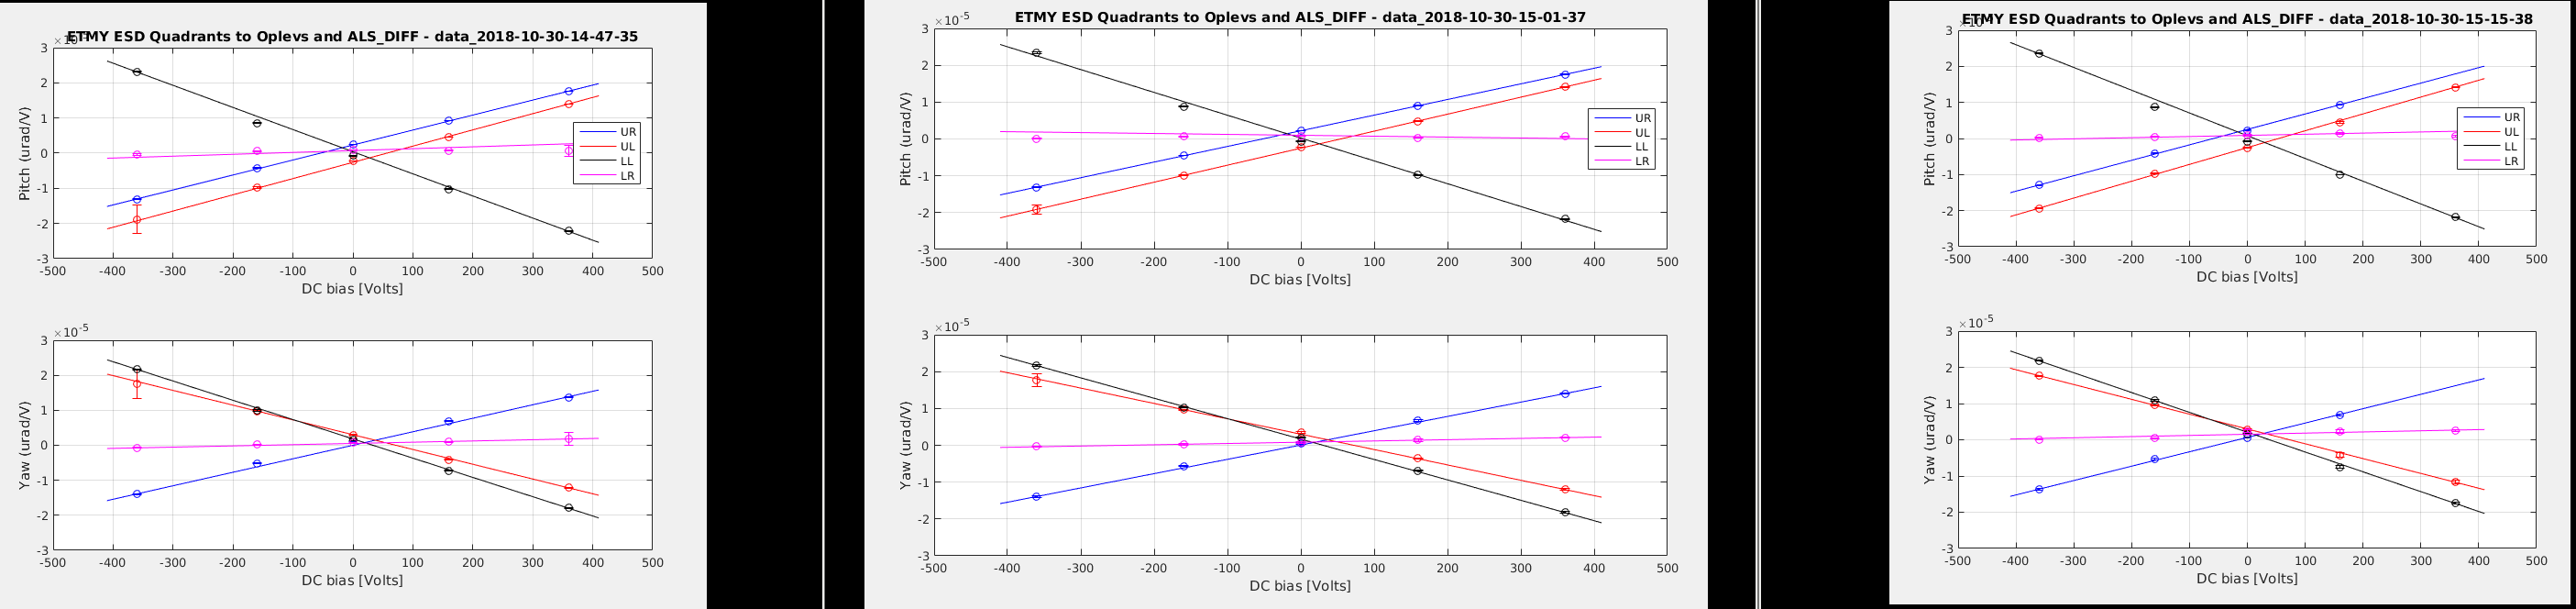
Below are the slider values & brief notes/checks of the measurements for both ETMs as I was running. I ended up running the full script which had 5-measurements for ETMx & ETMy. As long as we had three good measurements for an ETM, then we are good. A good measurement basically shows a matlab plot with an "X" on it. Attached are measurements for ETMx & ETMy.
Alignment slider values & brief notes/checks on measurements as I was running the procedure:
ETMx: Pit: +102.3 & Yaw: -131.0
NOTES for ETMx: See attached plot with 3-good measurements + 1 bad one. For the ETMx one, the first measurement did not look good for Pitch ( w/ no "X" and all four quadrants were a flat 0 urad/V); the next 3-measurements looked good.
ETMy (w/ ESD LR quadrant bad!): Pit: +122.3 & Yaw: -125.9
NOTES for ETMy: See attached plot with 3-good measurements. For the ETMy, mainly had an "X", but the ETMy LR quadrant was 0 urad/V. This is a known failure for the the ETMY ESD (FRS#10543).
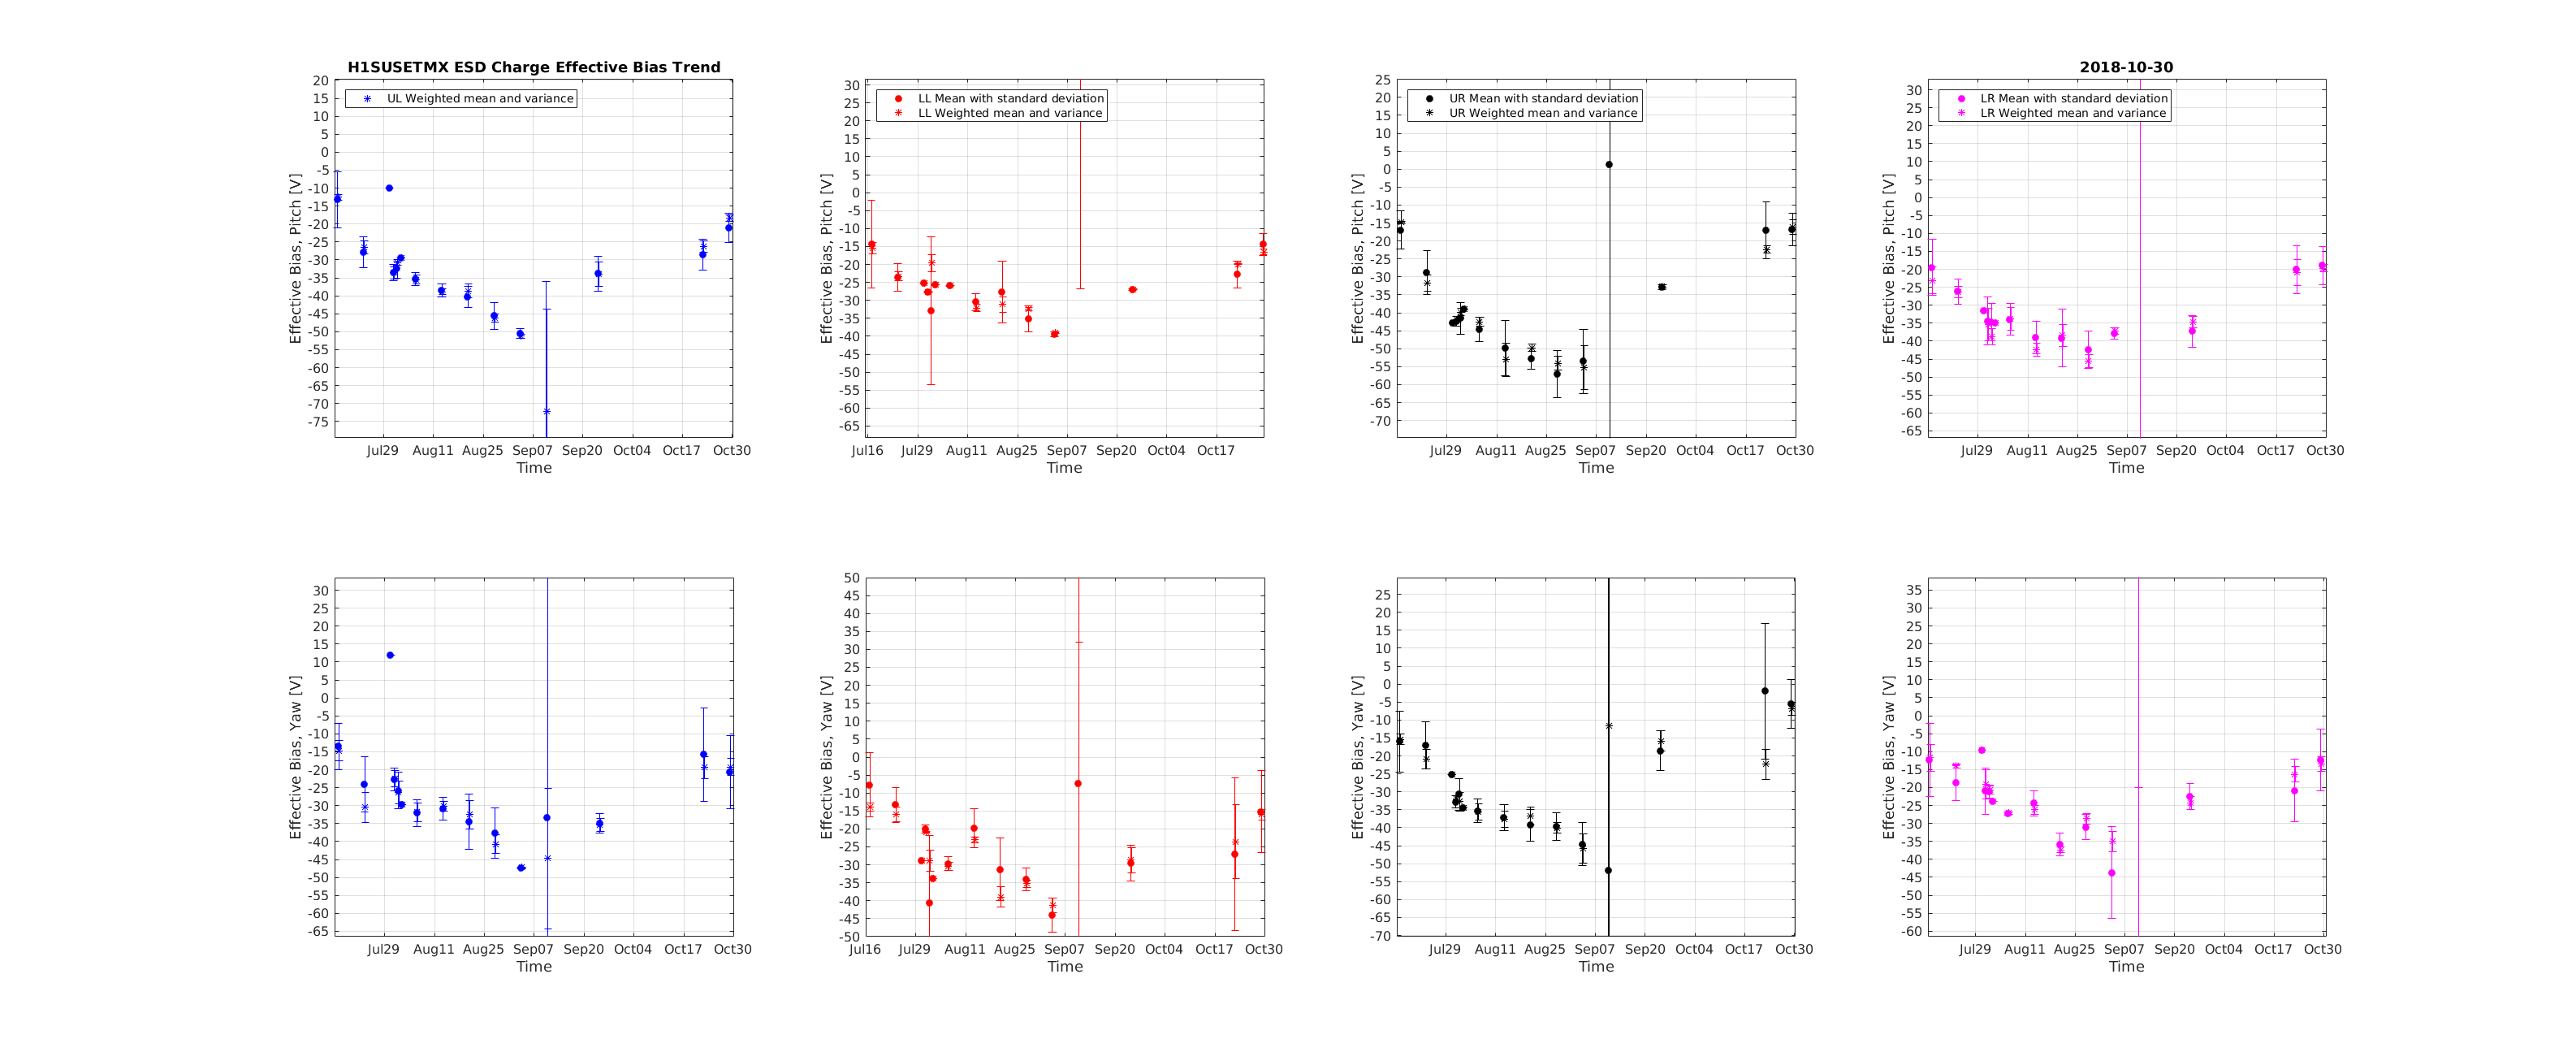
I've added today's data to the long trend plots of effective bias voltage for each quadrant, see first attachment for ETMX and second attachment for ETMY (sorry about the annoying axes on ETMY). No surprises: the same trend on EX due to the induced polarization caused by the bias voltage, and fairly flat for EY.
Measurements taken before and after the ETMX 20-bit DAC install show the same actuation strength (within error bars), which is good. The channels these scripts store and calculate the drive voltage from are the L3_ESDOUTF out channels.
I think I might need to update the calibration the scripts for the other types of charge measurements, which, if I remember right, read out the MASTER_OUT channels but I haven't done this yet.
New cables for the install of the L4C units in HAM1 are now routed to the feedthrough. Cables were left disconnected.
In the CER a HAM ISI Interface chassis was installed in Rack SEI-C1, slot U33. Serial number of new unit is S1301548.
[G. Mendell, J. Zweizig, M. Wade, A. Viets]
I restarted the primary calibration pipeline on h1dmt0 around GPS 1224964469. The restart picked up gstlal-calibration-1.2.1, which will allow us to read in the new front-end channels. More information about gstlal-calibration-1.2.1 can be found here. Latency is normal (~5 seconds), and there are no signs of any problems so far. The calibration pipeline is producing 1-second frames, and it looks to me like the DMTDQ process is still running but producing 4-second frames.
This completes the update to gstlal-calibration-1.2.1 (with a long list of dependencies, including ldas-tools and gds) on the production DMT computers at LHO: h1dmt0, h1dmt1, and h1dmt2. This completes WP: 7894.
The redundant pipeline on h1dmt2 was restarted around GPS 1224966041.
The primary and redundant pipelines were restarted again around GPS 1224978658 with 4-second frames, since that is what the DMTDQ process is producing. We were previously seeing an issue where the output of the DMTDQ process was producing a frame with one second of data every 4 seconds. This should be fixed now.
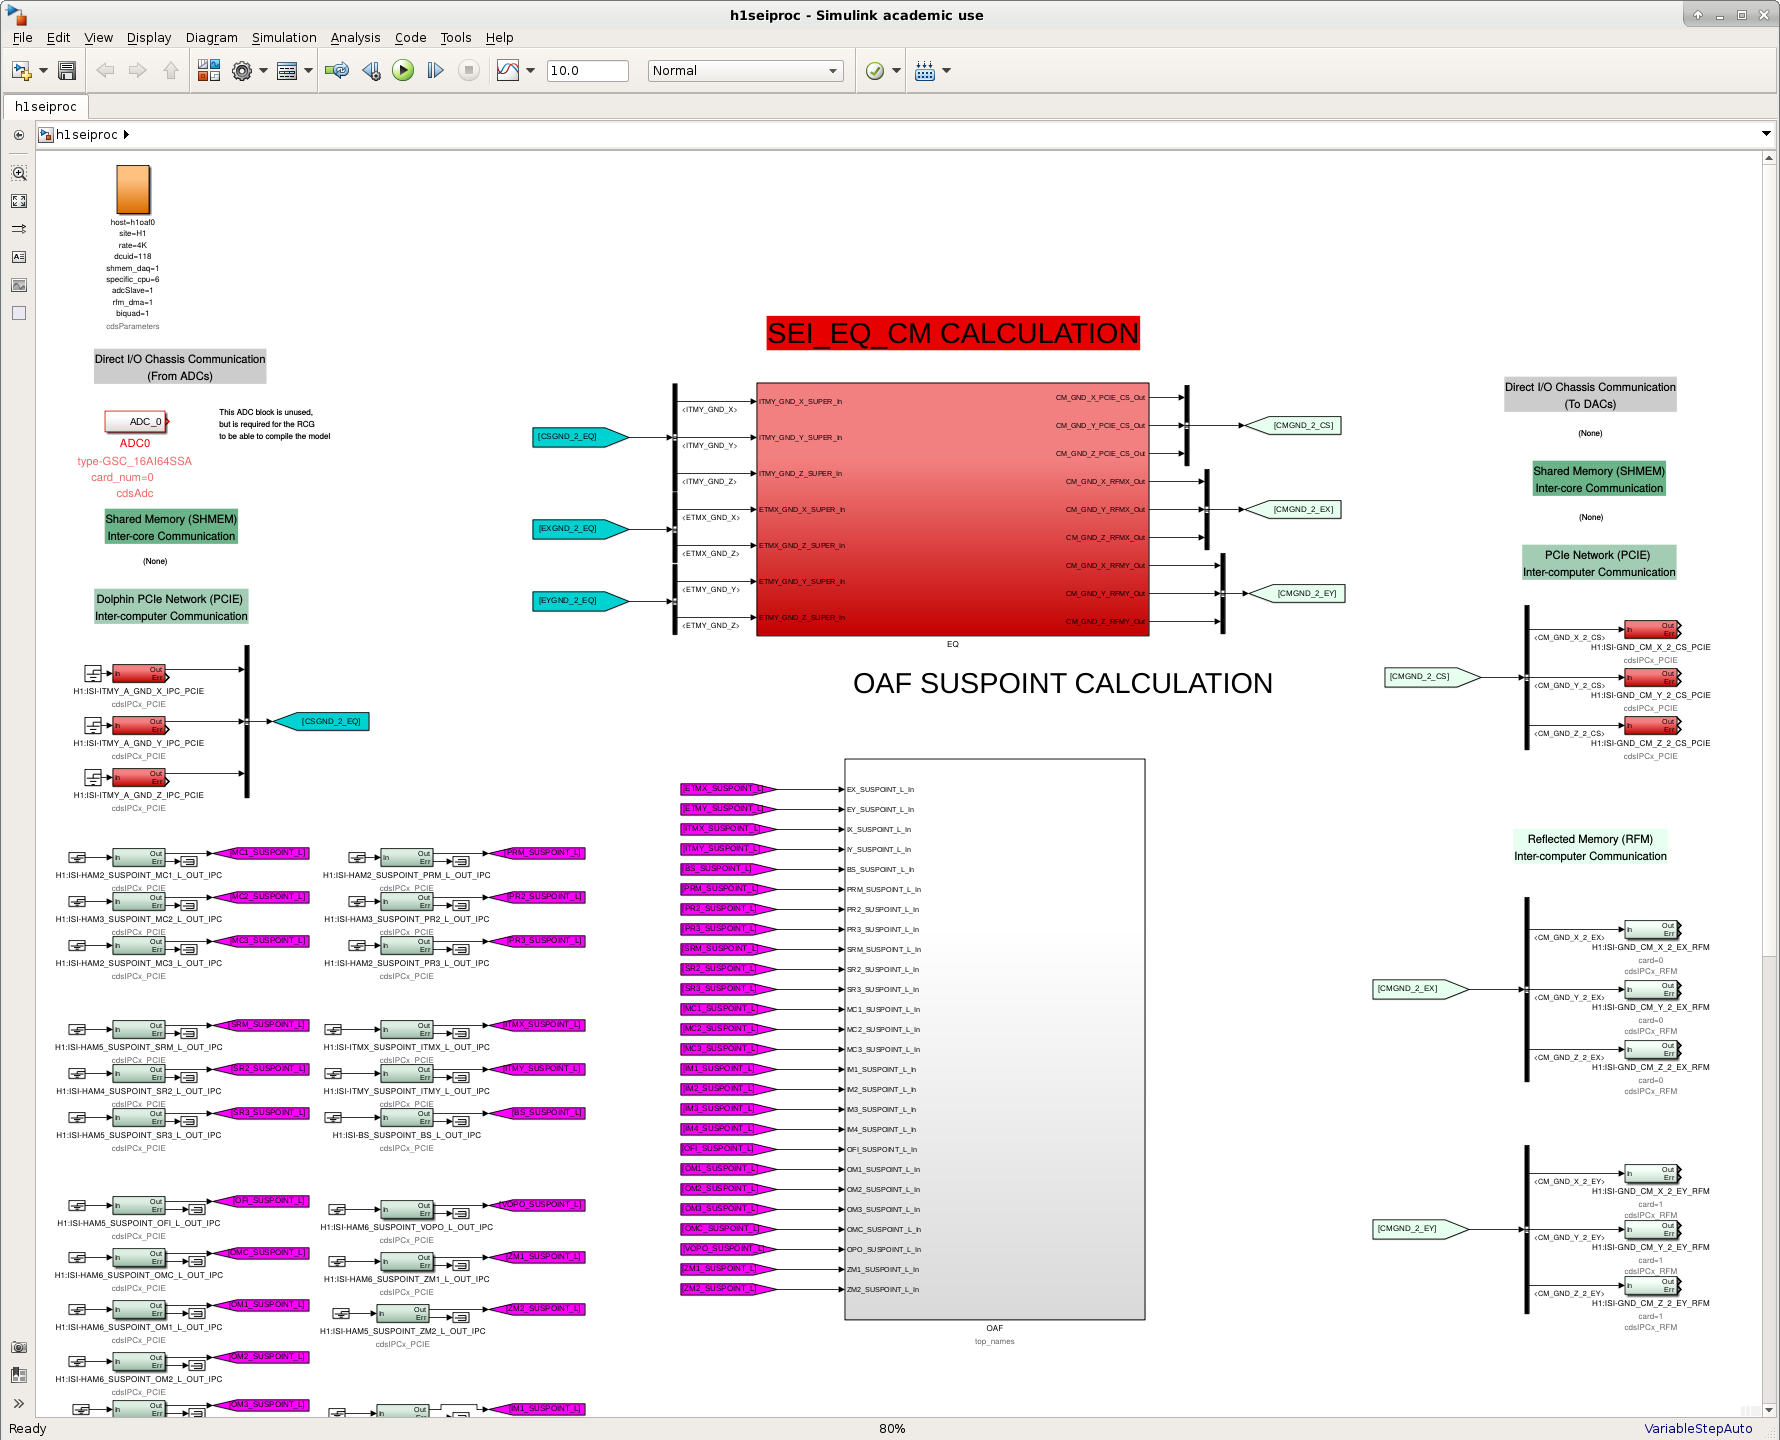
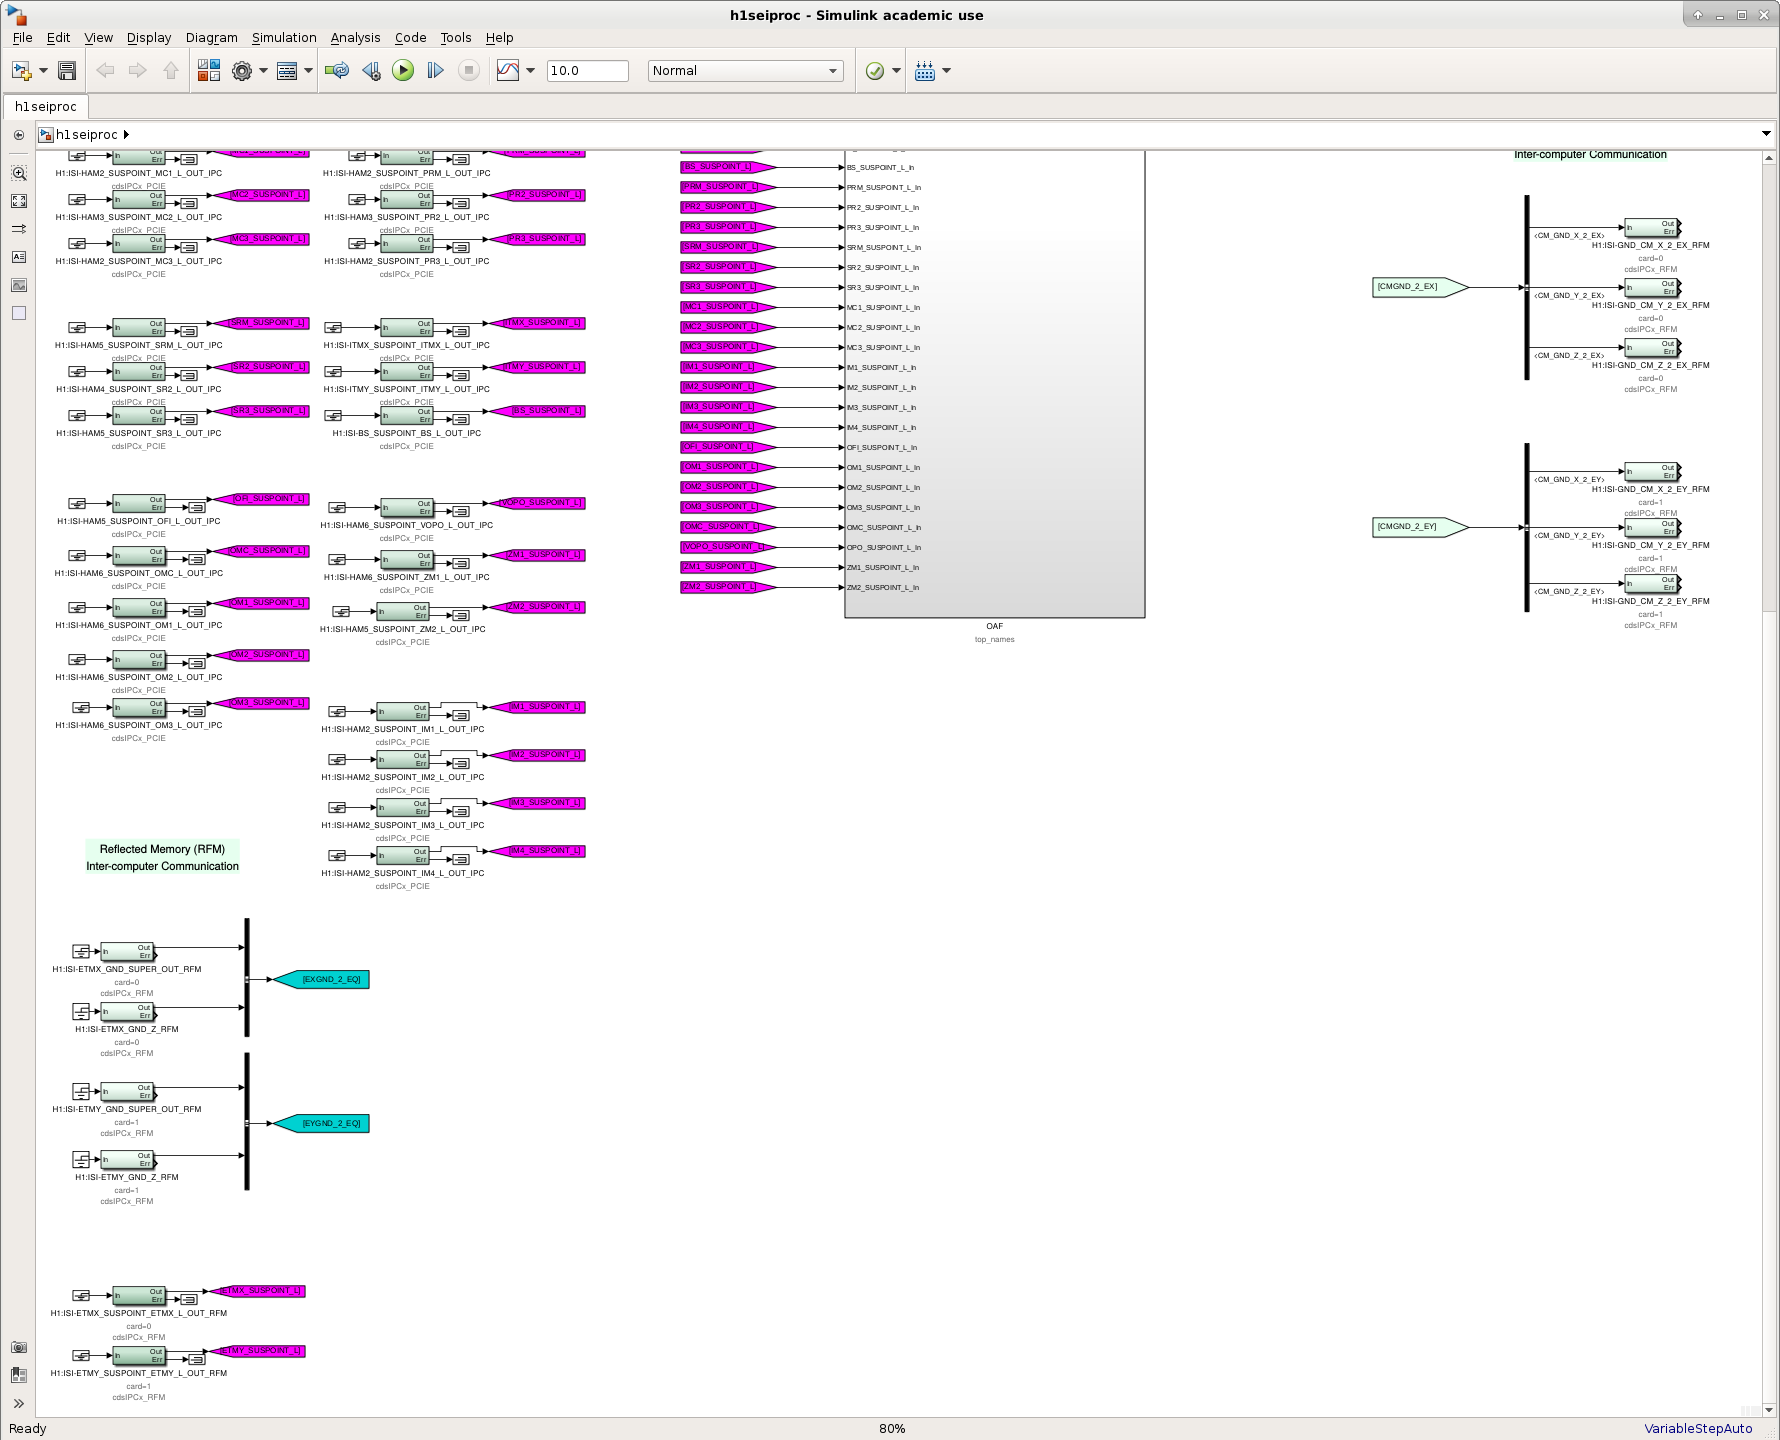
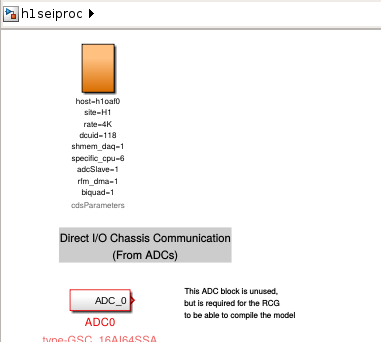
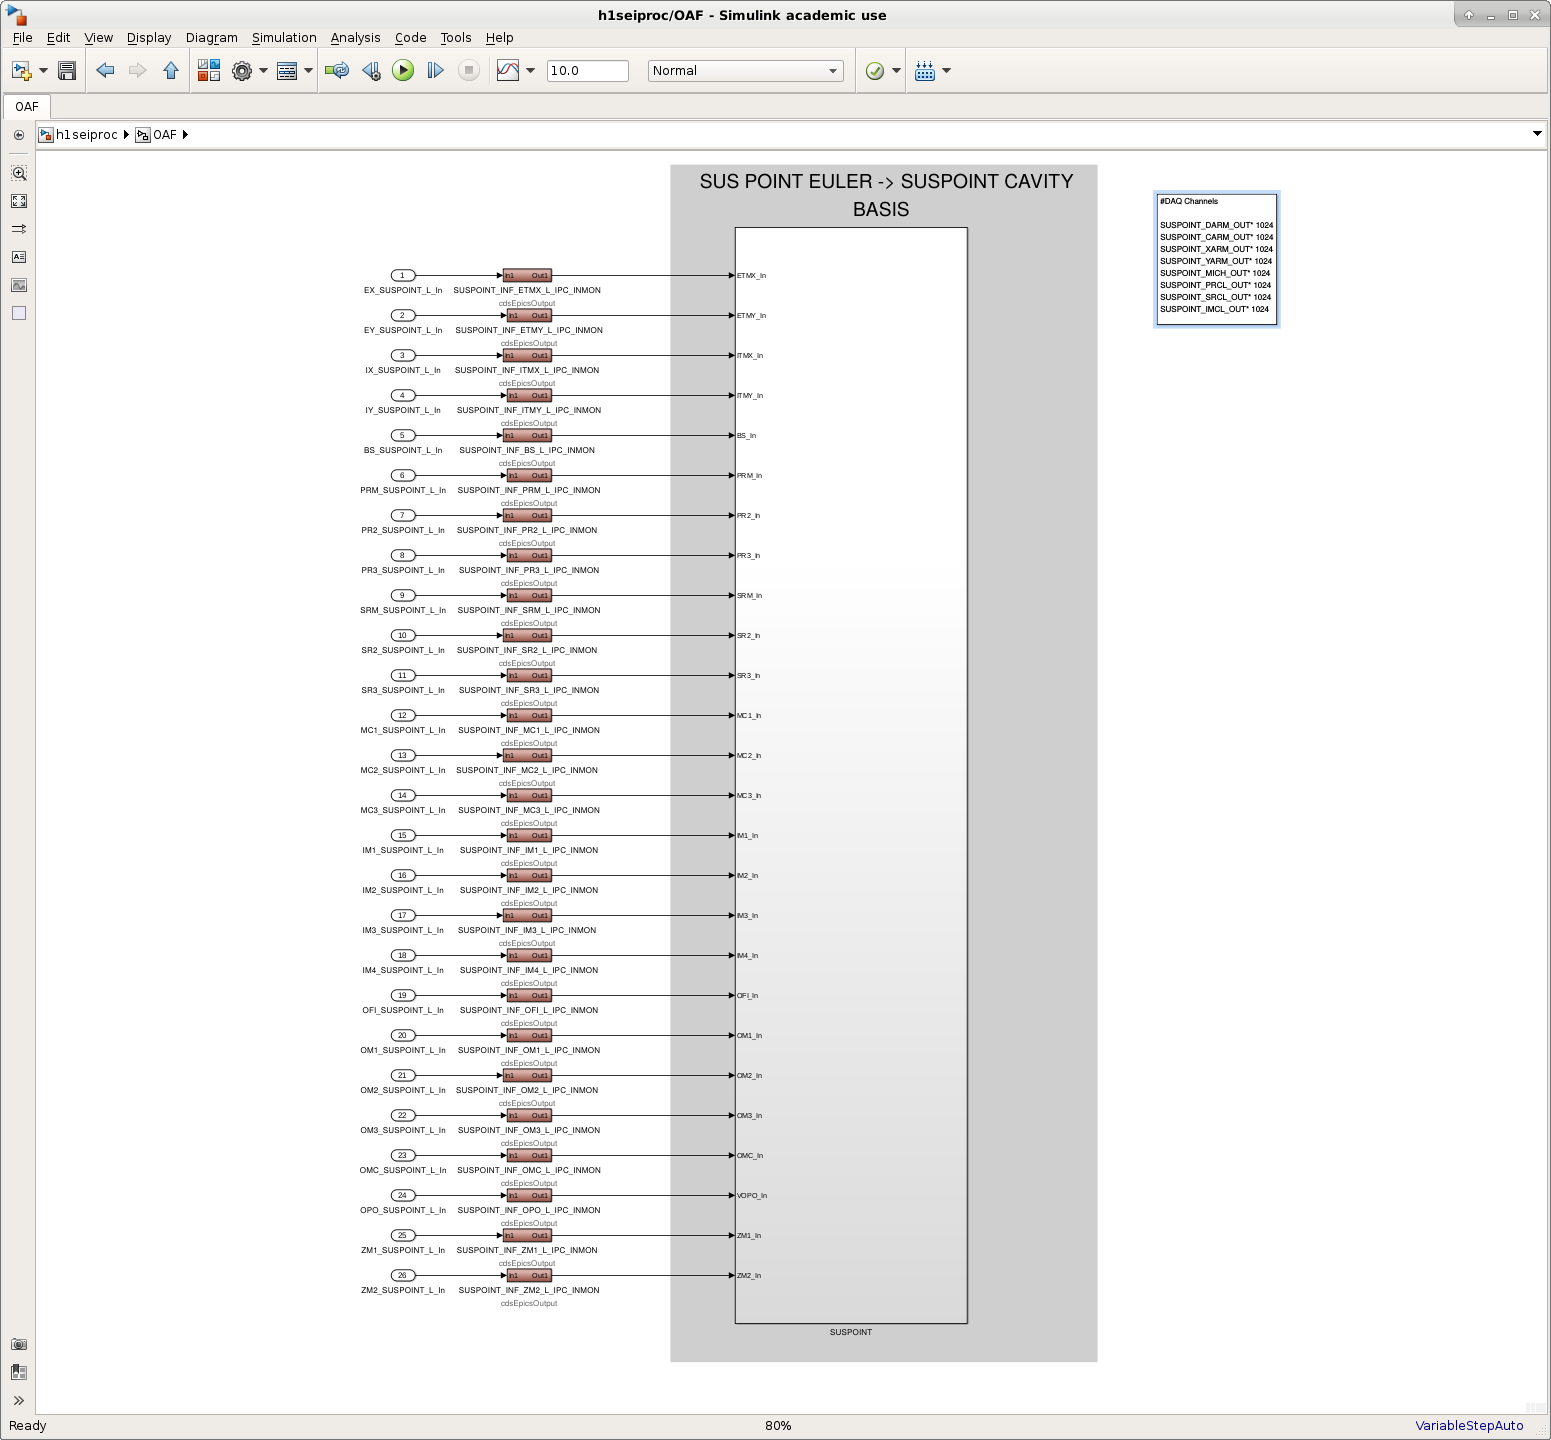
J. Kissel, D. Barker, J. Warner WP 7826, 7848 ECRs E1800271, E1800268 IIET Tickets 11564, 11552 Over the course of O1 and O2, the h1oaf front end model (and associated computer h1oaf0) served as prototyping playground in what was originally conceived as an "Online Adaptive Filtering" or OAF computational machine. Now that - the OAF computer is now two computers, one with a faster processing speed and more cores (a.k.a. h1oaf1), - front-end computers and associated models can be run without an associated I/O chassis, and - we have long-range dolphin network systems that replace the reflected memory for communication down the arms, we are re-organizing and pruning of content of what was previously all inside the h1oaf user model. See lots of details about the re-oragnization and proposed changes in the presentation G1801962 associated with the above mentioned ECR E1800271. Today, we've done two parts of this change: (1) We've created and installed a brand new front end model (with DCUID 118, on specific_cpu=6, of h1oaf1) called h1seiproc. This model now contains (a) The projections of ISI GS13s -- that have already been projected into their respective suspensions longitudinal motion of the suspension point -- into the interferometer degrees of freedom (at the suspension point; it does not *yet* include the dynamical response of the optic from motion at the suspension point). Because we don't want to have to re-draw MEDM screens, we've retained the OAF_SUSPOINT channel name structure using the top_names feature of the RCG. (b) Brand new prototype code that is producing common mode ground motion that will eventually be used for earthquake mitigation (see above mentioned ECR E1800268) See the first 6 attachments that show the content of this new model. (2) We've pruned out all of the content that has now been moved over to the h1seiproc model, and along the way, removed any "abandonware," i.e. prototypes of the above mentioned projection matrices, and other online adaptive (wiener) filtering prototypes. See last attachment that shows what little is left over. Note, there are two things that L1 has and uses that will eventually go into the seiproc model, that have not yet been installed: (a) The latest and greatest attempt at online adaptive wiener filtering (b) A test signal constructed of a combination of HAM6 accelerometers and ground seismometers. There's no party actively using these, so we'll wait for a less hectic maintenance day to install those lower priority infrastructure. Finally, there remains content that will eventually become two more brand new susproc and iscproc models, but more details on that later. Since it's been so long since we created a brand new model, we want to see how well the creation seiproc goes before we create the rest of the new content.
Thanks Keith! Apologies if it wasn't clear -- we have run h1seiproc (running at 4096 Hz) on the slower h1oaf0 machine, as you recommend.
Correcting a misconception - the original OAF computers (h1oaf0) have two(2) six(6)-core CPUs, for 12 total cores. The additional OAF computers (h1oaf1) have a single eight(8)-core CPU, for 8 total cores. So h1oaf0 has more cores. So oaf-type real-time processes that don't need the high speed of the OAF1 machine can stay on OAF0
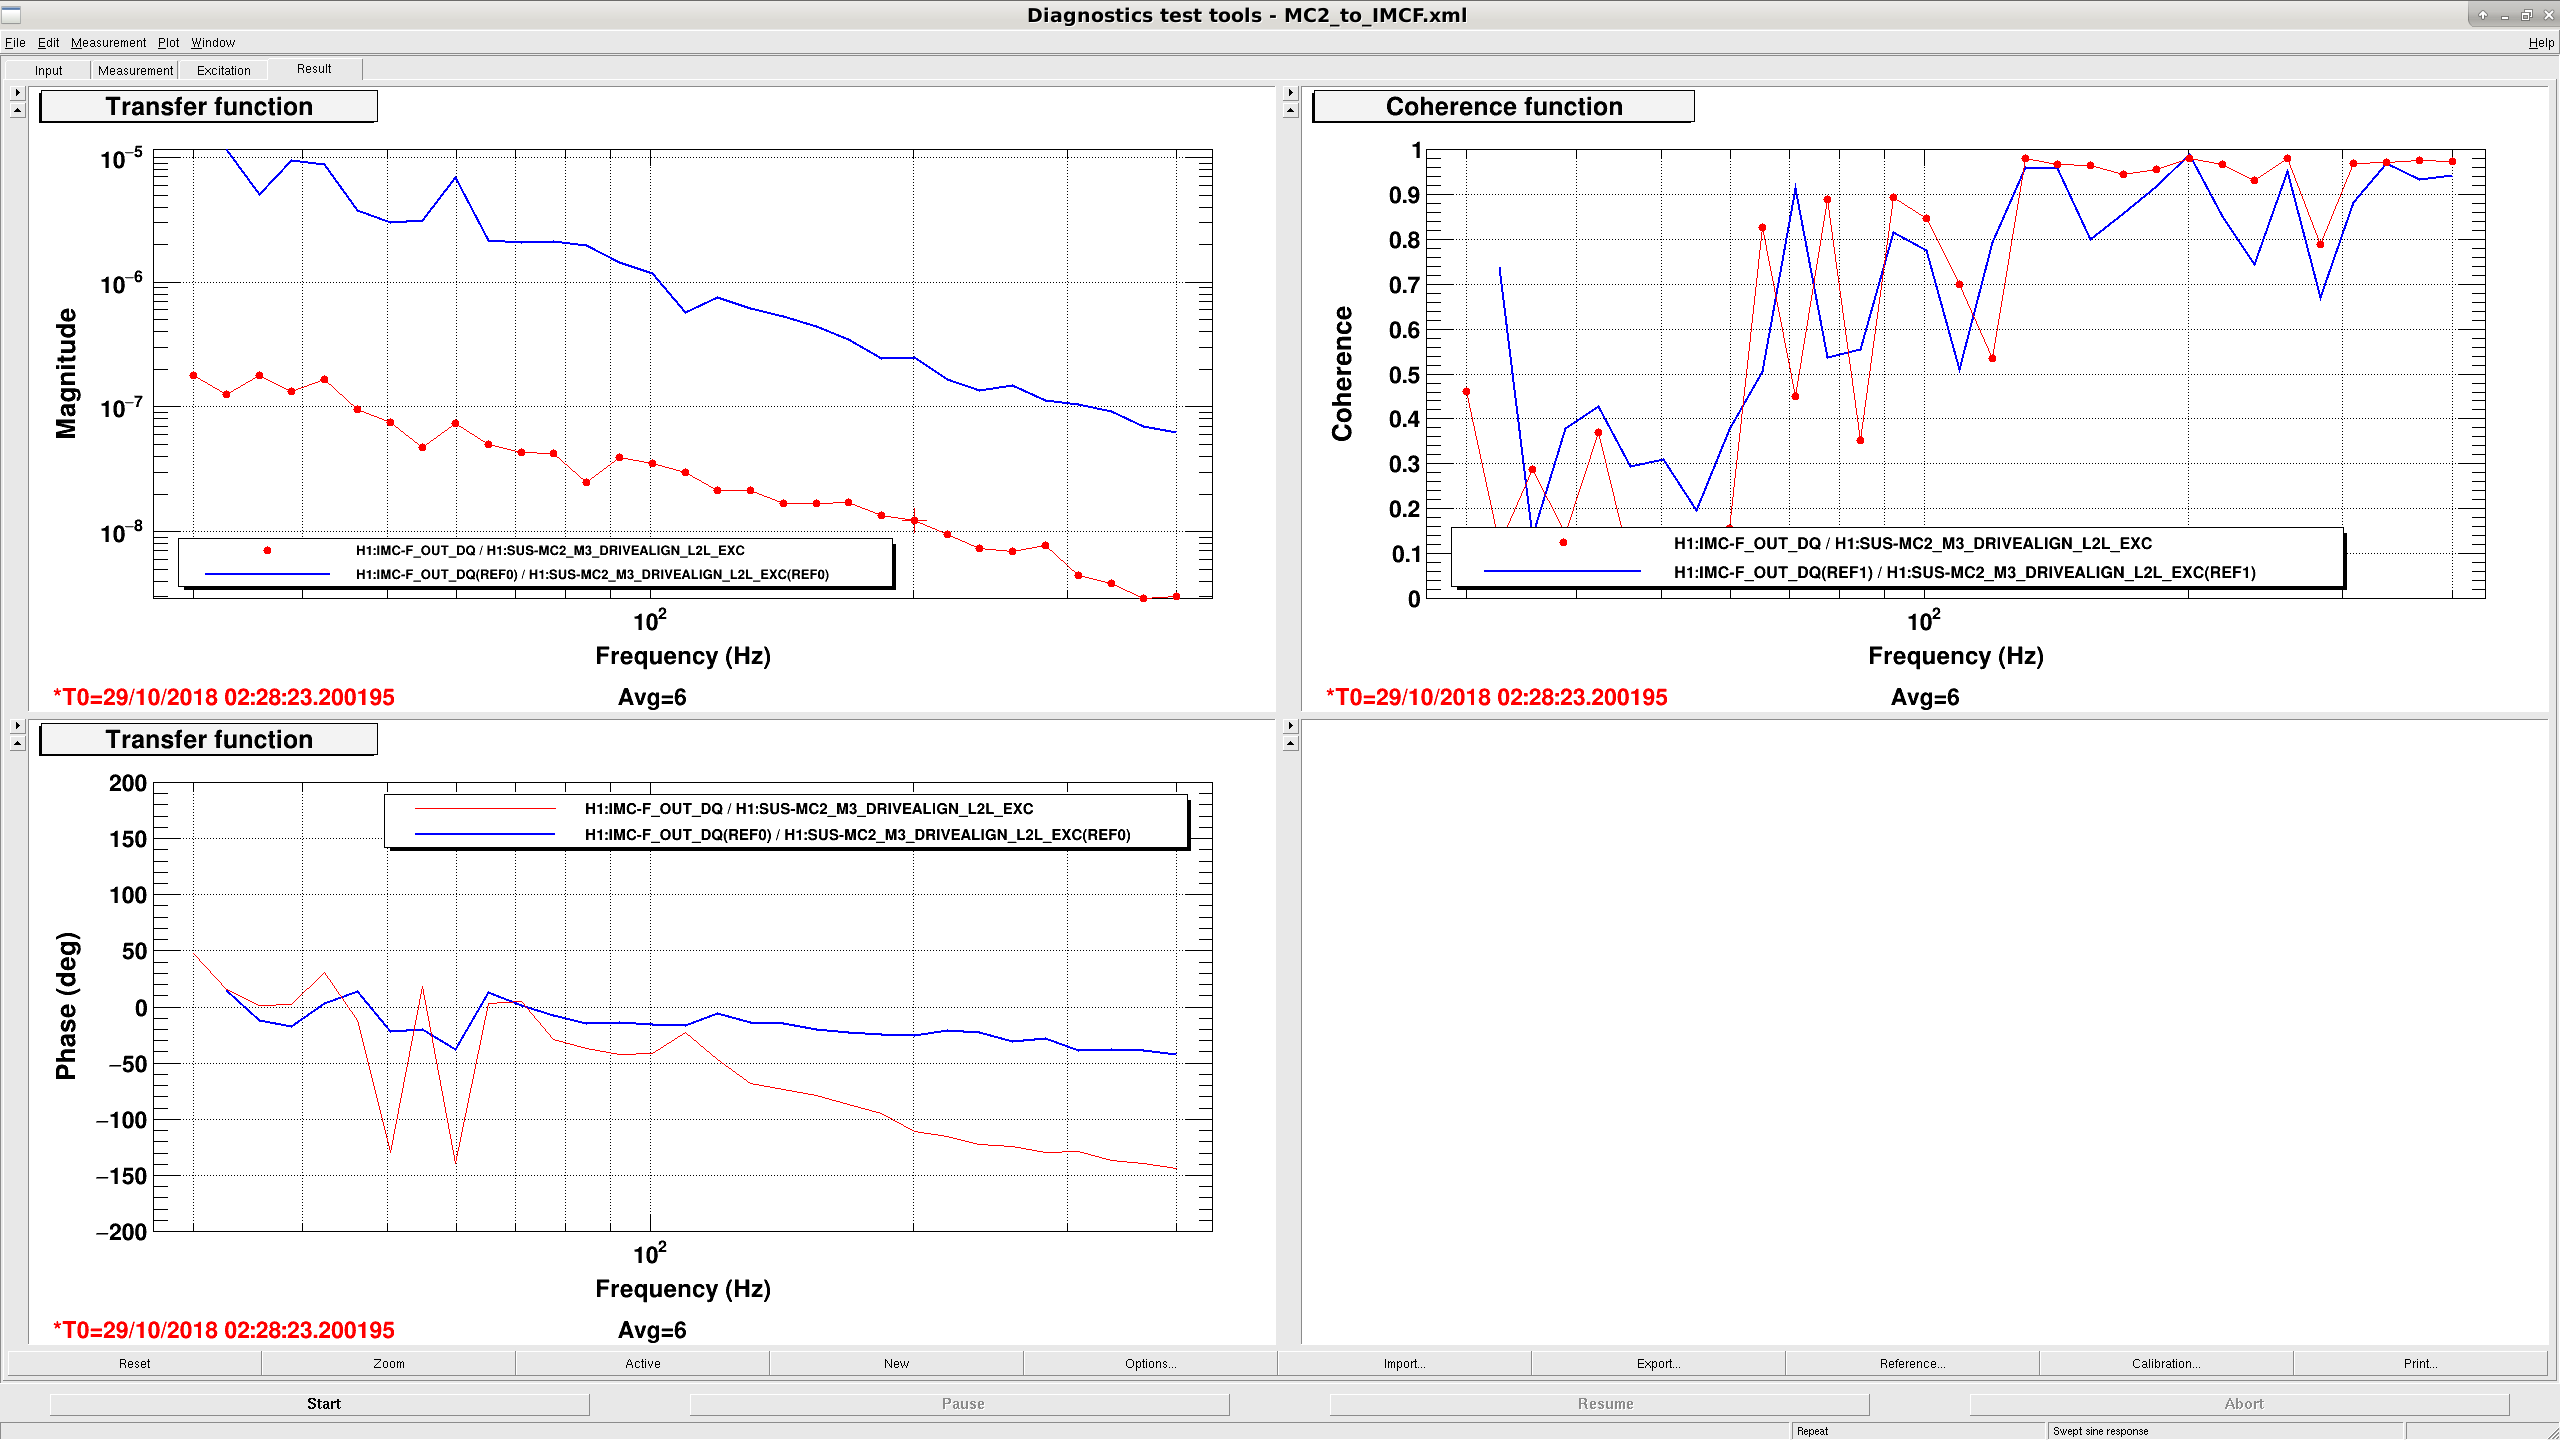
Previously when trying to understand the CARM loop, I'd calibrated to some additive noise on the input to the interferometer. There were also some issues with our understanding of the REFL_SERVO_ERR channel and our frequency injection into MC2 that were not resolved. Here, I will calibrate the CARM error signal into the loop-suppressed frequency input into the IFO, and resolve some of the misunderstandings with REFL_SERVO_ERR and the MC2 frequency injection calibration. REFL_SERVO_ERR and the shot noise spectra It's as simple as we didn't know there was a factor of 200 boost in the "generic filter" part of the CM board which goes to the ADC. So to convert from common mode board volts to counts you have to multiply by 200 V/V and 2**16/40 cts/V. PDF 1 shows the REFL_SERVO_ERR channel plotted alongside analog spectra for REFL9 shot noise and dark noise spectra. The dark noise spectra were taken without the mode cleaner locked, while the shot noise was taken with direct reflection off PRM with the rest of the IFO misaligned and 2 watts input. MC2 Length Injection to Frequency Calibration While CARM was locked, Rana and I drove MC2 in length and got a TF from REFL_SERVO_ERR [cts] to IMC_F [kHz] of 3.1e-7 kHz/cts at 71.1 Hz to calibrate CARM last time. That's valid as long as you remember that CARM is not doing all the work: you have to include the suppression of the IMC as well, which I did not previously. To account for this, we measure the TF from MC2 drive [cts] to IMC_F while the IMC is locked by itself, then again while CARM is locked. This gives us PNG 1, with a higher suppression by a factor of 20.7 for CARM locked vs. IMC alone at around 100 Hz. What this means for our calibration of CARM is we have to multiply the REFL_SERVO_ERR to IMC_F TF by 20.7 to get exactly how much work CARM was doing trying to suppress the MC2 drive. Now, given our transimpedance of 2900 V/W, 2dB sum node gain, and CARM pole of 0.6 Hz, we can calculate the CARM optical gain at DC: (1/3.1e-7 cts/kHz)(40/2**16 V/cts)(1/200 V/V)(1/2dB V/V)(1/2900 W/V) * abs(1+1j*71.1/0.6) ~ 4 mW/Hz CARM optical gain. CARM Error Spectrum To calibrate the CARM error spectrum into incident IFO noise, I divide by the CARM boost (zero 4kHz, pole 40 Hz), sum node gain, and CARM plant that I just calculated. This simply removes the CARM pole from the laser. I also calculated the shot noise for 8.6 mW on the REFL9 PD we see when we are locked at NOMINAL_LOW_NOISE with 22 watts input. Seems like we are sensing noise limited from around 10 Hz to 500 Hz.
I'm sort of confused by the MC2 injection description. I would instead say that the IMC loop makes the laser follow the MC2 motion exactly (since the gain is > 100 for all frequencies we care about). So then we can calibrate the MC2 drive directly into Hz.
To then measure the CARM to DARM coupling, we drive MC2 and measure the TF to the CM board error point. This signal will be MC2/(1 + G_CM). Since we know G_CM exactly from our CM model which was fit to the measurement, we have no need to know about the CARM plant or optical gain.
For the estimating of the CARM noise budget, I think instead of just shot noise, you should include the measured noise with only the PRM aligned. This will then include the scattering noise in REFL in addition to the shot noise.
As a 3rd step, you should drive PRCL and measure CARM. The PRCL noise gets injected into CARM and shows up as an extra sensing noise since we have no PRCLFF->CARM path.
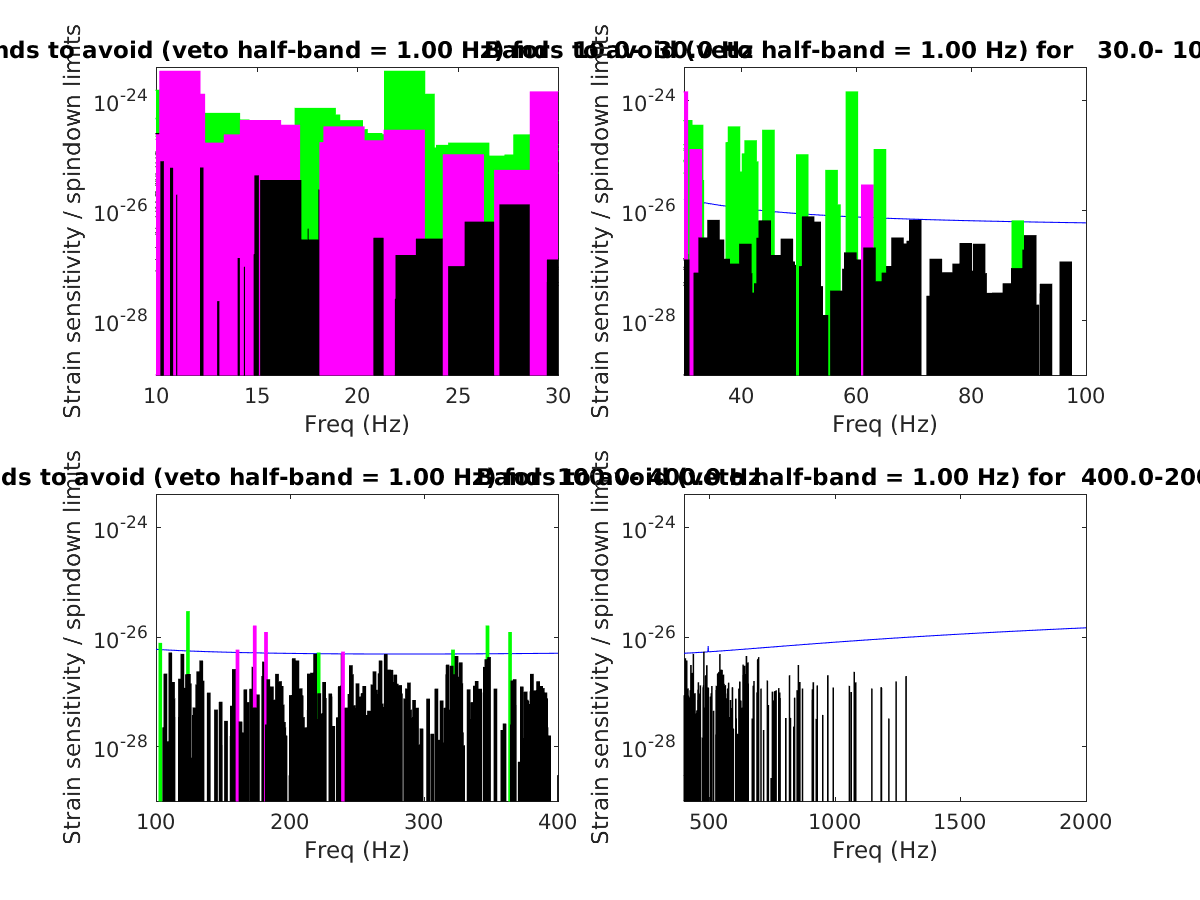
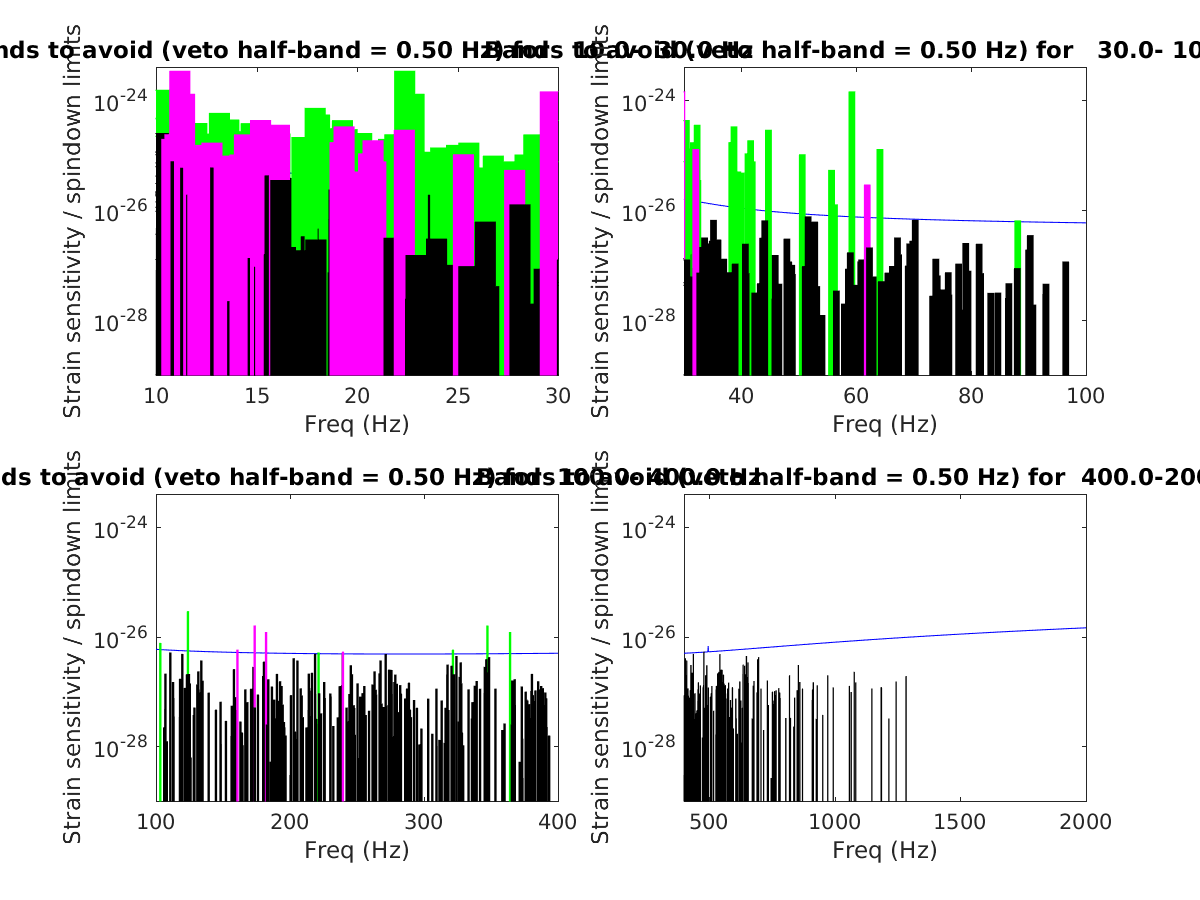
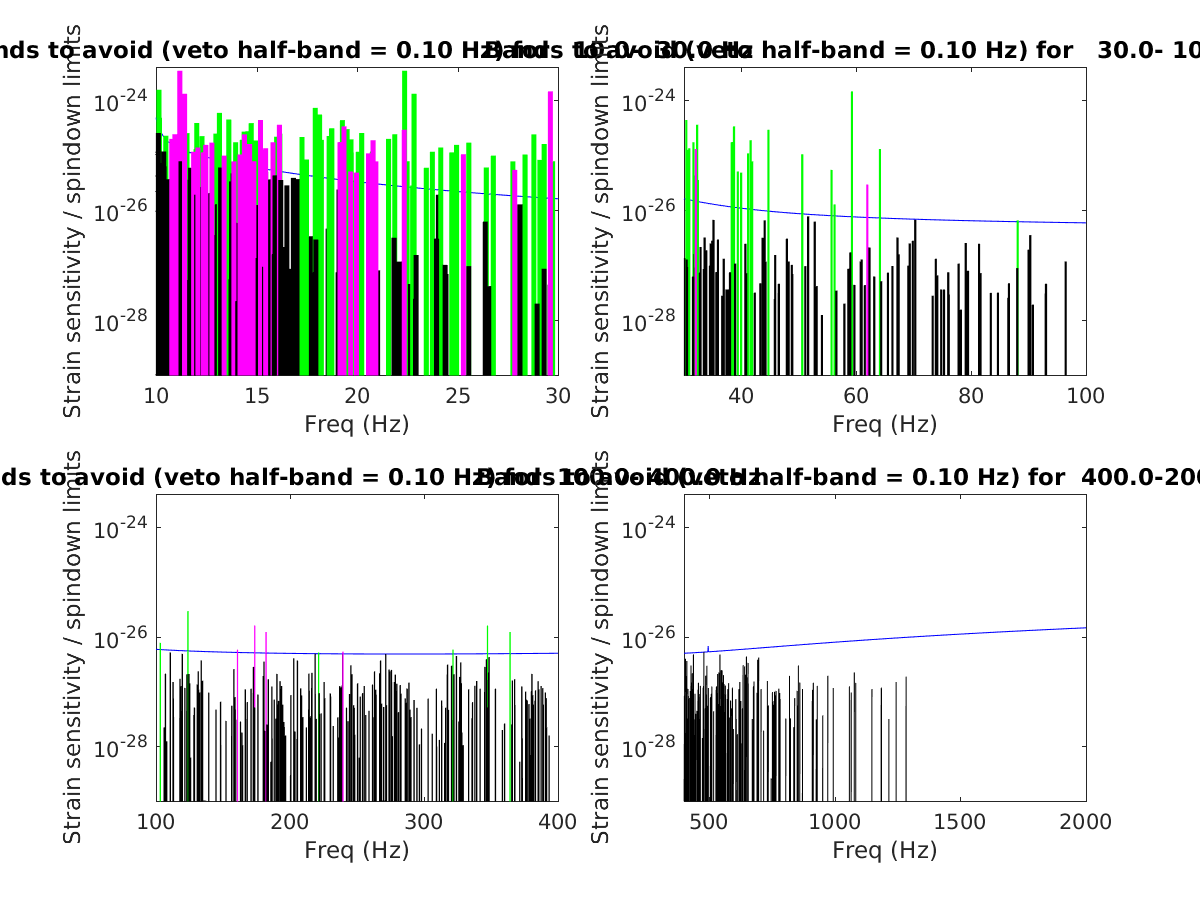
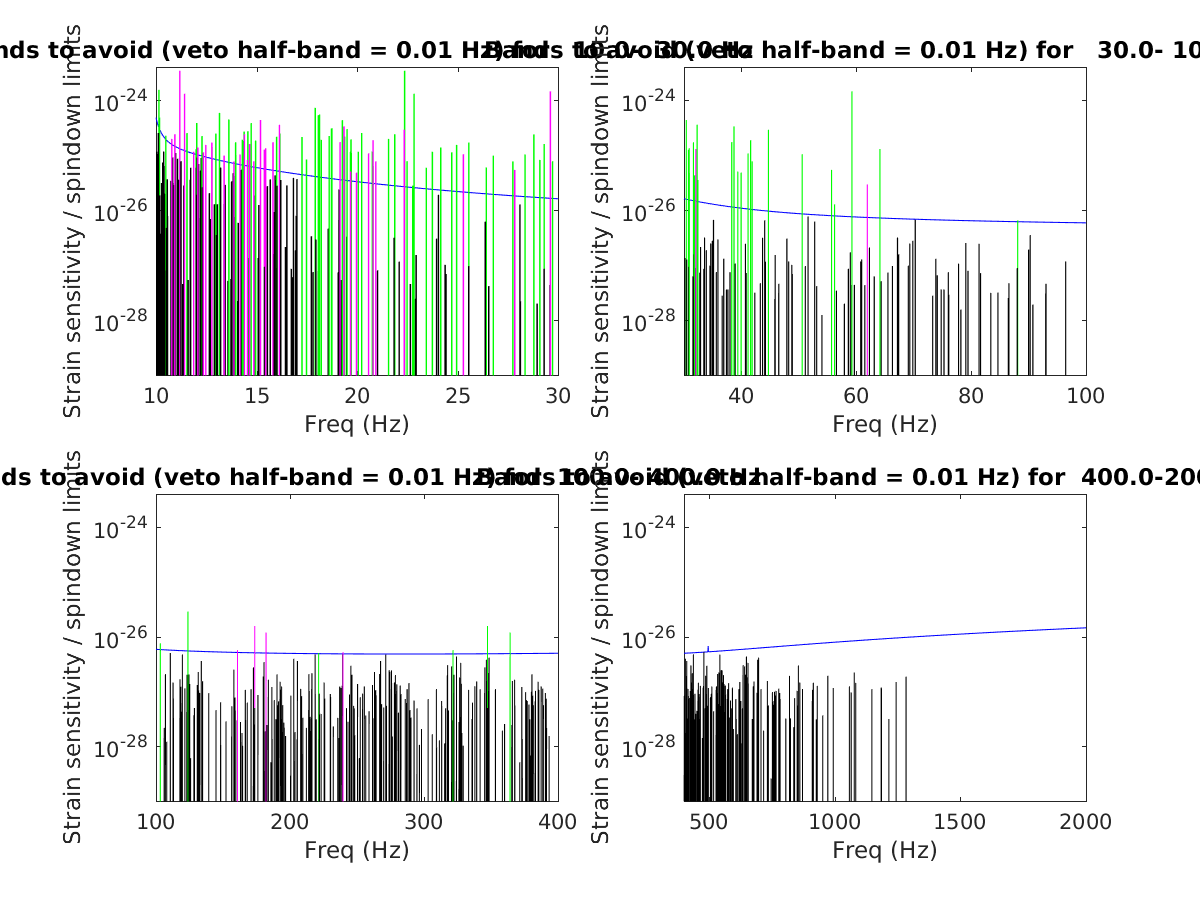
As a follow up to Lilli's analysis (see LHO aLOG 44590) on where to move the calibration lines, I re-ran Keith Riles' analysis from 4 years ago (about time to refresh this analysis!) on where to avoid dithering so as not to detrimentally impact pulsar searches with accessible spindown limits (see LHO aLOG 14836). I downloaded the scripts, made a new ATNF pulsar catalog table (see this link), and used an aLIGO design sensitivity curve as needed by Keith's script (from T1800044). To summarize the differences between Keith's analysis and mine: 1) I use an updated ATNF pulsar catalog file 2) I use an updated aLIGO noise curve 3) Changed the reference Julian date to Jan. 1, 2019 --> MJD=58484 Comparing the Oct. 2014 (left columns) with Oct. 2018 (right columns): Non-vetoed bands for veto half-band = 1.000000 (one or two times pulsar frequency) 33.42- 37.32 Hz ( 3.91 Hz) 33.42- 37.31 Hz ( 3.90 Hz) 42.88- 49.58 Hz ( 6.71 Hz) 42.88- 43.70 Hz ( 0.83 Hz) 45.71- 49.58 Hz ( 3.88 Hz) 51.59- 54.69 Hz ( 3.11 Hz) 51.59- 54.69 Hz ( 3.11 Hz) 57.22- 58.30 Hz ( 1.09 Hz) 57.22- 58.23 Hz ( 1.02 Hz) 60.31- 60.93 Hz ( 0.63 Hz) 60.24- 60.91 Hz ( 0.68 Hz) 62.94- 63.12 Hz ( 0.19 Hz) 62.92- 63.11 Hz ( 0.20 Hz) 65.13- 81.32 Hz ( 16.20 Hz) 65.12- 87.10 Hz ( 21.99 Hz) 83.33- 87.10 Hz ( 3.78 Hz) 89.11- 122.87 Hz ( 33.77 Hz) 89.11- 102.21 Hz ( 13.11 Hz) 104.22- 122.83 Hz ( 18.62 Hz) 124.88- 159.80 Hz ( 34.93 Hz) 124.84- 159.80 Hz ( 34.97 Hz) 161.81- 172.68 Hz ( 10.88 Hz) 161.81- 172.68 Hz ( 10.88 Hz) 174.69- 201.79 Hz ( 27.11 Hz) 174.69- 181.11 Hz ( 6.43 Hz) 183.12- 220.35 Hz ( 37.24 Hz) 203.80- 320.61 Hz ( 116.82 Hz) 222.36- 238.51 Hz ( 16.16 Hz) 240.52- 320.61 Hz ( 80.10 Hz) 322.62- 346.37 Hz ( 23.76 Hz) 322.62- 346.37 Hz ( 23.76 Hz) 348.38-2000.00 Hz (1651.63 Hz) 348.38- 363.23 Hz ( 14.86 Hz) 365.24-2000.00 Hz (1634.77 Hz) where blank lines exist, the script did not output a corresponding line for the given pulsar catalog with 4 years difference. I'll summarize Keith to say that the above is rather conservative, to stay 1 Hz away from known pulsars with accessible spindown limits when searching at both 1f and 2f. Observe that it's impossible to find a frequency band below 33.4 Hz under these considerations. If we instead focus on 2f searches, again comparing Oct. 2014 with Oct. 2018: Non-vetoed bands for veto half-band = 1.000000 (two times pulsar frequency) 33.42- 37.32 Hz ( 3.91 Hz) 33.42- 37.31 Hz ( 3.90 Hz) 42.88- 49.58 Hz ( 6.71 Hz) 42.88- 43.70 Hz ( 0.83 Hz) 45.71- 49.58 Hz ( 3.88 Hz) 51.59- 54.69 Hz ( 3.11 Hz) 51.59- 54.69 Hz ( 3.11 Hz) 57.22- 58.30 Hz ( 1.09 Hz) 57.22- 58.23 Hz ( 1.02 Hz) 60.31- 63.12 Hz ( 2.82 Hz) 60.24- 63.11 Hz ( 2.88 Hz) 65.13- 81.32 Hz ( 16.20 Hz) 65.12- 87.10 Hz ( 21.99 Hz) 83.33- 87.10 Hz ( 3.78 Hz) 89.11- 122.87 Hz ( 33.77 Hz) 89.11- 102.21 Hz ( 13.11 Hz) 104.22- 122.83 Hz ( 18.62 Hz) 124.88- 320.61 Hz ( 195.74 Hz) 124.84- 220.35 Hz ( 95.52 Hz) 222.36- 320.61 Hz ( 98.26 Hz) 322.62- 346.37 Hz ( 23.76 Hz) 322.62- 346.37 Hz ( 23.76 Hz) 348.38-2000.00 Hz (1651.63 Hz) 348.38- 363.23 Hz ( 14.86 Hz) 365.24-2000.00 Hz (1634.77 Hz) If we are less restrictive on the band vetoed, allowing for 0.5 Hz rather than 1.0 Hz: Non-vetoed bands for veto half-band = 0.500000 (two times pulsar frequency) 10.99- 11.04 Hz ( 0.06 Hz) 15.46- 15.50 Hz ( 0.05 Hz) 16.67- 16.76 Hz ( 0.10 Hz) 32.92- 37.81 Hz ( 4.90 Hz) 40.45- 40.65 Hz ( 0.21 Hz) 42.38- 44.20 Hz ( 1.83 Hz) 45.21- 50.08 Hz ( 4.88 Hz) 51.09- 55.19 Hz ( 4.11 Hz) 56.72- 58.73 Hz ( 2.02 Hz) 59.74- 63.61 Hz ( 3.88 Hz) 64.62- 87.60 Hz ( 22.99 Hz) 88.61- 102.71 Hz ( 14.11 Hz) 103.72- 123.33 Hz ( 19.62 Hz) 124.34- 220.85 Hz ( 96.52 Hz) 221.86- 321.11 Hz ( 99.26 Hz) 322.12- 346.87 Hz ( 24.76 Hz) 347.88- 363.73 Hz ( 15.86 Hz) 364.74-2000.00 Hz (1635.27 Hz) Attached are the plot outputs for each of veto bands 1.0, 0.5, 0.1, and 0.01 Hz and text files for pulsars with spindown limits and non-vetoed bands. The plotted magenta bands mark pulsars with an accessible 1*F spindown limit, green bands mark pulsars with an accessible 2*F spindown limit, and black bands mark pulsars where a 1*F or 2*F spindown limit is not accessible. The blue curve shows the 1-year 2-IFO sensitivity for the zero-detuned, high-power configuration. Suggestions for calibration line frequencies were (from LHO aLOG 44590): LLO - Stay with the current choices - 15.7 Hz, 16.3 Hz, 16.9 Hz, and add one more 18.1 Hz (notes: 16.9 is not a prime divided by 10; 18.1 is closer than 0.1 Hz to a known pulsar with accessible spindown) LHO - 15.5 Hz, 16.7 Hz, 18.3 Hz, 18.9 Hz (notes: 15.5, 18.3, and 18.9 are not a prime divided by 10; 18.3 is closer than 0.1 Hz to a known pulsar with accessible spindown) Suggested modifications based on this analysis and choosing primes divided by 10: LLO - 15.7 Hz, 16.3 Hz, 17.3 Hz, and 18.1 Hz (unless this causes issues for the CW group) LHO - 15.1 Hz, 16.7 Hz, 17.9 Hz, and 19.1 Hz (unless this causes issues for the CW group) Bottom line: When the suspension actuator calibration lines are moved to lower frequencies (< 20 Hz), then we will be within 1.0 Hz of an accessible pulsar, but further than 0.1 Hz except for suggested 17.3 Hz, 17.9 Hz, and 18.1 Hz calibration lines.
For the higher frequency Pcal line, I suggest we use prime values divided by 10 rather than what was suggested previously. This means H1: 433.7 Hz and L1: 434.9 Hz
I updated the control filters in CAL_SUM_PRCL, CAL_SUM_SRCL and CAL_SUM_BS to match what is now used in the suspension models.
Changes have been accepted into the SDF.
I also updated the optical gains in the error signal calibration. Differences were small (within 20-30%)
The M1 calibration path for PRCL is limited by numerical noise, which appears as a spurious increase of the high frequency noise floor in the calibrated PRCL signal.
To prevent this, I switched off the M1 paths in PRCL, SRCL and MICH. This means that the low frequency calibration might be a bit wrong (what low frequency means depends on the cross-over frequency between M3/M2 and M1)
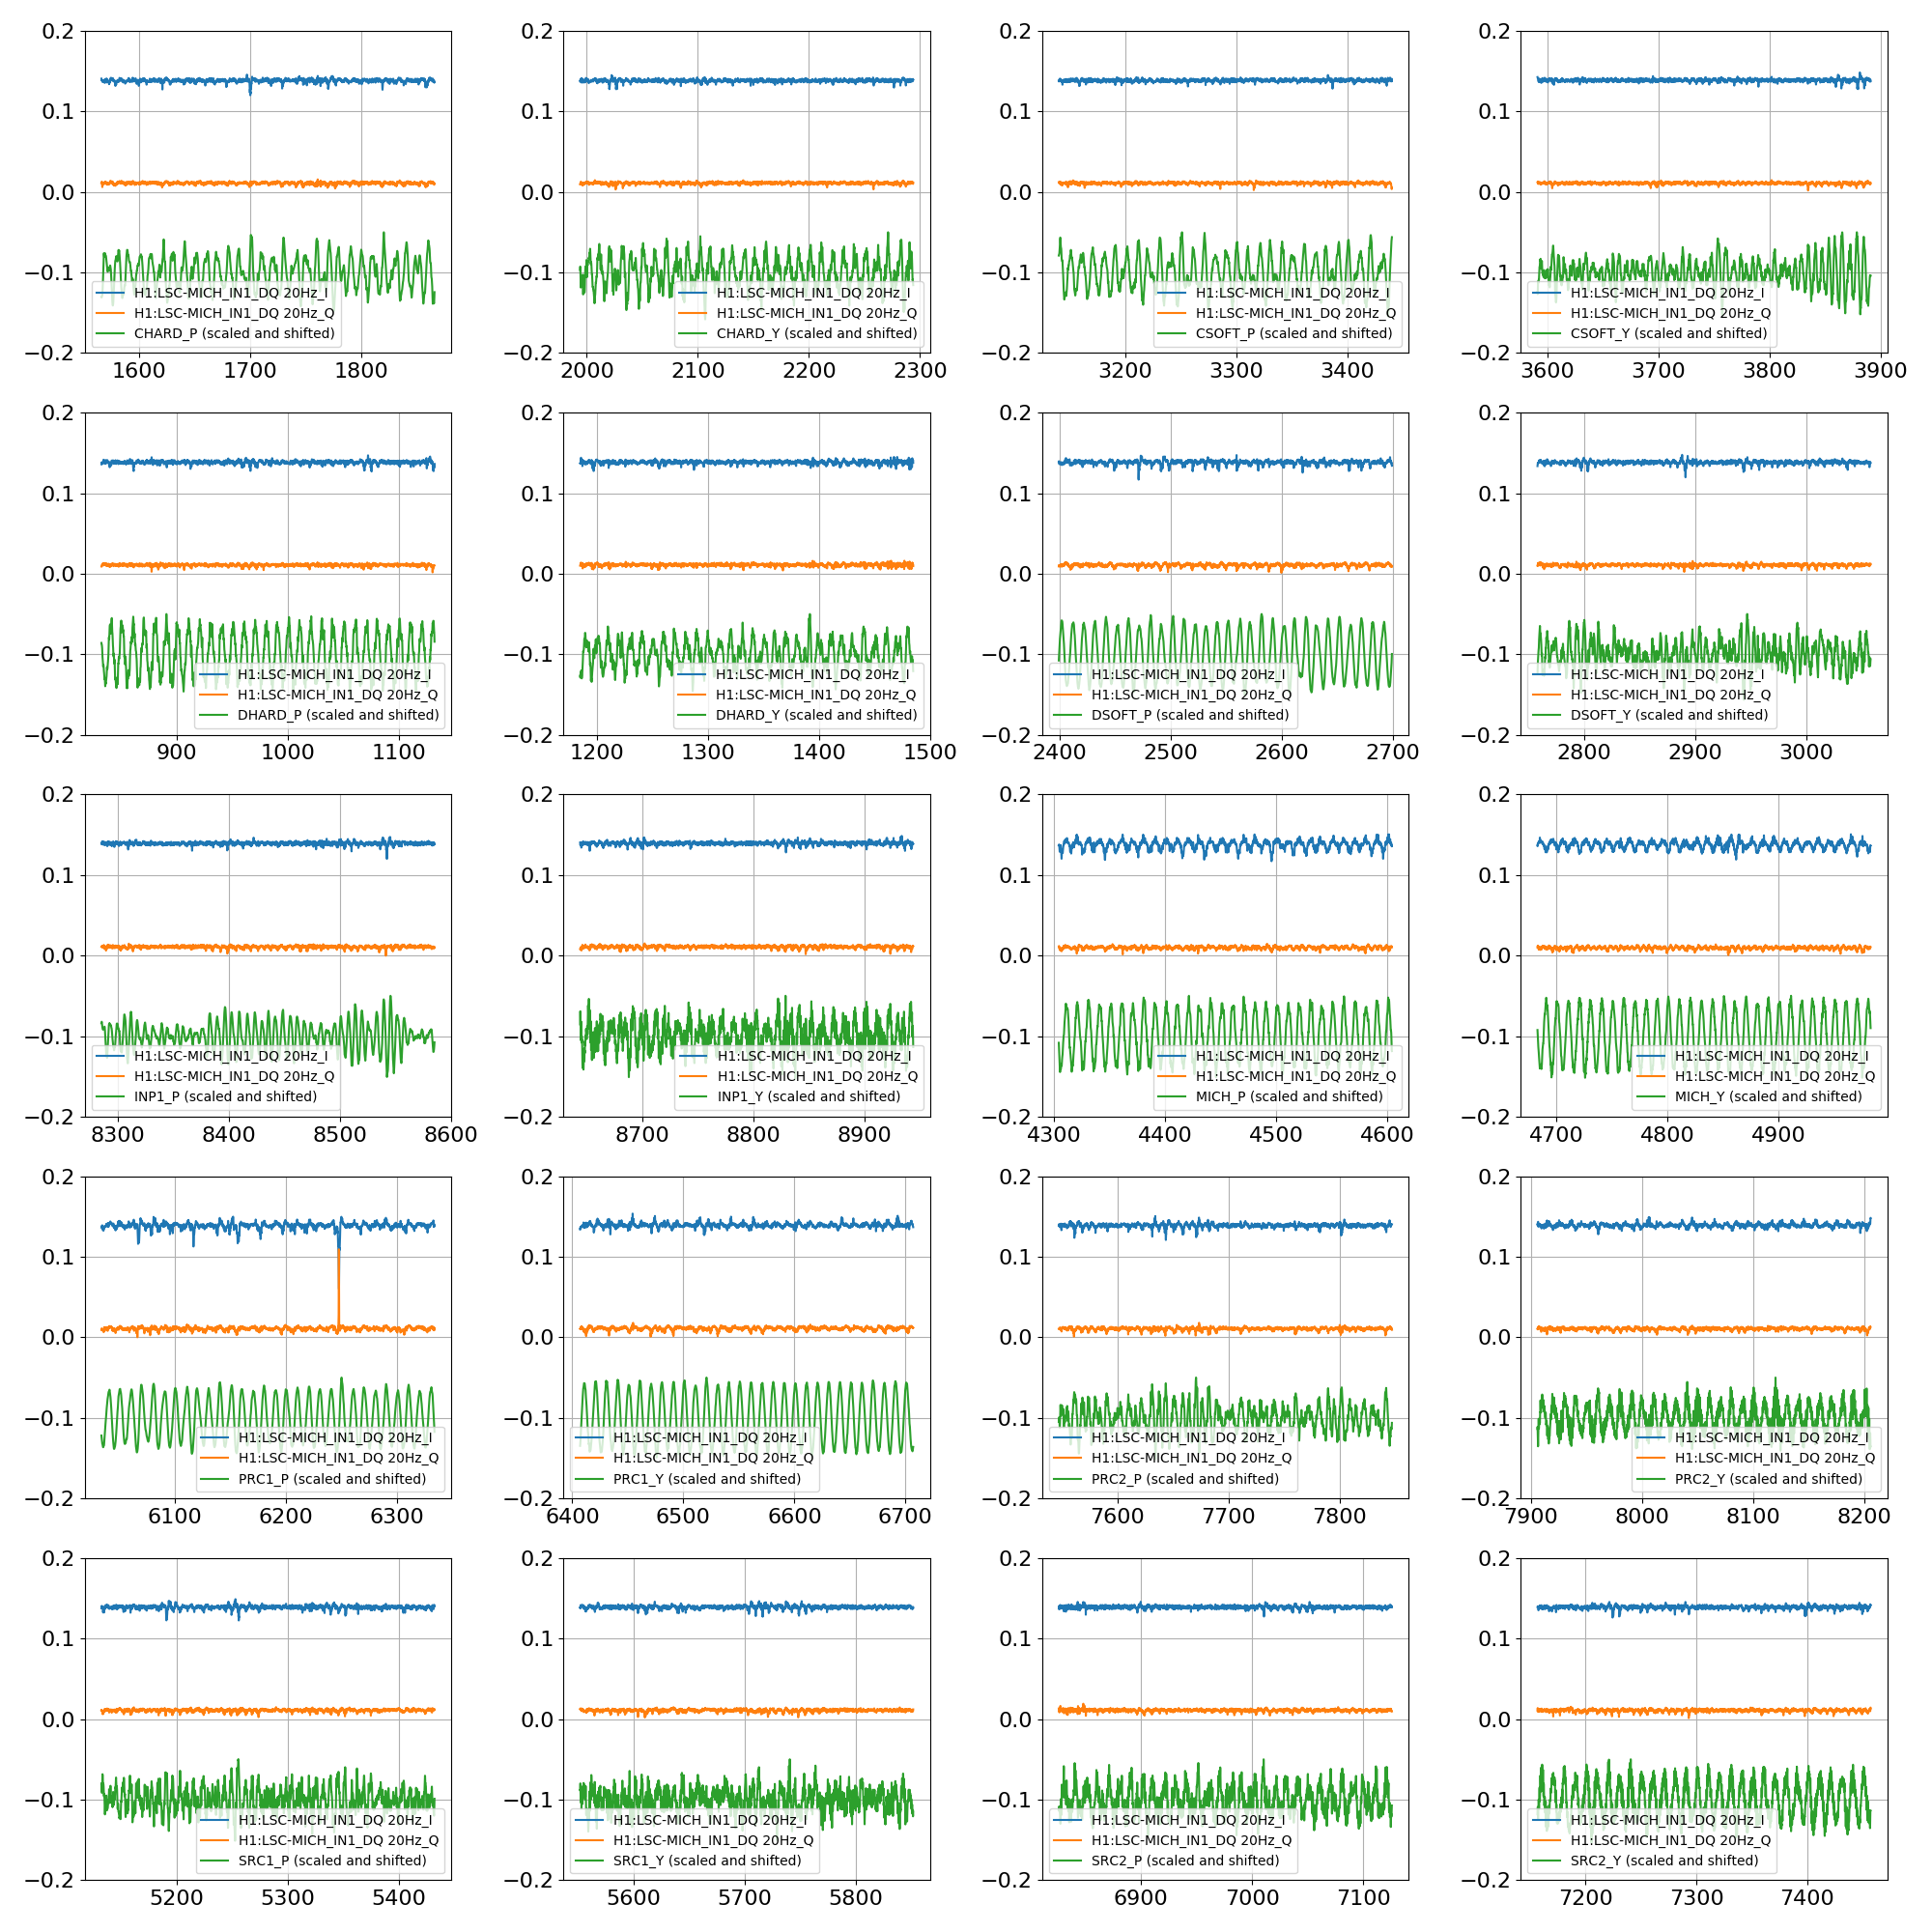
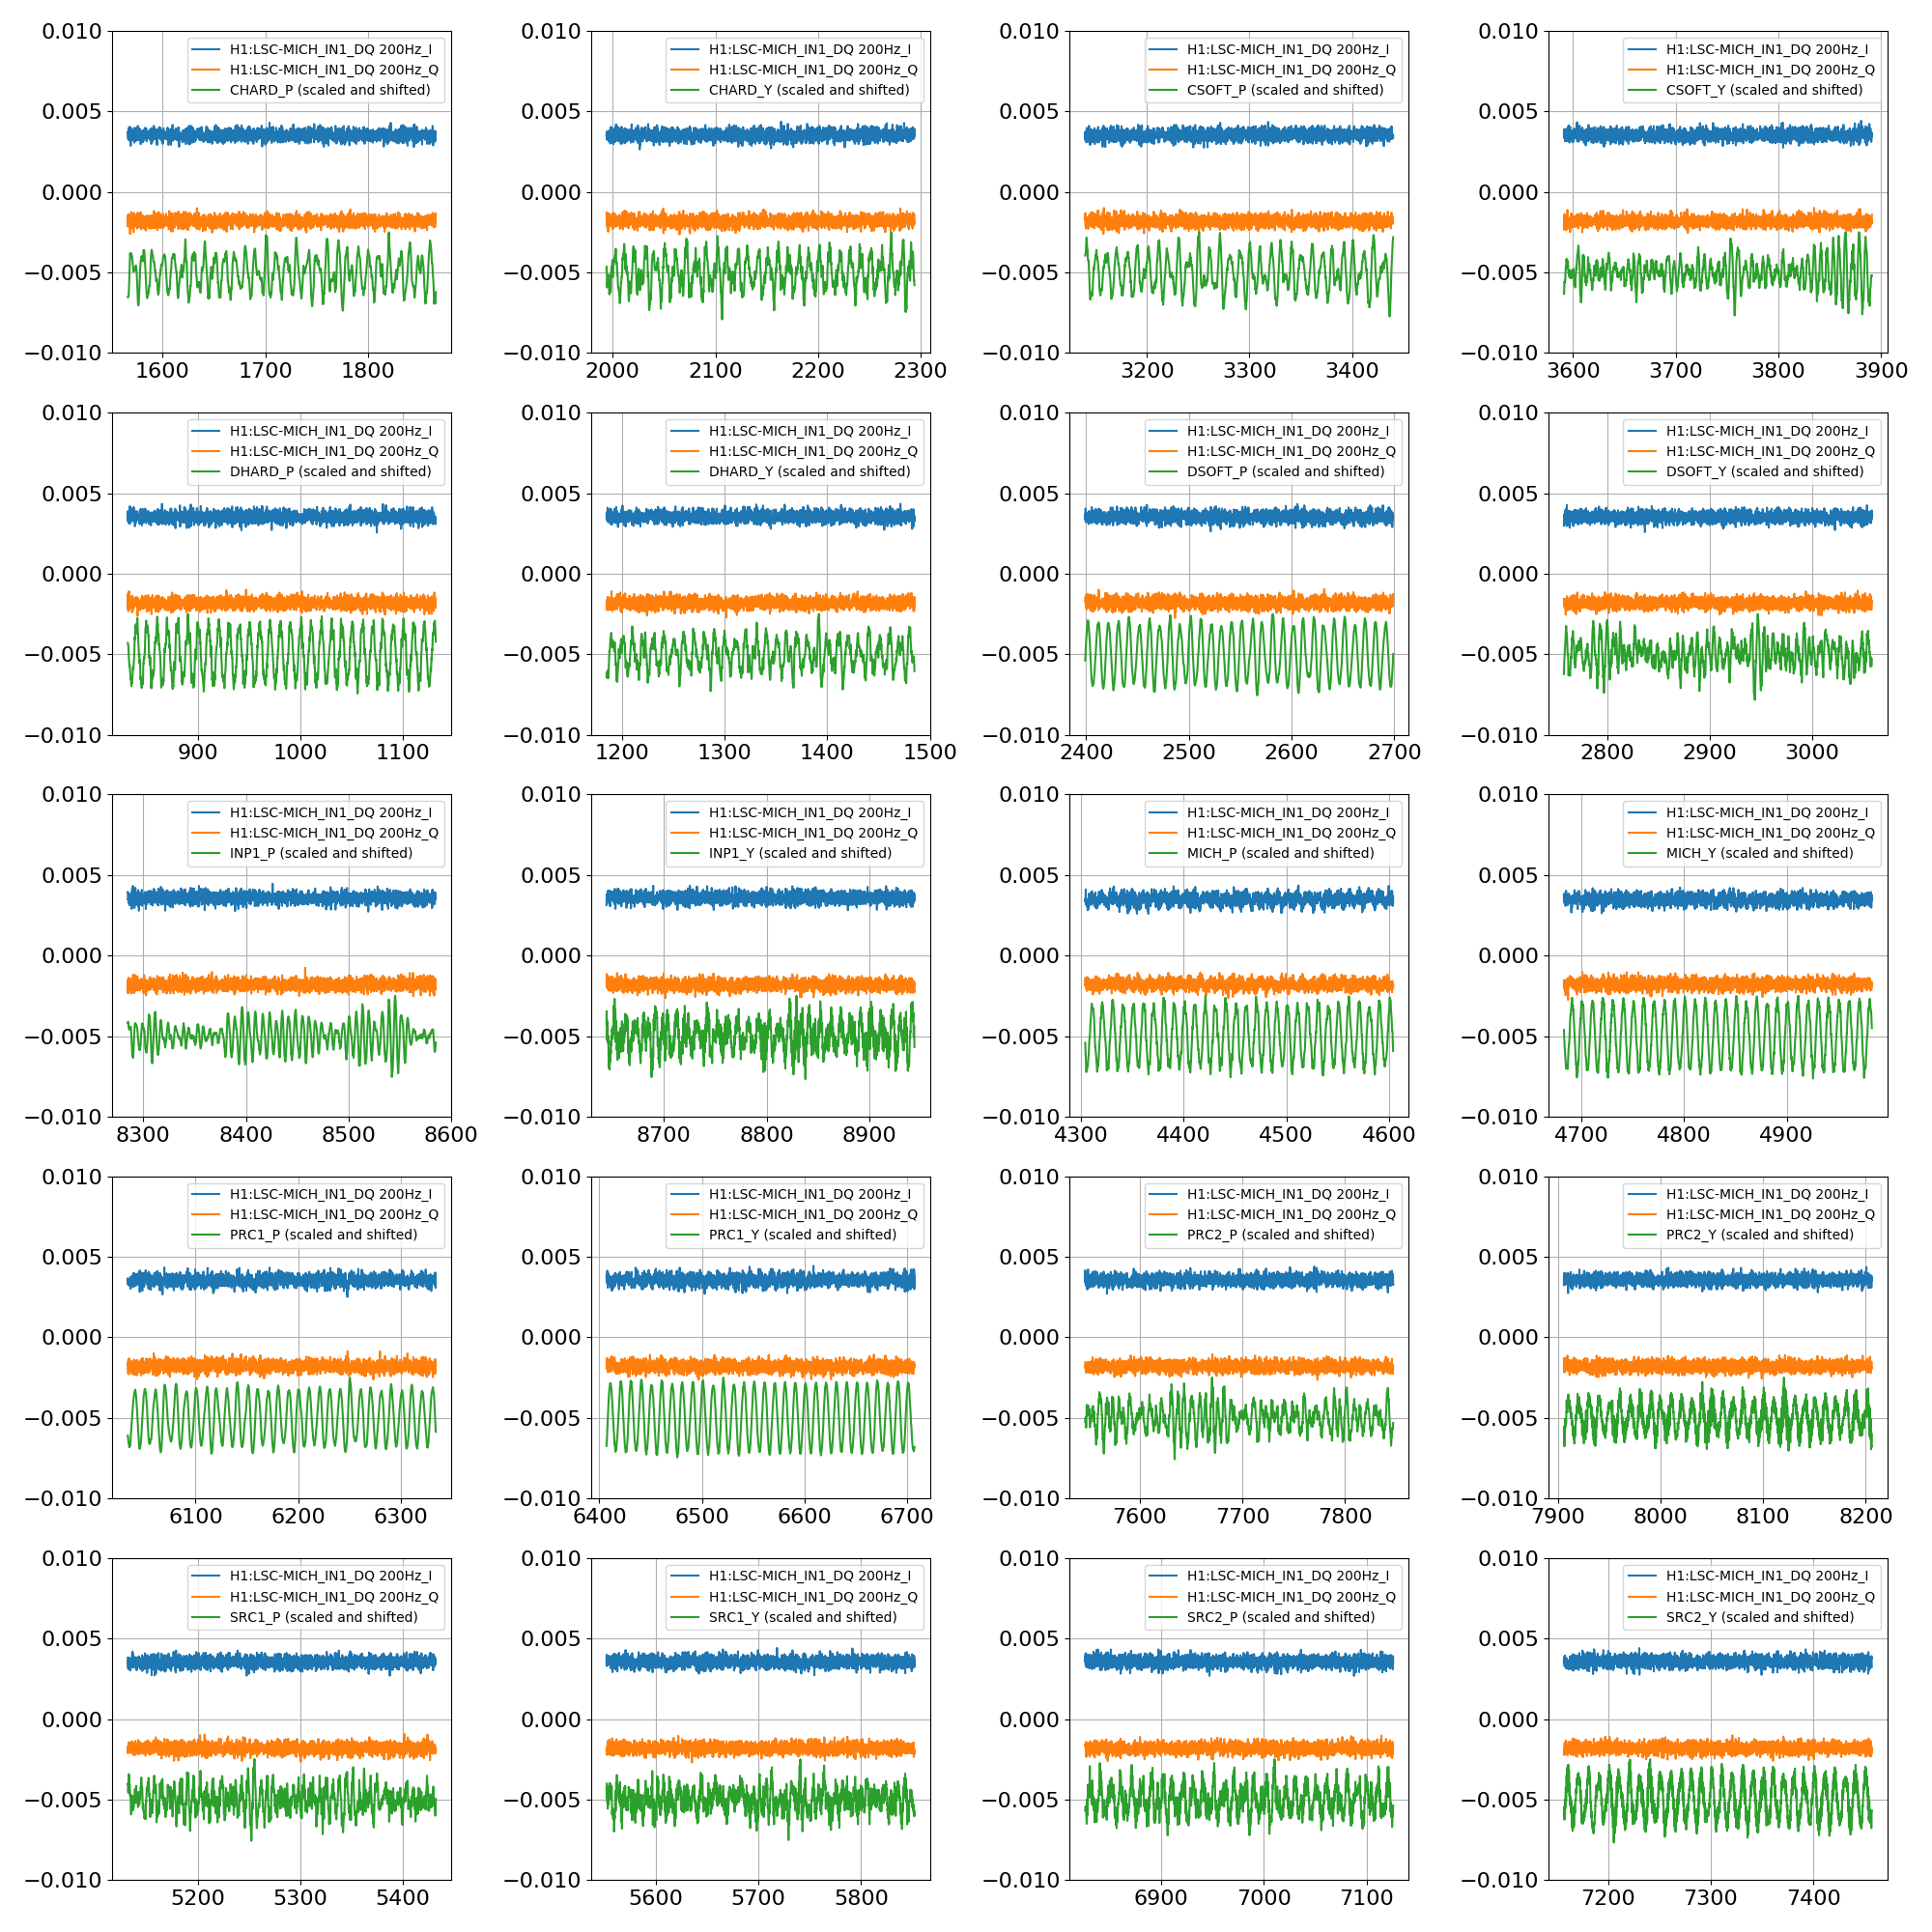
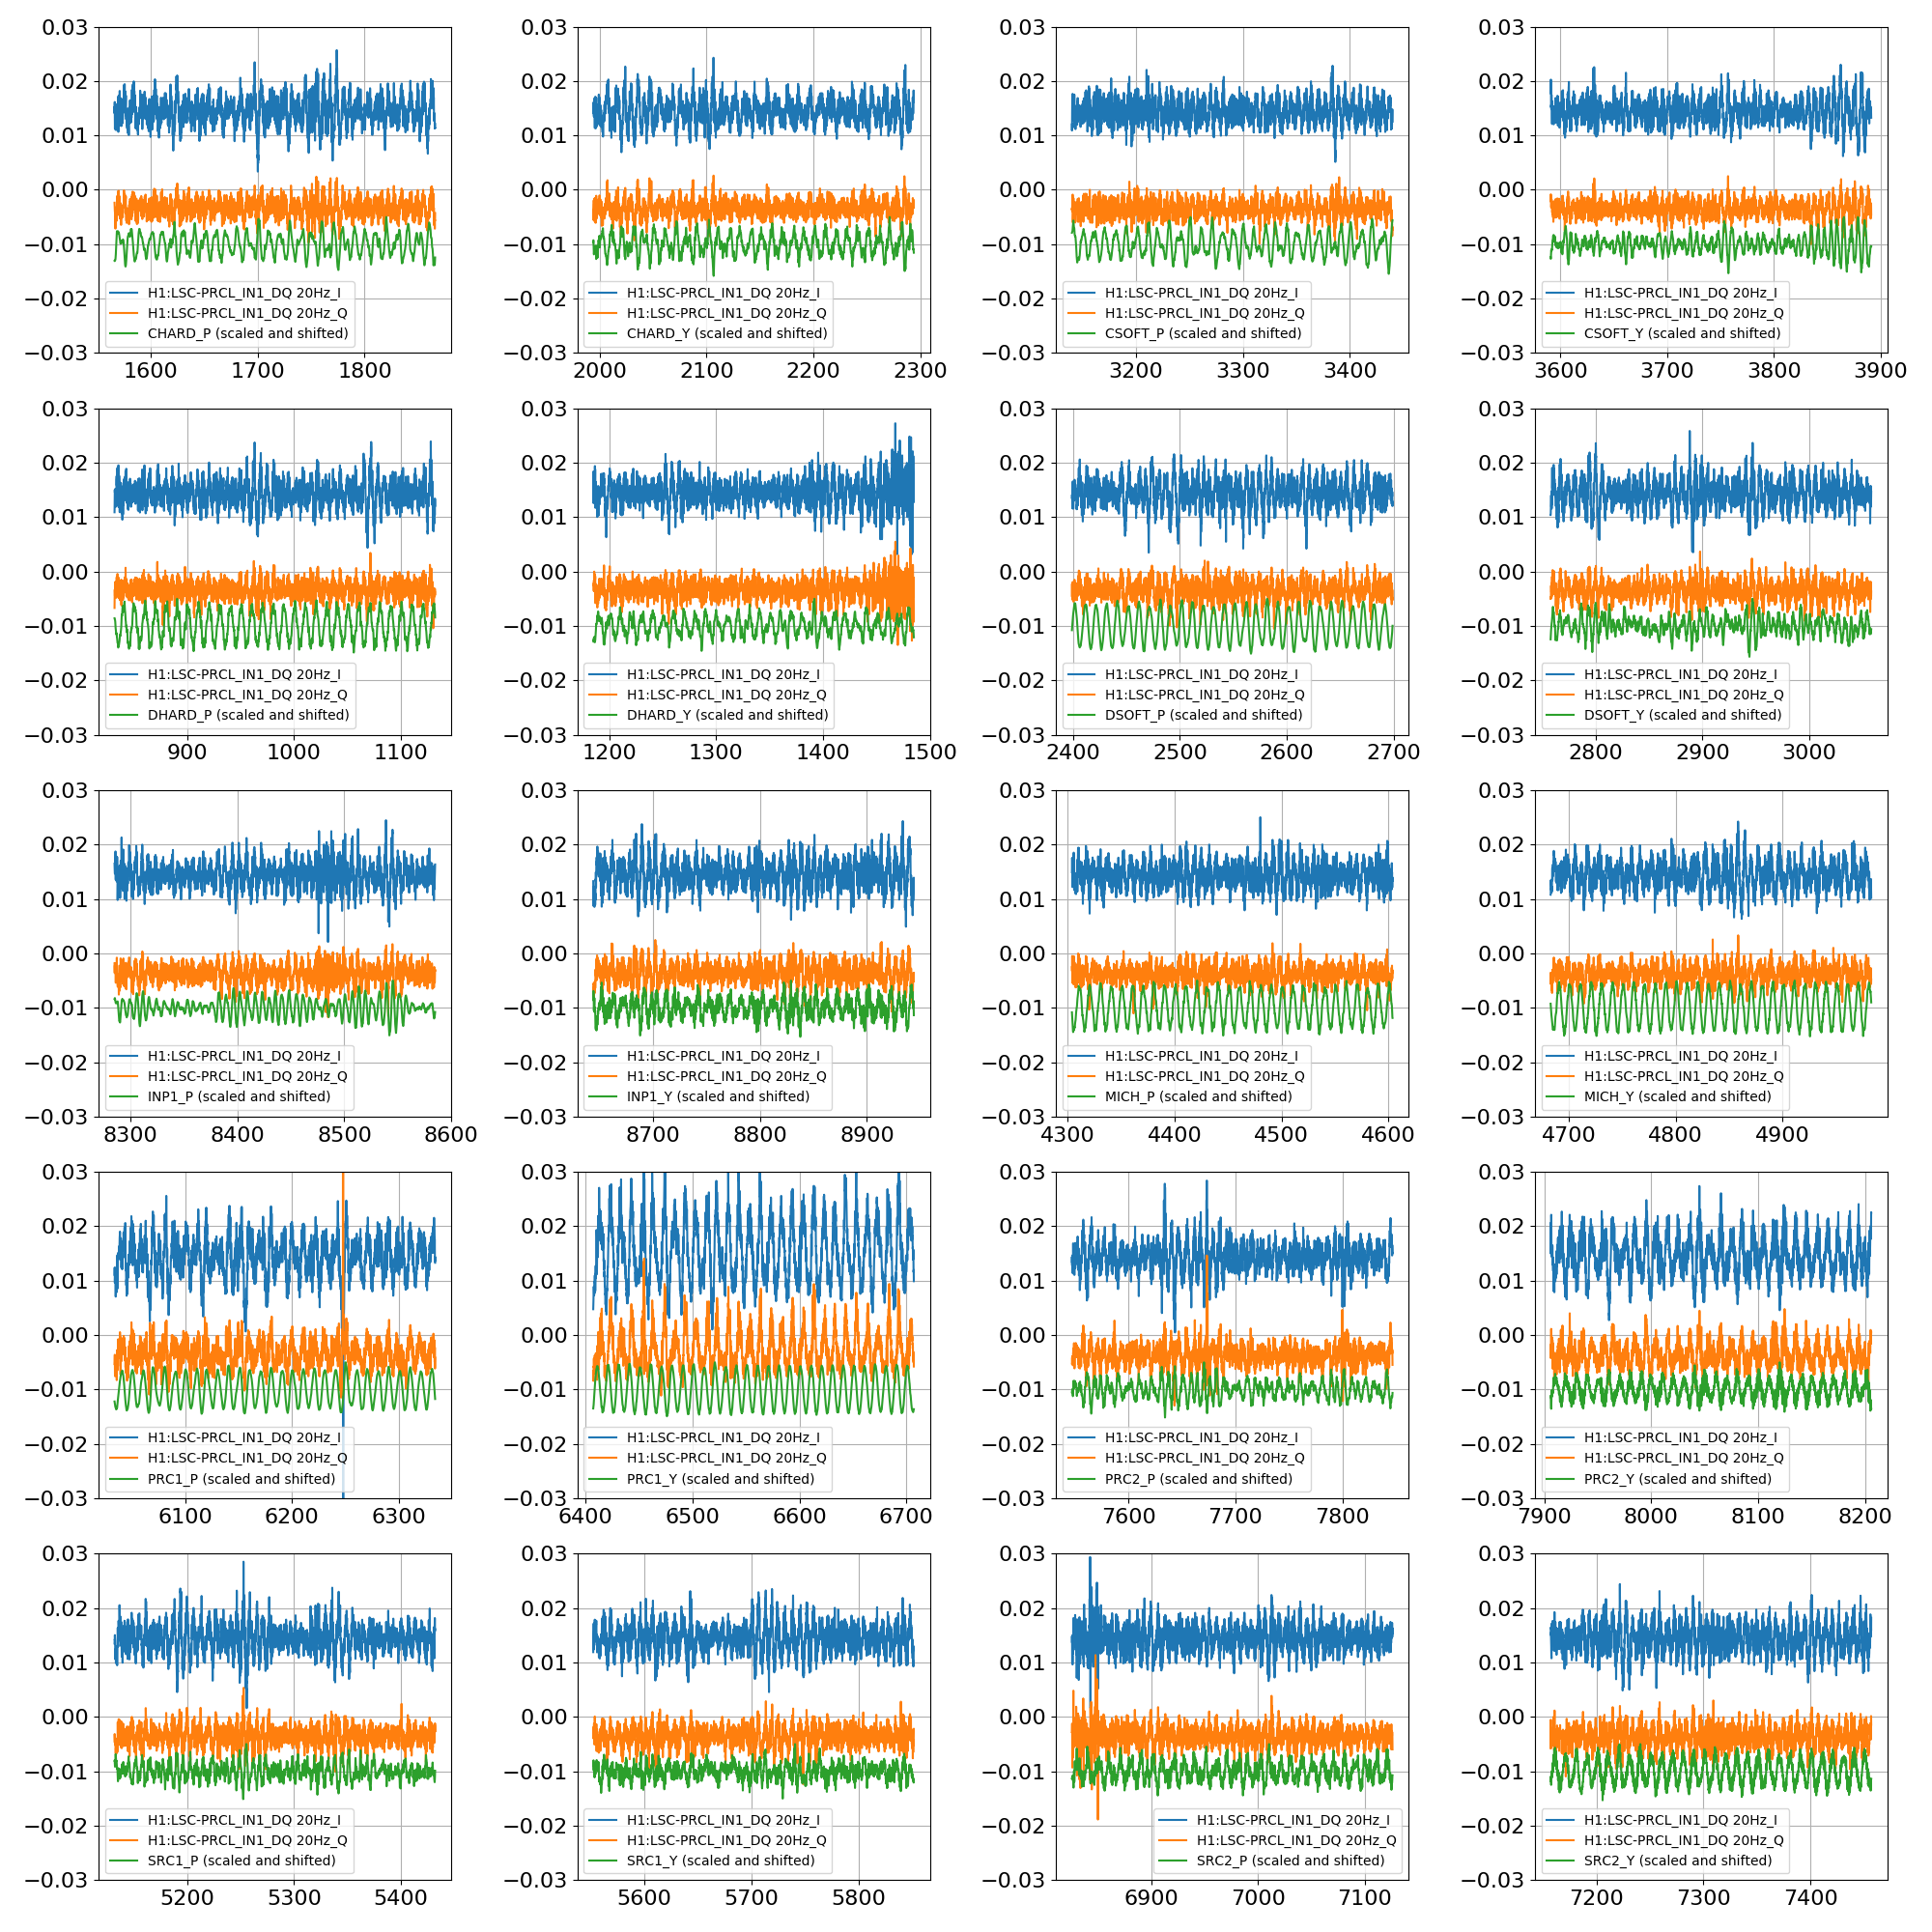
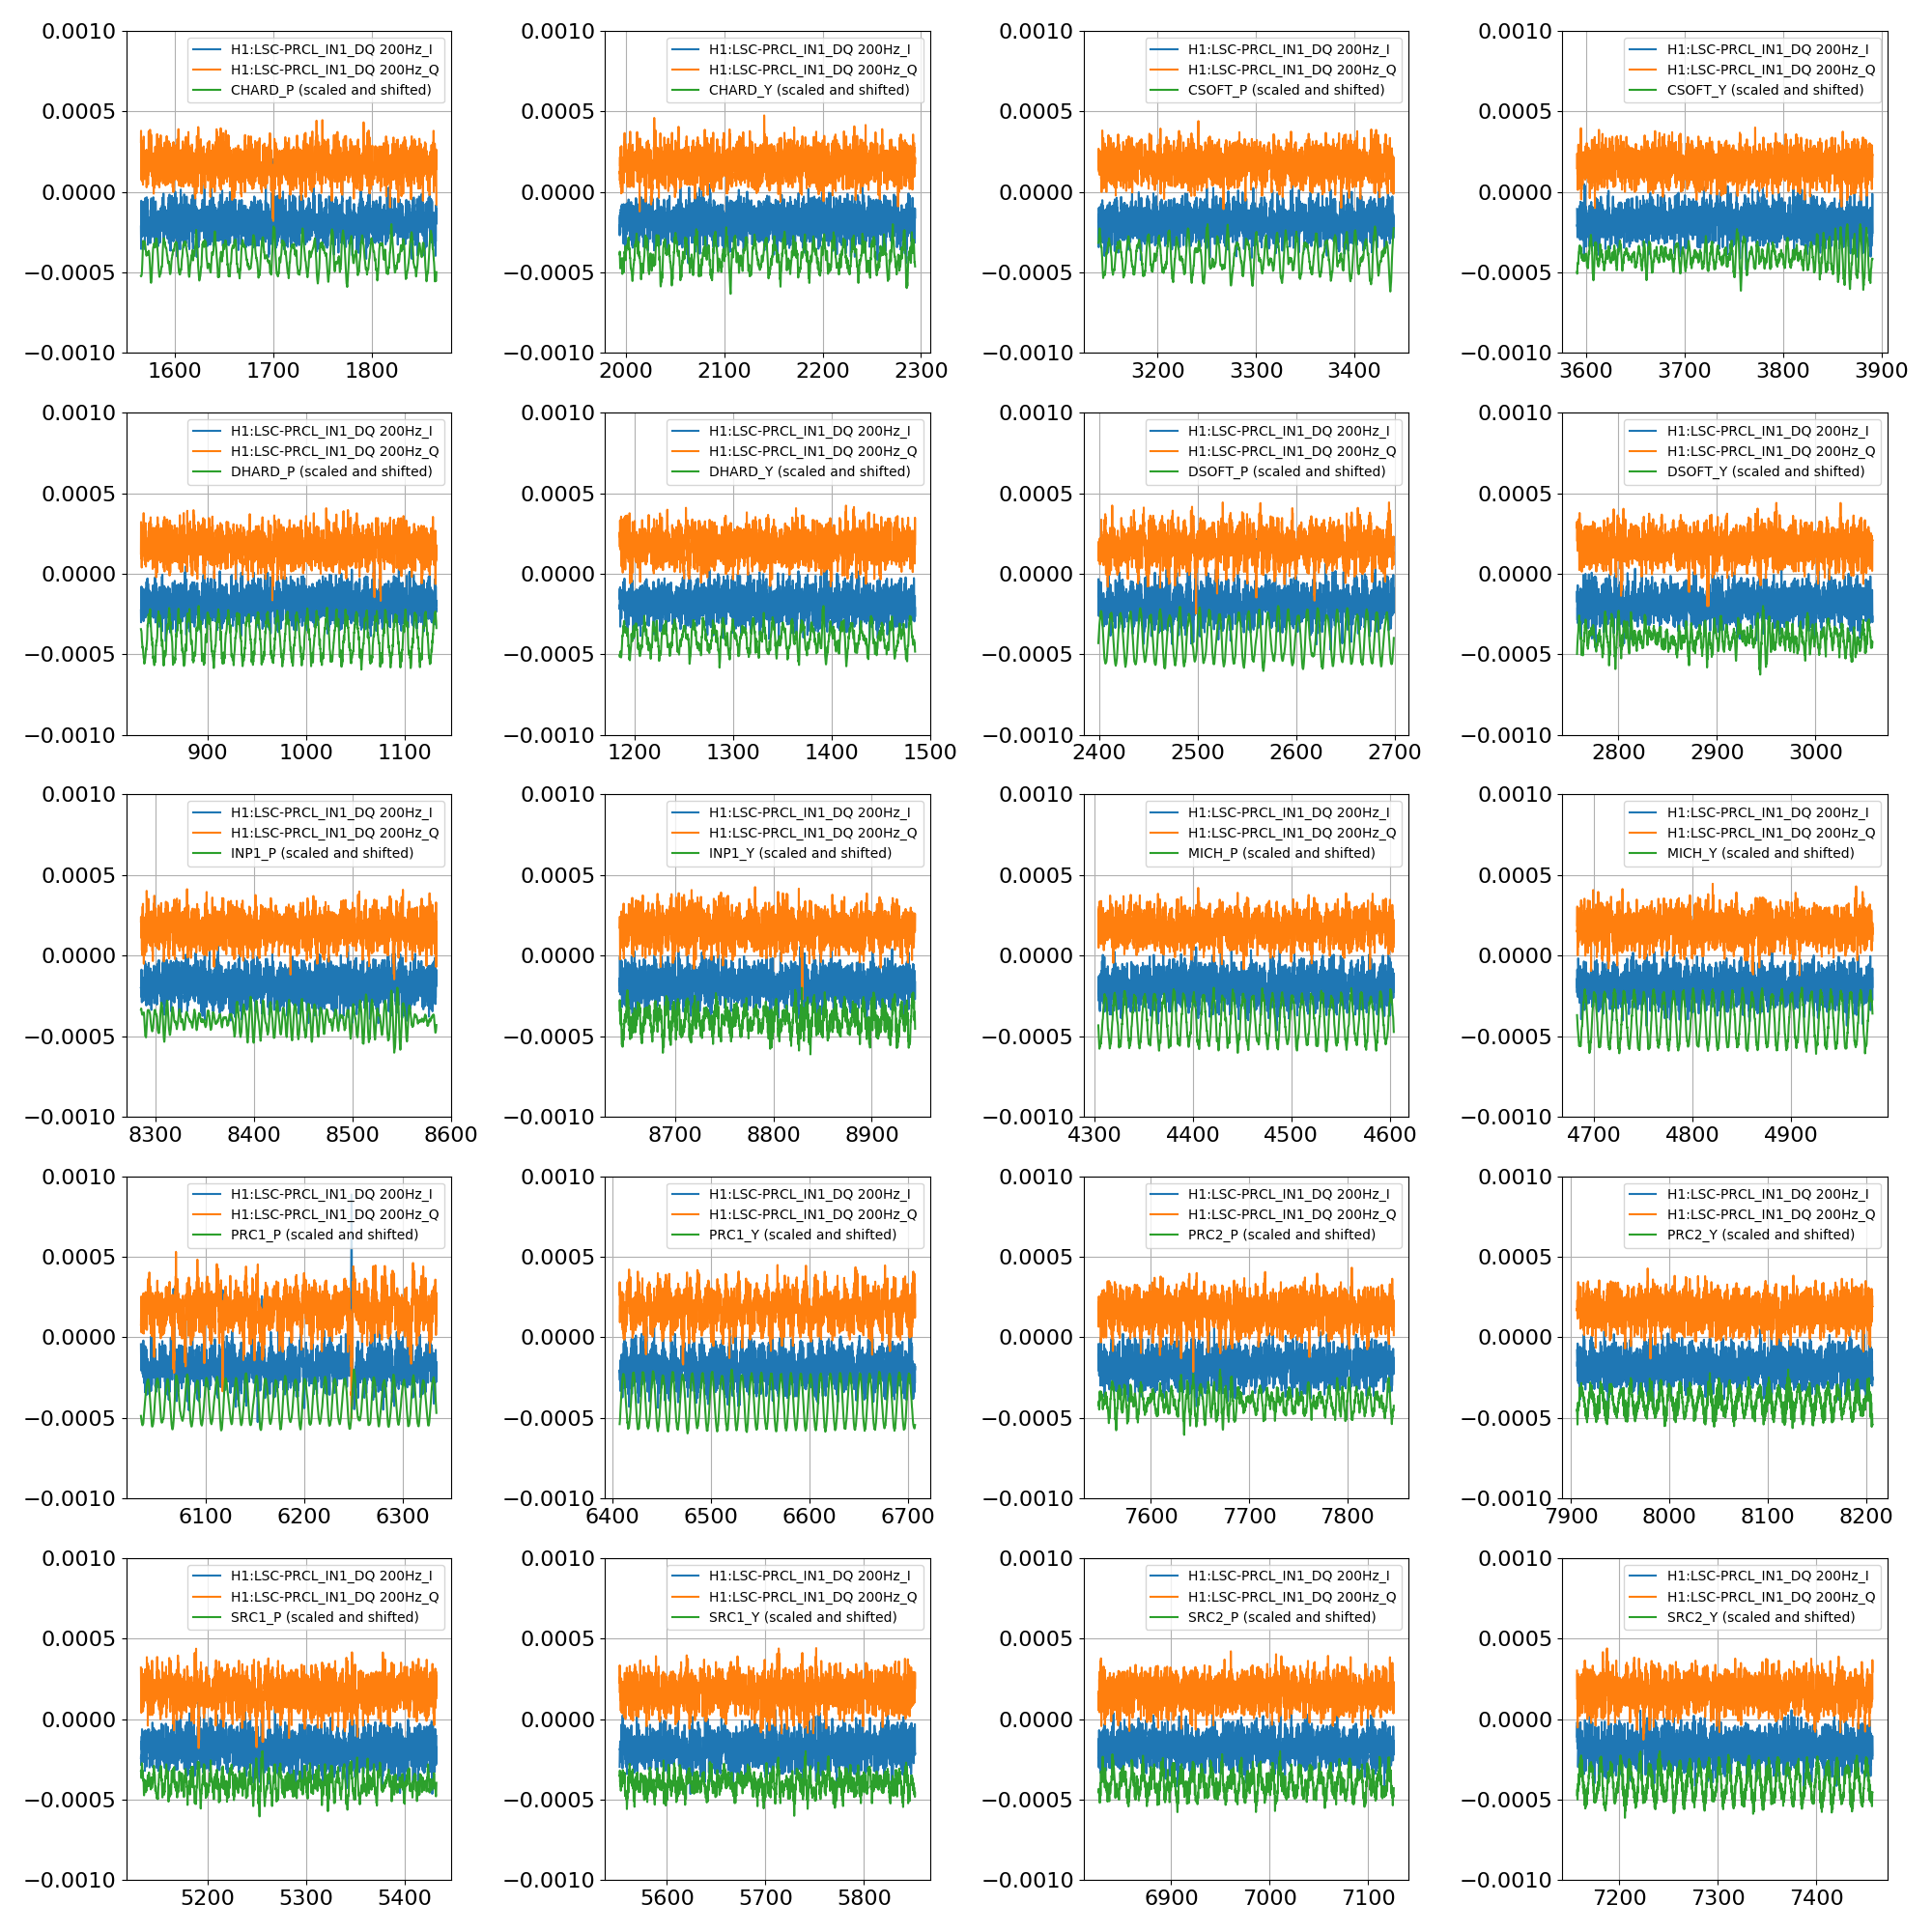
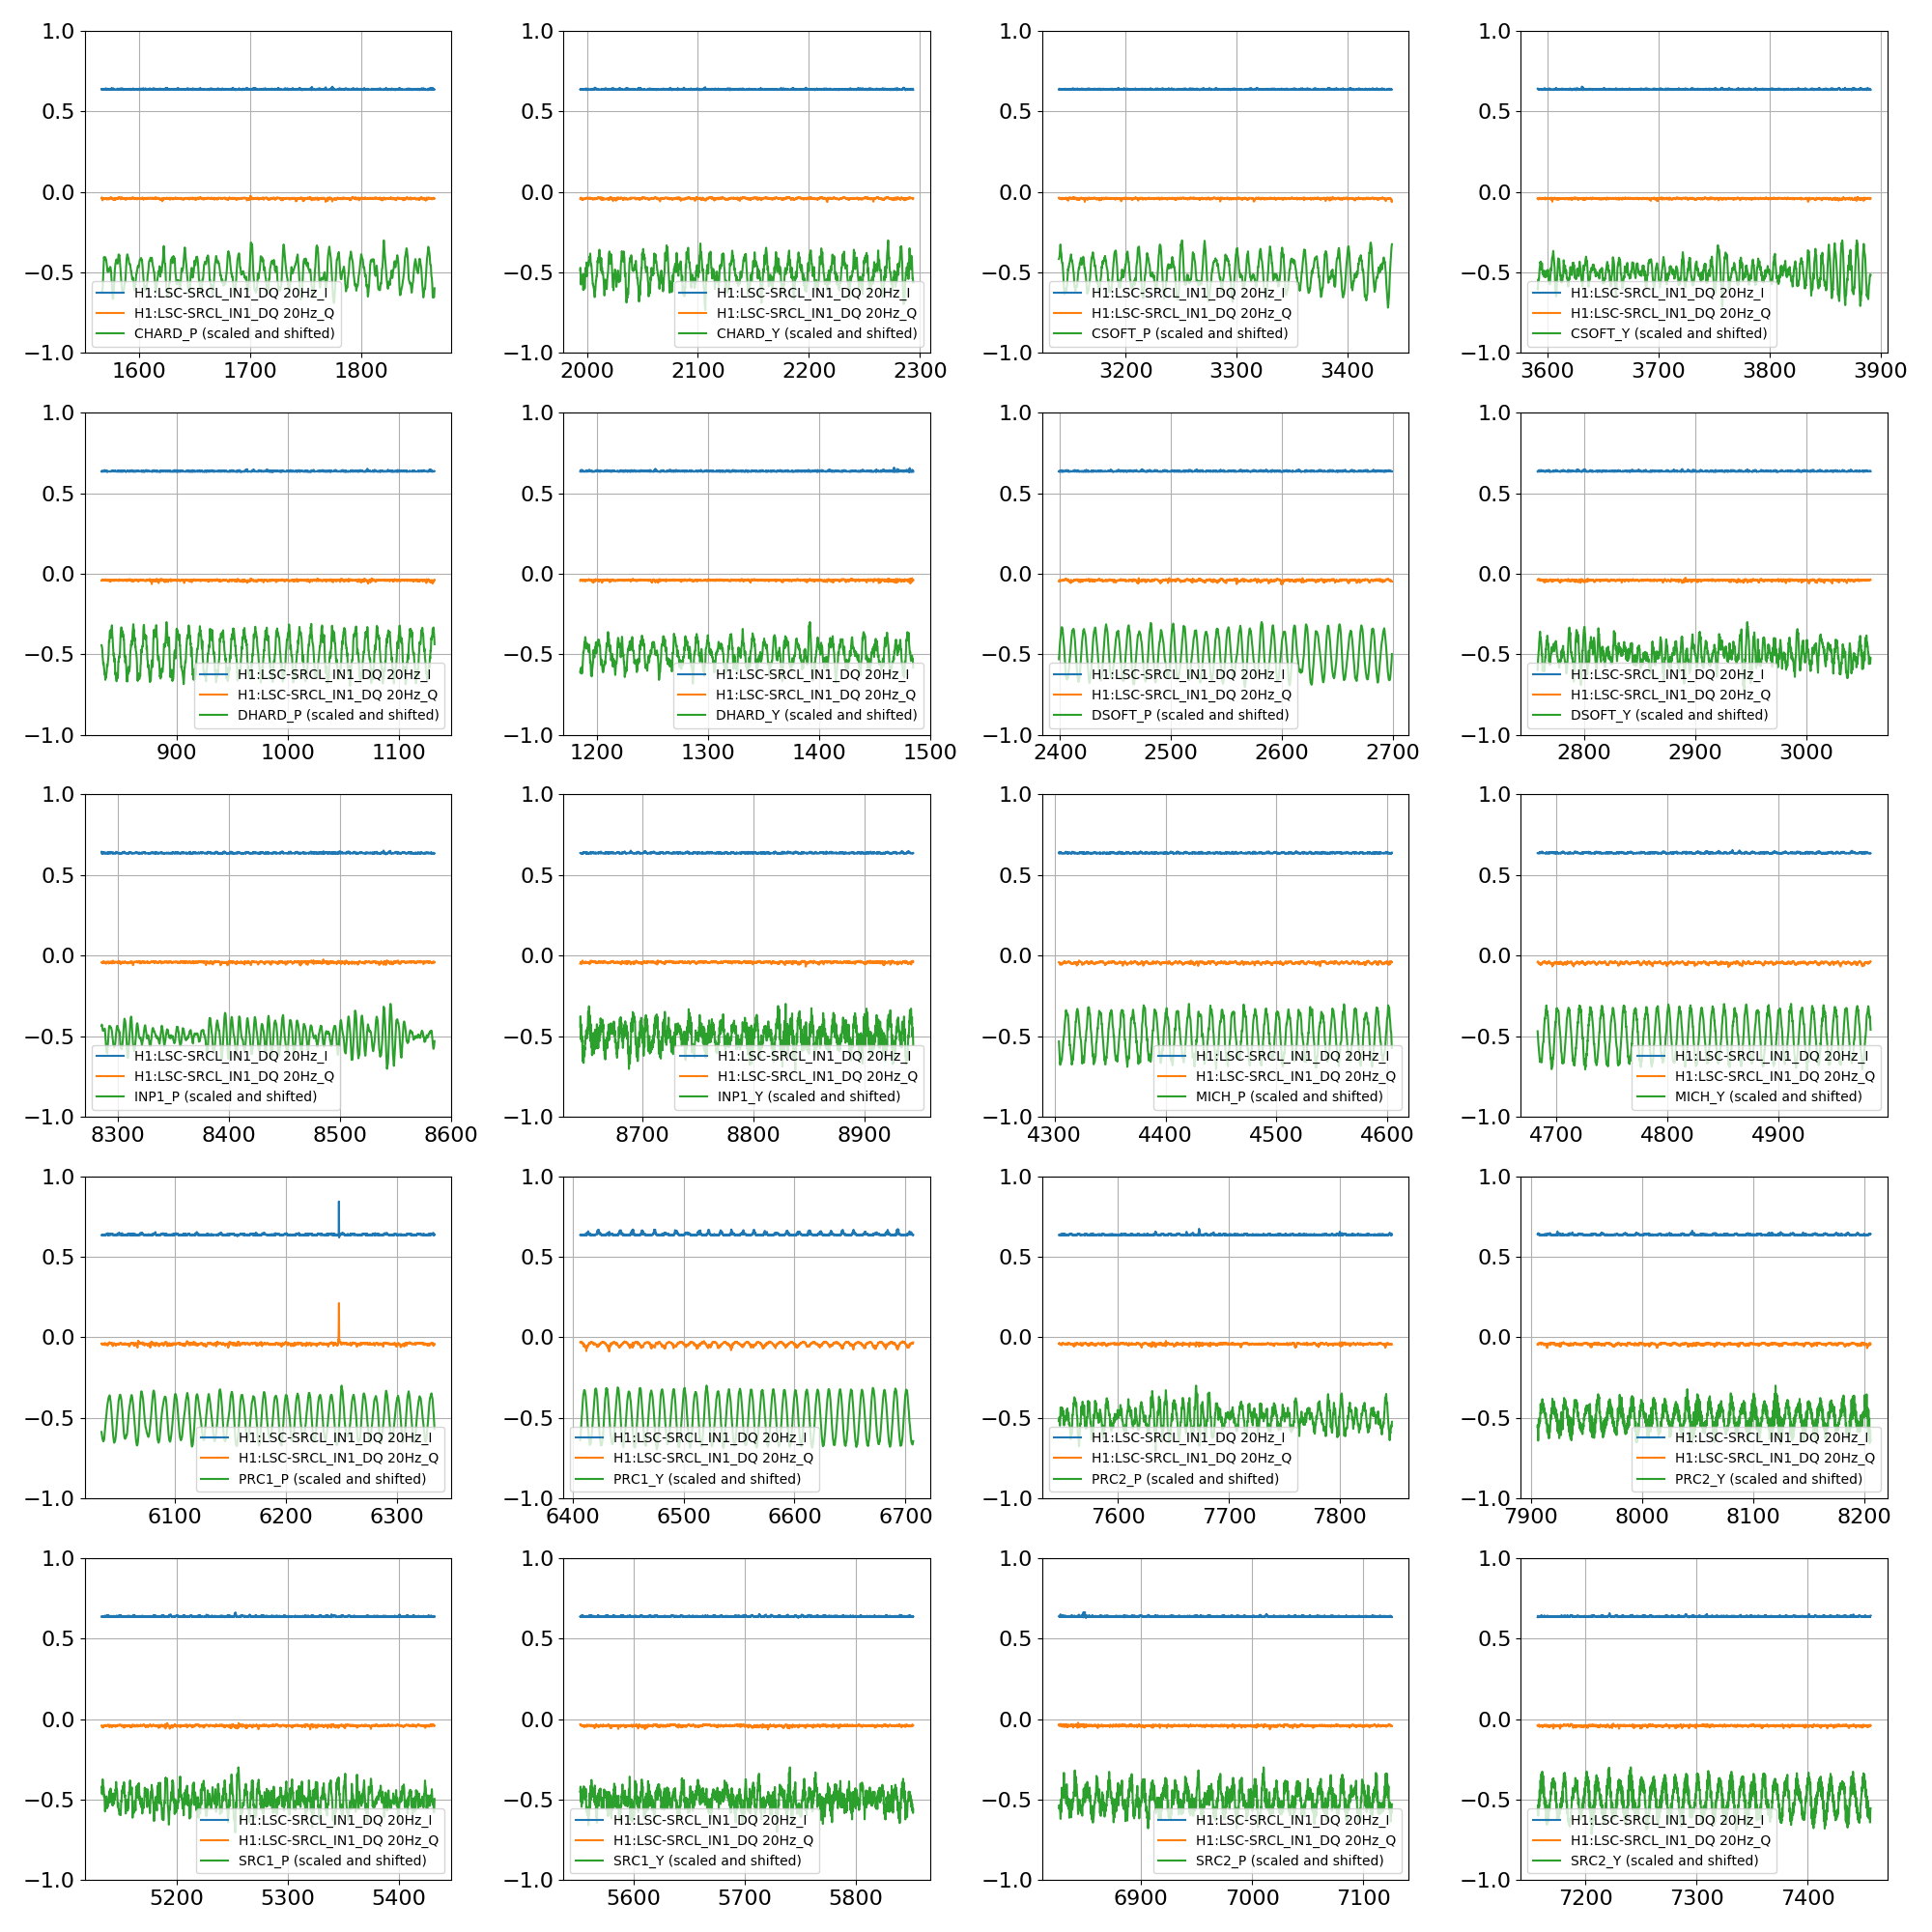
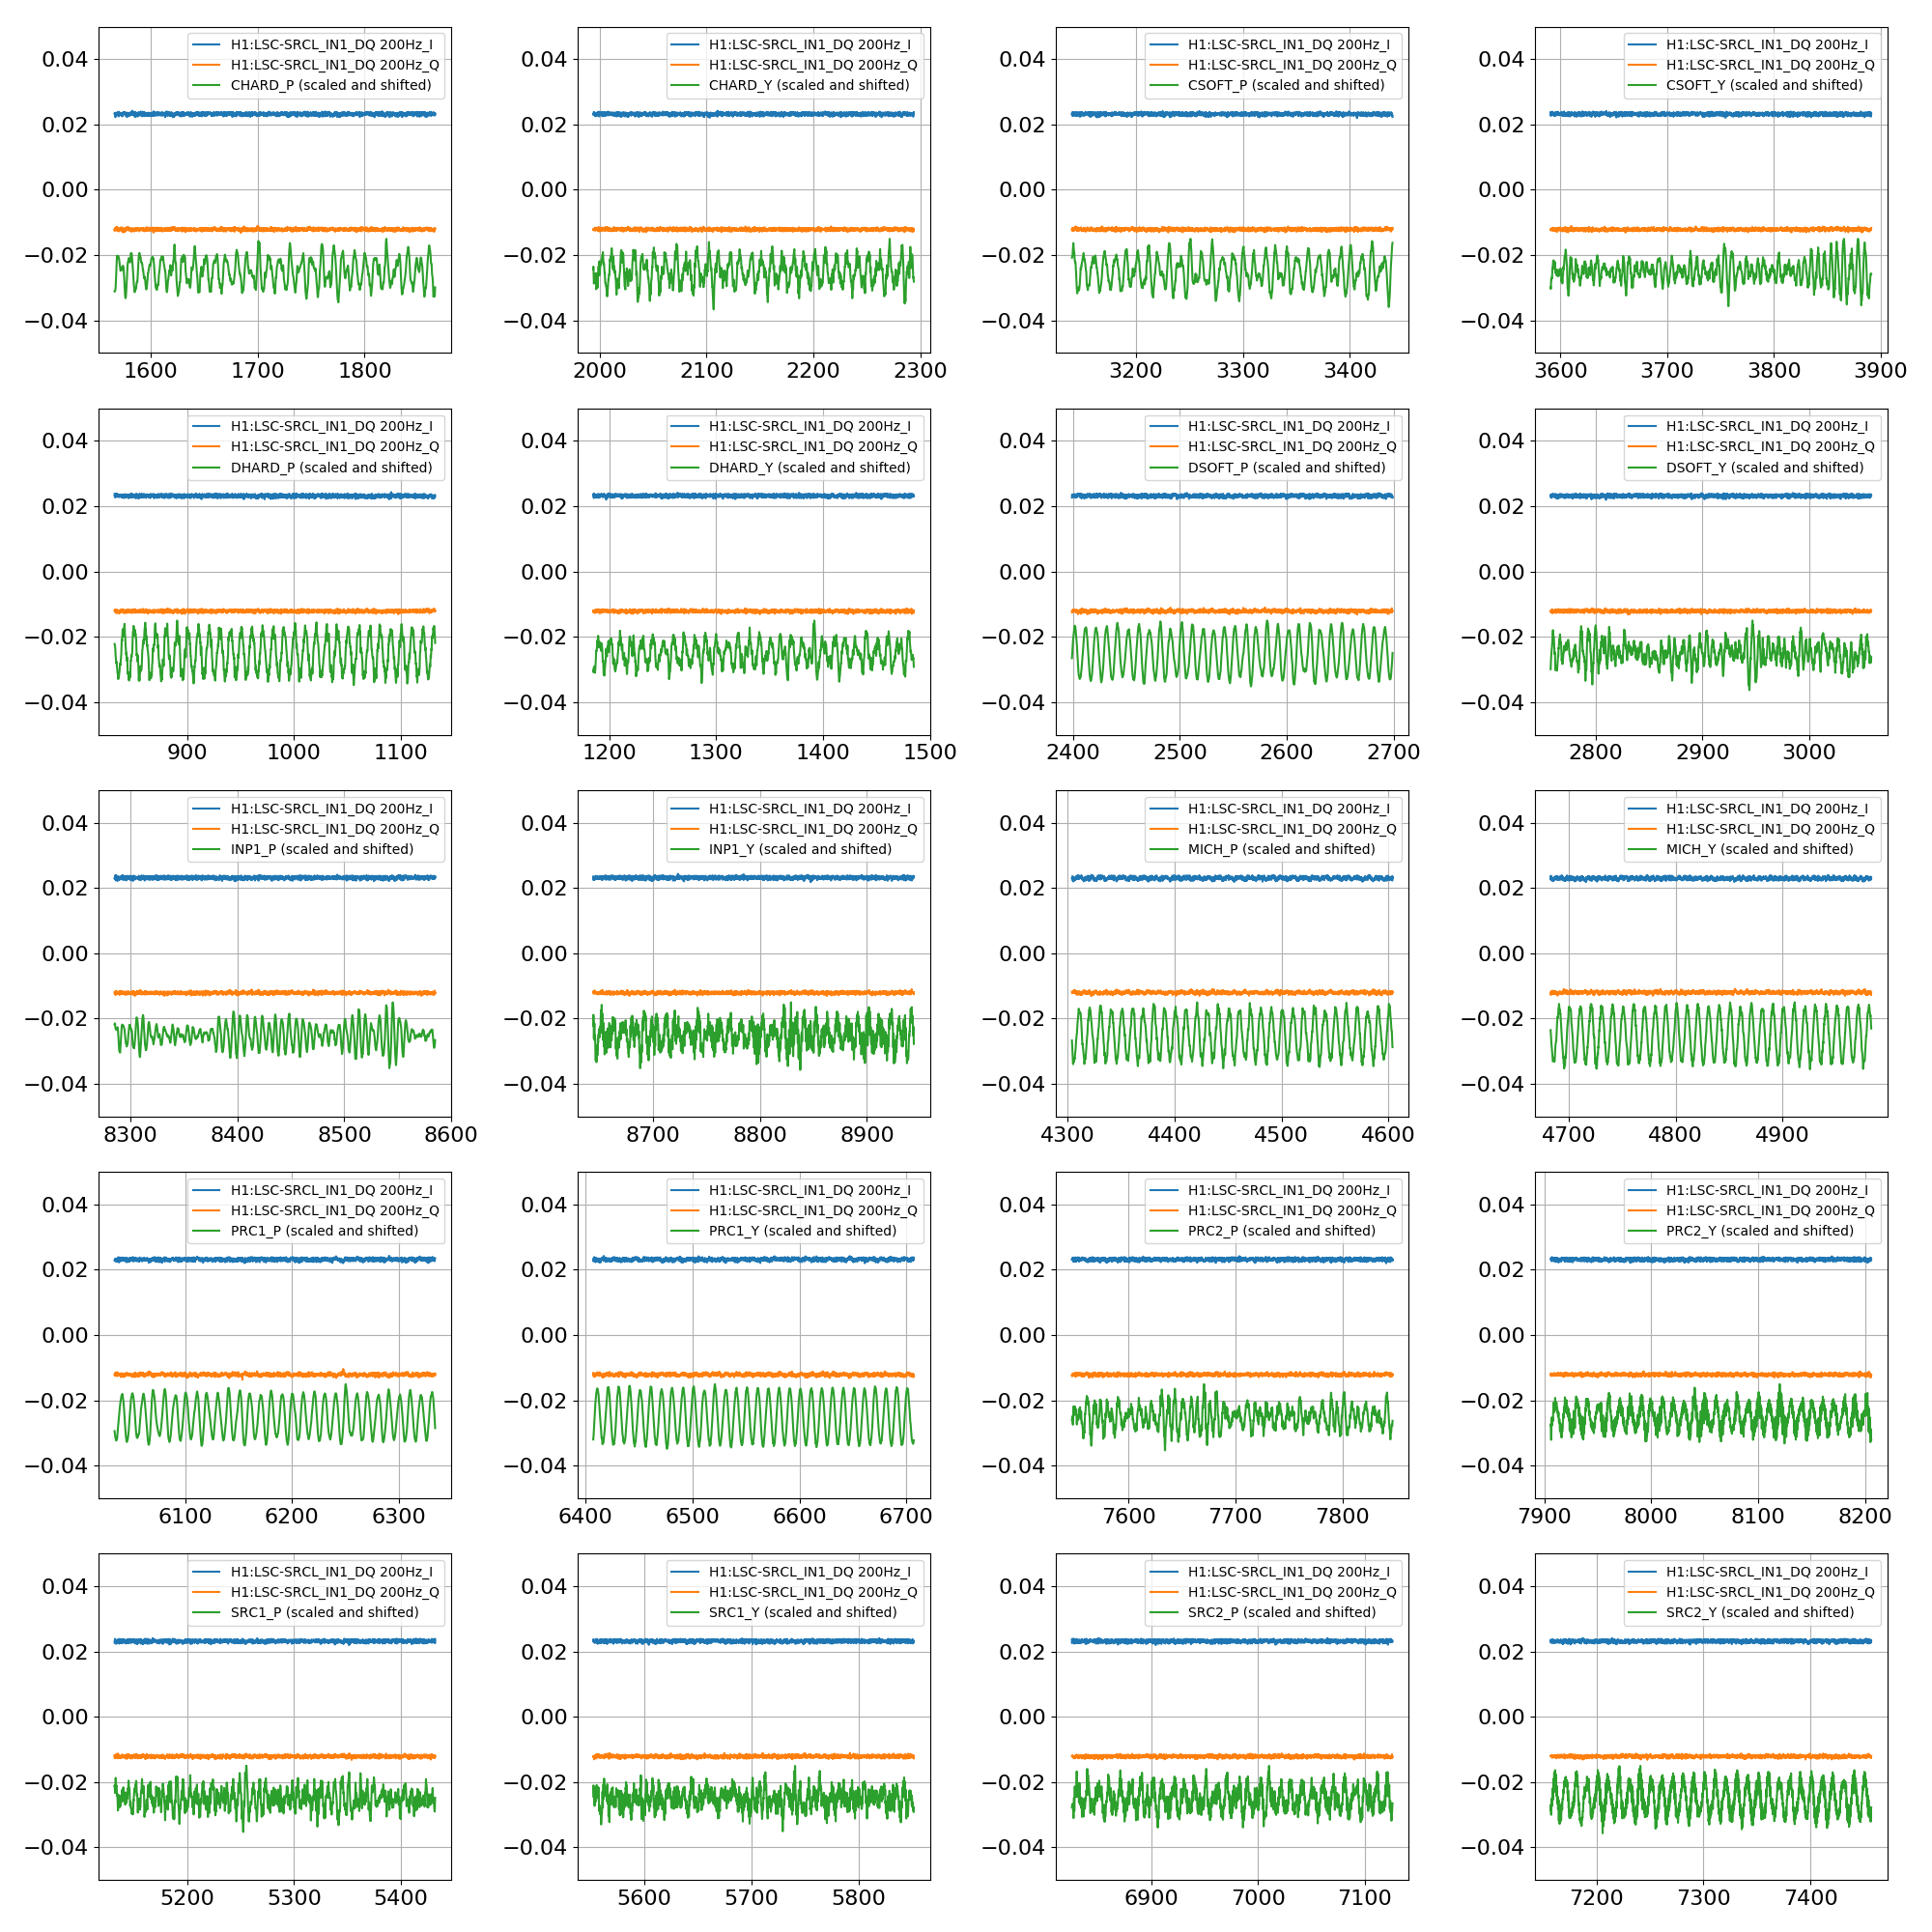
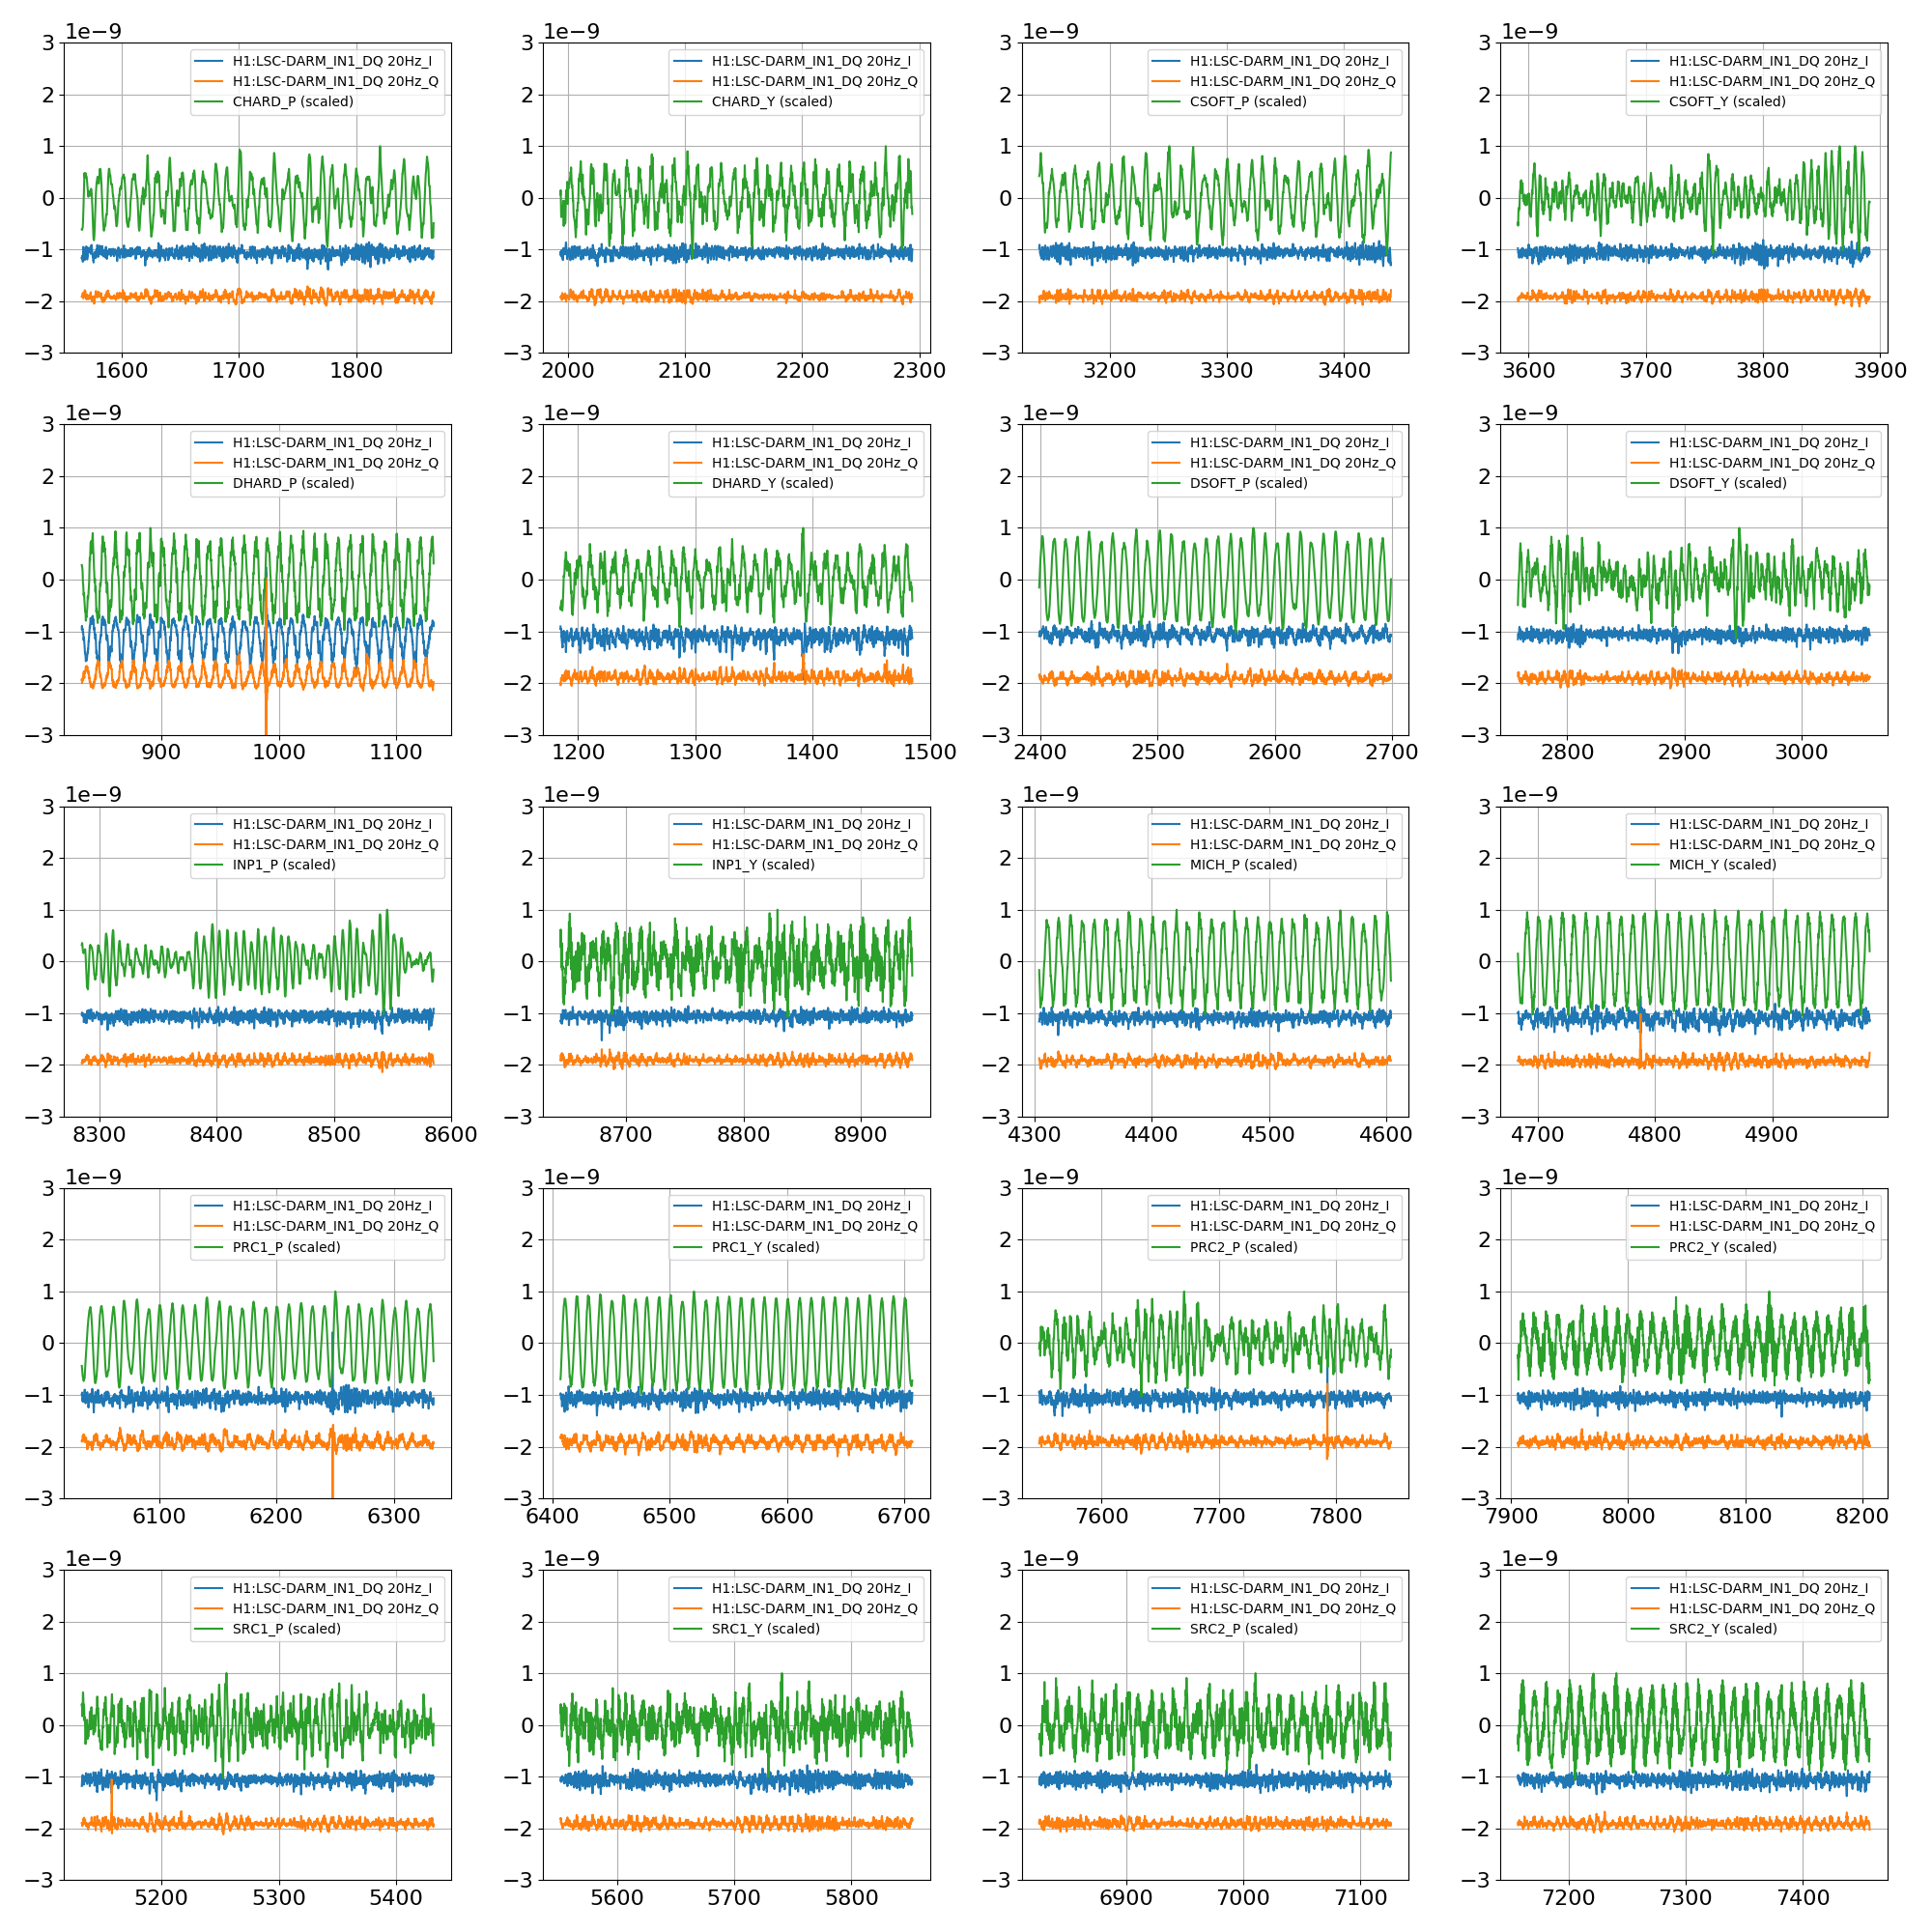
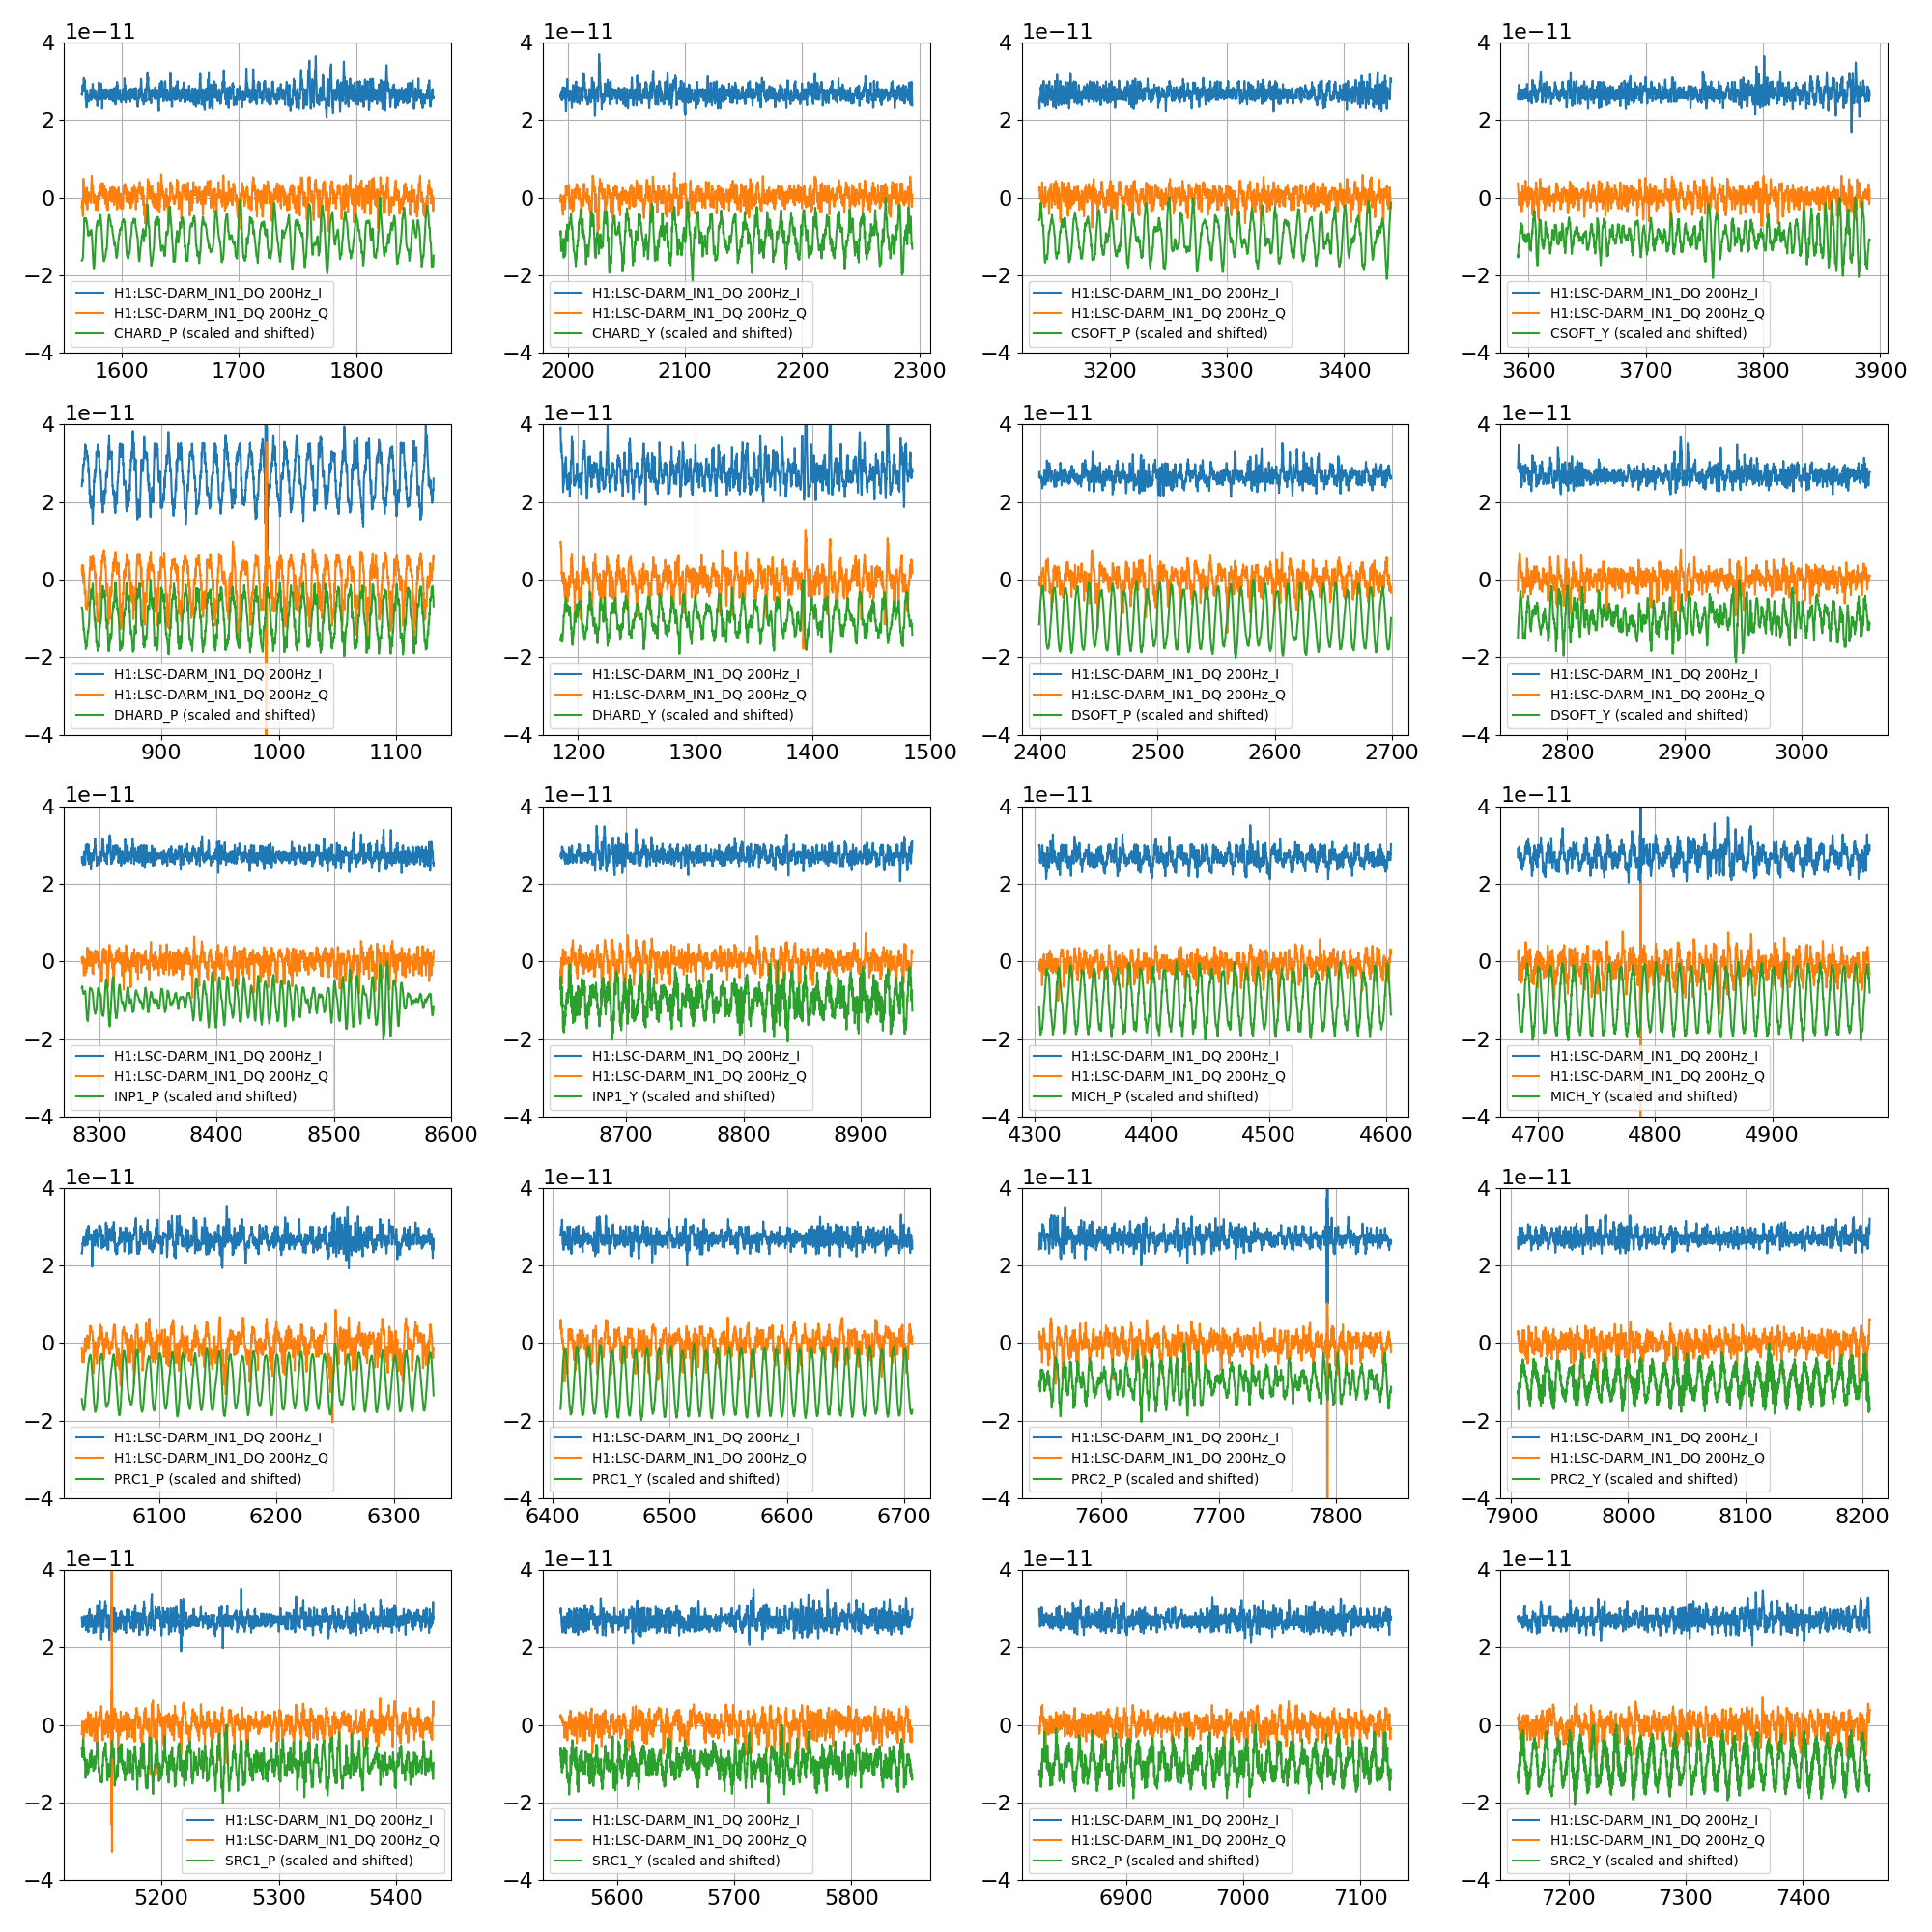
This is the follow-up analysis of the measurements described in 44881. The method is quite simple: I demodulated the LSC signals (DARM, MICH, SRCL and PRCL) at 20Hz and 200Hz, using the excitation line in SRCL_OUT to set the I and Q phases (I extracted absolute phases of the two lines by band-passing the SRCL_OUT signal and fitting a sinusoid to a short period. Then I generate I and Q demodulation signals as numerical sines and cosines). The demodulated signals (I and Q for both 20Hz and 200Hz) are then decimated to 16 Hz and low passed at 4 Hz.
The two plots below shows the most interesting results, which is how the SRCL to DARM coupling is modulated byt the angular motions. In each panel, I show the demodulated I and Q signals (basically the DARM/SRCL transfer function at either 20 or 200 Hz) and a scaled and shifted version of the ASC input signal corresponding to where the 100 mHz excitation was injected at that time. Left plot is the DARM_IN1 signal demodulated at 20 Hz, the right plot is the DARM_IN1 signal demodulated at 200 Hz.
Note that the excitation amplitude is not calibrated, so we can't do a urad to urad comparison (yet). But in all cases the excitation was larger than the typical motion of the d.o.f. at low frequency, and of comparable size.
In summary
The other plots attached below show the demodulated signals in PRCL_IN, MICH_IN and SRCL_IN:
The code is attached as a ipynb
that's good to see. I think its consistent with what we see in the Summary Pages' Rayleigh grams:
On Saturday night, when the microseism was high (~1 um/s) the Rayleigh stat in the 40-100 Hz band shows a lot of red (many non Gaussian outliers).
On Sunday, when the microseism was down to ~0.5 um/s, the Rayleigh gram is mostly white (Gaussian) in this band.