Displaying reports 44821-44840 of 88410.Go to page Start 2238 2239 2240 2241 2242 2243 2244 2245 2246 End
Reports until 18:24, Monday 29 October 2018
H1 SEI (Lockloss, SEI)
sheila.dwyer@LIGO.ORG - posted 18:24, Monday 29 October 2018 (44898)
lockloss where tidal caused EX HPI trip

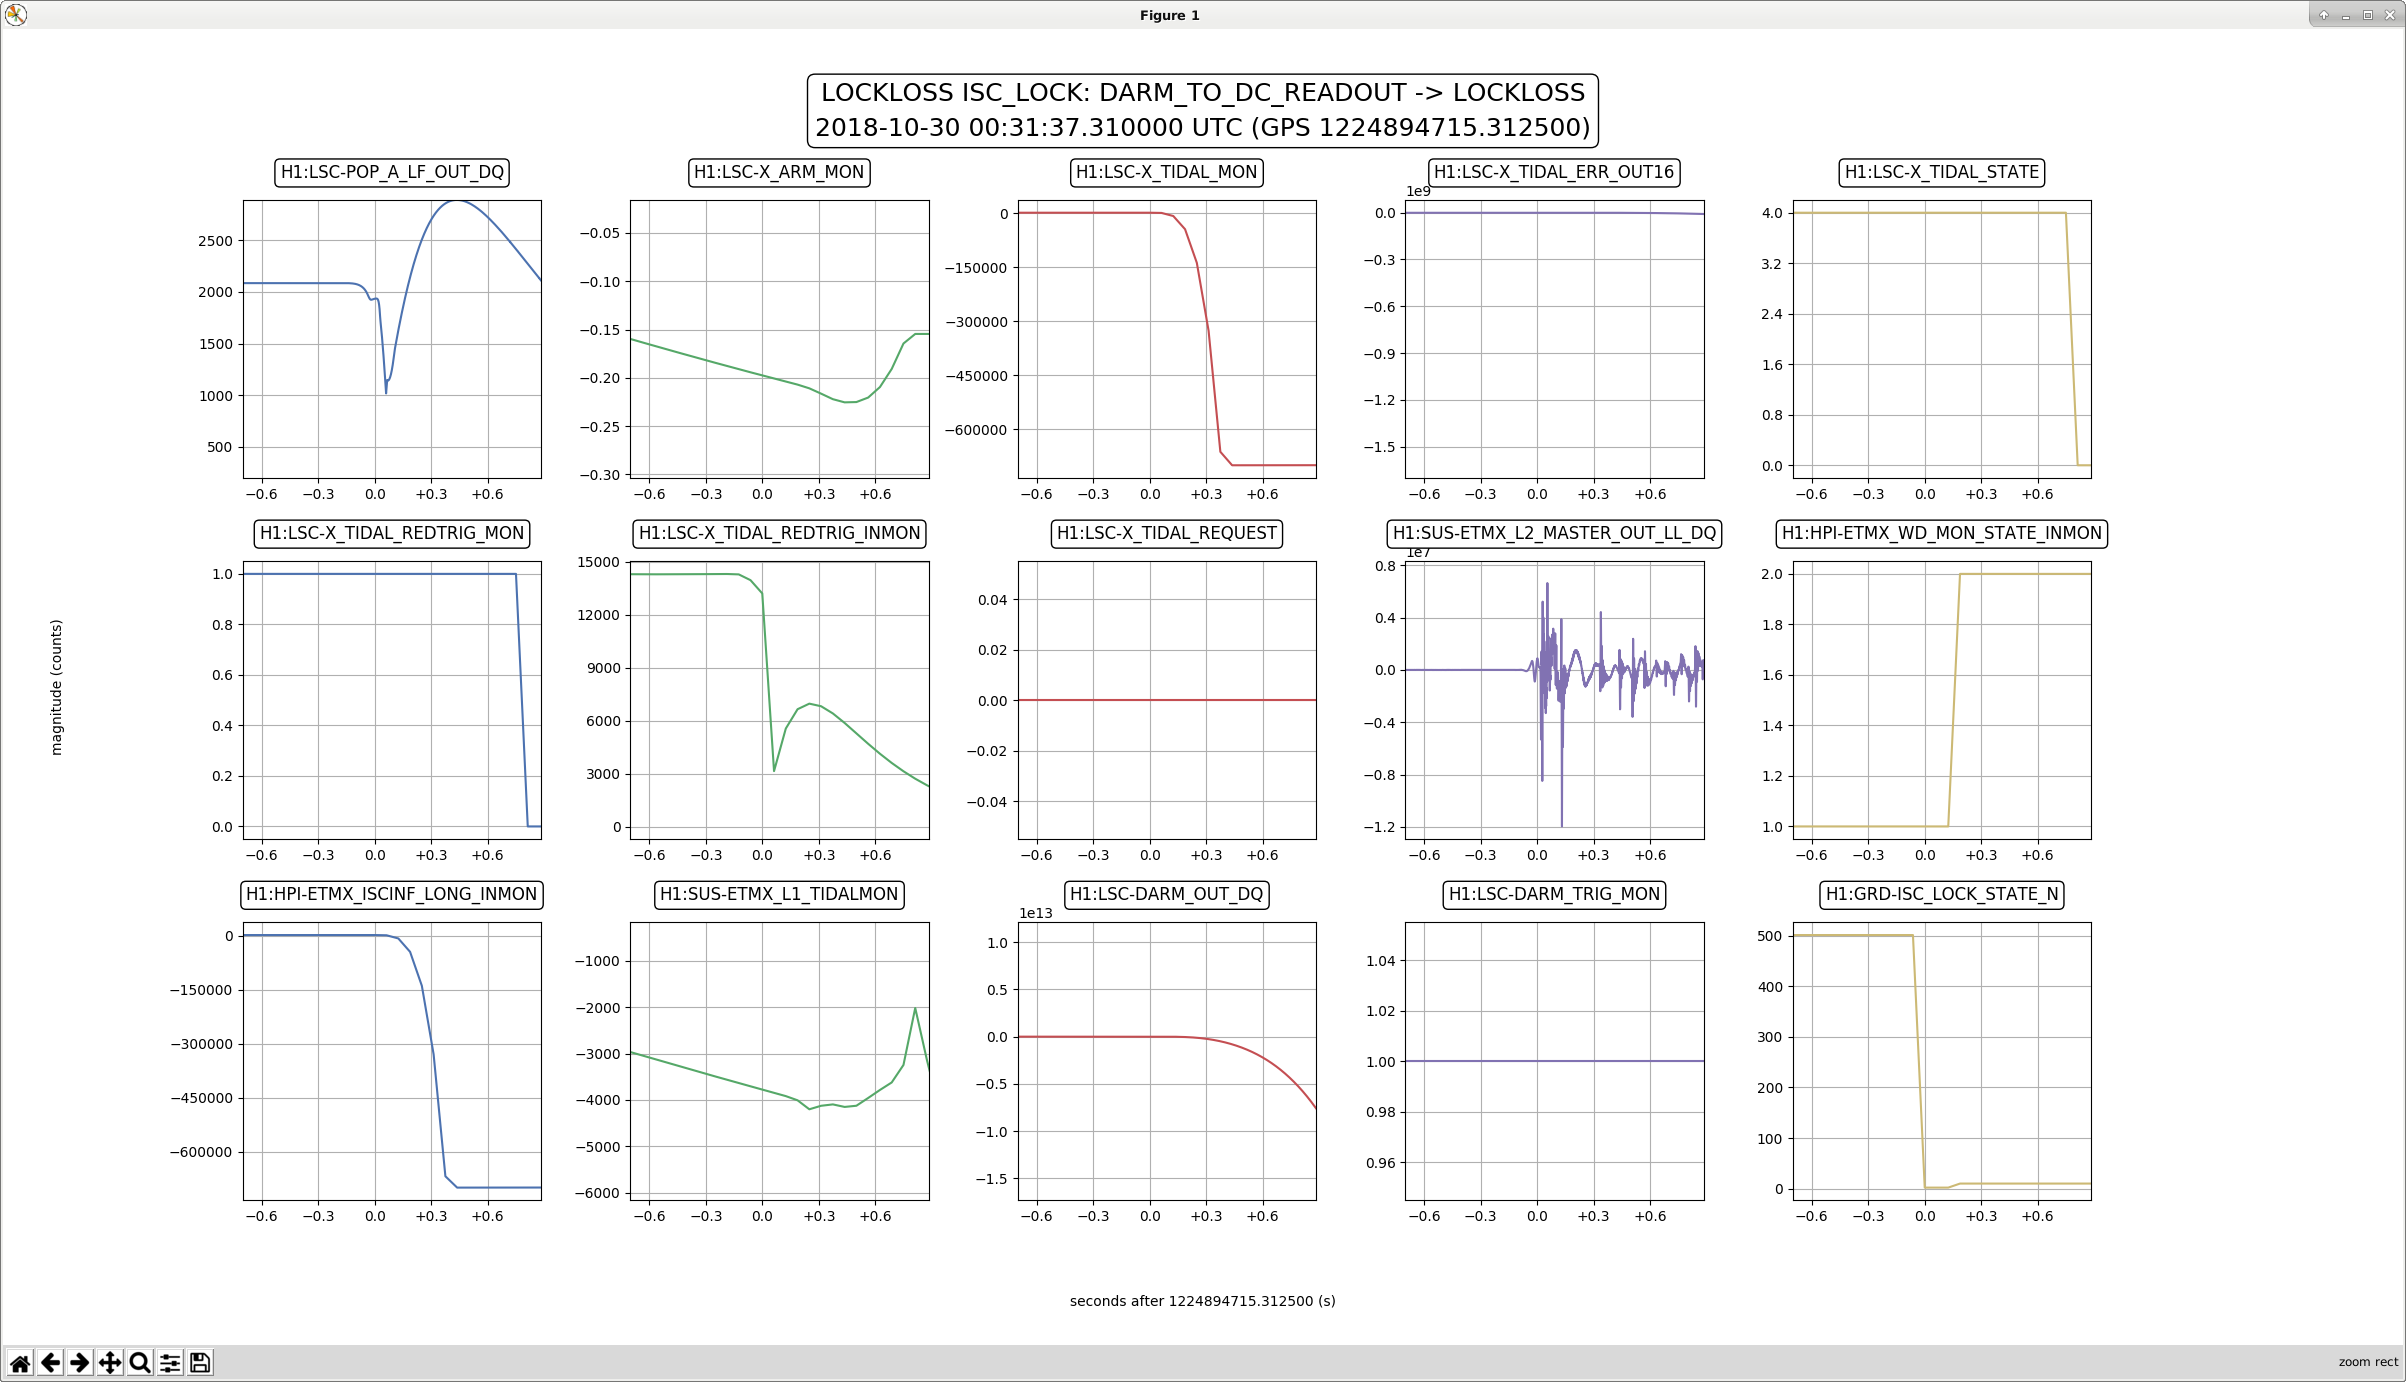
Just after I asked the interferometer to go to DC readout at 0:31:37 UTC Oct 30th the watchdogs at EX tripped, including HEPI, ISI ST1+ST2, and TMSX (but not the quad).  

The ISI ETMX ST2 guardian has an ezca connection error, which did not allow the ISI to reisolate.  I stopped the node and went to execute again, and it is now isolating HEPI.  

The attached screenshot from the lockloss tool shows that tidal did not trigger off unitl 0.8 seconds after the lockloss.  The trigger for tidal is based on the sum of the red transmon QPDs, and has been set to 3000 by the guardian in the step DRMI_TO_POP

I added a few lines at the end of the increase power state so that after we increase the input power we reset the tidal off threshold to 8000 counts, which would have helped avoid the HPI trip in this instance.  

Images attached to this report
H1 CAL (CAL, DetChar, ISC, SUS)
evan.goetz@LIGO.ORG - posted 17:21, Monday 29 October 2018 - last comment - 16:09, Tuesday 30 October 2018(44892)
Re-running 'Where not to dither - avoiding known pulsars with accessible spindown limits'
As a follow up to Lilli's analysis (see LHO aLOG 44590) on where to move the calibration lines, I re-ran Keith Riles' analysis from 4 years ago (about time to refresh this analysis!) on where to avoid dithering so as not to detrimentally impact pulsar searches with accessible spindown limits (see LHO aLOG 14836). I downloaded the scripts, made a new ATNF pulsar catalog table (see this link), and used an aLIGO design sensitivity curve as needed by Keith's script (from T1800044).

To summarize the differences between Keith's analysis and mine:
1) I use an updated ATNF pulsar catalog file
2) I use an updated aLIGO noise curve
3) Changed the reference Julian date to Jan. 1, 2019 --> MJD=58484

Comparing the Oct. 2014 (left columns) with Oct. 2018 (right columns):
Non-vetoed bands for veto half-band = 1.000000 (one or two times pulsar frequency)
    33.42-  37.32 Hz (   3.91 Hz)    33.42-  37.31 Hz (   3.90 Hz)
    42.88-  49.58 Hz (   6.71 Hz)    42.88-  43.70 Hz (   0.83 Hz)
                                     45.71-  49.58 Hz (   3.88 Hz)
    51.59-  54.69 Hz (   3.11 Hz)    51.59-  54.69 Hz (   3.11 Hz)
    57.22-  58.30 Hz (   1.09 Hz)    57.22-  58.23 Hz (   1.02 Hz)
    60.31-  60.93 Hz (   0.63 Hz)    60.24-  60.91 Hz (   0.68 Hz)
    62.94-  63.12 Hz (   0.19 Hz)    62.92-  63.11 Hz (   0.20 Hz)
    65.13-  81.32 Hz (  16.20 Hz)    65.12-  87.10 Hz (  21.99 Hz)
    83.33-  87.10 Hz (   3.78 Hz)
    89.11- 122.87 Hz (  33.77 Hz)    89.11- 102.21 Hz (  13.11 Hz)
                                    104.22- 122.83 Hz (  18.62 Hz)
   124.88- 159.80 Hz (  34.93 Hz)   124.84- 159.80 Hz (  34.97 Hz)
   161.81- 172.68 Hz (  10.88 Hz)   161.81- 172.68 Hz (  10.88 Hz)
   174.69- 201.79 Hz (  27.11 Hz)   174.69- 181.11 Hz (   6.43 Hz)
                                    183.12- 220.35 Hz (  37.24 Hz)
   203.80- 320.61 Hz ( 116.82 Hz)
                                    222.36- 238.51 Hz (  16.16 Hz)
                                    240.52- 320.61 Hz (  80.10 Hz)
   322.62- 346.37 Hz (  23.76 Hz)   322.62- 346.37 Hz (  23.76 Hz)
   348.38-2000.00 Hz (1651.63 Hz)   348.38- 363.23 Hz (  14.86 Hz)
                                    365.24-2000.00 Hz (1634.77 Hz)
where blank lines exist, the script did not output a corresponding line for the given pulsar catalog with 4 years difference.

I'll summarize Keith to say that the above is rather conservative, to stay 1 Hz away from known pulsars with accessible spindown limits when searching at both 1f and 2f. Observe that it's impossible to find a frequency band below 33.4 Hz under these considerations. If we instead focus on 2f searches, again comparing Oct. 2014 with Oct. 2018:
Non-vetoed bands for veto half-band = 1.000000 (two times pulsar frequency)
    33.42-  37.32 Hz (   3.91 Hz)    33.42-  37.31 Hz (   3.90 Hz)
    42.88-  49.58 Hz (   6.71 Hz)    42.88-  43.70 Hz (   0.83 Hz)
                                     45.71-  49.58 Hz (   3.88 Hz)
    51.59-  54.69 Hz (   3.11 Hz)    51.59-  54.69 Hz (   3.11 Hz)
    57.22-  58.30 Hz (   1.09 Hz)    57.22-  58.23 Hz (   1.02 Hz)
    60.31-  63.12 Hz (   2.82 Hz)    60.24-  63.11 Hz (   2.88 Hz)
    65.13-  81.32 Hz (  16.20 Hz)    65.12-  87.10 Hz (  21.99 Hz)
    83.33-  87.10 Hz (   3.78 Hz)
    89.11- 122.87 Hz (  33.77 Hz)    89.11- 102.21 Hz (  13.11 Hz)
                                    104.22- 122.83 Hz (  18.62 Hz)
   124.88- 320.61 Hz ( 195.74 Hz)   124.84- 220.35 Hz (  95.52 Hz)
                                    222.36- 320.61 Hz (  98.26 Hz)
   322.62- 346.37 Hz (  23.76 Hz)   322.62- 346.37 Hz (  23.76 Hz)
   348.38-2000.00 Hz (1651.63 Hz)   348.38- 363.23 Hz (  14.86 Hz)
                                    365.24-2000.00 Hz (1634.77 Hz)

If we are less restrictive on the band vetoed, allowing for 0.5 Hz rather than 1.0 Hz:
Non-vetoed bands for veto half-band = 0.500000 (two times pulsar frequency)
    10.99-  11.04 Hz (   0.06 Hz)
    15.46-  15.50 Hz (   0.05 Hz)
    16.67-  16.76 Hz (   0.10 Hz)
    32.92-  37.81 Hz (   4.90 Hz)
    40.45-  40.65 Hz (   0.21 Hz)
    42.38-  44.20 Hz (   1.83 Hz)
    45.21-  50.08 Hz (   4.88 Hz)
    51.09-  55.19 Hz (   4.11 Hz)
    56.72-  58.73 Hz (   2.02 Hz)
    59.74-  63.61 Hz (   3.88 Hz)
    64.62-  87.60 Hz (  22.99 Hz)
    88.61- 102.71 Hz (  14.11 Hz)
   103.72- 123.33 Hz (  19.62 Hz)
   124.34- 220.85 Hz (  96.52 Hz)
   221.86- 321.11 Hz (  99.26 Hz)
   322.12- 346.87 Hz (  24.76 Hz)
   347.88- 363.73 Hz (  15.86 Hz)
   364.74-2000.00 Hz (1635.27 Hz)

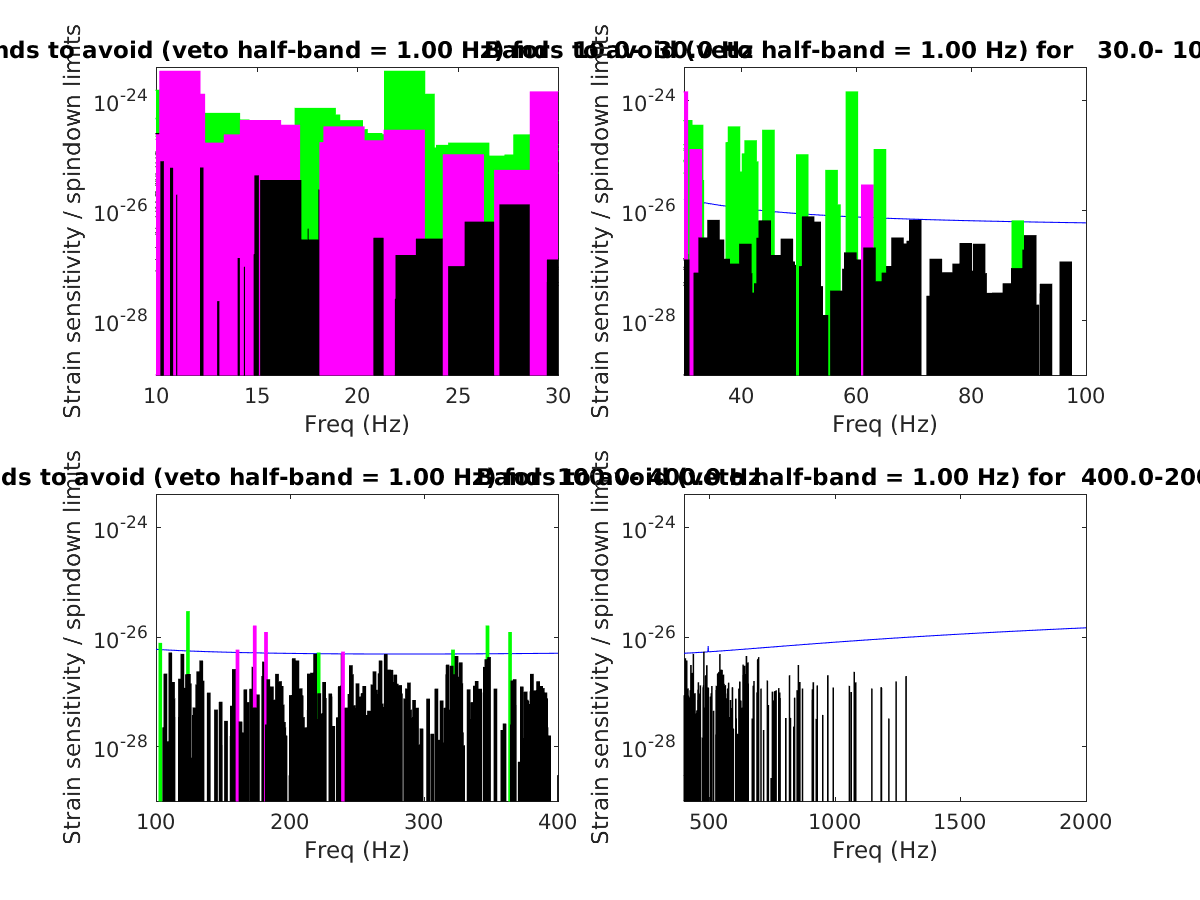
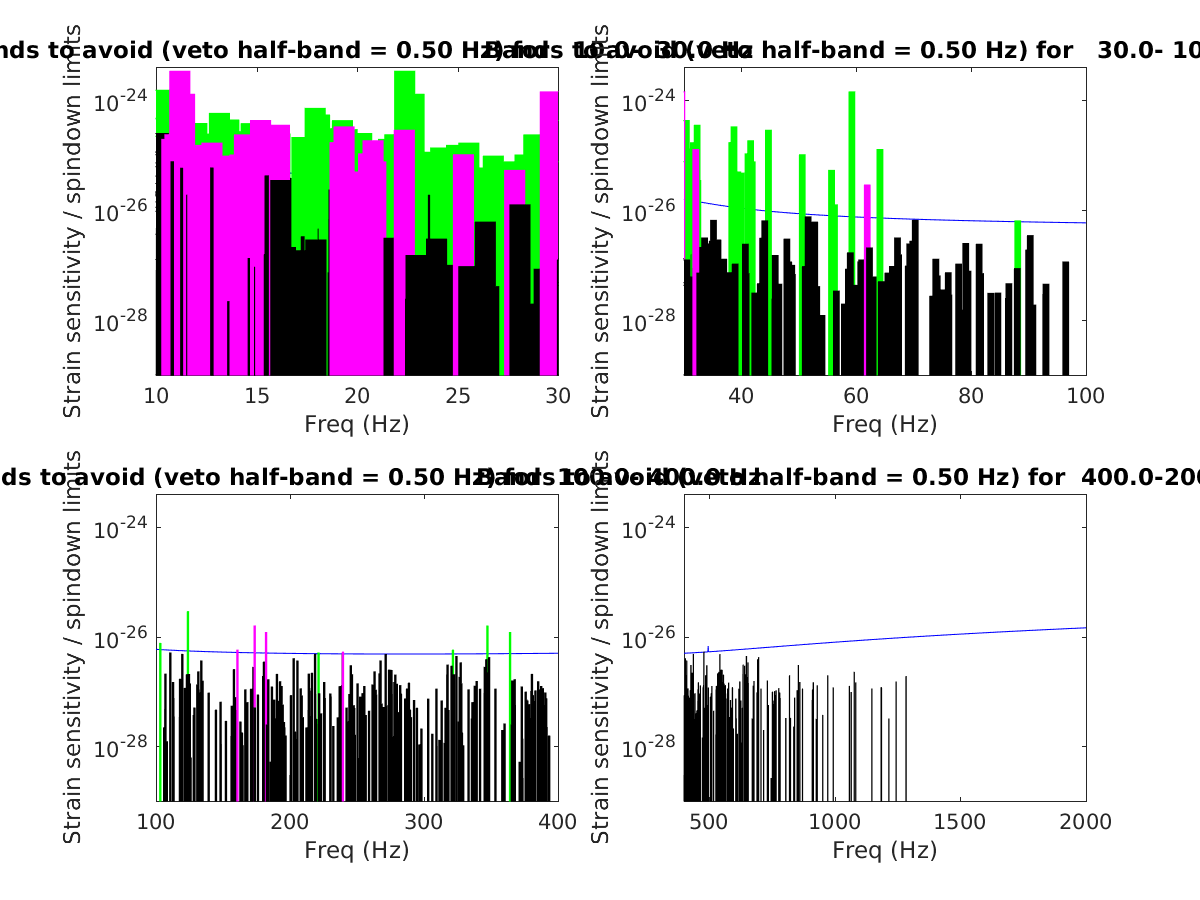
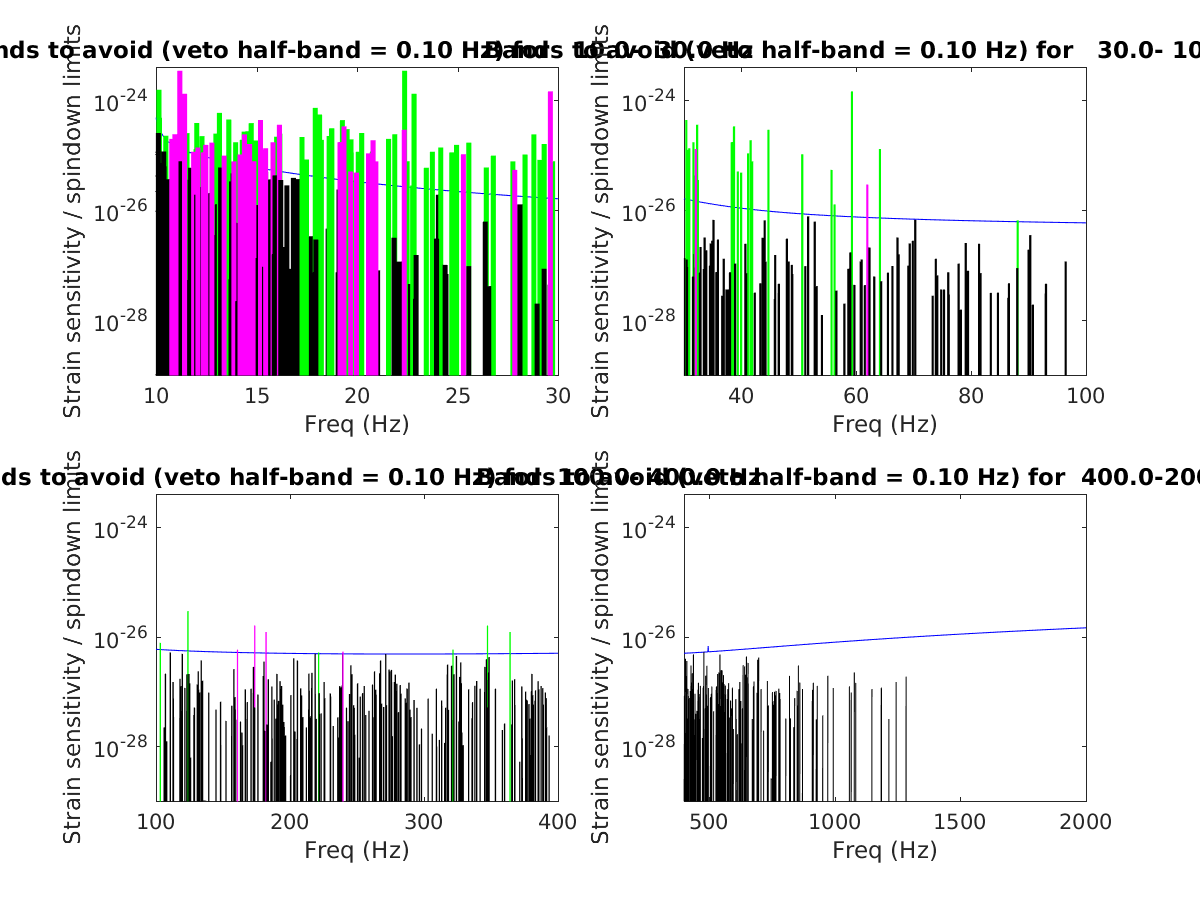
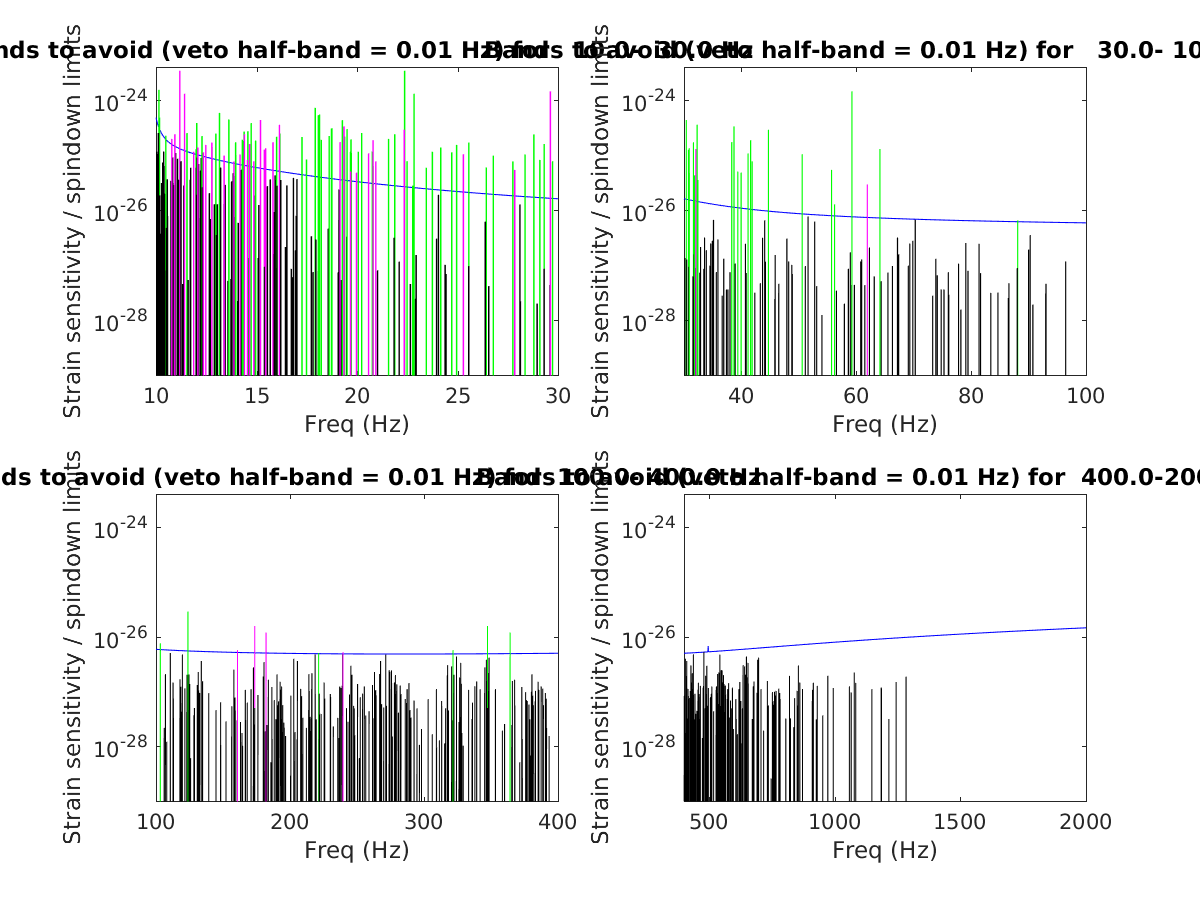
Attached are the plot outputs for each of veto bands 1.0, 0.5, 0.1, and 0.01 Hz and text files for pulsars with spindown limits and non-vetoed bands. The plotted magenta bands mark pulsars with an accessible 1*F spindown limit, green bands mark pulsars with an accessible 2*F spindown limit, and black bands mark pulsars where a 1*F or 2*F spindown limit is not accessible. The blue curve shows the 1-year 2-IFO sensitivity for the zero-detuned, high-power configuration.

Suggestions for calibration line frequencies were (from LHO aLOG 44590):
LLO - Stay with the current choices - 15.7 Hz, 16.3 Hz, 16.9 Hz, and add one more 18.1 Hz (notes: 16.9 is not a prime divided by 10; 18.1 is closer than 0.1 Hz to a known pulsar with accessible spindown)

LHO - 15.5 Hz, 16.7 Hz, 18.3 Hz, 18.9 Hz (notes: 15.5, 18.3, and 18.9 are not a prime divided by 10; 18.3 is closer than 0.1 Hz to a known pulsar with accessible spindown)

Suggested modifications based on this analysis and choosing primes divided by 10:
LLO - 15.7 Hz, 16.3 Hz, 17.3 Hz, and 18.1 Hz (unless this causes issues for the CW group)

LHO - 15.1 Hz, 16.7 Hz, 17.9 Hz, and 19.1 Hz (unless this causes issues for the CW group)

Bottom line: When the suspension actuator calibration lines are moved to lower frequencies (< 20 Hz), then we will be within 1.0 Hz of an accessible pulsar, but further than 0.1 Hz except for suggested 17.3 Hz, 17.9 Hz, and 18.1 Hz calibration lines.
Images attached to this report
Non-image files attached to this report
Comments related to this report
evan.goetz@LIGO.ORG - 16:09, Tuesday 30 October 2018 (44925)
For the higher frequency Pcal line, I suggest we use prime values divided by 10 rather than what was suggested previously.

This means H1: 433.7 Hz
and L1: 434.9 Hz
H1 ISC
sheila.dwyer@LIGO.ORG - posted 17:02, Monday 29 October 2018 (44893)
PRCL to SRCL input matrix tuning

Gabriele, Sheila

Summary:

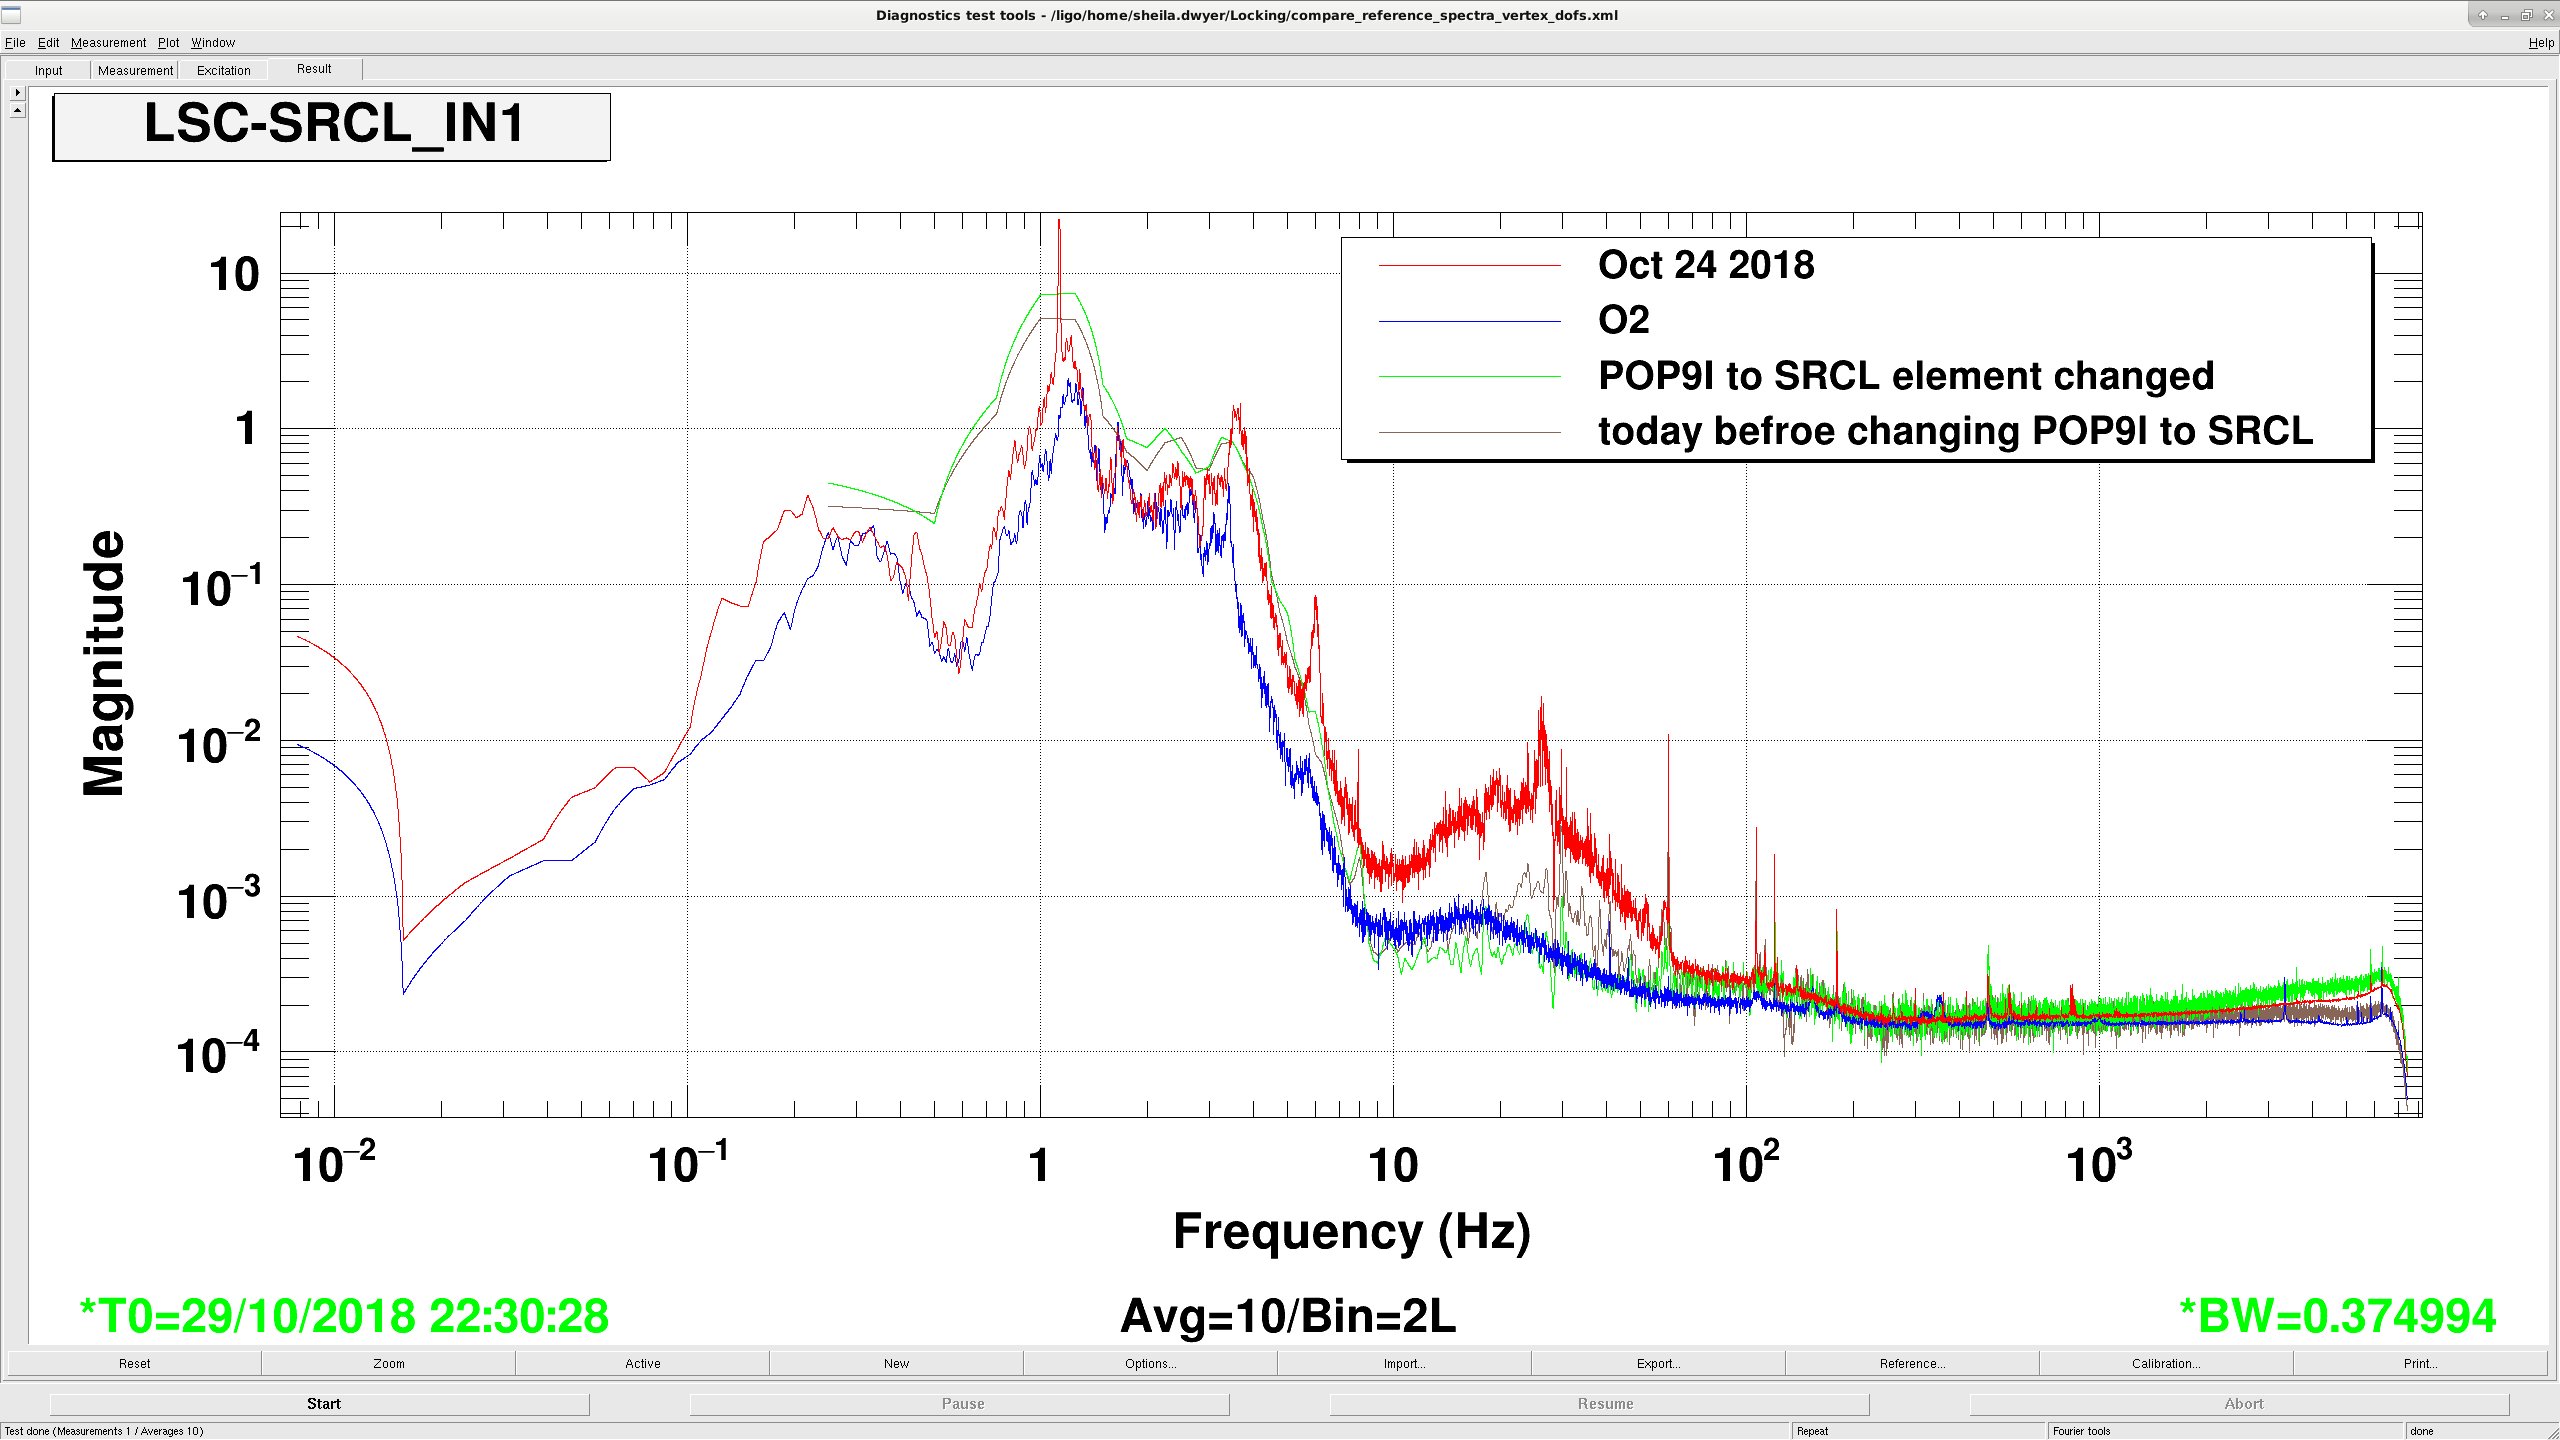
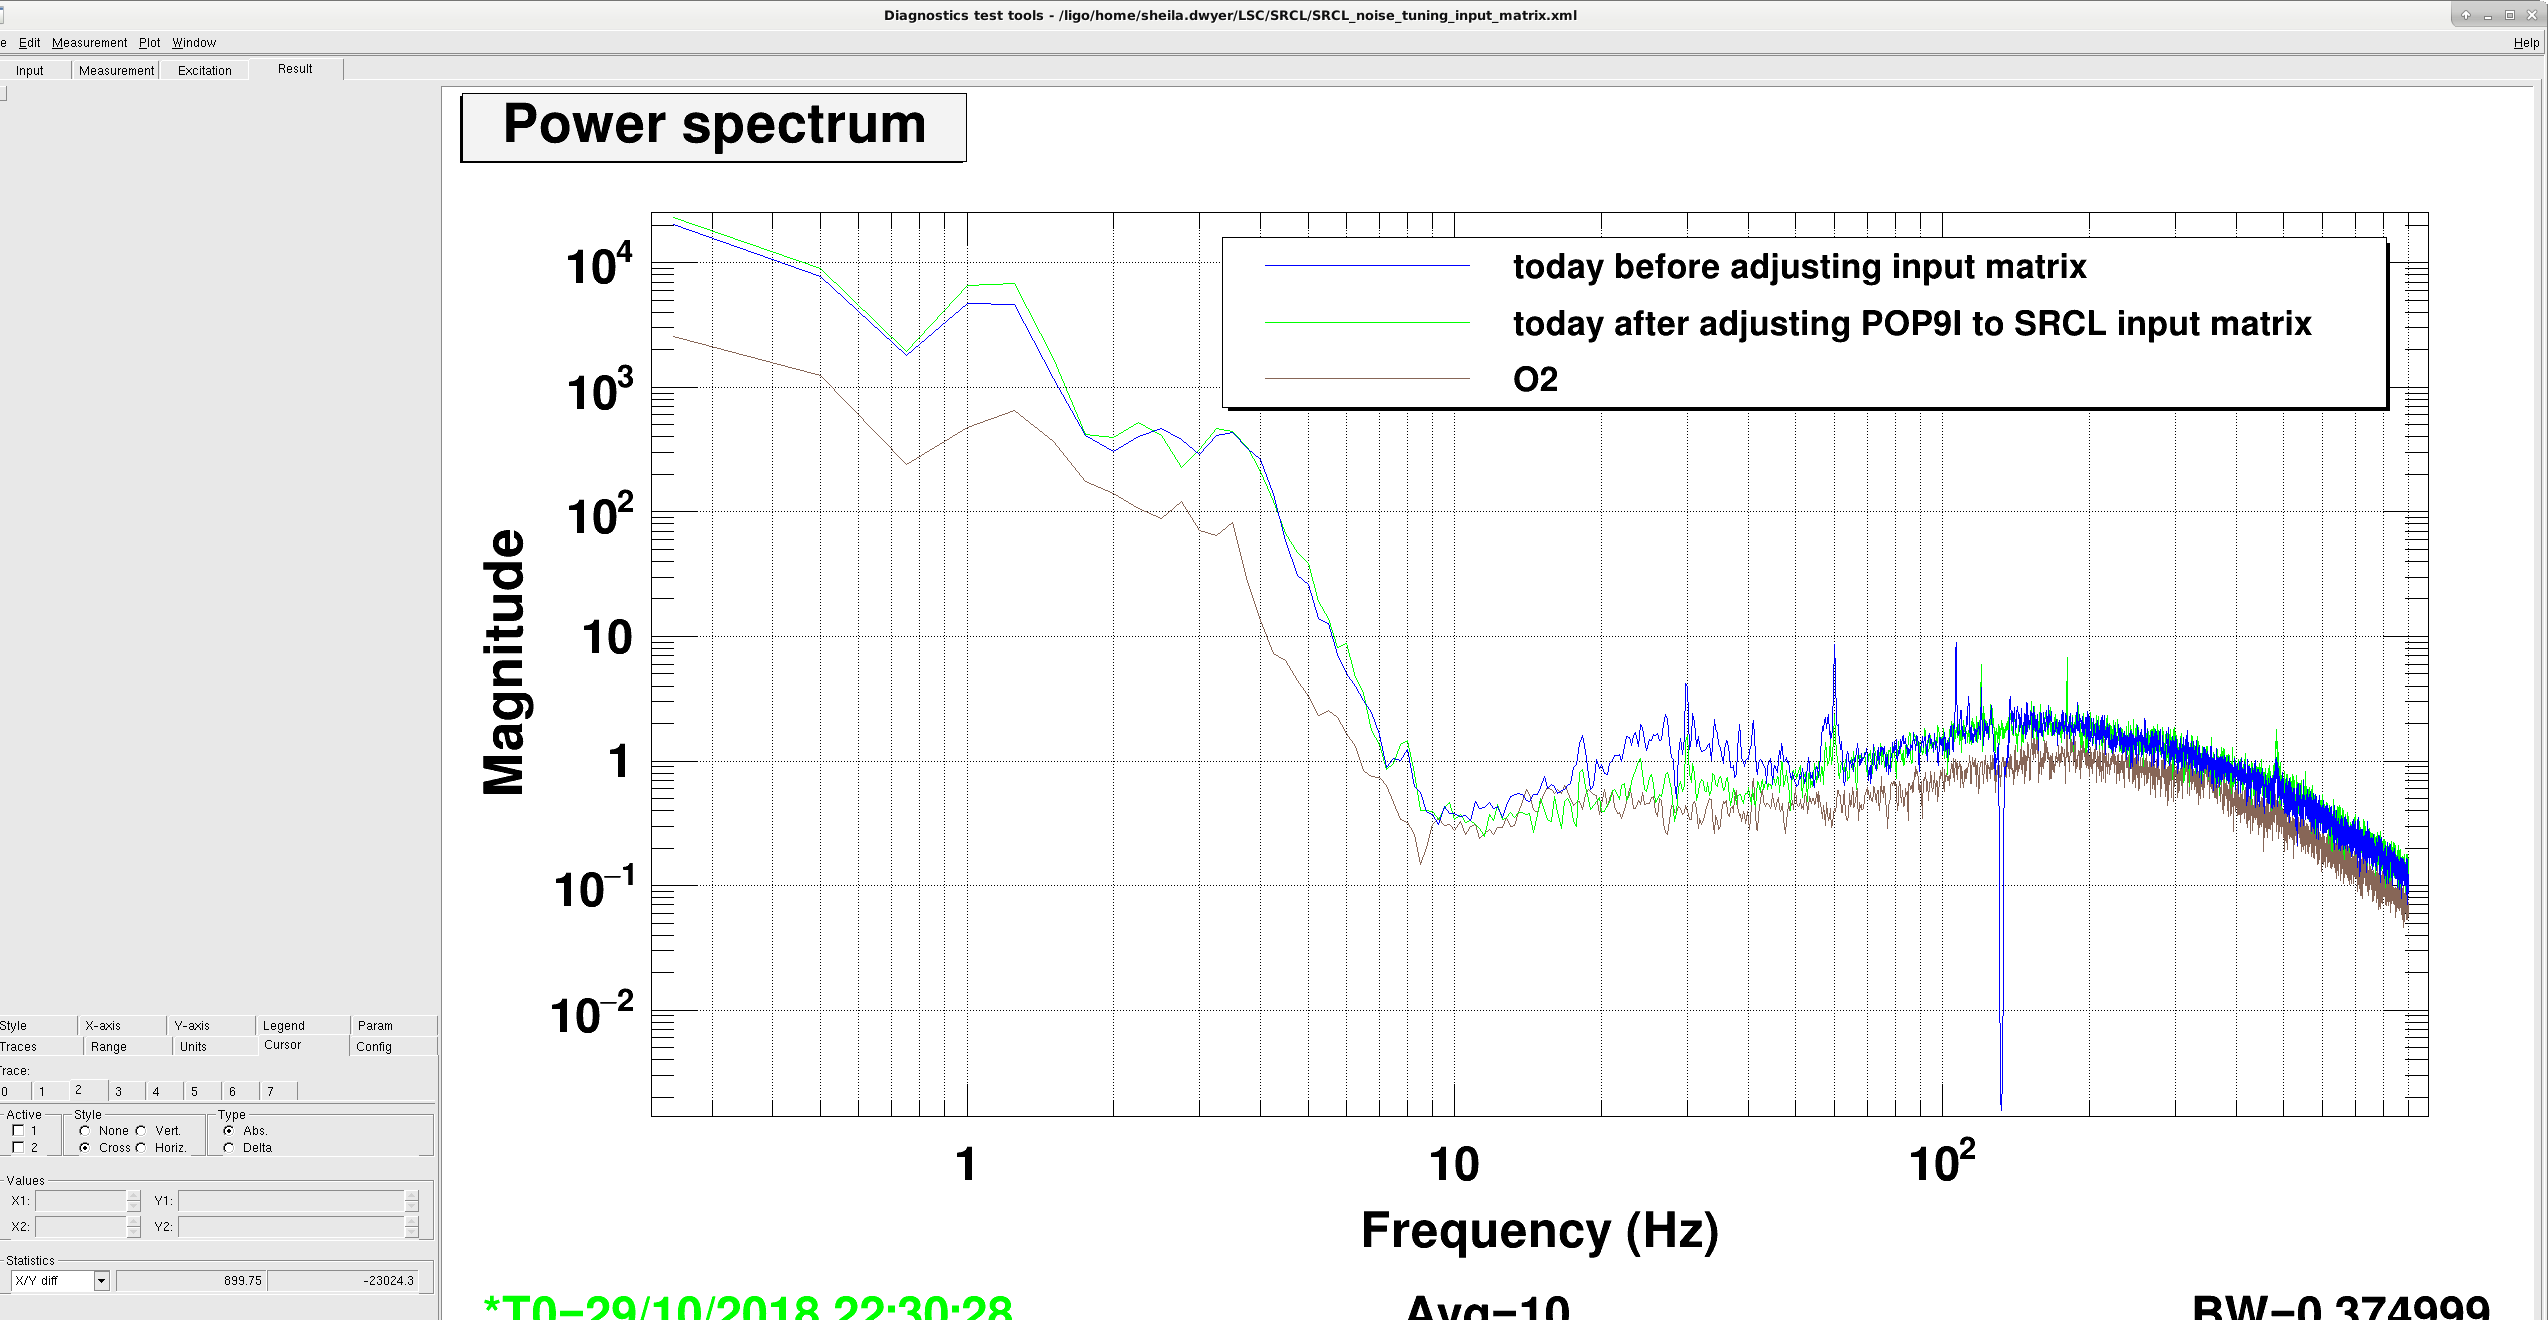
We have higher noise in SRCL than we did in O2, which is part of the reason why our SRCL noise contribution to the DARM noise is large.  We changed the input matrix element which should cancel the PRCL signal in SRCL using POP9I, and now the SRCL control signal is similar to what it was like during O2 at low frequencies. 

Details:

POP9I to SRCL input matrix:

We made an injection at 132 Hz into PRCL with notches engaged in PRCL and MICH, and measured the resonse of POP9I and POP45 I. We found that for the POP45I to SRCL input matrix element of 1.856 we should use a POP9I to SRCL element of 0.038 to cancel the PRCL contribution to SRCL, while the element in place was -0.01

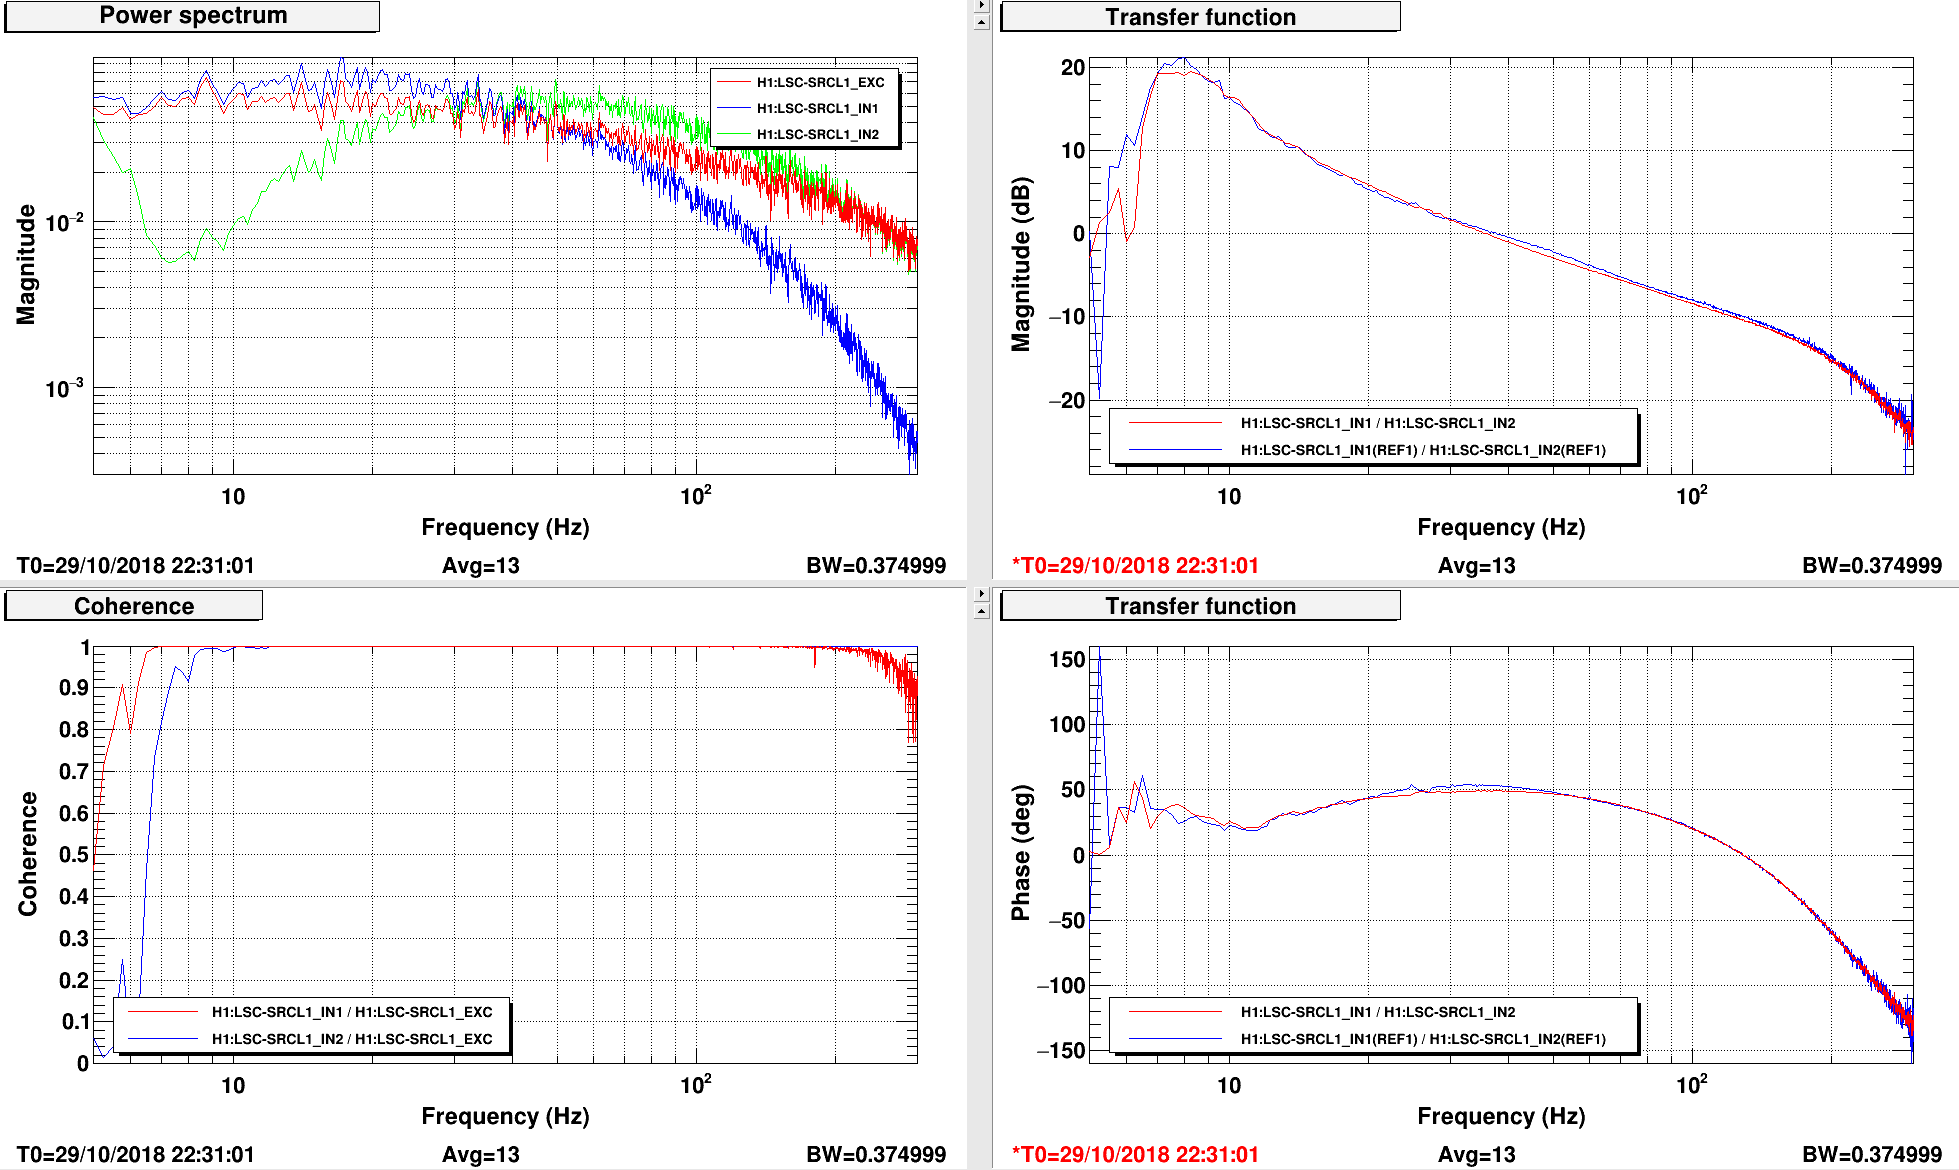
The first attached screenshot shows the improvement in the SRCL noise from 10 to 50 Hz when we retuned this input element.  The second attached screenshot shows a similar comparison for the control signal.  You can see that at high frequencies the SRCL control signal is still noisier than it was during O2, but that the noise from 40 Hz and below is now comparable. The third attached screenshot shows measurements of the SRCL OLG that Gabriele took before and after this change in the input matrix, there is some impact of the cross coupling from 20-50 Hz. 

Whitening gain:

A few weeks ago Keita found that one of our locklosses were due to ADC saturations in POP45, 44420, and detchar followed up 44521.  We reduced the POP45 whitening gain to avoid those locklosses.  Then Patrick Godwin and I found that the MICH residual motion was large because of a  boost missing in MICH 44693, and Hang put the boost back in 44703 I think that Hang may have also added a boost to SRCL.  

I looked at the RMS of the ADC inputs for POP45 I was 71 ADC counts while Q was 41 counts.  I have increased the whitening gain by 21dB and compensated with a -21dB filter in the digital path.  We have locked once since then but quickly lost lock because of the earthquake in the pacific near El Salvador.  

Note: I didn't reset the dark offsets for POP45, which I should have before we relocked.  Edi: dark offsets updated this morning. Increasing the whitening gain for POP45 didn't change the sensing noise much.  

Images attached to this report
LHO General
patrick.thomas@LIGO.ORG - posted 16:23, Monday 29 October 2018 (44895)
Ops Shift Summary
14:58 UTC Vanessa to LVEA
15:02 UTC Restarted video2
15:07 UTC Restarted video4
15:23 UTC Ran dust monitor check. All report OK.
15:28 UTC Call on phone on wall in back of control room. Static and beeping.
16:00 UTC Morning meeting
16:21 UTC Vanessa to end X, end Y
16:40 - 17:04 UTC Thomas to LVEA to test HWS equipment (not going on table)
16:42 - 17:17 UTC Gerardo to mid Y to take picture
16:55 UTC Bubba to end Y chiller yard to check fault
17:33 - 18:08 UTC Terry to squeezer bay
18:32 - 18:53 UTC Terry to squeezer bay
19:34 UTC Phone call alert for Hanford monthly testing
21:00 UTC Terry to squeezer bay
22:31 - 22:39 UTC Filiberto and Thomas to LVEA to inspect HWS electronics
H1 TCS (TCS)
patrick.thomas@LIGO.ORG - posted 16:21, Monday 29 October 2018 - last comment - 17:56, Monday 29 October 2018(44894)
TCS Chiller Water Level Top-Off - Weekly
FAMIS 11463

Added 1250 mL to TCSY chiller.
Comments related to this report
georgia.mansell@LIGO.ORG - 17:56, Monday 29 October 2018 (44899)

This seemed like a lot of water, so TVo and I went out to CO2Y table to check for leaks. We searched around but did not find a leak.

H1 CDS
david.barker@LIGO.ORG - posted 16:18, Monday 29 October 2018 (44890)
preparation for 20bit DAC install on h1susetmx

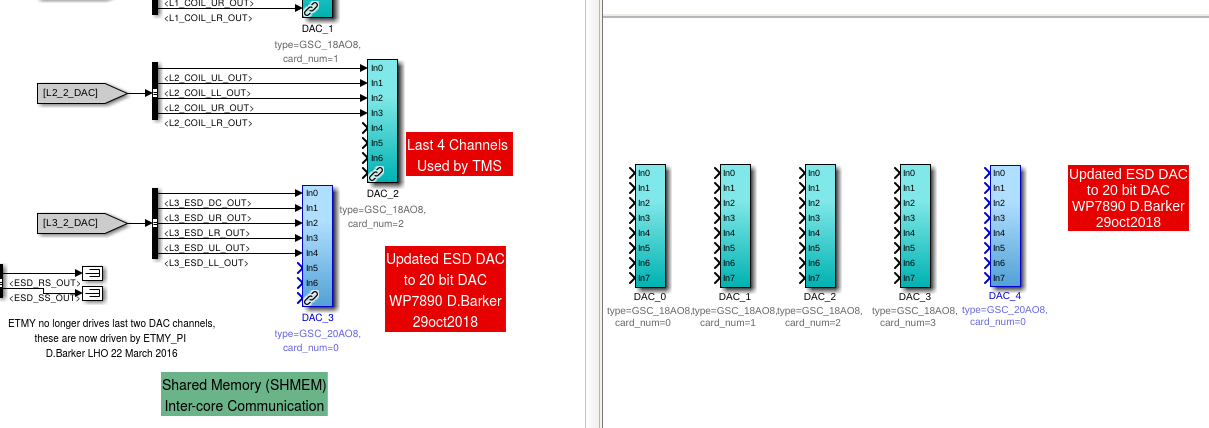
Attached image shows the model changes I have made to h1iopsusex.mdl and h1susetmx.mdl to replace the 5th 18bit-DAC with a 20bit-DAC. I've changed the color of the part so it stands out as a different type of DAC.

In order to compile the code, I had to rewind some code prior to Jenne's latest TRIG_IFO changes. This was done using a SVN backwards merge. This table shows filename, Jenne's latest version number and the version I went back to

QUAD_MASTER.mdl r18073 r17922
FOUROSEM_DAMPED_STAGE_MASTER_WITH_DAMP_MODE.mdl r18073 r17922
FOUROSEM_STARGE_MASTER_OPLEV_TIDAL.mdl r18073 r17922

All files are in svn/common/models

I also edited sus/h1/models/h1susetmx.mdl to:

Remove the TRIG_IFO IPC part which connected to the new input port on the QUAD_MASTER

Changed DAC_3 from 18bit-DAC to 20bit-DAC

To re-install Jenne's code, we just need to "svn revert" the common models and edit h1susetmx.mdl to add the new RFM-IPC receiver and connect it to the QUAD_MASTER block.

Images attached to this report
H1 CAL
gabriele.vajente@LIGO.ORG - posted 16:08, Monday 29 October 2018 - last comment - 15:42, Tuesday 30 October 2018(44891)
Updated suspension control filters for SRM, PRM and BS

I updated the control filters in CAL_SUM_PRCL, CAL_SUM_SRCL and CAL_SUM_BS to match what is now used in the suspension models.

Changes have been accepted into the SDF.

Comments related to this report
gabriele.vajente@LIGO.ORG - 11:55, Tuesday 30 October 2018 (44907)

I also updated the optical gains in the error signal calibration. Differences were small (within 20-30%)

gabriele.vajente@LIGO.ORG - 15:42, Tuesday 30 October 2018 (44923)

The M1 calibration path for PRCL is limited by numerical noise, which appears as a spurious increase of the high frequency noise floor in the calibrated PRCL signal.

To prevent this, I switched off the M1 paths in PRCL, SRCL and MICH. This means that the low frequency calibration might be a bit wrong (what low frequency means depends on the cross-over frequency between M3/M2 and M1)

H1 ISC (ISC, SEI)
hang.yu@LIGO.ORG - posted 16:02, Monday 29 October 2018 (44888)
Adding boosts to the HARD loops; O3 vs O2 OPLEV comparison

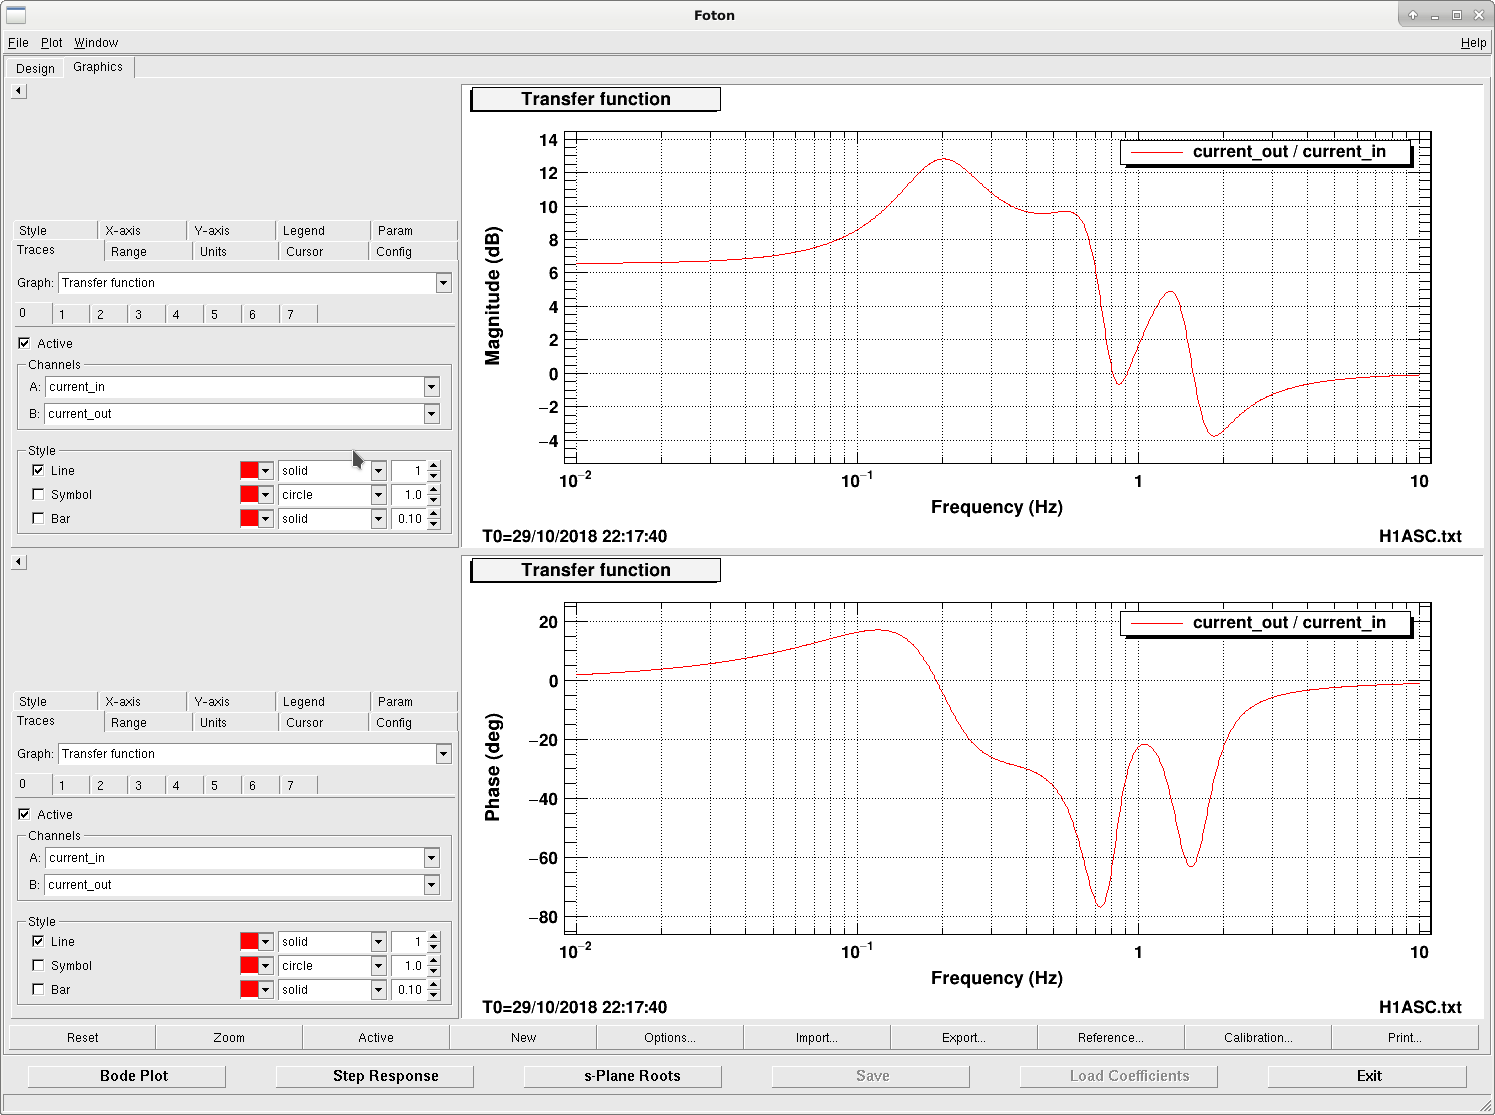
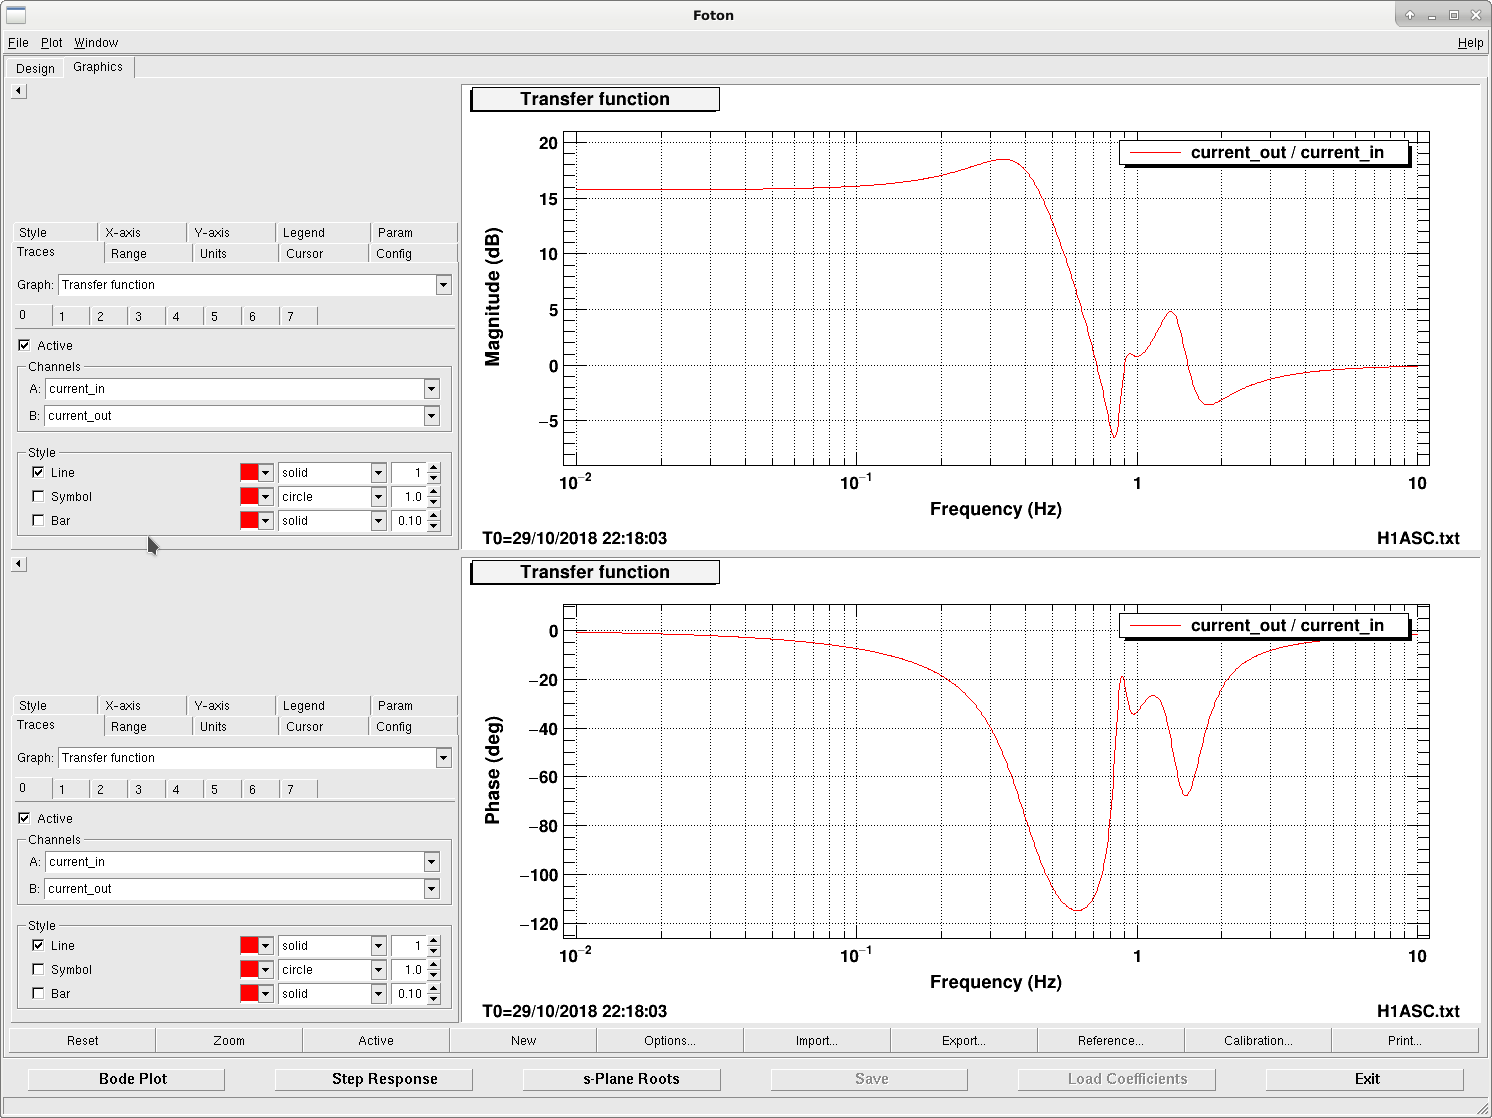
We tried to add in extra boosts to the C/DHARD P/Y loops so that we could reduce the amount of bilinear noise couplings whose low freq coupling coefficients were modulated by alignment fluctuations. We added the boosts without increasing the loop UGFs, so that we would not increase the amount of ASC noise contaminating DARM.

In the first two plots we show the new boost filters we used. The first one is for C/D HARD PIT and the second one is for C/D HARD YAW. Mostly they are designed to invert the 10 W sus plant (but with lower Q for the resonances than those from the sus plants; hopefully this should make them more robust against power fluctuations which modifies the plant).

Those filters are named as "boost10W" and are engaged in the LOWNOISE_ASC state.

=============================================================================

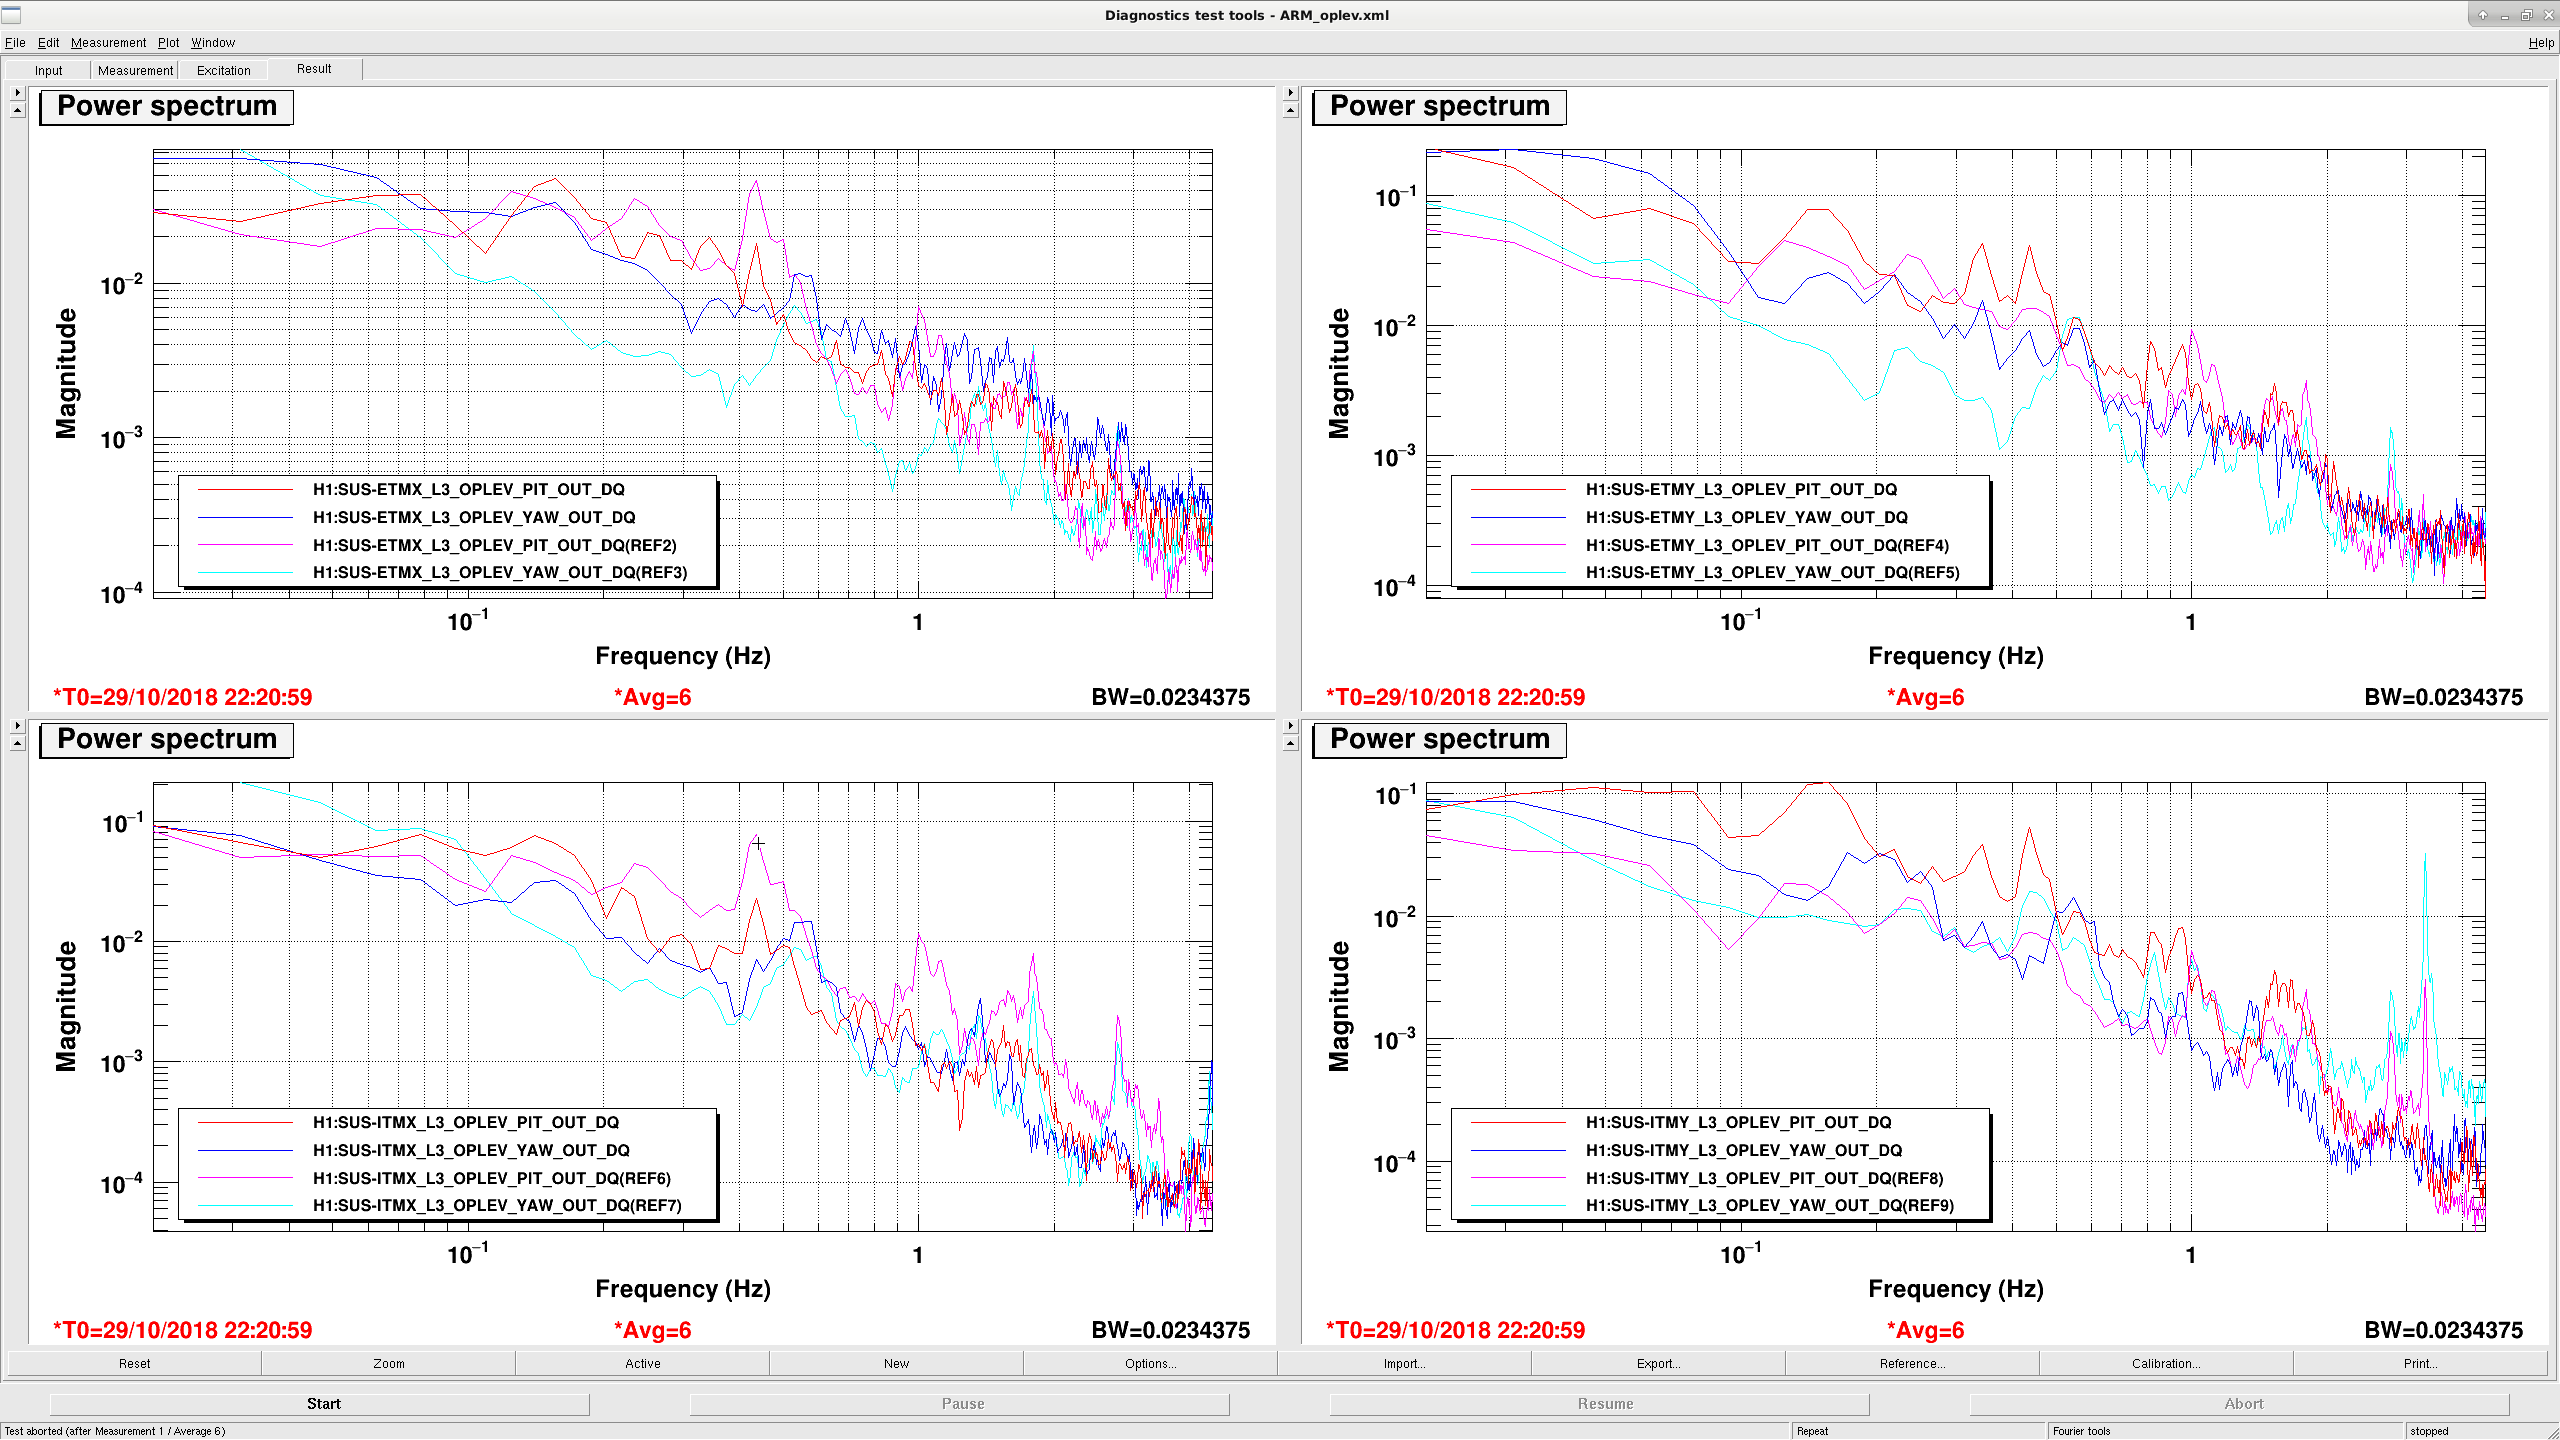
We also tried to compare the test masses' angular motion between now and O2 using oplev's.

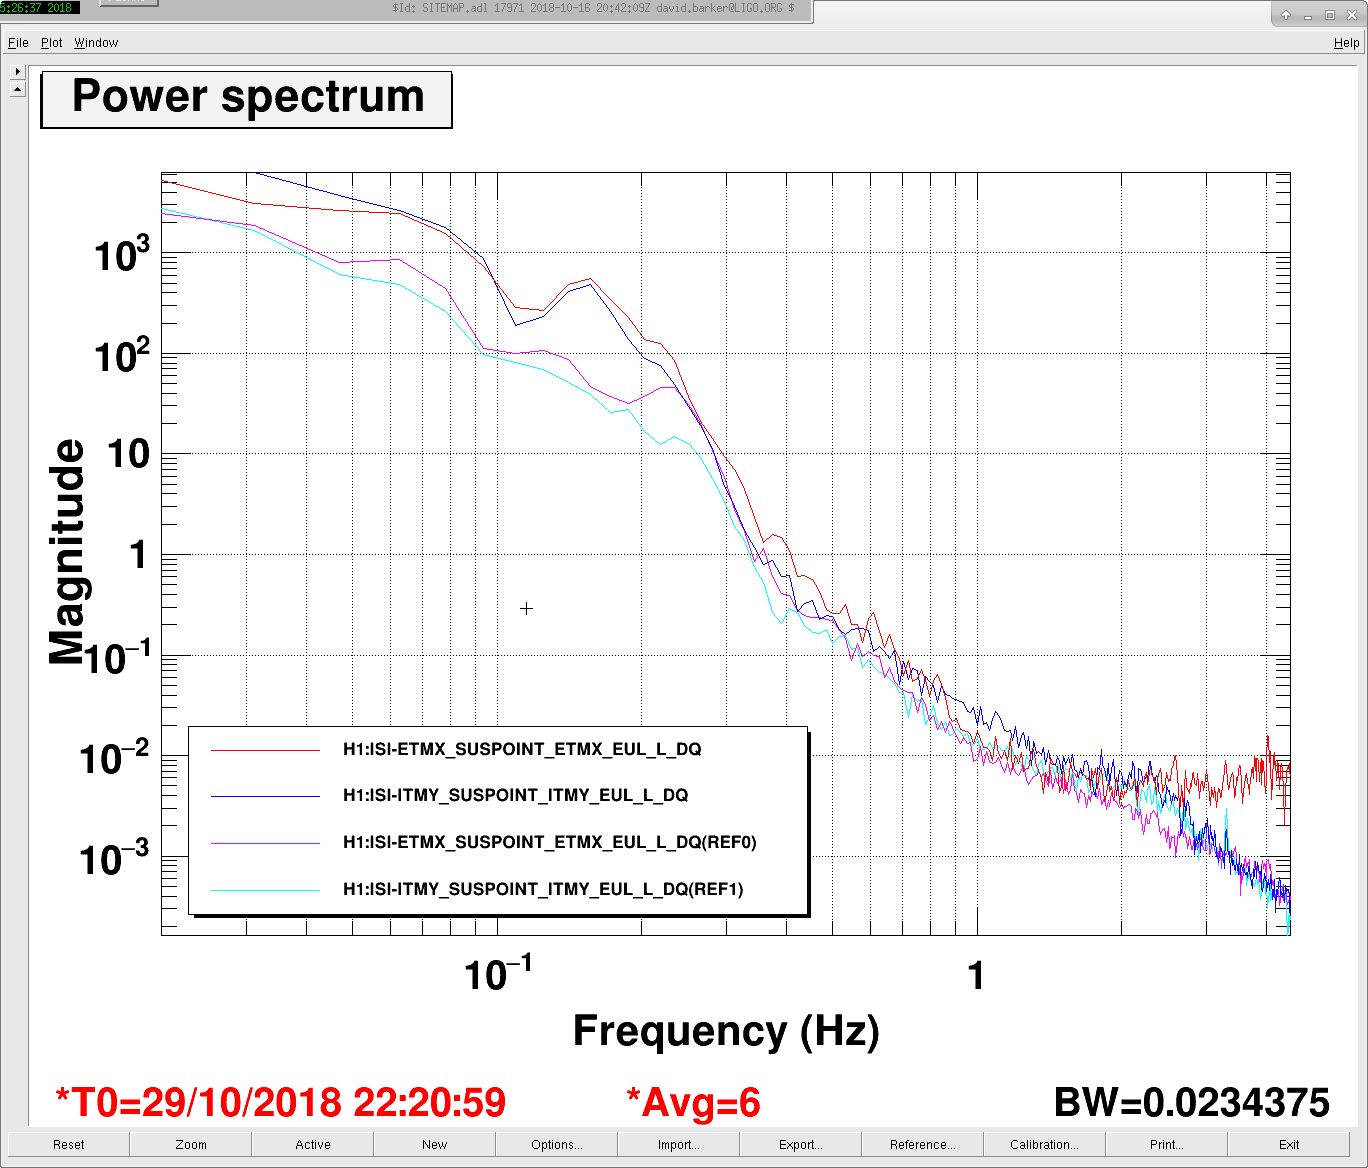
Please see the third plot for the comparison of the OPLEVs' outputs, and the forth plot for the ground motions. The reference traces (pink/cyan) are from O2 (8/8/2017 11:00:00 UTC), and the red/blue ones are from today.

Notice that the ground moves x10 times more below 0.2 Hz now than O2 due to the high microseismic motion. On the other hand, from the oplevs the test masses' pitch motion are comparable between now and O2. For XARM we actually improved the pitch motion. For ETMY it moves about factor 2 more than the O2 reference, yet given the fact that the input noise is 10 times higher, our current ETMY residual motion is still improved. For IY, the excess motion seemed to be consistent with the excess input motion. This is also the case for YAW, where the current excess motion is consistent with the excess ground motion input.

Overall, our current ASC + ISIFF performance should be satisfying. 

Images attached to this report
H1 ISC
gabriele.vajente@LIGO.ORG - posted 15:36, Monday 29 October 2018 - last comment - 15:16, Tuesday 30 October 2018(44886)
Modulation of SRCL coupling due to angular motion

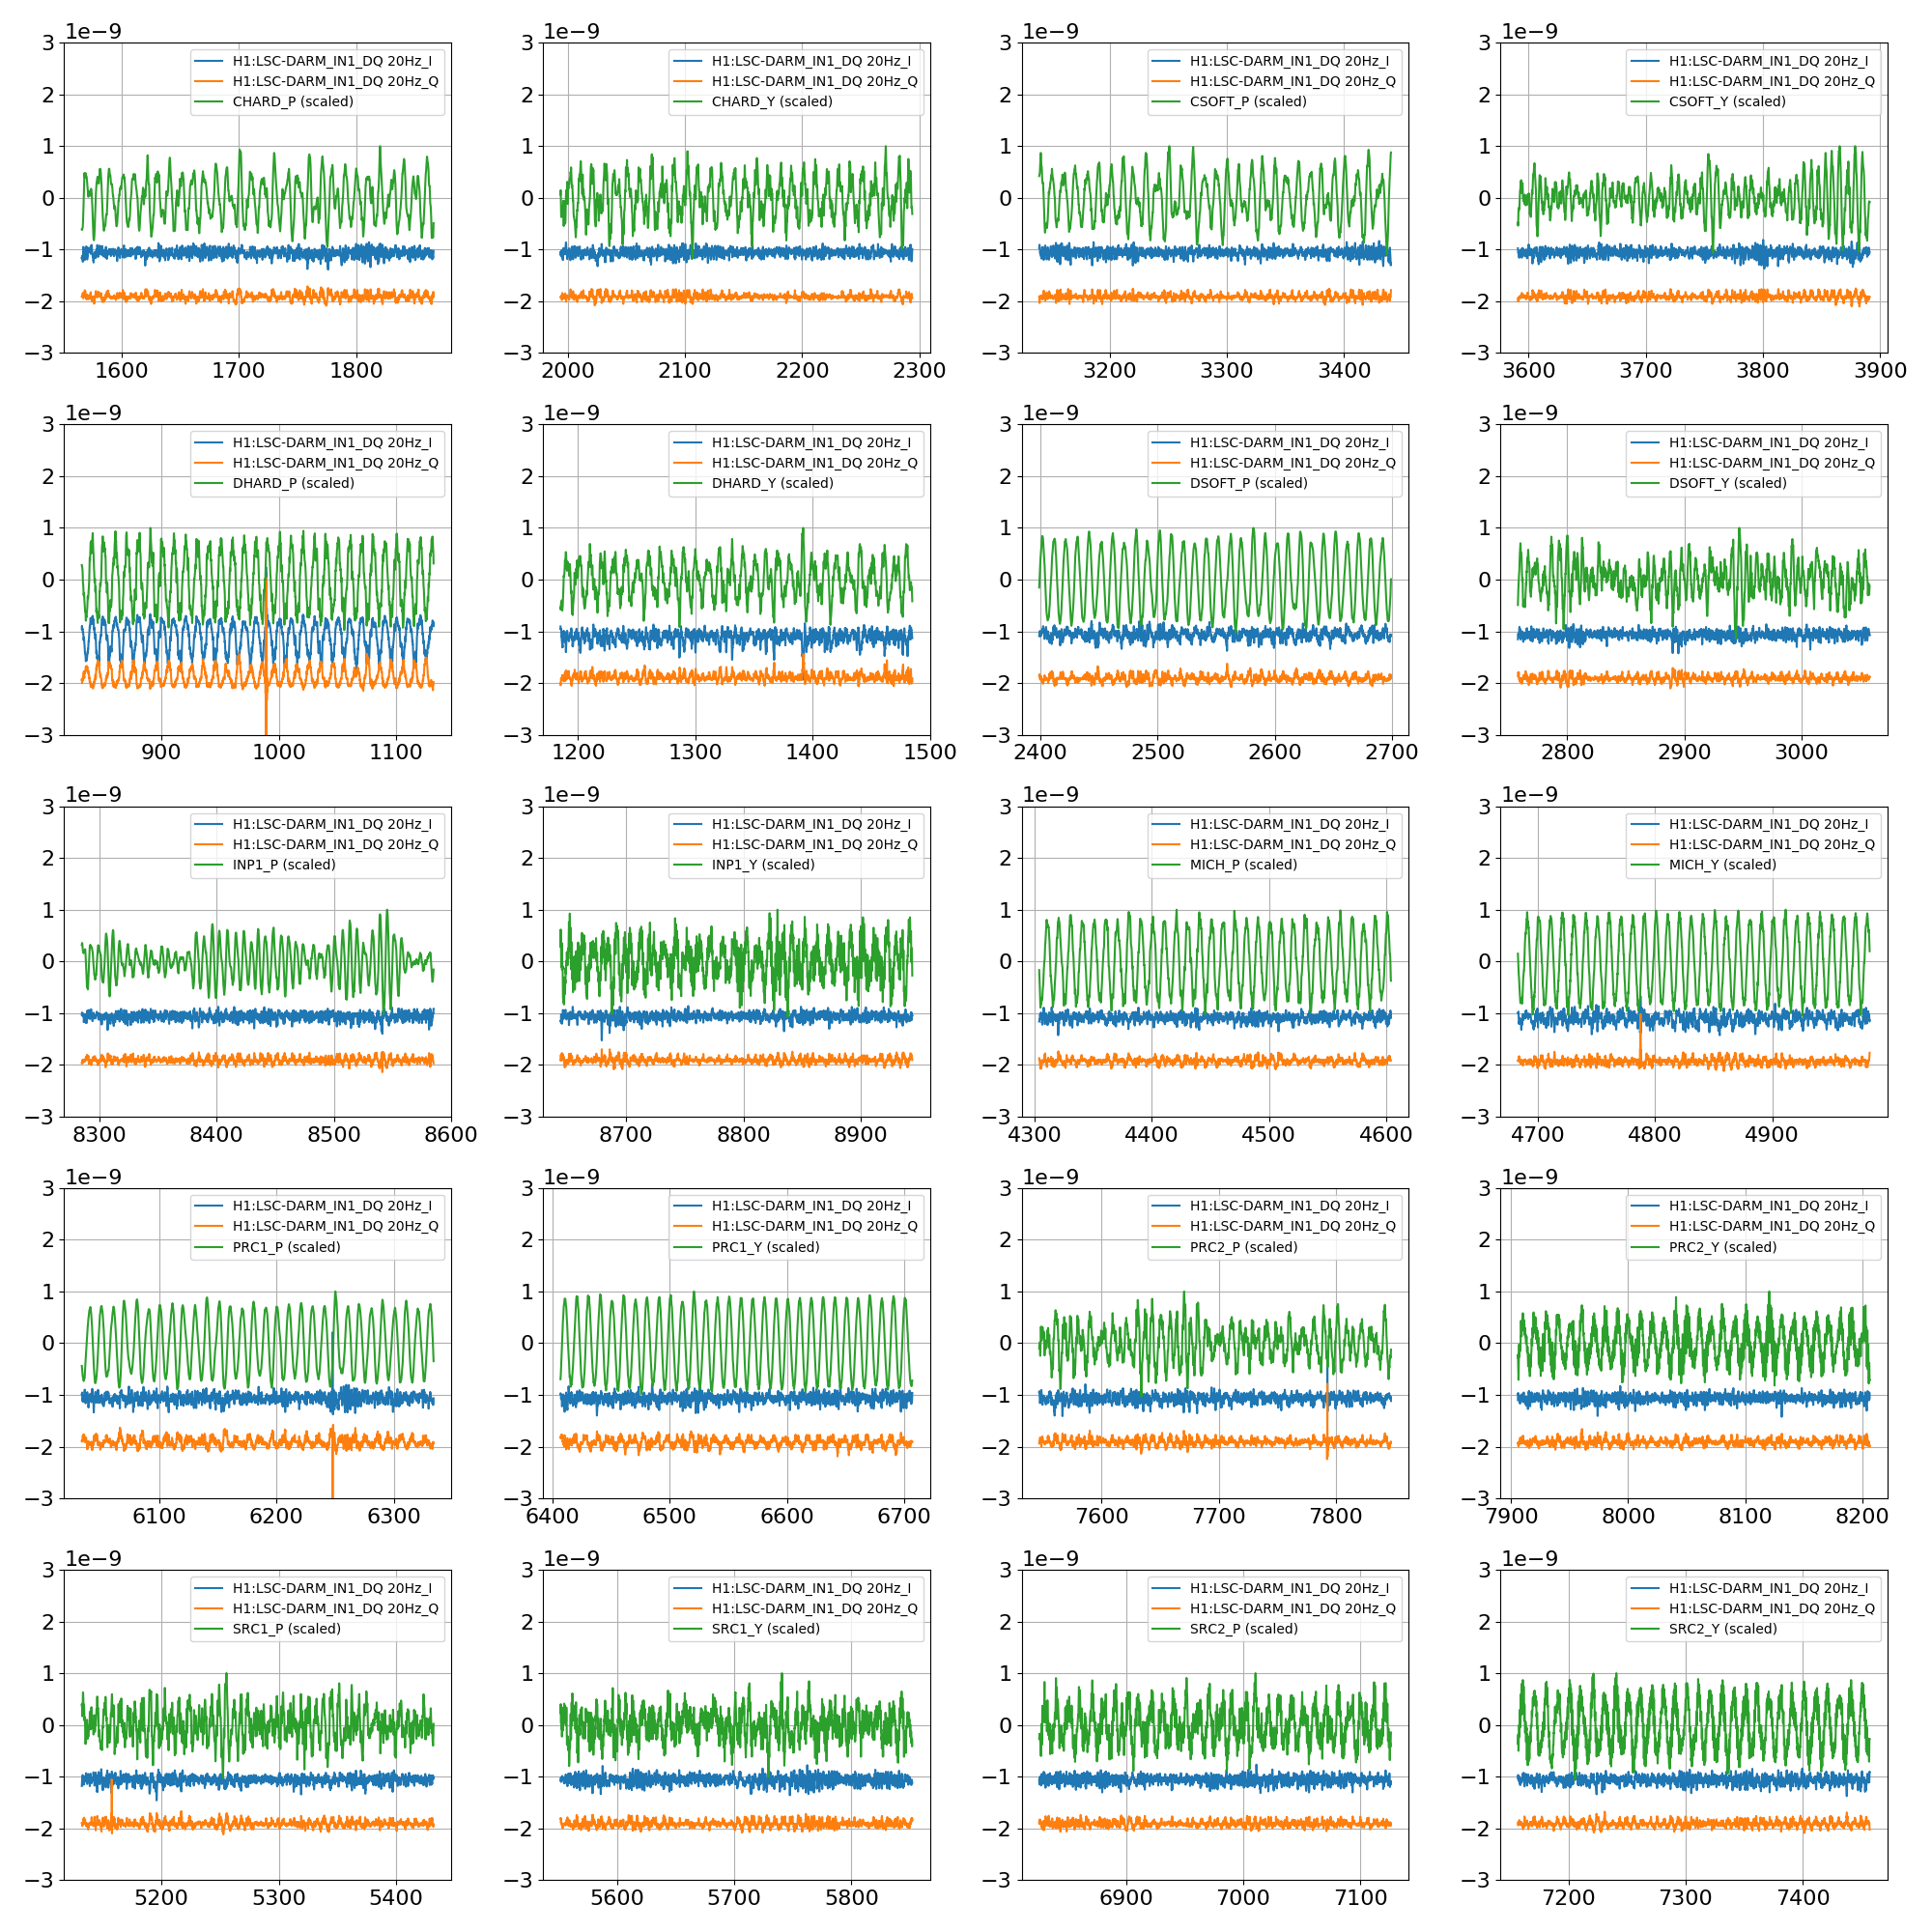
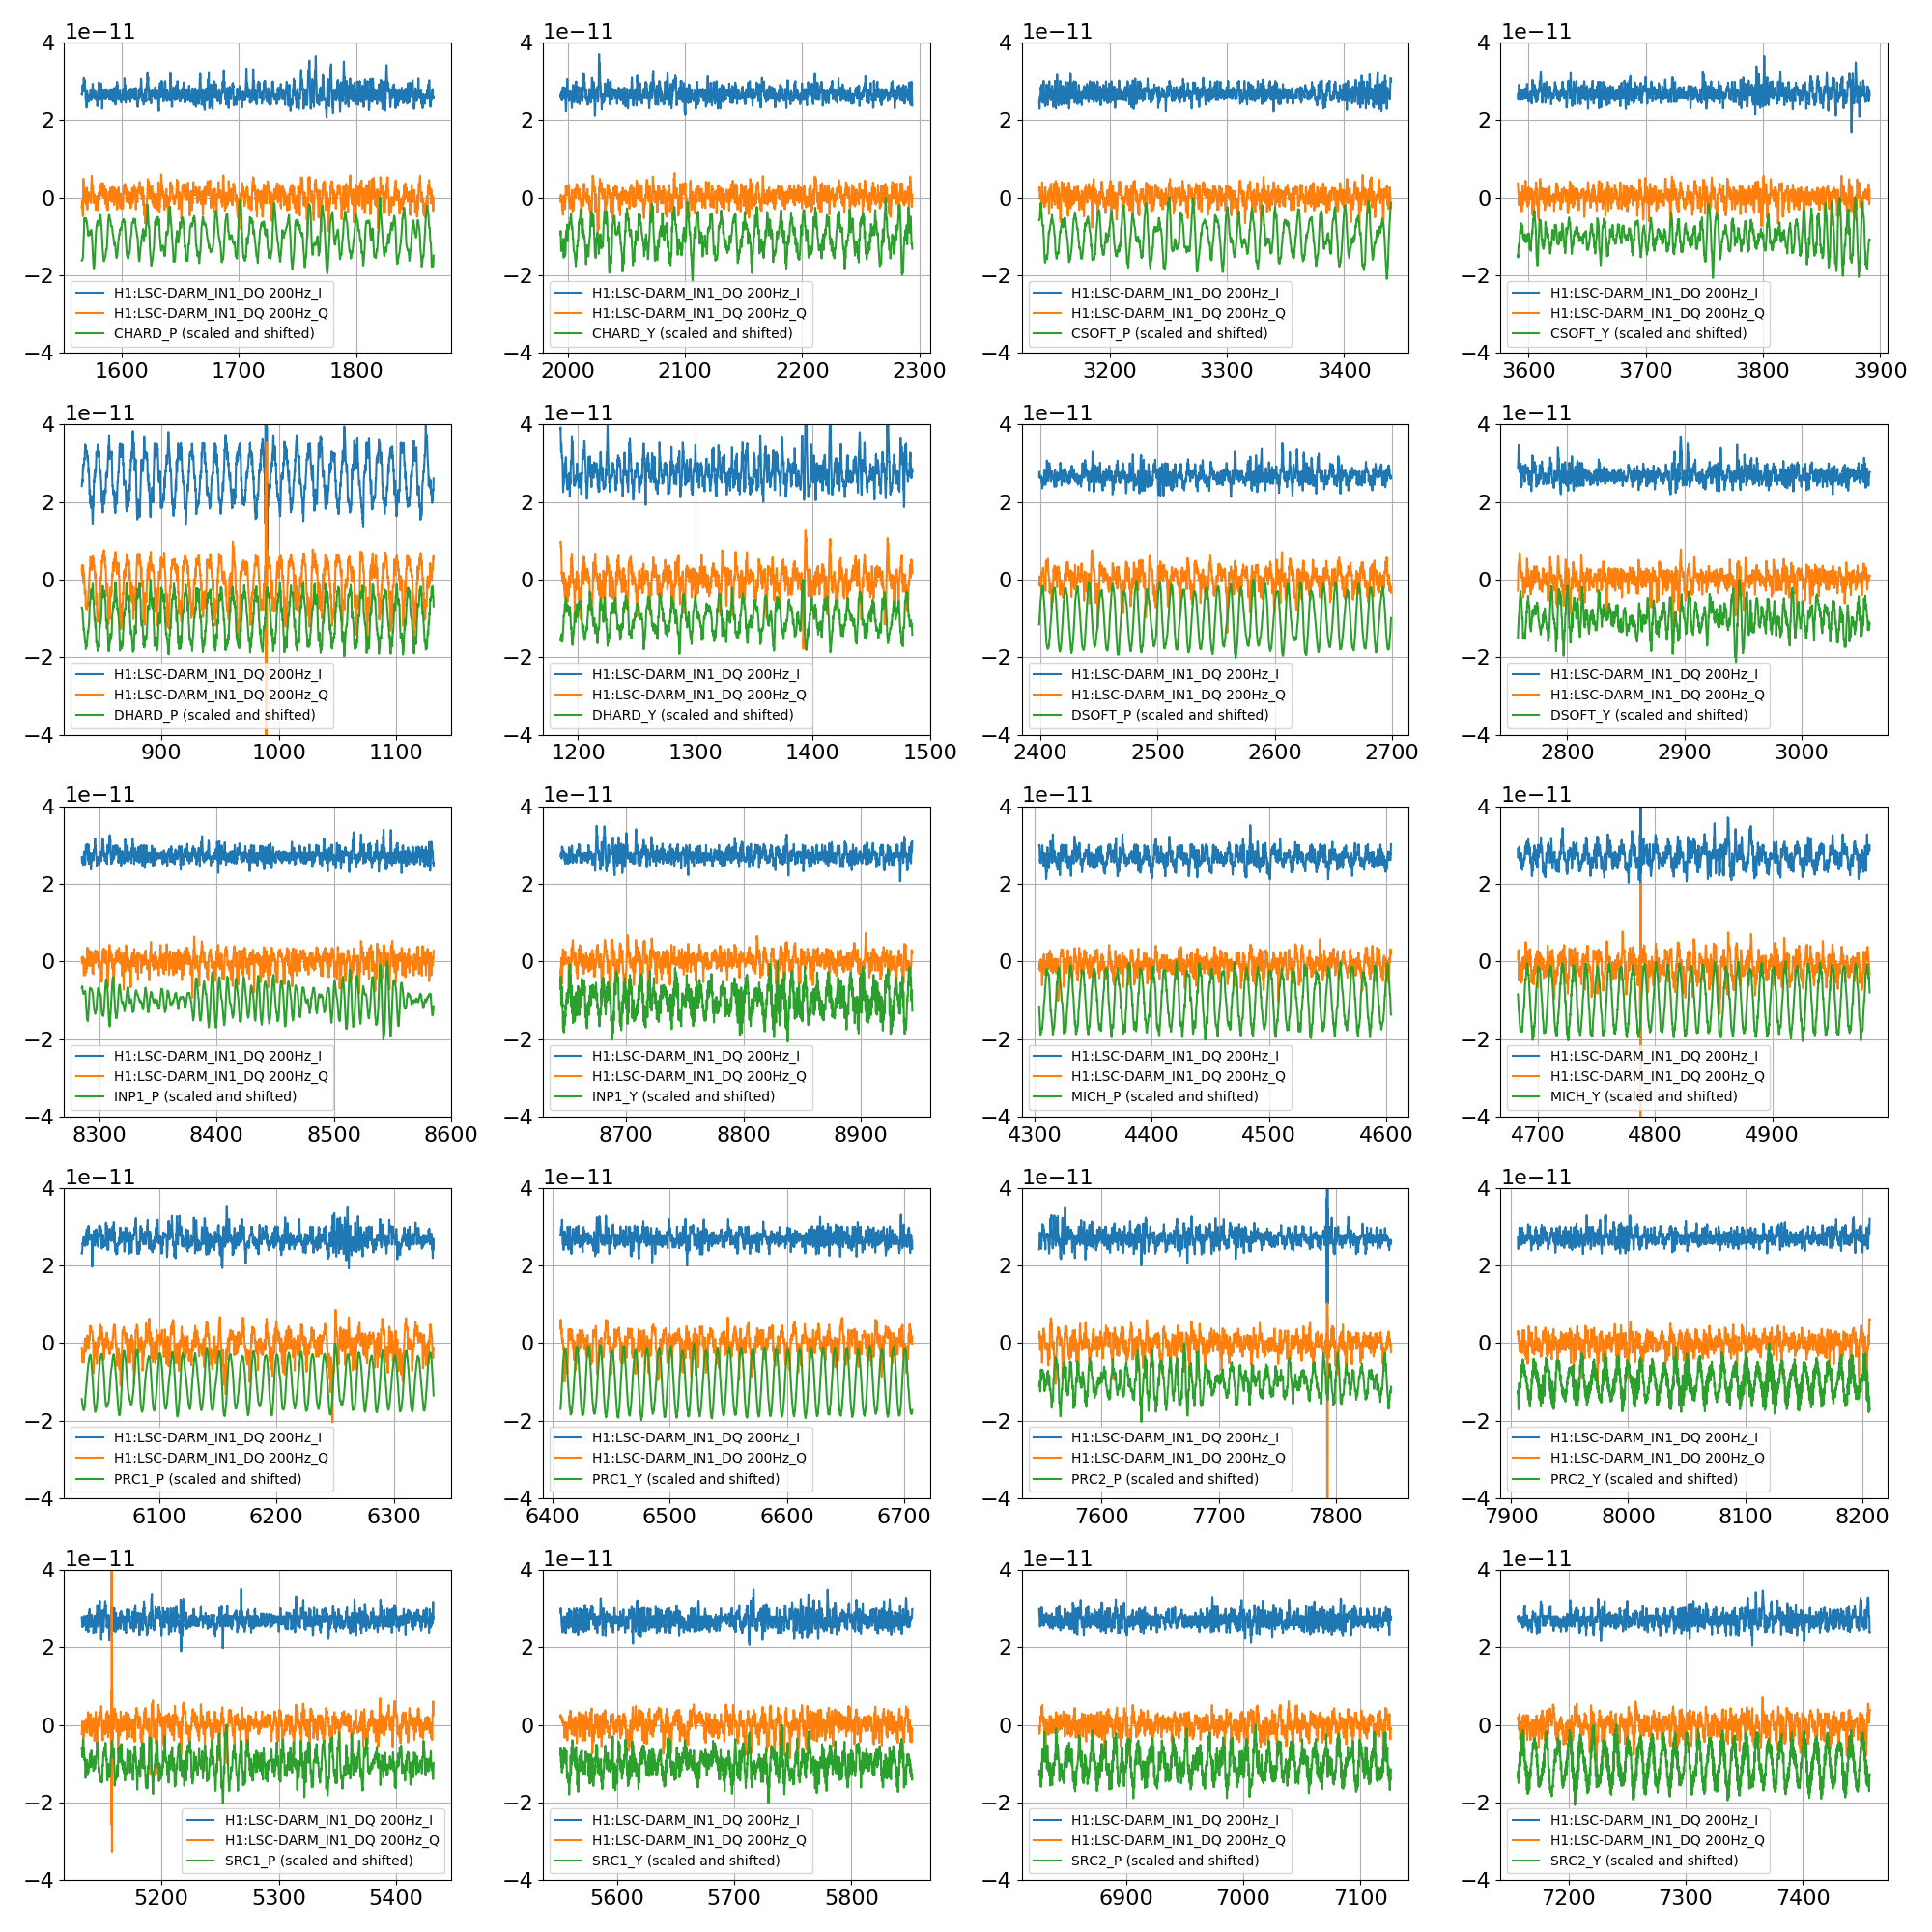
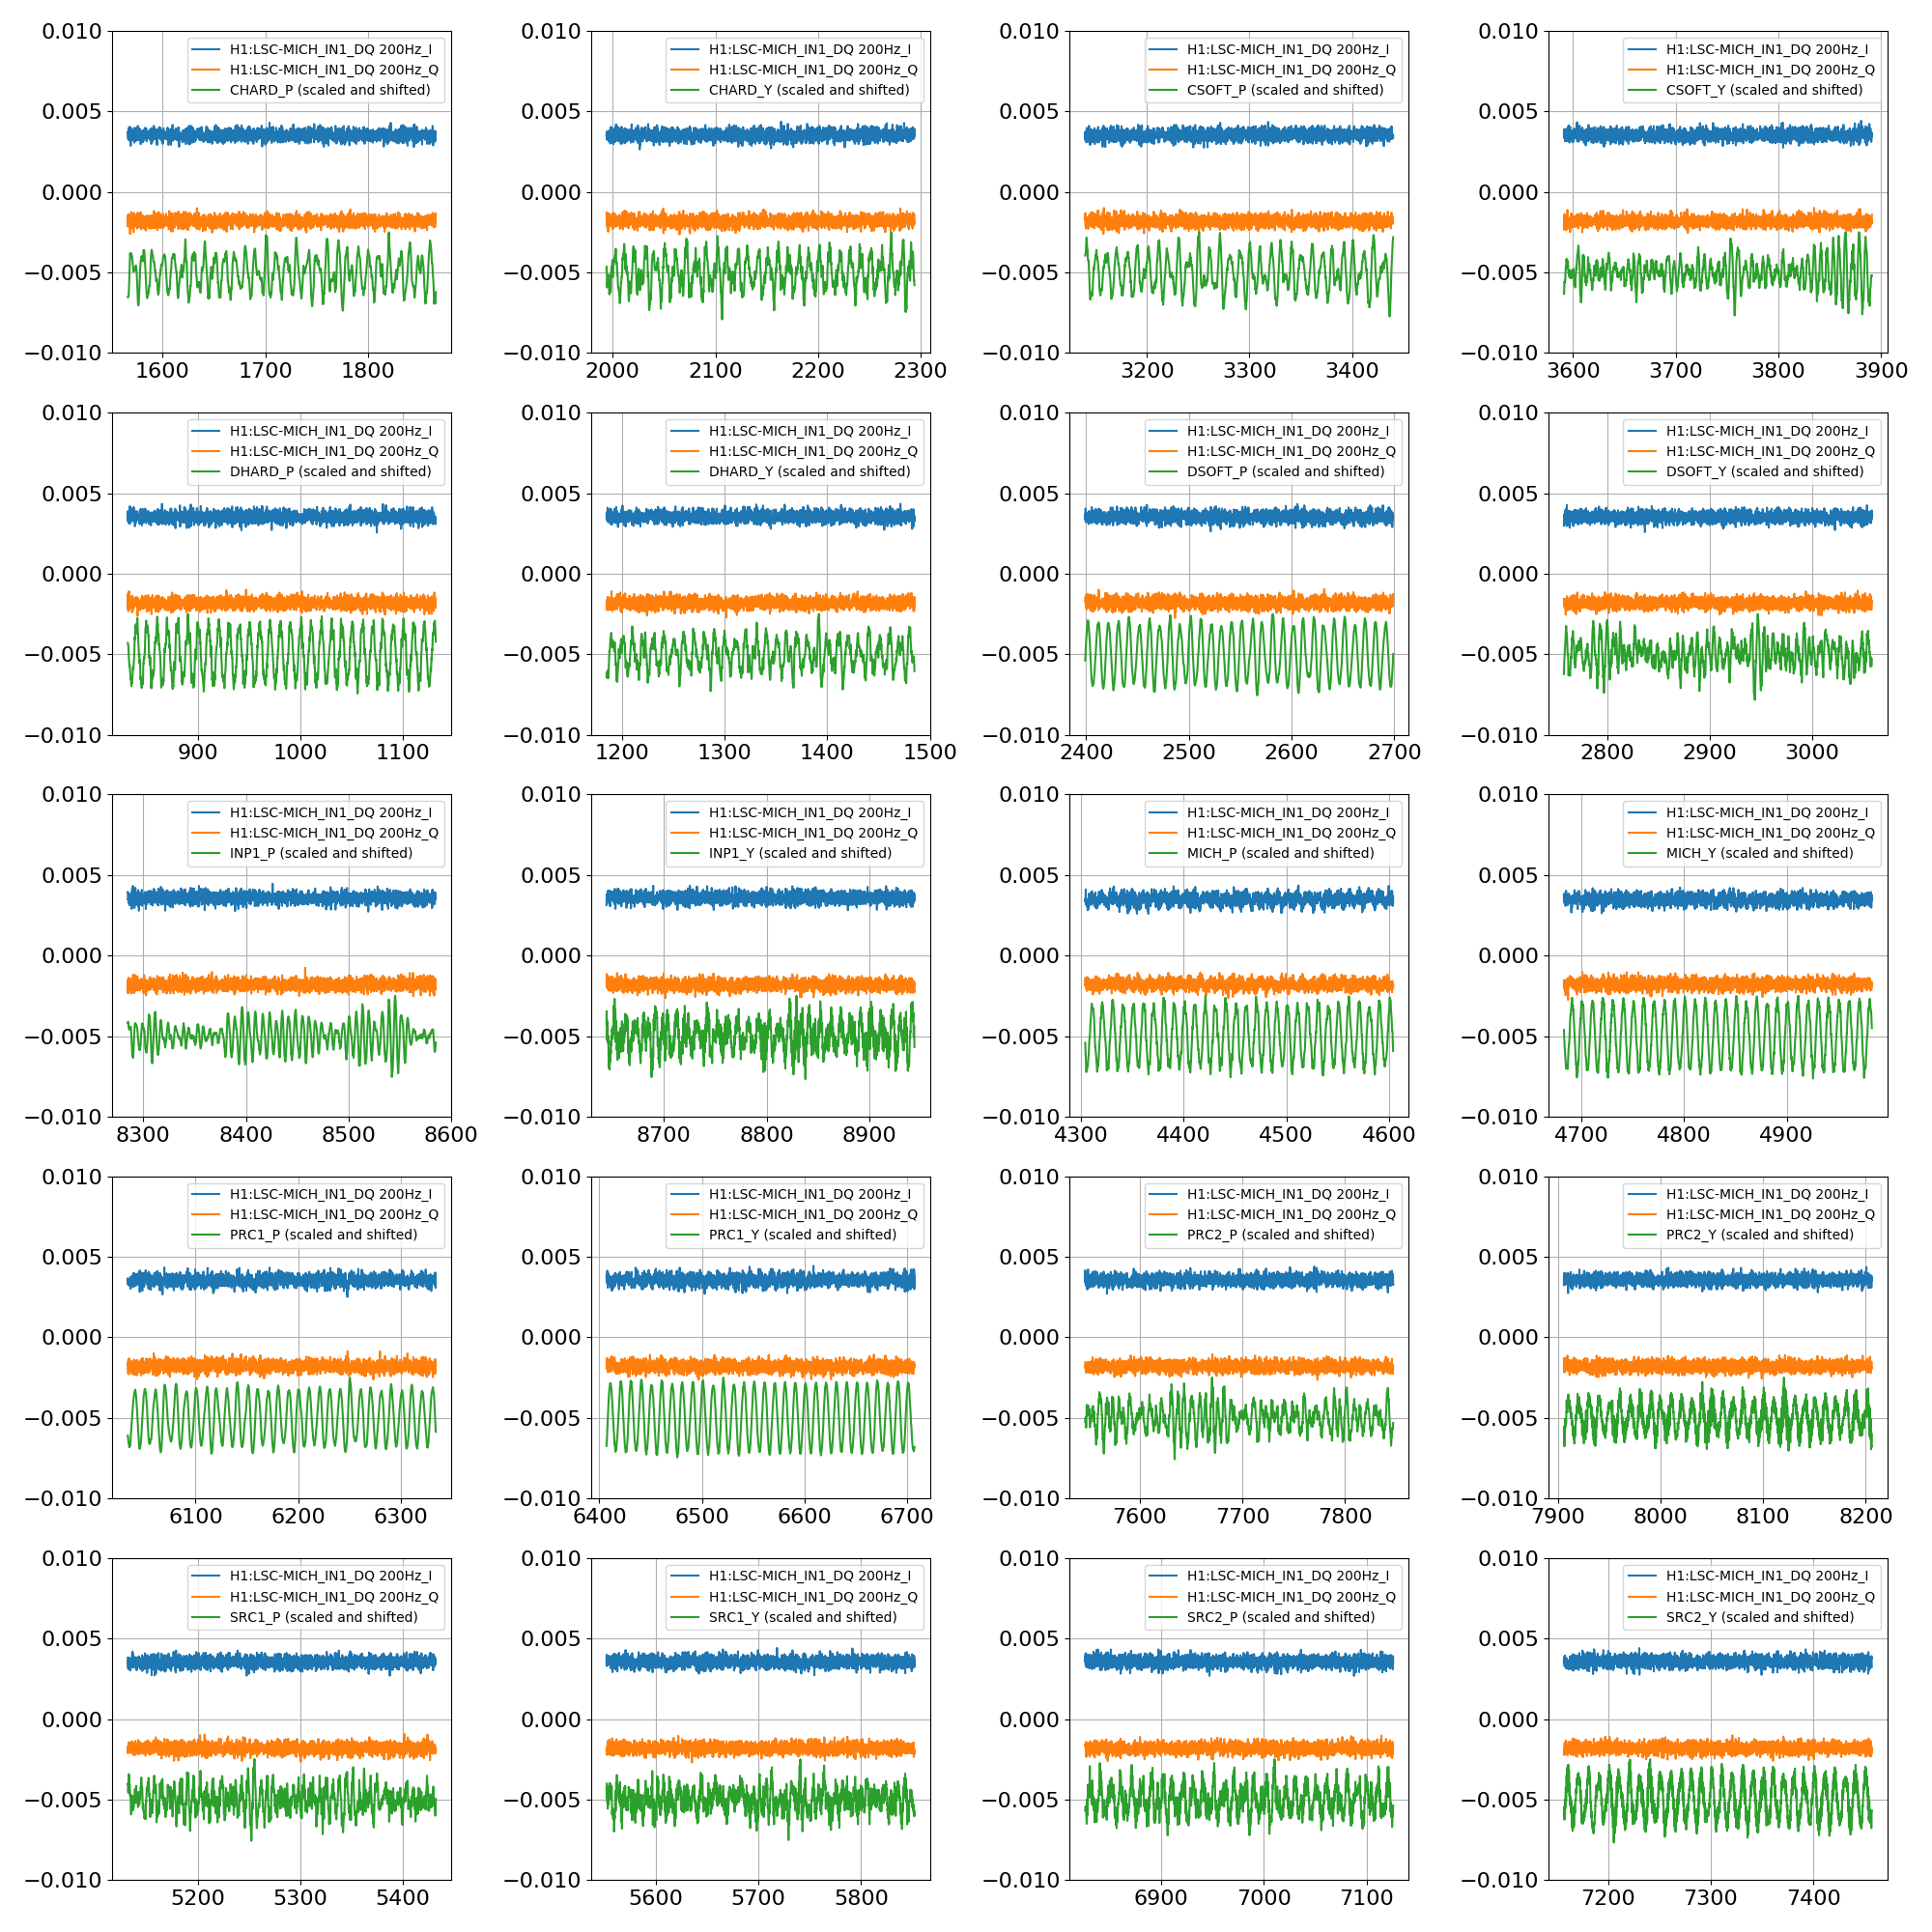
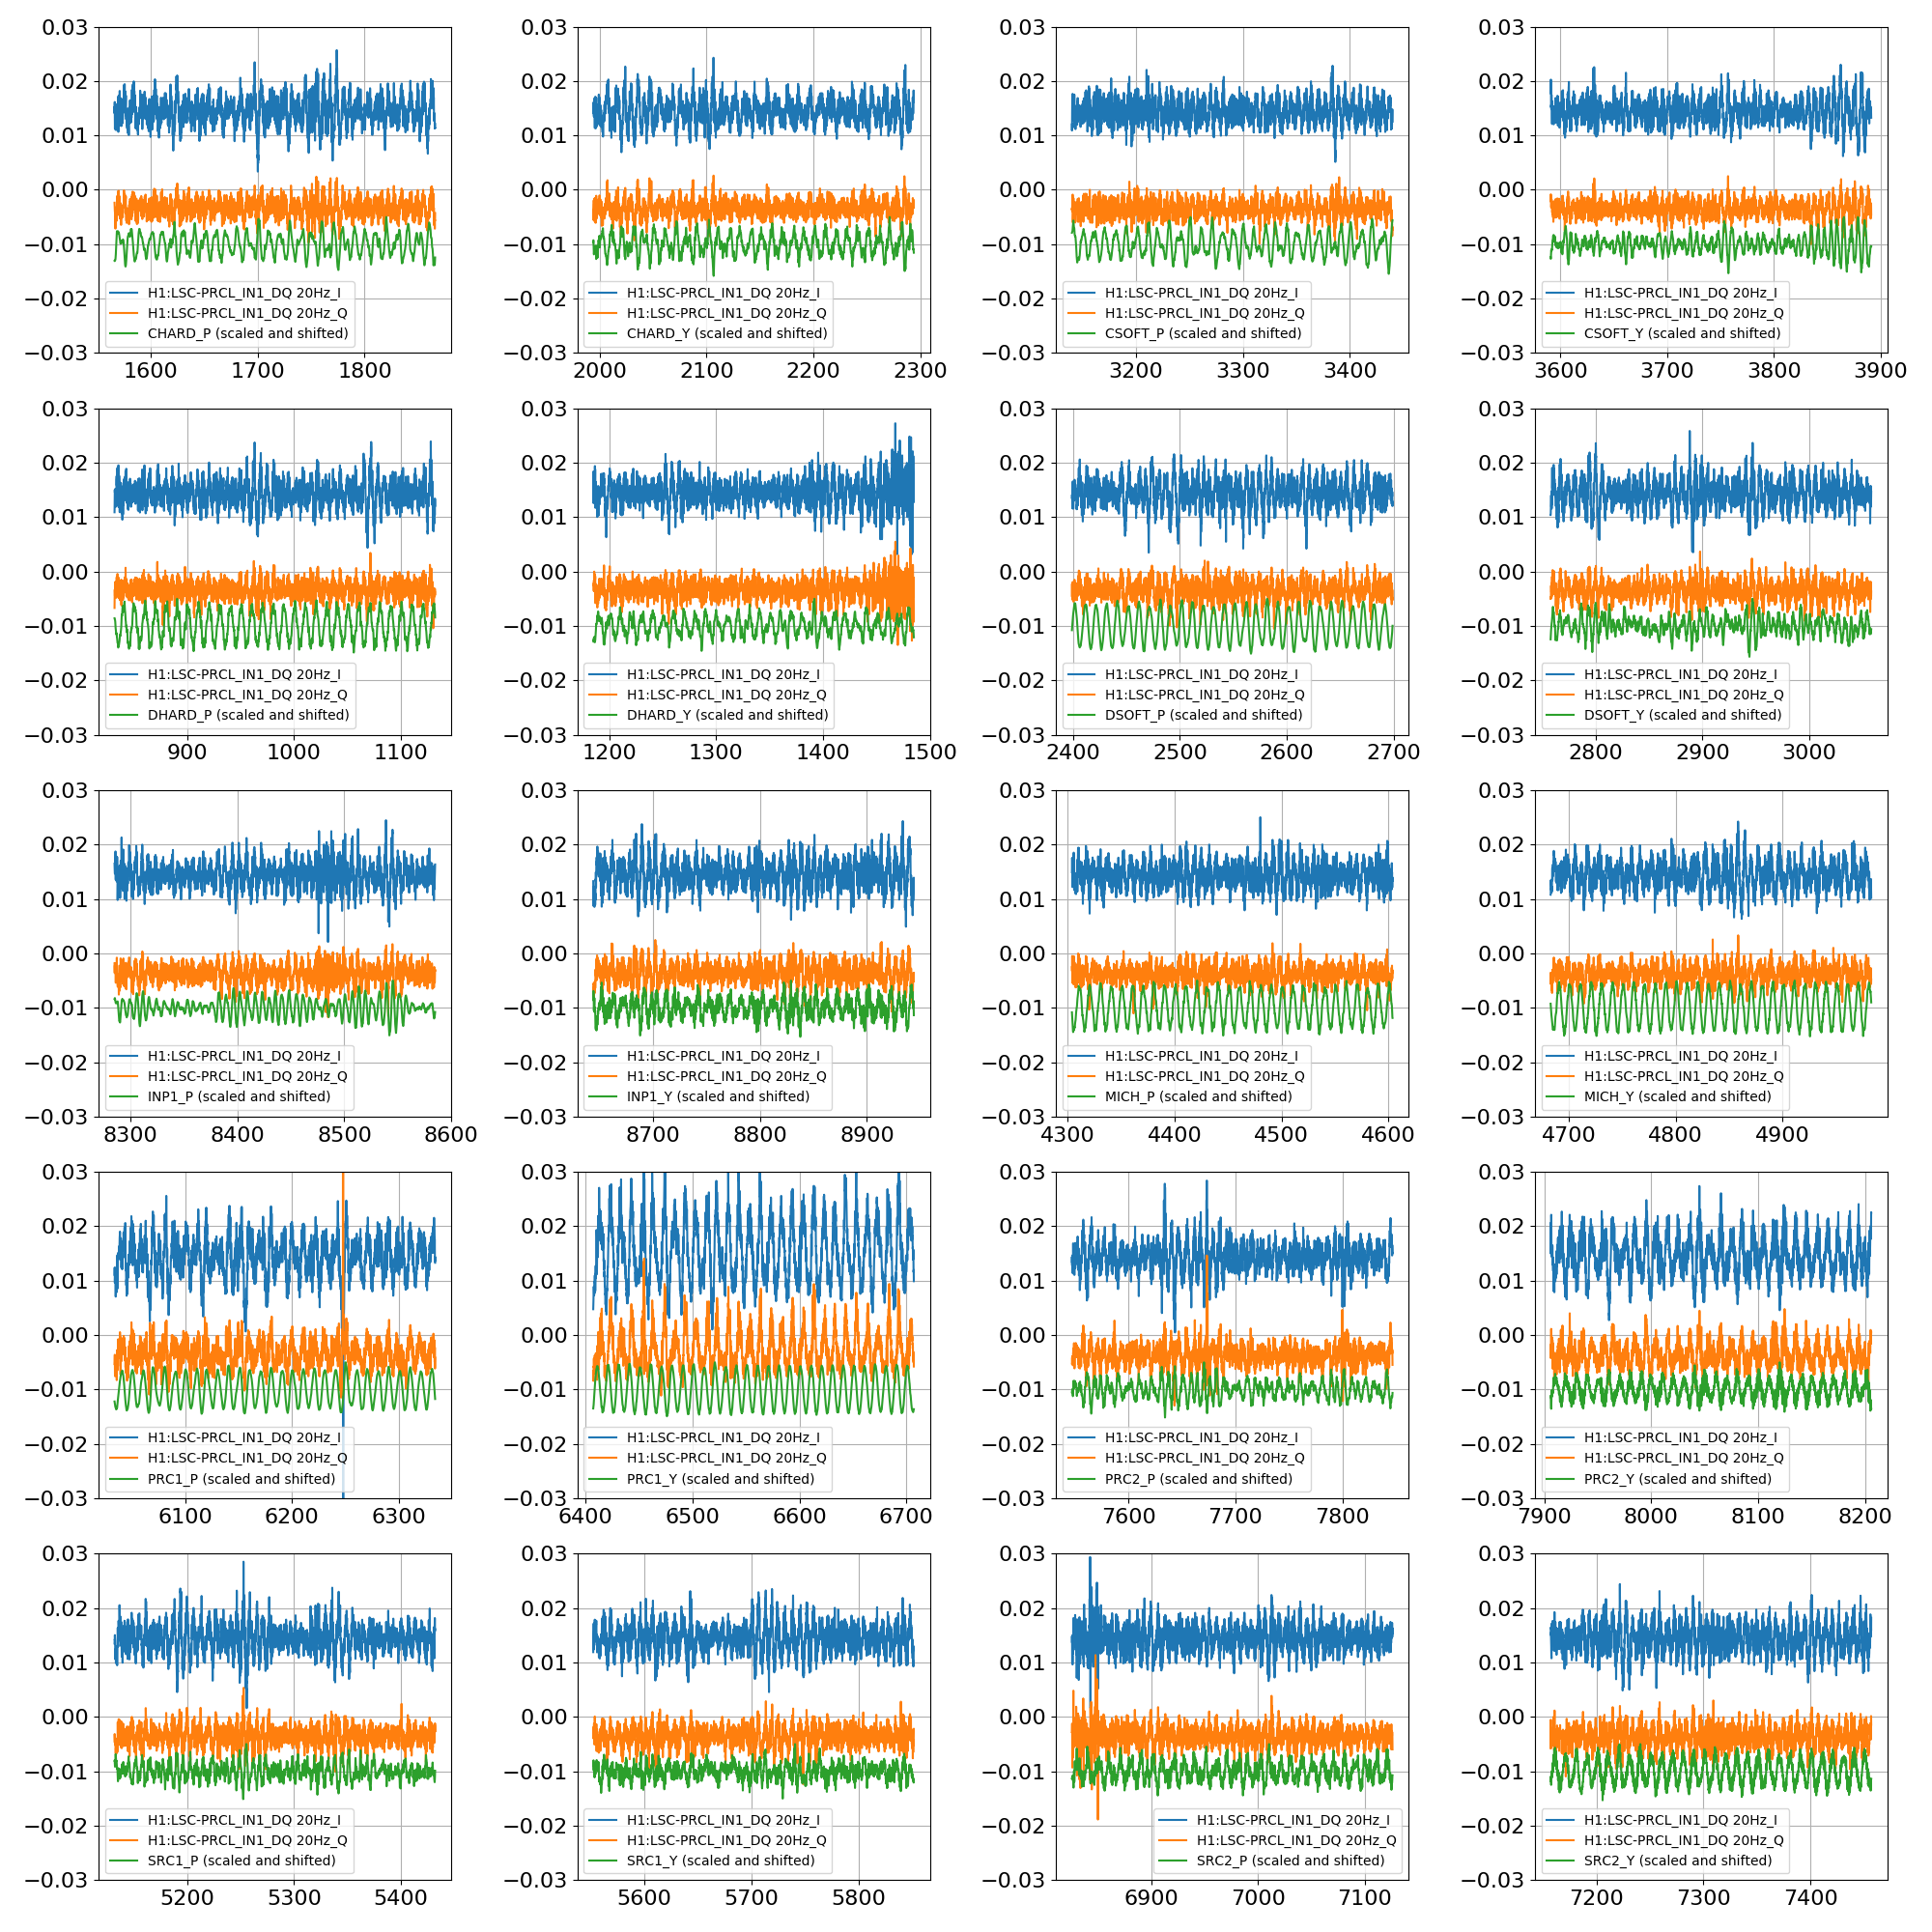
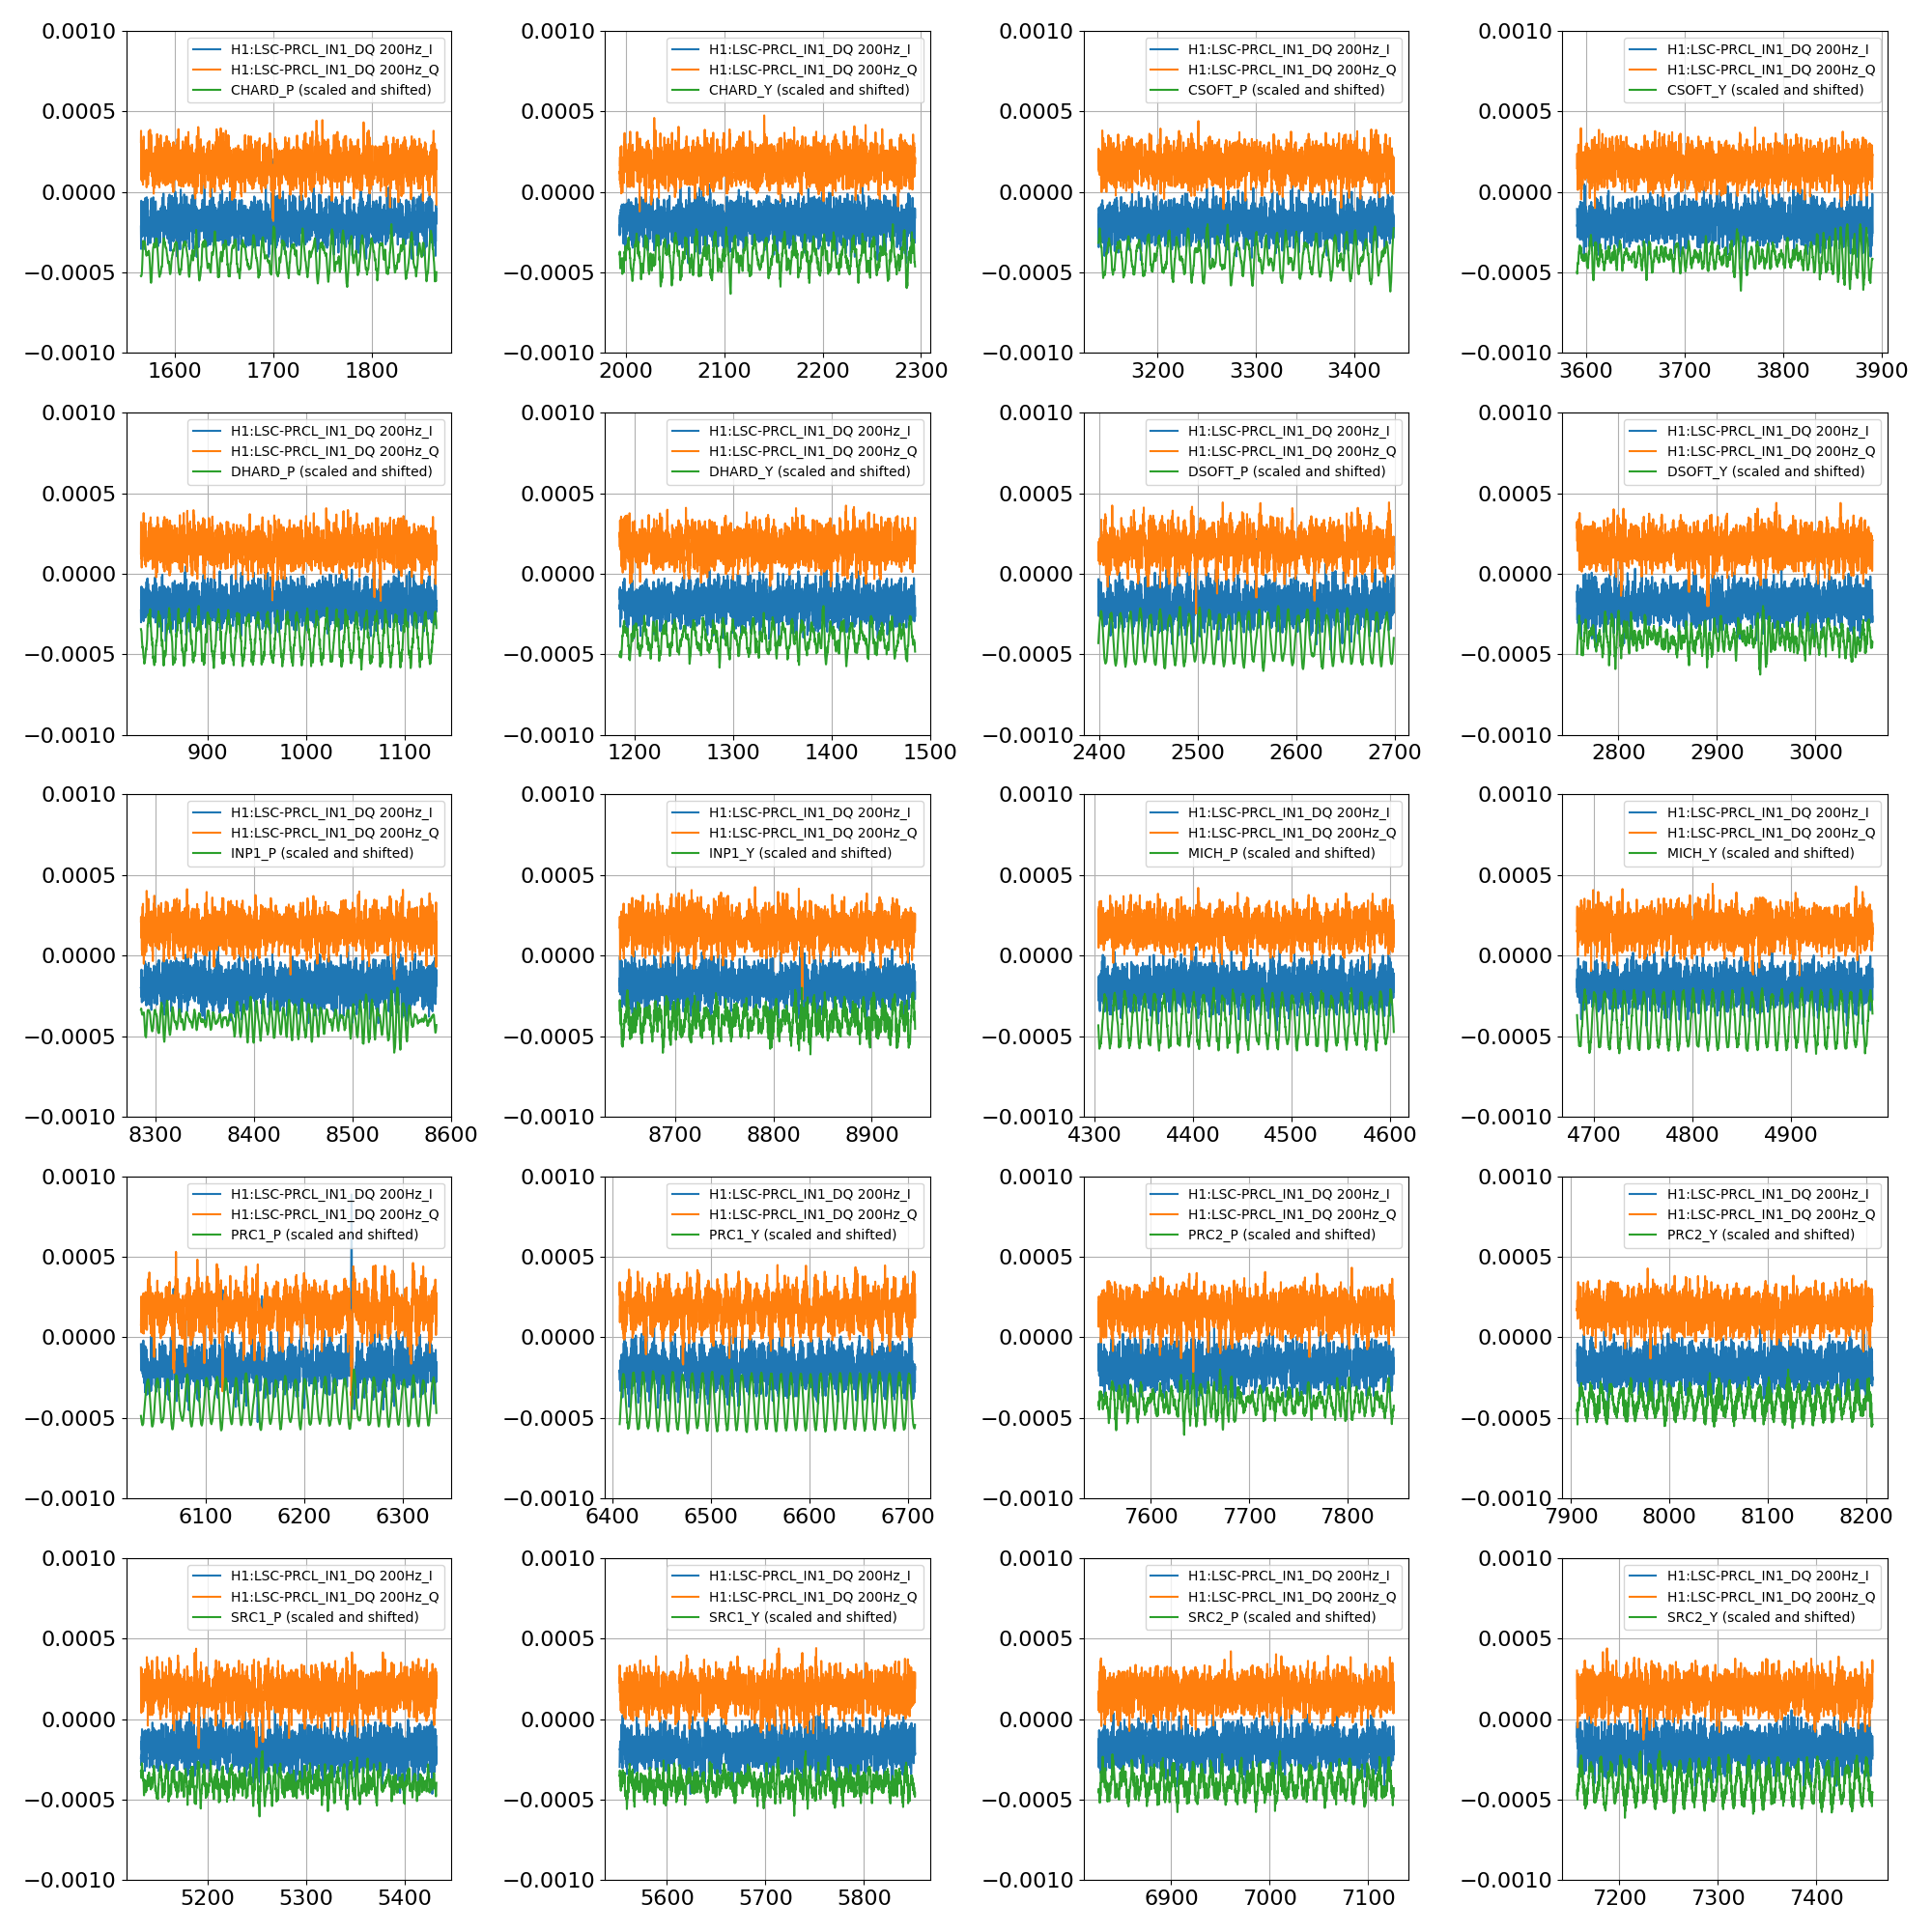
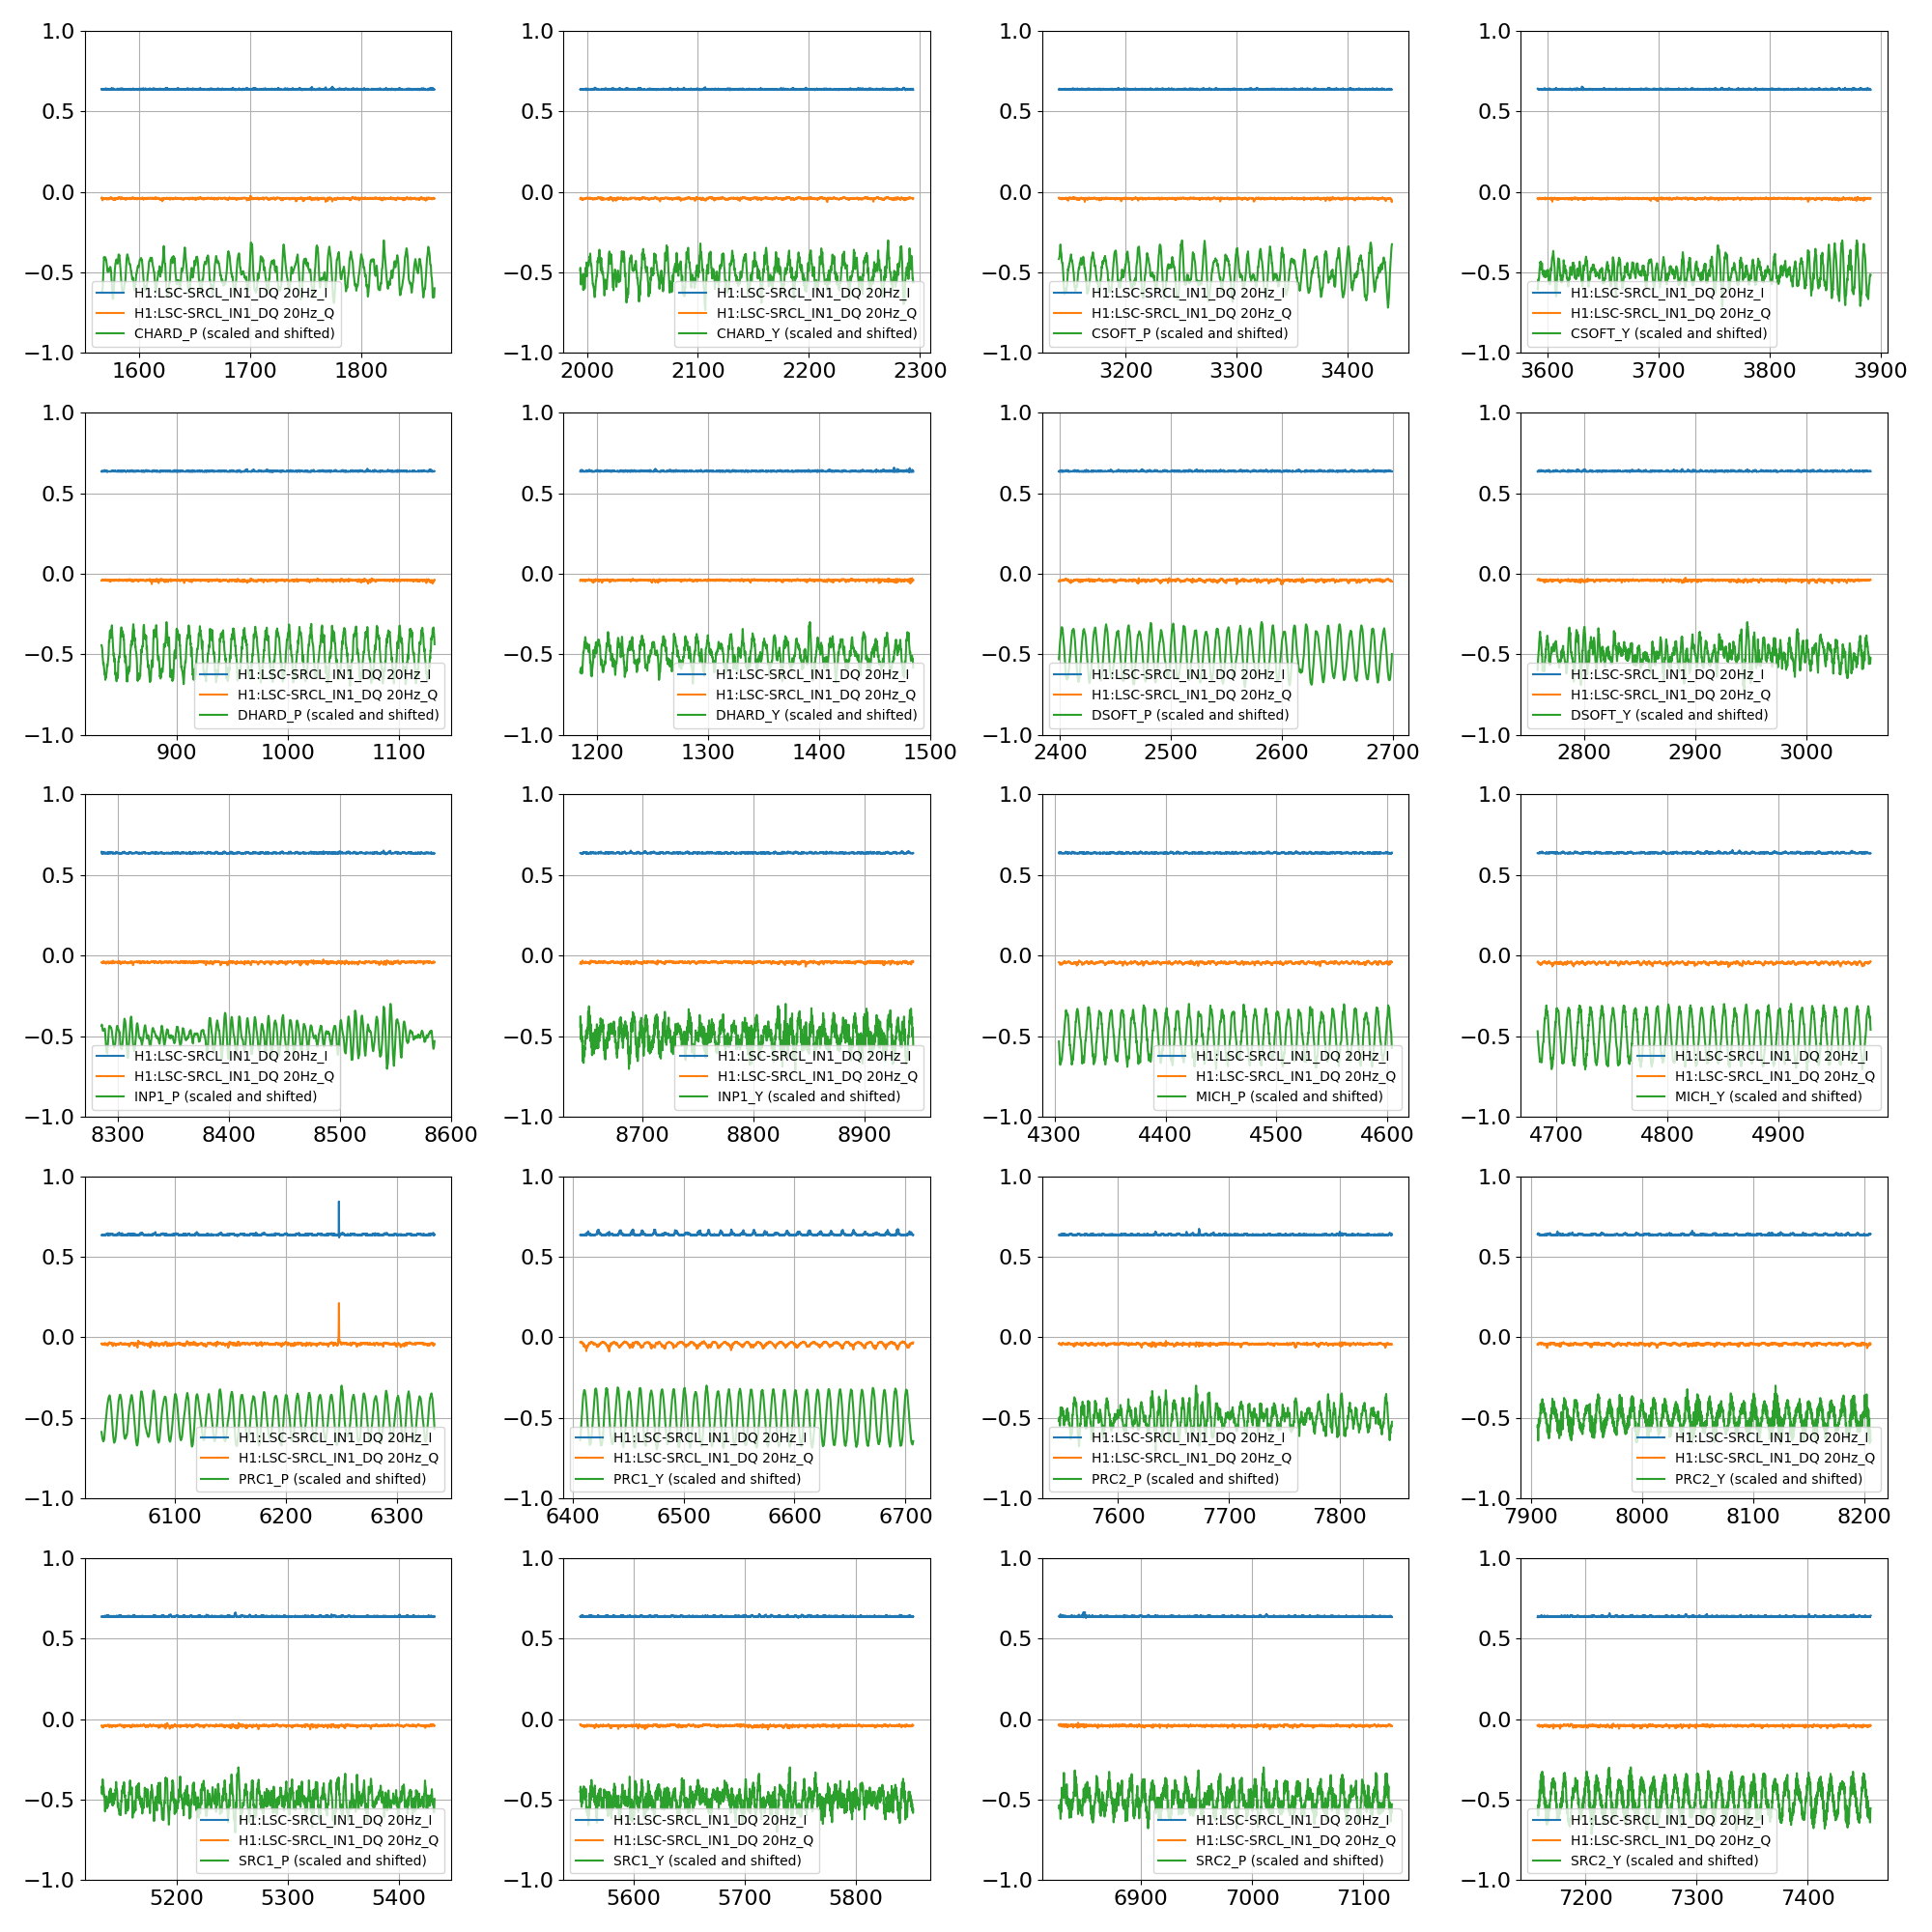
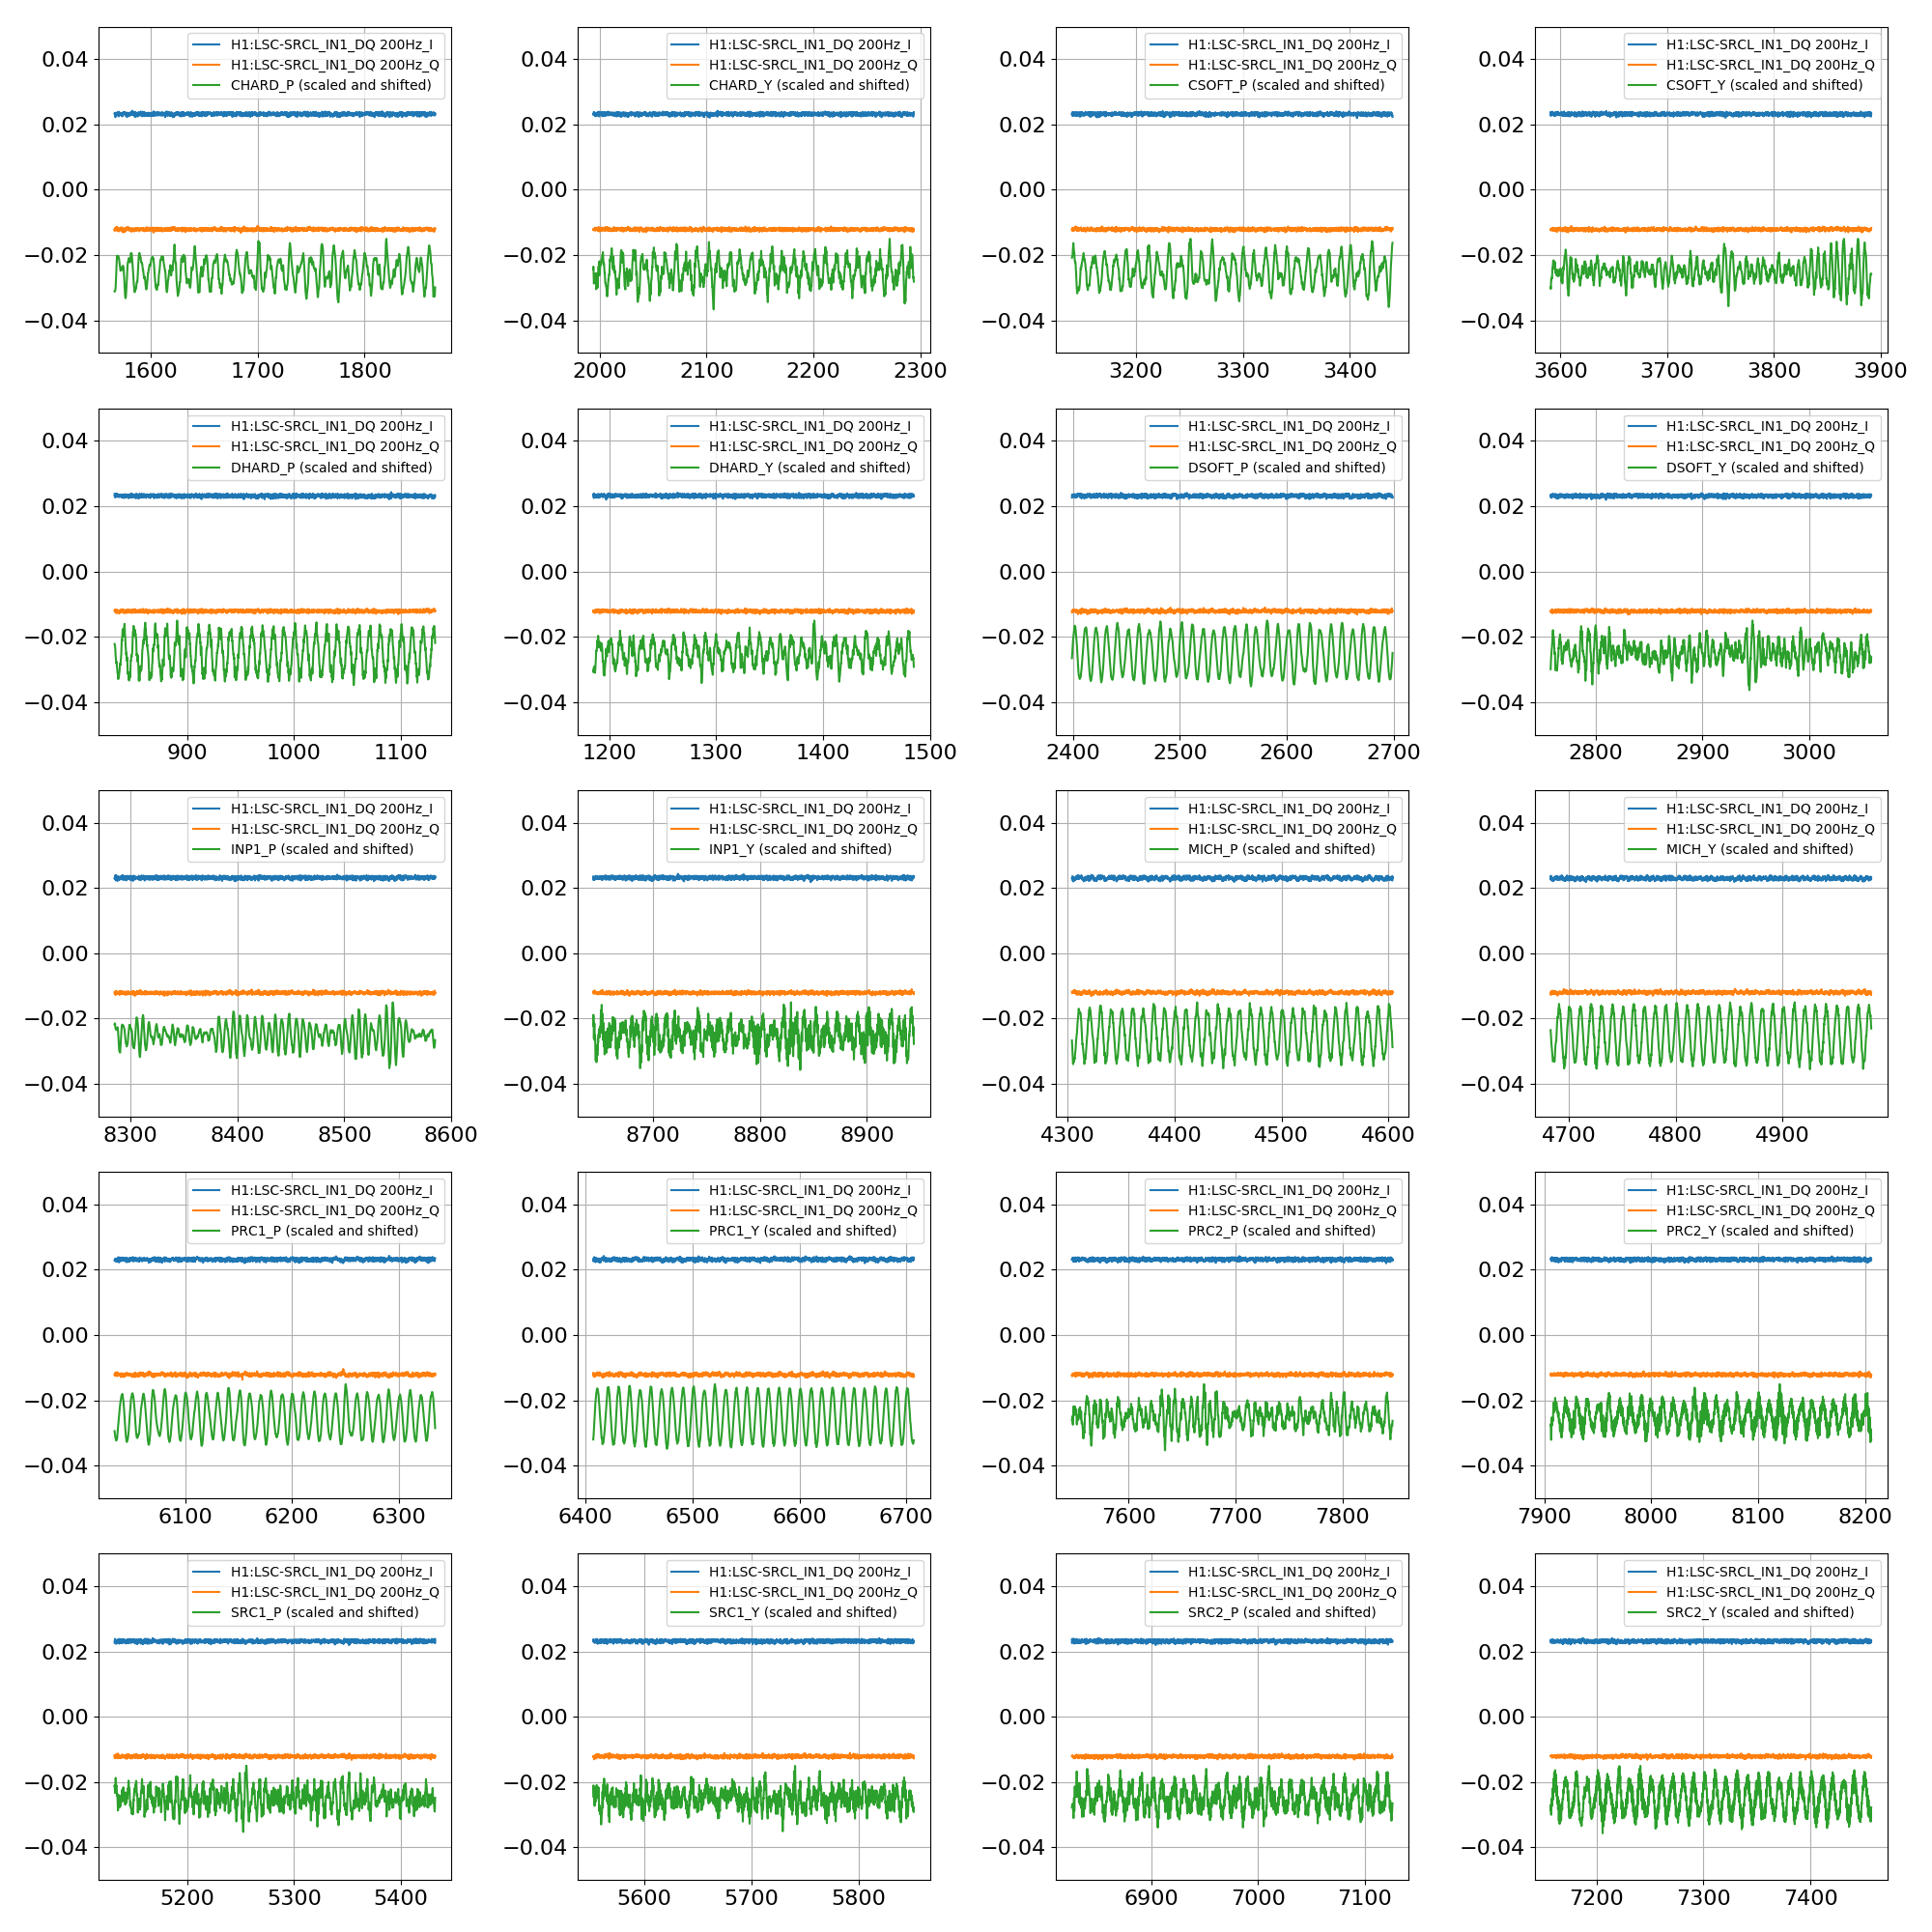
This is the follow-up analysis of the measurements described in 44881. The method is quite simple: I demodulated the LSC signals (DARM, MICH, SRCL and PRCL) at 20Hz and 200Hz, using the excitation line in SRCL_OUT to set the I and Q phases (I extracted absolute phases of the two lines by band-passing the SRCL_OUT signal and fitting a sinusoid to a short period. Then I generate I and Q demodulation signals as numerical sines and cosines). The demodulated signals (I and Q for both 20Hz and 200Hz) are then decimated to 16 Hz and low passed at 4 Hz.

The two plots below shows the most interesting results, which is how the SRCL to DARM coupling is modulated byt the angular motions. In each panel, I show the demodulated I and Q signals (basically the DARM/SRCL transfer function at either 20 or 200 Hz) and a scaled and shifted version of the ASC input signal corresponding to where the 100 mHz excitation was injected at that time. Left plot is the DARM_IN1 signal demodulated at 20 Hz, the right plot is the DARM_IN1 signal demodulated at 200 Hz.

Note that the excitation amplitude is not calibrated, so we can't do a urad to urad comparison (yet). But in all cases the excitation was larger than the typical motion of the d.o.f. at low frequency, and of comparable size.

In summary


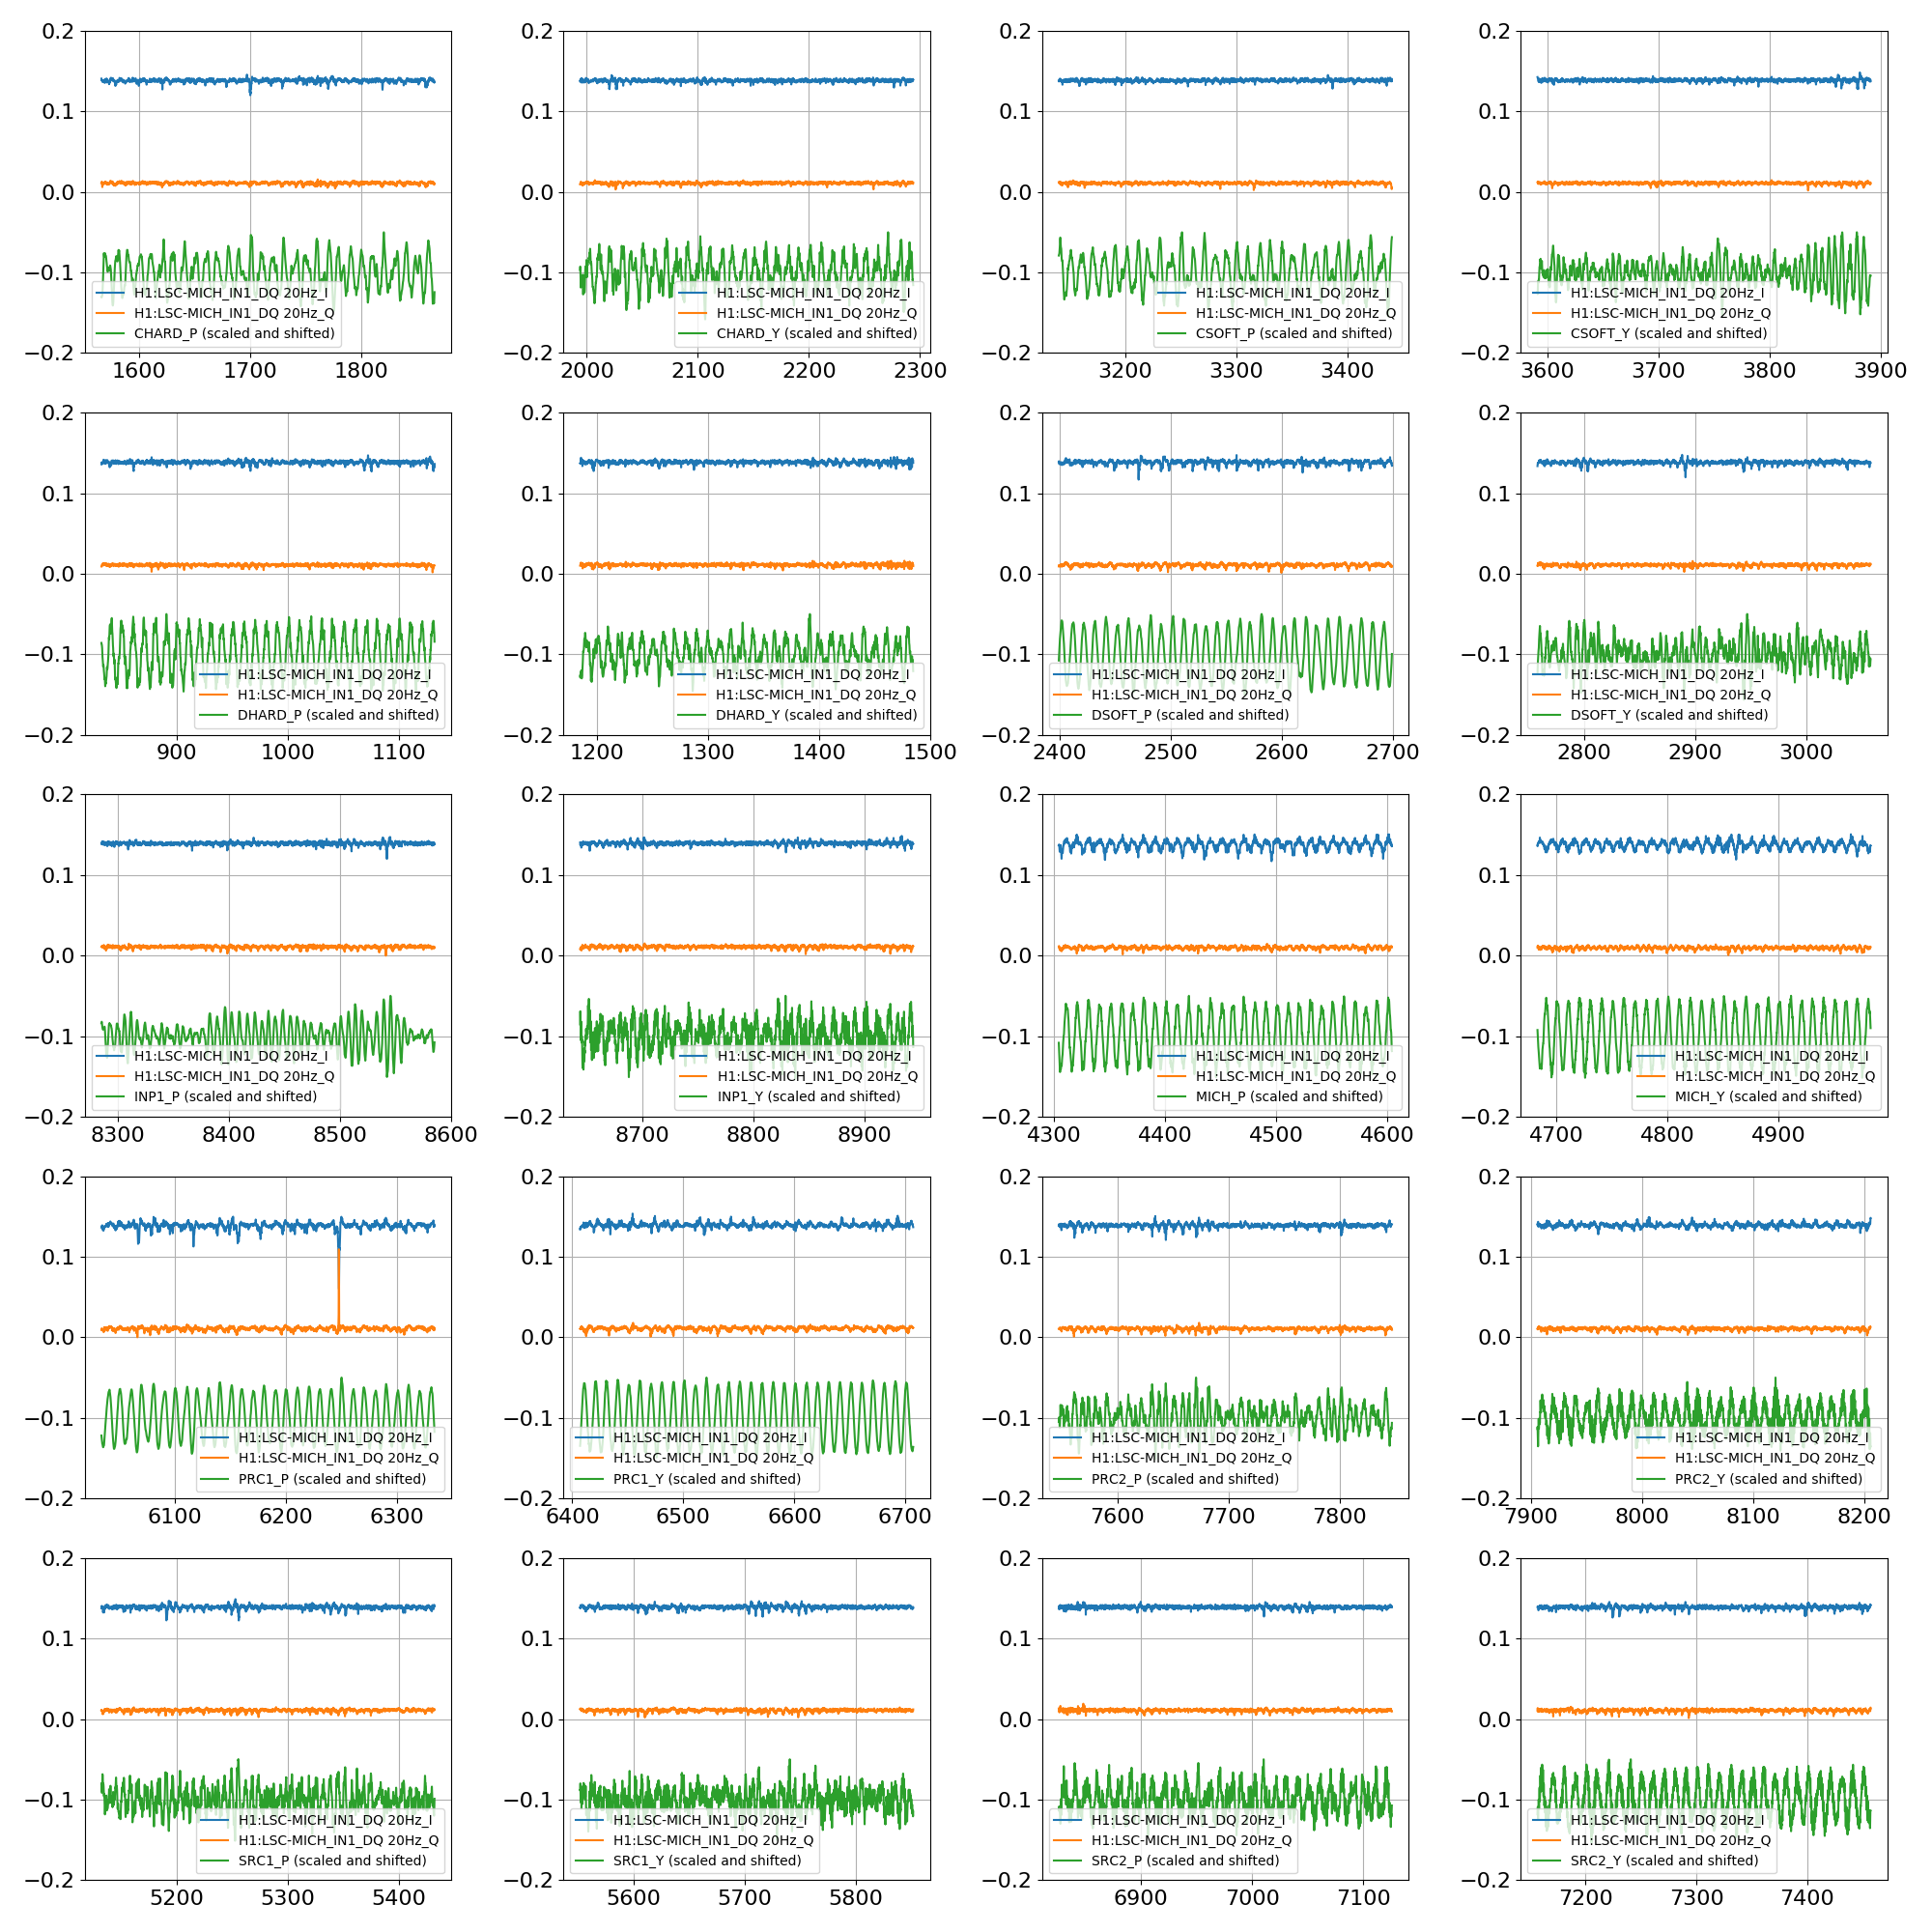
The other plots attached below show the demodulated signals in PRCL_IN, MICH_IN and SRCL_IN:

Images attached to this report
Comments related to this report
gabriele.vajente@LIGO.ORG - 15:38, Monday 29 October 2018 (44889)

The code is attached as a ipynb

Non-image files attached to this comment
rana.adhikari@LIGO.ORG - 15:16, Tuesday 30 October 2018 (44919)

that's good to see. I think its consistent with what we see in the Summary Pages' Rayleigh grams:

On Saturday night, when the microseism was high (~1 um/s) the Rayleigh stat in the 40-100 Hz band shows a lot of red (many non Gaussian outliers).

On Sunday, when the microseism was down to ~0.5 um/s, the Rayleigh gram is mostly white (Gaussian) in this band.

Images attached to this comment
H1 CAL
evan.goetz@LIGO.ORG - posted 14:36, Monday 29 October 2018 (44885)
Sign conventions in DARM and elucidation in CAL-CS model
Jeff K., Evan G.

We wanted to make the CAL-CS DARM model to be as explicit as possible to avoid issues or confusion involving sign conventions in the model of the DARM control loop in the front end (nevertheless it is still confusing and requires some critical thinking). To that end, we created a schematic diagram to illustrate where sign flips originate from DARM_CTRL to differential length (see T1800456). This document shows the O2 feedback layout (driving all three stages of ETMY) and compares it to the current feedback layout (L1 and L2 on ETMY and L3 on ETMX).

Sign issues that were resolved last week (see LHO aLOG 44766) were added in the digital gain of the DARM ETM analog filter bank, but to be explicit on where sign flips enter, we moved these signs into filter modules with gain(1) or gain(-1), depending on the appropriate sign for that actuator and arm.

As an example, for ETMX L3:

1) there is currently an ESD bias of -9.5 V (with the sign and magnitude ignored in the model because the linearization is bypassed), so we include in FM6 a "biassign" value of -1. If the real bias is flipped to +9.5 V from it's current value then the real DRIVEALIGN gain is also flipped to compensate. Based on previous experience, the calibration team decided against changing the CAL-CS model (see LHO aLOG 29868) for future flips in the ESD bias, and we will continue this convention (e.g., don't be alarmed if ESD bias and DRIVEALIGN gains in CAL-CS don't match reality, but they should match in sign). Also note that if the CAL-CS model is ever fixed so that the ESD bias sign and value is not bypassed, then we would need to remove the biassign filter. 
2) since the ESD is exerts a pulling force, then FM7--"actsign"--gets a value of -1. All ESDs will have actsign=-1 while pushing actuators (OSEMs) get a value of +1. 
3) since we actuate on ETMX, the result is that the x-arm gets shorter, so there is a negative effect on deltaL = L_x - L_y, the value of FM8--"armsign"--gets -1.

We updated L1, L2, and L3 stages for both ETMX and ETMY, and accepted SDF changes. Screenshots are attached for each filter bank.
Images attached to this report
H1 ISC
gabriele.vajente@LIGO.ORG - posted 09:31, Monday 29 October 2018 (44881)
Longitudinal and angular injection

At the beginning of the morning I increased PRCL gain from 11 to 22, since the UGF was low (23 Hz) and very close to unstable. Gain peaking was visible in the PRCL error signal.

In nominal low noise, I did some LSC injections (with the feed-forward paths on):

PRCL noise 1224852731 Oct 29 2018 12:51:53 UTC
           1224853333 Oct 29 2018 13:01:56 UTC
DARM noise 1224853376 Oct 29 2018 13:02:38 UTC
           1224853999 Oct 29 2018 13:13:01 UTC
MICH noise 1224854031 Oct 29 2018 13:13:33 UTC
           1224854630 Oct 29 2018 13:23:32 UTC
SRCL noise 1224854656 Oct 29 2018 13:23:58 UTC
           1224855262 Oct 29 2018 13:34:04 UTC

Then, to investigate the origin of the SRCL modulation, I injected a 20 Hz and a 200 Hz line (simultaneously) in SRCL1

SRCL line 20Hz (ampl 1.0) + 200Hz (ampl 0.3)
Started at 1224856157 Oct 29 2018 13:48:59 UTC
Stopped at 1224865128 Oct 29 2018 16:18:30 UTC

During the period with the two lines on, I injected angular motions at 100 mHz, with amplitudes large enough to be the dominant motion in the ASC input signal time series. Times and amplitudes are below

DHARD_P freq 100mHz ampl 30     1224856631 Oct 29 2018 13:56:53 UTC
                                1224856969 Oct 29 2018 14:02:31 UTC
DHARD_P freq 100mHz ampl 100    1224856989 Oct 29 2018 14:02:51 UTC
                                1224857292 Oct 29 2018 14:07:54 UTC
DHARD_Y freq 100mHz ampl 100    1224857342 Oct 29 2018 14:08:44 UTC
                                1224857642 Oct 29 2018 14:13:44 UTC
CHARD_P freq 100mHz ampl 300    1224857723 Oct 29 2018 14:15:05 UTC
                                1224858097 Oct 29 2018 14:21:19 UTC
CHARD_Y freq 100mHz ampl 300    1224858151 Oct 29 2018 14:22:13 UTC
                                1224858453 Oct 29 2018 14:27:15 UTC
DSOFT_P freq 100mHz ampl 0.003  1224858556 Oct 29 2018 14:28:58 UTC
                                1224858860 Oct 29 2018 14:34:02 UTC
DSOFT_Y freq 100mHz ampl 0.003  1224858915 Oct 29 2018 14:34:57 UTC
                                1224859218 Oct 29 2018 14:40:00 UTC
CSOFT_P freq 100mHz ampl 0.001  1224859297 Oct 29 2018 14:41:19 UTC
                                1224859689 Oct 29 2018 14:47:51 UTC
CSOFT_Y freq 100mHz ampl 0.002  1224859748 Oct 29 2018 14:48:50 UTC
                                1224860275 Oct 29 2018 14:57:37 UTC
MICH_P freq 100mHz ampl 1000    1224860461 Oct 29 2018 15:00:44 UTC
                                1224860804 Oct 29 2018 15:06:26 UTC
MICH_Y freq 100mHz ampl 1000    1224860840 Oct 29 2018 15:07:02 UTC
                                1224861204 Oct 29 2018 15:13:06 UTC
SRC1_P freq 100mHz ampl 0.3     1224861289 Oct 29 2018 15:14:31 UTC
                                1224861674 Oct 29 2018 15:20:56 UTC
SRC1_Y freq 100mHz ampl 0.3     1224861709 Oct 29 2018 15:21:31 UTC
                                1224862086 Oct 29 2018 15:27:48 UTC
PRC1_P freq 100mHz ampl 0.03    1224862191 Oct 29 2018 15:29:33 UTC
                                1224862529 Oct 29 2018 15:35:11 UTC
PRC1_Y freq 100mHz ampl 0.03    1224862564 Oct 29 2018 15:35:46 UTC
                                1224862885 Oct 29 2018 15:41:07 UTC
SRC2_P freq 100mHz ampl 0.01    1224862983 Oct 29 2018 15:42:45 UTC
                                1224863283 Oct 29 2018 15:47:45 UTC
SRC2_Y freq 100mHz ampl 0.01    1224863314 Oct 29 2018 15:48:16 UTC
                                1224863615 Oct 29 2018 15:53:17 UTC
PRC2_P freq 100mHz ampl 10      1224863704 Oct 29 2018 15:54:46 UTC
                                1224864005 Oct 29 2018 15:59:47 UTC
PRC2_Y freq 100mHz ampl 30      1224864063 Oct 29 2018 16:00:45 UTC
                                1224864364 Oct 29 2018 16:05:46 UTC
INP1_P freq 100mHz ampl 100     1224864442 Oct 29 2018 16:07:04 UTC
                                1224864743 Oct 29 2018 16:12:05 UTC
INP1_Y freq 100mHz ampl 300     1224864801 Oct 29 2018 16:13:03 UTC
                                1224865110 Oct 29 2018 16:18:13 UTC

Analysis will follow.


H1 ISC (ISC)
craig.cahillane@LIGO.ORG - posted 03:36, Monday 29 October 2018 - last comment - 02:00, Tuesday 30 October 2018(44874)
Nonlinear Coupling of CARM to DARM at 4.096 kHz (actually 4.100 kHz)
Today I found that excess noise in CARM around 4.096 kHz (actually 4.100 kHz) is downconverted to DC noise in DARM.

While taking CARM OLG measurements, I've noticed that we always see a jump in the DARM noise at low frequency.  I always assumed it was a glitch having to do with turning on/off the SR785 excitation, today I decided to track it down.
Turns out it's not the on/off switch, it was when the swept sine passed through a specific frequency band.  I took a bunch of swept sines from 100kHz to 90 kHz, etc... until I got to 10 kHz to 1 kHz, where I saw the DARM noise jump again.
I went out to the floor and injected a line into the Common Mode Board at 1 mVrms while moving the frequency from 10 kHz down to 1 kHz.  I noticed nothing on this first pass.

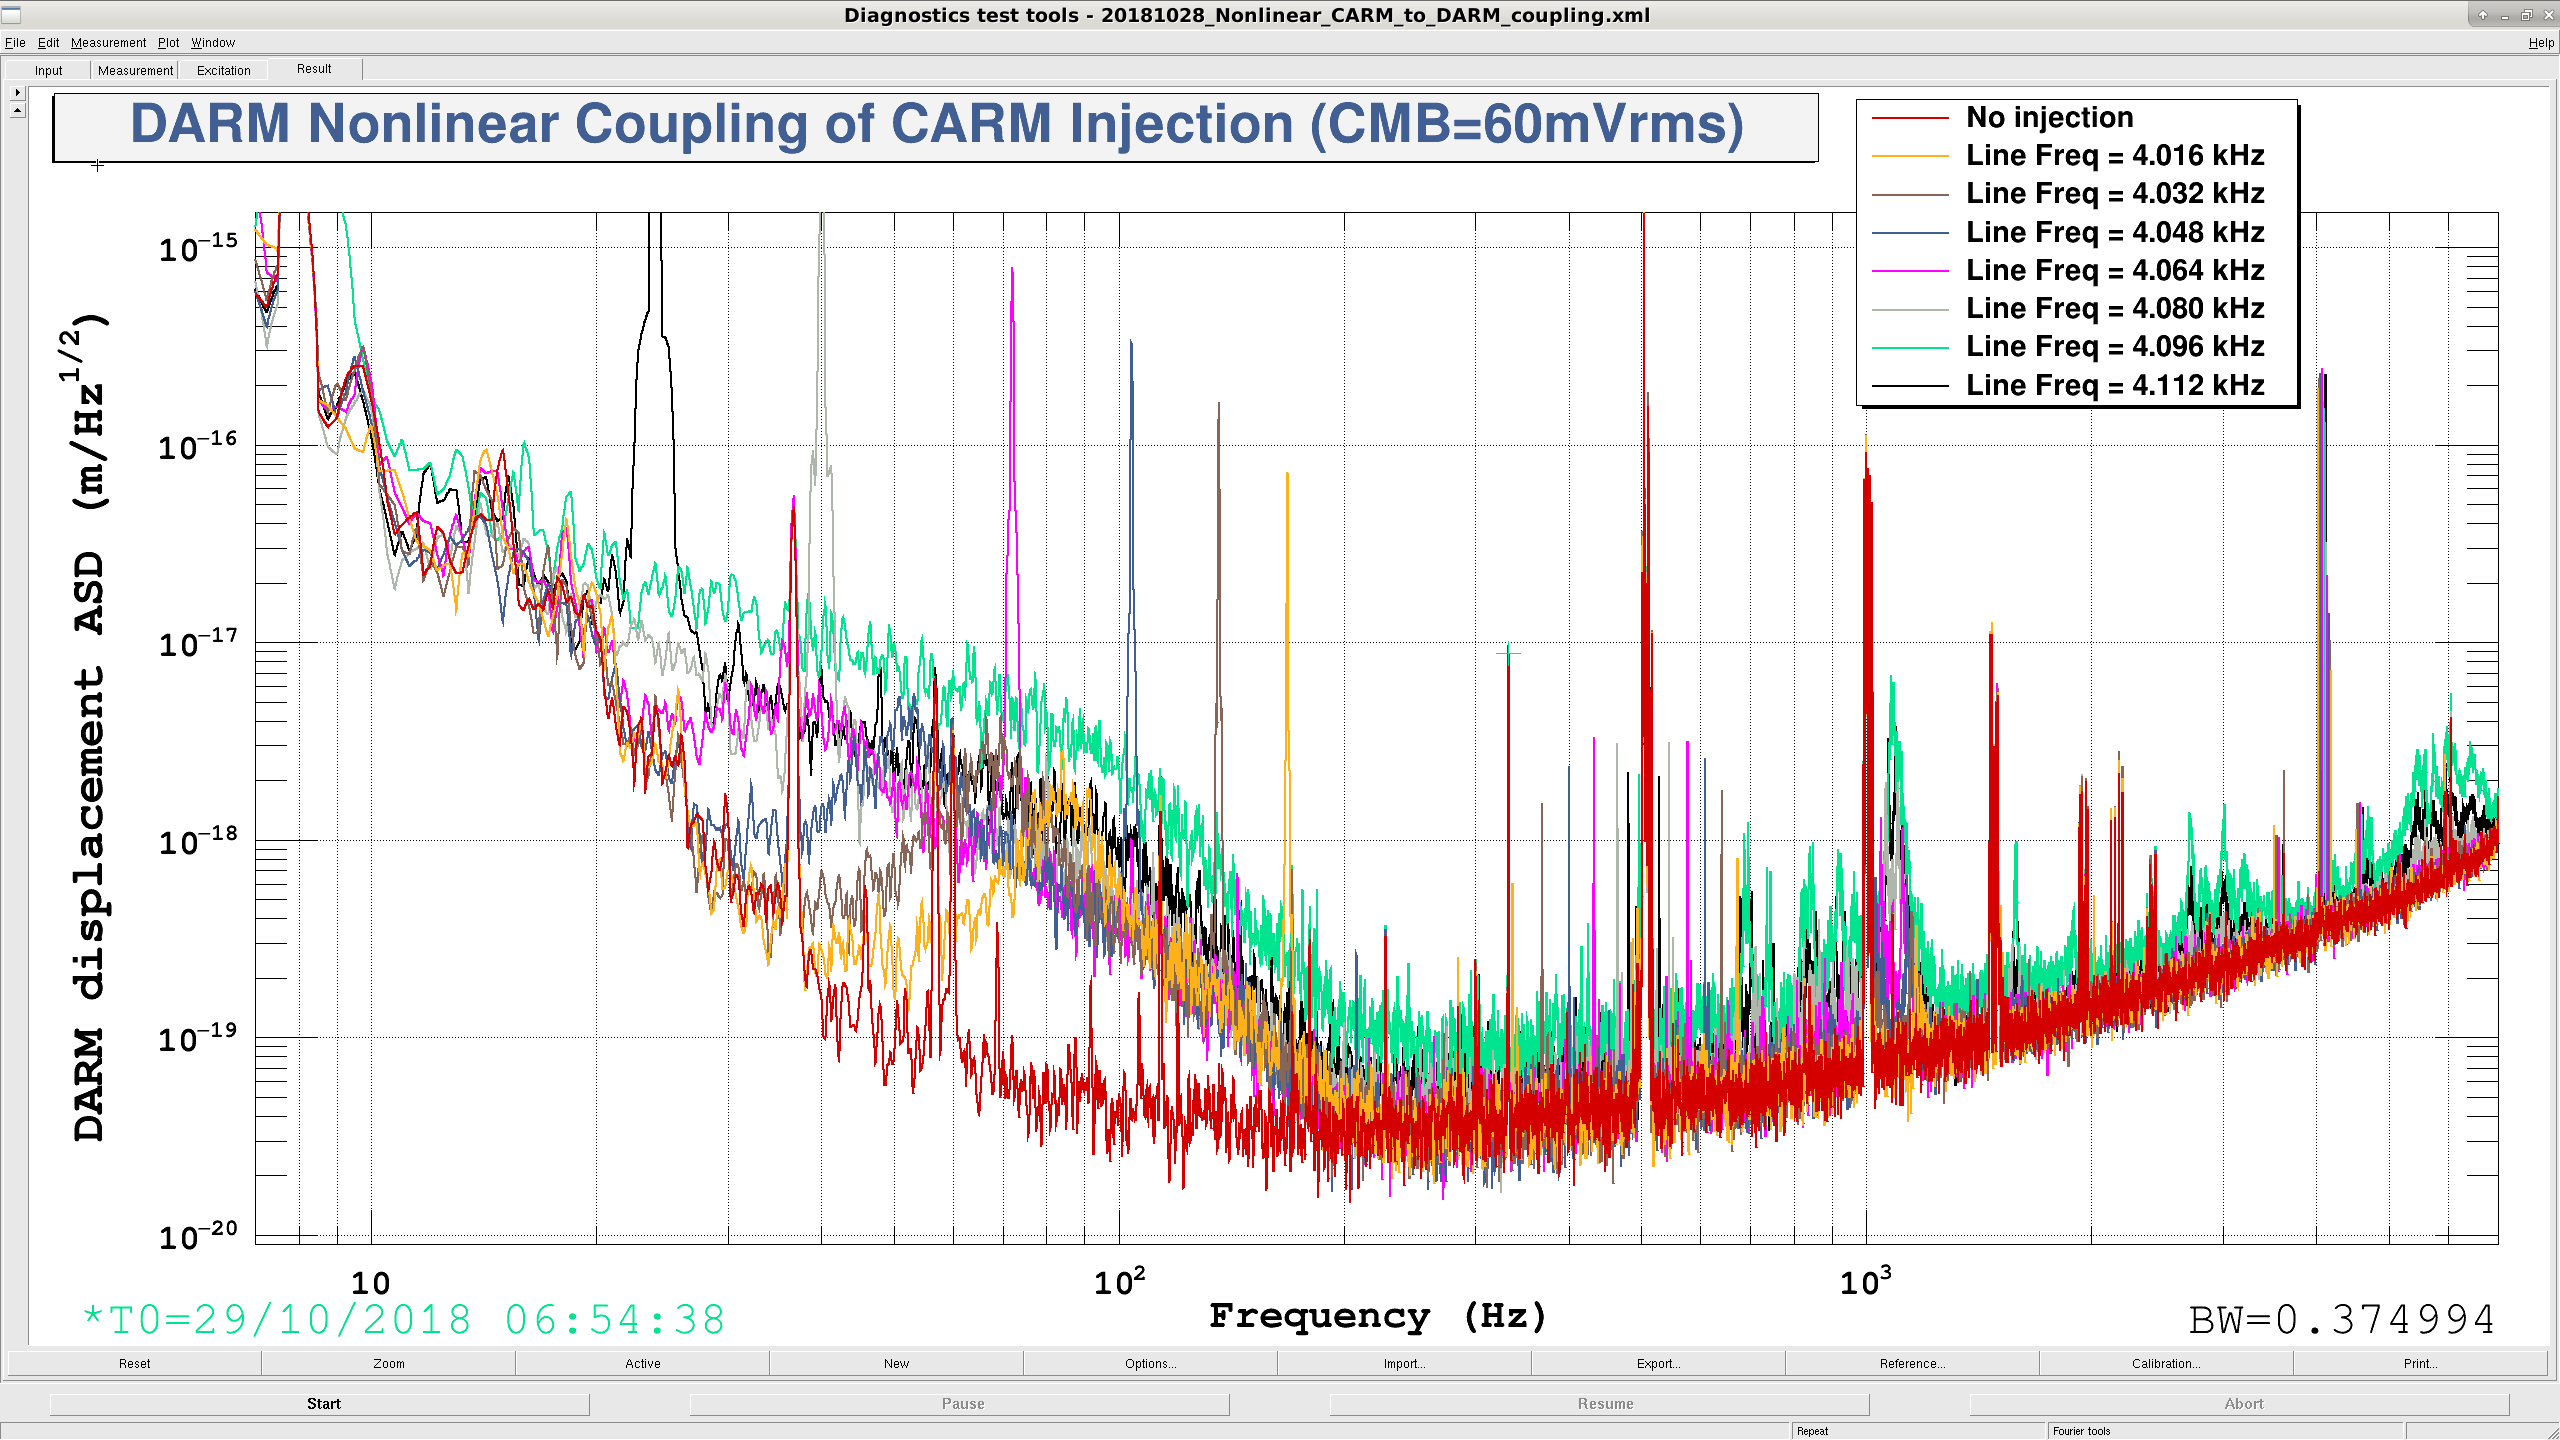
So I input 60 mVrms and went back in frequency and found the jump when I got to 4.016 kHz.  It was a stationary, broadband hump in DARM at around 80 Hz.
I moved the sine wave frequency slowly, getting spectra at every jump of 16 Hz.  The DARM hump moved down in frequency until I reached 4.096 kHz, when it started moving up again. (Pic 1).  The coupling became much stronger when the line was directly on 4.096 kHz.
I could control the coupling amplitude by increasing the sine wave amplitude (Pic 2). 

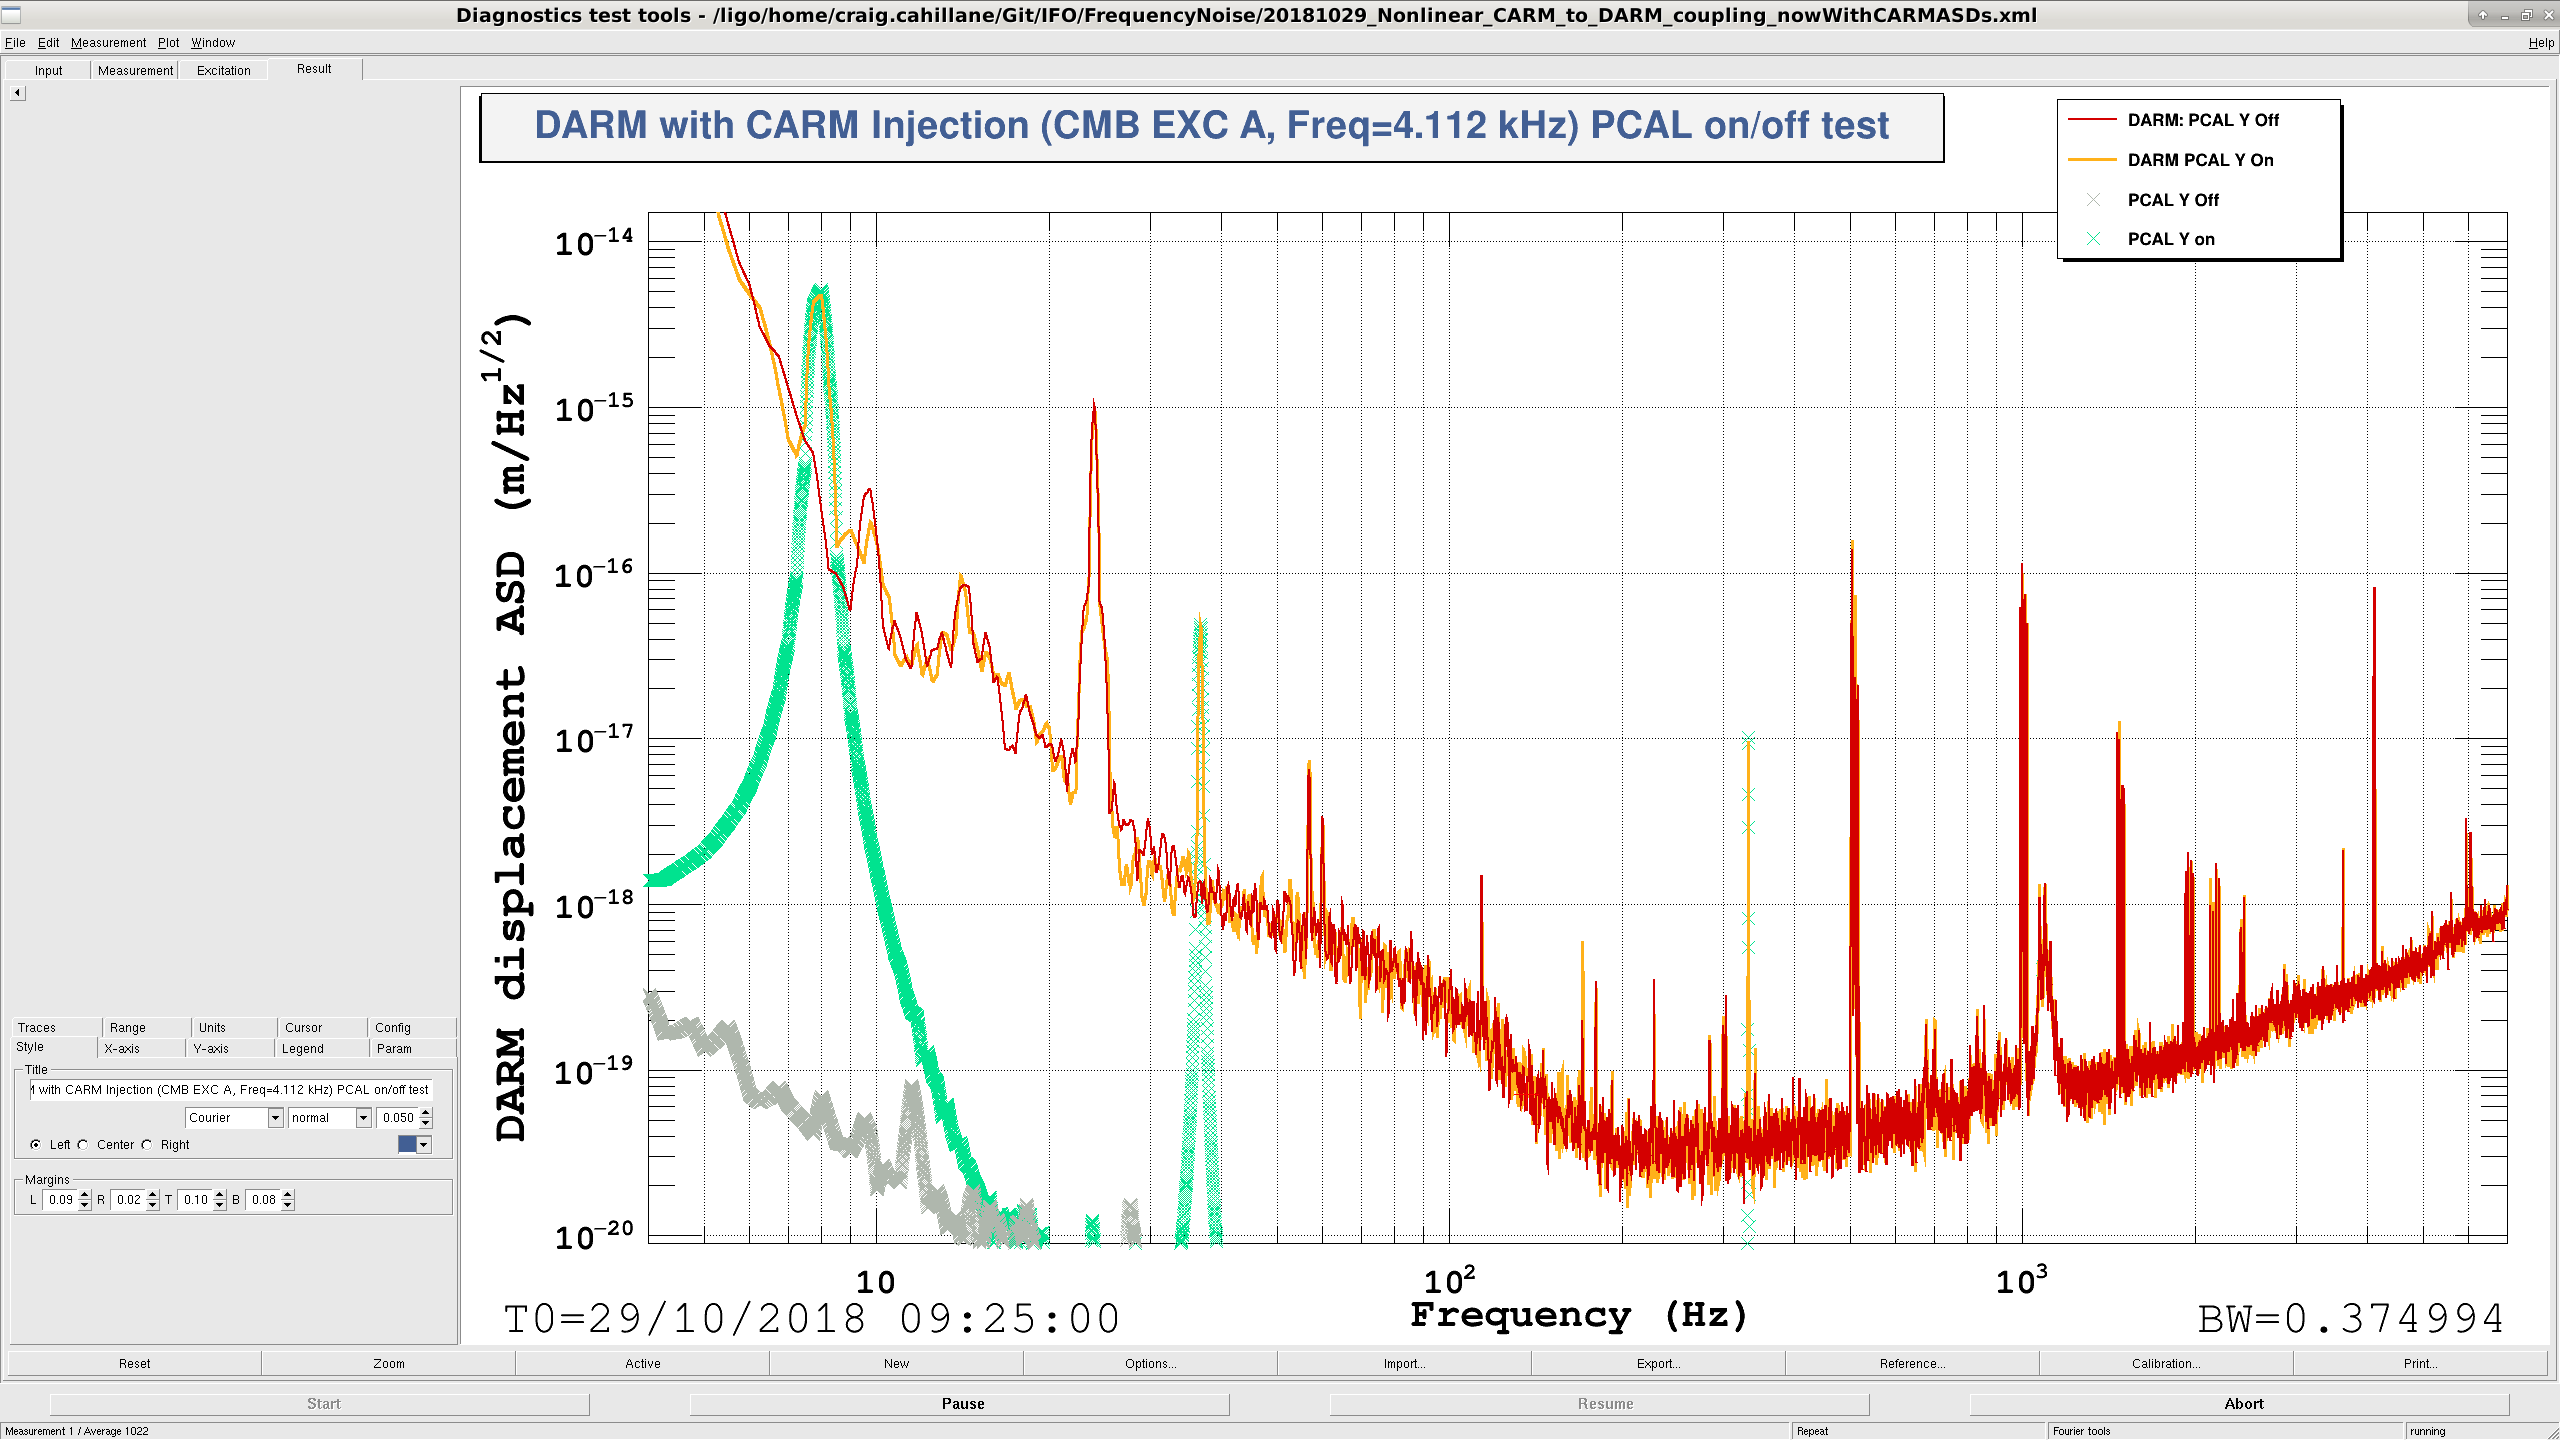
As I moved down in frequency, I could also see a strong reflection of the line at |Inj Freq - 4.096 kHz| + 8 Hz (so if my line was at 4.112 kHz, which is 16 Hz away from 4.096 kHz, I'd see a line 24 Hz).  The PCAL line is on at 8 Hz, so I thought I was probably seeing it again in reflection.  Turns out that's not the case, see Pic 3 where I turned off the PCAL line with the line freq at 4.112 kHz

4.096 kHz is 2^12, so this has to be an ADC electronics issue.  There seems to be a corner at around 100 Hz, which could be consistent with some whitening filter corner.  I looked at the CARM spectrum at the same time as I increased the sine wave amplitude, there was no change (Pic 2), so this is probably a DARM loop issue.

DTT template was too huge for upload, it exists at /ligo/home/craig.cahillane/Git/IFO/FrequencyNoise/20181028_Nonlinear_CARM_to_DARM_coupling.xml

------------------------------------------------------------------------------------------------------------------------------------------------------------------

Something wasn't hanging together with these reflections, so I injected the line at a few different frequencies and recorded the difference with 4.096 kHz and the reflection peak frequency:

Inj Freq [kHz]     Diff with 4.096 kHz [Hz]    Refl Peak Freq [Hz]
------------------------------------------------------------------
4.064              32                          72
4.080              16                          40
4.112             -16                          24
4.128             -32                          56

These results are more consistent with a frequency reflection about exactly 4.100 kHz.  (???)
Maybe not a digital electronics issue....

------------------------------------------------------------------------------------------------------------------------------------------------------------------

I tried driving DARM1_EXC at 1e-6 excitation at 4.112 kHz but lost lock.  There was no noticeable change in the DARM spectrum when driving at low amplitudes.  Gonna be really hard to drive DARM at this frequency, should probably get an hour or so of integration with a drive of 1e-7 or so.

------------------------------------------------------------------------------------------------------------------------------------------------------------------

Note: I was trying to control the SR785 remotely to take some spectra, and accidentally blasted 5 Vpk into the common mode servo board EXC A (make sure to always set your units with GPIB source amplitude changes, even if you already set your units by hand to be mVrms, because SR785 always assumes units are Vpk, which is way too big for us and we lost lock immediately).
We've gotten back to NOMINAL_LOW_NOISE, so nothing too bad must have happened...
Images attached to this report
Comments related to this report
gabriele.vajente@LIGO.ORG - 06:26, Monday 29 October 2018 (44876)

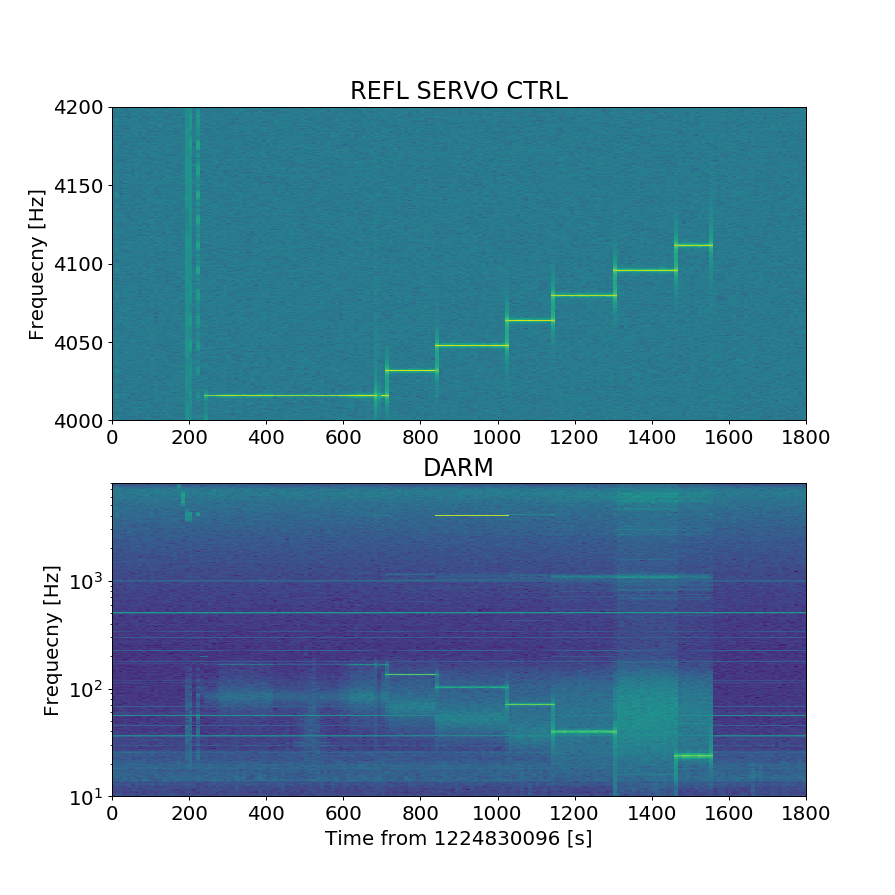
Here's a look at Craig's injections as a spectrogram. Injection times can be inferred from the plot below.


Images attached to this comment
gabriele.vajente@LIGO.ORG - 08:39, Monday 29 October 2018 (44879)

There is more going on here

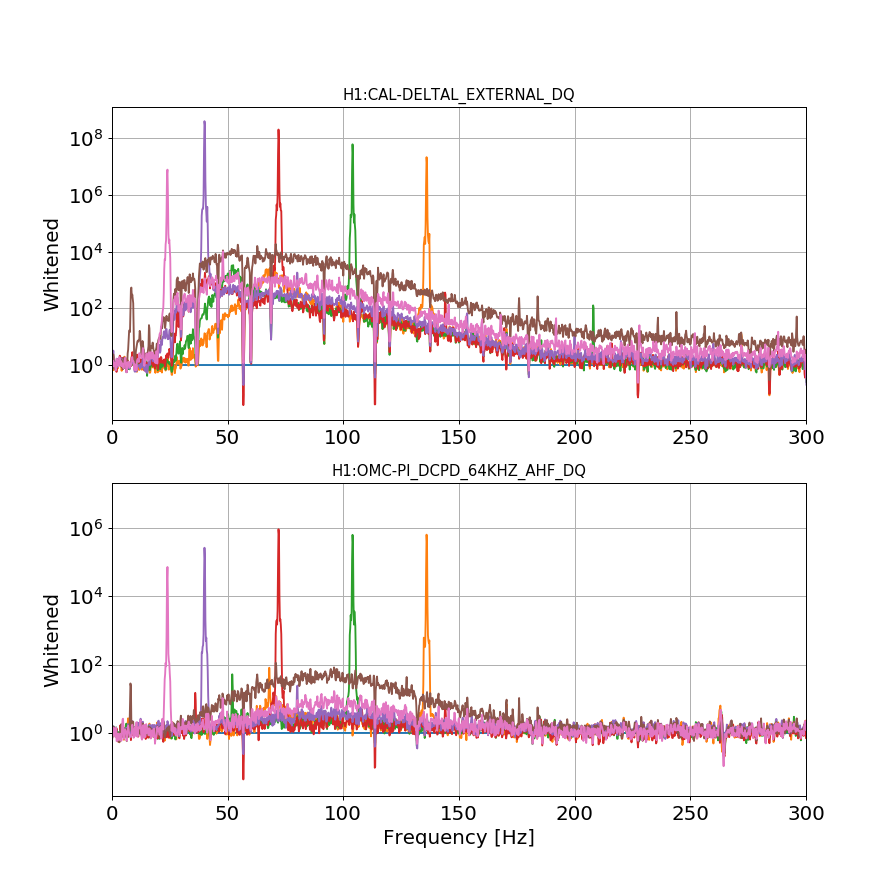
  • The line in DARM is mirrored at exactly 4100.0 Hz, as pointed out by Craig (those lines have similar amplitudes in CAL_DELTAL and OMC_DCPD_A, I did not check OMC_DCPD_B since I wanted to look at high frequency too)
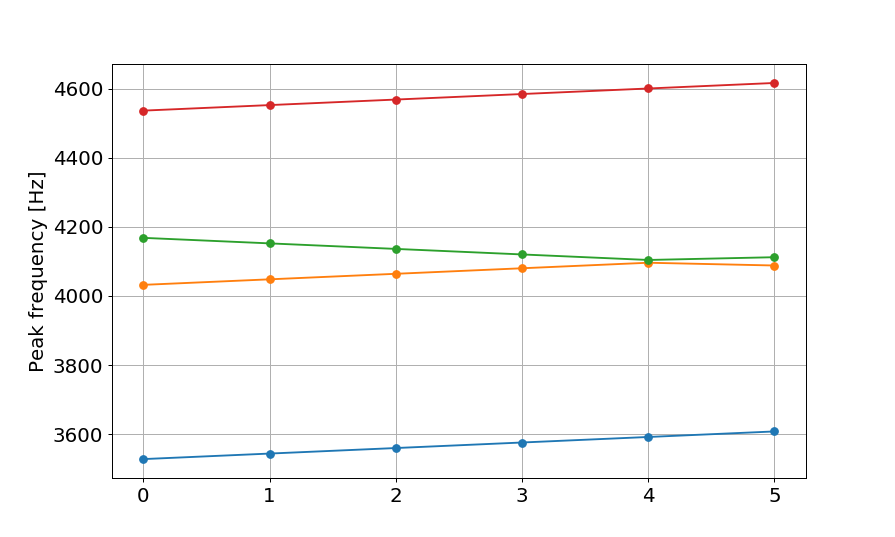
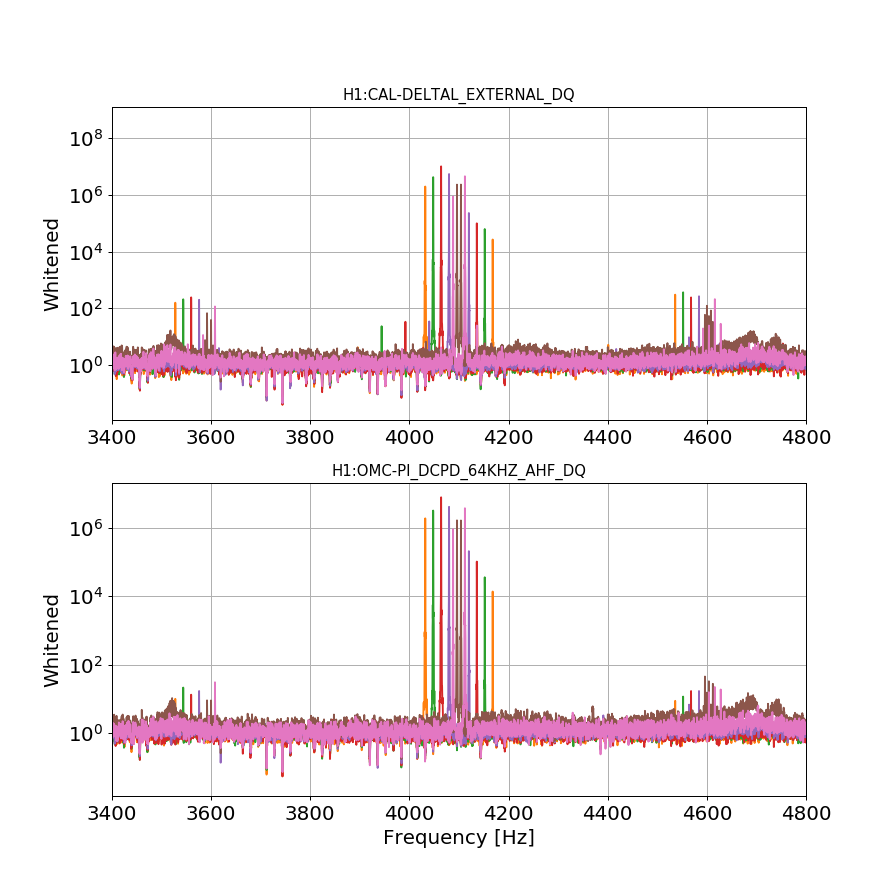
  • But also there are more lines created around 3.6 Khz and 4.6 kHz, see figures 1 (whitened spectra) and figure 2 (frequency of peak as a function of the time segment). Those lines are spaced by 1008.4 Hz, and move all up in frequency in the same way as the injection, so they are not mirrored around 4100 Hz. Those lines are more prominent in CAL_DELTAL than in OMC_DCPD_A. We should check if they are in OMC_DCPD_B
  • There also moving lines created around 504.1 Hz, moving symmetrically toward the line (figures 3 and 4, same plotting as above)
  • The main noise bump below 300 Hz is much larger in CAL_DELTAL than in OMC_DCPD_A (figure 5), and there are also lines at frequencies below 300 Hz
  • There's a double bump around 1080 Hz (figure 6)
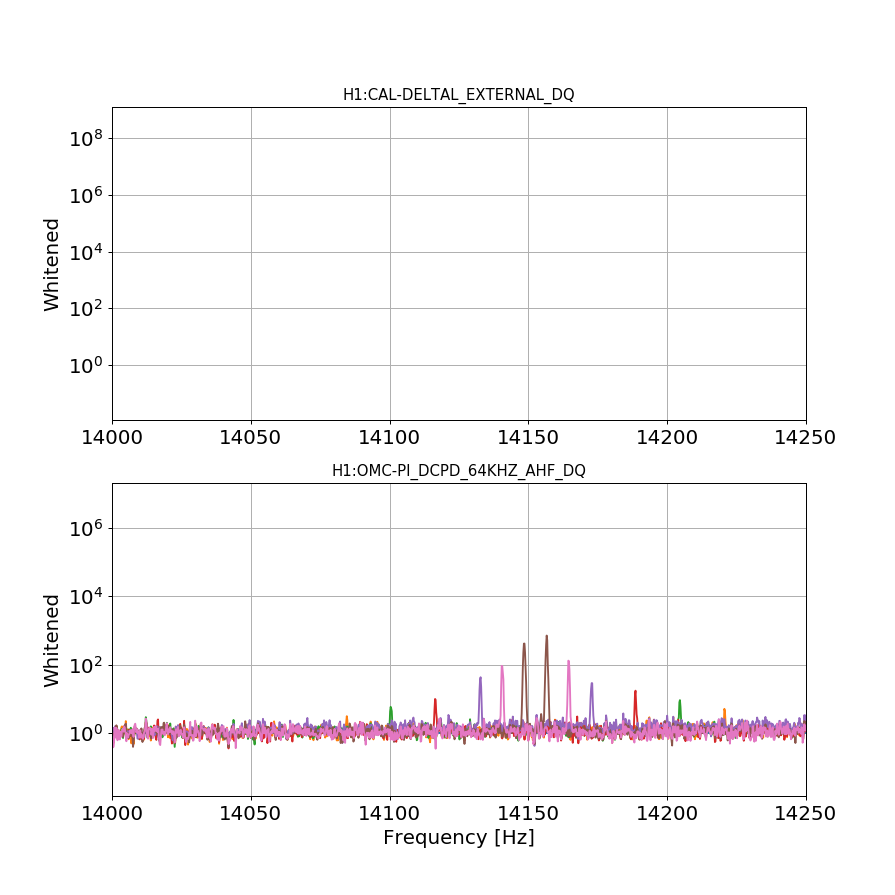
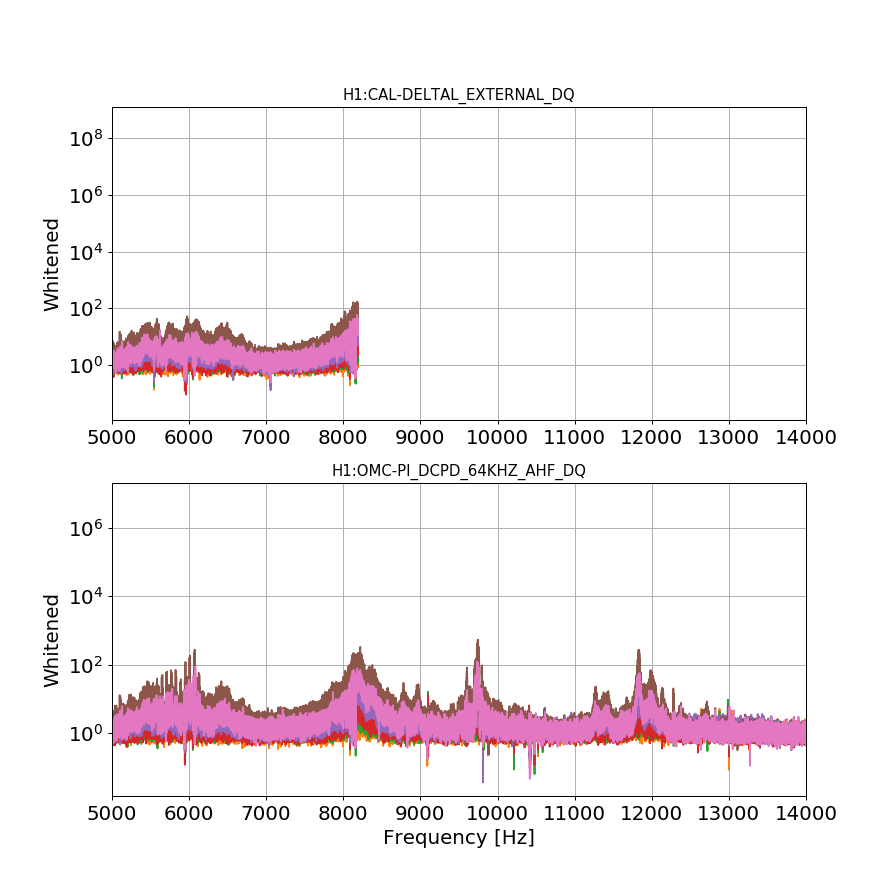
  • In OMC_DCPD_A we can see more lines at HF around 14152 Hz (figure 7), and more bumps at high frequencies (figure 8)


EDIT: OMC_DCPD_A and OMC_DCPD_B seems to see the same lines and noise. There is a difference therefore between H1:OMC-DCPD_A_DQ and H1:OMC-PI_DCPD_64KHZ_AHF_DQ

Images attached to this comment
daniel.sigg@LIGO.ORG - 09:38, Monday 29 October 2018 (44882)

4.100kHz is the OMC dither.

keita.kawabe@LIGO.ORG - 19:27, Monday 29 October 2018 (44896)

Summary:

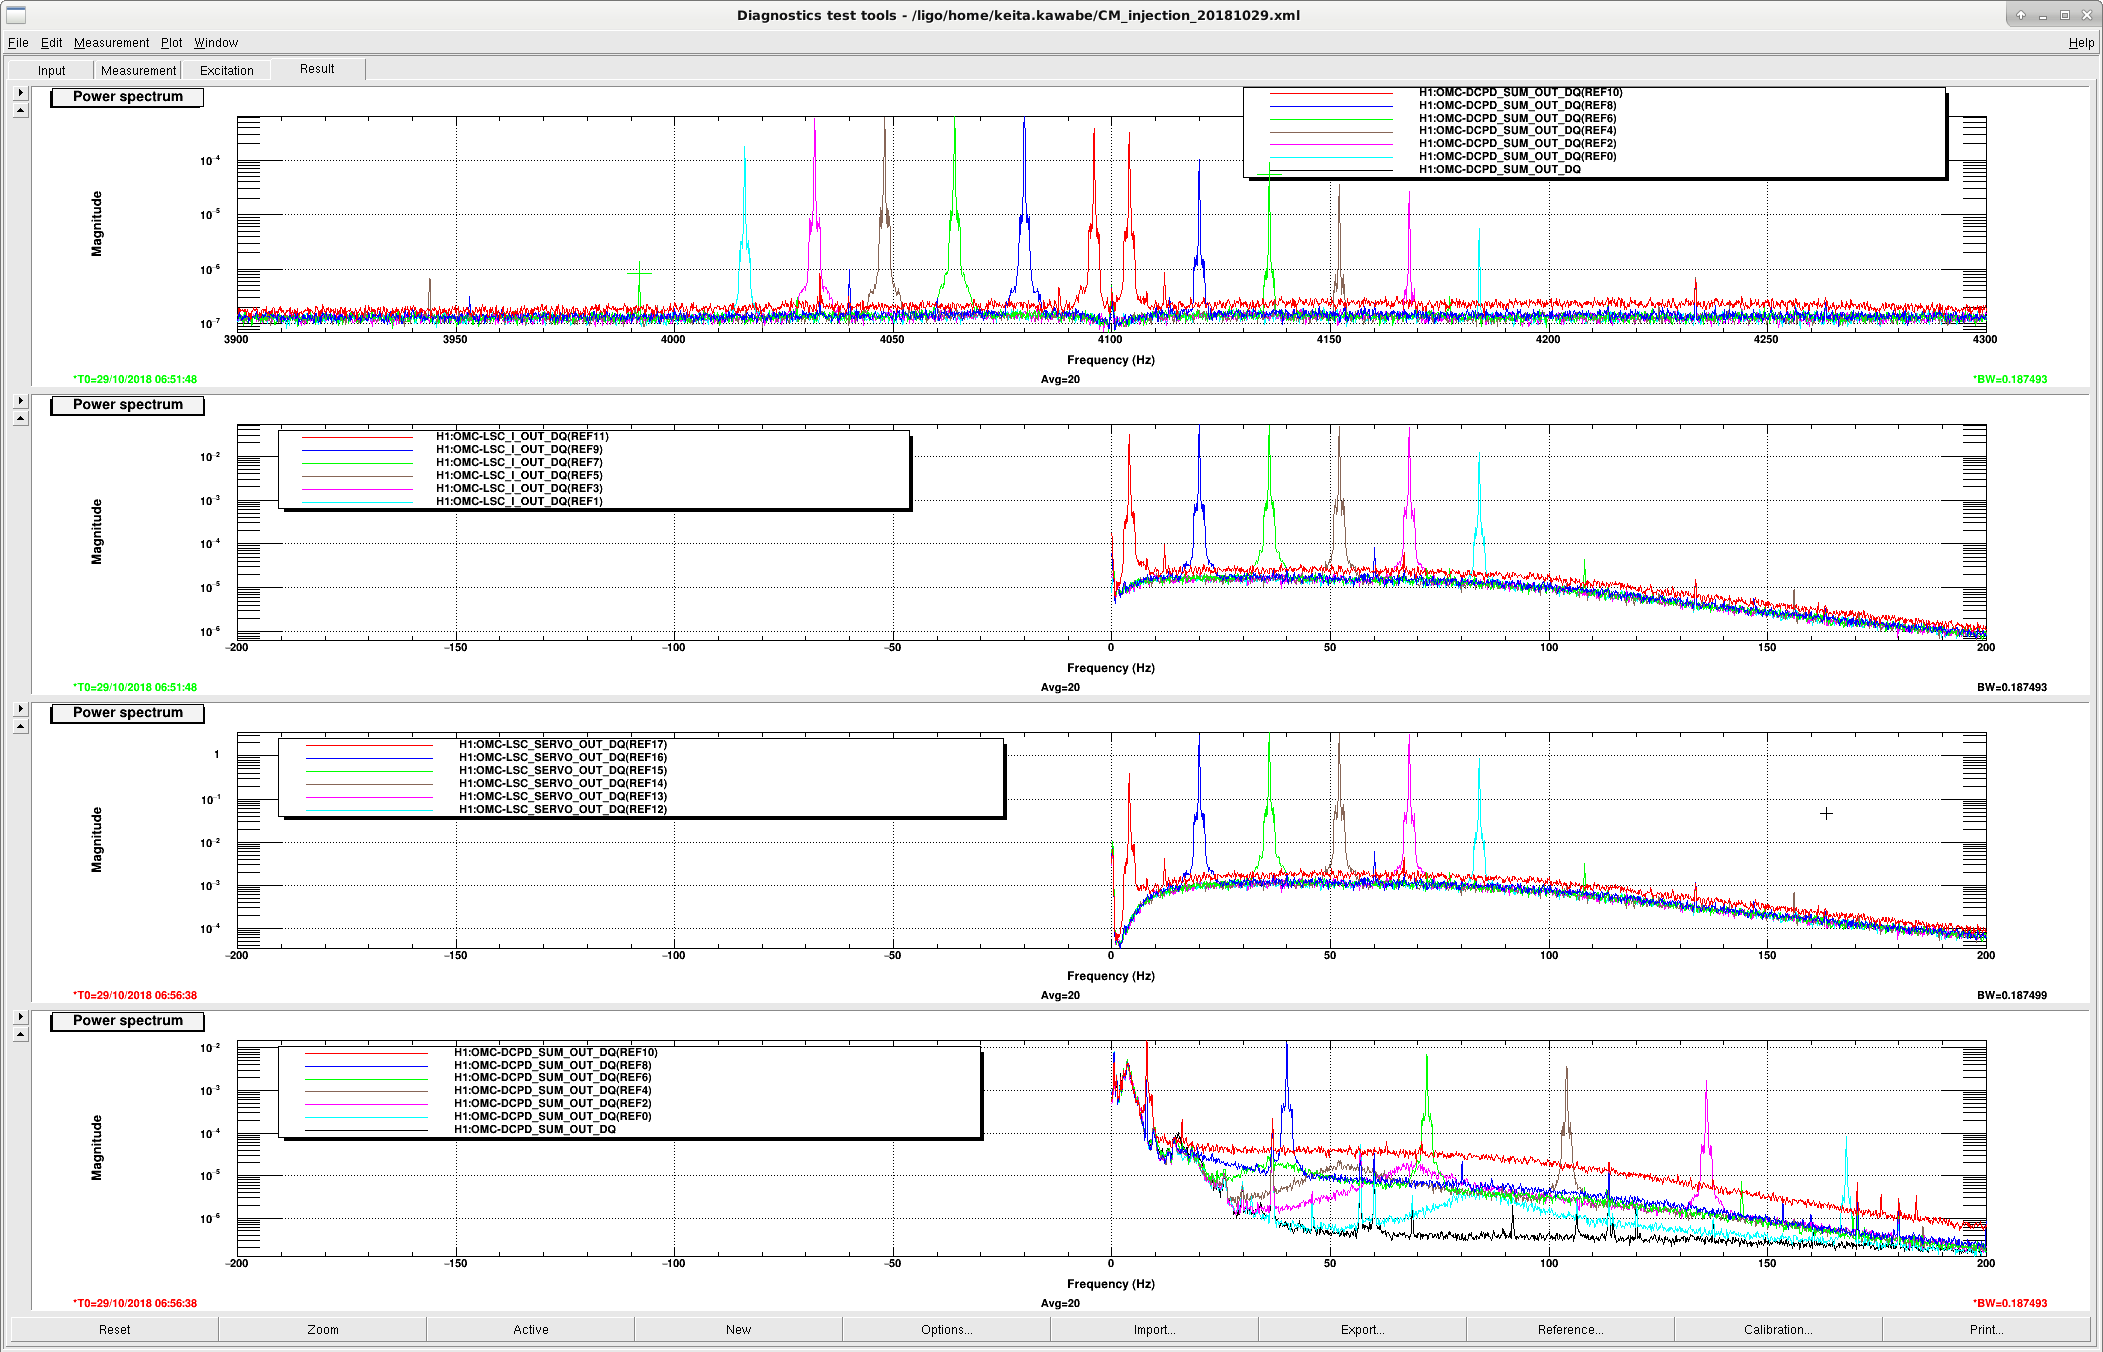
There seem to be two different up/down conversion paths here. Look at the bottom of the attached.

One path makes a broad bump at fd-finj where fd and finj are the frequency of OMC dither and CM injection respectively. The effect seems to be small and doesn't matter that much.

The other makes a peak at 2*(fd-finj). This is because of the following mechanism.

CM(finj) shows up in OMC transmission at finj -> OMC length demodulates at fd to down-convert to fd-finj

-> OMC length servo imprints fd-finj in OMC length -> therefore it shows up in OMC transmission as 2*(fd-finj).

We need a real estimate of the frequency noise to see if this is a problem.

I'll wait for a proper analysis by Craig.


Preparation:

DCPD SUM propto [P0+dP(finj)]*[L0+dL(fd)+df(finj)*RT/FSR]^2    --- Eq1

where P0, dP, L0, dL, df, RT and FSR represent power of the light  coming from IFO, small power modulation generated in the IFO (not OMC) by the CM injection, OMC length, OMC length dither, frequency noise hitting the OMC in Hz/sqrt(Hz), round trip length of the OMC and FSR of the OMC. propto is used as "proportional to".

In the attached, finj was smaller than fd in all of the traces (e.g. 4064Hz for the green). In DCPD at DC (bottom), you can see that there are broad bumps at fd-finj as well as huge peaks at 2*(fd-finj).

In the top panel, large peaks to the left of 4100Hz are direct finj terms:

Direct peaks at finj = A*[dP(finj)*avg(L0^2)+2*P0*rms(L0)*df(finj)*RT/FSR].   --- Eq2

(Averaging and RMS are made over the entire frequency band. I ignored avg(dL^2) and avg(df^2) for convenience, but when you do the quantitative calculation you need to substitute avg(L0^2) with avg(L0^2+dL^2+(df*RT/FSR)^2).)


Direct down conversion not likely a problem:

Direct down conversion terms in EQ1 are

2*dL(fd)*[dP(finj)*L0+P0*df(finj)*RT/FSR]    at fd-finj  --- Eq3

If the second term is dominant I expect to see a clear peak corresponding to this in the bottom plot at fd-finj because P0 has a large true DC value. Instead we have broad bump. So the direct down conversion mechanism is likely from the first term where L0 is zero at DC . In other words, this is an amplitude noise coming from IFO, not frequency noise hitting OMC.

Anyway, from the top plot it's clear the CM injection is almost 4 orders of magnitude larger than the background frequency noise at the measurement frequency bin. It could be even larger but we cannot know as we're just looking at DCPD, not true frequency noise. If you simply lower bumps by 4 orders of magnitude, it would be an order or two smaller than no injection trace (black). Therefore, unless these are proportional to injection^n where n is a constant that is smaller than 1/2 or something, this is probably not a problem. 

(Update: Since the bump in OMC length L0 seems to have the width of 100Hz or so, let's compare the injection power with the background frequency noise power at 4100+-100Hz. In this plot there are about 2000 frequency bins, and the injection peak is ~1E4 larger than the background at least, so RMS to RMS the injection is at least 1E4/sqrt(2000)~200 larger than the background frequency noise in this band. The real frequency noise floor could be even lower.

If you lower the bumps by a factor of 200, they are below the non-injection spectrum by at least a factor of 2 or so.)

But that should be experimentally determined. I'll wait for Craig's more detailed analysis.

It would be useful to change dither strength dL(fd) to see how the bump scales. Note that the change in dL also causes change in rms(L0+dL).


Path including OMC length servo causing 2*(fd-finj):

Eq2 is demodulated at fd by the OMC length loop and down converted to OMC length at fd-finj (middle two plots).

OMCL error propto  [dP(finj)*avg(L0^2)+2*P0*rms(L0)*df(finj)*RT/FSR]   at fd-finj. --- Eq4

(Update: This happens even if dL(fd)=0 because this is purely in software demodulation.)

OMC length loop imprints this into the physical length of OMC, i.e.

L0 propto [dP(finj)*avg(L0^2)+2*P0*rms(L0)*df(finj)*RT/FSR] * G/(1+G)   at fd-finj  ---Eq5

where G is the OLTF of the OMC length loop at |fd-finj|, UGF at 6Hz and the shape is about 1/f from a few Hz to 100Hz.

Finally, plugging Eq5 back to Eq1, L0^2 term will bring the peak to 2*(fd-finj).

DCPD propto A*P0*[[dP(finj)*avg(L0^2)+2*P0*rms(L0)*df(finj)*RT/FSR] * G/(1+G)]^2 at 2*(fd-finj). ---Eq6

This is suppressed by DARM loop by injecting this into physical DARM.

The fact that the peaks in the bottom plot goes down as the frequency goes up (despite larger DARM loop suppression at lower frequency) seems to make sense qualitatively.

Anyway, this seems to be a linear coupling with side lobes. Lowering the peaks in DCPD at fd-finj (bottom) by four orders of magnitude, the peaks seem to come above the no injection curve. So here we need a real estimate of the frequency noise. Again will wait for Craig.

We could simply change OMC length gain (thus G) to see if this matters, as the UGF is about 6Hz and anything above UGF in Eq6 is scaled by [G/(1+G)]^2 in Eq6.


Other peaks:

There are huge mirror peaks in DCPD at fd+(fd-finj)=finj+2*(fd-finj), e.g. for green trace of finj=4064, huge mirror peak is at finj+2*(fd-finj)=4064+2*36=4136Hz.

This should be P0*L0(fd-finj)*dL(fd) term in Eq1, i.e. a cross term of the dither itself and the fd-finj component in L0 (imprinted by OMC length loop). Another term, P0(2fd-2finj)*L0*df(finj) which is the cross term of the frequency noise df(finj) and the 2(fd-finj) component in P0 (imprinted by DARM loop), should not make a clear peak as it is also proportional to the OMC length L0 which should be zero at zero frequency.

I don't understand why there are smaller but definitive peaks at finj-2*(fd-finj). The same P0(2fd-2finj)*L0*df(finj) term will produce something but not a distinct peak. But I stop here.


Images attached to this comment
craig.cahillane@LIGO.ORG - 18:12, Monday 29 October 2018 (44897)
Quick plot showing the 2 *|f_inj - f_omc| reflection peak amplitudes in DARM for each injection frequency around 4.100 kHz (shown in plot 1 of the original post).
Approximately follows a 1/f^2 dependence.  
Images attached to this comment
craig.cahillane@LIGO.ORG - 02:00, Tuesday 30 October 2018 (44900)ISC
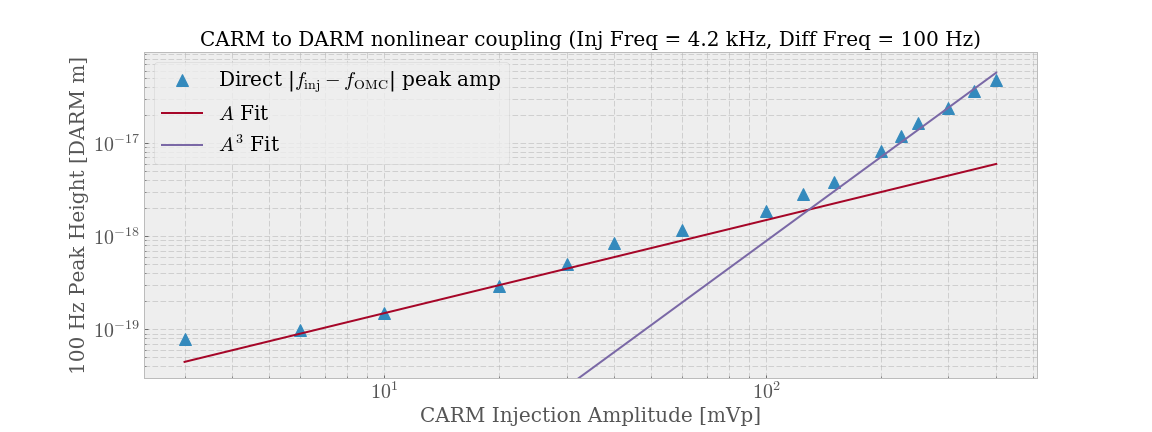
Quick plot of CARM peak injection amplitude at 4.200 kHz, (exactly 100 Hz away from the OMC dither) vs DARM peak intensity, with a focus on first order |f_inj - f_dither| broadband noise.

We can see two different mechanisms of frequency noise coupling to DARM. The first (the broadband noise) is a linear dependence on amplitude that dominates with low excitations, the other (a large spike) has an amplitude cubed dependence.

The first, linearly-rising broadband noise is consistent with Keita's intensity noise prediction.  We have no real proof yet that it's intensity noise other than Keita's finely honed noise hunting instincts.
-------------------------------------------------------------------------------------------------------------------------------------------

I was confused by this plot, as Keita's analysis does not have any obvious frequency-noise-cubed dependencies that work out to give us a response at |f_inj - f_dither|.  It turns out we have to include some higher order stuff to get the freq-noise-cubed terms, none of which is relevant for our noise levels.

-------------------------------------------------------------------------------------------------------------------------------------------
I also included an uncalibrated CARM error spectrum to give an idea of the relevant noise levels in CARM right now, assuming we aren't sensing noise limited at 4 kHz.

CARM Noise at the injection point at 4 kHz: ~ 2 uV/rtHz, or ~20 uV in a 100 Hz bandwidth around 4.1 kHz.

When compared with the lowest injection amplitudes of 3 mVp = 2 mV, we're about a factor of 10 away from seeing direct broadband noise in DARM from CARM.

-------------------------------------------------------------------------------------------------------------------------------------------

Koji OMC parameters
Images attached to this comment
Non-image files attached to this comment
H1 CDS
rana.adhikari@LIGO.ORG - posted 12:13, Sunday 28 October 2018 - last comment - 11:59, Monday 29 October 2018(44865)
Workstation login problem

Looks like the ligo.org auth system is not allowing logins right now. So we can't login to the control room workstations. The couple of stations that are already logged in continue to work, but we can't work on the interferometer like this.

For DCC/alog access, I'm able to use one of the backup servers. Hopefully, someone will read this and contact the authorities. Is there a way to redirect our control room workstations to use the backup for today?

Comments related to this report
david.barker@LIGO.ORG - 11:59, Monday 29 October 2018 (44884)

Jonathan, Dave:

This unfortunate situation appears to have been the result of a series of unrelated problems. The ligo.org main server was down on Sunday (requiring the user to switch to backup servers for web based access) but this is not used for workstation authentication. The first workstation used (zotws11) had a login issue which was verified by Hung Yu this morning and resolved by him booting the machine. The second login attempt on zotws21 appears to have a typo in the login text.

It is still a mystery why zotws11 was refusing console logins over the weekend.

H1 General (DetChar, ISC, SEI)
rana.adhikari@LIGO.ORG - posted 23:05, Saturday 27 October 2018 - last comment - 10:25, Monday 29 October 2018(44862)
back to locking

Last night, the microseism went up to ~1 um/s and we had trouble locking. This continued all day today. I redid some DRMI alignment (very small adjustments) and Sheila and I switched the SEI FF state a bit, and now things are locking well. WE have gotten to low noise many times tonight.

I was curious about what counts as 'high useism'. This plot (https://ldas-jobs.ligo.caltech.edu/~detchar/summary/day/20181027/sei/ground_blrms/) compares the BLRMS at the 2 sites. As you can see, LLO has no serious problems with ~1 um/s.

Reading many entries, there are several times in the LHO log over the past few years where people not how the locking is really poor when the useism is at 1-2 um/s. Sometimes this also includes wind.

It would be useful if someone in DetChar could crawl through the locking records over the past few years to find out how touch locking is as a function of seismicity. So that in addition to the word of mouth guidance, we also have a some kind of DHS threat level that incorporates ground, wind, etc.

Comments related to this report
brian.lantz@LIGO.ORG - 10:25, Monday 29 October 2018 (44883)

A good place to start is the study that Jim Warner did during O2

Commissioning F2F Environment and Duty Cycle G1700246

and this is also useful:

Seismic controls site differences G1700245

H1 ISC
jenne.driggers@LIGO.ORG - posted 17:16, Thursday 25 October 2018 - last comment - 16:10, Friday 02 November 2018(44838)
Adding a global IFO lock trigger to models that receive ISC signals

I have modified a large quantity of models today, as part of ECR E1800304 / FRS 11676. The goal is to provide a front-end way to shut off ISC-related outputs when we have a lockloss, even if some of the EPICs connections are failing (which causes guardian to not be able to execute the full DOWN reset state).

The trigger of lock or not-lock is generated using a new row of the LSC trigger matrix.  That trigger is passed to all of our main IFO suspensions, as well as the ASC and OMC models.  Everywhere the trigger is used, it goes through a ramping code written by JoeB some time ago, so that signals can either be ramped to zero or immediately set to zero (by setting the ramp time to 0 seconds, as usual).  Each of these trigger blocks also has an Enable switch, so that we can chose to bypass use of the trigger for any particular set of outputs (eg, if we want to be triggering the output of the LSC model but not the ASC model, we'd bypass the trigger on the ASC model). 

To enable more flexibility, there are many different locations where the trigger can be used or bypassed. Some of these may seem somewhat redundant, but I wanted to give each site flexibility and also the ability to disable either inputs or outputs of the suspension filter banks. I list the groups here.  For each group, there is only one trigger / ramp that controls them all.  All of these channels should be initialized properly with their ENABLEs set to 0 by default, which should give no net effect when we first install them, so that we can decide which ones we want to utilize.  Each of these also has a monitor channel _IS_RAMPING.

Note in particular the things that I have not given triggers to: the IMC mirrors, or the IMC ASC dof outputs, since we want those to be active separately, and don't want a lockloss to kick the IMC out of lock if it wasn't already going to be. I also did not give triggers to the ADS dithers.  I can add these if we think it's important.  I also did not include any squeezer-related optics, since that is a pretty independent system.  We can give the squeezer suspensions their own trigger if its needed.

I have not yet made any screen modifications (that will be tomorrow, hopefully).


When we are ready to implement this, we will need to restart:

For LLO, we will need to svn-up to get all of the modifications to the suspension library parts, then add the IPC receiver to the top model for each sus.  We will also need to hand copy the modifications to the LSC, ASC and OMC models.

EDIT: I have compiled all of the models, but not installed.  h1asc has an error, which I will work on debugging in the morning.

Comments related to this report
jenne.driggers@LIGO.ORG - 10:23, Friday 26 October 2018 (44846)

Found and fixed the problem with h1asc - a few of my new multiply blocks I had forgotten to connect.  Oooops.  It compiles nicely now. 

Also, I ran make install-h1lsc so that it would generate the lsc trigger matrix for me, but I have not installed any of the other models.

jenne.driggers@LIGO.ORG - 17:35, Friday 26 October 2018 (44854)

I have now made some screen modifications, enough that we should be able to roll this out on Tuesday.

I've added a row to the LSC trigger matrix, and also from the LSC trigger matrix screen you can access the new lockloss trigger screen.

After consulting with Rana and JeffK, I've moved the triggers in the suspension models to after the drivealign matrices, rather than just after the lock filter banks.  The violin triggers remain where they were.  No channel names will change as a result.

I have not done a make on any of the models - they should all get one (including LSC, ASC, and OMC) before installing on Tues.

david.barker@LIGO.ORG - 15:20, Monday 29 October 2018 (44887)

It looks like there is a problem with sending the TRIG_IFO signal to the end stations. We will most probably hold off on the upgrade until 6th November, so for now I've backed out the "make install-h1lsc" to revert the DAQ INI file.

jenne.driggers@LIGO.ORG - 16:10, Friday 02 November 2018 (44989)

For some unknowable reason, even though the end stations are now on PCIE dolphin, the send / receive parts in the models need to be the old RFM parts. This should be changed, so that the RFM parts have some name that is sensible, like PCIE_ENDS or something. 

Anyhow, I have undone all of Dave's temp changes from last week to the LSC model and the SUS common parts.  I added a 3rd sender to the LSC model, changed the EY model to use the mis-named RFM block, and and put in a mis-named RFM block into the new susetmx that has the 20 bit DAC.
Displaying reports 44821-44840 of 88410.Go to page Start 2238 2239 2240 2241 2242 2243 2244 2245 2246 End