This morning I measured and fit again the SRCL feed-forward. Measurements attached.
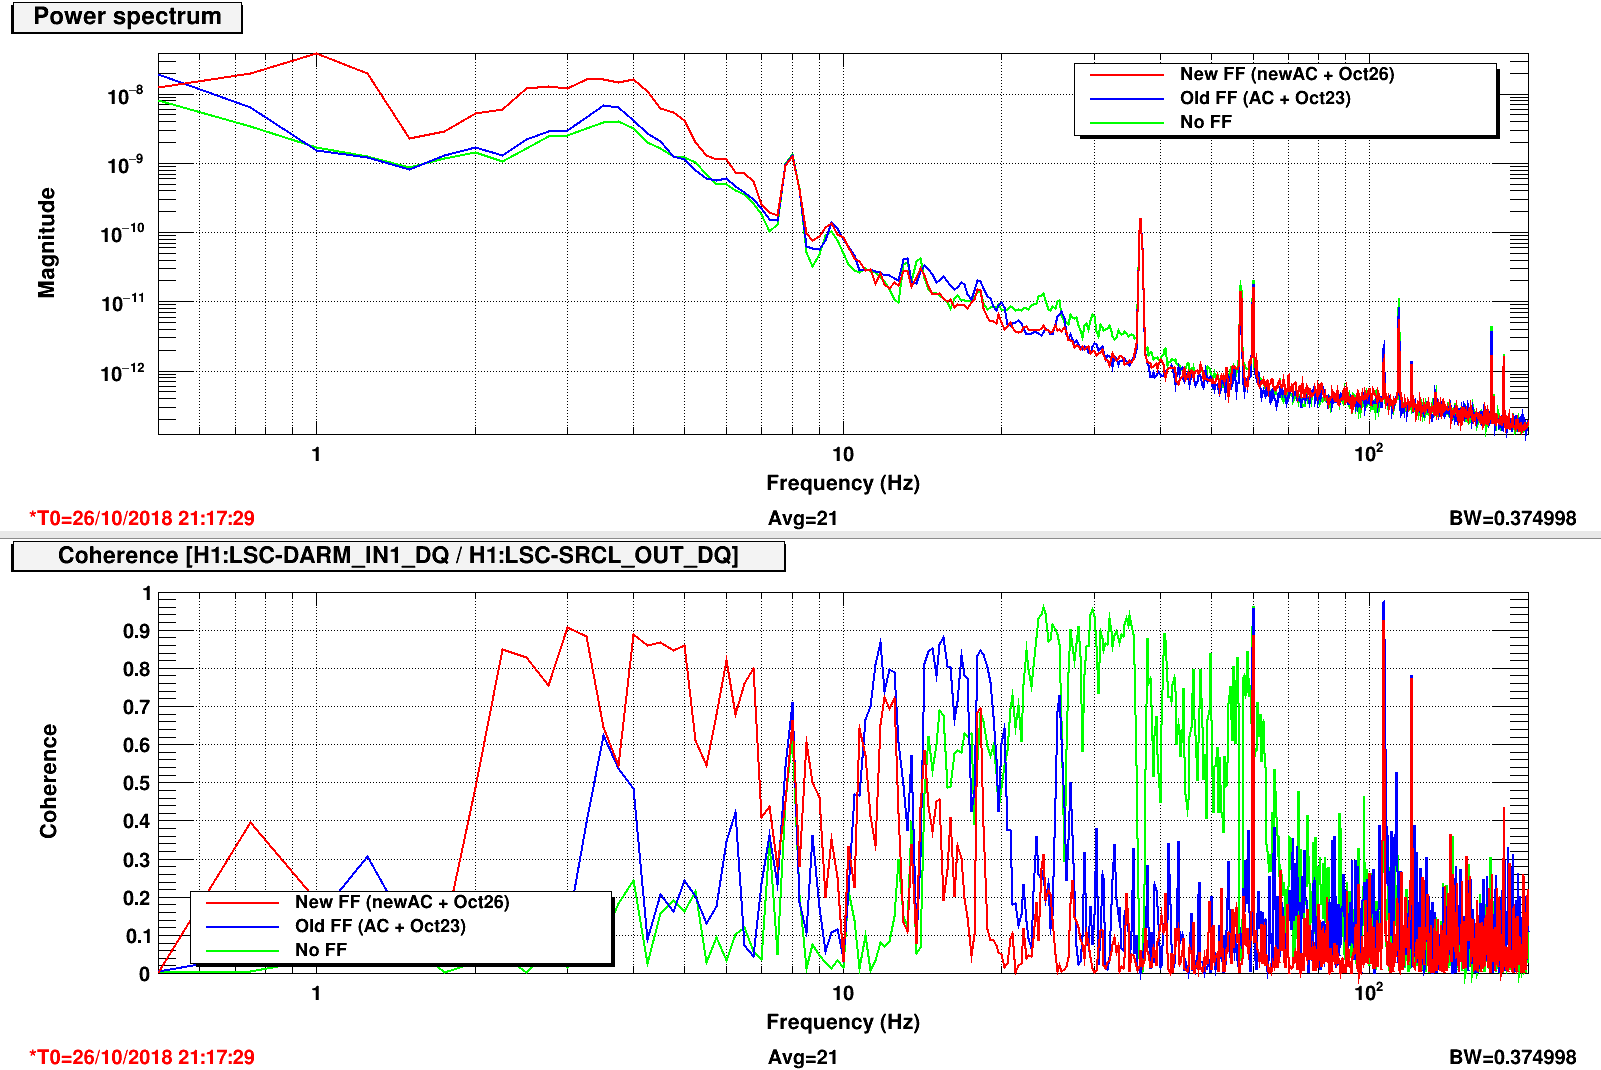
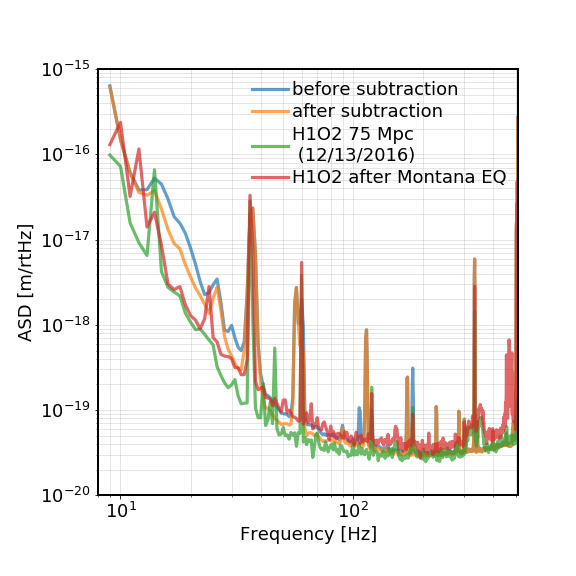
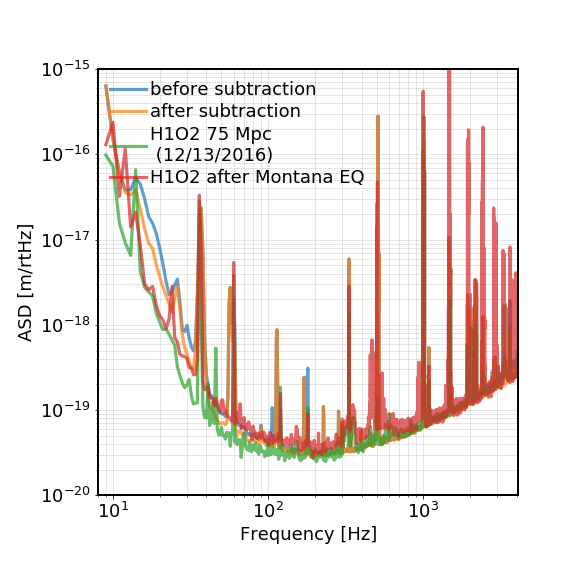
The new feed-forward filter is effective in reducing the SRCL coupling (indeed the old feed-forward was amplifying the SRCL noise in DARM between 10 and 20 Hz) (figure 2)
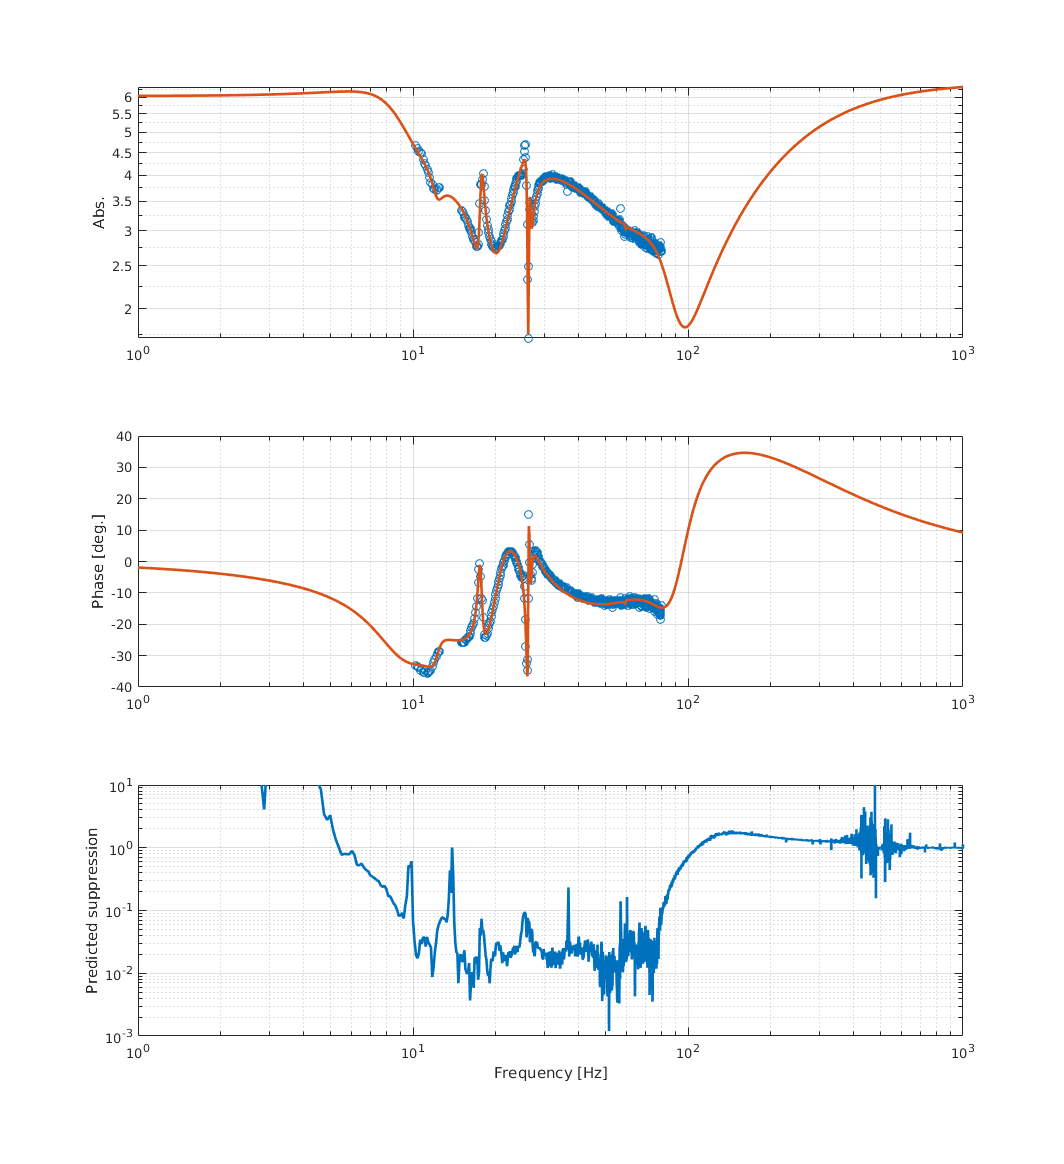
To improve the feed-forward between 10 and 30 Hz I designed a new AC coupling, with less phase rotation at 10 Hz, and with a band-stop between 0.8 and 1.2 Hz. Using this AC coupling I could fit a good filter down to 10 Hz (figure 1).
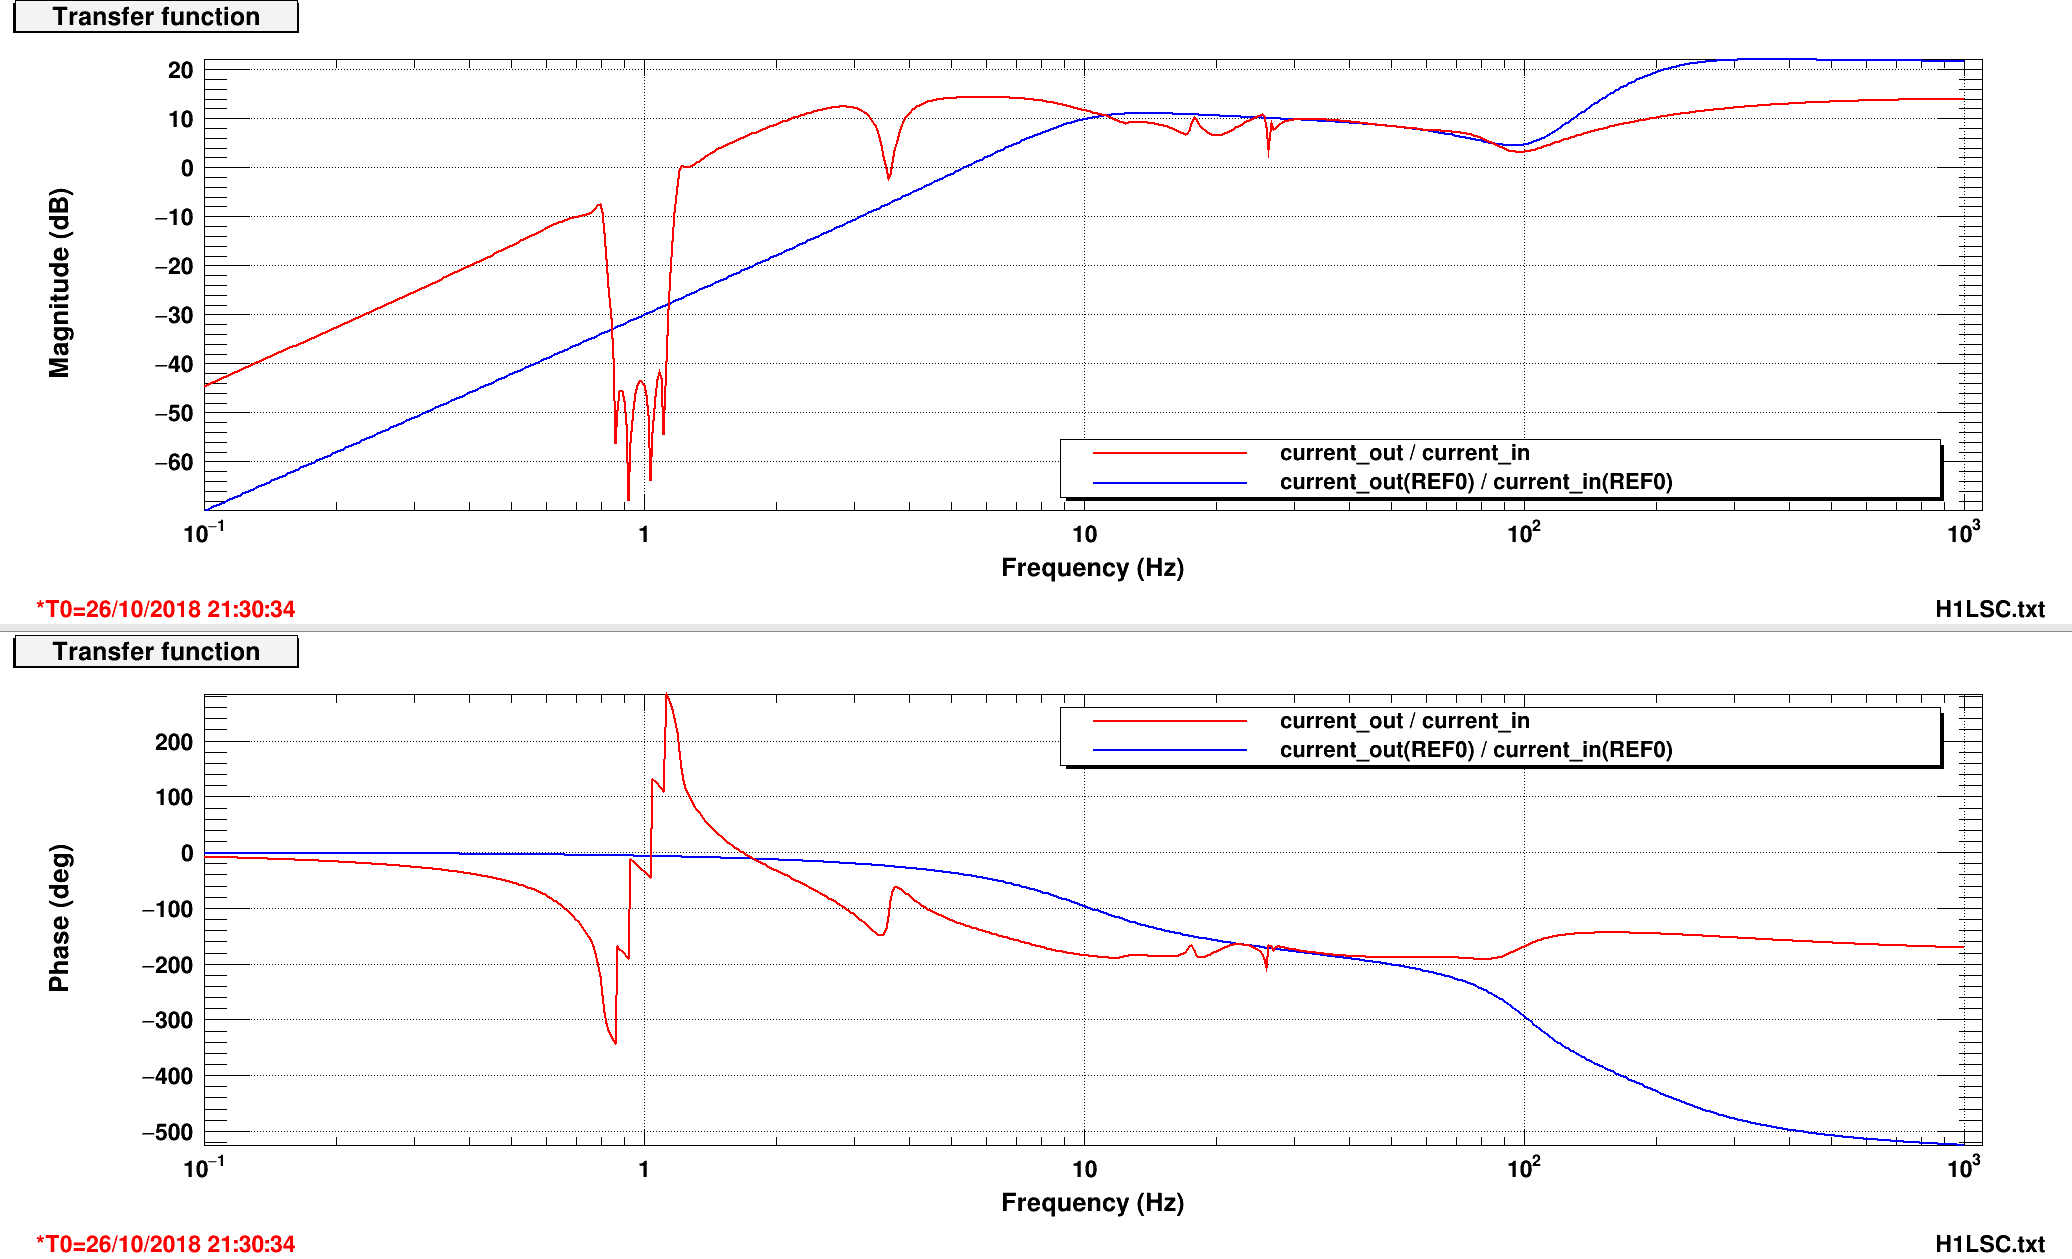
The band-stop reduced the feed-forward output at around 1 Hz well below the previous version (figure 4).
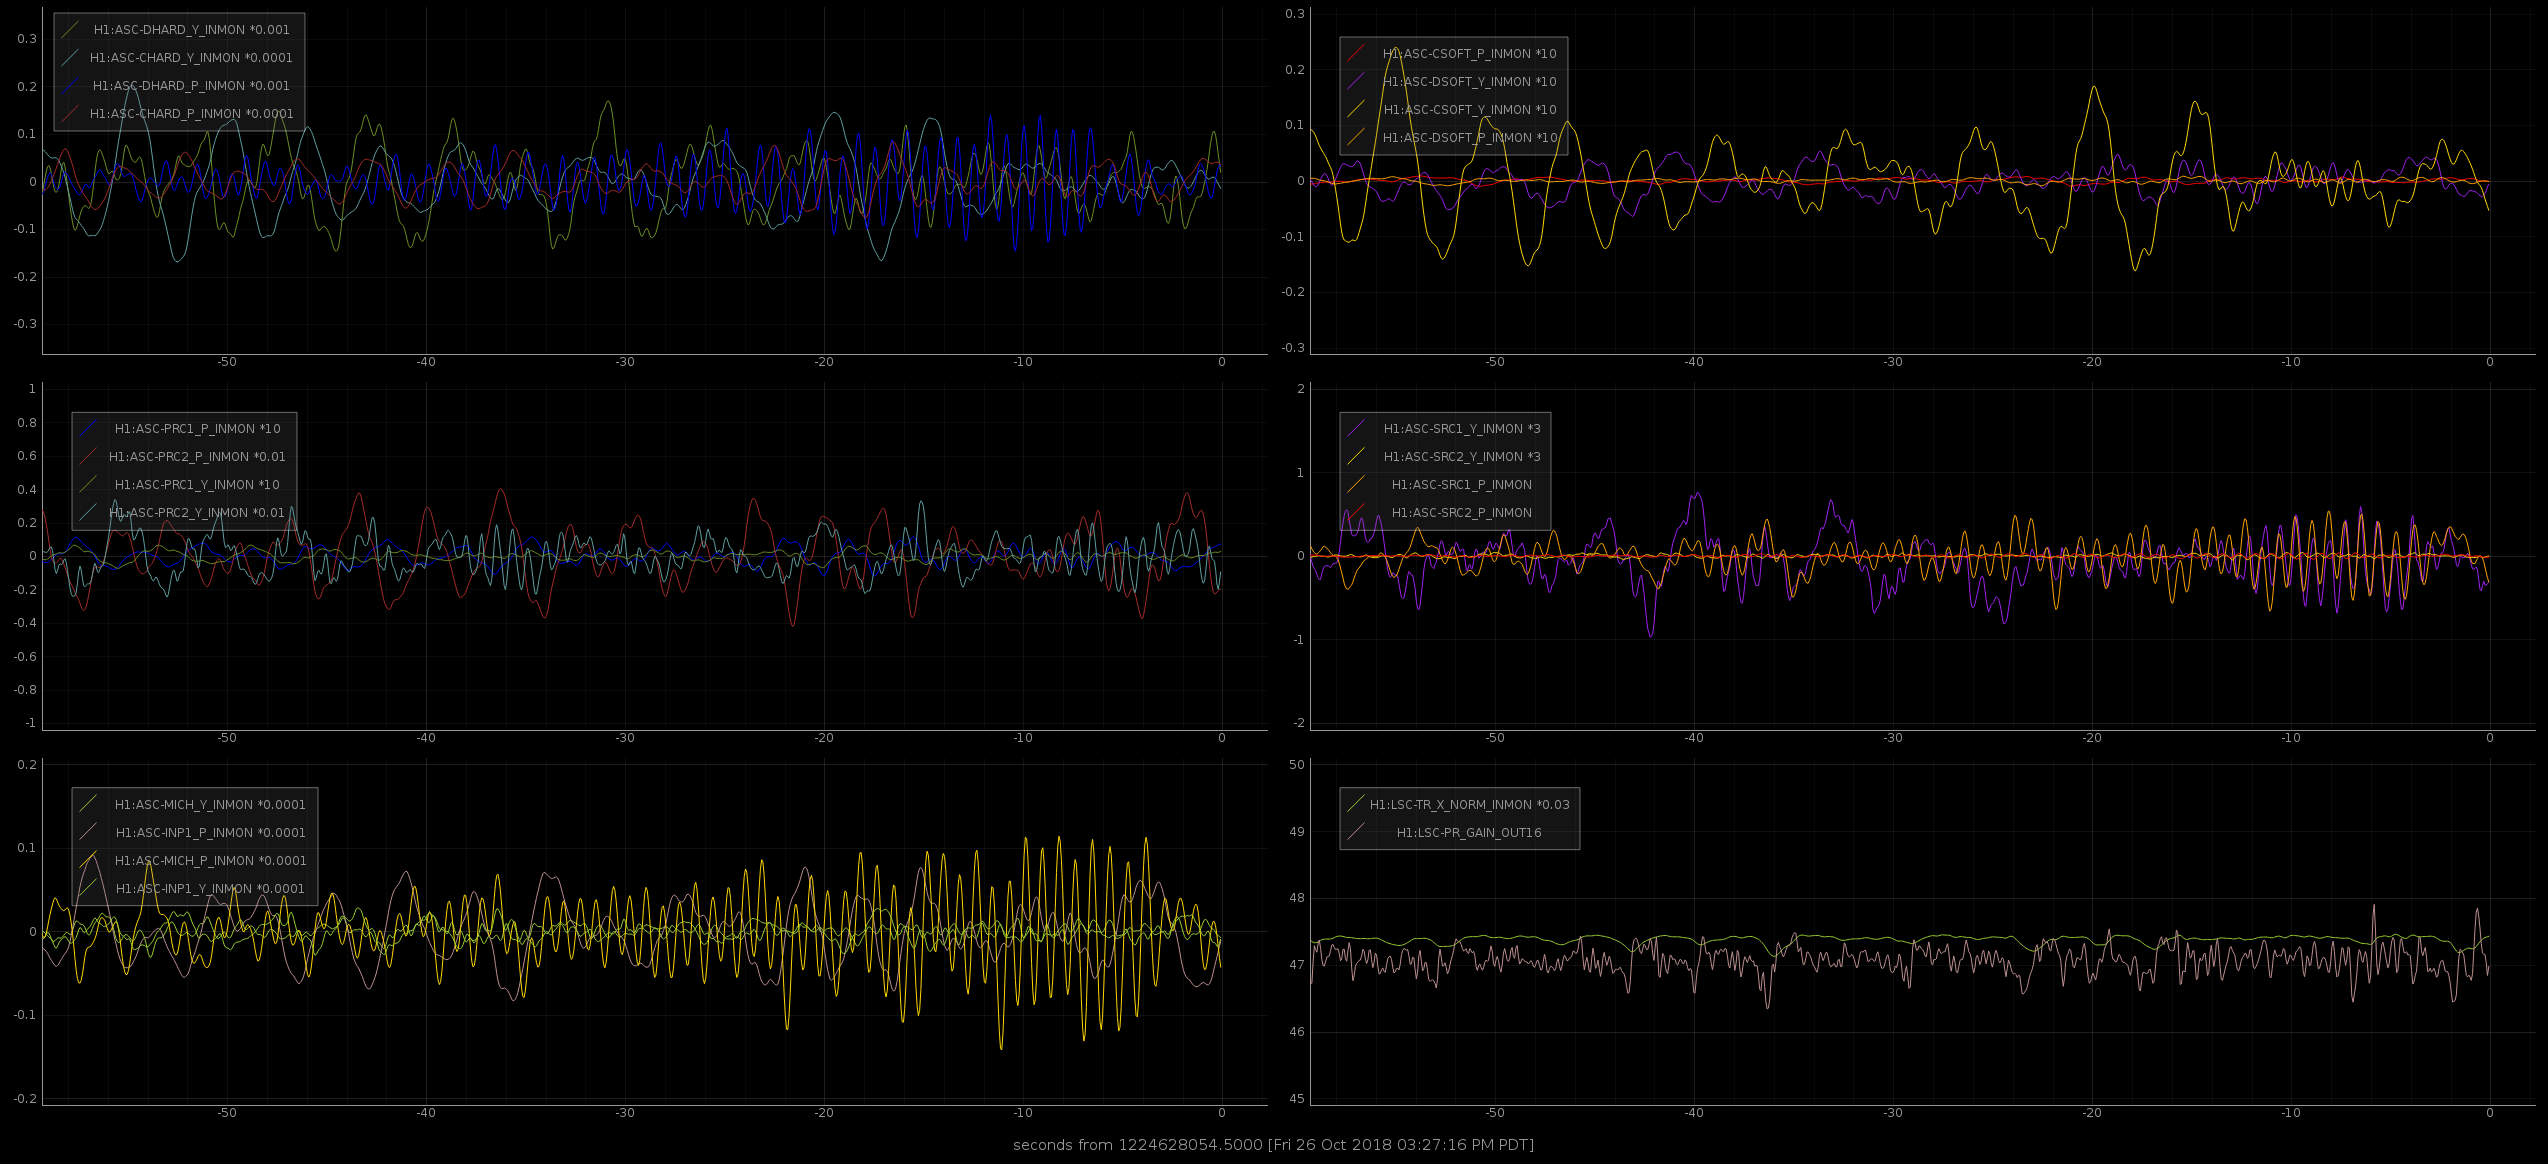
Unfortunately, the new feed-forward triggered again an instability that was slowly growing in many ASC signals. This time the instability is not at 1.1 Hz (the BS pitch mode) but at 1.2 Hz, which is exactly the corner frequency of the band-stop. So it seems this instability is not due to a too large control signal exciting a mode, but due to a spurious unstable loop. This makes it much harder to understand whether a given feed-forward is stable or not.
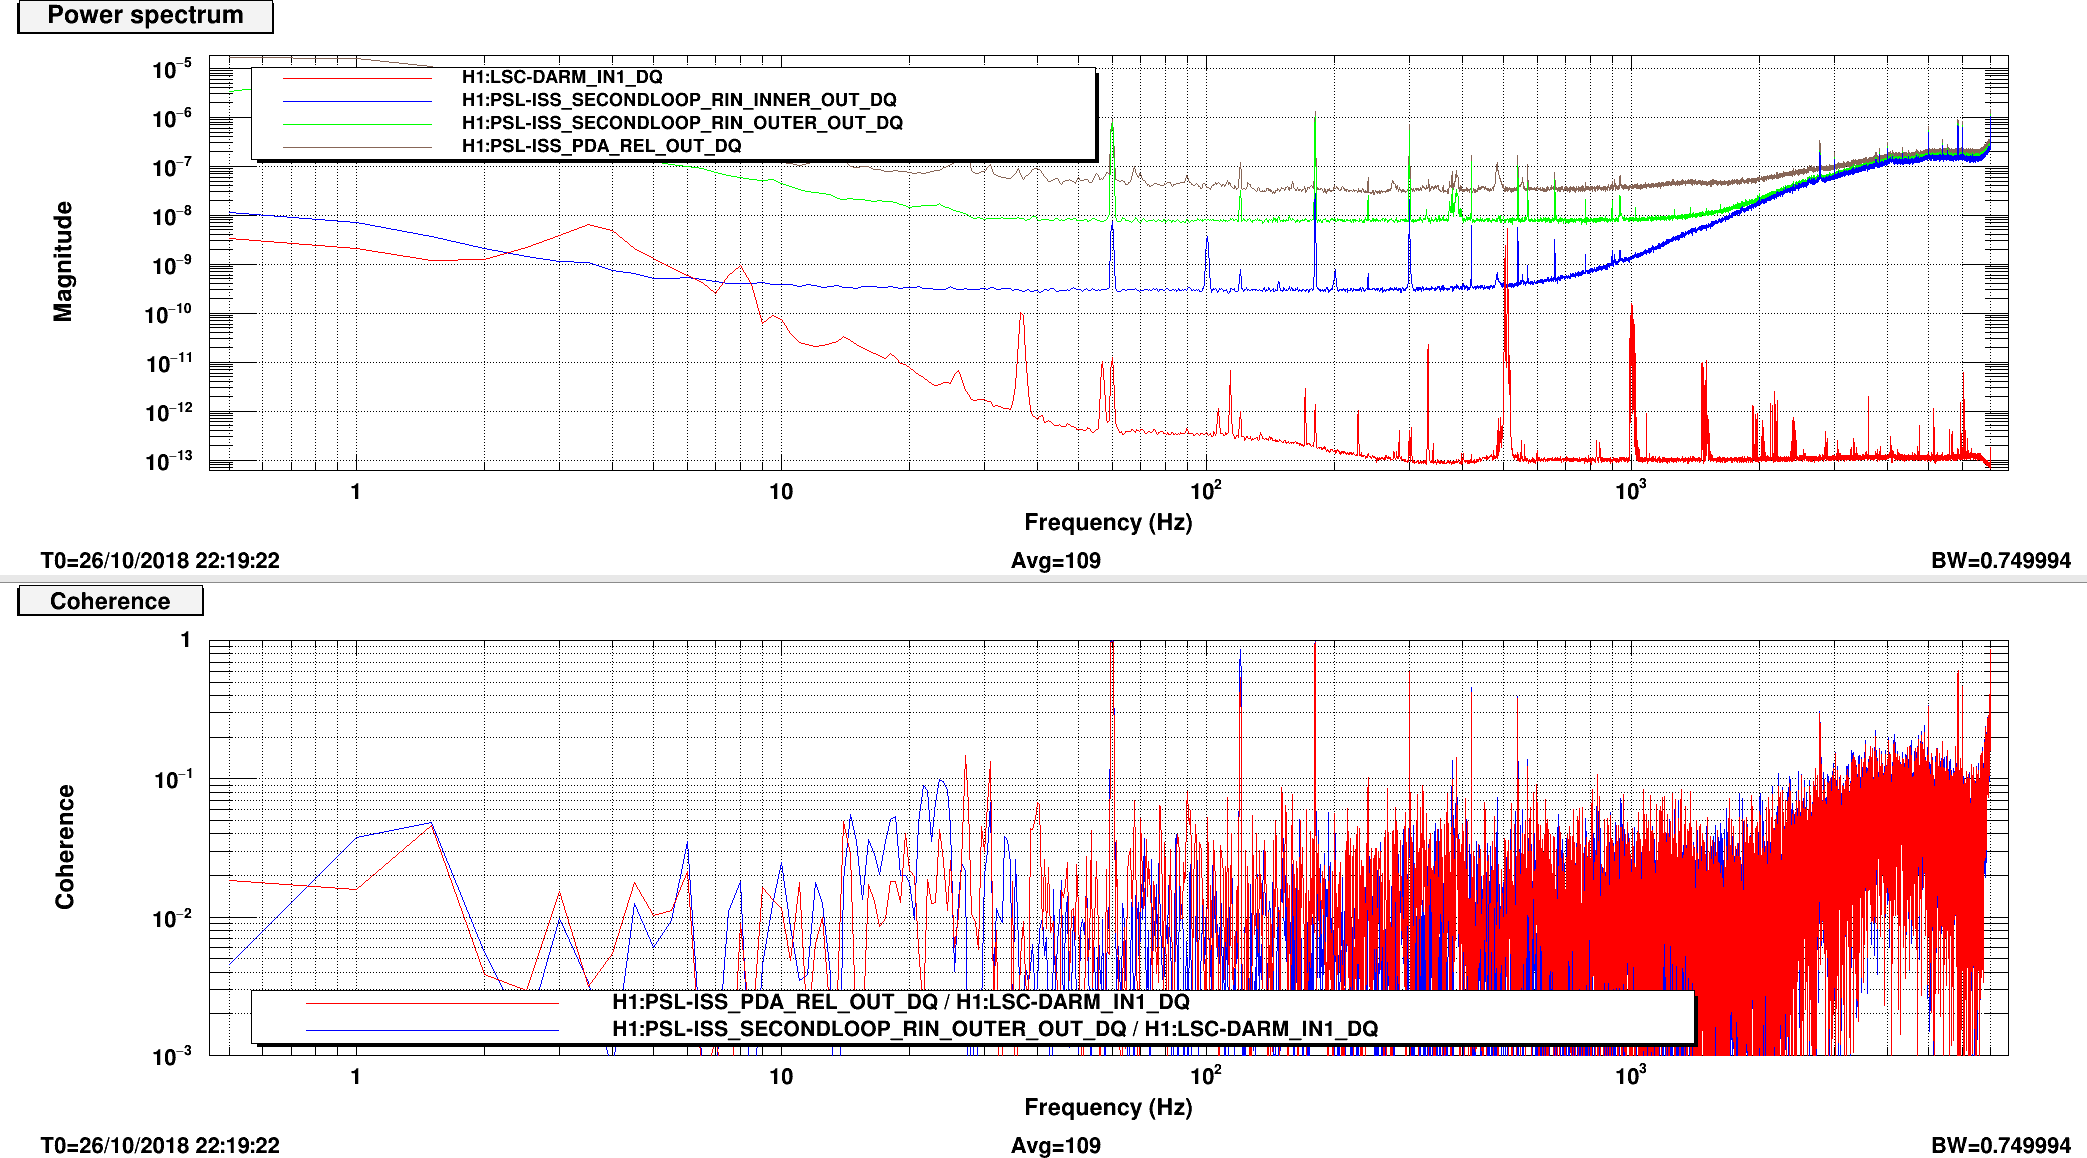
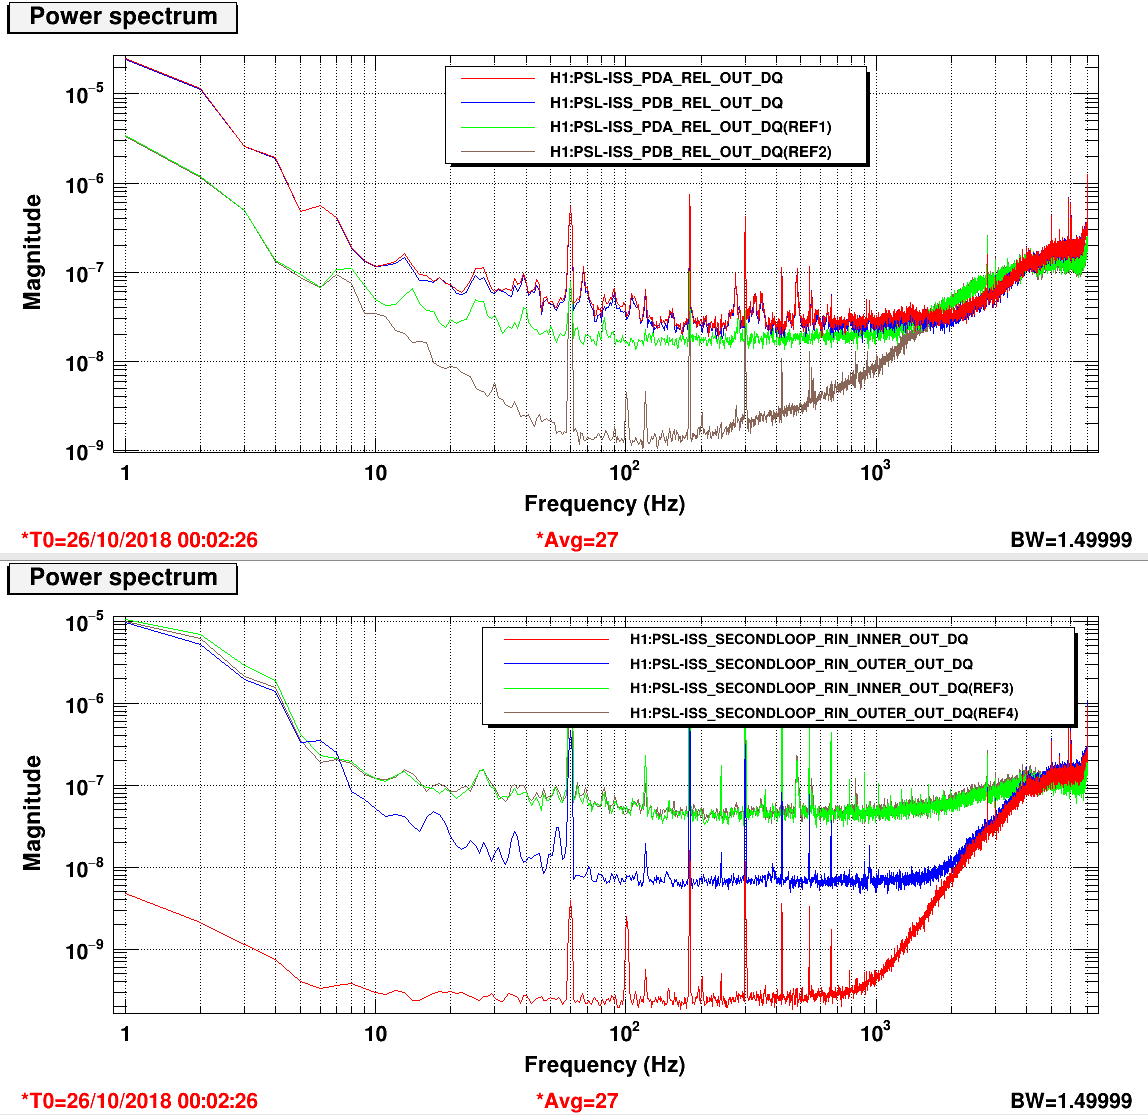
Coherence between DARM and ths ISS second loop out-of-loop sensor is at the 1e-2 level (below a few kHz). Similar coherence with the first loop sensors.
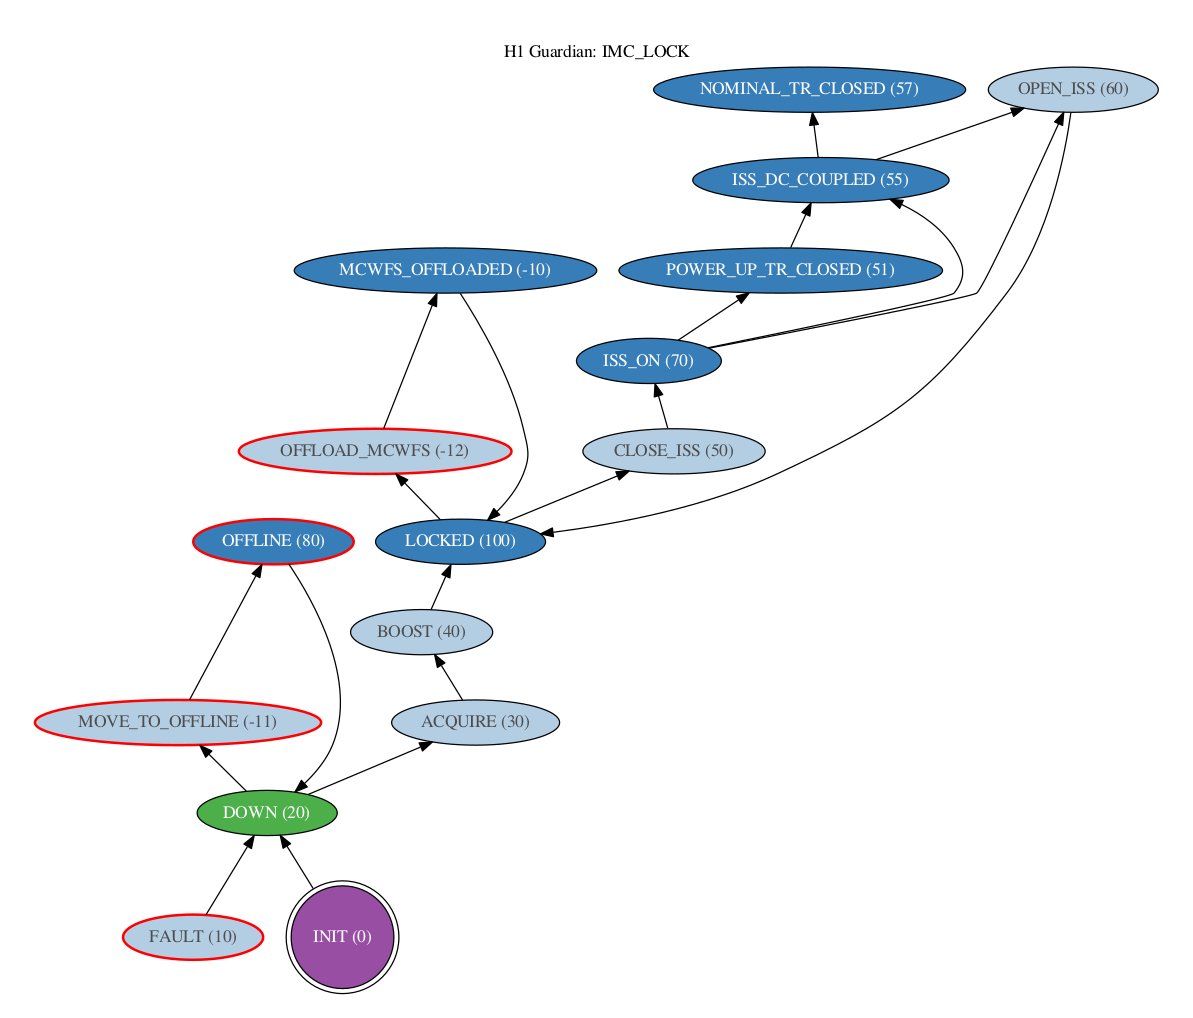
The IMC_LOCK guardian was missing a path from ISS_ON or ISS_DC_COUPLED to LOCKED that opened the ISS second loop.
Now it's been added. The ISC_LOCK DOWN state should request IMC_LOCK to got to LOCKED, and thus open the ISS second loop.
After the earthquake in Greece I thought I was going to be able to recover lock with no problems. But before beginning the lock sequence I accidentally pressed the load button on ISC_LOCK. Briefly after, I tried going through the lock sequence and ISC_LOCK crashed so I restarted the ISC_LOCK guardian. After this, it was obvious that the green alignment did not look good. After attempting initial alignment for a while I noticed that the OPS_OVERVIEW had many red triangles on the screen. I do not know how long the screen was in this state. I figured I would not make things worse as I do not know how to recover from this so I restored the alignment to what it was before the earthquake. I am leaving the interferometer in initial alignment. I apologize in advance to the early morning commissioners if I have caused you any woes.
Thank you for putting the alignment sliders back - that's the right thing to do when you're feeling lost, and it makes things much easier. The red triangles indicate that all seismic platforms and HEPIs had their watchdogs tripped and were not in the correct state - this is a tricky one to recover from if you haven't done it before.
Not a huge deal but I changed OFI OSEM input/output matrix for L and increased L damping gain in FM6 of H1:SUS-OFI_M1_DAMP_L from 20 to 4000 because they didn't make sense (and because IFO was down due to EQ).
What was wrong?
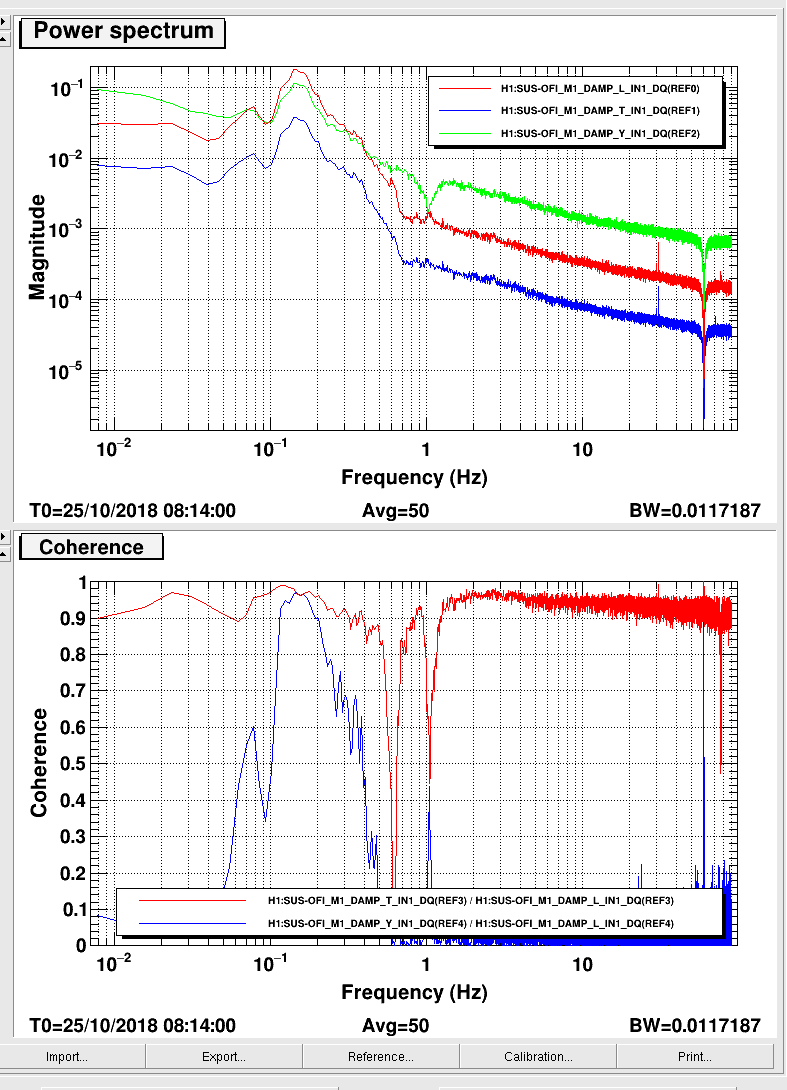
OFI OSEM input/output matrix for L were nonsensical, L mostly sensed and actuated on T. See the first attachment where L was mostly just about 4*T. L and T were perfectly coherent even at noise-dominated frequency.
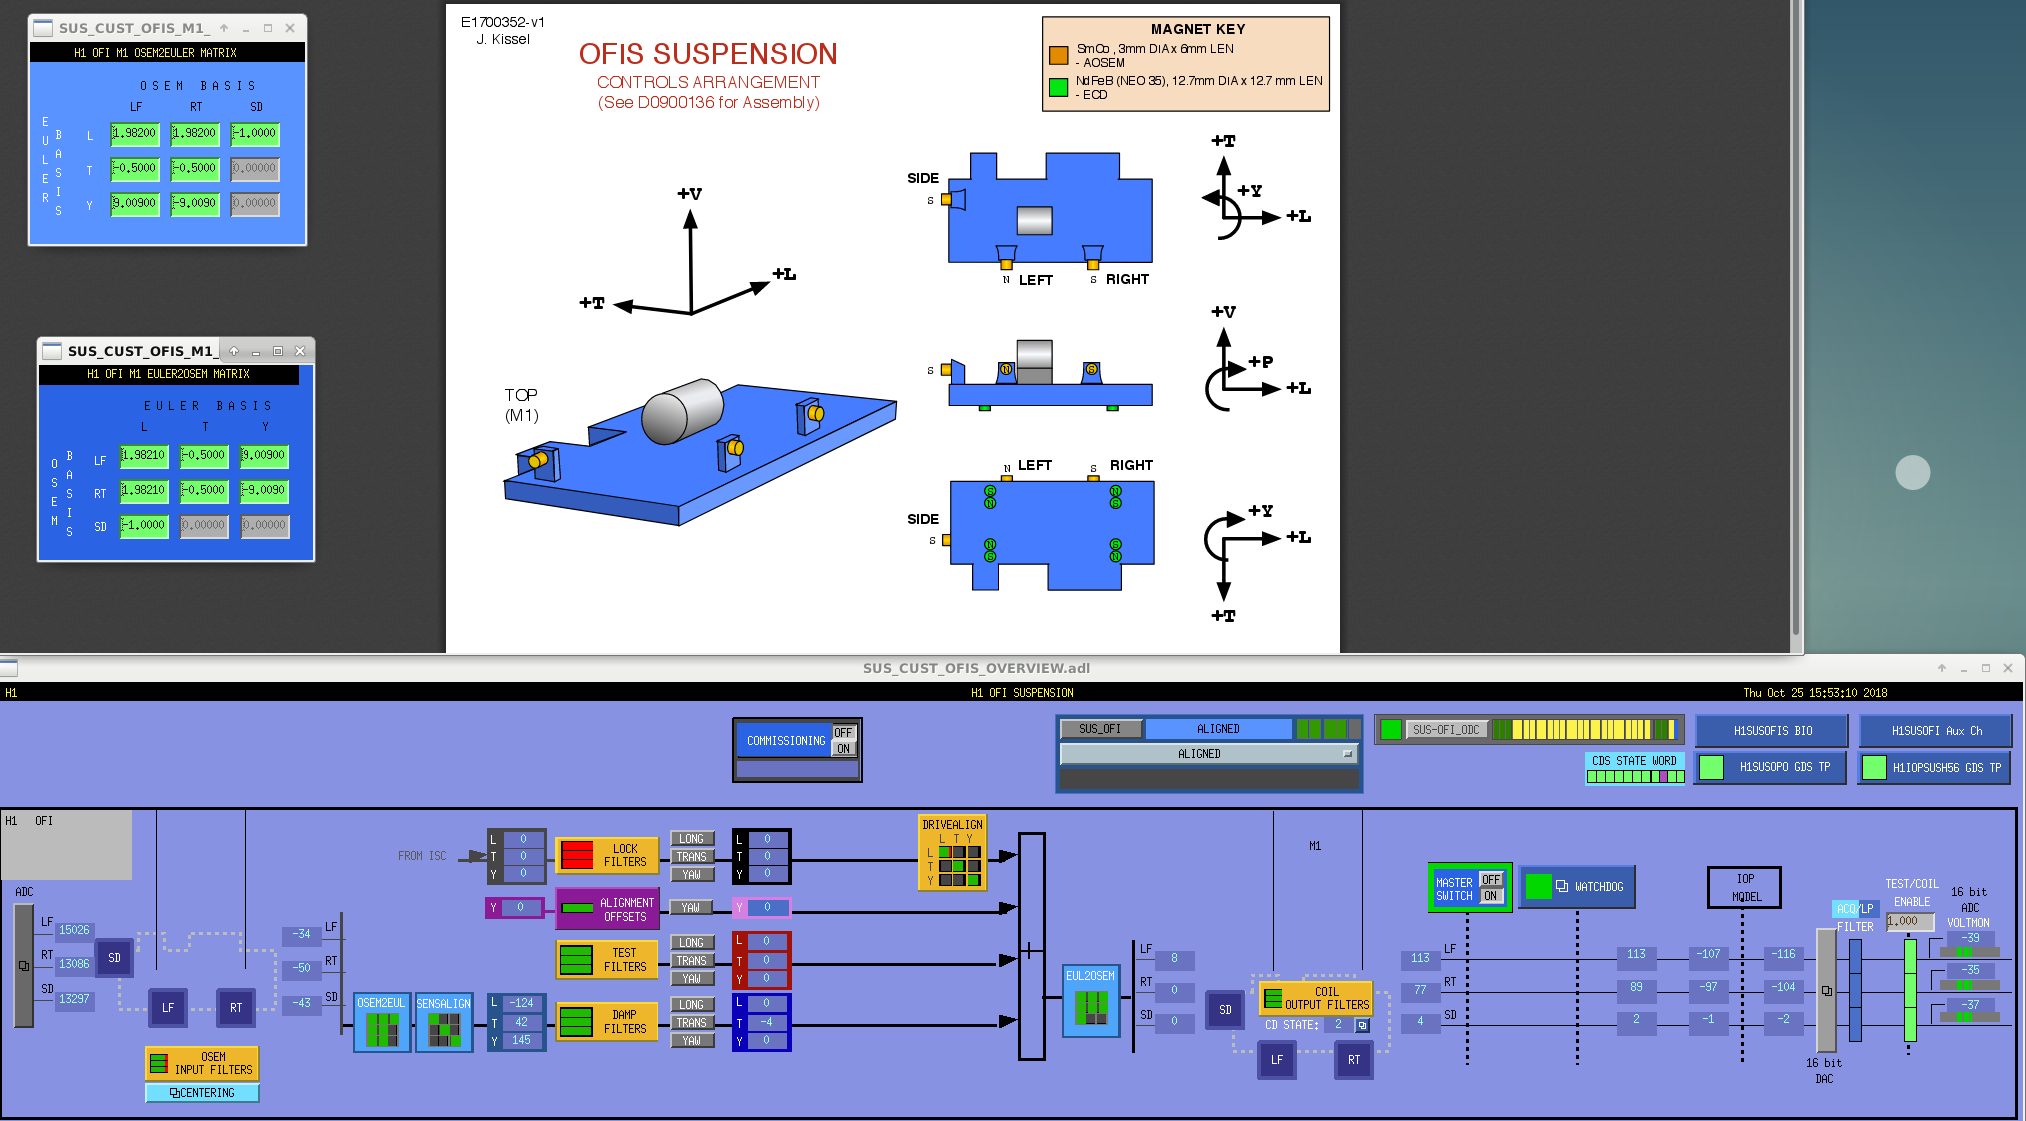
SD OSEM is sensitive to L as well as a bit of Y(=LF-RT), thus L should be linear combination of SD and LF-RT. In reality L was configured to be mostly LF+RT(=T) with much smaller SD mixed in as shown in the second attachment.
These matrices were set in Jan 2018 (alog 40204).
What was done?
SD sensitivity to YAW is proportional to the position offset of SD OSEM from the longitudinal (i.e. Y-arm direction) center line of the bread board, which seems to be 2.18" according to D0900136.
Similarly LF and RT offset from the X-direction center line of the bread board seem to be 4.38". Due to OSEM locations, the sign of Y sensitivity for SD and LF are the same.
SD=-L+2.18"*Y
LF=T+4.38"*Y
RT=T-4.38"*Y
L=-SD +(LF-RT)* 2.18/4.38/2 = -SD + 0.249 LF - 0.249 RT.
Actuation math should be the same (if I ignore potential difference between COG and the center of the bread board).
I changed both of the matrices accordingly. Since there's no good reason for L damping gain (was 200) to be much smaller than T damping (4000) any more, I increased the FM6 ("gain") filter bank in H1:SUS-OFI_M1_DAMP_L from 200 to 4000. In the third attachment, right plot is before increasing the damping gain, left is after, both with a new set of matrices and both during the earthquake.
It seems like Y is mixing into L a bit (look at 1Hz Y resonance), I won't bother to fix it for now.
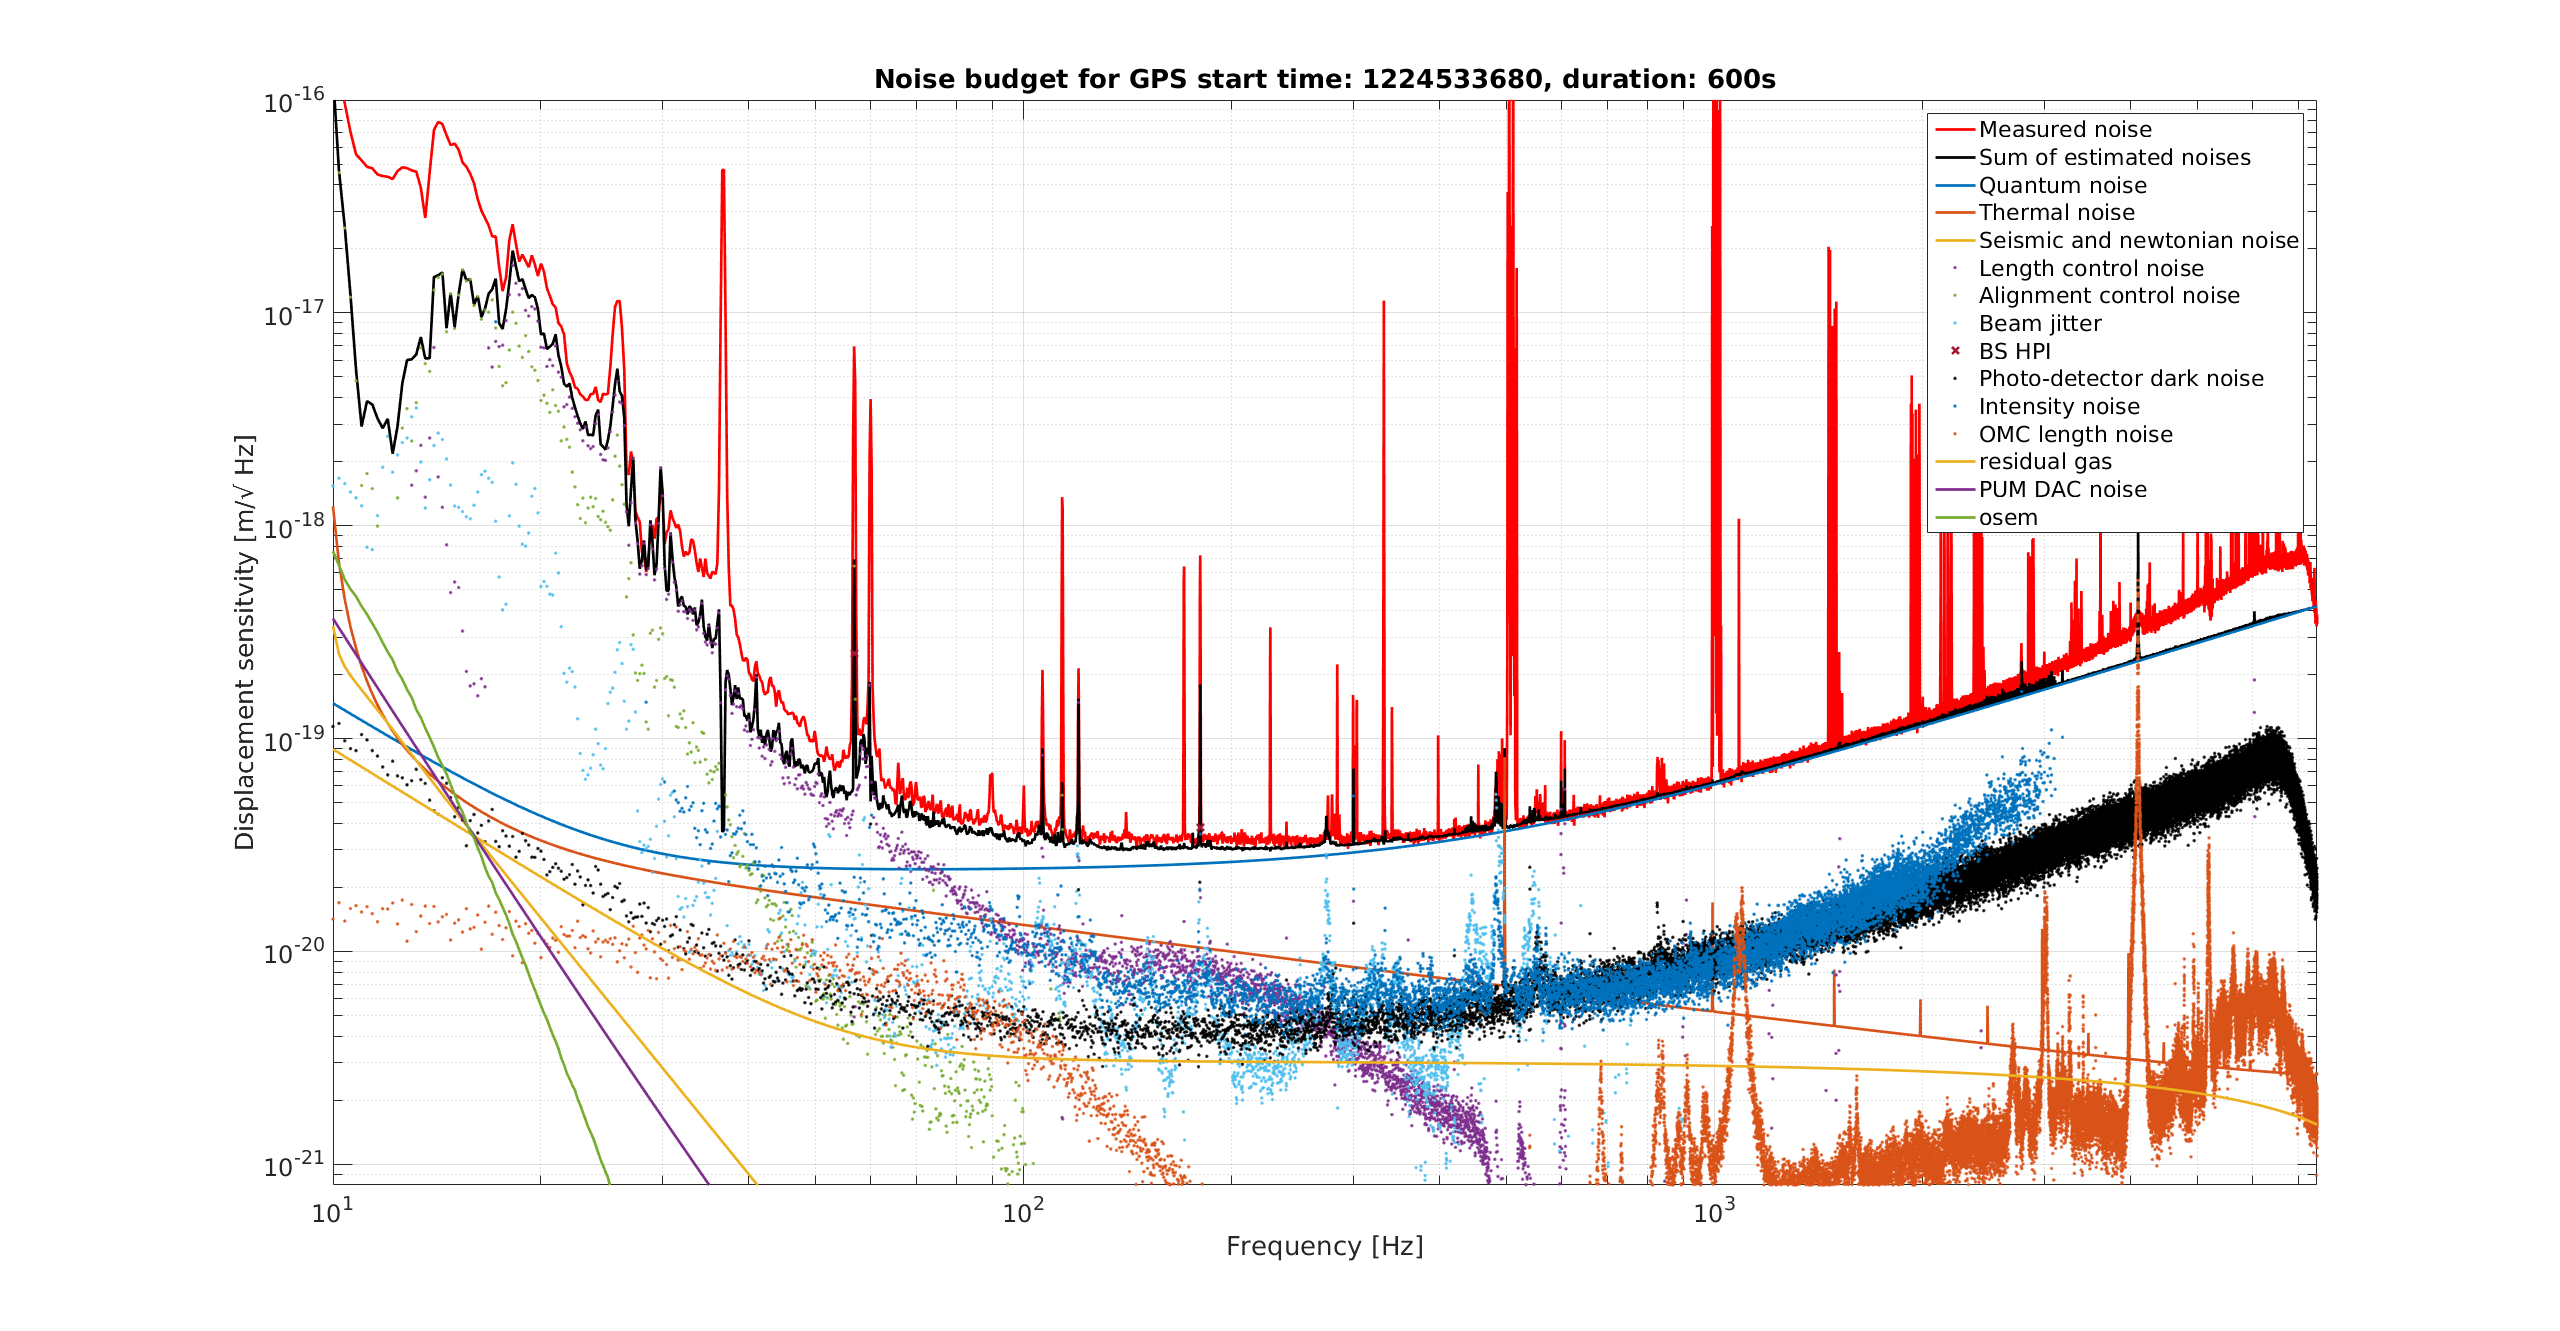
Here's an updated version of the noise budget with injections made over the last couple of days.
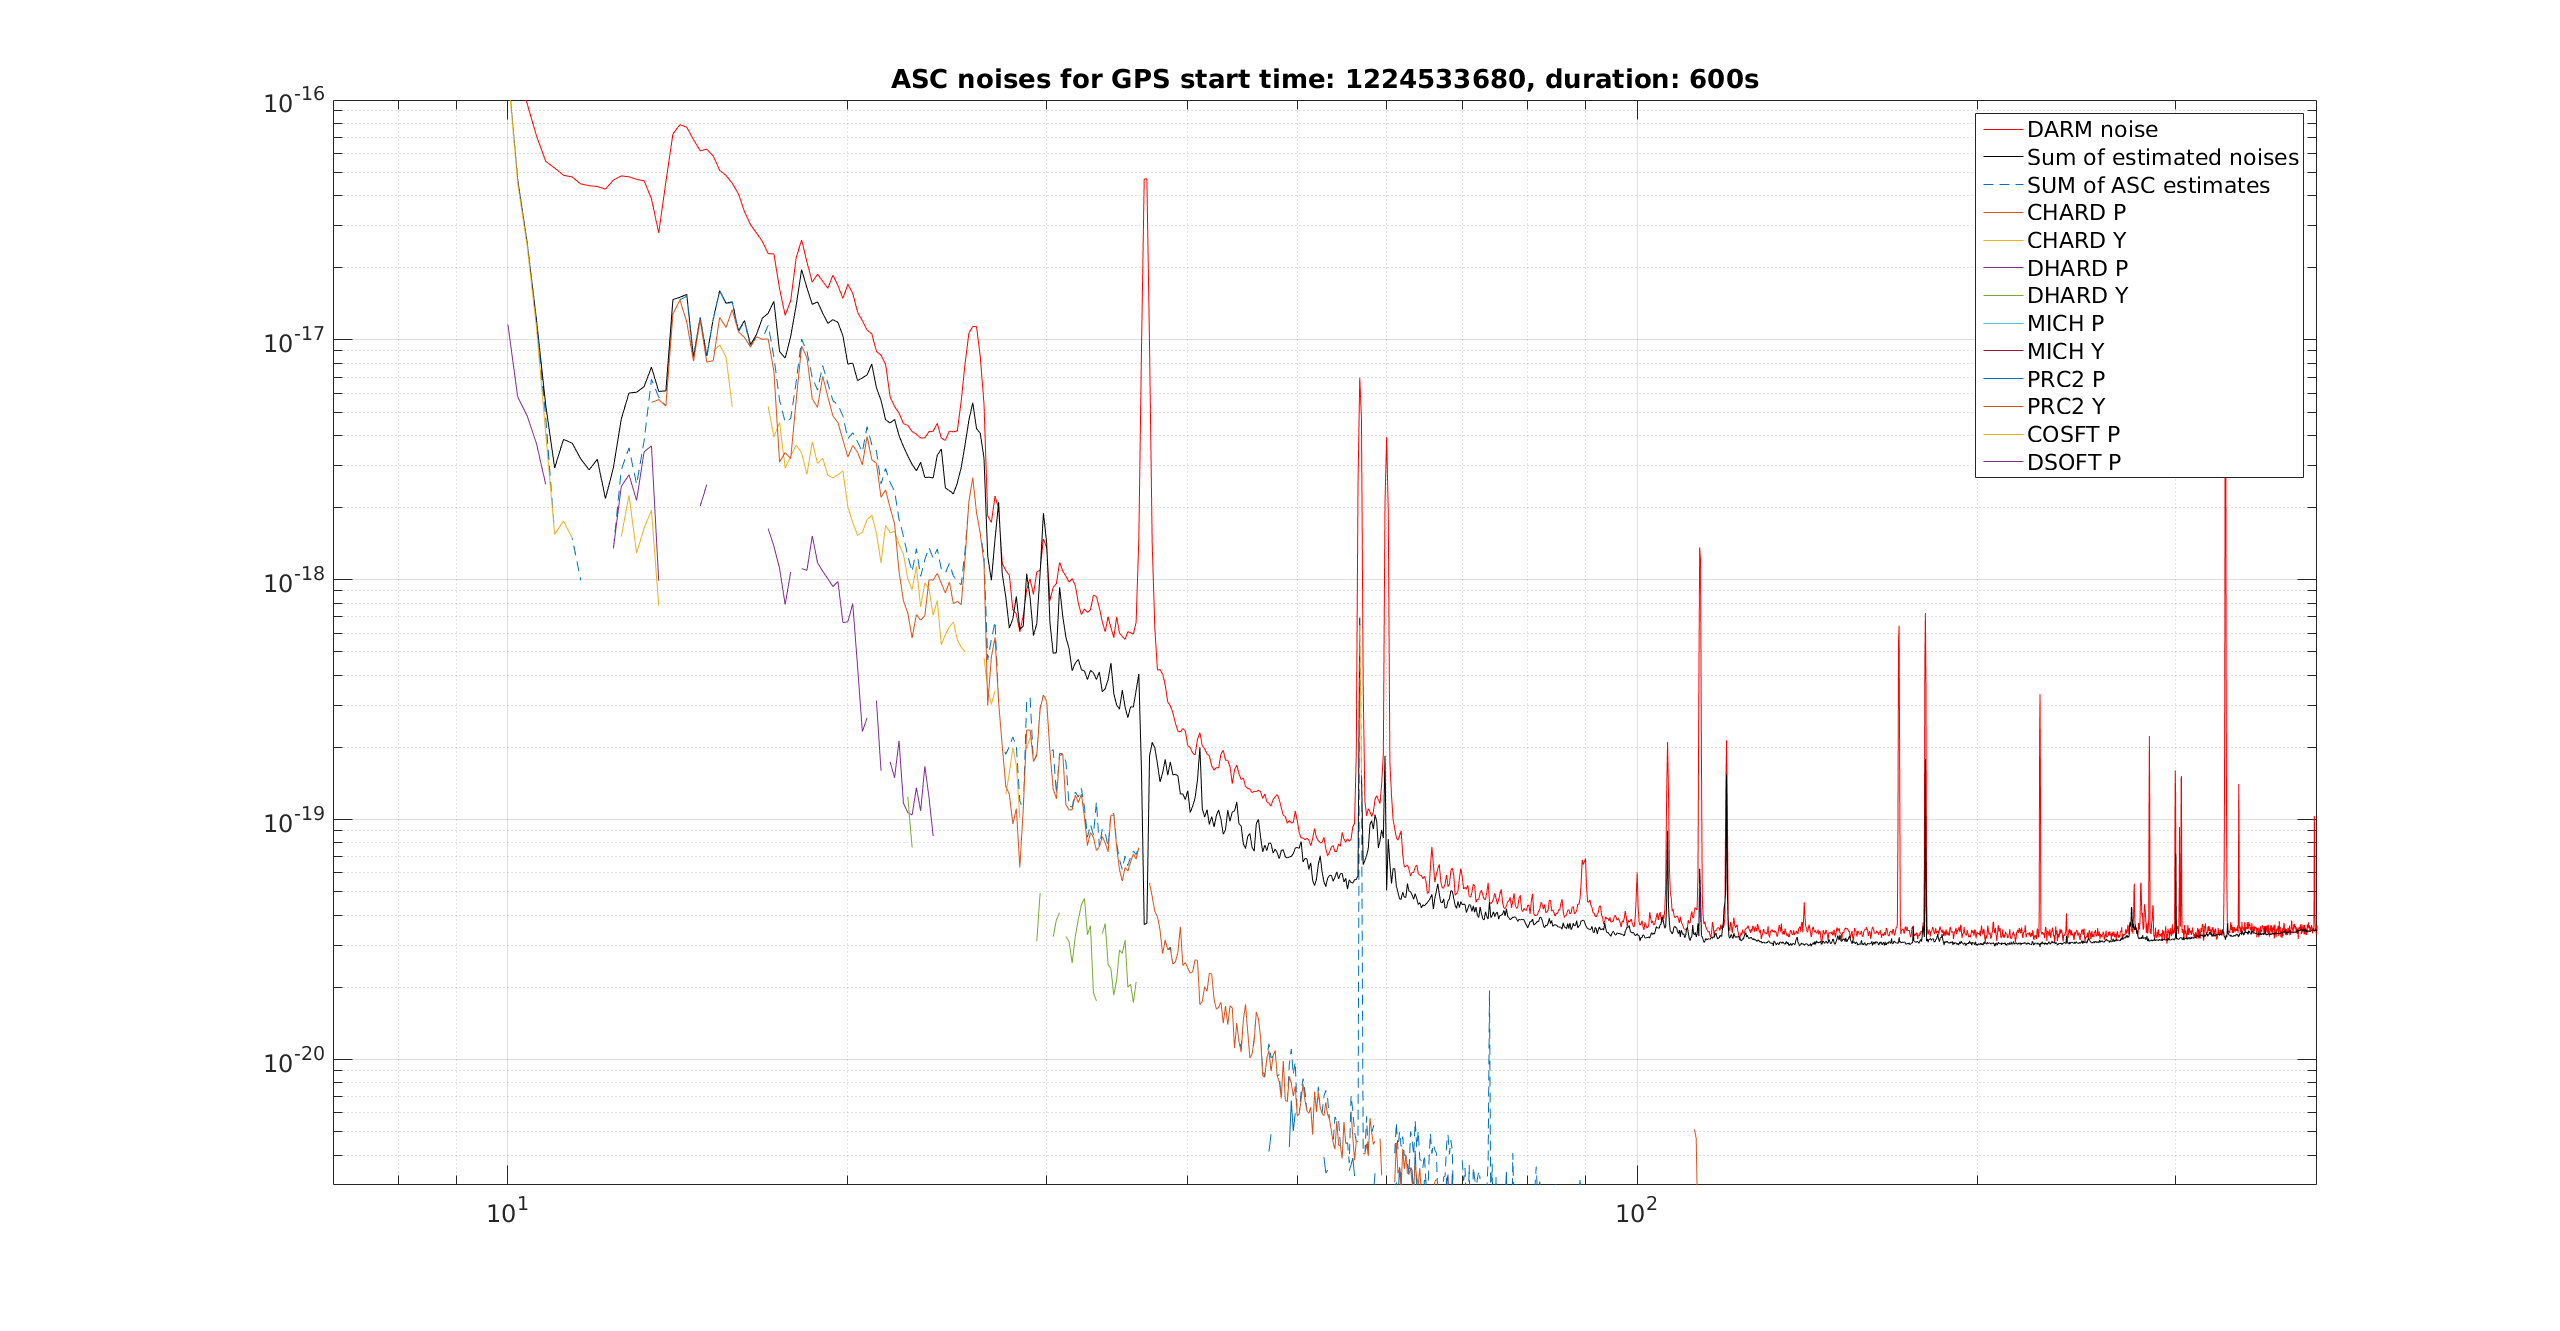
Also attached is a plot of the individual ASC noises, including the soft P injections Hang made from 44800
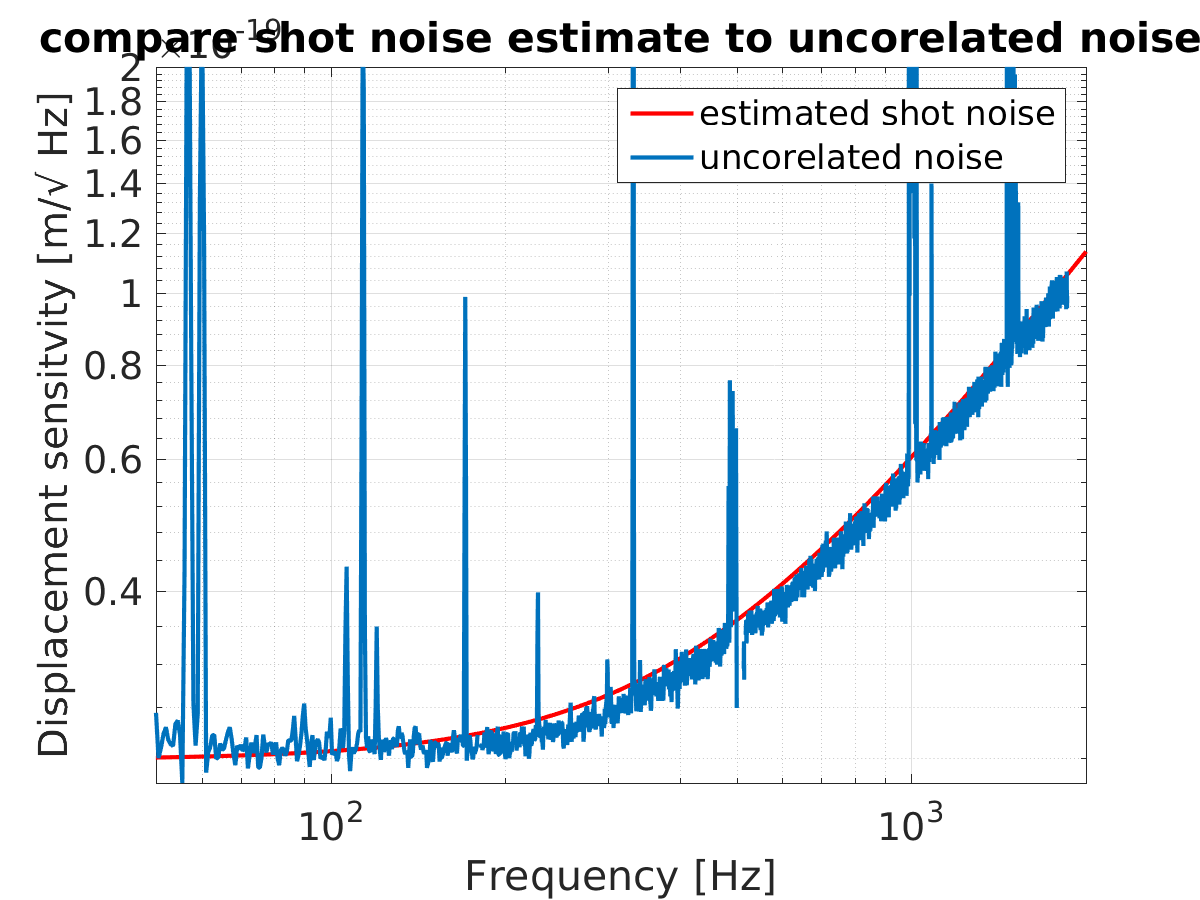
This noise budget normally relies on the measured cavity pole and optical gain from the Pcal lines, but since they aren't available yet I compared the shot noise estimate to the difference (in quadrature) between the DARM noise and the correlated noise (using the template Geogria updated 44807. I estimated that kappac = 0.9 at the time of this measurement and the cavity pole is 430 Hz. (Third attachment)
The other noise traces are up to date, except for the OMC length noise for which I am using the measurement from O2.
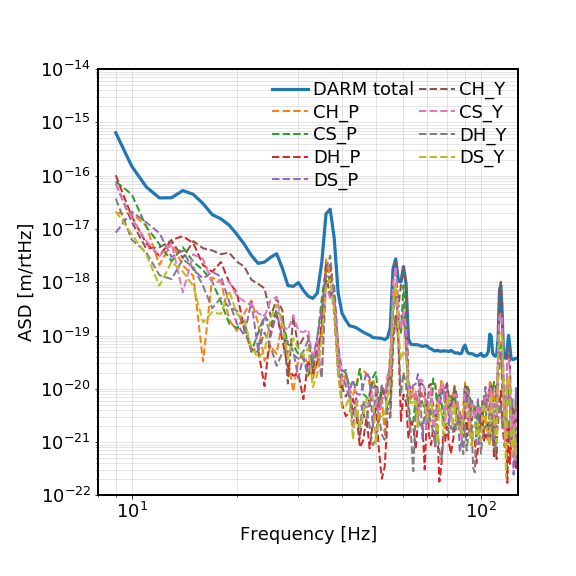
We also measured coupling of HAM1 Hepi excitations to DARM, MICH, SRCL and PRCL. We will add some plots to the alog tomorrow: there is a contribution of HAM1 X +Y motion to all of these DOFs, but the coupling is not through CHARD.
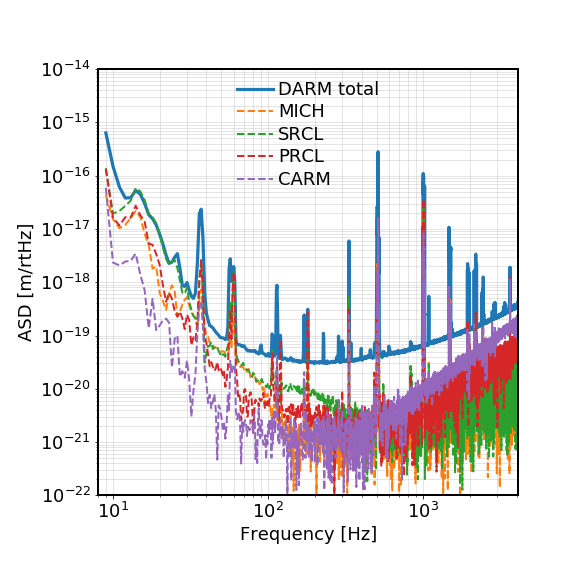
We did more DARM noise projection based on f-domain MISO coherence (i.e., linear couplings). The noise showed up in this study are in principle removable, ideally using online FF in real time, or using offline noise subtraction as did by Jenne et al. for O2 data.
This time we studied 3 different freq bands:
1). 8 ~ 128 Hz (LF), including all the LSC (MICH/SRCL/PRCL/CARM), arm ASC (C/D HARD/SOFT), and jitter (PSL bullseyes & IMC WFS) channels as the witnesses.
2). 8 ~ 512 Hz (MF), including all the LSC and jitter channels.
3). 8 ~ 4096 Hz (HF), including all the LSC channels.
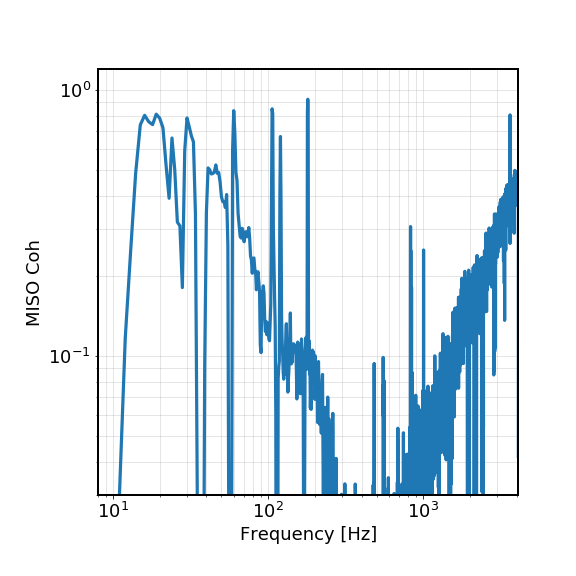
The noise projections to DARM are attached for each freq band. Also attached are the MISO coherence with DARM for the HF case (as LSC channels dominates the linear couplings for now), and noise projection for the LSC channels for the HF band, jitter channels for the MF band, and ASC channels for the LF band.
Some observations:
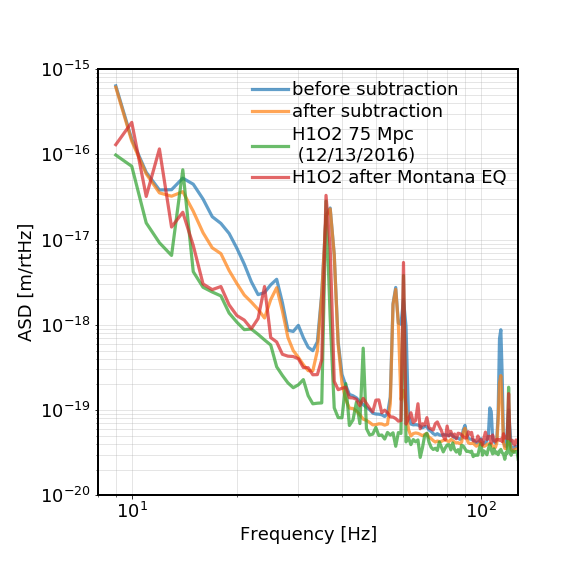
i), While our current real-time DARM noise is very similar to the post Montana EQ level from 40 to 100 Hz (which I believe Sheila et al will show in more details), there is room for improvement in that band by removing linear couplings.
ii). Right now SRCL dominates DARM sensitivity below 40 Hz, and it contributes roughly equally as LSC-MICH in the 40-80 Hz region. In the 100-300 Hz range we can still see a significant amount of SRCL in DARM. Thus to improve BNS range, we should definitely improve our SRCL FF.
iii). A significant amount of frequency noise/CARM is linearly coherent with DARM above 1 kHz. We should fix this excess HF freq noise but in the worst case we can still remove it by doing CARM FF/offline subtraction.
iv). CHARD Y is the largest contribution for the ASC noise. For other DOFs we are not yet able to see them with the current high SRCL noise.
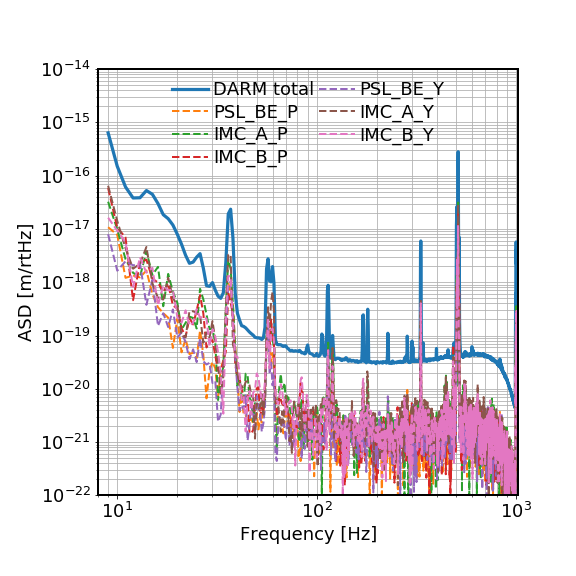
v). No significant amount of jitter noise showed up.
=========================================================================================
Details: the data we used for this study were starting from gps 1224541306 for 256 secs. For each FFT we took 1 sec (i.e. 1 Hz BW) of the data with 50% overlaps between adjacent pieces. We had ~ 500 averages for this study, thus we can see coherence down to ~ 1/500 =0.002 level. This further means we can probe linear noise projection to DARM roughly 20 times below its sensitivity.
The analysis code lives in
/ligo/home/hang.yu/Desktop/LSC/DARM_NOISE/darm_coh.ipynb
Hang, TVo
Hang had most of the tools written up to run the spectrograms using jupyter notebook so i helped tune the notch filtering to get the normalized spectrogram of CAL-DELTAL_EXTERNAL_DQ
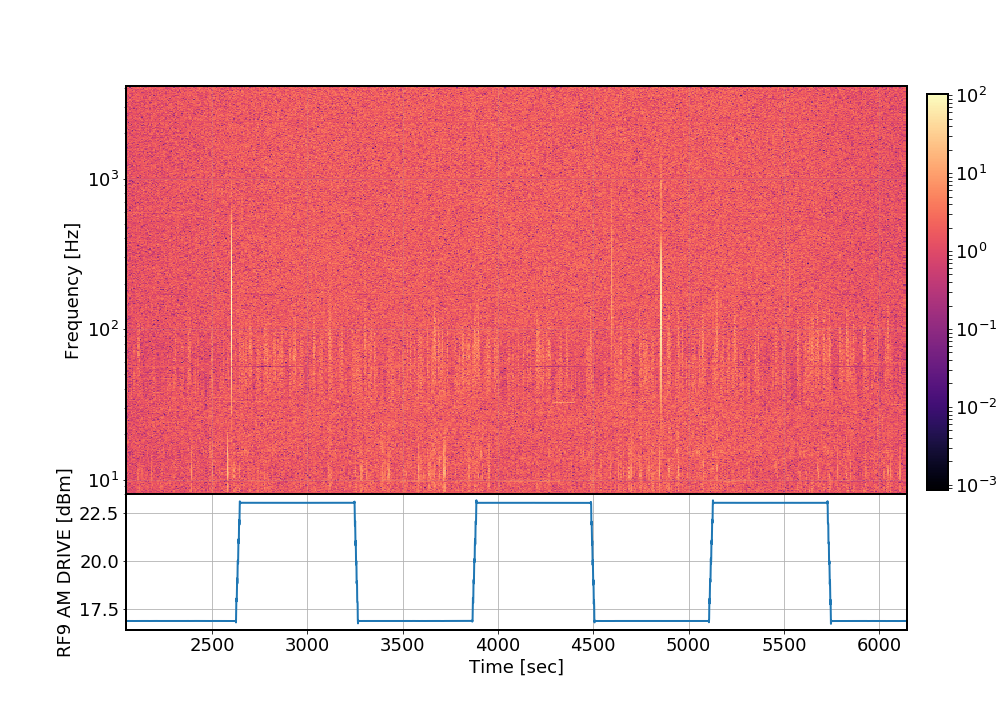
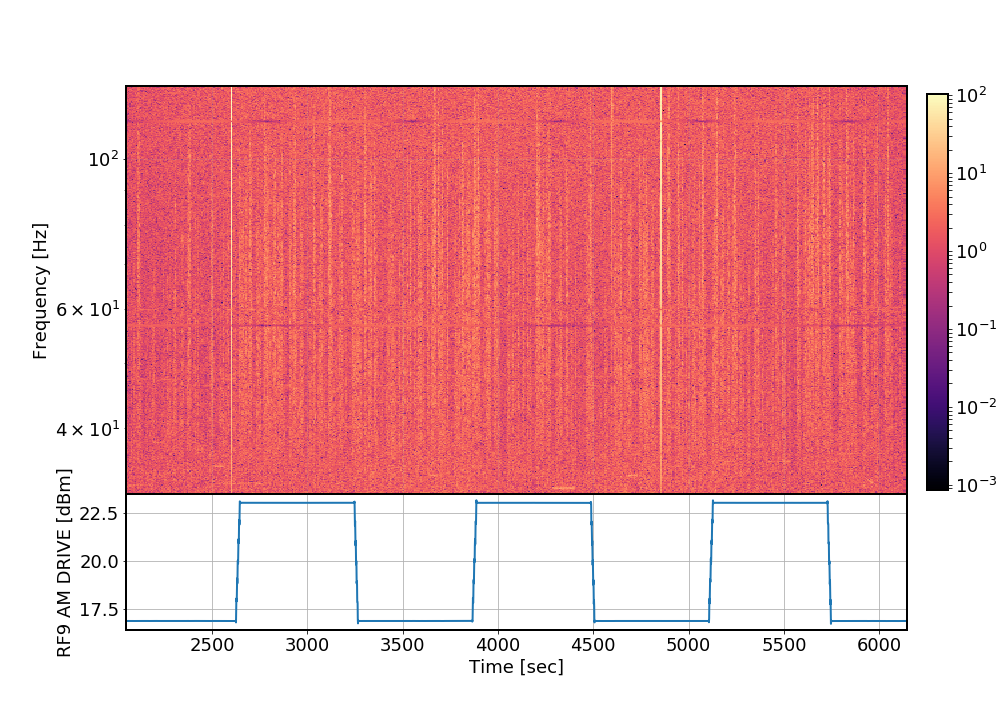
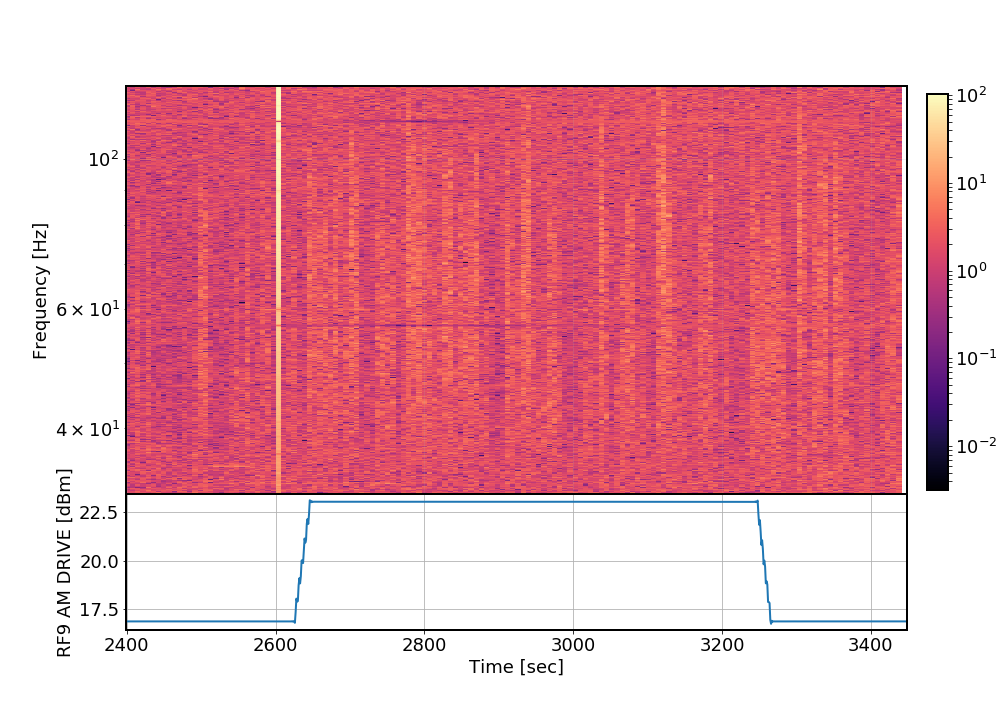
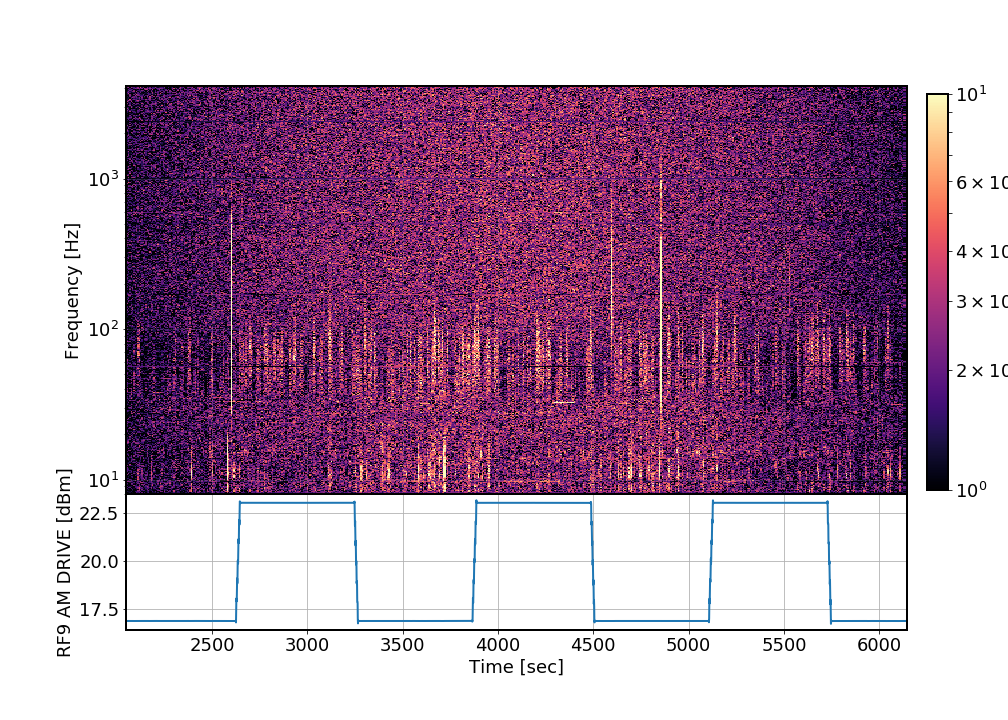
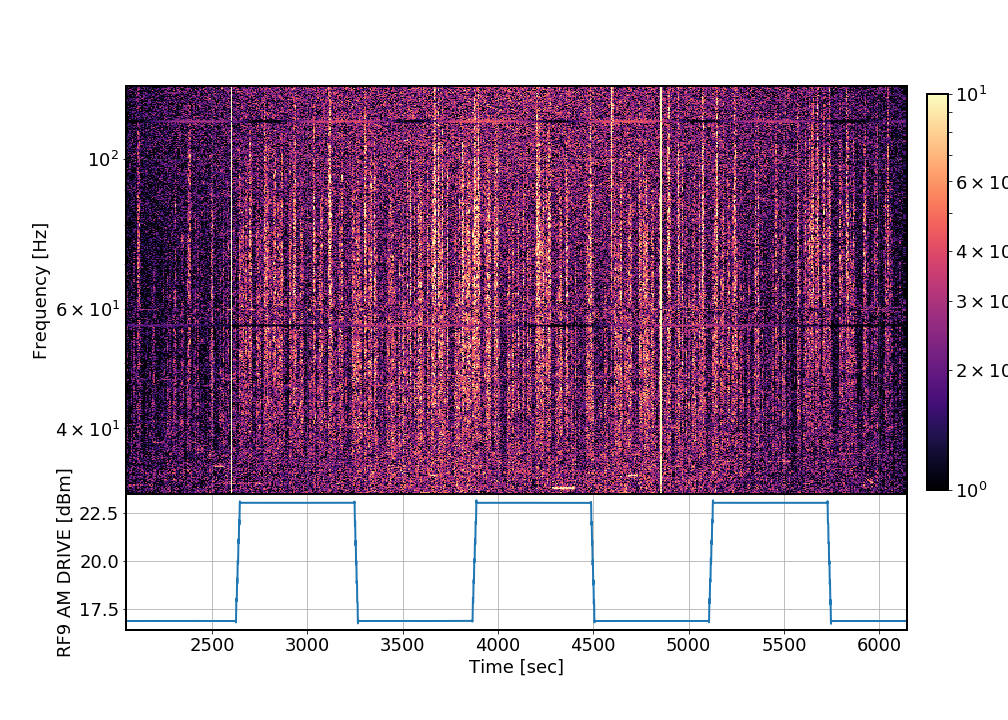
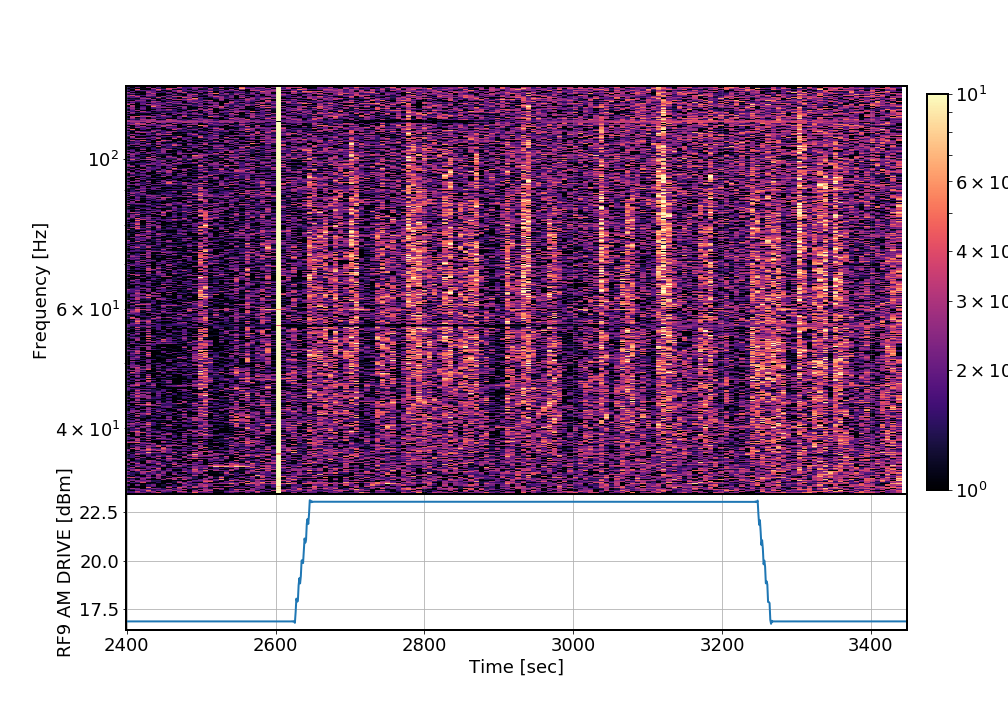
The first plot shows broadband DARM, and the second plot shows a zoomed in version from 30 to 200 Hz. By eye, there's not an obvious correlation between the amplitude square wave of DB9 modulation depth to DARM, except there's some extra noise at the 57-58 Hz region which might come from the Hartmann sensor sync frequency. The third plot shows a zoomed-in time version during one of the glitchy times, there's an obvious broadband spike but there is also a long lasting one at the 57-58 Hz that lasts for a few minutes.
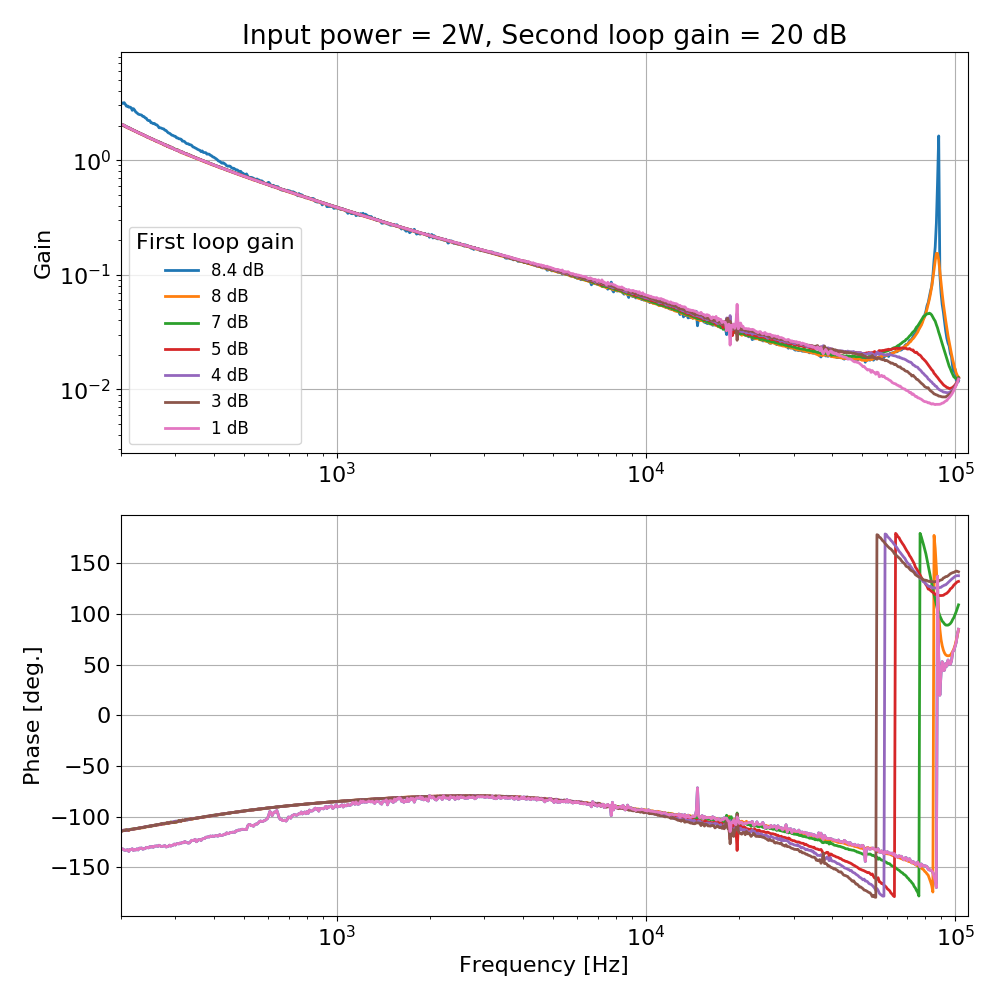
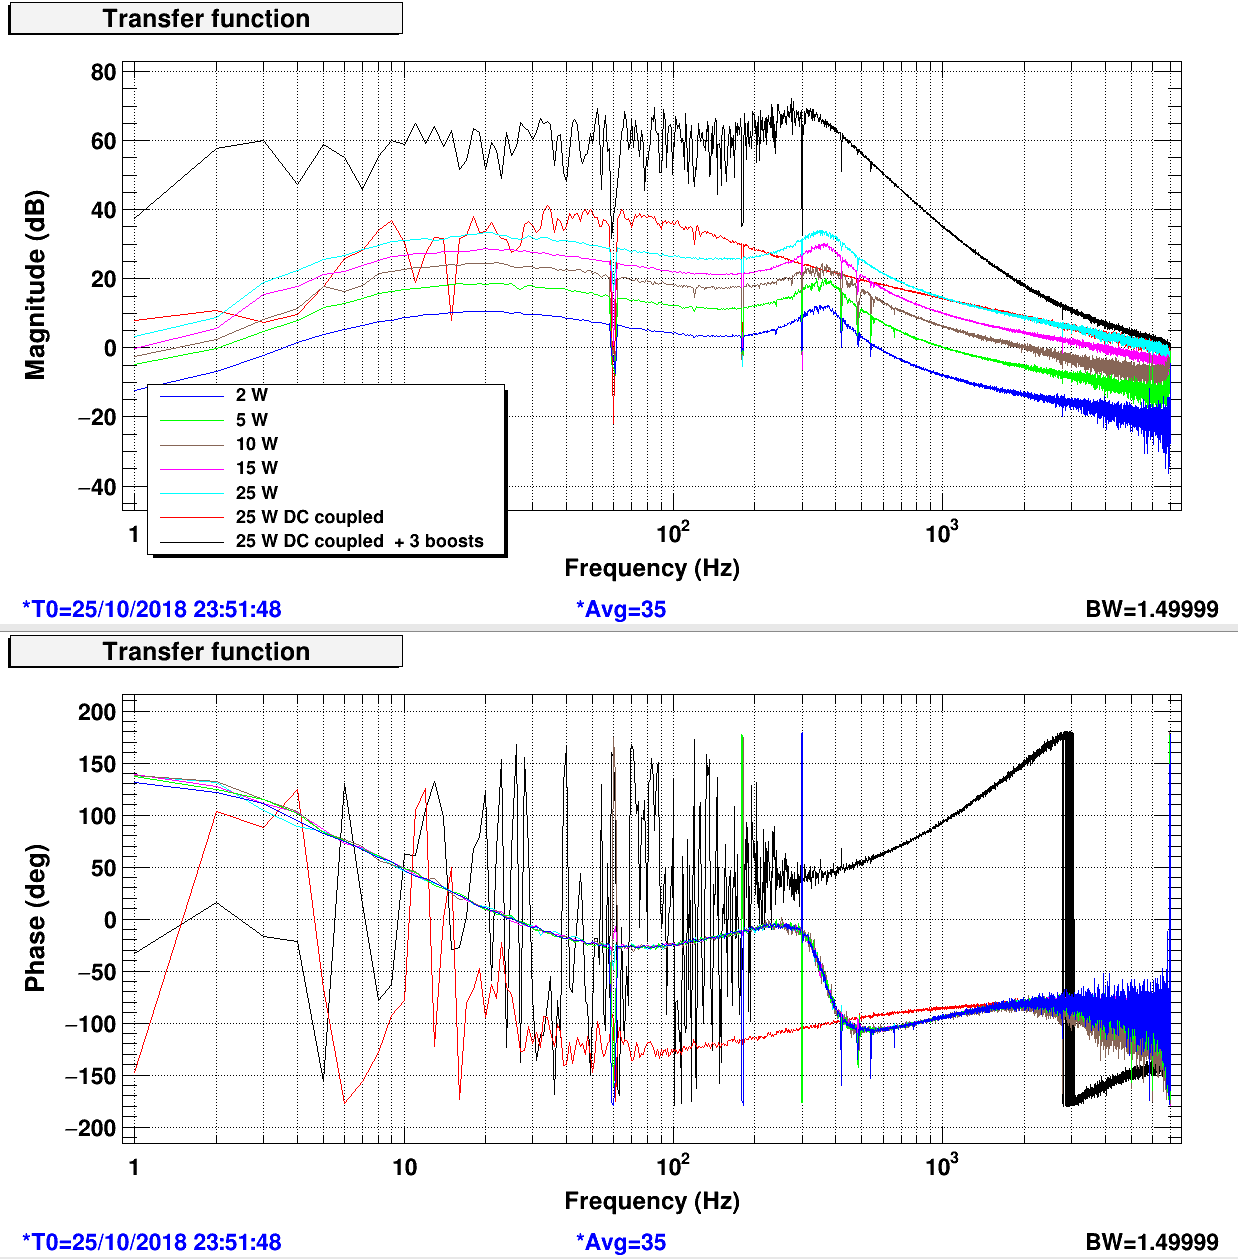
In brief, the ISS second loop could not be engaged because the gain of the FIRST loop was too high, resulting in a large gain peaking at 88 kHz, which made the ISS second loop unstable for high gain or high power. Indeed, the gain of the first loop was 8 db: increasing the gain to 8.6 dB made the FIRST loop unstable even without the second loop. I reduced the gain to 4 dB and now the ISS second loop transfer function looks ok. I could engage the second loop at 2 W with AC coupling, increase the power to 25 W, DC-couple the second loop and engage three boosts.
I tested once the following procedure
Below the RIN with 25W, ISS second loop closed, DC-coupled and boosted.
The plot below shows the open loop transfer function of the ISS second loop, at 2 W, with a second loop gain of 20 W. The traces correspond to various gains of the first loop. The gain was originally set to 8 dB, giving a large gain peaking at 88 kHz. The gain is now set to 4 dB, which gives a reasonably smooth transfer function.
Once this issue was fixed, I could engage the ISS second loop and power up to 25 W. I measured the open loop gain of the second loop while powering up. At 25 W I D-coupled the ISS and switched on all three boosts. Open loop gains are shown below.
SLOW SERVO
With the output switch open, the slow reference servo will maintain the board output near zero.
I offloaded the output of the slow offset servo H1:PSL-ISS_SECONDLOOP_REFERENCE_SERVO_OUT16 to the "bottom" offset H1:PSL-ISS_THIRDLOOP_OUTPUT_OFFSET so that the slow offset servo is around zero.
When the second loop will be engaged, the slow offset servo will switch to keeping the diffracted power near the desired value. Therefore the offset H1:PSL-ISS_SECONDLOOP_REFERENCE_DFR_CAL_OFFSET must be set to minus the diffracted power.
AC COUPLING AND PREDICTOR
In this condition, the AC coupling is off, but the "predictor" will update the AC decoupling output following the ISS second loop power, rescaled to the first ISS loop power. Set the gain of the "predictor" normalization H1:PSL-ISS_PD_NORM FM2 so that the output of the predictor normalization is near one (H1:PSL-ISS_PD_NORM_OUT16)
When the ISS second loop input is switched on (with output off) the AC coupling servo starts to work. The bias H1:PSL-ISS_SECONDLOOP_AC_COUPLING_INT_BIAS was adjusted so that the AC output when the AC coupling is off (coming from the predictor) is equal to the average value of the AC output when the AC coupling is on (meaning that H1:PSL-ISS_SECONDLOOP_AC_COUPLING_OUTPUT does not change, in mean value, when toggling the ISS input on and off).
In this configuration, with the ISS second loop input and output open, the input error signals is near zero H1:PSL-ISS_SECONDLOOP_ERR1_MON, and the output is also near zero H1:PSL-ISS_SECONDLOOP_OUTPUT_MON.
I don't understand the use of the AC coupling input offset H1:PSL-ISS_SECONDLOOP_AC_COUPLING_OFFSET
Notes
H1:PSL-ISS_SECONDLOOP_AC_COUPLING_INT_BIAS and H1:PSL-ISS_PD_NORM_OUT16 ensures that the predictor works to keep the input error signal near zero, by compensating the sum of the ISS diode signals, when the second loop is open.
even in this condition, there is an input offset in the ISS second board, so if you don't compensate for it, with the output open the board will rail. H1:PSL-ISS_THIRDLOOP_OUTPUT_OFFSET plus H1:PSL-ISS_SECONDLOOP_REFERENCE_SERVO_OUT16 is used in this configuration to keep the board output near zero when the input is near zero. Of course H1:PSL-ISS_SECONDLOOP_ERR2_MON is not zero, since that's afer the addition of the compensation offset.
I have modified a large quantity of models today, as part of ECR E1800304 / FRS 11676. The goal is to provide a front-end way to shut off ISC-related outputs when we have a lockloss, even if some of the EPICs connections are failing (which causes guardian to not be able to execute the full DOWN reset state).
The trigger of lock or not-lock is generated using a new row of the LSC trigger matrix. That trigger is passed to all of our main IFO suspensions, as well as the ASC and OMC models. Everywhere the trigger is used, it goes through a ramping code written by JoeB some time ago, so that signals can either be ramped to zero or immediately set to zero (by setting the ramp time to 0 seconds, as usual). Each of these trigger blocks also has an Enable switch, so that we can chose to bypass use of the trigger for any particular set of outputs (eg, if we want to be triggering the output of the LSC model but not the ASC model, we'd bypass the trigger on the ASC model).
To enable more flexibility, there are many different locations where the trigger can be used or bypassed. Some of these may seem somewhat redundant, but I wanted to give each site flexibility and also the ability to disable either inputs or outputs of the suspension filter banks. I list the groups here. For each group, there is only one trigger / ramp that controls them all. All of these channels should be initialized properly with their ENABLEs set to 0 by default, which should give no net effect when we first install them, so that we can decide which ones we want to utilize. Each of these also has a monitor channel _IS_RAMPING.
Note in particular the things that I have not given triggers to: the IMC mirrors, or the IMC ASC dof outputs, since we want those to be active separately, and don't want a lockloss to kick the IMC out of lock if it wasn't already going to be. I also did not give triggers to the ADS dithers. I can add these if we think it's important. I also did not include any squeezer-related optics, since that is a pretty independent system. We can give the squeezer suspensions their own trigger if its needed.
I have not yet made any screen modifications (that will be tomorrow, hopefully).
When we are ready to implement this, we will need to restart:
For LLO, we will need to svn-up to get all of the modifications to the suspension library parts, then add the IPC receiver to the top model for each sus. We will also need to hand copy the modifications to the LSC, ASC and OMC models.
EDIT: I have compiled all of the models, but not installed. h1asc has an error, which I will work on debugging in the morning.
Found and fixed the problem with h1asc - a few of my new multiply blocks I had forgotten to connect. Oooops. It compiles nicely now.
Also, I ran make install-h1lsc so that it would generate the lsc trigger matrix for me, but I have not installed any of the other models.
I have now made some screen modifications, enough that we should be able to roll this out on Tuesday.
I've added a row to the LSC trigger matrix, and also from the LSC trigger matrix screen you can access the new lockloss trigger screen.
After consulting with Rana and JeffK, I've moved the triggers in the suspension models to after the drivealign matrices, rather than just after the lock filter banks. The violin triggers remain where they were. No channel names will change as a result.
I have not done a make on any of the models - they should all get one (including LSC, ASC, and OMC) before installing on Tues.
It looks like there is a problem with sending the TRIG_IFO signal to the end stations. We will most probably hold off on the upgrade until 6th November, so for now I've backed out the "make install-h1lsc" to revert the DAQ INI file.
For some unknowable reason, even though the end stations are now on PCIE dolphin, the send / receive parts in the models need to be the old RFM parts. This should be changed, so that the RFM parts have some name that is sensible, like PCIE_ENDS or something.
Anyhow, I have undone all of Dave's temp changes from last week to the LSC model and the SUS common parts. I added a 3rd sender to the LSC model, changed the EY model to use the mis-named RFM block, and and put in a mis-named RFM block into the new susetmx that has the 20 bit DAC.
TITLE: 10/25 Day Shift: 15:00-23:00 UTC (08:00-16:00 PST), all times posted in UTC
STATE of H1: Commissioning
INCOMING OPERATOR: None
SHIFT SUMMARY: Commissioning continues through elevated microseism. BRSX seems like it may drift back off after Jim's rebalancing today. Nighttime commissioners should keep an eye on DIAN_MAIN for any notifications, and then bring the SEI_CONFIG to WINDY_NO_BRSX.
LOG:
1526 Vanessa to LVEA to start a cleaning
1545 Jim to EX to rebalance the BRS
1630 Vanessa out of LVEA and heading to the ends to clean main areas
1641 Jeff B to LVEA to take pictures of the ITMs
1650 Jim back from EX
1706 Jonathan to H2 CDS room and disconnecting phone
1707 Peter to LVEA to join Jeff B
1736 Terry to LVEA to ISCT6
1806 H2 phones back online
1827 Ed to LVEA to grab alignment laser
1835 Ed, Peter, Jeff B
2000 Terry out
2058 Terry back in
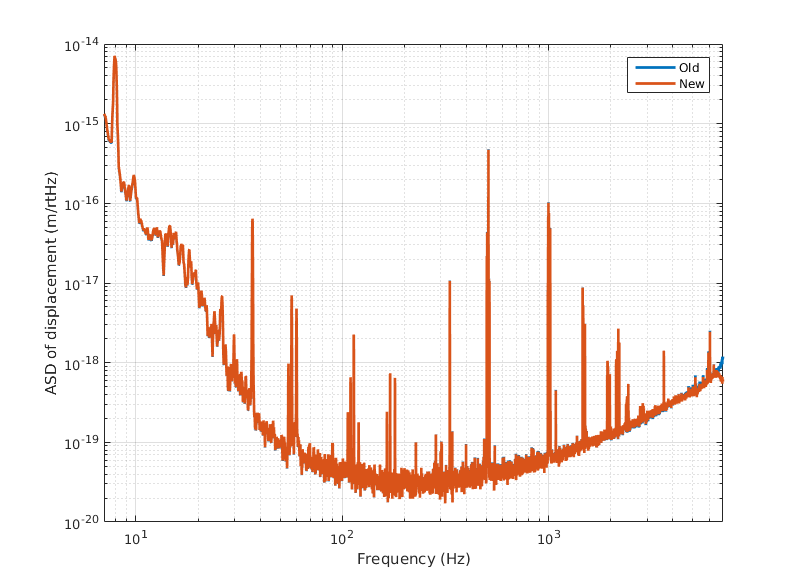
I realized today that our updates to the inverse sensing FOTON filter would yield slightly incorrect DARM FOM curve in DTT, especially in the ~5 kHz range. This is because the DARM FOM DTT template has a calibration that corrects for "warping" from a correct inverse sensing filter compared to what we are able to install in the front end using an IIR filter. I updated the H1_DARM_FOM.xml file with this new calibration and committed the changes to the SVN. This curve was computed using the following script located in the calibration SVN: aligocalibration/trunk/Runs/O3/H1/Scripts/darm_FOM_calibration.py Attached is a figure showing comparison with the old curve (with slightly incorrect calibration) to the new curve (with correct calibration). Also attached is the current DARM FOM DTT template calibration transfer function that is now being applied to H1:CAL_DELTAL_EXTERNAL_DQ (columns are frequency, magnitude (dB), phase (deg.)).
Upon request, I've removed the effect of analog and digital anti-aliasing filters from the DARM FOM. I have committed this to the SVN repo.
Lilli S., Jeff K., Evan G. We processed the measurements made in LHO aLOG 44766 using an MCMC to fit the data for the unknown parameters. Below are the maximum a postiori values and their 1-sigma quantiles. Parameter | Quantiles (0.15, 0.50, 0.84) --------------------------------------------------------------------- Cavity gain, H_c (ct/m) | 3.309e+06, 3.321e+06, 3.332e+06 Cavity pole, f_cc (Hz) | 419, 421.7, 424.6 Detuned SRC spring frequency, f_s (Hz) | 5.54, 7.037, 8.212 Detuned SRC spring quality factor, Q_s | 66.63, 37.57, 21.87 Residual time delay, tau_c (usec) | -3.887, -2.821, -1.734 The results are typical for what we now expect for an O3 aLIGO interferometer. Attached are the measurement compared against the best fit model values and the corner plot output from the MCMC analysis (first and second attachments). The final attachment is an updated Gaussian Process Regression plot showing the residuals from the Oct. 12 measurement and the Oct. 23 measurement propagated back to the Oct. 12th time. We would normally propagate the values using time dependent calibration factors derived from the calibration lines, but the front end calculation of these values is still in disarray. Since we couldn't use these values, we simply made MCMC fits to each measurement and divided out the changes that are caused because of drifts in alignment. The two sets of residuals (data points) are used in a Gaussian Process Regression algorithm to search for and quantify unknown systematic errors. The best fit using the GPR algorithm is shown as a dark line with the 1-sigma uncertainty given by the shaded region We expect that with further, higher precision measurements, the uncertainty on the GPR will be reduced.
Evan Goetz, Lilli Sun
The DARM loop sign conventions and the definitions of open loop gain, closed loop gain, and response functions are documented here -> T1800456
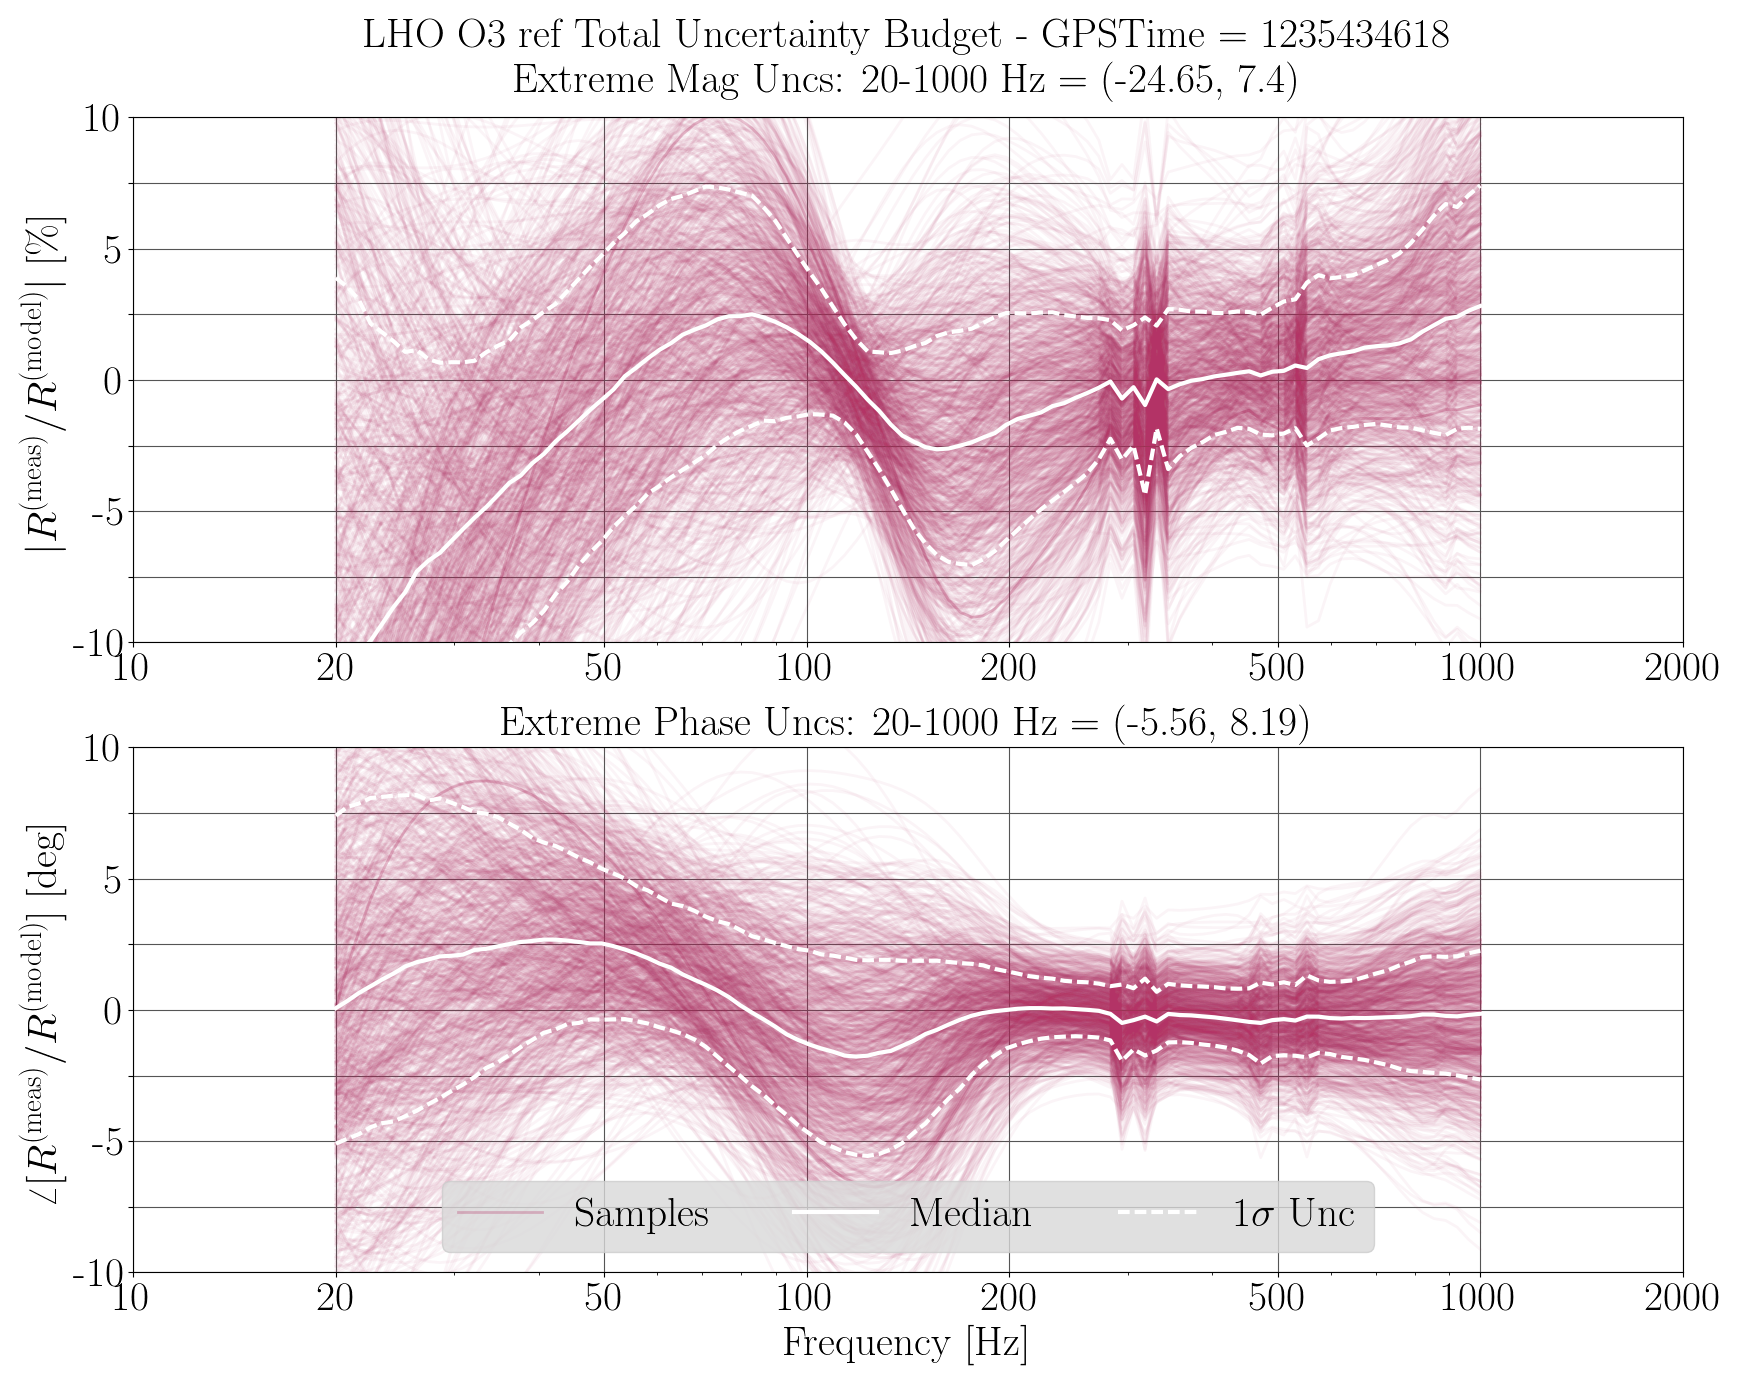
We revisited the signs in the DARM control loop and the response functions. In O2, we did all actuation in Y arm. For O3 the TST actuation was switched to X arm. Hence there are two separate sign issues: (1) is the actuation in UIM/PUM (push) or TST (pull), and (2) is it in X (+) or Y (-) arm. We had too many sign definitions in the code. The arm signs and the output matrix signs can be combined together. This has been fixed in actuation.py
By definition, we have G=A*D*C and the negative feedback "-" is not included in "A". We fixed the code to keep things consistent with this convention. Correspondingly, we have open loop gain = -G (fixed in the open loop gain processing script), closed loop gain = -G/(1+G), response function R = (1+G)/C (fixed in computeDARM and RRNom).
After all these changes, our model matches the measurements. The phase at unit gain frequency is near -180 deg (see meas vs model plot).
We processed the new calibration measurements taken by Jeff on Oct 23, and ran GPR using the both sets of measurements (Oct 12 & 23) after the model files are updated with MAP values.
At last, we tested RRNom with reference model. The plots do not look good because the measurements we have are poor (see corresponding sensing corner plot and actuation GPRs).
Note: After rerunning the MCMC again, the weird patches in the sensing corner plots disappear (Oct 12 measurement). This might be caused by the poor measurement. Keep in mind and check in the future.
The high uncertainty at low frequency definitely begs for the need of better precision measurements of the actuation stages at low frequency. We had that during O2, but right now we only have the single, quick-n-dirty measurement of the actuation stages.
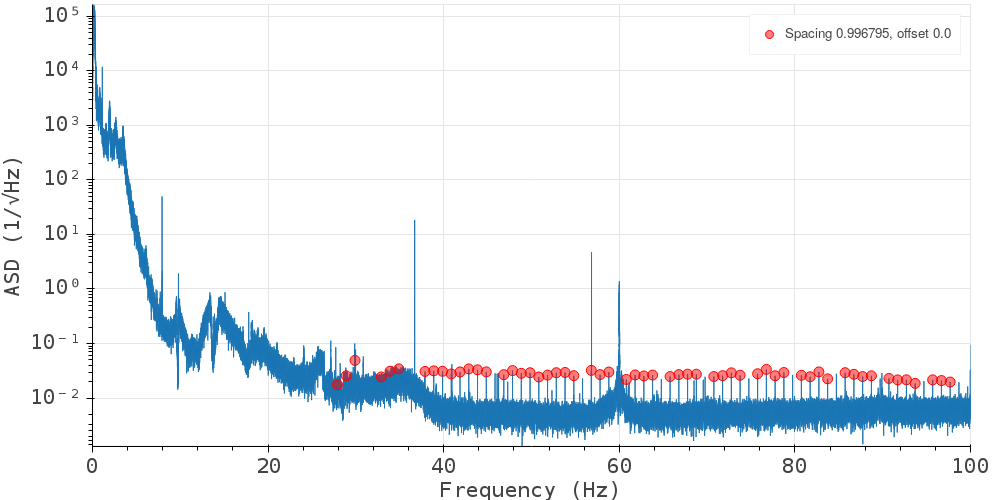
There's a comb visible in recent DARM data at multiples of 0.996795 Hz (last digit uncertain). This is suspiciously similar to a comb seen before O2 (then measured at 0.996798 Hz), which was due to the HWS. Just as before, the comb appears strongly in corner station magnetometer channels.
I've attached an image showing teeth of the comb below 100 Hz (Oct 24, ~50 minutes starting at 9:30 UTC). It is also visible in other lock stretches within the past few weeks. When this comb was seen before, it coupled only intermittently to DARM; its presence seems steadier now.
Relevant past alogs:
Hey Ansel,
The Hartmann camera sync frequency is set to 1Hz for both cameras at the vertex.
Hi Daniel, Right, some of us were wondering in an email thread if that frequency could be set to something different for a period of time, ideally with DARM in low noise, but that's not essential for things to be seen in magnetometers. thanks, Keith
Keith and Ansel,
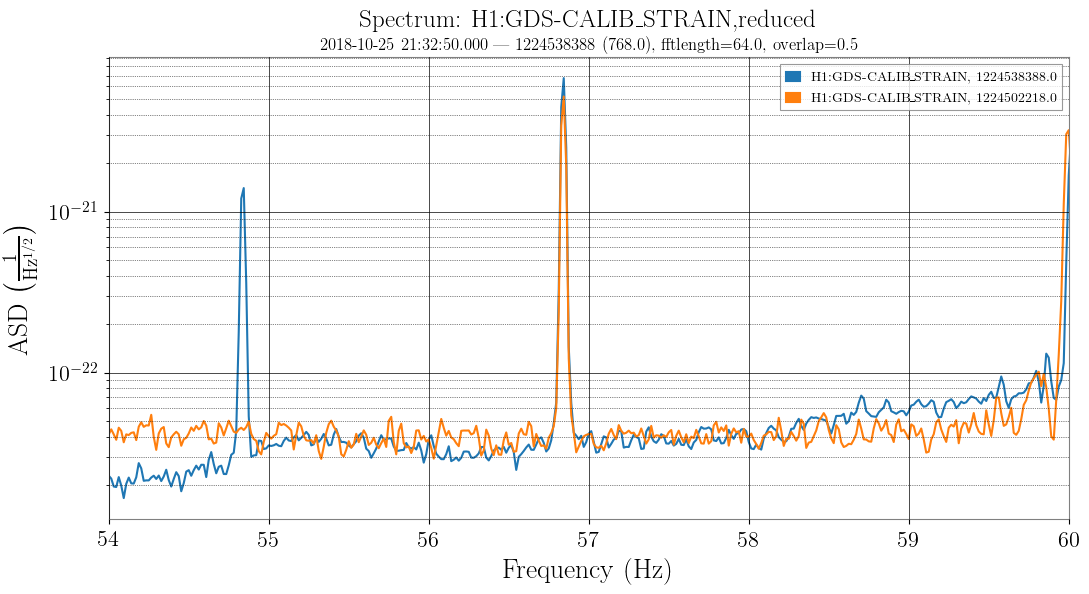
I adjusted the ITMY and ITMX HWS sync frequency to 55 Hz from gps 1224538388 to 1224539253. Please don't hesitate to let me know if you need anything else related.
Yes, this couples very strongly into DARM. A line at 54.8ish Hz appears with the change (spectrum attached).
Hi Daniel - yes, that definitely had an effect. I checked both DARM, and also the magnetometer channel where the comb was showing up most strongly. The comb disappears in both channels during the time segment you indicated, and reappears afterward.
Indeed this is a known problem with the HWS cameras (FRS 4559). And the problem was solved by placing the cameras on alternate power supplies in 2016. I suspect that following the post-O2 disconnecting and reconnecting of the HWS table and cables, the cameras got plugged into the chassis power supply again. We should do the following for all 8 HWS:
This should be done for the ETMs as well (where the 57Hz is an issue). The original isolation fix does not appear to be robust enough.
Block diagrams (DCC is down so I can't get hyperlinks right now)
[Craig Hang TVo Rana Danny Keita Georgia]
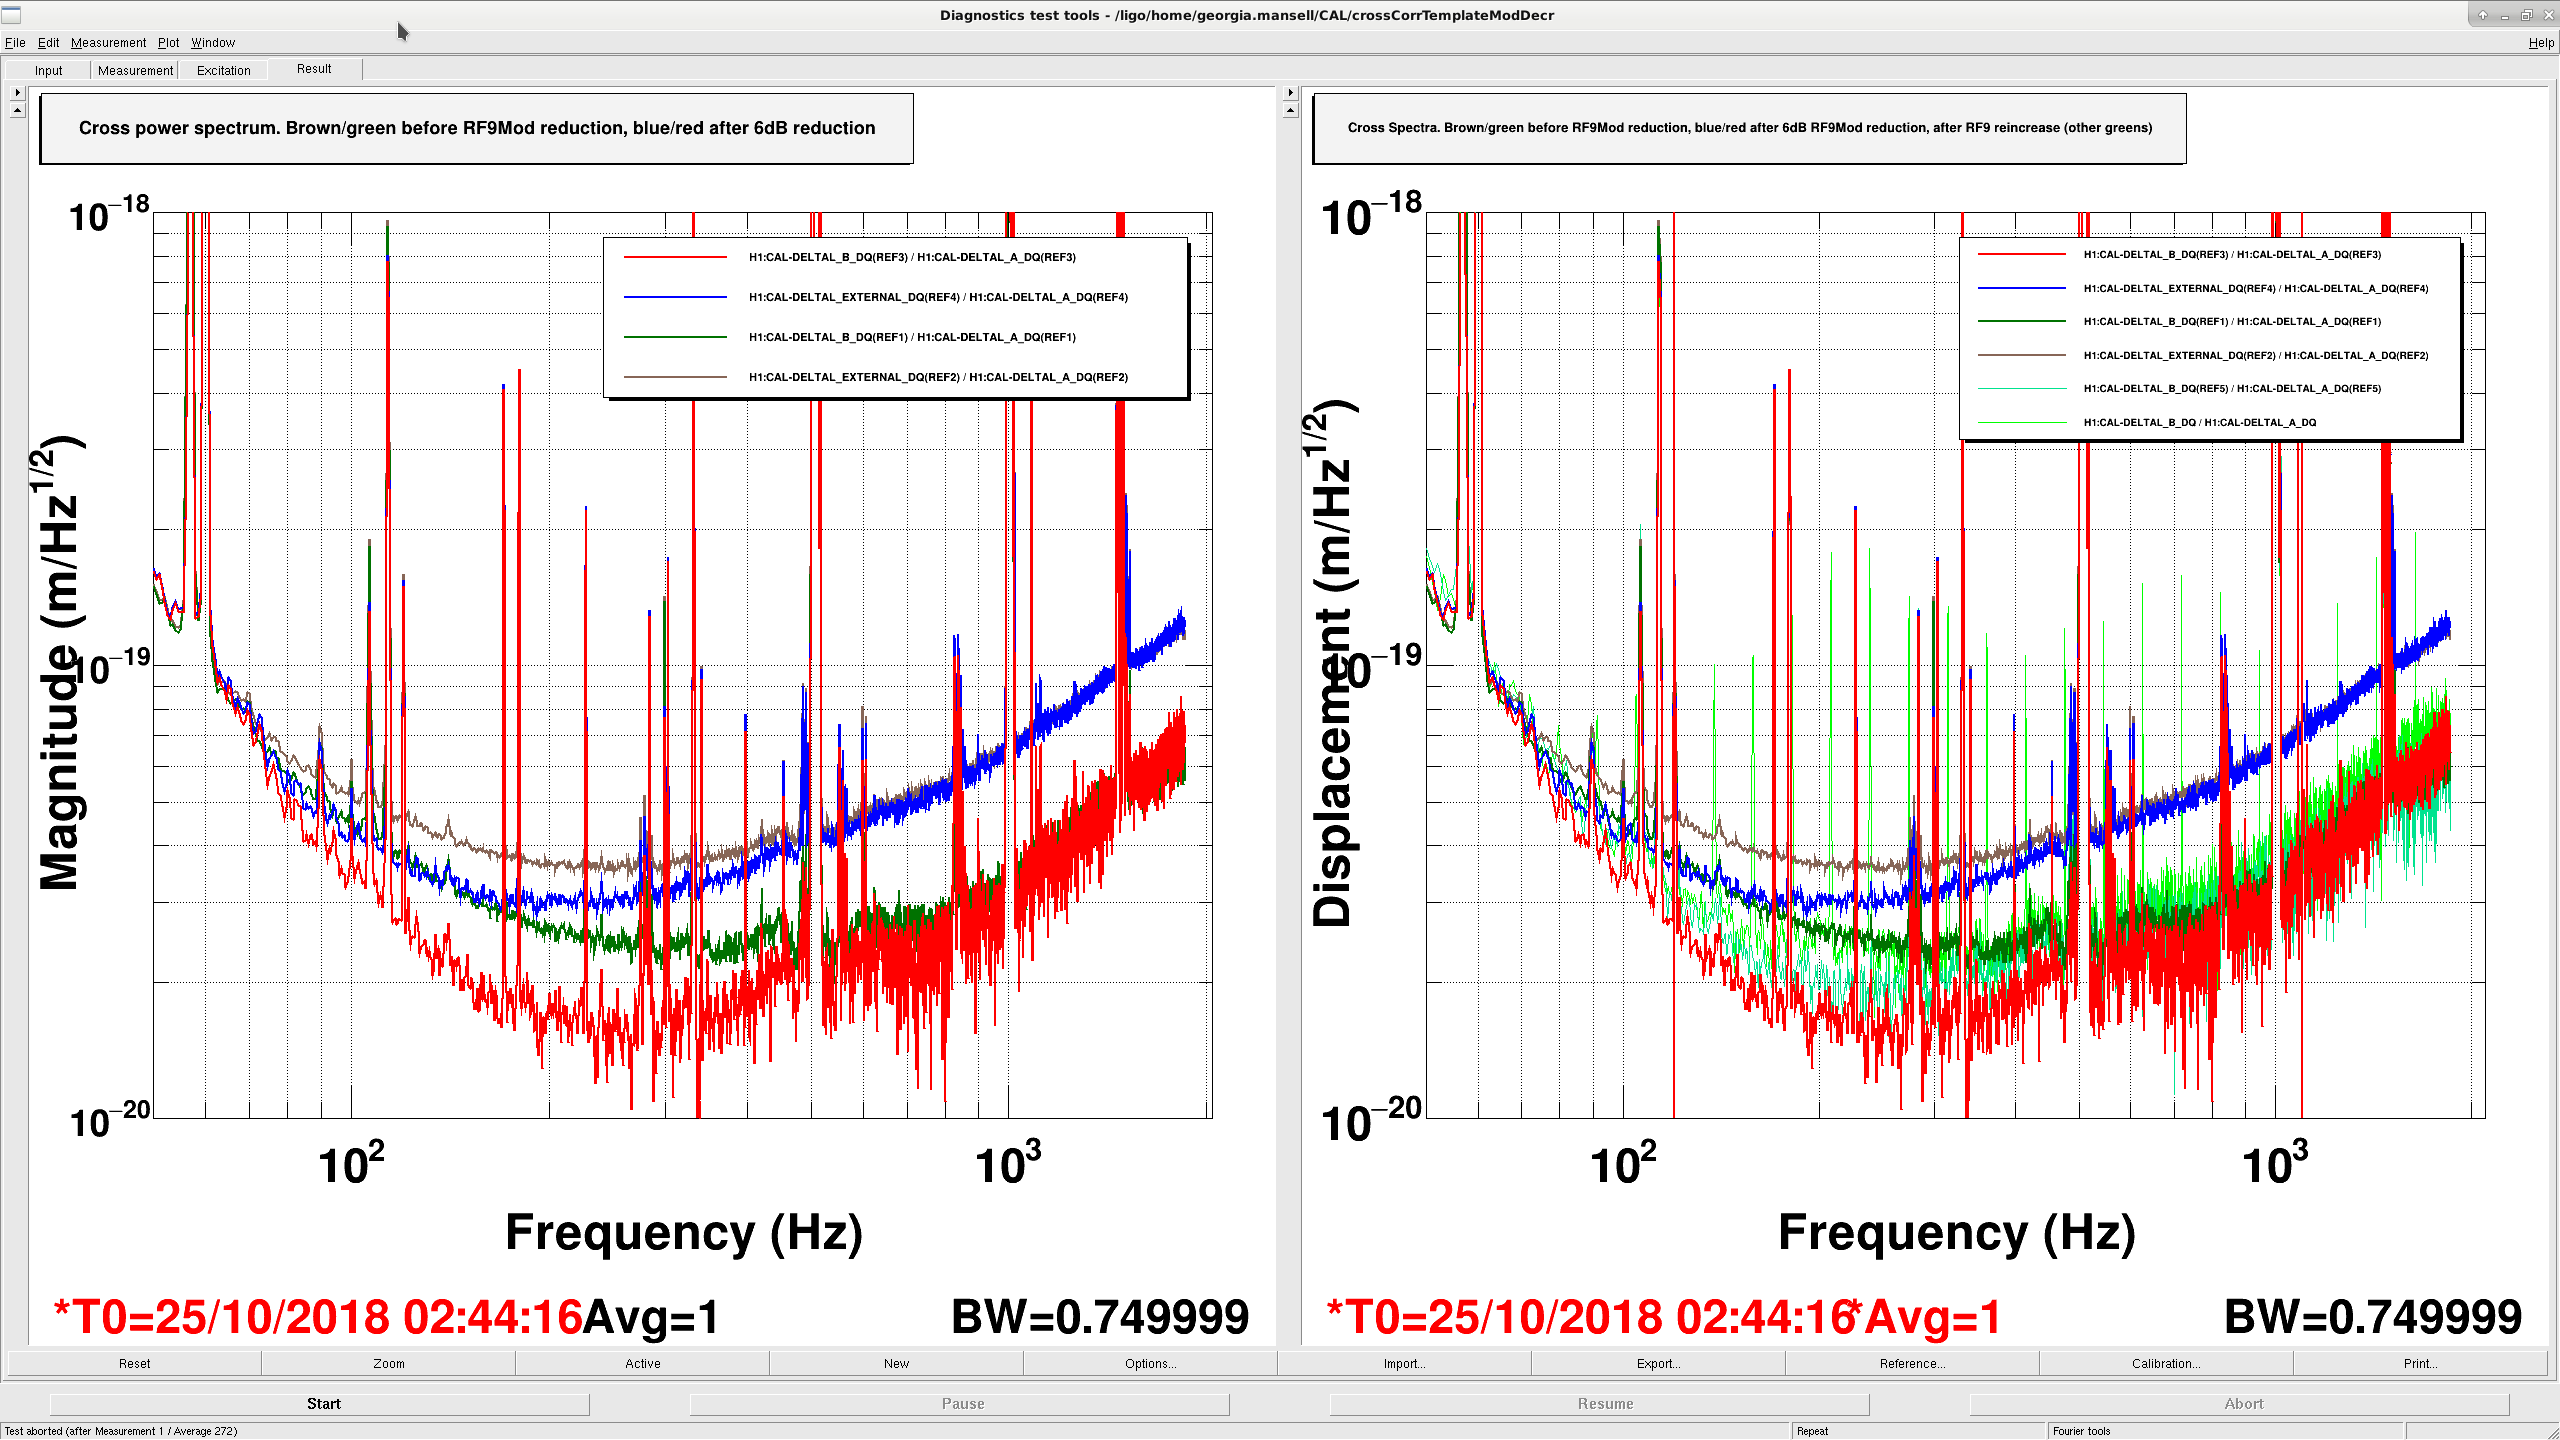
Following up on alog 44781, we had a look at the OMC DCPD cross-correlation as a function of RF9 modulation depth, using Kiwamu’s handy DCPD cross correlation infrastructure and DTT template (35156, T1700131). The cross-correlation allows us to look below the sensing noise of the OMC DCPDs and the photon shot noise.
In the first attachment, the brown and dark green traces show the DARM and cross-correlated spectra before the RF9 modulation depth decrease. Above 100 Hz the cross-correlated noise is below the DARM noise, indicating that we are limited by uncorrelated noise, eg photon shot noise, at these frequencies.
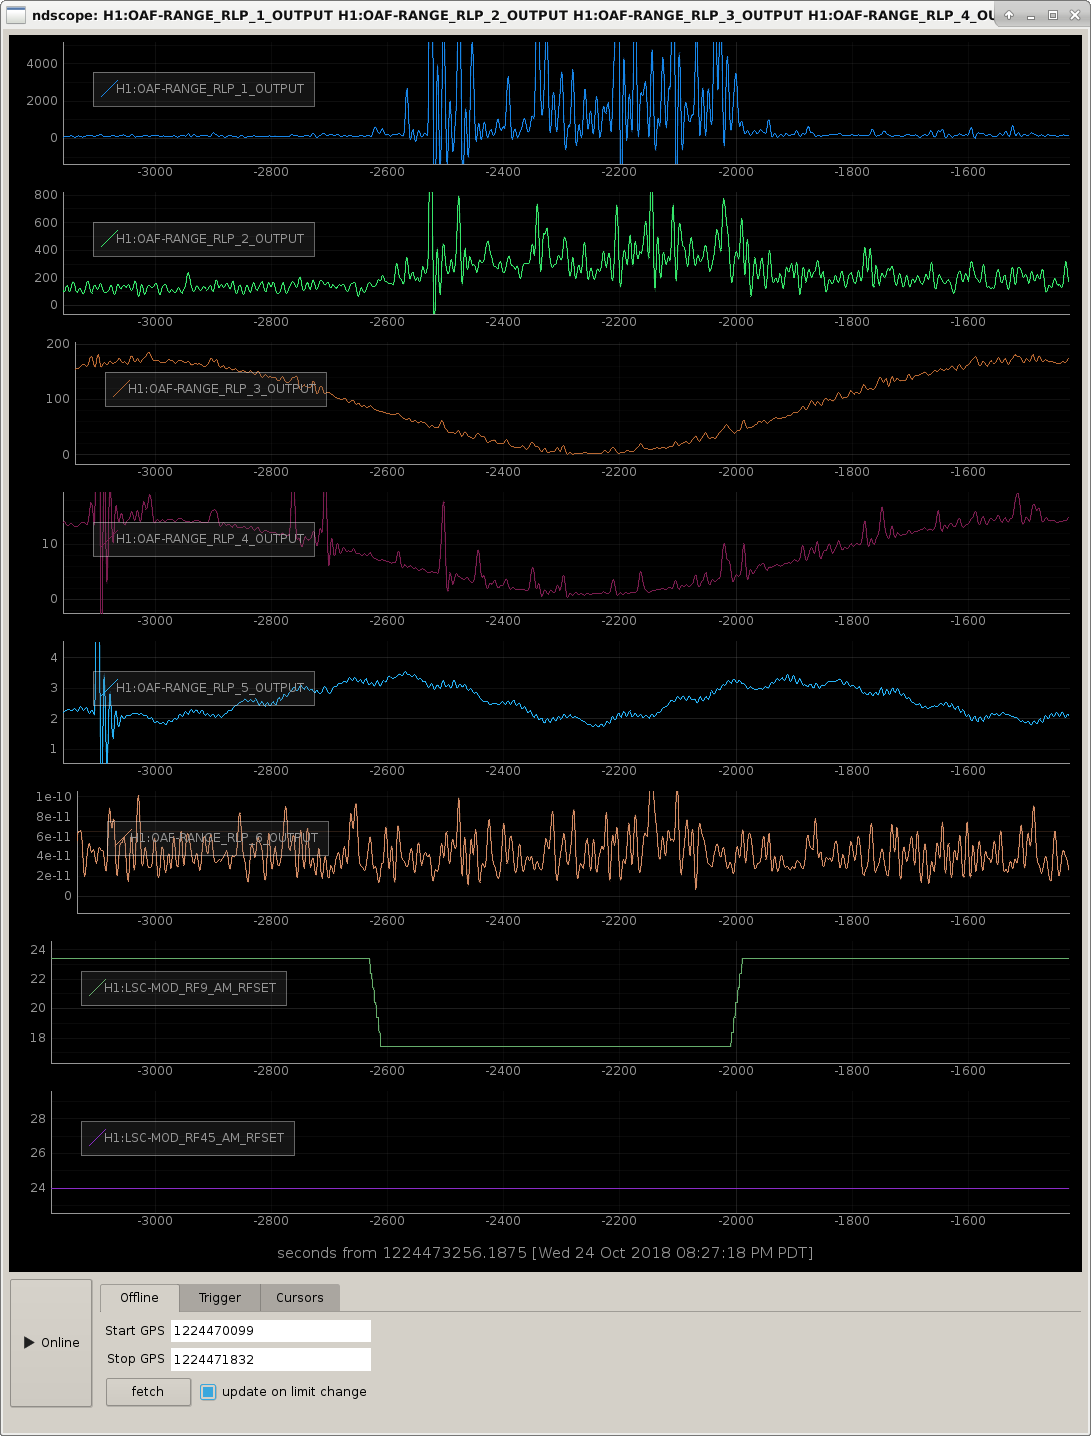
We used a Craig modification on Jenne’s script to turn the RF9 modulation depth down by 6dB for 10 minutes. Surprisingly, it looked like we had a significant reduction of noise in the bucket, from ~100 to 500 Hz in both the DARM and cross-correlated spectra, shown in blue and red, with no significant change to the noise above 500Hz. However when we brought the modulation depth back up the noise seemed to remain closer to the before-modulation-depth reduction level.
In the next lock stretch it seemed like the noise in the bucket crept back up to the original level. The two pale green traces in the right plot are cross correlation spectra from different times in the next lock where the RF modulation was not changed (03:47UTC and 04:30UTC). Similar behaviour was seen in the DARM spectrum, omitted from the plot for clarity. The second attachment shows the DARM BLRMS while we changed the RF9 modulation depth, this also has the timestamps for this test.
Before generating these cross-correlated spectra I updated normalisation and inverse sensing filters in the H1:CAL-CS_DARM_ERR_NULL filters to match the H1:CAL-CS_DARM_ERR. That is, I copied the O3_D2N and O3gain filter banks to the NULL channel. I have not updated the DTT frequency domain calibration (a transfer function in the templates calibration), and am still using the calibration from 2017.
Other locking notes:
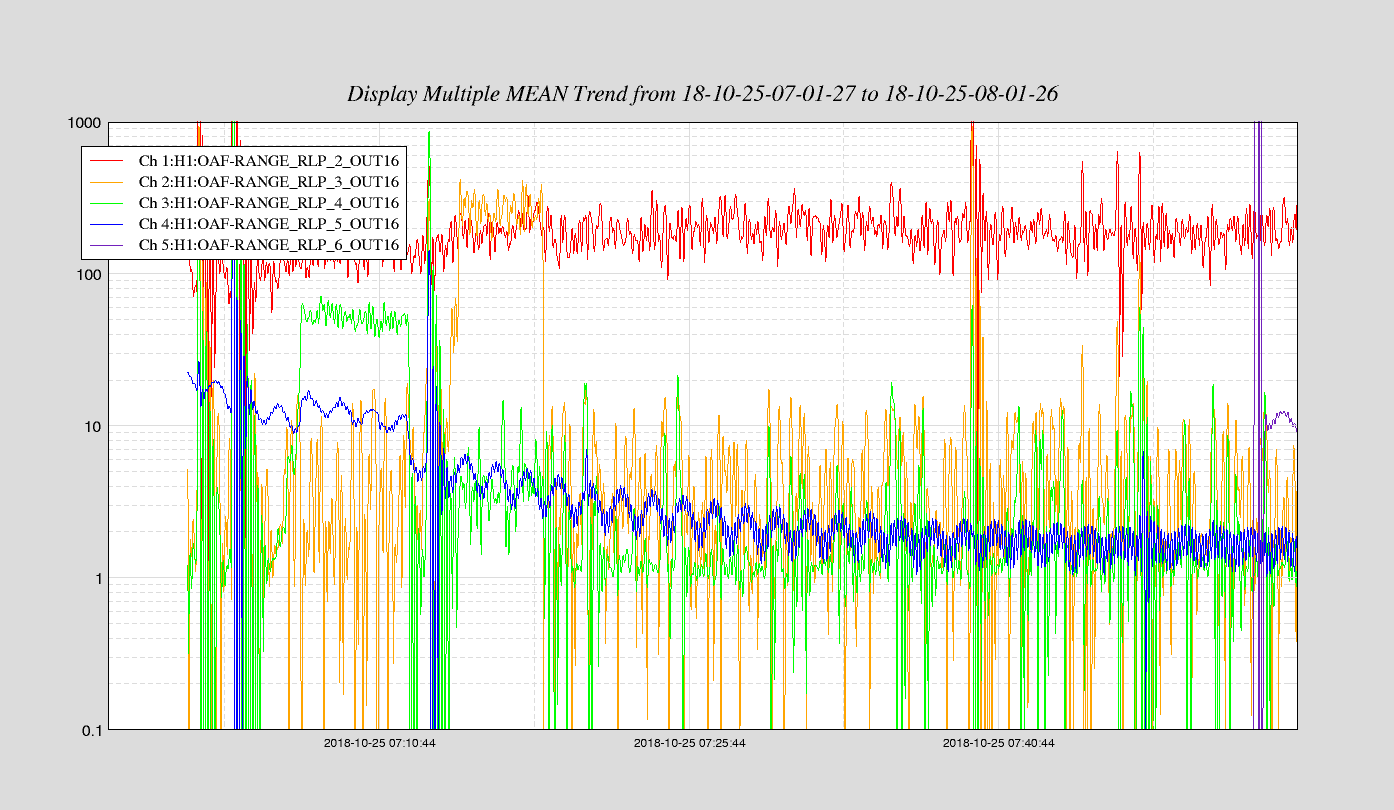
DARM BLRMS - Added 57 Hz and 114 Hz notches to the relevant DARM BLRMS filters (found in sitemap>LSC>OAF Calib>OAF BLRMS>RBP1-5) to get rid of the peak which we identified as the ITM HWSs. These notches removed the ~30 minutes period sinusoid seen in the BLRMS 3 and 4, and its harmonic in BLRMS5.
Glitches - After Hang implemented his DHARD PIT mircoseismic filter (44801) the regular glitches we were seeing in DARM are less frequent and less severe, compare locks before and after 1224468886.
in the above entry, ITM is a typo, it should be ETM Hartmann.
After putting in the notches for the heartmann noise, we were able to plot the BLRMS of DARM using the OAF-CAL LSC BLRMS (attached).
The frequency bands are 20-30 Hz, 38-60 Hz, 60-100 Hz, 100-450 Hz, and 450-950 Hz. The color coding follows the rainbow: red is the lowest frequency and purple the highest.
Since Georgia added the notches, we no longer see the 25 minute period that was characteristic of the TCS/Harmann noise, but rather the underlying breathing of the noise. Most troubling is the Orange (38-60 Hz) band. This one and the green one show all the breathing that is in our mystery noise band.
I think it would be illuminating if someone could find correlations with the orange and green bands and some other channels; it may shed light on what is causing the coupling. Note that since this is a RMS, one should find a correlation between the absolute value of (whatever) and these BLRMS channels.
I'm also attaching a plot showing DRMI error signals and coherence with DARM. The PRC signal is ~50x larger in the 20-30 Hz band than it used to be in O1. This also shows up in MICH/SRC and so there's a large coherence with DARM. I wish we had a noise budget for PRC/MICH/SRC, not just DARM.
I tried to run 'cdsutils audio' from the command line to listen to some band limited darm (to see if it sounds like rubbing or scattering) but the 'pygst' and 'gnuradio' modules are not available from this terminal. It would be useful to have that functionality added if possible.
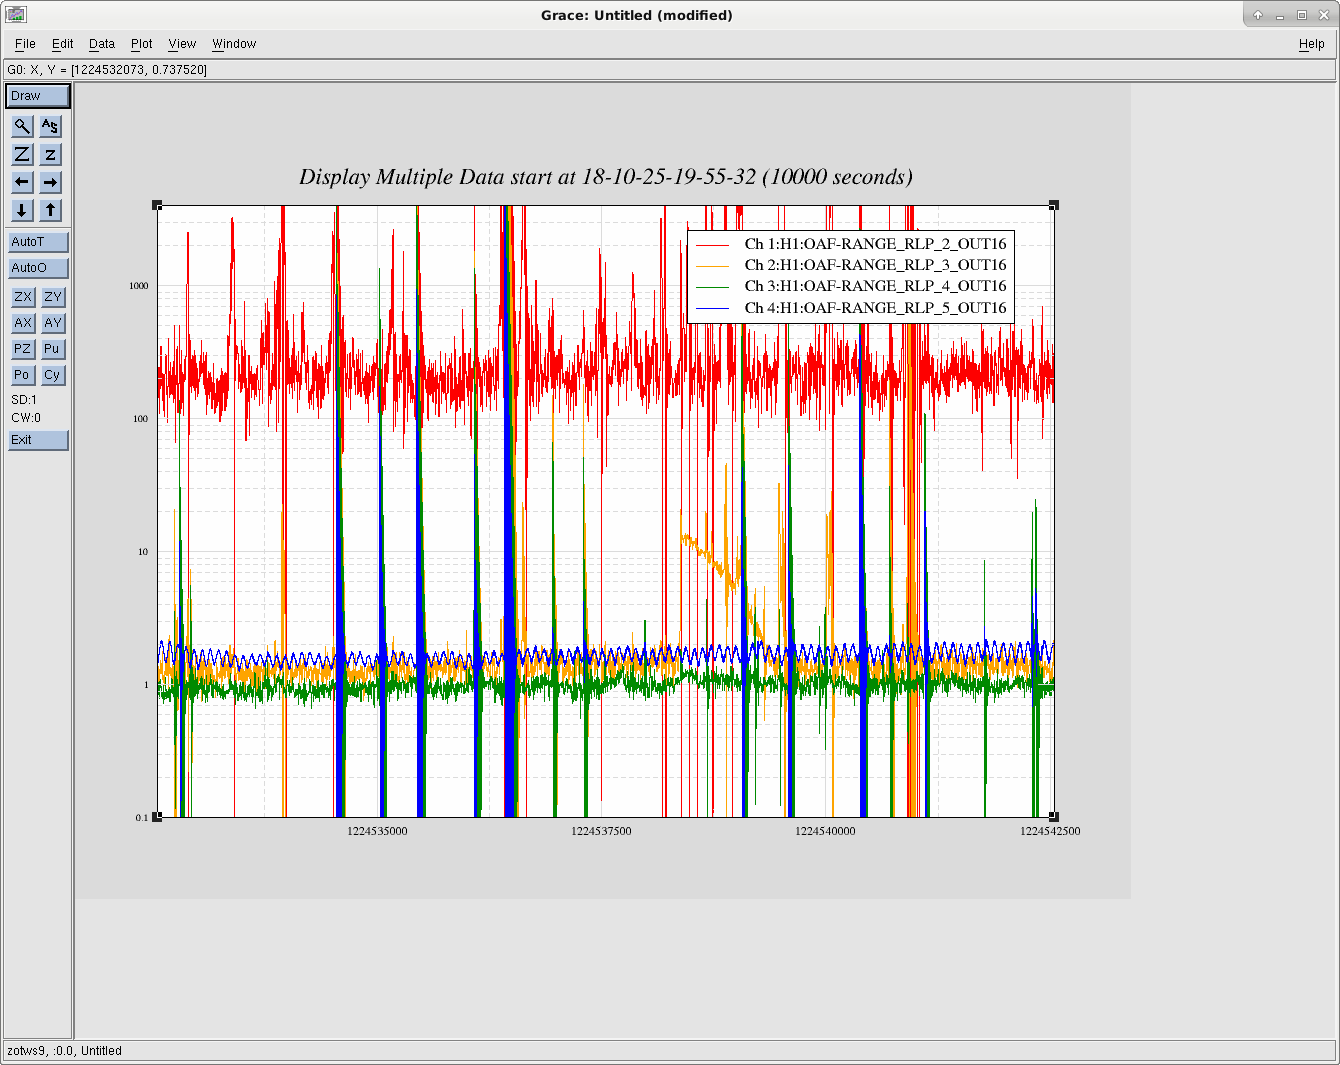
I had a look at the DARM BLRMS during this morning's long lock, it looks like the noise in the 38-100 Hz band is much quieter, see attached plot showing 10000 seconds of data. The extra noise in RLP3 band at 1224538440 is an injection (I think).
Two differences between last night and this morning is the initial alignment has been redone, and the BNS range which decreases over the duration of a lock. Second attachment shows H1 BNS range. The BLRMS plot from last night was taken at T-16, the BLRMS plot from this morning starts around T-4.
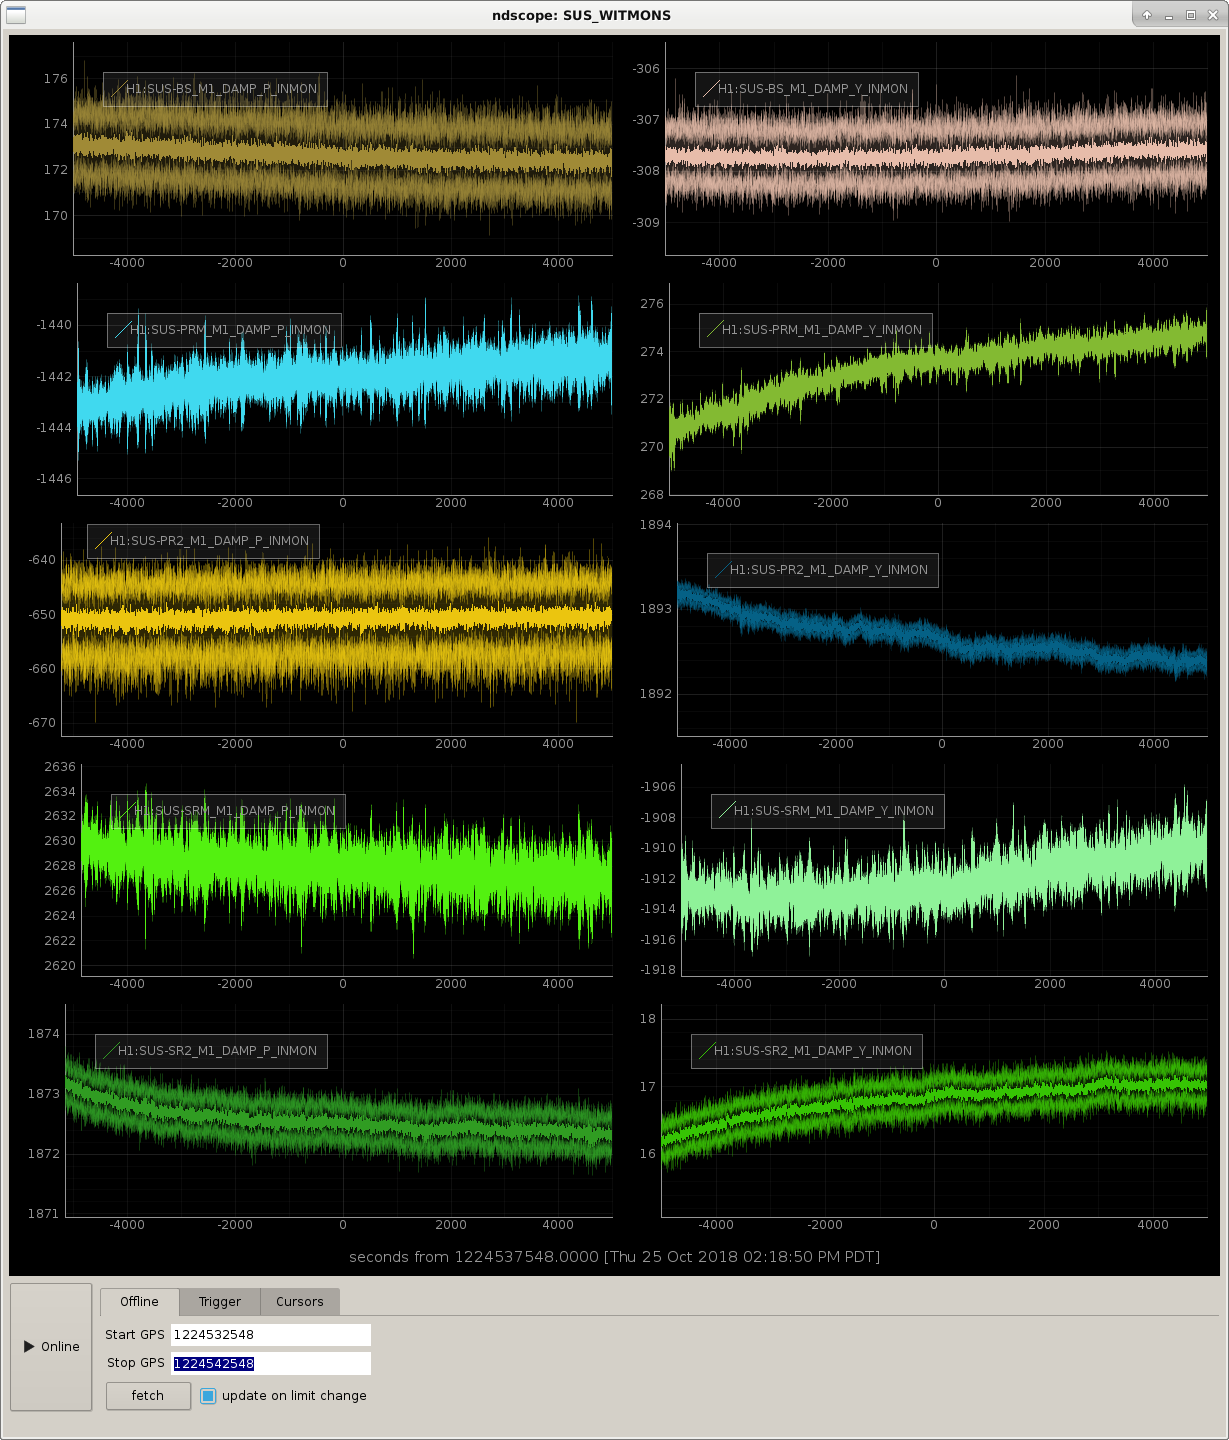
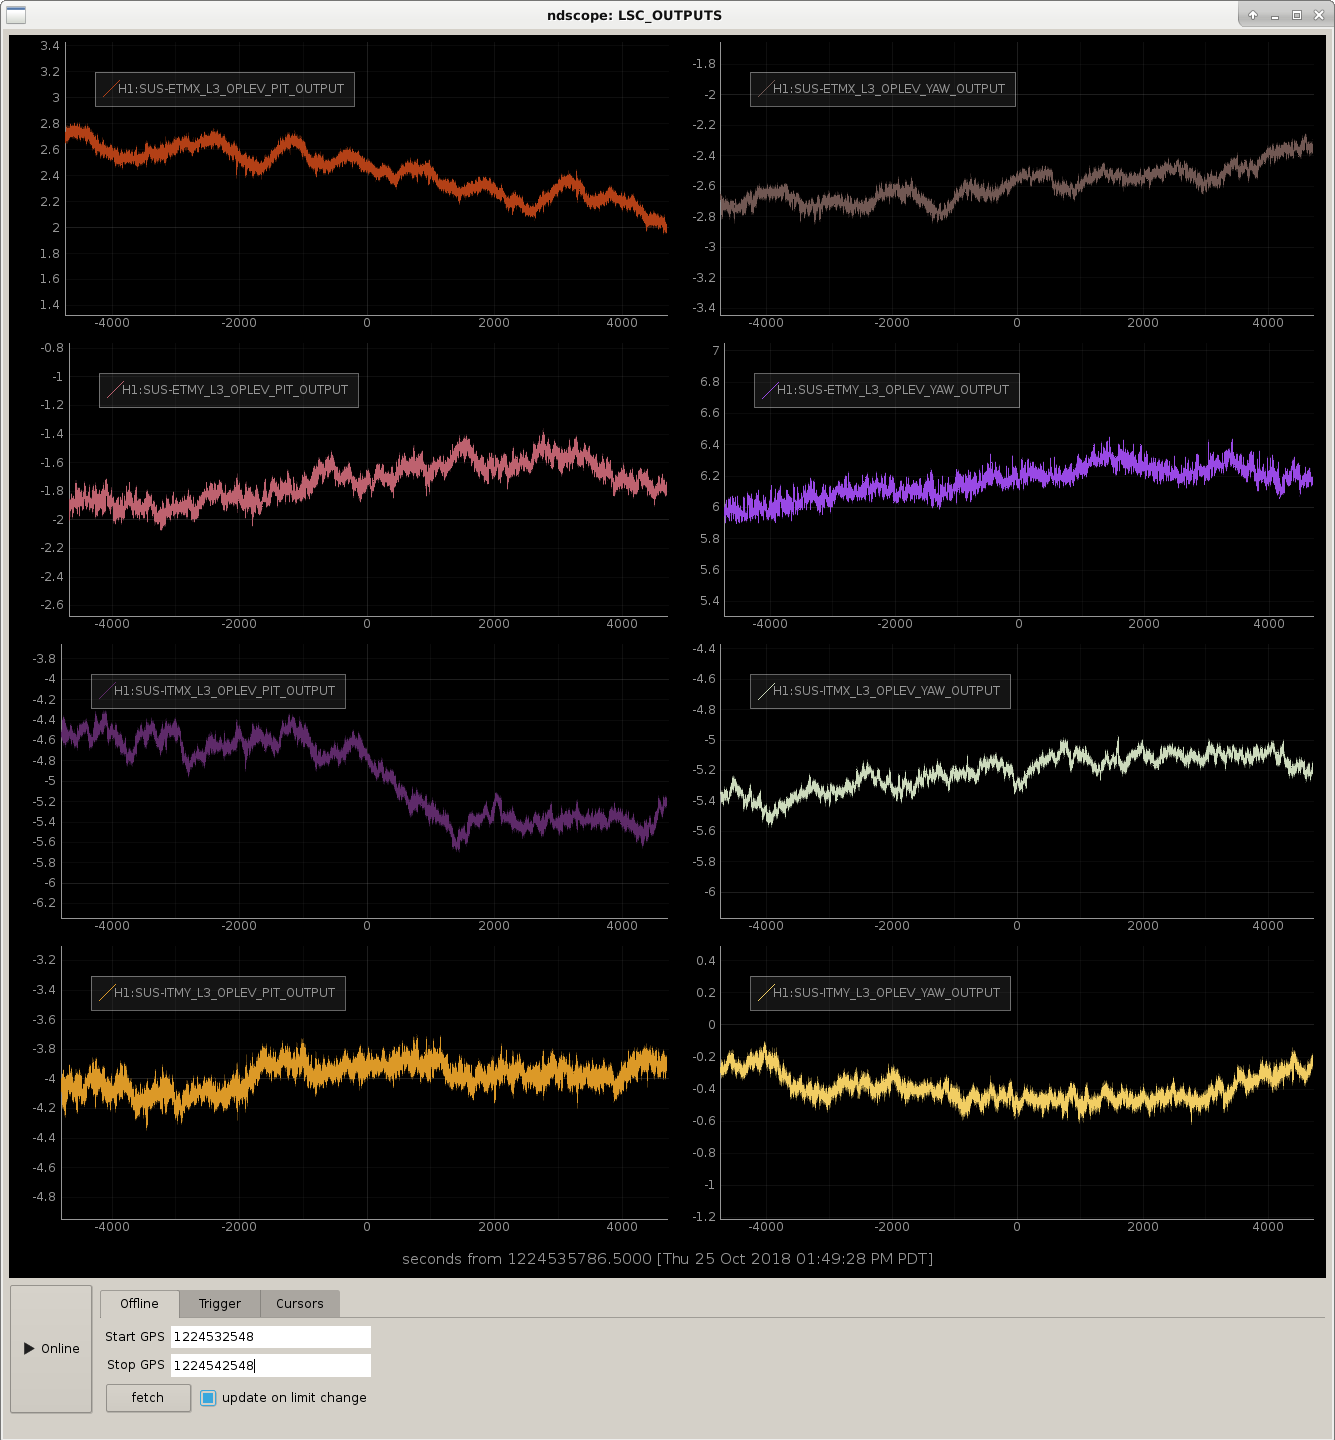
Out of interest I also looked at the suspension witness monitors (3rd attachment) and test mass op levs (4th attachment) over the duration of this morning's the lock. In these plots pitch is on the left and yaw is on the right. PR2 PIT stands out as being extra noisy, and SRM and PRM drift the furtherest over the duration of the lock.
Danny, TJ, Georgia, TVo
Big ups to Sheila for running our measurement after ISC was finished with their work for the night.
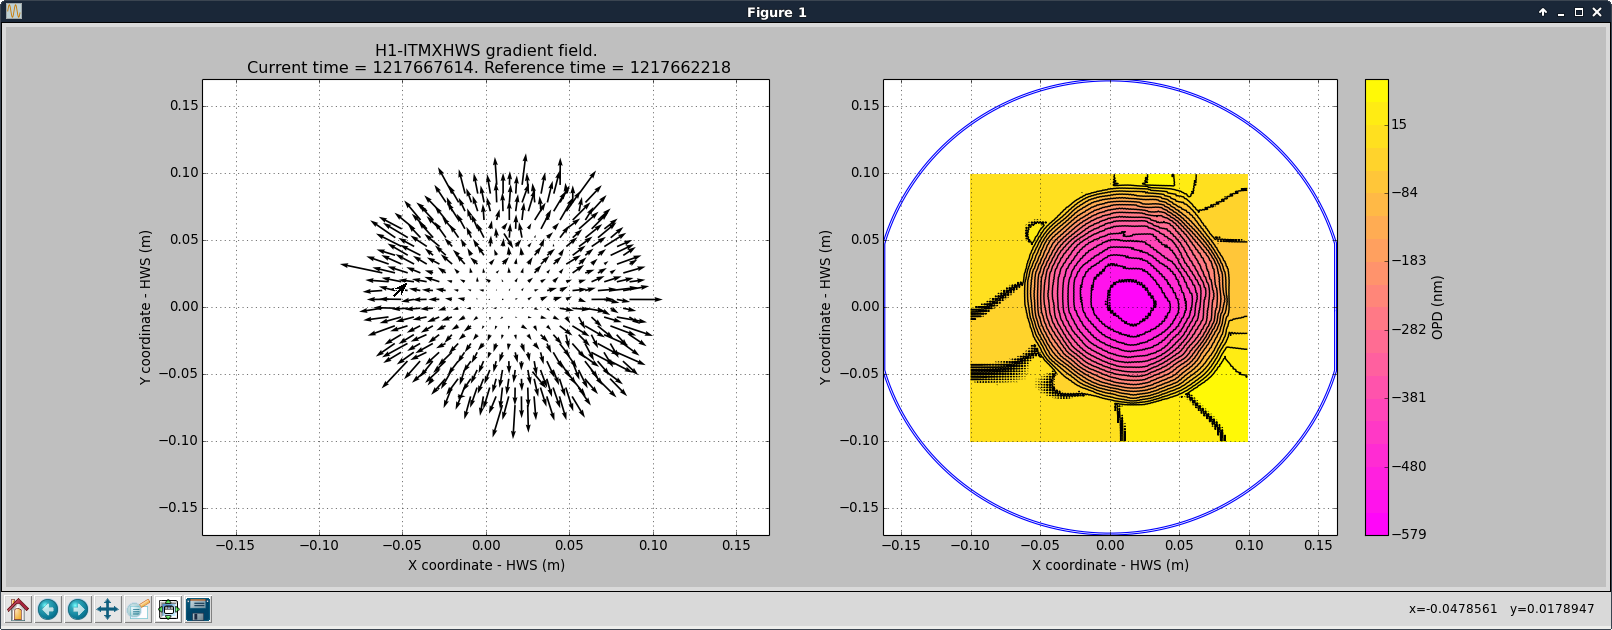
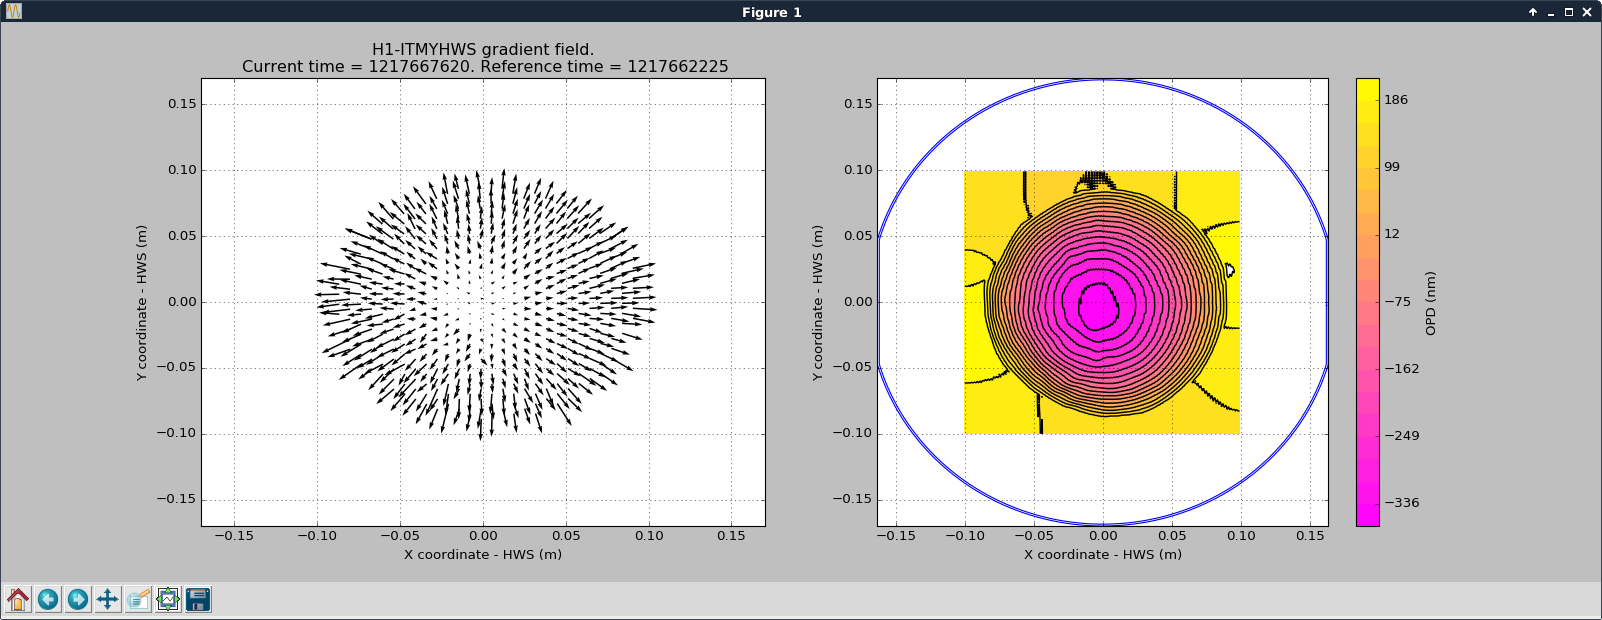
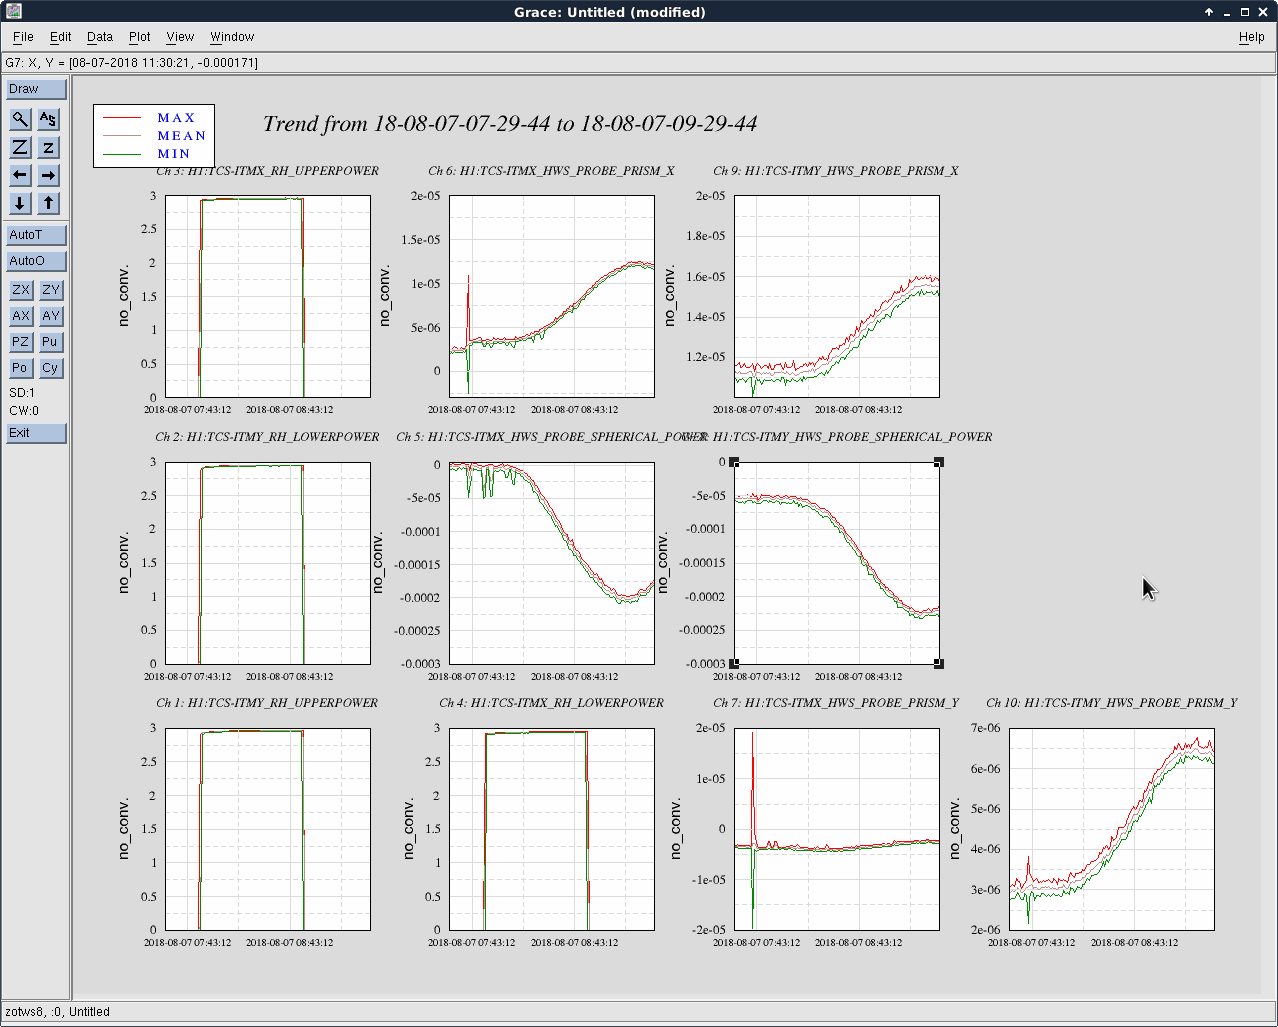
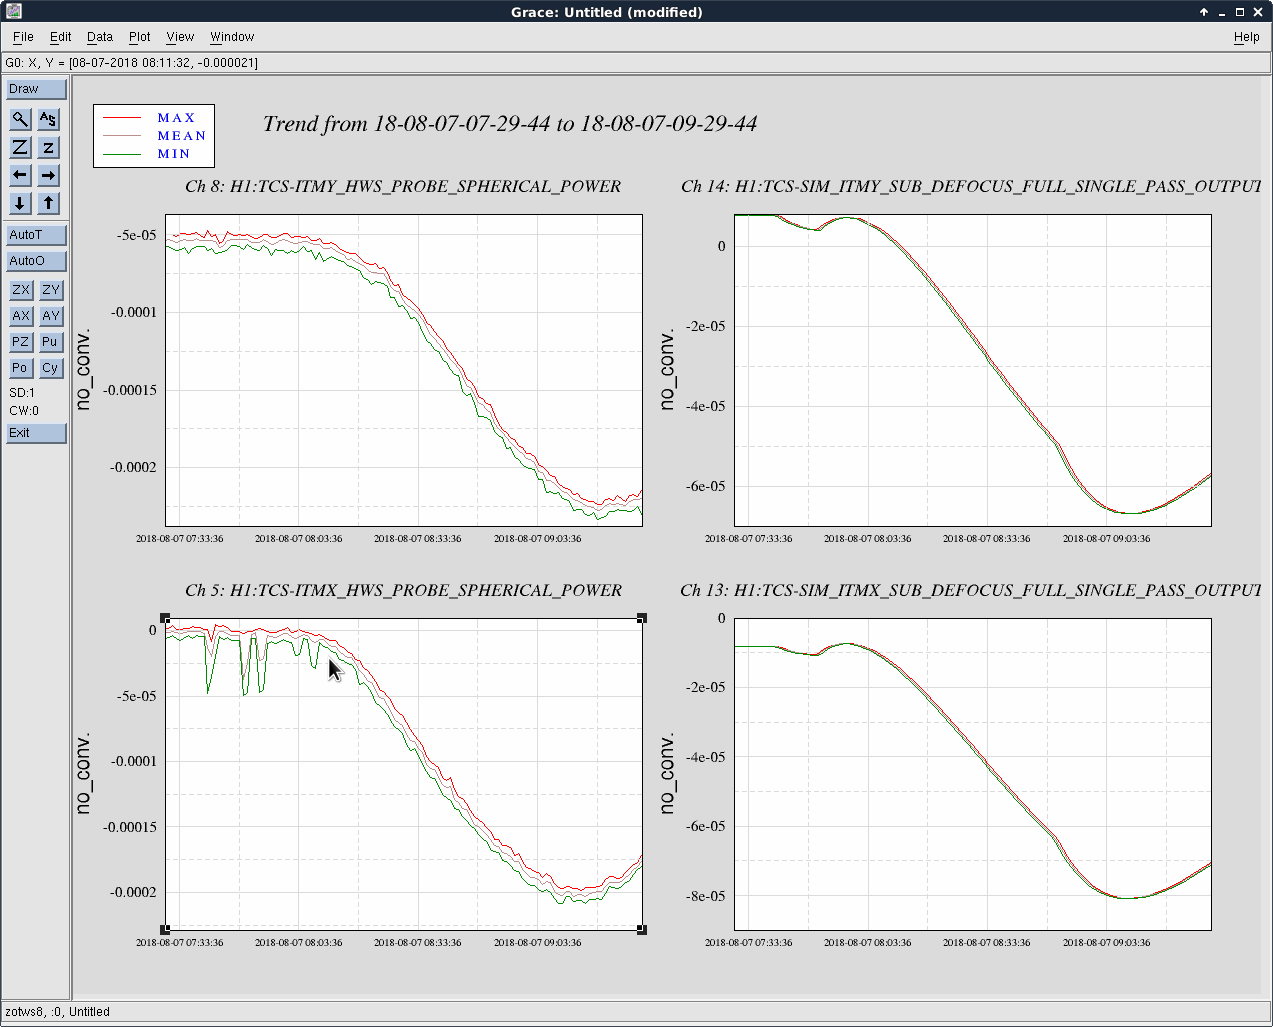
Yesterday Georgia and Danny put in an iris on ITMX to crop out a prompt reflected beam from an in-chamber lens so that we can try to compare the spherical power on both ITMX and ITMY HWS when injecting 6 Watts of power into the ring heaters (3 top, 3 bottom):


Note that there is still a bit of clipping on ITMX on the top right corner. Using the results of a COMSOL model here, where it quotes

| Model Prediction | ![]() |
| HWS ITMX Measured | ![]() |
| HWS ITMY Measured | ![]() |
From yesterday:
Danny installed an iris on the ITMY HWS path directly before the HWS camera.
This iris blocks a problematic stray beam that appears to be reflected off a surface between the viewport and the SR3 baffle.
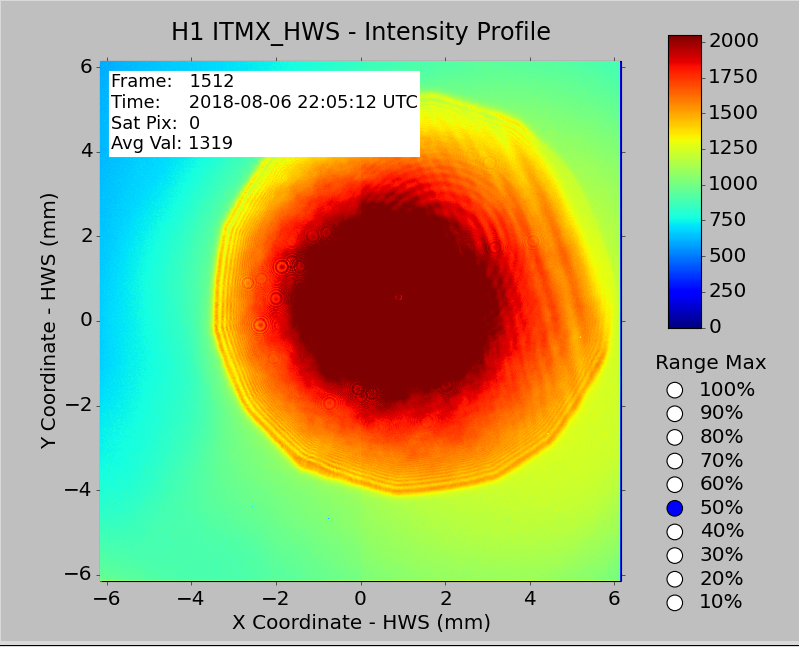
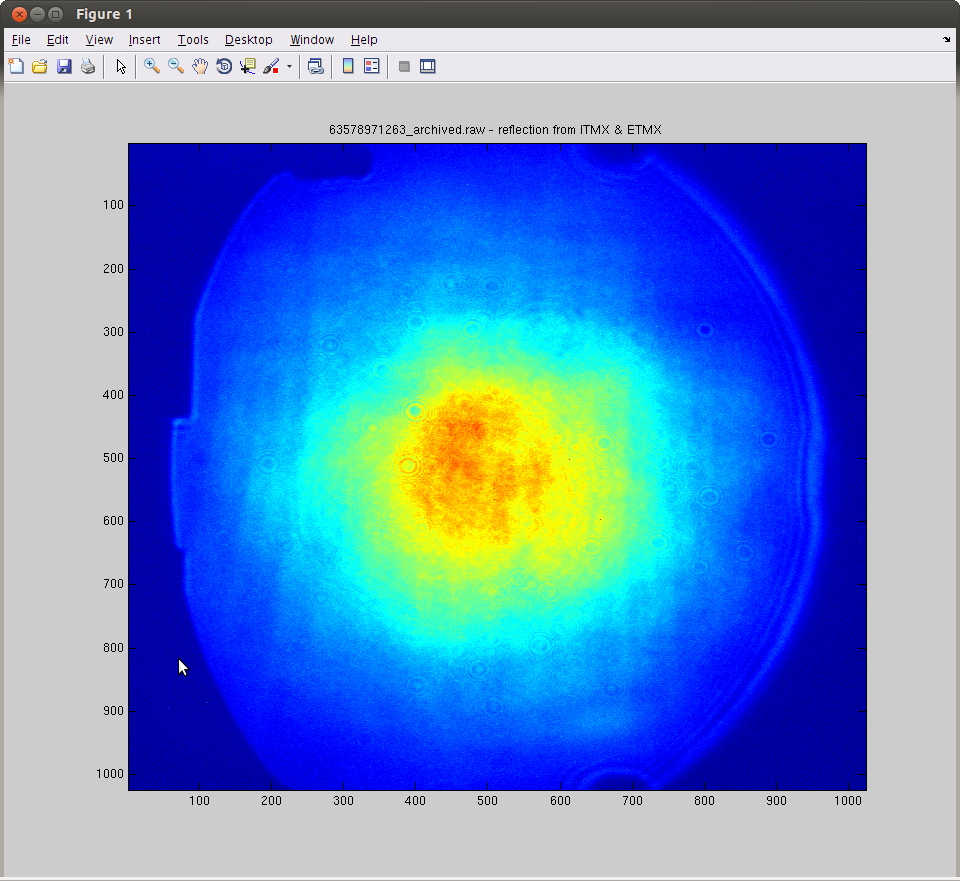
Attaching screenshots of the camera image (with hartmann plate removed) before (attachment 1) and after (attachment 2) iris install. We were a bit concerned about the new fringes and any noise they might introduce. Note the two screenshots were taken with different lighting conditions (table door open/closed) so the intensity difference is not a concern.
For reference, here is how the ITMX HWS return beam looked back in 2014 when everything was first installed.
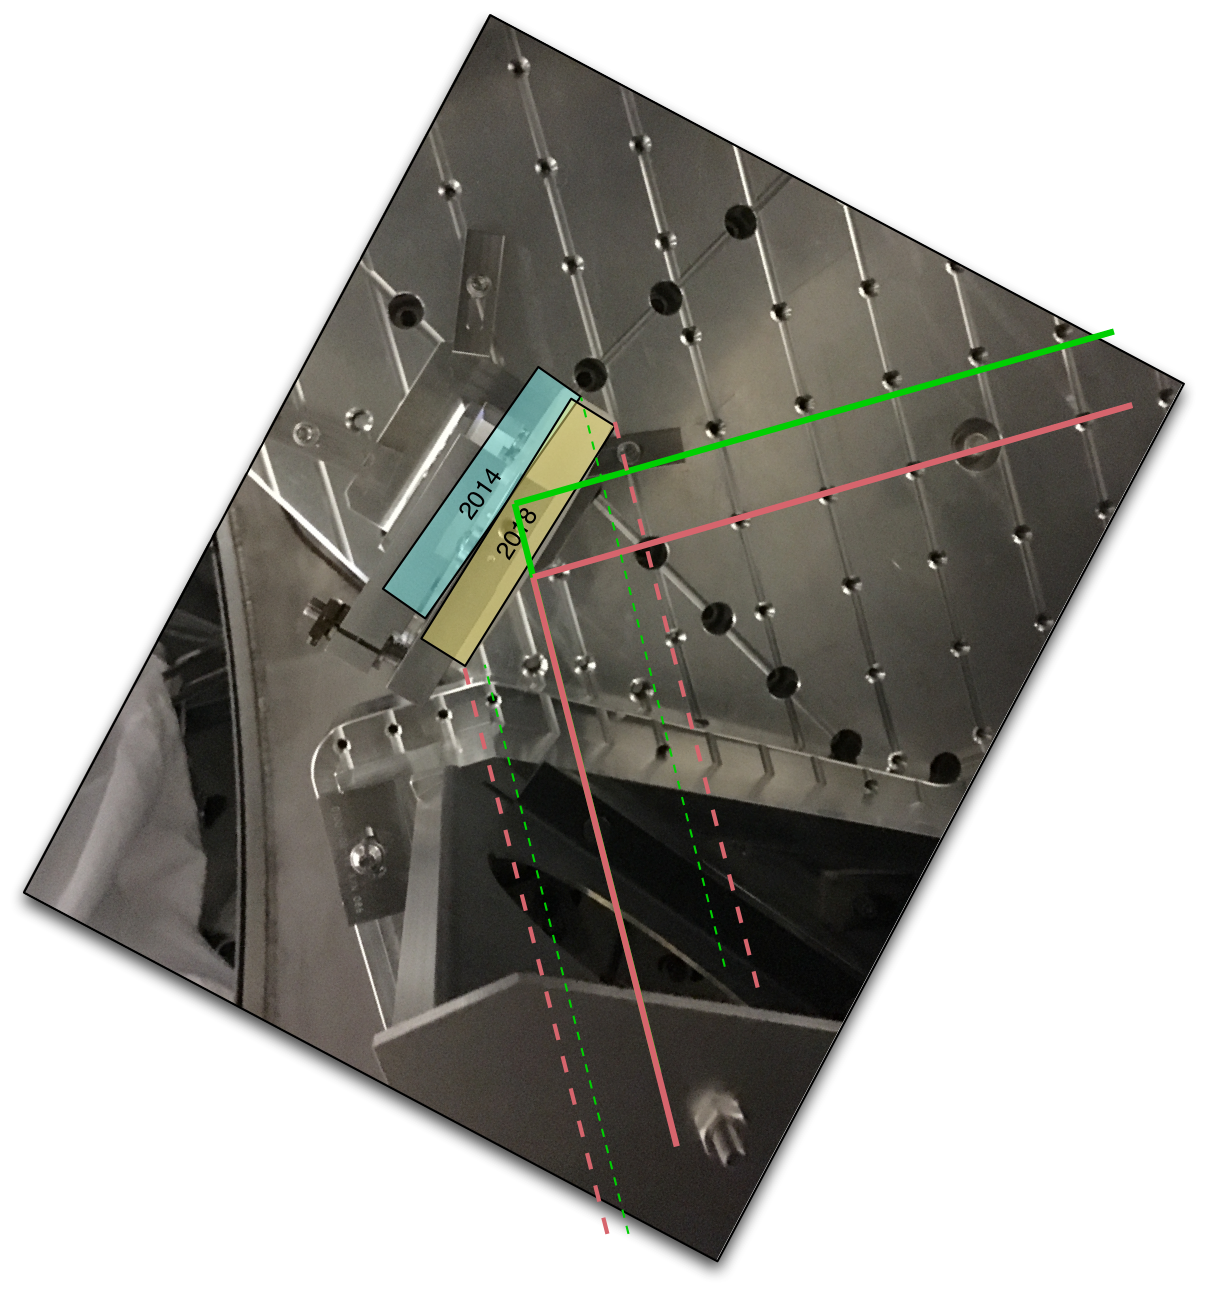
2014 versus 2018
And here's a view with the 2014 and 2018 beams overlapped. Roughly 50% of the HWS probe beam is clipped.

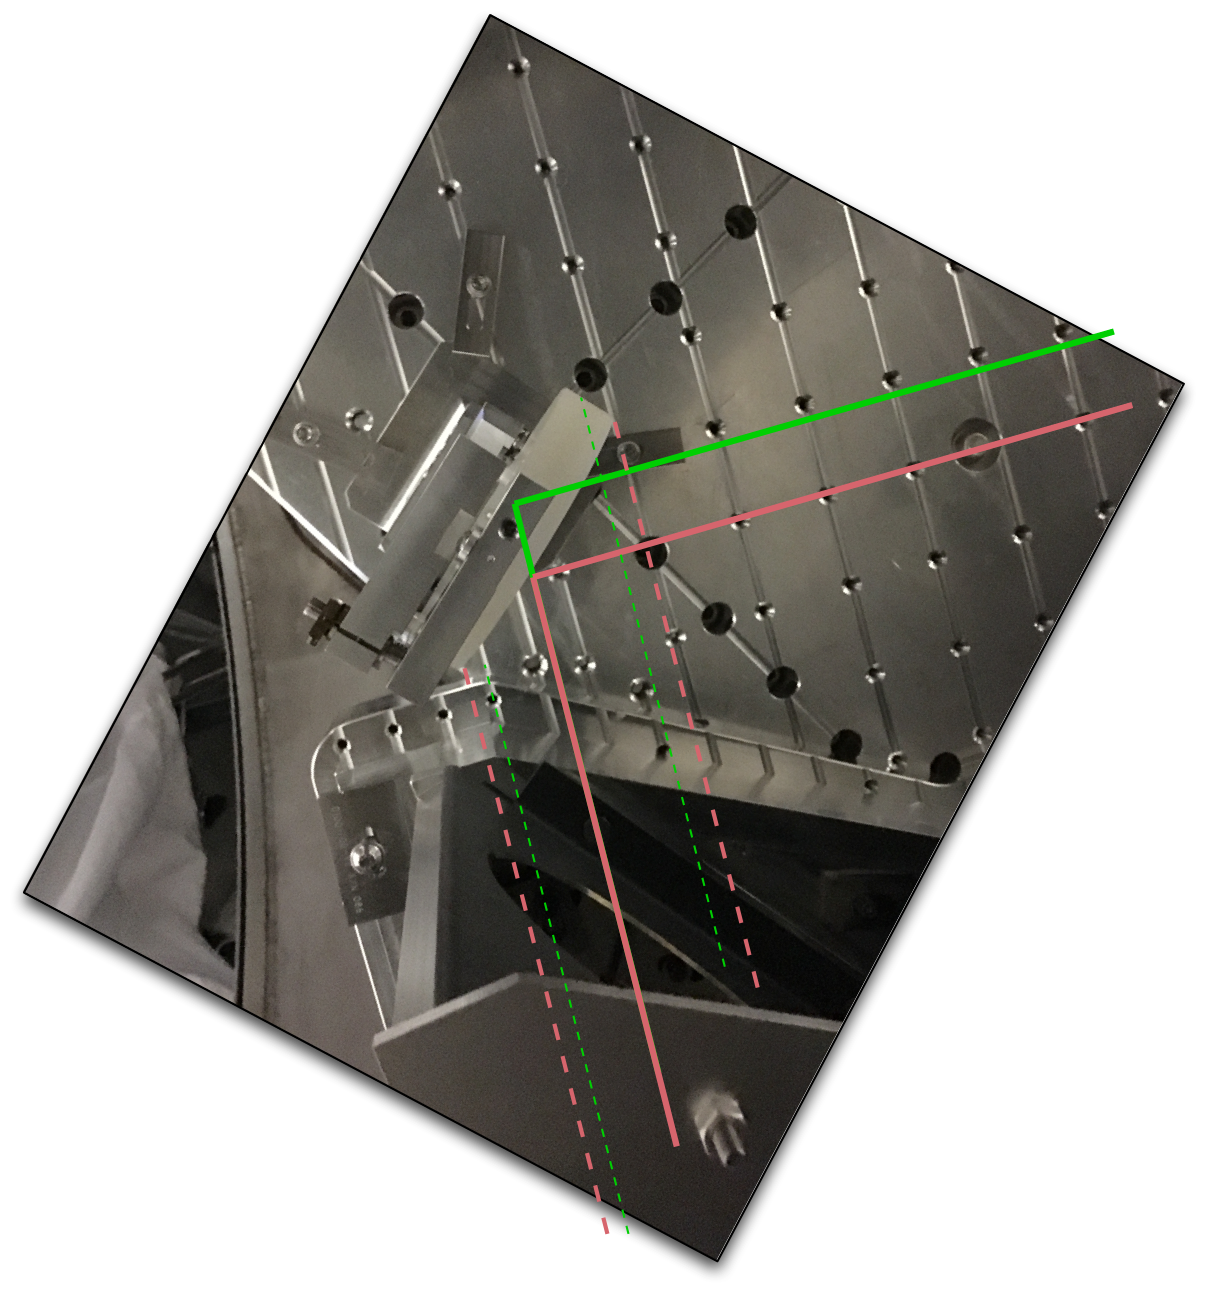
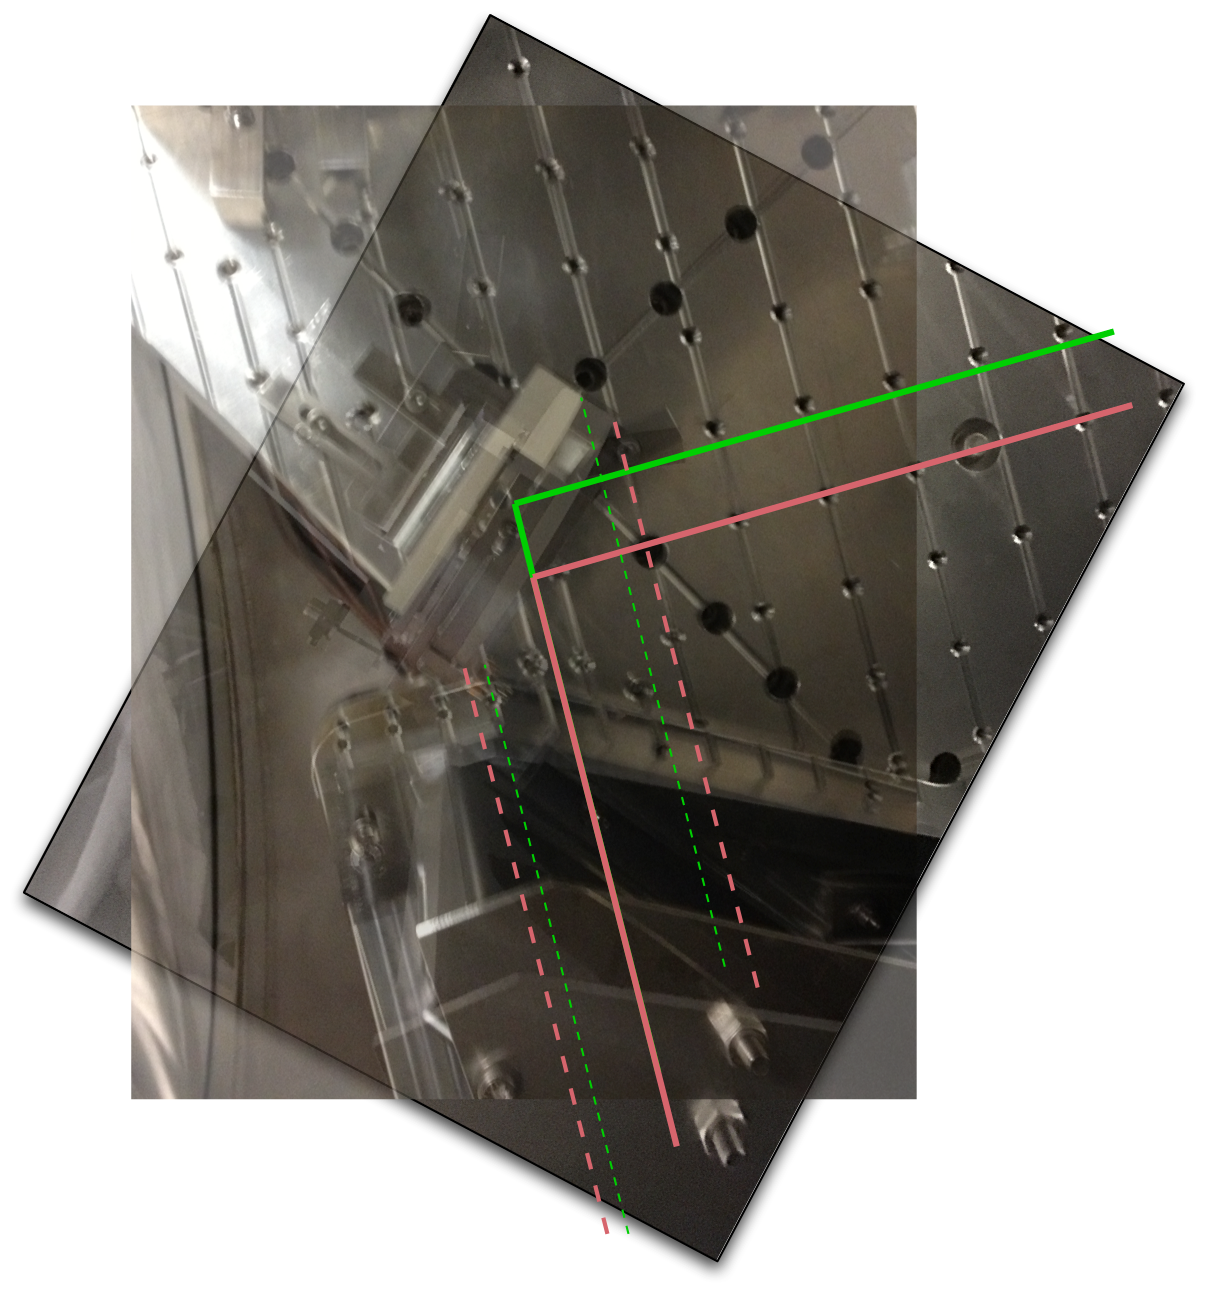
I think I've tracked down the source of the problem with the HWSX probe beam clipping. The issue stems from the fact that the new HWSX STEER M1 optical mount required the base to be moved. This was known and we aimed to keep the optic face in the same location. However, in placing the new optical mount, the wrong face has been kept in the same location - resulting in a displaced front surface.
We aligned the in-vacuum optics assuming the front surface had not moved(aLOG 39053). I'll need to investigate further to trace out the beams but this is almost certainly the cause of the clipping we're seeing.
The attached images show an overlay of two photos of the HWSX STEER M1 optic in 2014 (aLOG 12615) and 2018 (aLOG 39071)
FRS issue (https://services.ligo-la.caltech.edu/FRS/show_bug.cgi?id=11691)

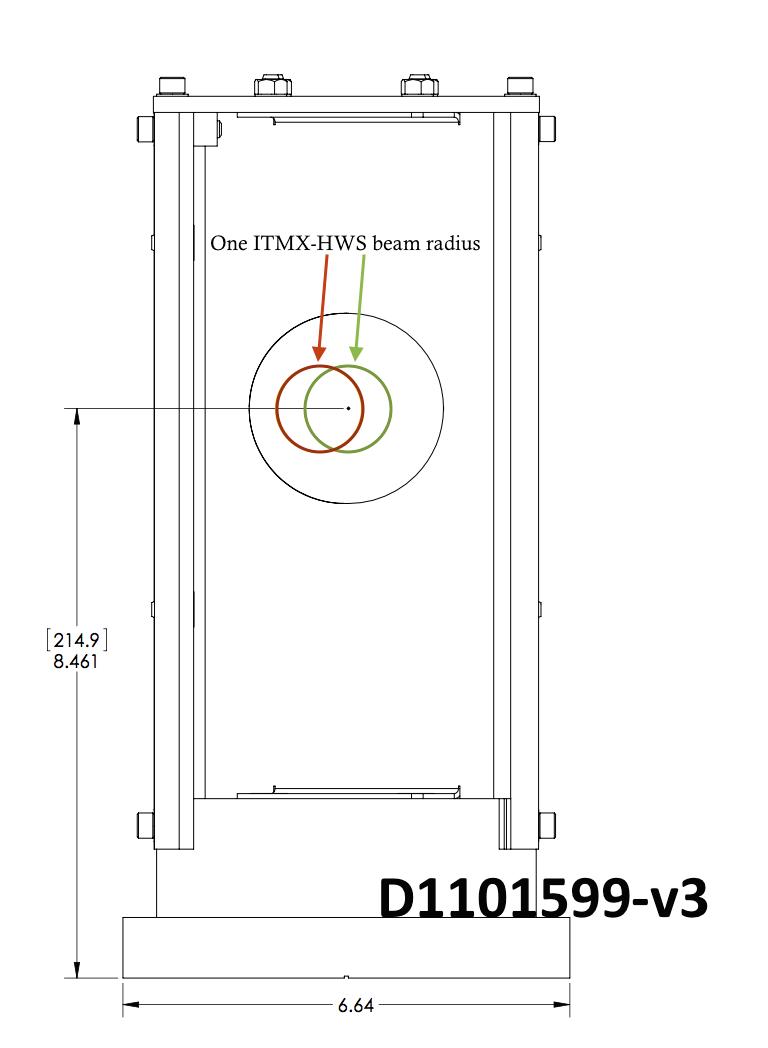
After looking closely at the in-chamber photos, I've tried to estimate what the optical axis is doing. It should move in the -Y direction by ~7-10mm in the Hartmann Scraper Baffle.

If that's the case, then the beam size (at one beam radius) going through the aperture will look something like the following. The red beam is getting close to the edge of the aperture.

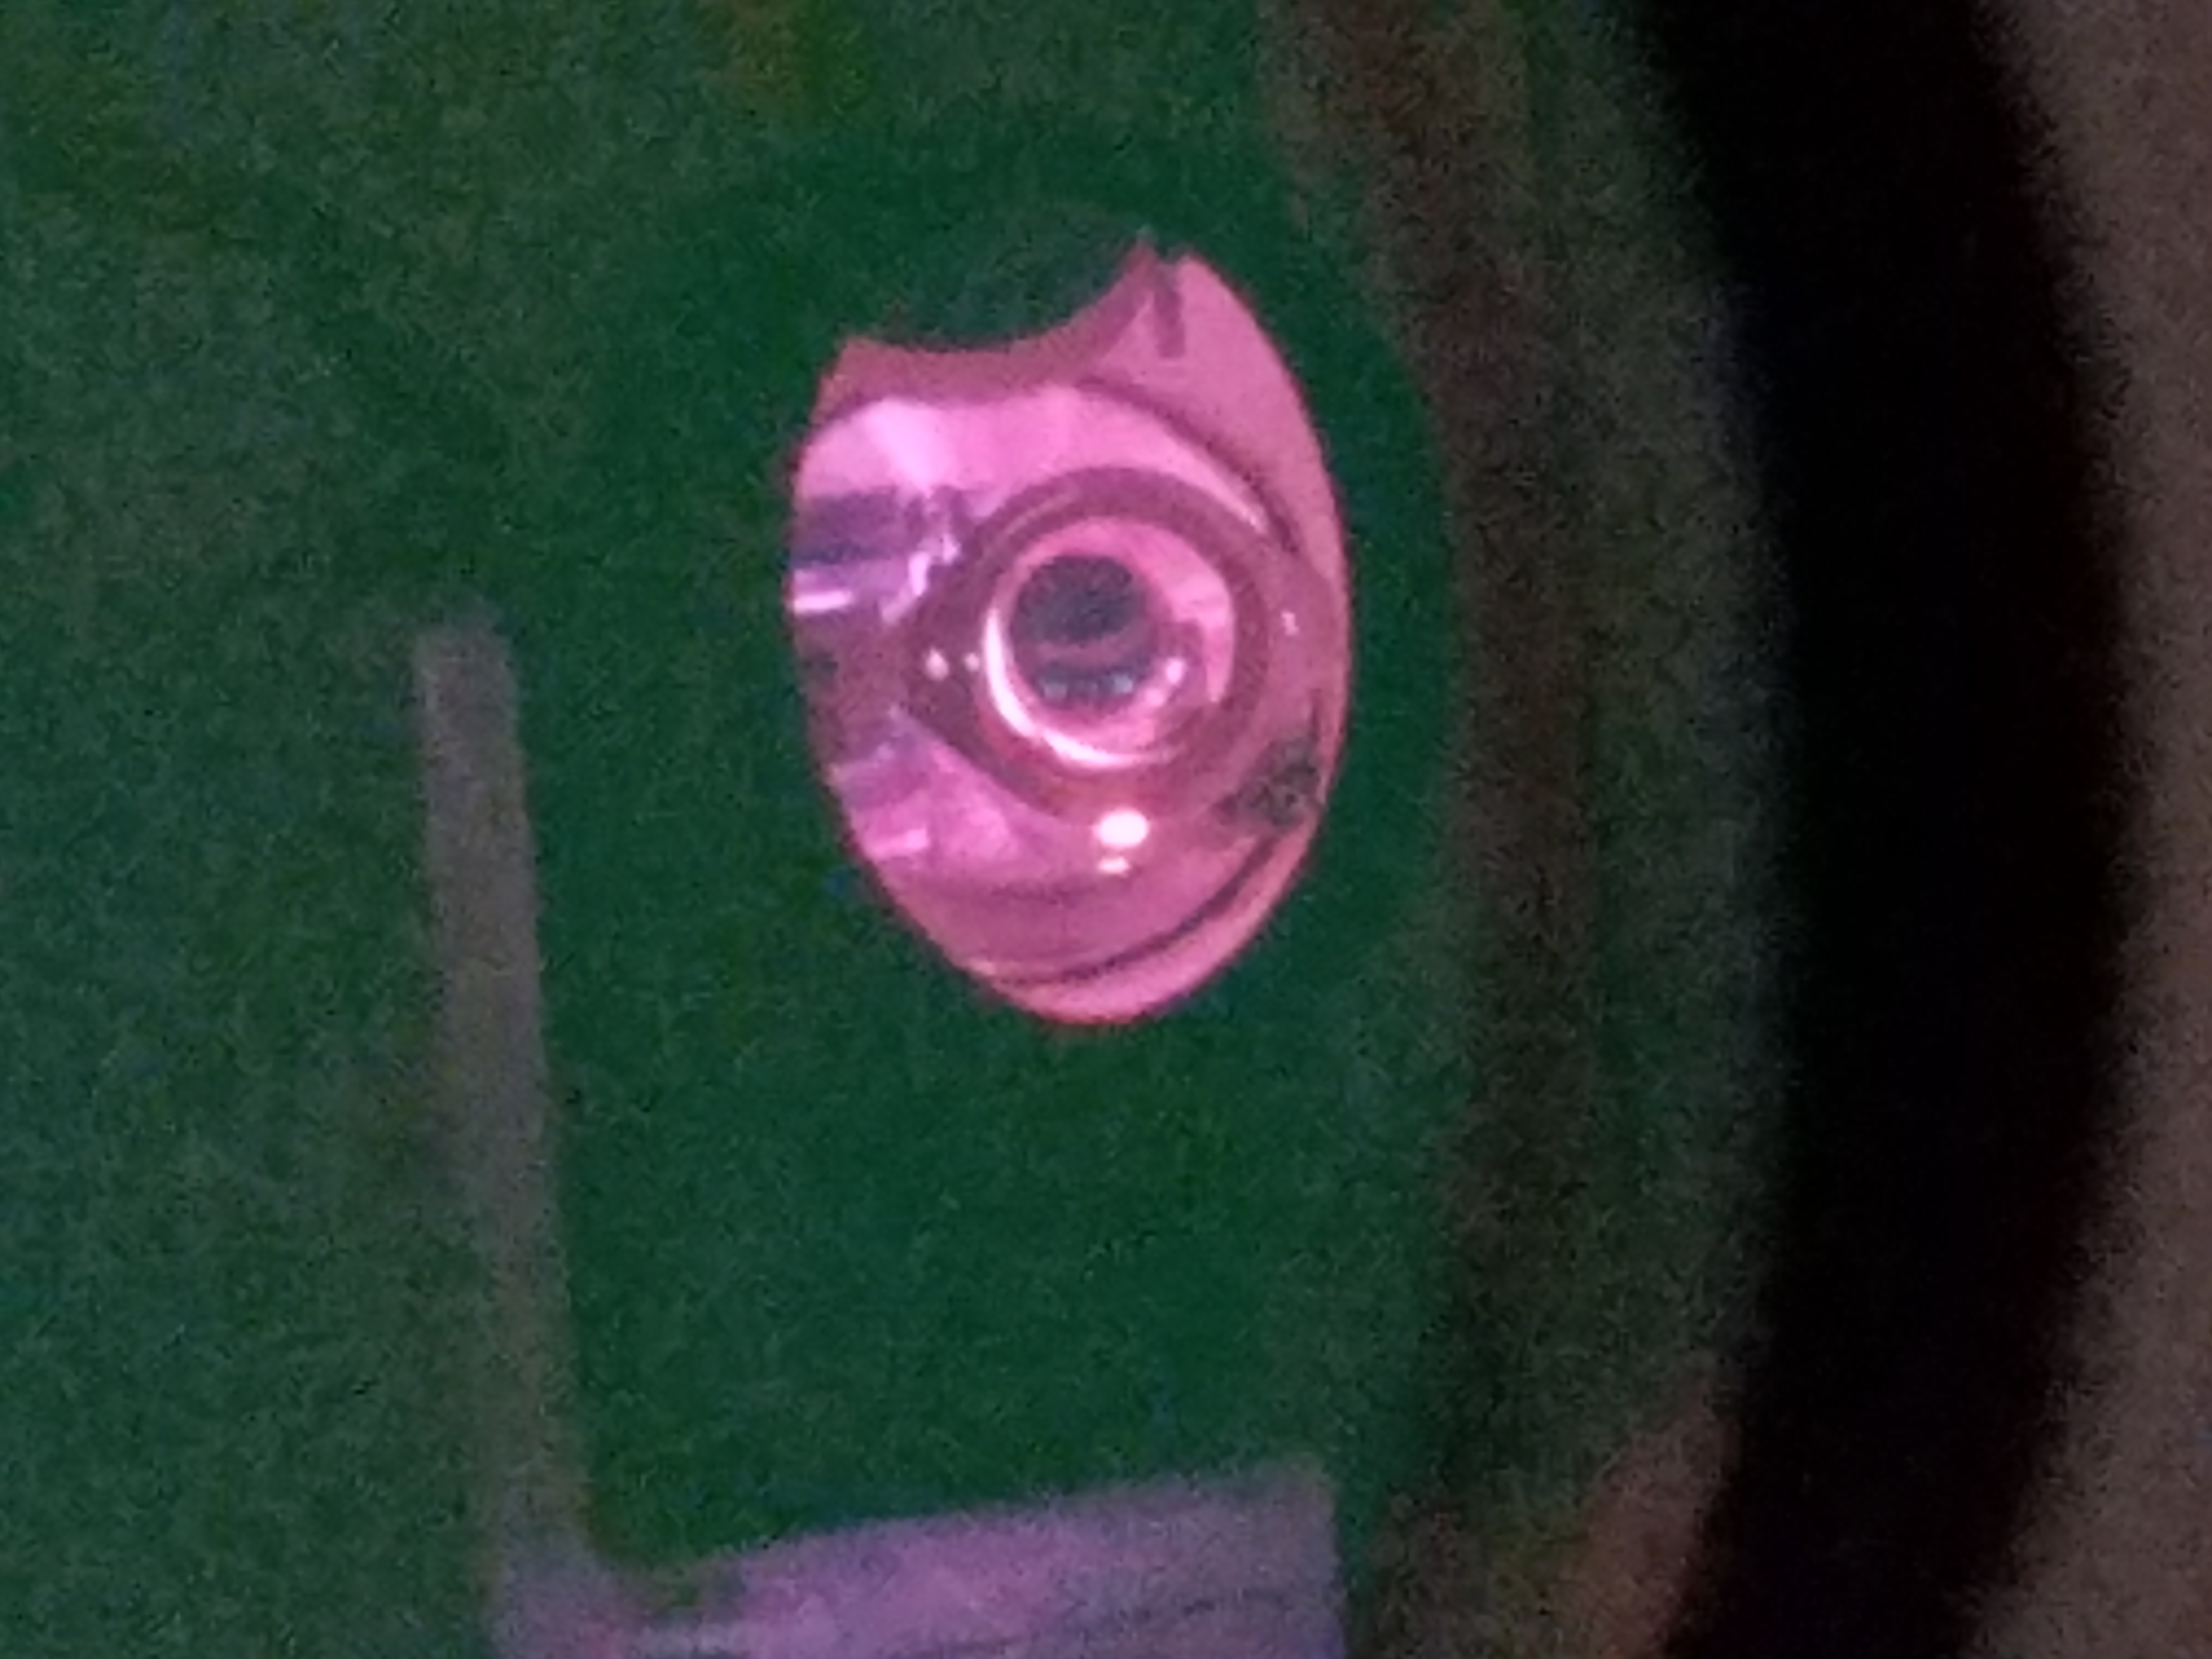
TJ took some photos of the in-vacuum optics with his phone and we can see relatively well along the optical axis of the HWS (although not with enough resolution to see the scraper baffle).

We'd like to try to do this with the chamber illuminated and a good SLR camera that is placed in the optical axis and focussed at the same distance as the scraper baffle. We should see a series of concentric circles and ellipses that are the apertures of all the optics and baffles. If, as I suspect, the HWS scraper baffle is now off center relative to the beam, it should be visible as such in this image.