Displaying reports 44881-44900 of 88399.Go to page Start 2241 2242 2243 2244 2245 2246 2247 2248 2249 End
Reports until 14:51, Thursday 25 October 2018
H1 CAL
ling.sun@LIGO.ORG - posted 14:51, Thursday 25 October 2018 - last comment - 15:59, Thursday 25 October 2018(44828)
Fix signs and definitions in pyDARM
Evan Goetz, Lilli Sun

The DARM loop sign conventions and the definitions of open loop gain, closed loop gain, and response functions are documented here -> T1800456

We revisited the signs in the DARM control loop and the response functions. In O2, we did all actuation in Y arm. For O3 the TST actuation was switched to X arm. Hence there are two separate sign issues: (1) is the actuation in UIM/PUM (push) or TST (pull), and (2) is it in X (+) or Y (-) arm. We had too many sign definitions in the code. The arm signs and the output matrix signs can be combined together. This has been fixed in actuation.py

By definition, we have G=A*D*C and the negative feedback "-" is not included in "A". We fixed the code to keep things consistent with this convention. Correspondingly, we have open loop gain = -G (fixed in the open loop gain processing script), closed loop gain = -G/(1+G), response function R = (1+G)/C (fixed in computeDARM and RRNom).

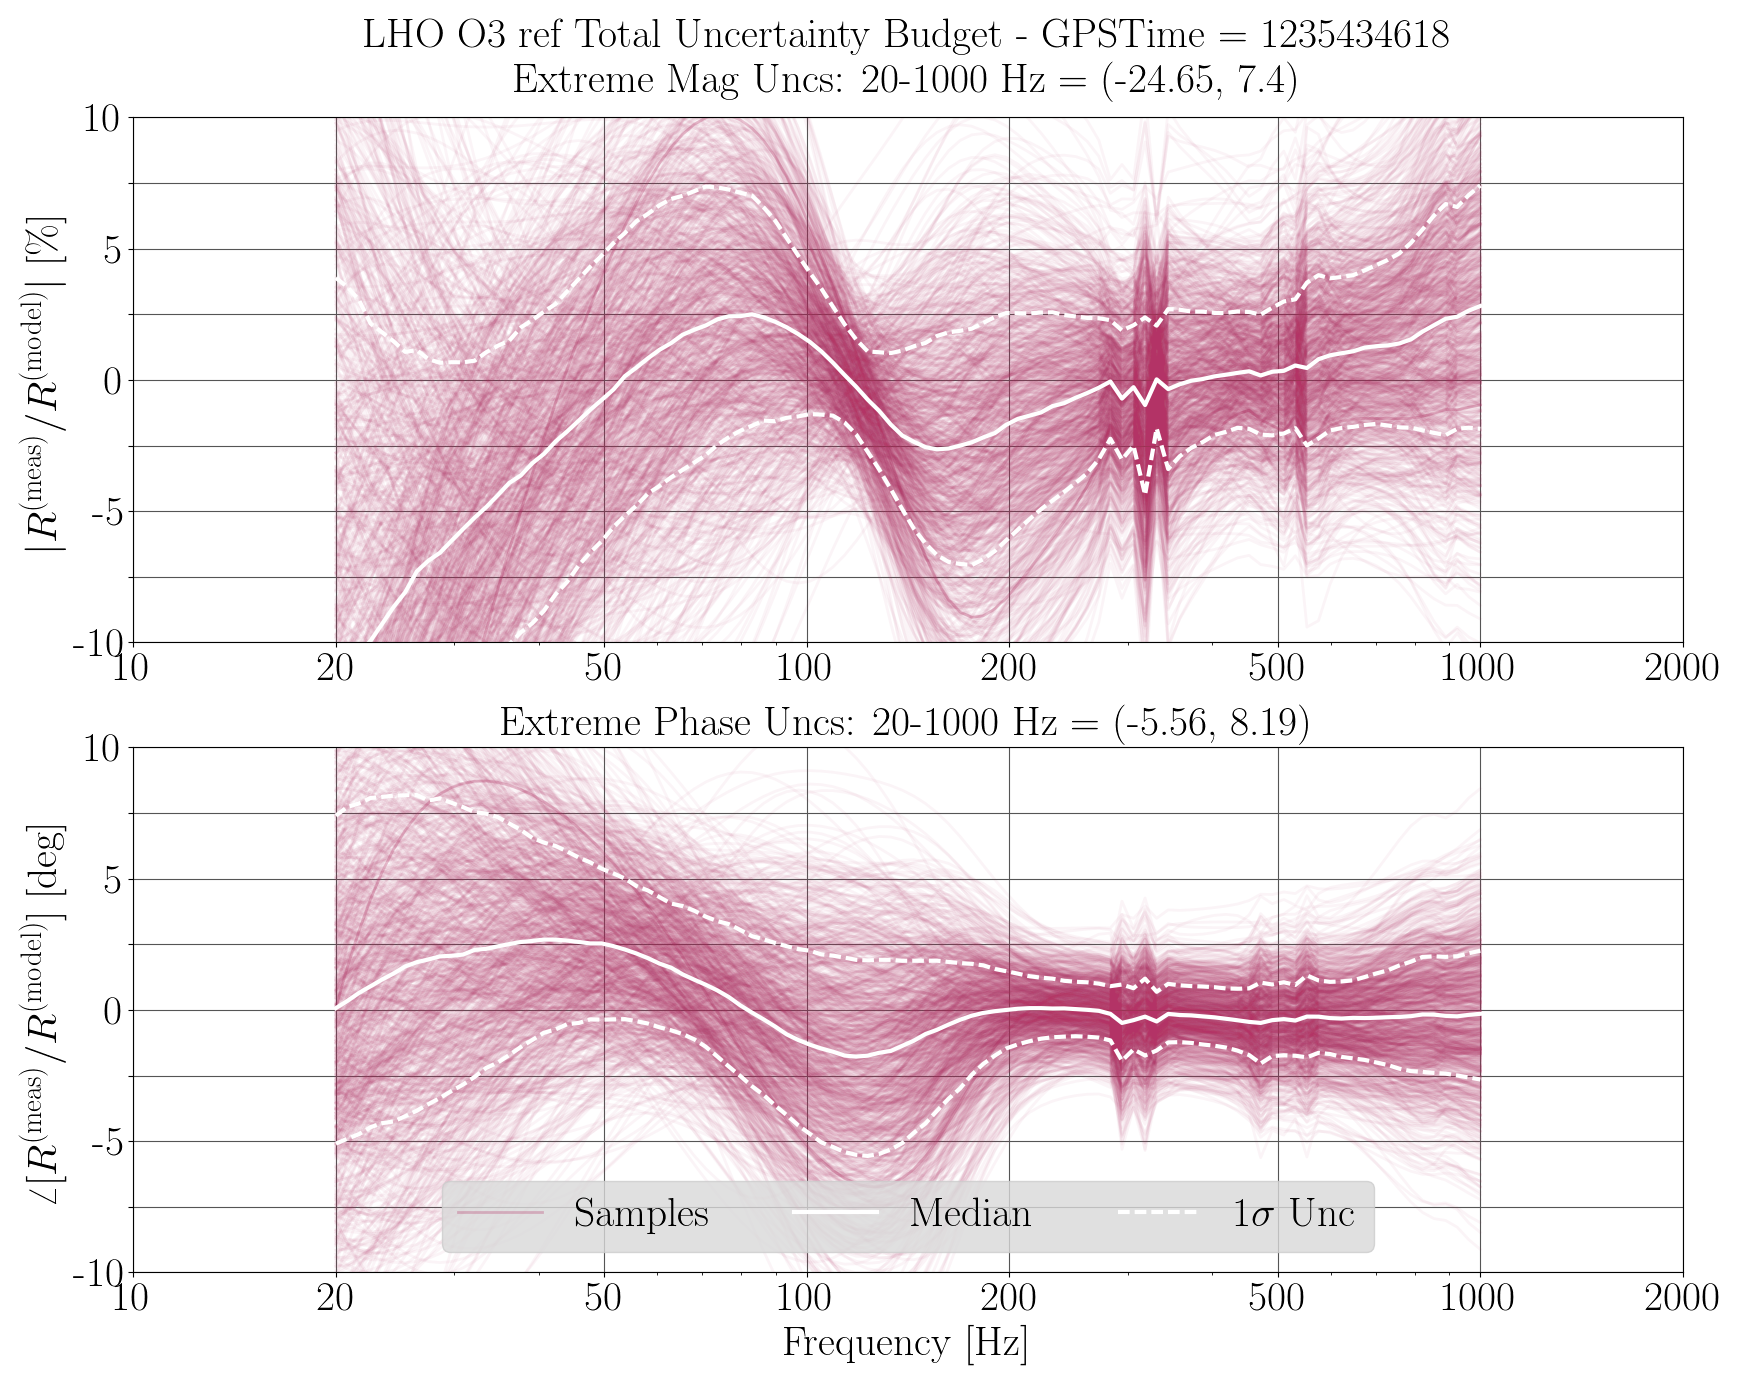
After all these changes, our model matches the measurements. The phase at unit gain frequency is near -180 deg (see meas vs model plot).

We processed the new calibration measurements taken by Jeff on Oct 23, and ran GPR using the both sets of measurements (Oct 12 & 23) after the model files are updated with MAP values.

At last, we tested RRNom with reference model. The plots do not look good because the measurements we have are poor (see corresponding sensing corner plot and actuation GPRs).
Images attached to this report
Non-image files attached to this report
Comments related to this report
ling.sun@LIGO.ORG - 15:31, Thursday 25 October 2018 (44832)

Note: After rerunning the MCMC again, the weird patches in the sensing corner plots disappear (Oct 12 measurement). This might be caused by the poor measurement. Keep in mind and check in the future.

evan.goetz@LIGO.ORG - 15:59, Thursday 25 October 2018 (44835)
The high uncertainty at low frequency definitely begs for the need of better precision measurements of the actuation stages at low frequency. We had that during O2, but right now we only have the single, quick-n-dirty measurement of the actuation stages.
H1 SQZ (SQZ)
haocun.yu@LIGO.ORG - posted 10:05, Thursday 25 October 2018 (44822)
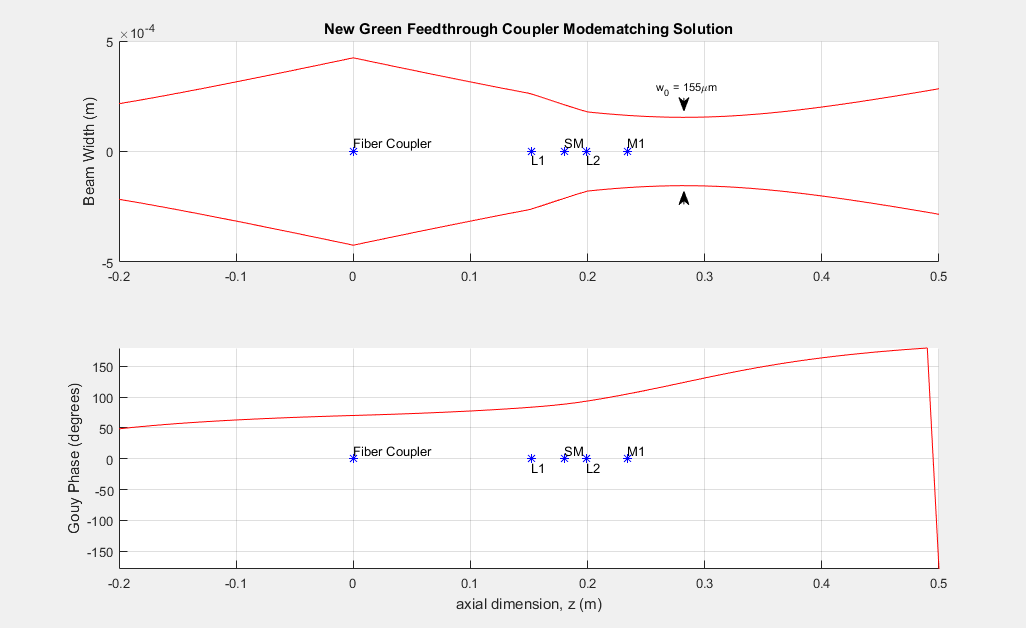
VOPO New Green Feedthrough Fiber Coupler Modematching Solution

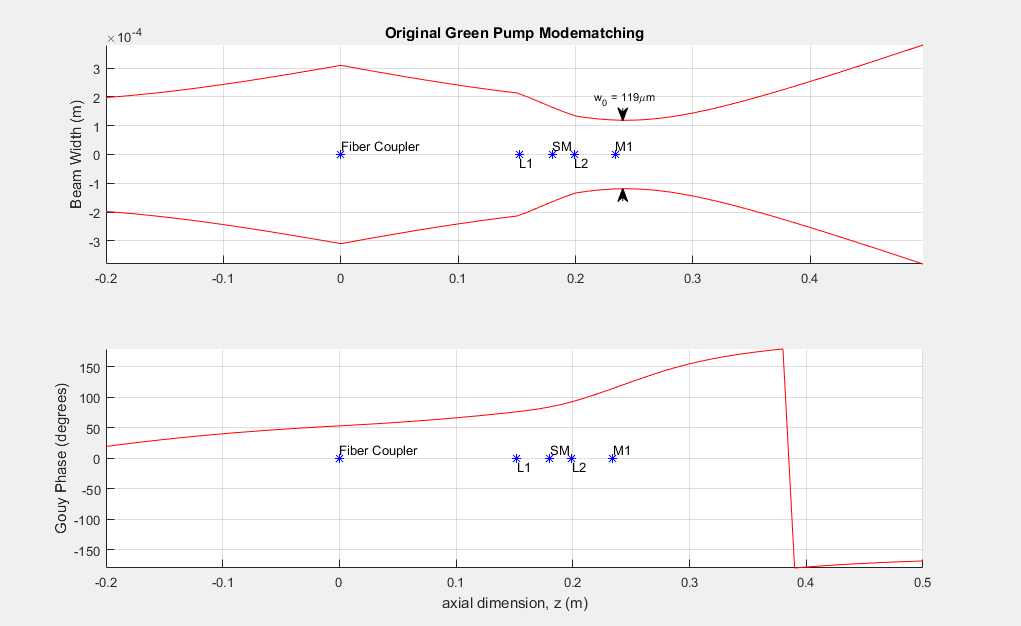
Modematching solution for 532nm feedthrough and fiber replacement


Original green pump path mode matching (Pic1) according to Nutsinee's fiber coupler mode measurement and distances from alog 40362.


Solution with new coupler (Pic. 2) according to Fabrice's measurement:


Images attached to this report
H1 DetChar
ansel.neunzert@LIGO.ORG - posted 09:40, Thursday 25 October 2018 - last comment - 12:19, Friday 26 October 2018(44820)
Reappearance of a near 1-Hz comb previously associated with Hartmann wavefront sensor

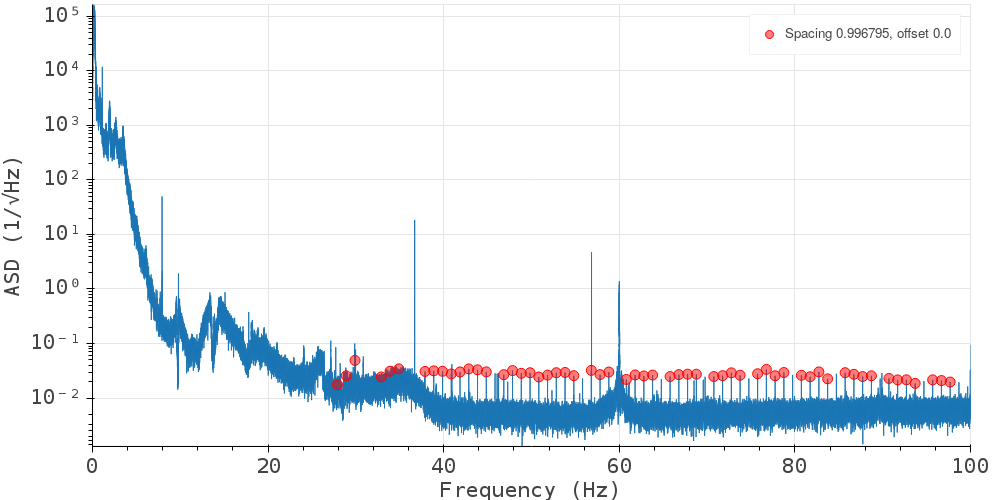
There's a comb visible in recent DARM data at multiples of 0.996795 Hz (last digit uncertain). This is suspiciously similar to a comb seen before O2 (then measured at 0.996798 Hz), which was due to the HWS. Just as before, the comb appears strongly in corner station magnetometer channels.

I've attached an image showing teeth of the comb below 100 Hz (Oct 24, ~50 minutes starting at 9:30 UTC). It is also visible in other lock stretches within the past few weeks. When this comb was seen before, it coupled only intermittently to DARM; its presence seems steadier now.

Relevant past alogs:

Images attached to this report
Comments related to this report
daniel.vander-hyde@LIGO.ORG - 10:28, Thursday 25 October 2018 (44825)

Hey Ansel,

The Hartmann camera sync frequency is set to 1Hz for both cameras at the vertex. 

keith.riles@LIGO.ORG - 11:42, Thursday 25 October 2018 (44827)DetChar
Hi Daniel,

Right, some of us were wondering in an email thread if that frequency could be set to something different for a period of time, ideally with DARM in low noise, but that's not essential for things to be seen in magnetometers.

thanks,
Keith
daniel.vander-hyde@LIGO.ORG - 14:48, Thursday 25 October 2018 (44829)DetChar

Keith and Ansel, 

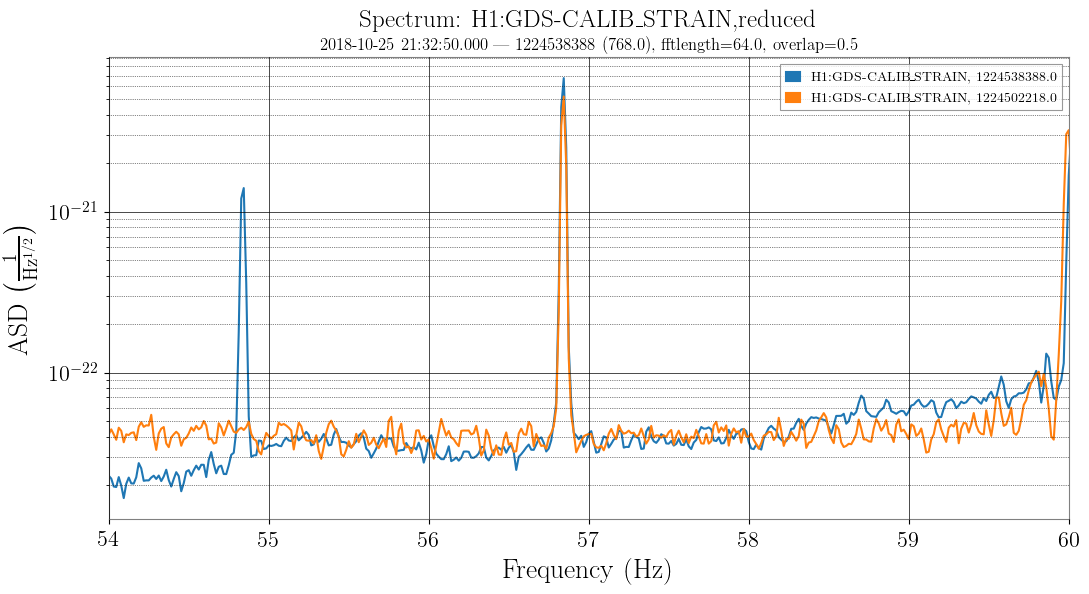
I adjusted the ITMY and ITMX HWS sync frequency to 55 Hz from gps 1224538388 to 1224539253. Please don't hesitate to let me know if you need anything else related. 

andrew.lundgren@LIGO.ORG - 15:15, Thursday 25 October 2018 (44830)DetChar, ISC
Yes, this couples very strongly into DARM. A line at 54.8ish Hz appears with the change (spectrum attached).
Images attached to this comment
ansel.neunzert@LIGO.ORG - 17:03, Thursday 25 October 2018 (44839)

Hi Daniel - yes, that definitely had an effect. I checked both DARM, and also the magnetometer channel where the comb was showing up most strongly. The comb disappears in both channels during the time segment you indicated, and reappears afterward.

aidan.brooks@LIGO.ORG - 12:19, Friday 26 October 2018 (44847)

Indeed this is a known problem with the HWS cameras (FRS 4559). And the problem was solved by placing the cameras on alternate power supplies in 2016. I suspect that following the post-O2 disconnecting and reconnecting of the HWS table and cables, the cameras got plugged into the chassis power supply again. We should do the following for all 8 HWS:

  • Confirm that the HWS cameras are plugged into the chassis. If so,
  • Get the plugged into a separate power supply, and
  • Lock out the chassis power supply to the cameras to prevent plugging them back in there in future, and
  • After consultation with Rana, look at getting them plugged more permanently into a dirty power supply (like the one for the vacuum system) and check they're properly isolated from the clean power
  • Also - enable EPICS control & read-back of the camera frame rate

This should be done for the ETMs as well (where the 57Hz is an issue). The original isolation fix does not appear to be robust enough.

Block diagrams (DCC is down so I can't get hyperlinks right now)

  • Corner station: E1100892
  • End stations: E1100891


H1 ISC
gabriele.vajente@LIGO.ORG - posted 09:38, Thursday 25 October 2018 (44817)
Morning locking activities
Images attached to this report
H1 SEI
thomas.shaffer@LIGO.ORG - posted 08:54, Thursday 25 October 2018 (44819)
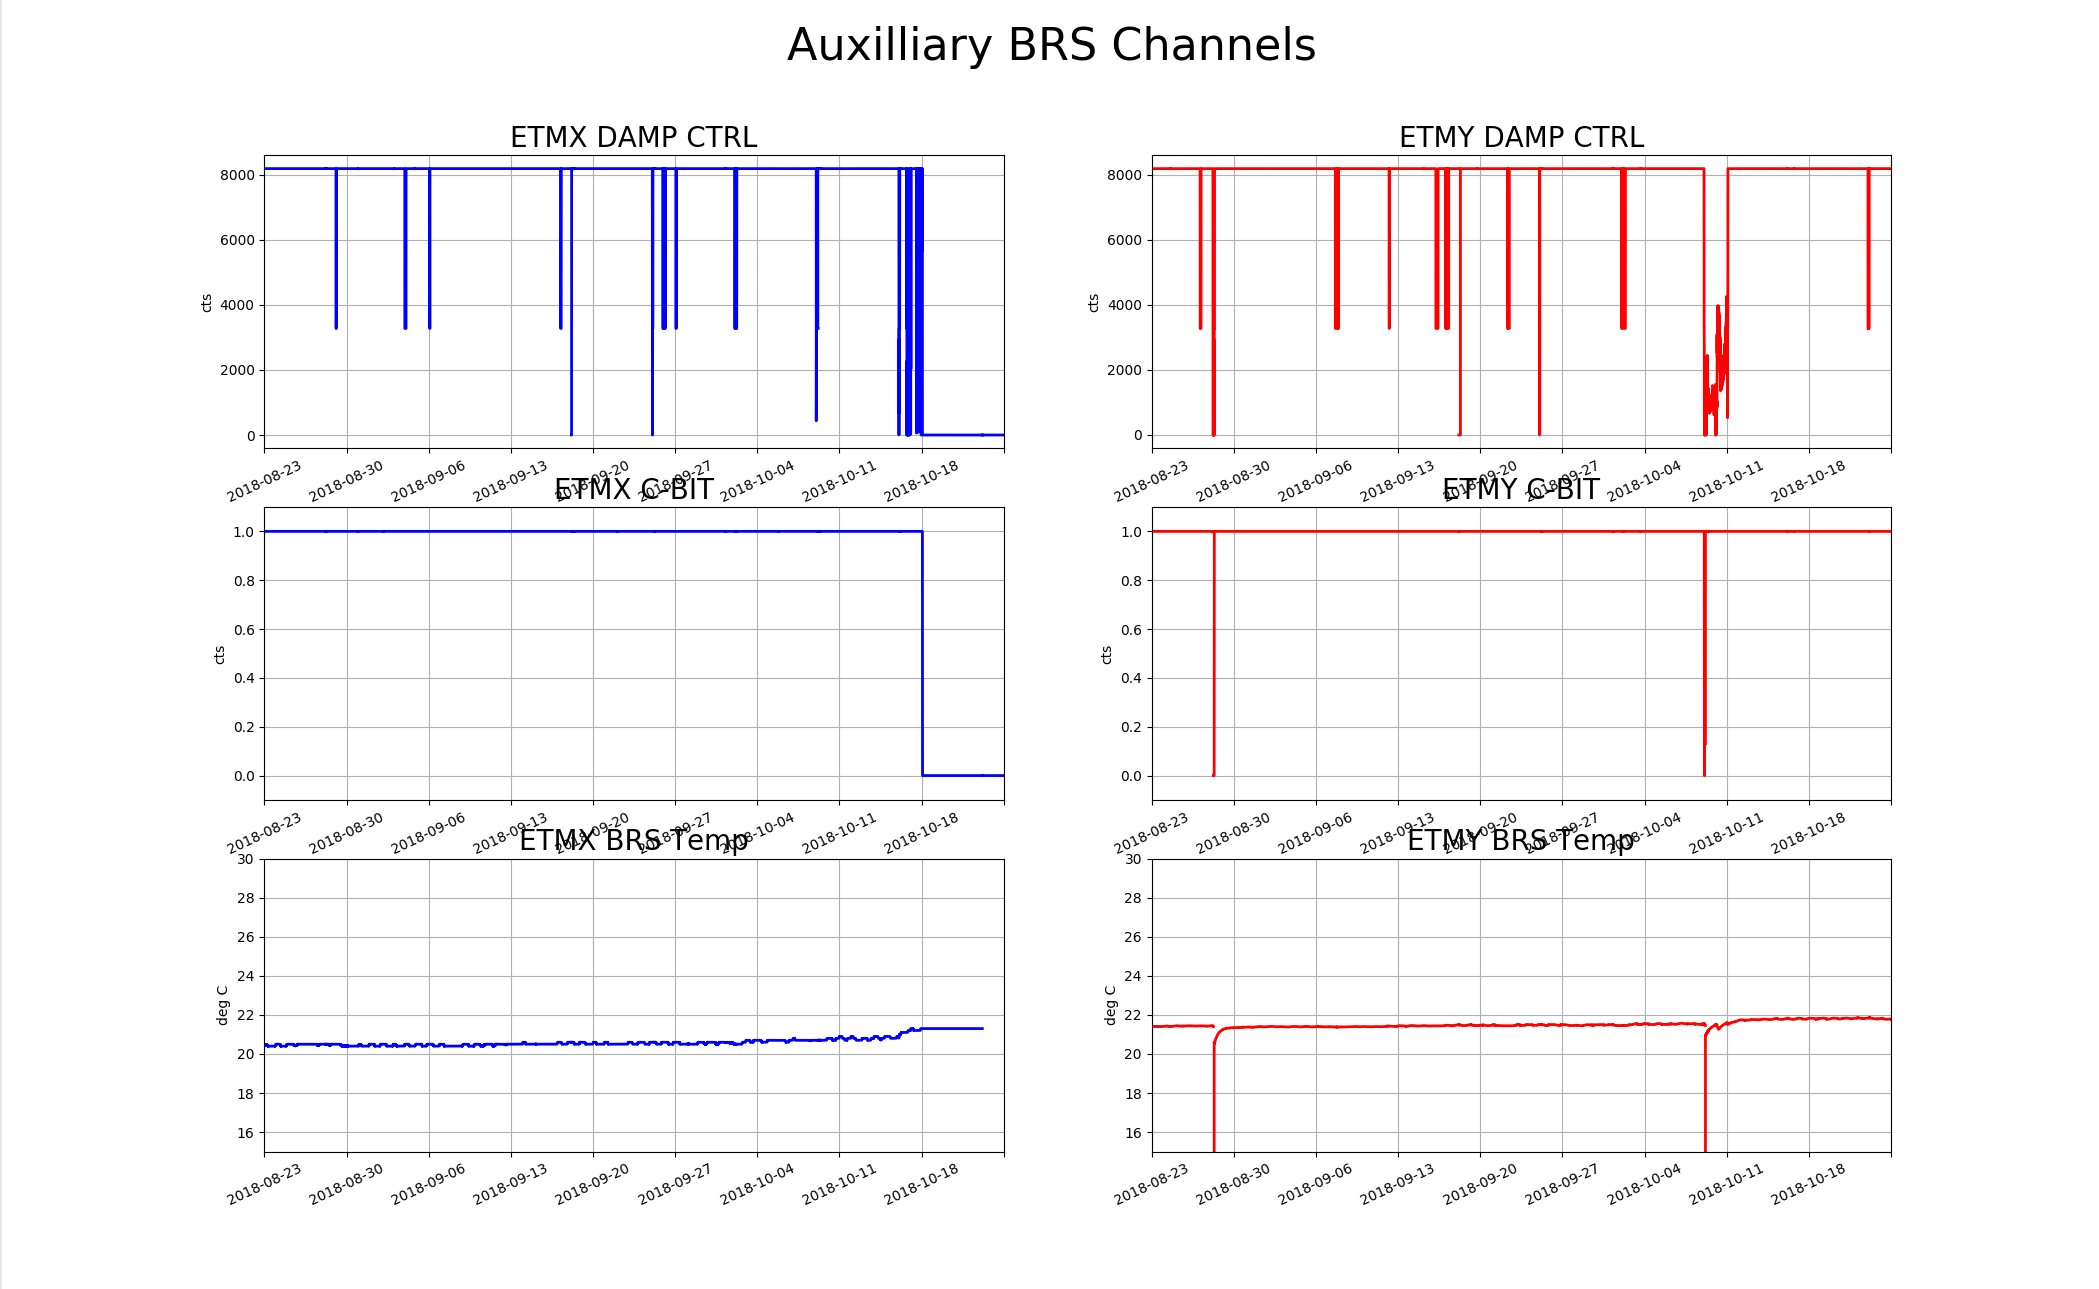
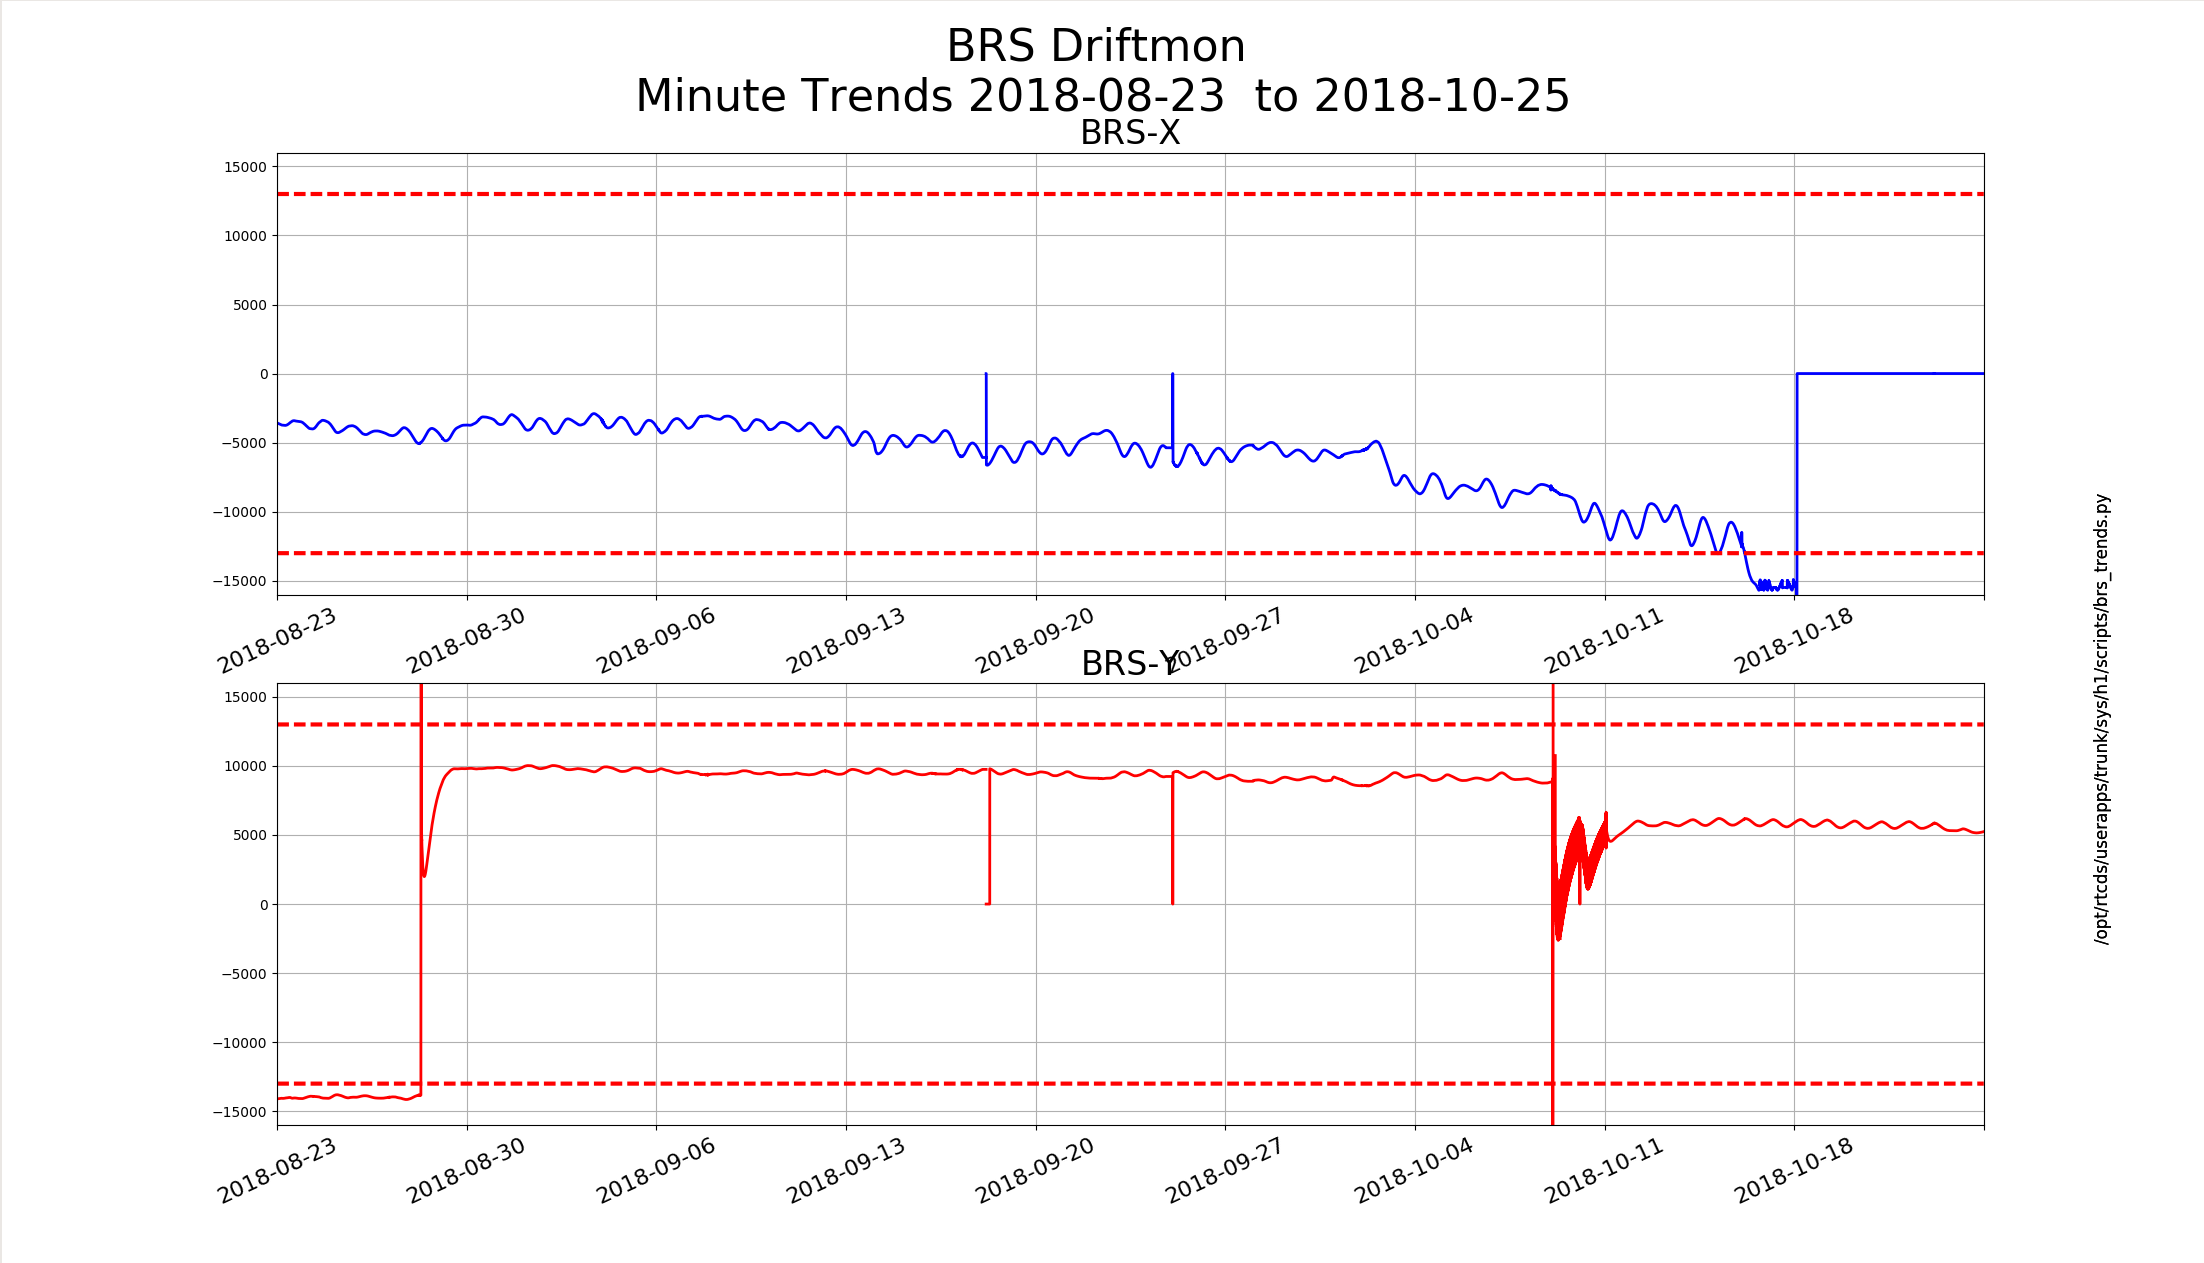
BRS Drift 7 Weeks

FAMIS8054

BRSY looks good, the temperature has risen slightly but this is consistent with the addition of the Jel packs. BRSX has the known issues.

Images attached to this report
H1 PSL
thomas.shaffer@LIGO.ORG - posted 08:45, Thursday 25 October 2018 (44818)
Weekly PSL Chiller Reservoir Top-Off

Added 250Ml to the diode chiller. Filters show no visible signs of debris. The lower filter is slightly yellow compared the the upper filter, but it may just be a different type.
FAMIS10480

H1 ISC (INS)
craig.cahillane@LIGO.ORG - posted 02:44, Thursday 25 October 2018 - last comment - 20:59, Wednesday 07 November 2018(44811)
LSC PD RF levels
Keita, Craig

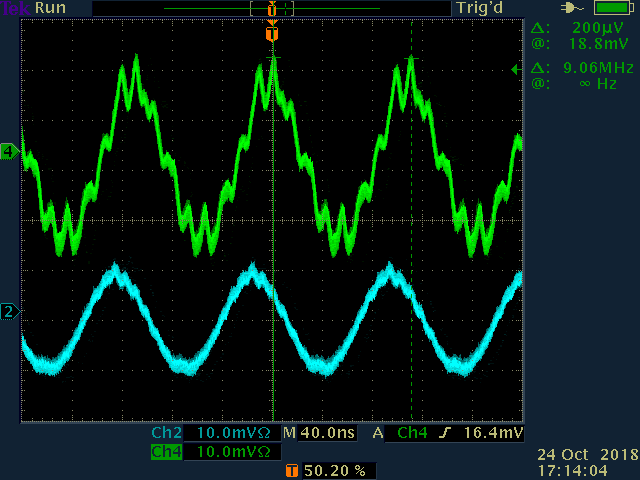
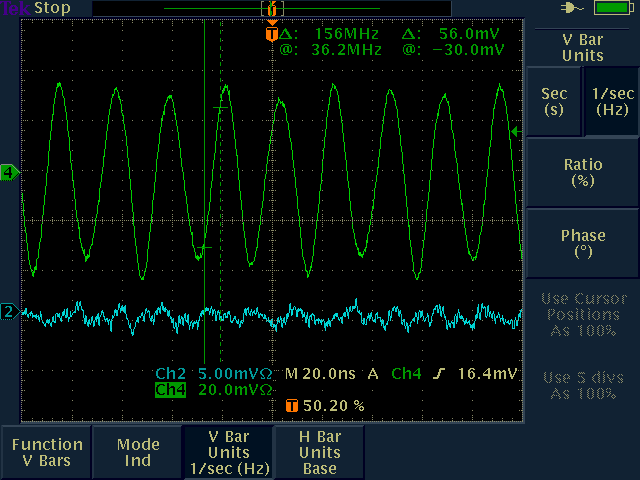
We checked all the LSC PDs while locked in nominal low noise with normal modulation depth settings.  Remember that we multiply the scope output by 14 to get the actual demodulated signal, since the demod board picks off -23 dB for the RF monitor.

REFL9pp ~   560 mV
POP9pp ~    280 mV
REFL45pp ~ 1120 mV (!)
POP45pp ~    70 mV

REFL45 seems to be slewing at ~ 100 V/us, seems pretty fast.
Images attached to this report
Comments related to this report
keita.kawabe@LIGO.ORG - 08:16, Thursday 25 October 2018 (44816)

"normal" means RF9 not reduced.

(We've looked at REFL45 though it's not used for LSC as when the RF opamp for 45 is going crazy it could affect the input side.)

We will repeat this with the reduced RF9.

daniel.sigg@LIGO.ORG - 13:41, Thursday 01 November 2018 (44966)

Nominal modulation index for 9.1MHz: Γ~0.191
Nominal modulation index for 45.5MHz: Γ~0.251

For the above measurement the modulation index for 45.5MHz was reduced by 3dB to Γ~0.177.

peter.fritschel@LIGO.ORG - 13:50, Friday 02 November 2018 (44987)

Side-by-side numbers for H1 and L1 are posted in LLO log entry 41547

craig.cahillane@LIGO.ORG - 20:59, Wednesday 07 November 2018 (45105)
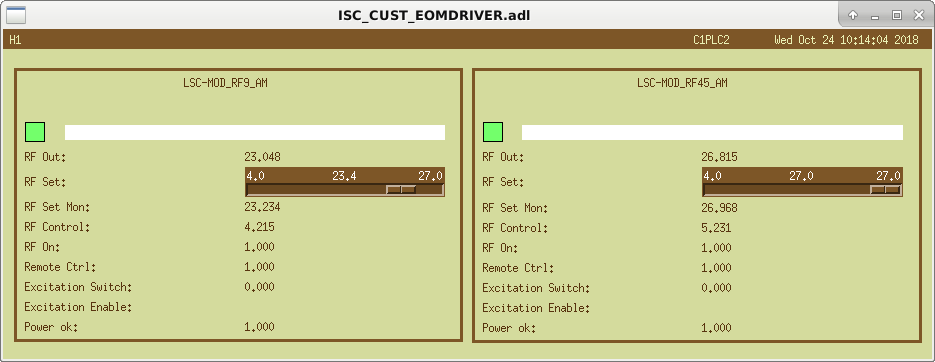
RF slider settings during this measurement.
Images attached to this comment
H1 DetChar (DetChar, ISC)
joshua.smith@LIGO.ORG - posted 00:58, Thursday 25 October 2018 - last comment - 04:17, Thursday 25 October 2018(44808)
FEC 8 1_30 and 1_31 and FEC 10 1_30 and 1_31 are overflowing

Based on the overflows page on the summary pages Link, FEC 8 1_30 and 31 and FEC 10 1_30 and 31 are overflowing semi-all the time (on 10/24). That’s OMC and LSC front ends. I forgot which way around the numbering goes in OMC, but in LSC this appears to be REFL A 45 Q,I.

Images attached to this report
Comments related to this report
rana.adhikari@LIGO.ORG - 01:32, Thursday 25 October 2018 (44810)

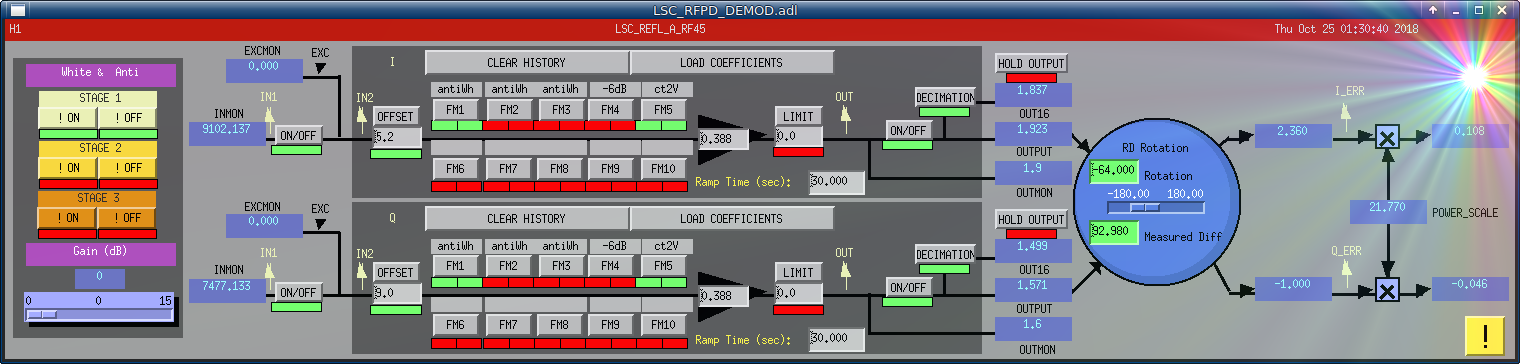
thanks; REFL45 is not being used so I turned the whitening gain from +12dB to 0dB and the saturations have stopped. It would be good to put this into Guardian.

Images attached to this comment
andrew.lundgren@LIGO.ORG - 04:17, Thursday 25 October 2018 (44814)DetChar, ISC
Josh, Andy

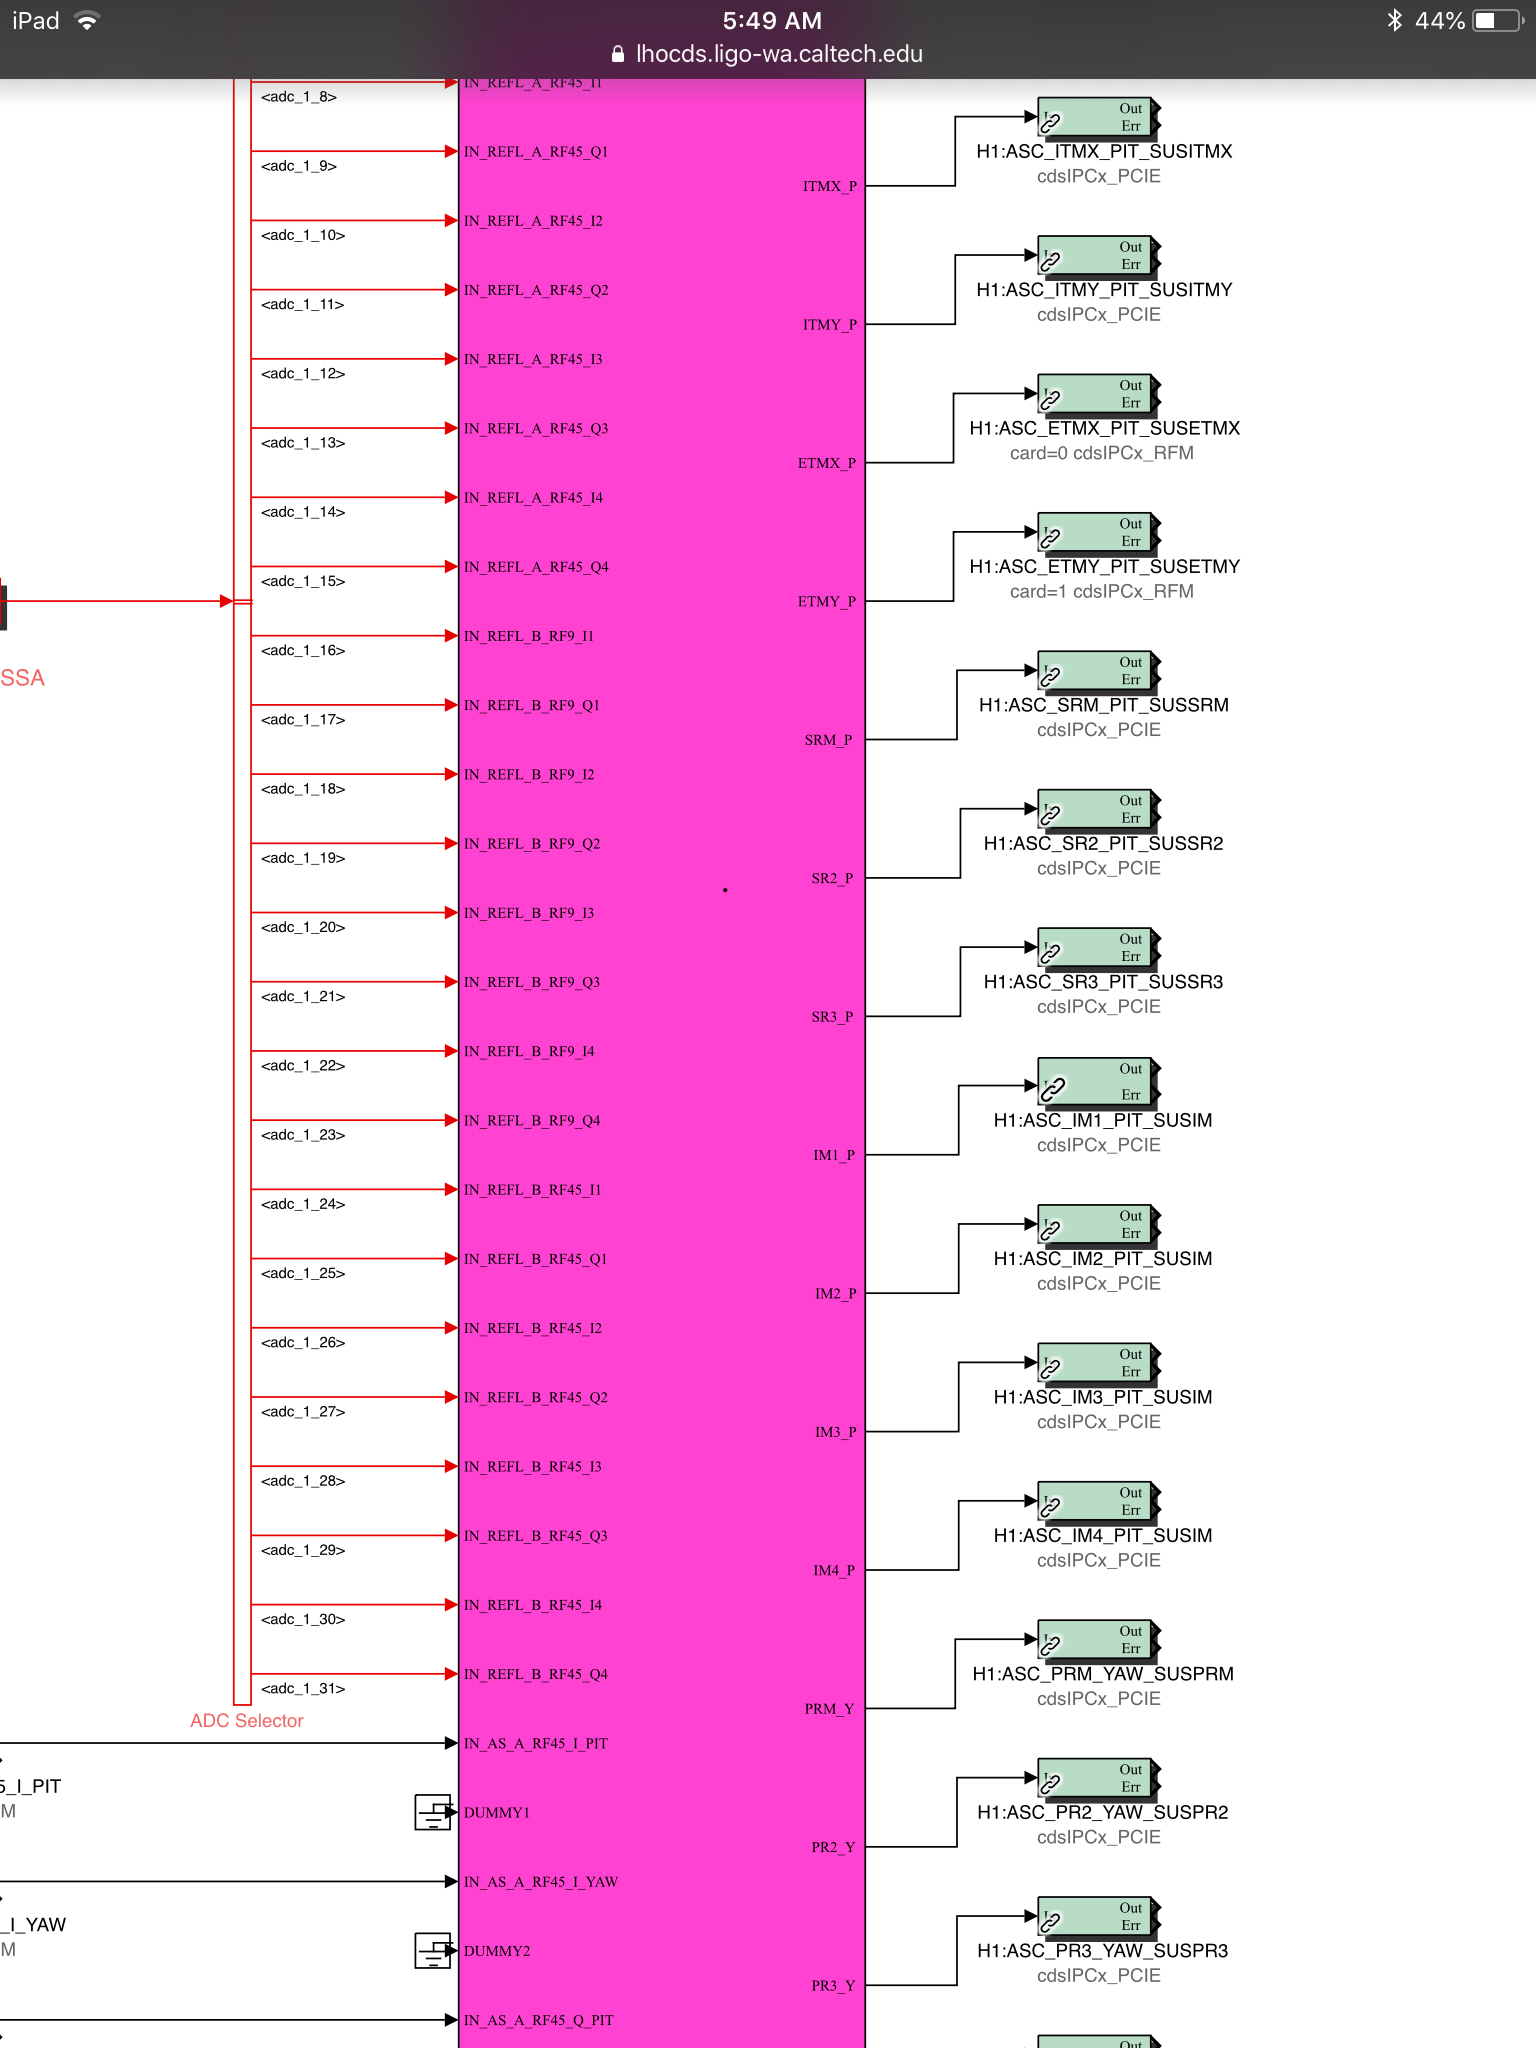
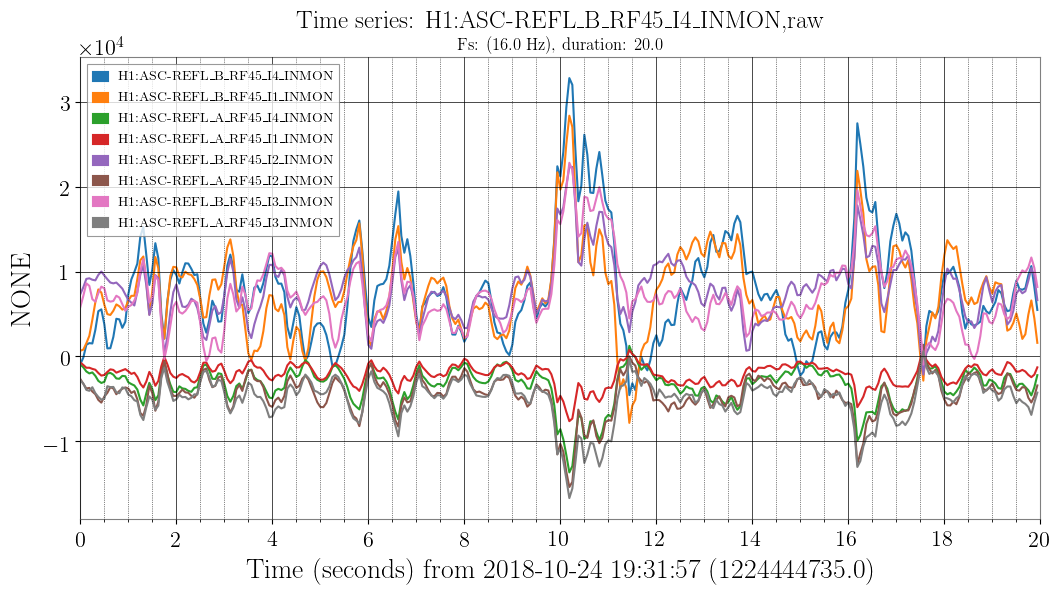
There are also overflows in the ASC model, FEC 19. The most overflowing channels there (overflowing 101 and 122 times) are 1_11 and 1_30, ASC REFL A RF 45 Q2 and ASC REFL B RF45 I4. Shortly after that are other I quadrant channels. REFL 45I is in loop for pitch. This can couple the overflow to DARM, but it might also be that glitches are showing up in DARM and overflowing the ASC.

It's probably worth checking the levels on the ASC REFL PDs at 45 MHz, and see if they can be stopped from overflowing in low noise. These do seem to be short overflows, not ones caused by the signal going slowly out of range. We haven't checked other signals yet; these were first on the list because they overflow most commonly.

Attached are the overflow times from yesterday for REFL_B_45 I4, and the simulink for reference. Then we have plots of the REFL 45I inmons for two glitches, and the associated spectrograms in DARM.
Images attached to this comment
H1 ISC (ISC)
georgia.mansell@LIGO.ORG - posted 23:50, Wednesday 24 October 2018 - last comment - 16:13, Thursday 25 October 2018(44807)
OMC DCPD cross-correlation, and other locking things

[Craig Hang TVo Rana Danny Keita Georgia]

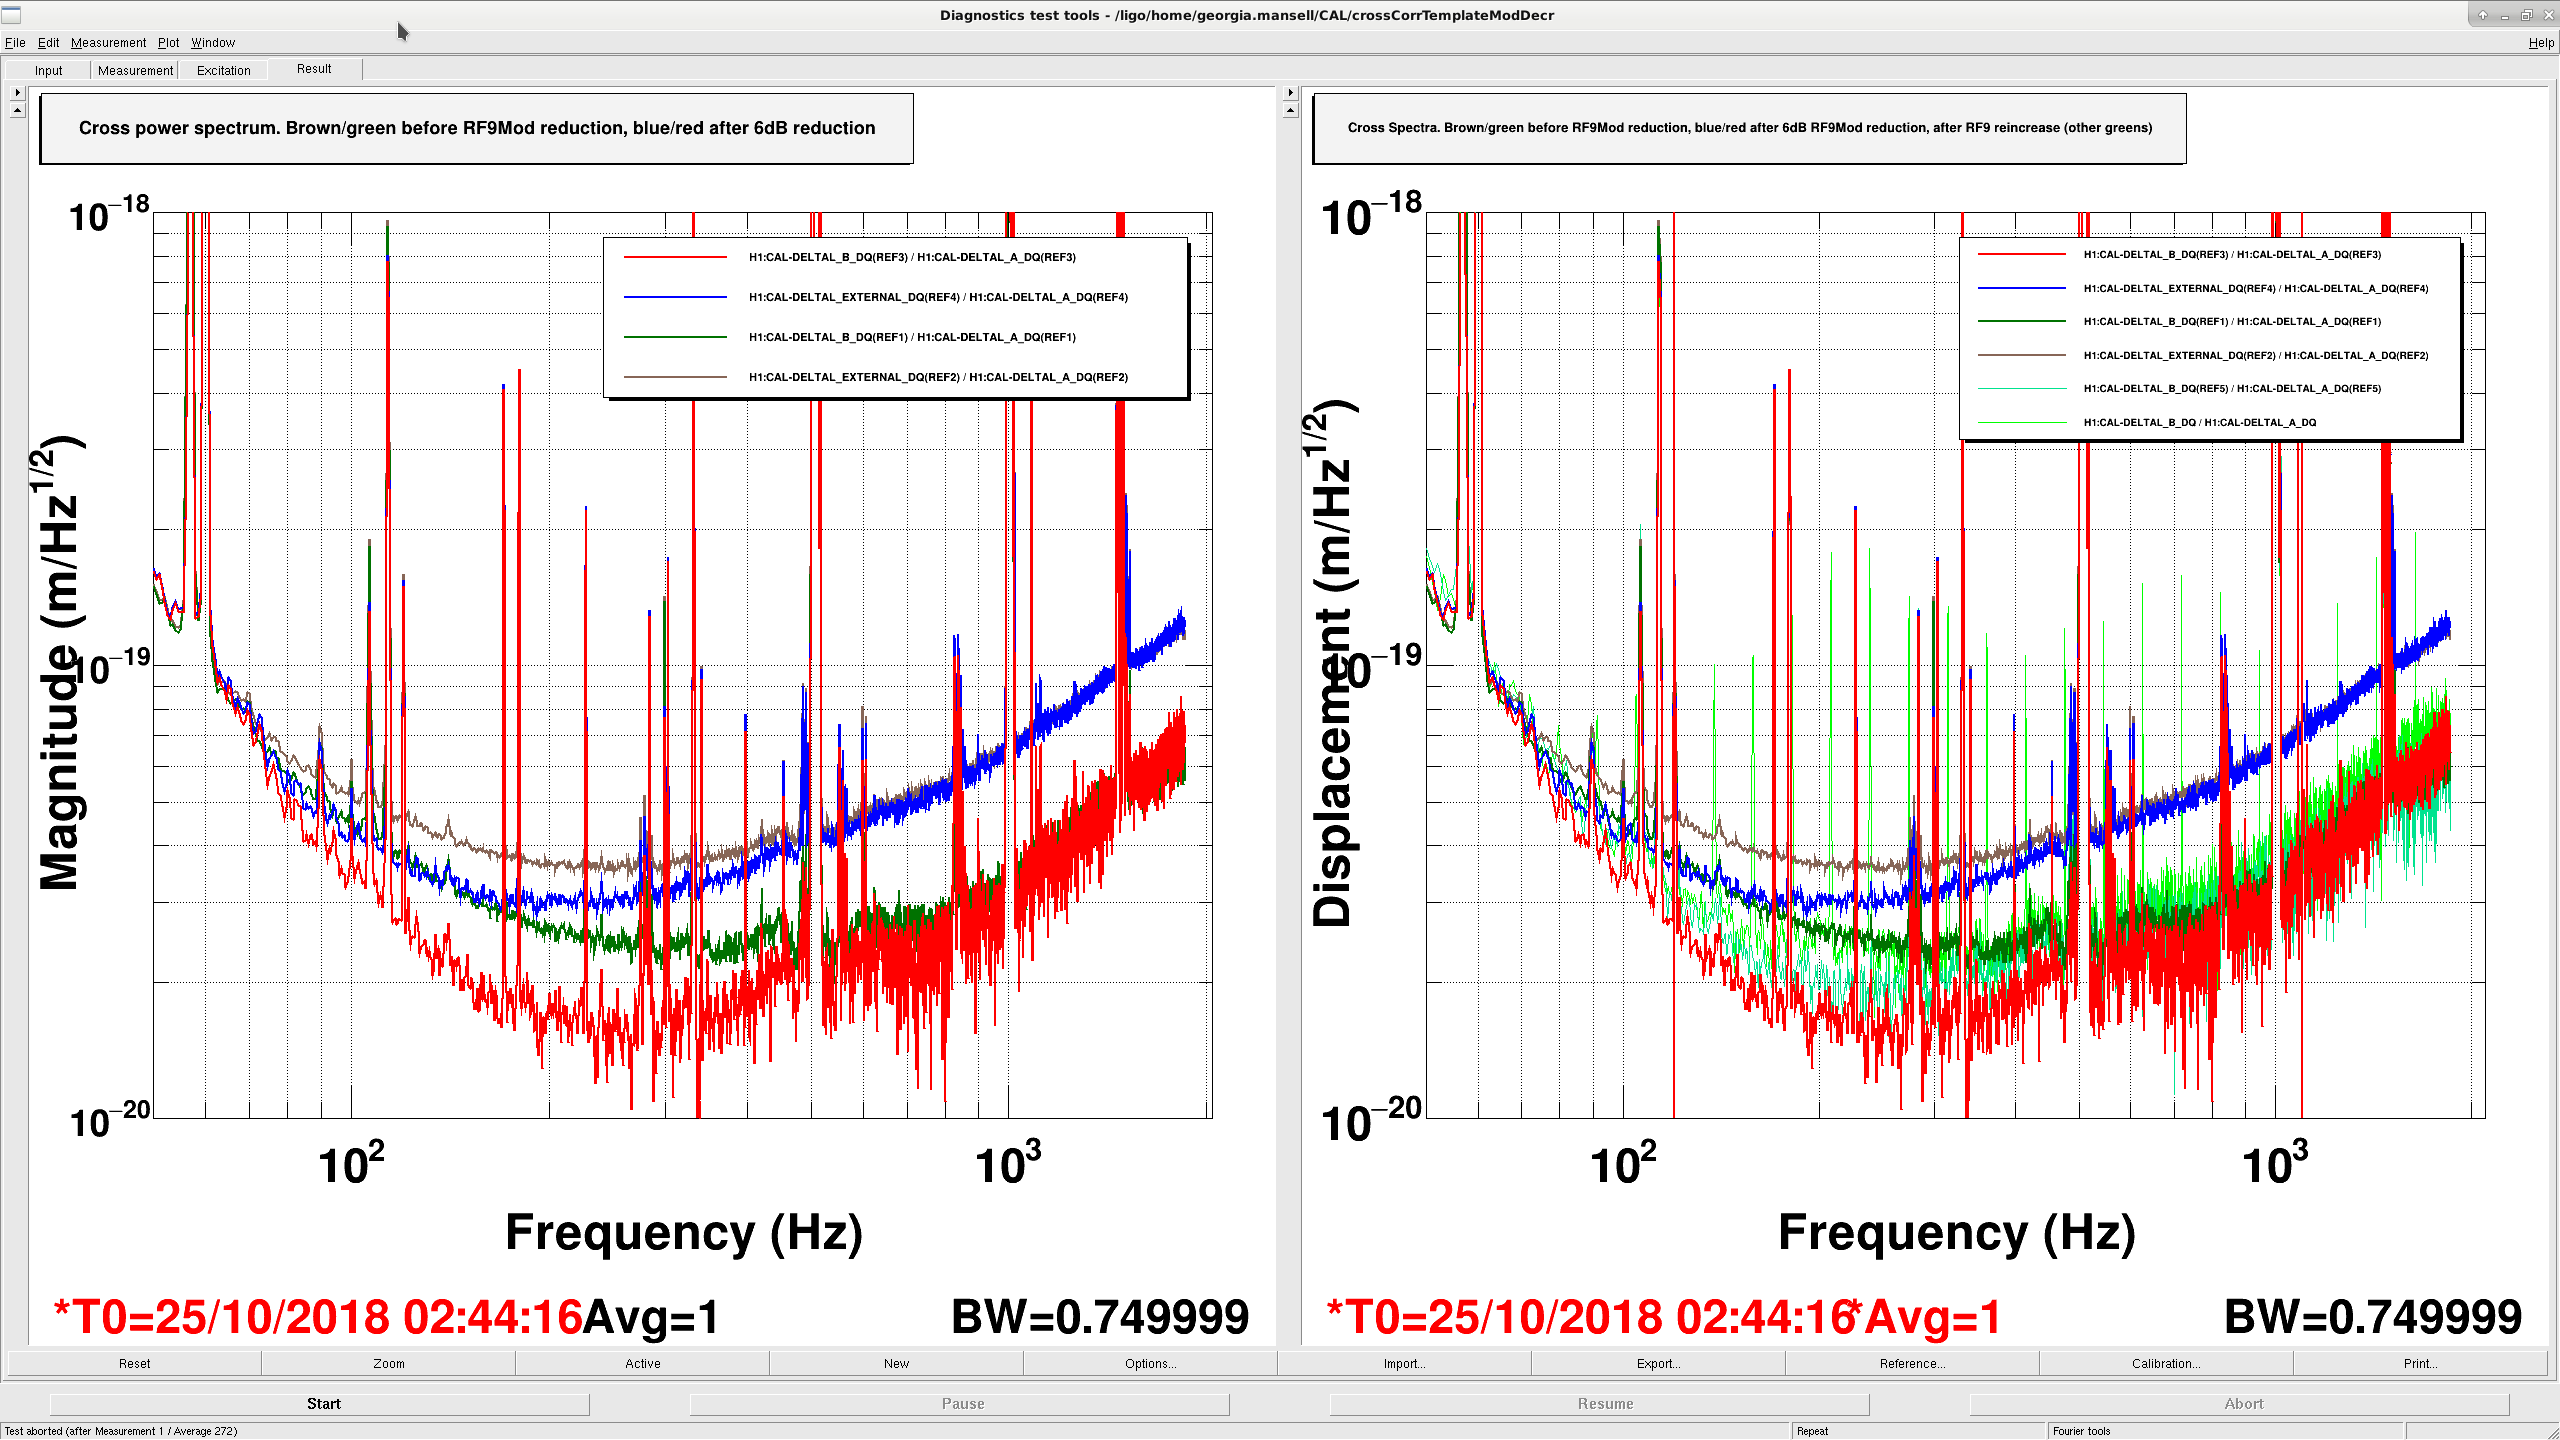
Following up on alog 44781, we had a look at the OMC DCPD cross-correlation as a function of RF9 modulation depth, using Kiwamu’s handy DCPD cross correlation infrastructure and DTT template (35156, T1700131). The cross-correlation allows us to look below the sensing noise of the OMC DCPDs and the photon shot noise.

In the first attachment, the brown and dark green traces show the DARM and cross-correlated spectra before the RF9 modulation depth decrease. Above 100 Hz the cross-correlated noise is below the DARM noise, indicating that we are limited by uncorrelated noise, eg photon shot noise, at these frequencies.

We used a Craig modification on Jenne’s script to turn the RF9 modulation depth down by 6dB for 10 minutes. Surprisingly, it looked like we had a significant reduction of noise in the bucket, from ~100 to 500 Hz in both the DARM and cross-correlated spectra, shown in blue and red, with no significant change to the noise above 500Hz. However when we brought the modulation depth back up the noise seemed to remain closer to the before-modulation-depth reduction level.

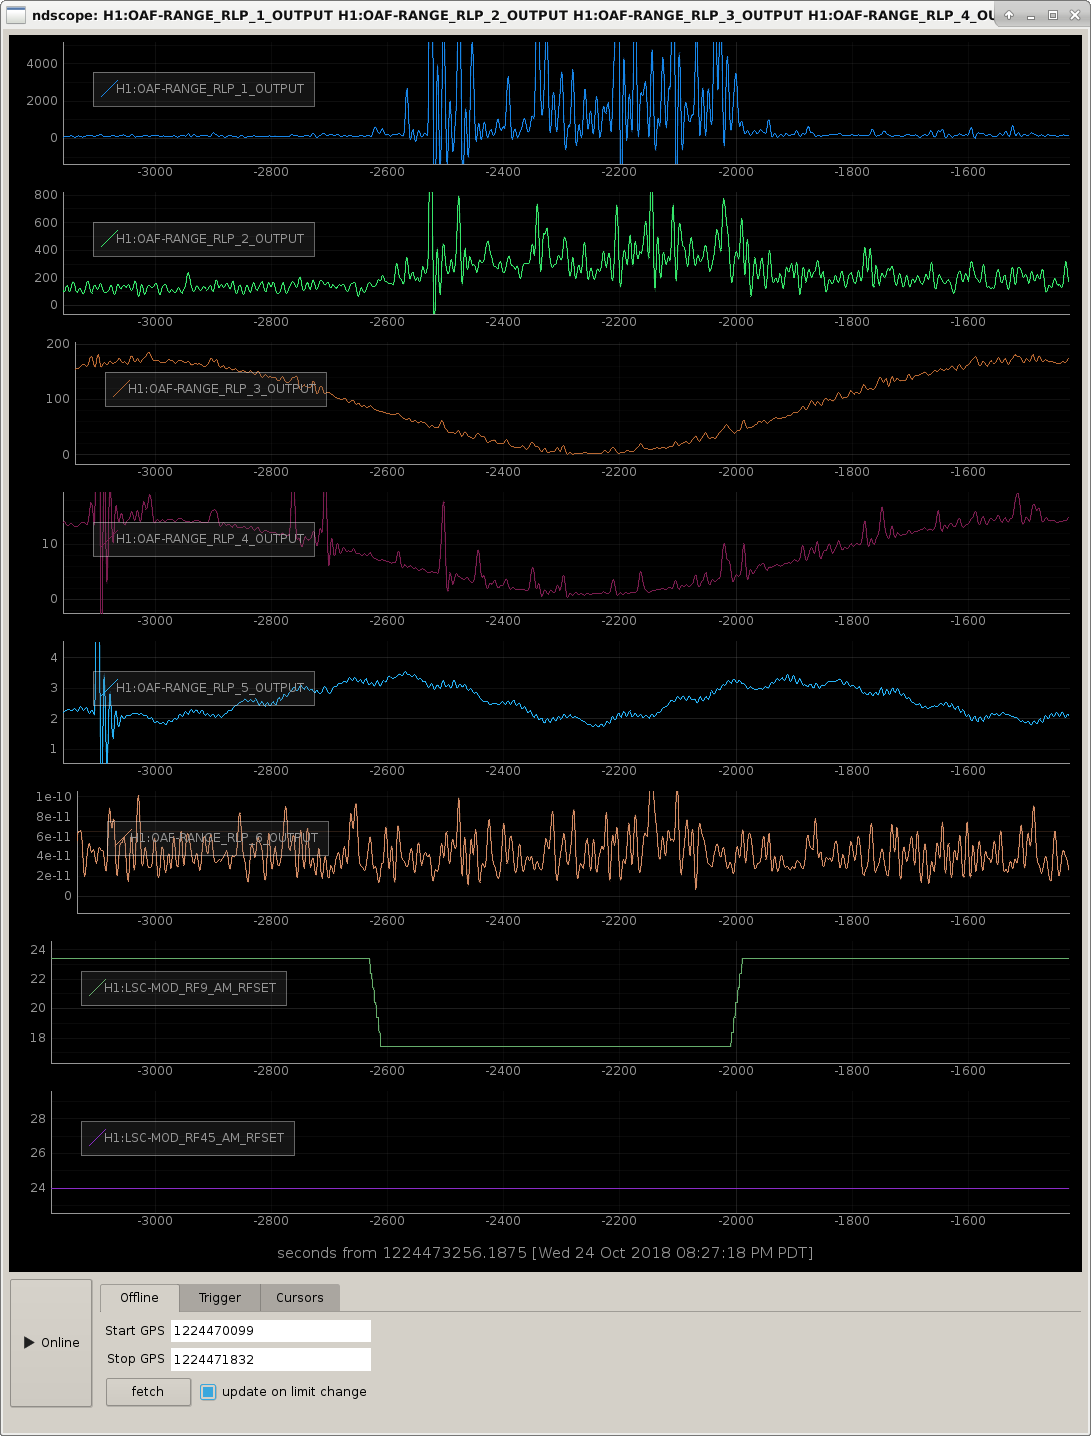
In the next lock stretch it seemed like the noise in the bucket crept back up to the original level. The two pale green traces in the right plot are cross correlation spectra from different times in the next lock where the RF modulation was not changed (03:47UTC and 04:30UTC). Similar behaviour was seen in the DARM spectrum, omitted from the plot for clarity. The second attachment shows the DARM BLRMS while we changed the RF9 modulation depth,  this also has the timestamps for this test.


Before generating these cross-correlated spectra I updated normalisation and inverse sensing filters in the H1:CAL-CS_DARM_ERR_NULL filters to match the H1:CAL-CS_DARM_ERR. That is, I copied the O3_D2N and O3gain filter banks to the NULL channel. I have not updated the DTT frequency domain calibration (a transfer function in the templates calibration), and am still using the calibration from 2017.

Other locking notes:

DARM BLRMS - Added 57 Hz and 114 Hz notches to the relevant DARM BLRMS filters (found in sitemap>LSC>OAF Calib>OAF BLRMS>RBP1-5) to get rid of the peak which we identified as the ITM HWSs. These notches removed the ~30 minutes period sinusoid seen in the BLRMS 3 and 4, and its harmonic in BLRMS5.

Glitches - After Hang implemented his DHARD PIT mircoseismic filter (44801) the regular glitches we were seeing in DARM are less frequent and less severe, compare locks before and after 1224468886.

Images attached to this report
Comments related to this report
rana.adhikari@LIGO.ORG - 01:25, Thursday 25 October 2018 (44809)DetChar, TCS

in the above entry, ITM is a typo, it should be ETM Hartmann.

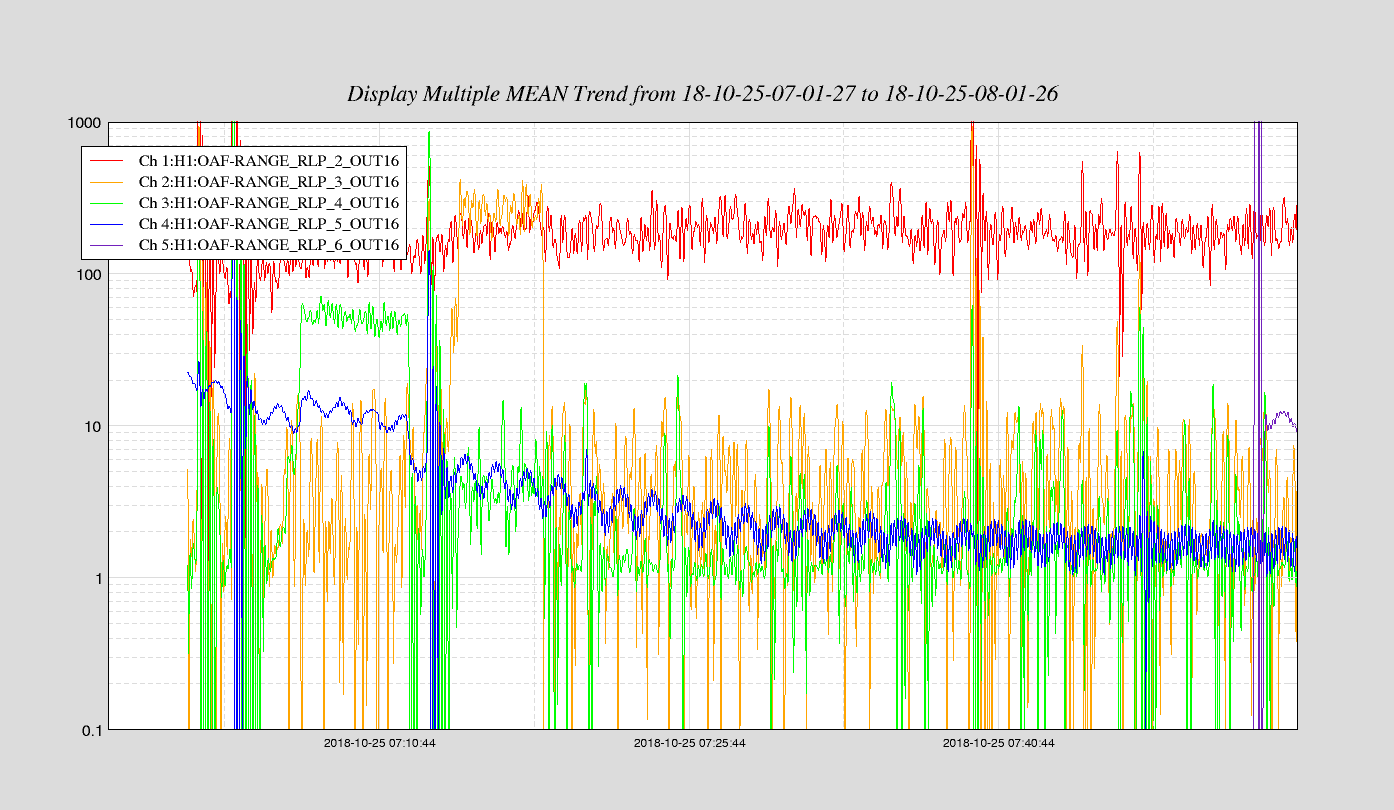
After putting in the notches for the heartmann noise, we were able to plot the BLRMS of DARM using the OAF-CAL LSC BLRMS (attached).

The frequency bands are 20-30 Hz, 38-60 Hz, 60-100 Hz, 100-450 Hz, and 450-950 Hz. The color coding follows the rainbow: red is the lowest frequency and purple the highest.

Since Georgia added the notches, we no longer see the 25 minute period that was characteristic of the TCS/Harmann noise, but rather the underlying breathing of the noise. Most troubling is the Orange (38-60 Hz) band. This one and the green one show all the breathing that is in our mystery noise band.

I think it would be illuminating if someone could find correlations with the orange and green bands and some other channels; it may shed light on what is causing the coupling. Note that since this is a RMS, one should find a correlation between the absolute value of (whatever) and these BLRMS channels.

I'm also attaching a plot showing DRMI error signals and coherence with DARM. The PRC signal is ~50x larger in the 20-30 Hz band than it used to be in O1. This also shows up in MICH/SRC and so there's a large coherence with DARM. I wish we had a noise budget for PRC/MICH/SRC, not just DARM.

I tried to run 'cdsutils audio' from the command line to listen to some band limited darm (to see if it sounds like rubbing or scattering) but the 'pygst' and 'gnuradio' modules are not available from this terminal. It would be useful to have that functionality added if possible.

Images attached to this comment
Non-image files attached to this comment
georgia.mansell@LIGO.ORG - 16:13, Thursday 25 October 2018 (44836)

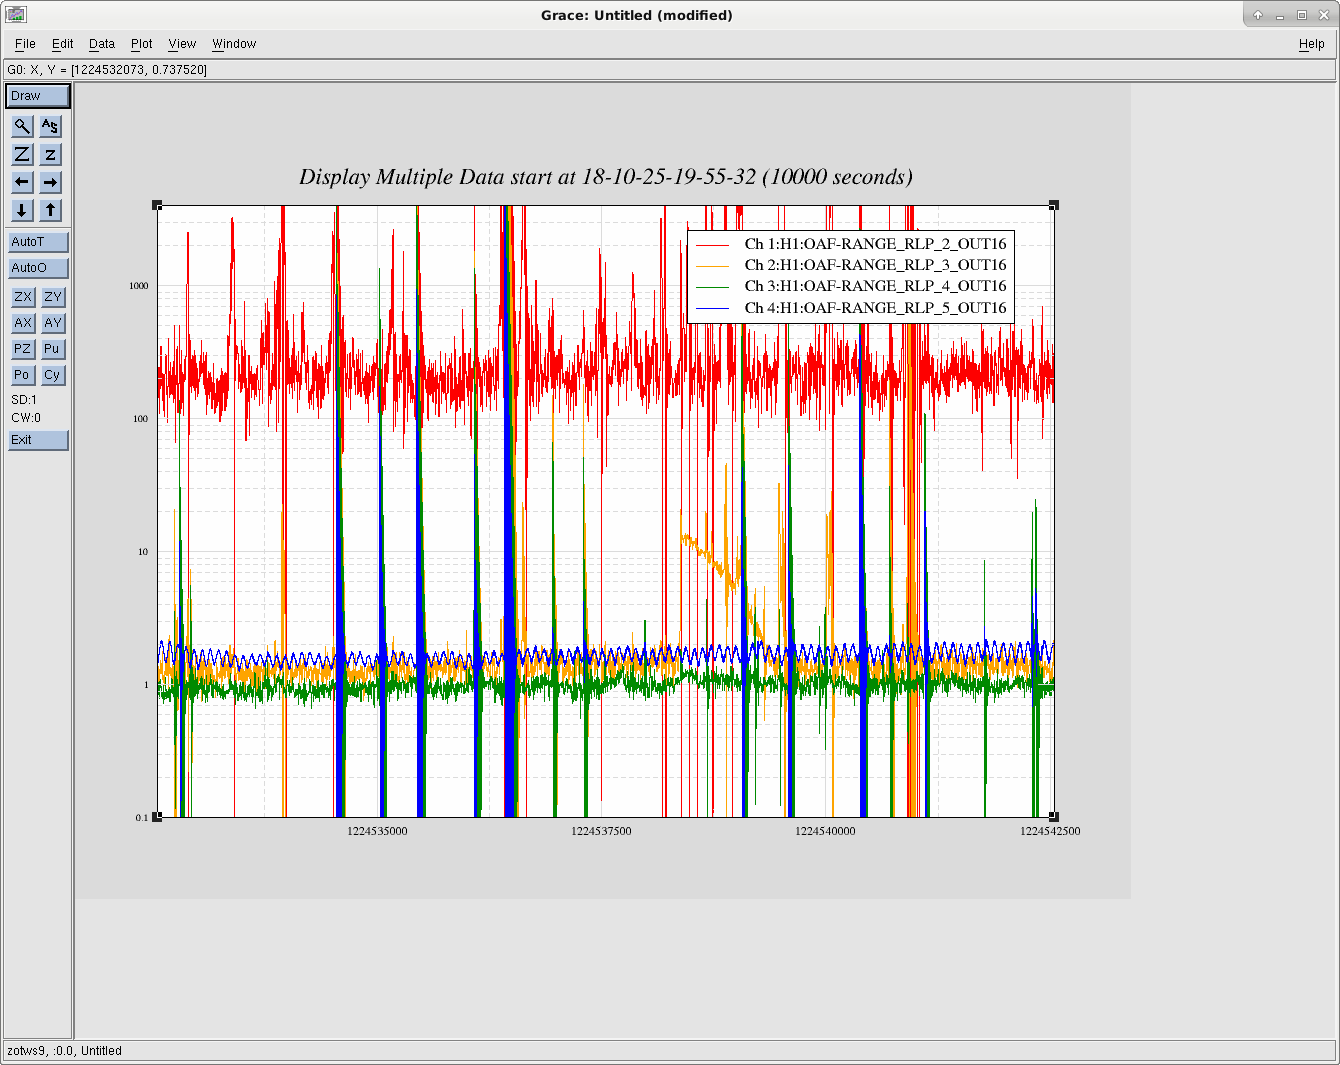
I had a look at the DARM BLRMS during this morning's long lock, it looks like the noise in the 38-100 Hz band is much quieter, see attached plot showing 10000 seconds of data. The extra noise in RLP3 band at 1224538440 is an injection (I think).

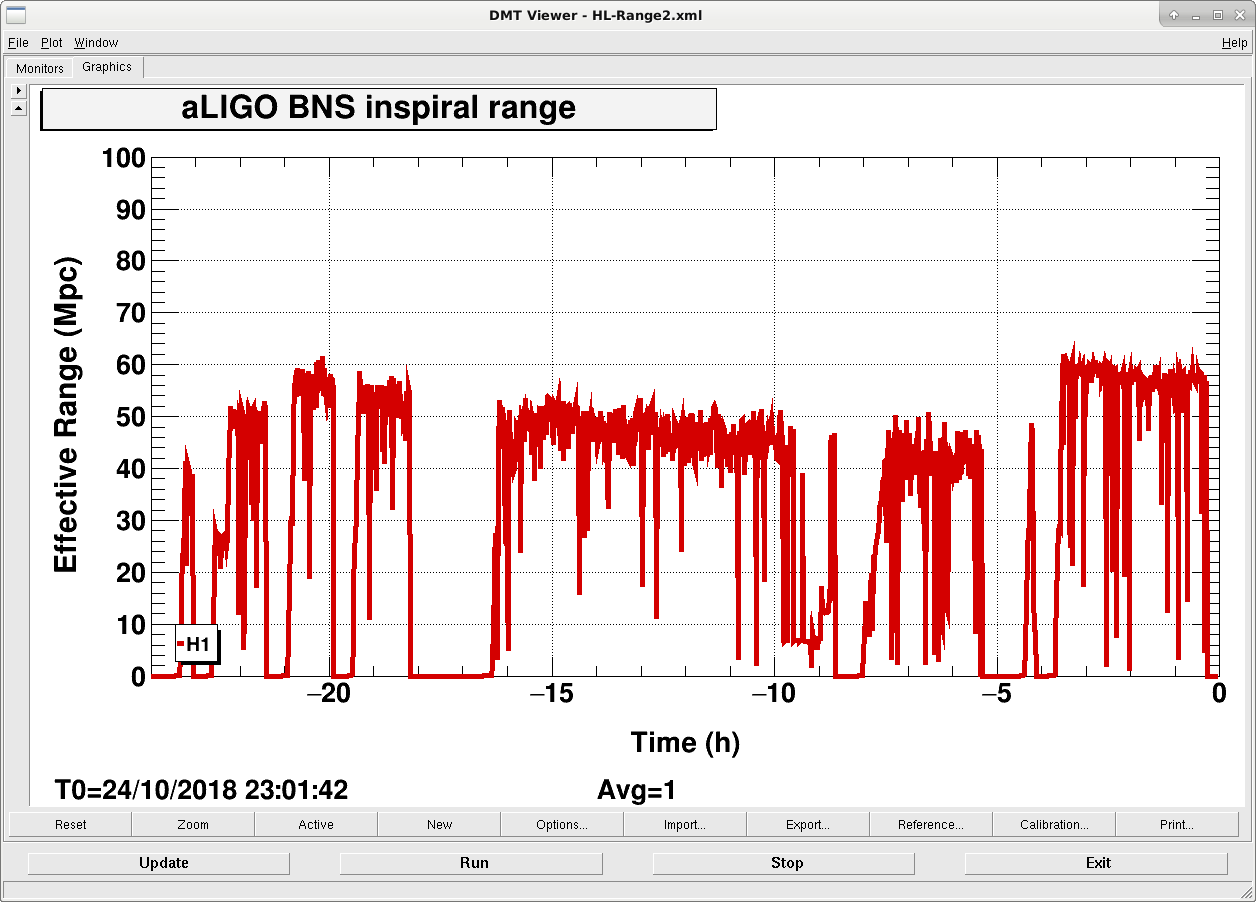
Two differences between last night and this morning is the initial alignment has been redone, and the BNS range which decreases over the duration of a lock. Second attachment shows H1 BNS range. The BLRMS plot from last night was taken at T-16, the BLRMS plot from this morning starts around T-4.


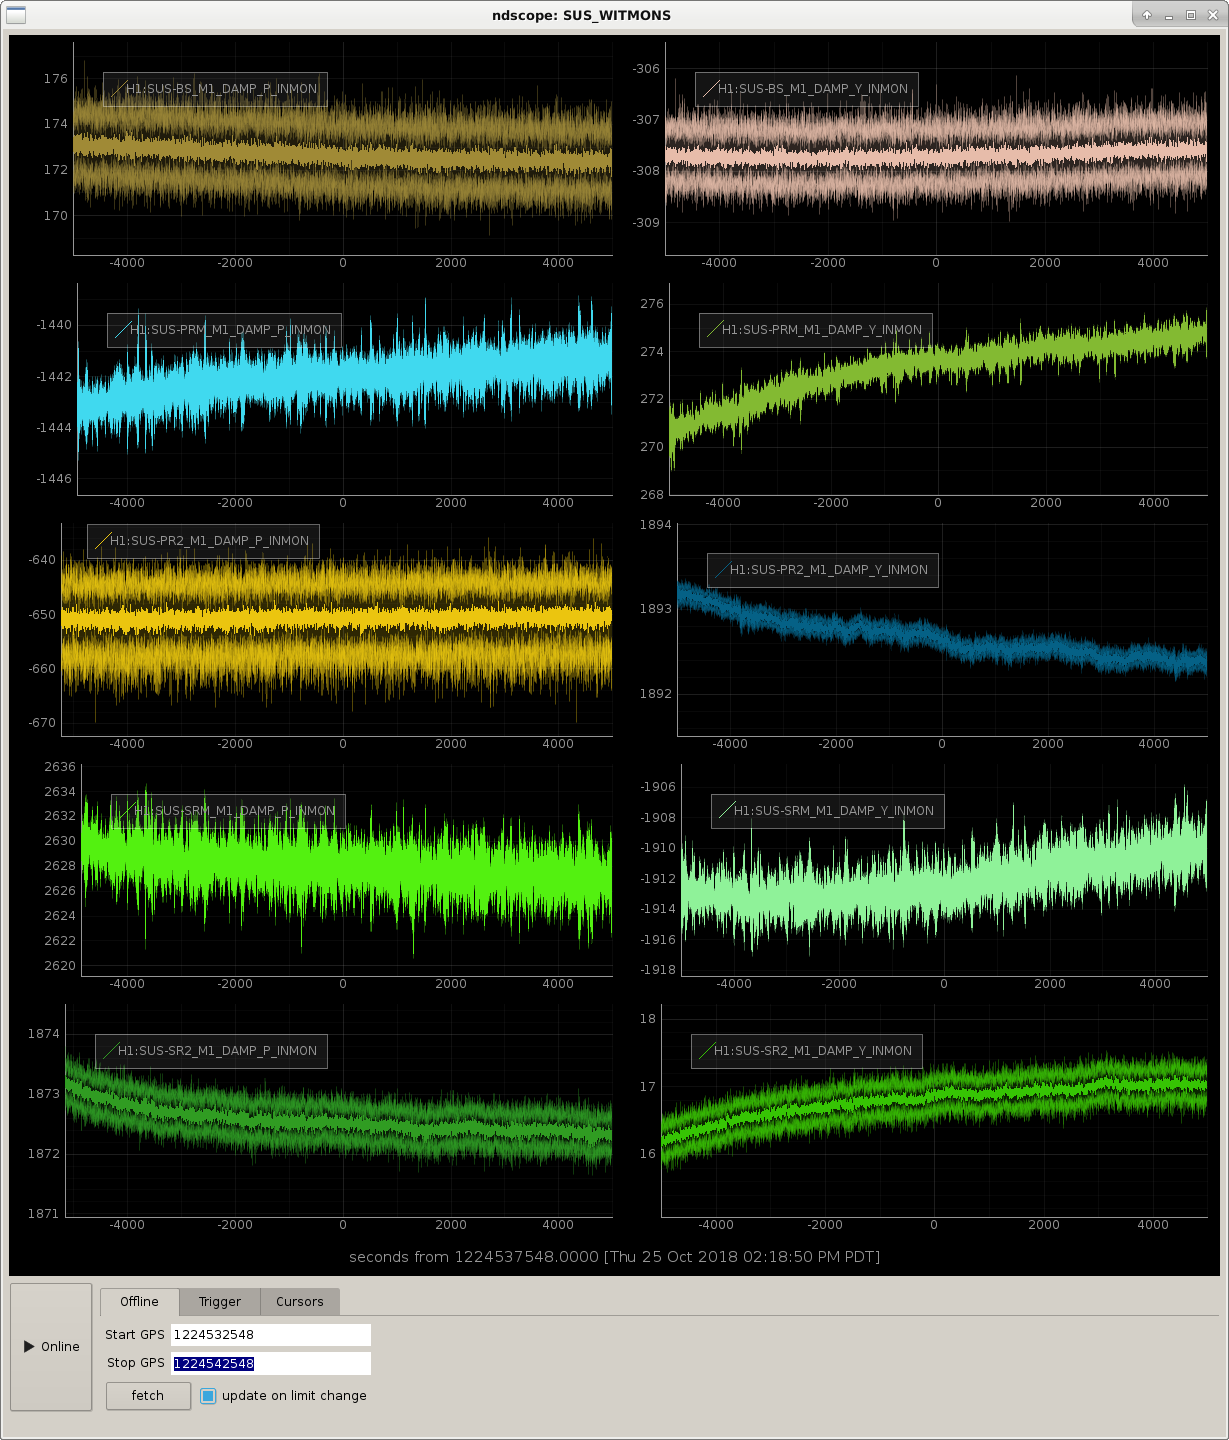
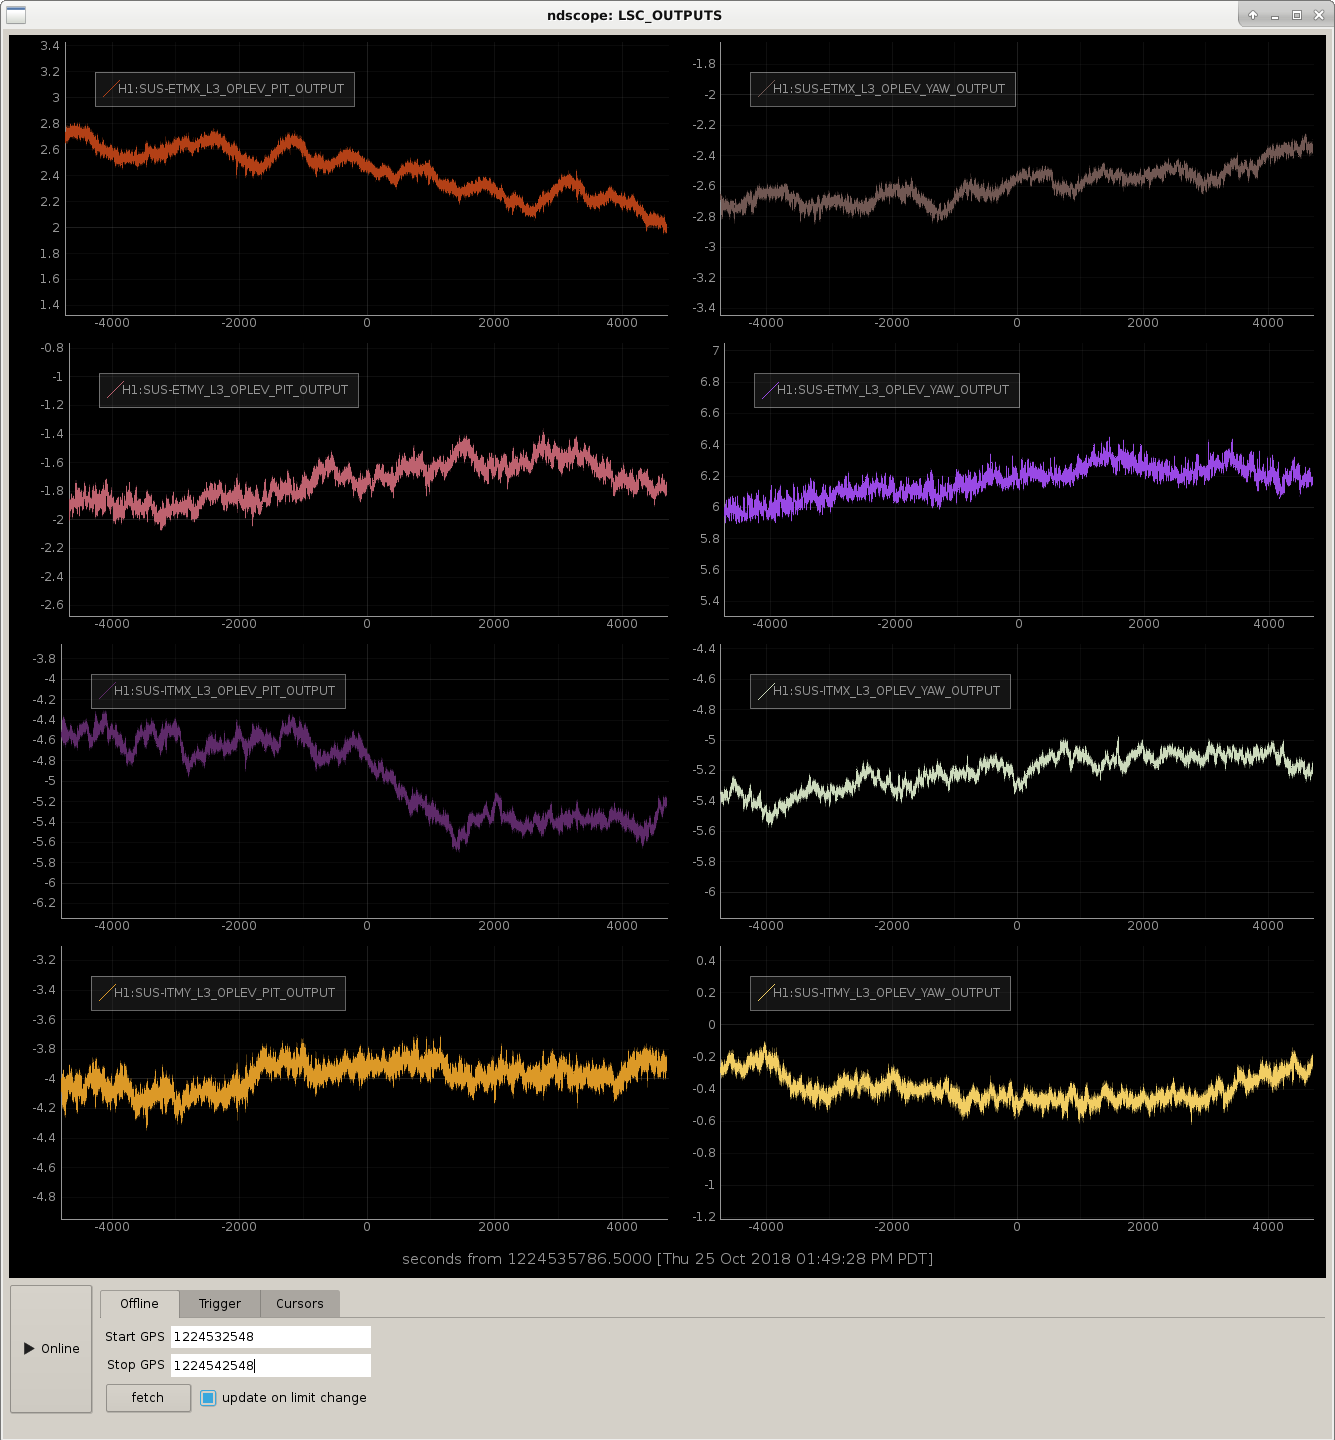
Out of interest I also looked at the suspension witness monitors (3rd attachment) and test mass op levs (4th attachment) over the duration of this morning's the lock. In these plots pitch is on the left and yaw is on the right. PR2 PIT stands out as being extra noisy, and SRM and PRM drift the furtherest over the duration of the lock.

Images attached to this comment
H1 DetChar (DetChar)
jenne.driggers@LIGO.ORG - posted 17:15, Wednesday 24 October 2018 - last comment - 09:46, Thursday 25 October 2018(44795)
Glitch times

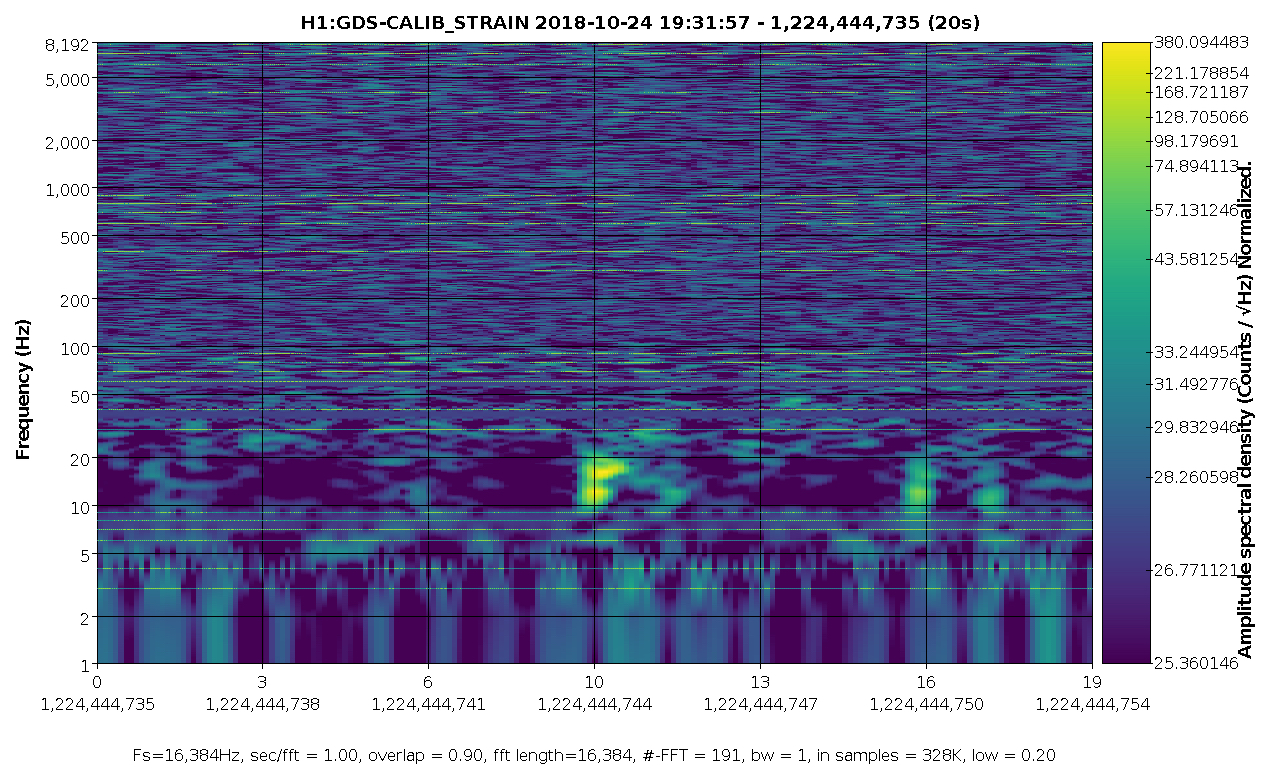
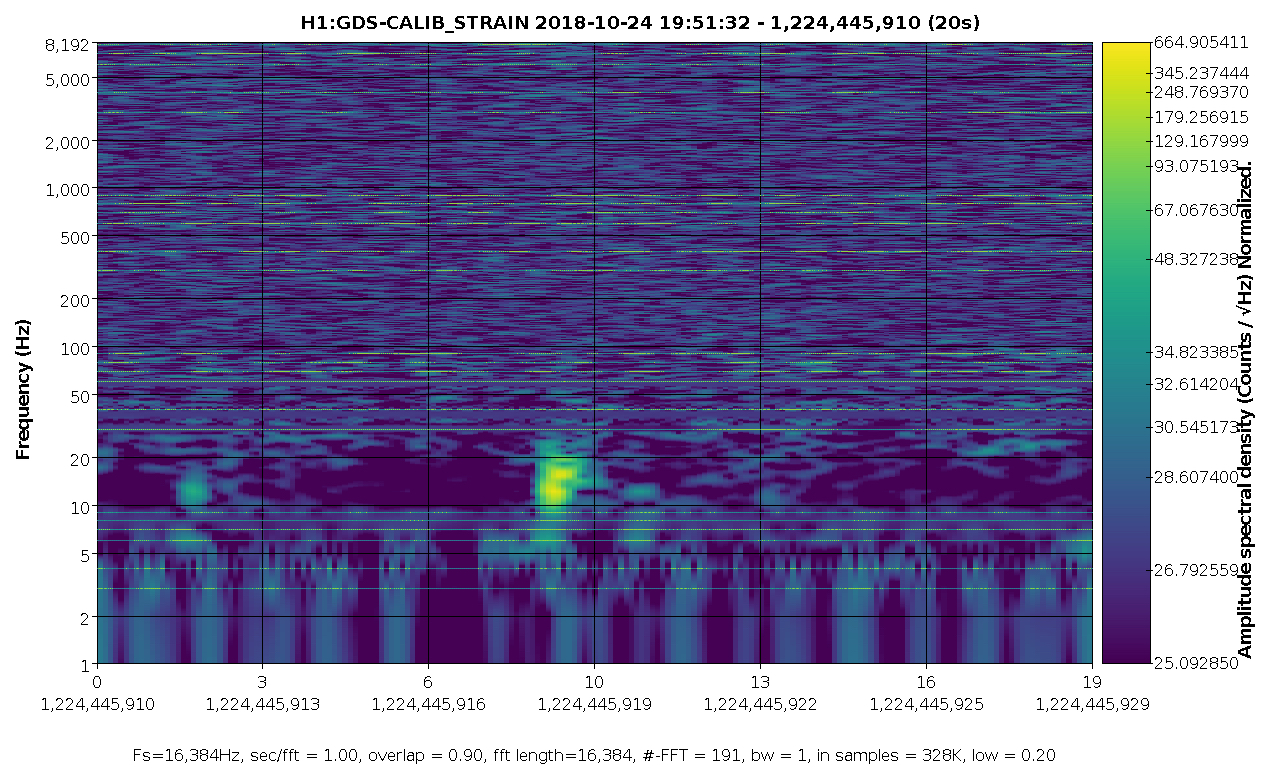
For a while this morning I wrote down times that I saw glitches, whether or not they saturated the ESD, that looked similar to me to the glitches that we gete when we have fast locklosses.  It would be helpful if Team DetChar could look around to see if there are other channels that see the glitch, that could help us understand what is going on and where the glitch is coming from.  A hypothesis is that this could be a family of similar-looking glitches that sometimes cause lockloss, and sometimes don't.  But, since these fast locklosses are one of our big limitations to how long the H1 IFO can stay locked, we need to figure them out.

Times are in UTC on 24 Oct 2018, glitches happened within 1 minute prior.

14:52 (This one I looked at very briefly - it's at 1224427963-0.18 sec. I see a small glitch in DARM_OUT and in the EX ESD)

15:01, 15:08, 15:13, 15:13 later in the same minute, 15:15, 15:17, 15:42, 15:58, somewhere btwn 16:04-16:07 there is a glitch, 16:27, 17:56, 18:13

At 18:14 we had a lockloss, and it could have been one of our mysterious fast ones, which could just be a larger version of this family.

I'll look more into this tomorrow if no one from DetChar is available.

Comments related to this report
alexander.urban@LIGO.ORG - 20:09, Wednesday 24 October 2018 (44803)

Thanks for pointing to these glitch times, Jenne! Just to let you know, a few of us from DetChar have started looking into them, and we'll hopefully have more to report tomorrow.

laura.nuttall@LIGO.ORG - 09:46, Thursday 25 October 2018 (44823)

I took a look for glitches in a 2 minute window around the times Jenne points out. Since most of the times Jenne posted pointed to obvious loud glitches, that's what I started looking for. I couldn't find anything similar to this for around 15:08, 15:13 and 15:15 though. For the rest of the times I found rather loud glitches, however they don't all look the same. Most are clearly overflows (if you just look at the spectrograms). Below I list the times of the glitches I found, and if an overflow which model it points to (sorry I'm rubbish at parsing simulink). I got the overflow information from the summary pages:

1224427963.30 - overflow in 98 2_0,3 (UR and LR ETMY L2 coil) and 88 3_1-4 (all quadrants of ETMX ESDs)
1224428469.55 - overflow in 98 2_0,3 (UR and LR ETMY L2 coil) 88 3_1-4 (all quadrants of ETMX ESDs), 10 0_12,13 (LSC) and 8 0_12,13 (OMC length dithers)
1224429544.87
1224430949.50 - overflow in 88 3_1-4 (all quadrants of ETMX ESDs)
1224431938.35 - overflow in 88 3_1-4 (all quadrants of ETMX ESDs)
1224432254.1 - overflow in 8 2_18 (OMC)
1224432439.6 
1224433667.31 - overflow in 98 2_0-3 (all quadrants of ETMY L2 coils) and 88 3_1-4 (all quadrants of ETMX ESDs)
1224439031.89 - overflow in 98 2_0-3 (all quadrants of ETMY L2 coils) 88 3_1-4 (all quadrants of ETMX ESDs), 10 0_12,13 (LSC) and 8 0_12,13 (OMC length dithers)
1224440021.65 - overflow pretty much everywhere. This is ~63 seconds before a lockloss (98 2_0-3 (SUSETMY), 88 2_0-3, 88 3_1-4 (SUSETMX), 30 2_0-4 (SUSITMY), 29 2_4-9 (SUSITMX), 19 1_8-15, 19 24-31 (ASC), 10 0_7 (LSC), 8 0_7 (OMC) 

H1 ISC
jenne.driggers@LIGO.ORG - posted 09:56, Wednesday 24 October 2018 - last comment - 11:07, Thursday 25 October 2018(44781)
Reduced 9MHz modulation depth

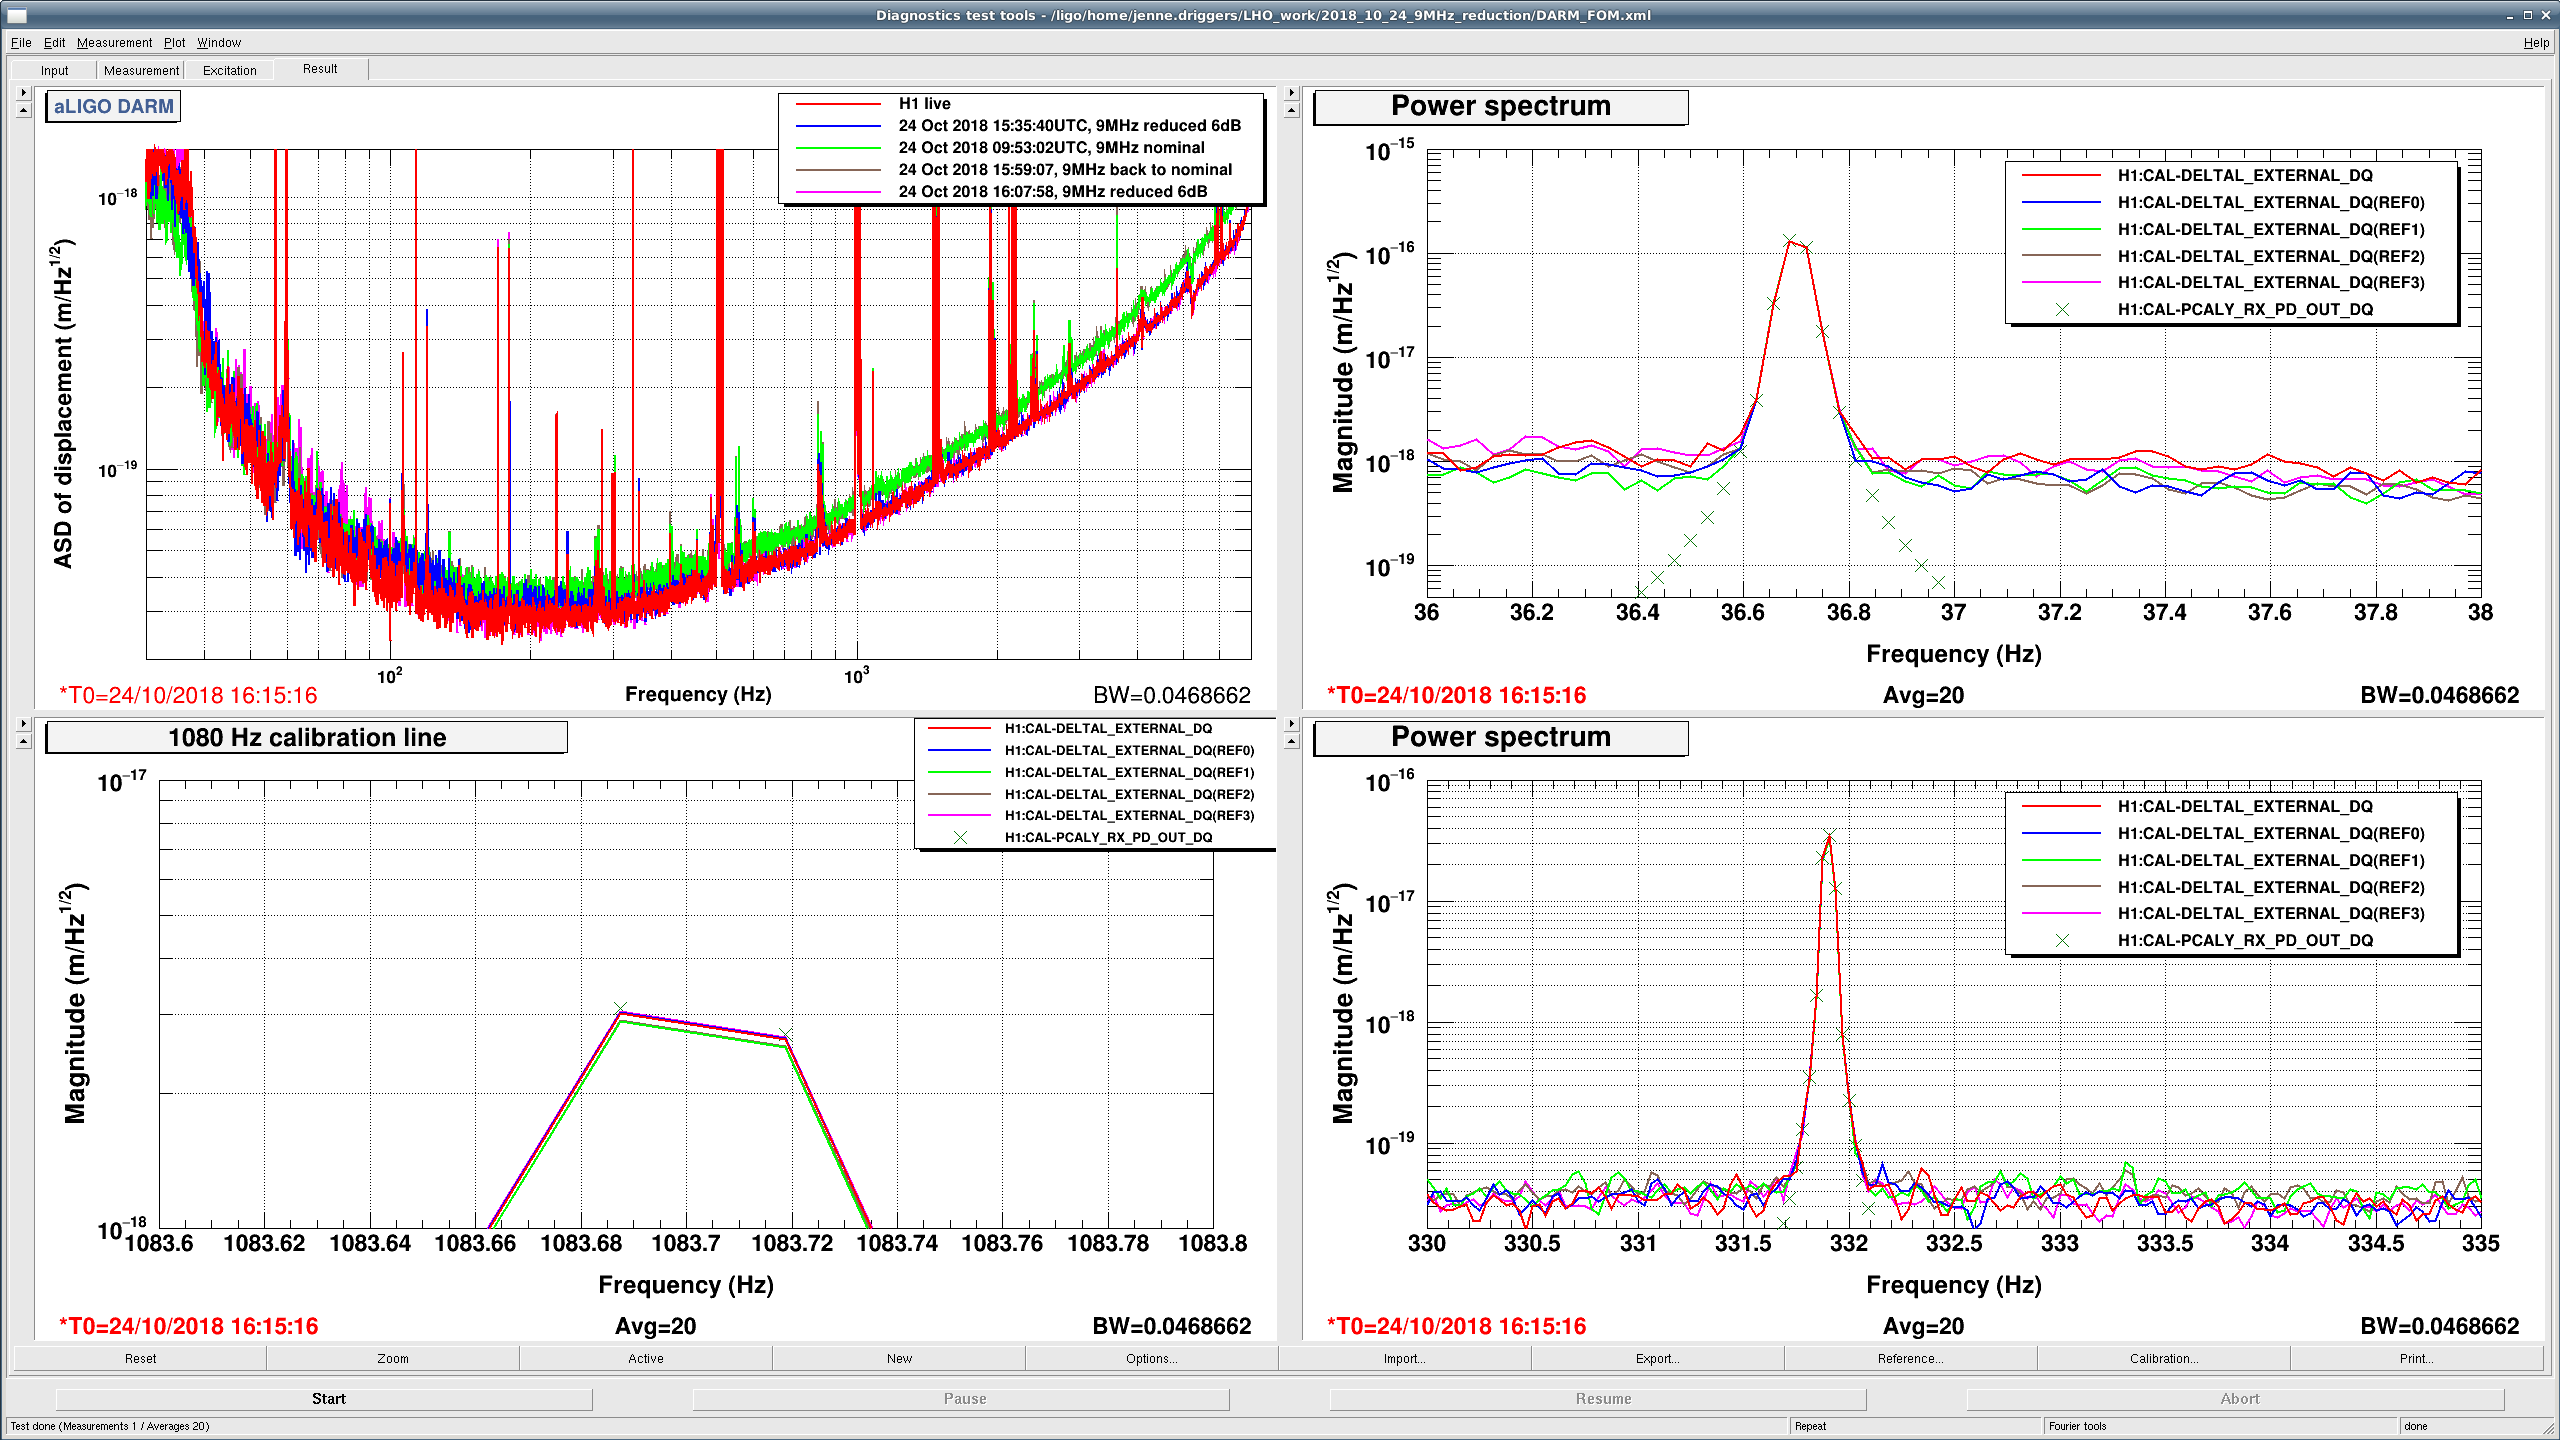
I reduced the 9MHz modulation depth by 6dB, and it seems like that gives us several more Mpc. It seems like our sensitivity is really improving when I reduce the modulation depth, although I'm not sure why it has such a significant effect, particularly at high frequencies.  I plot here also 3 of the calibration lines, so you can see that their peaks are lining up pretty well.  If anything, the green and brown traces with the 9MHz at it's lock acquisition value are a bit worse than they look here, since the 1080Hz line should be scaled up by a teeny bit.

Note that the lockloss around 16:45 was me, trying to reduce the 9MHz by another 3dB, but the old script that I use to step by hand further didn't include compensation for the analog CARM gain.  I've fixed the script, so will likely try again next lock.

Images attached to this report
Comments related to this report
jenne.driggers@LIGO.ORG - 11:43, Wednesday 24 October 2018 (44786)

I have now put the 9MHz reduction into the main acquisition sequence path.

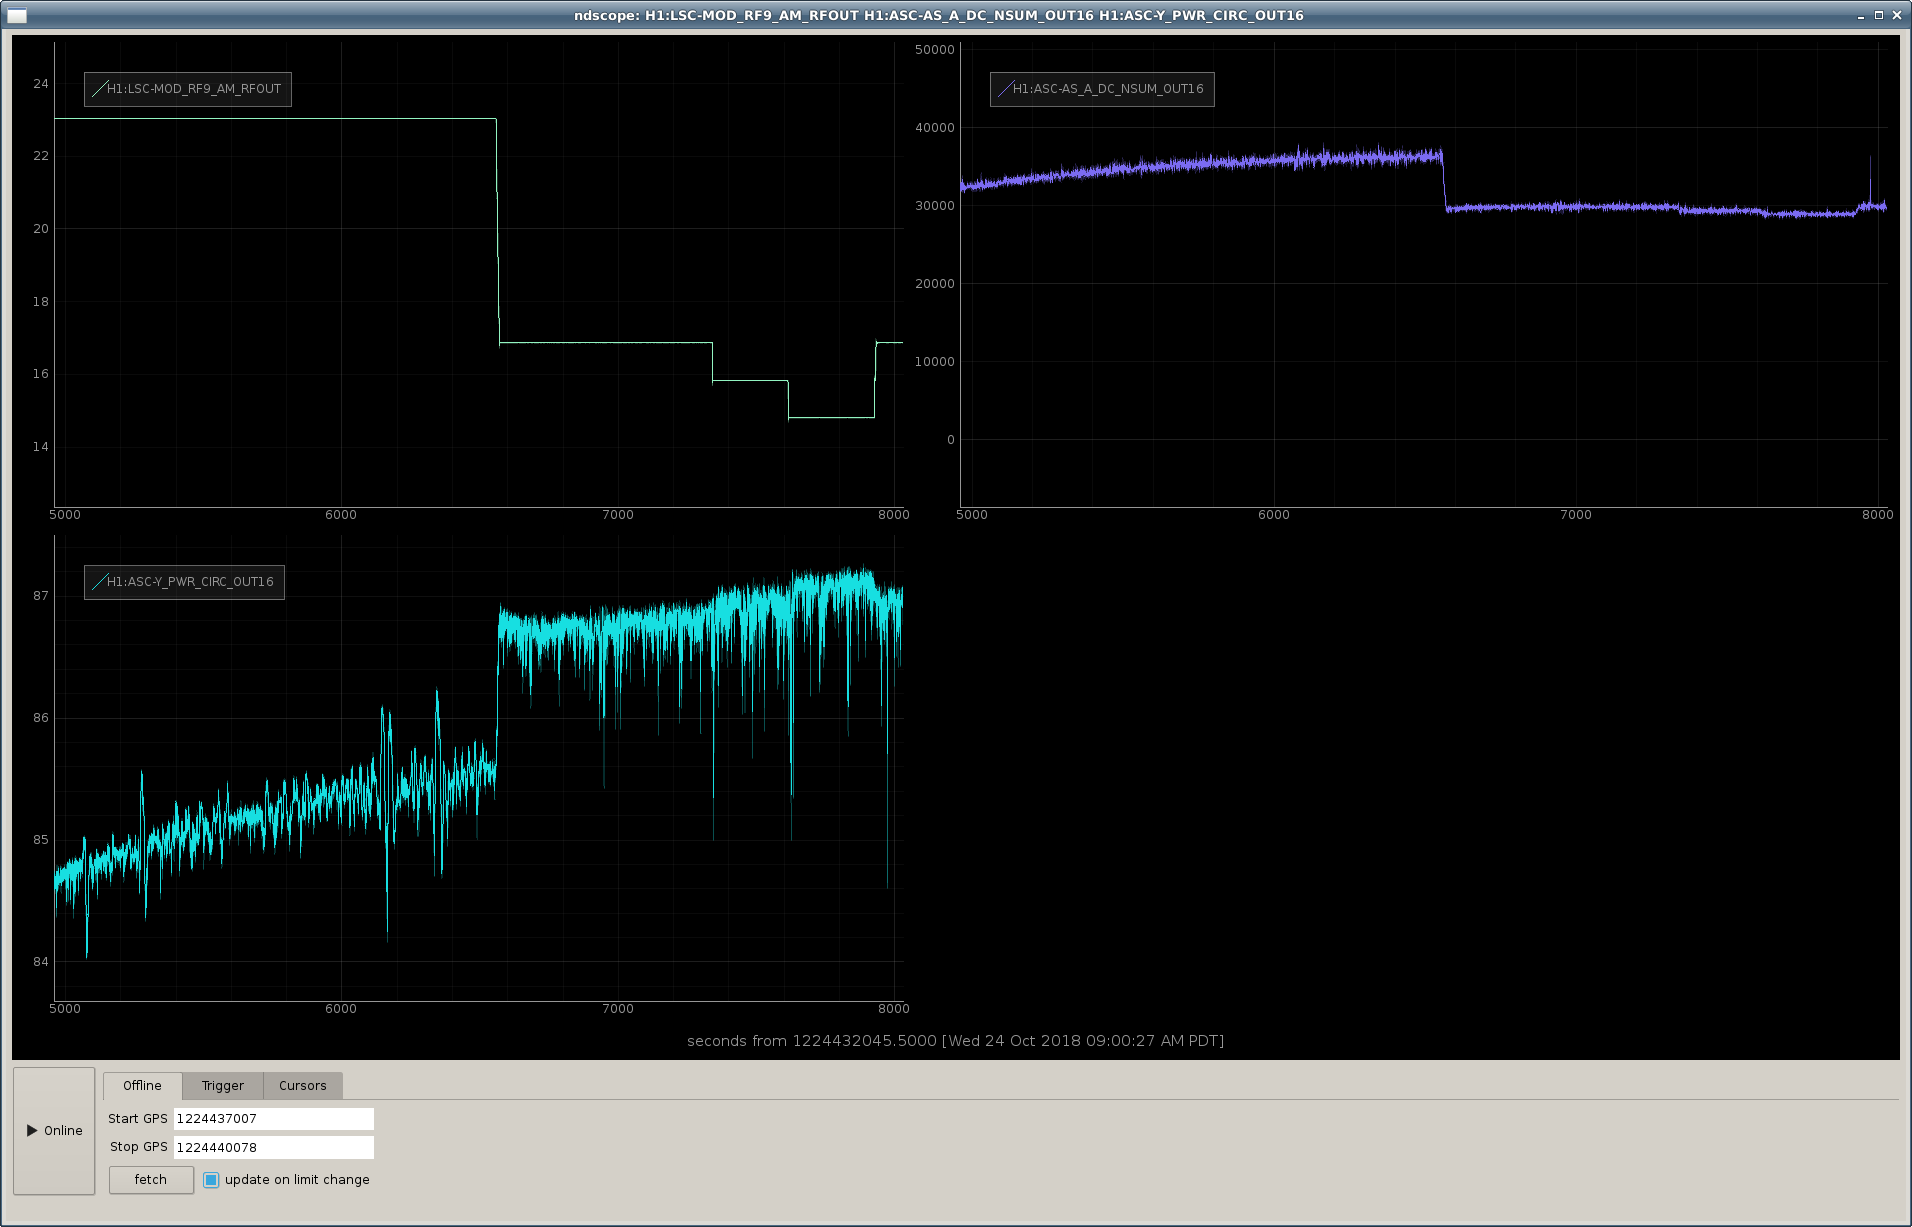
The attached plot shows that we are really seeing more power circulating in the arm cavities (and also less power at the AS port) when the 9MHz modulation depth is reduced.  So, there must be some offset somewhere that we're reducing. 

Also, I tried reducing the modulation depth by 8dB rather than just 6dB, and the IFO gets noticeably more glitchy when I do the extra 2dB.  So, it seems like 6dB of reduction is a reasonable place, and we can work on finding what is causing this circulating power change.

Since we're reducing the 9MHz modulation depth from 0.2ish to 0.1, we're changing the 9MHz power from 4% to 1%, so should have ~3% more carrier power.  That is consistent with the increase in circulating power that we see.  However, the apparent shot noise reduction implies a much larger increase in power, so something is still not quite hanging together.

Images attached to this comment
peter.fritschel@LIGO.ORG - 13:04, Wednesday 24 October 2018 (44787)

It would be worth checking the RF levels on the other LSC RFPDs used for LSC control (if you haven't already), as was done yesterday for REFL9.

keita.kawabe@LIGO.ORG - 15:52, Wednesday 24 October 2018 (44793)

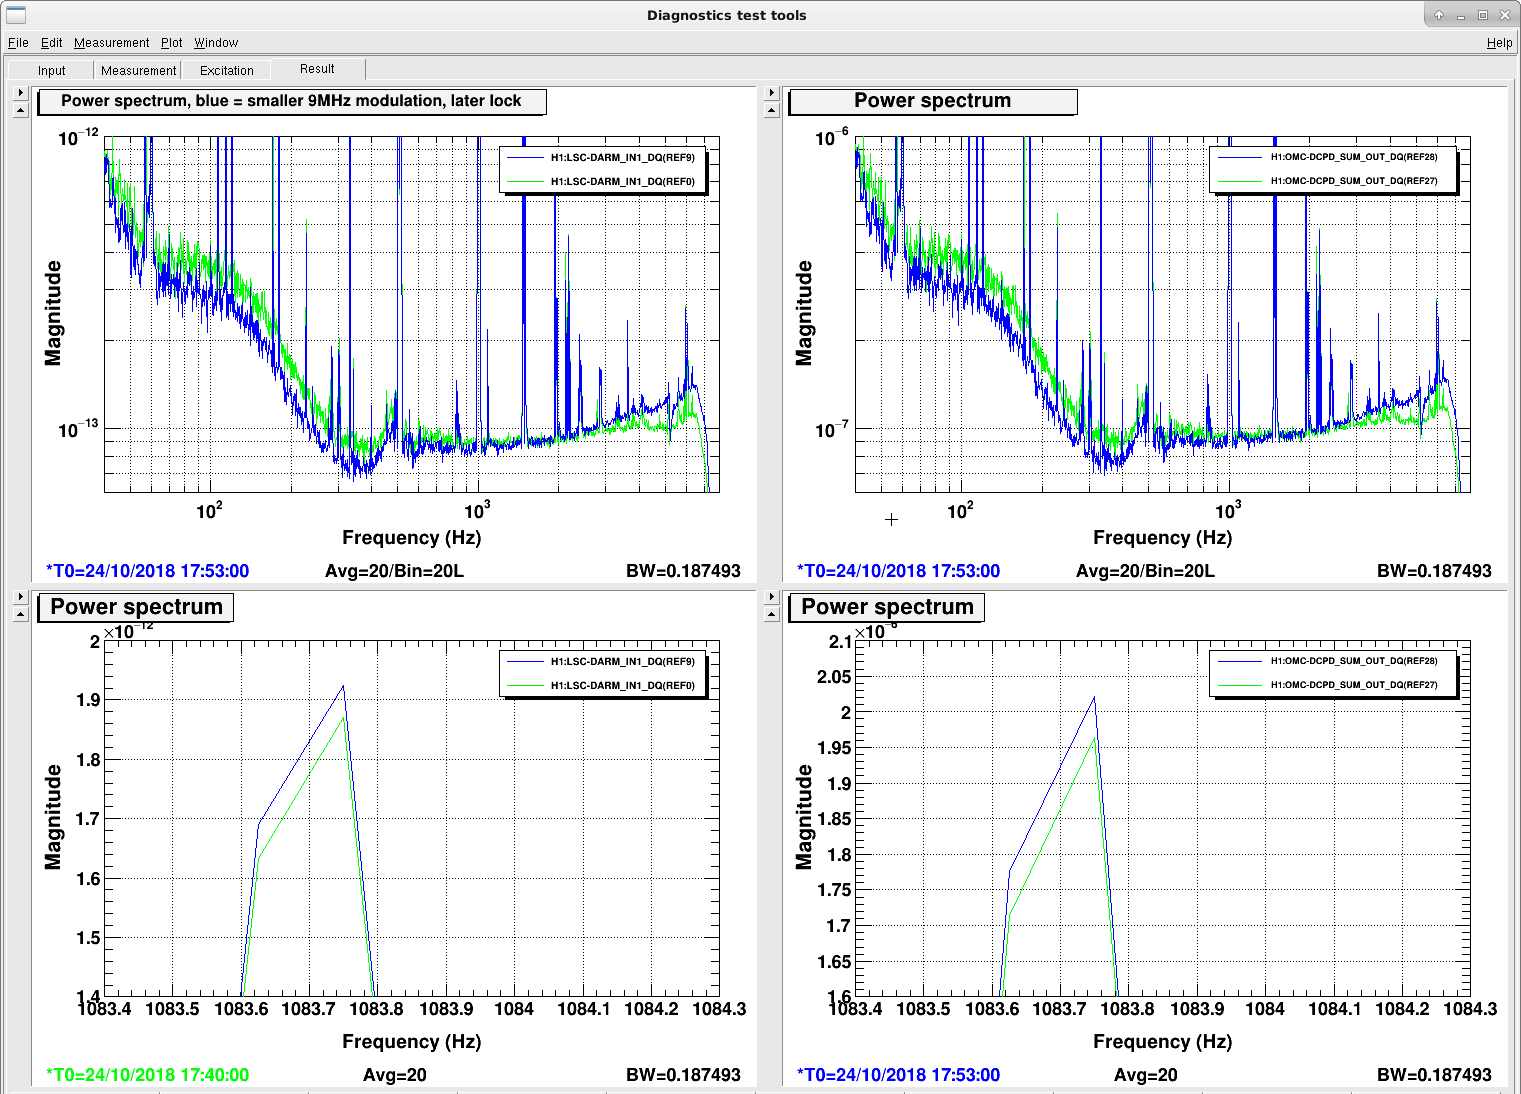
Premature to say we're gaining something, as I don't see the same reduction in uncalibrated DARM nor in OMC DCPD.

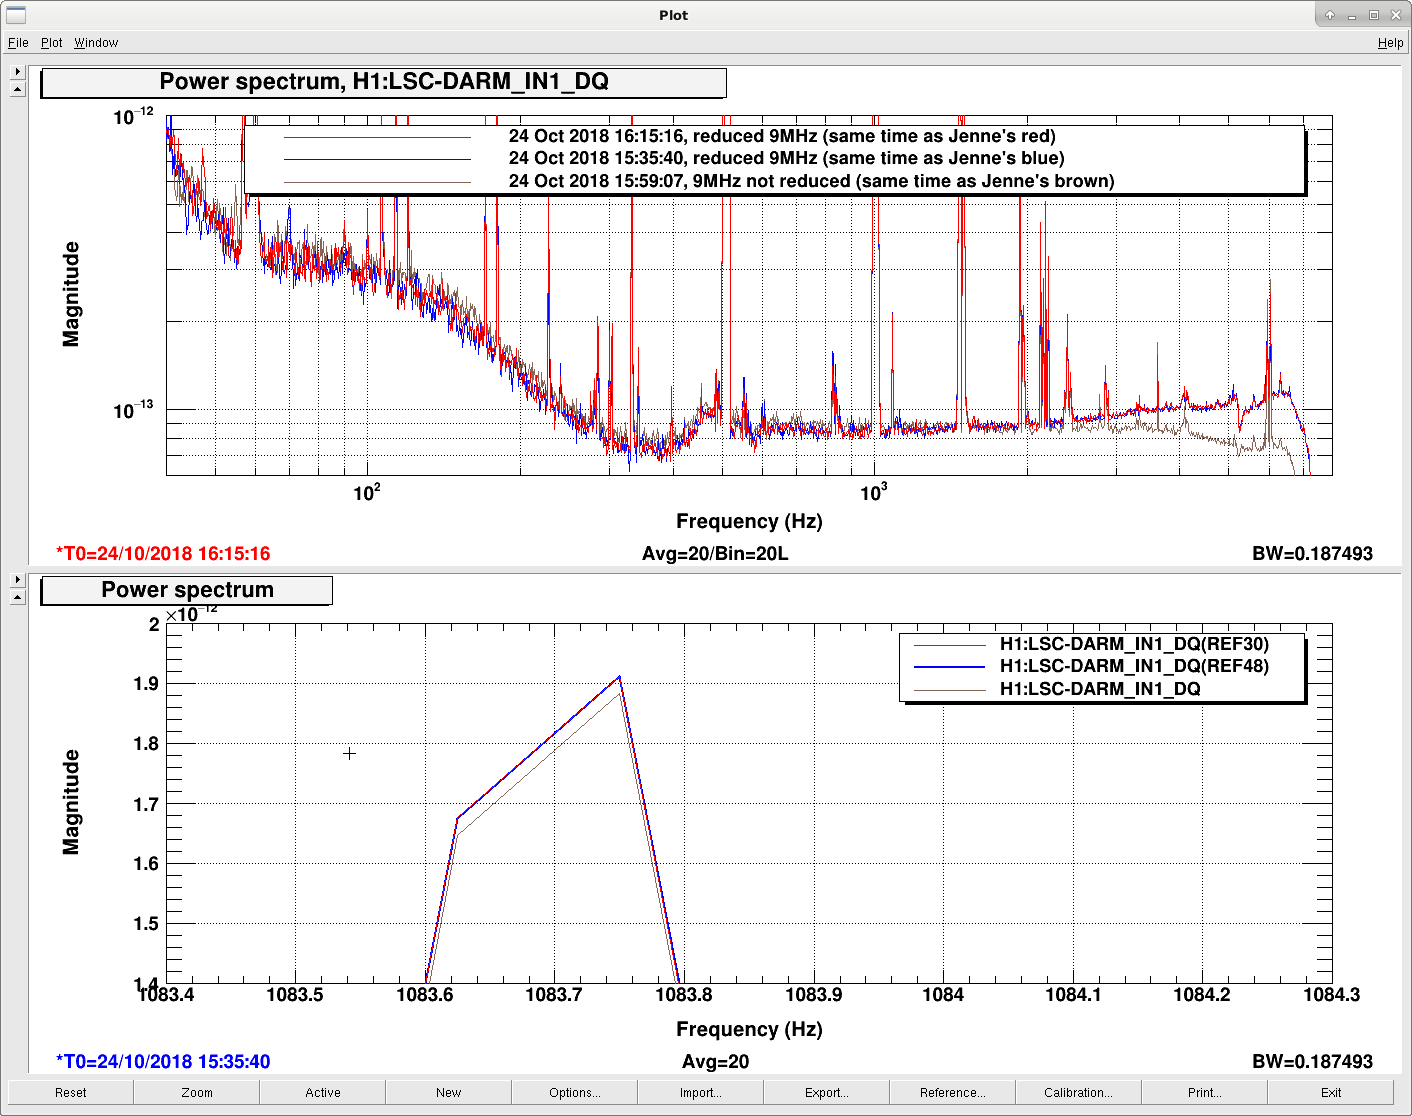
In the first attachment , red, blue and brown are from the single lock stretch corresponding to Jenne's red, blue and brown. No improvement at 1kHz at all, and the frequency noise part (f>2k or so) is worse when 9MHz was reduced. In Jenne's plot the improvement was pretty much 15 % or so over the large frequency region.

The second attachment is later in the morning. Blue is small RF9, green is large RF9.

In the latter there seem to be a difference at 100Hz but I don't know if this was due to high/low RF9 mod index.

Optical gain difference between high/low RF9 was no larger than a few % in both of the lock stretches.


Images attached to this comment
keita.kawabe@LIGO.ORG - 16:55, Wednesday 24 October 2018 (44796)

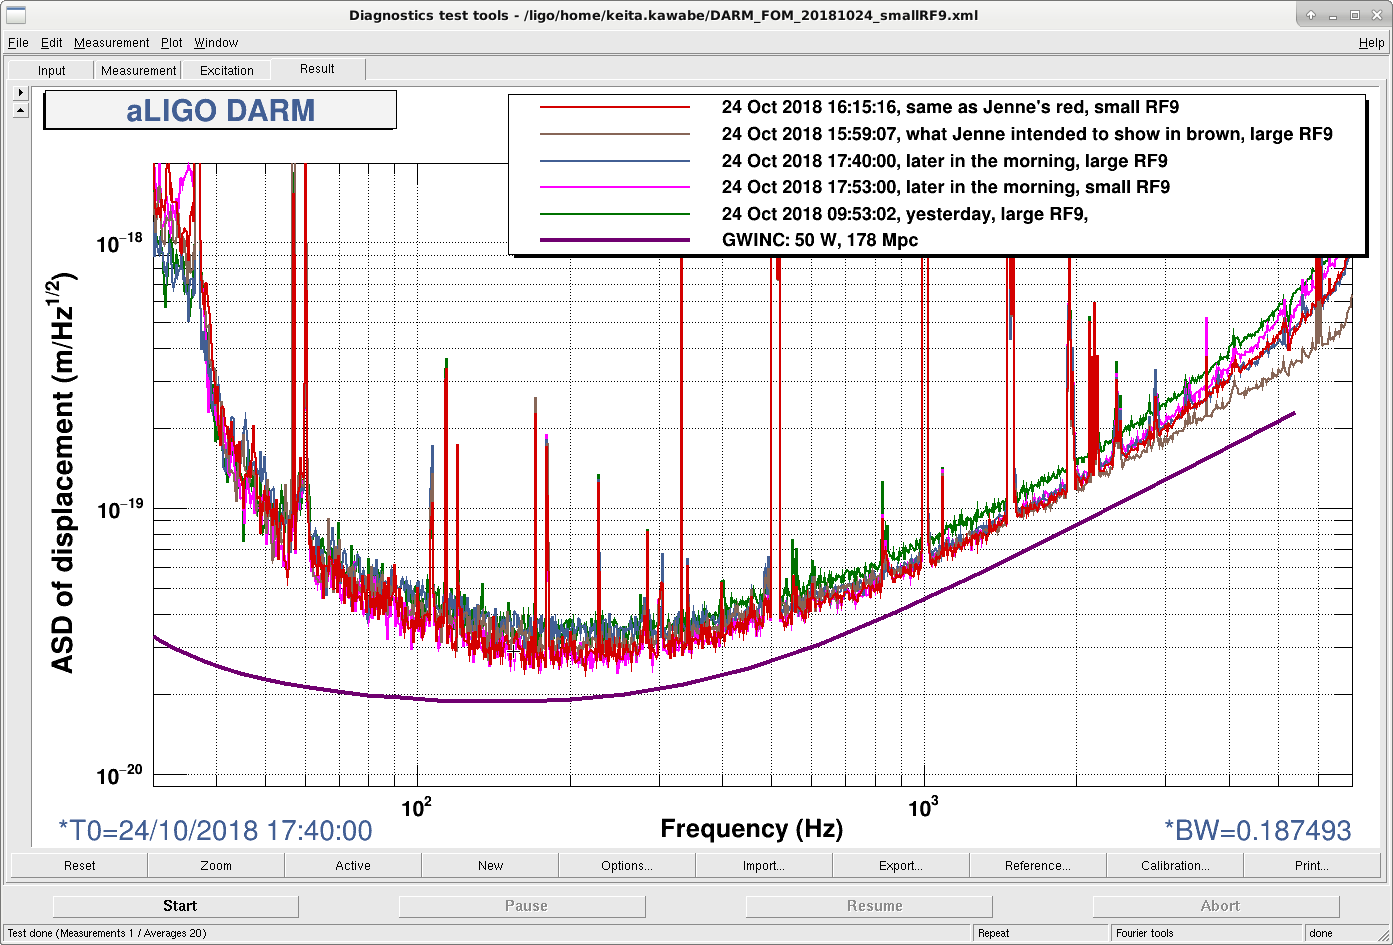
Update (Jenne, Keita): Things makes more sense now.

In the attached, you should compare red (reduced RF9) with brown (not reduced) from the same lock stretch, or blue (not reduced) with pink (reduced) from another lock stretch. Legends are in UTC. In both of the cases, smaller modulation index increases the frequency noise in high kHz but seems to somewhat reduce noise at 100Hz.

It didn't make sense at first because there was an error in the legend of Jenne's plot.


Details:

Turns out that the legend for the brown trace (15:59:07, 9MHz back to normal) in Jenne's plot was incorrect, it was neither UTC nor local time, it was actually from 09:53:02 UTC, i.e yesterday. This means that all of her "9MHz reduced" traces are from today and all of "9MHz normal" traces are from yesterday.

But she intended to look at 15:59:07 UTC for brown trace, which was from today when 9MHz was reduced (but the CM gain setting was not changed to compensate). In the attached, red and brown are the same as Jenne's red and what Jenne intended to show in brown, these are from the same lock stretch.

Blue and pink are from another lock stretch later in the morning. (In this case, CM gain setting was changed to compensate for the optical gain.)

Low RF makes frequency noise worse at high-kHz due to lower S/N (pink VS blue). In the case of red VS brown, overall CM gain was lower, making the difference larger than pink VS blue.

To confuse the matter further, somehow at some point in yesterday the shot noise level seemed to have improved according to  Sheila, and that is clearly seen in green trace from yesterday.

Images attached to this comment
jenne.driggers@LIGO.ORG - 17:19, Wednesday 24 October 2018 (44799)

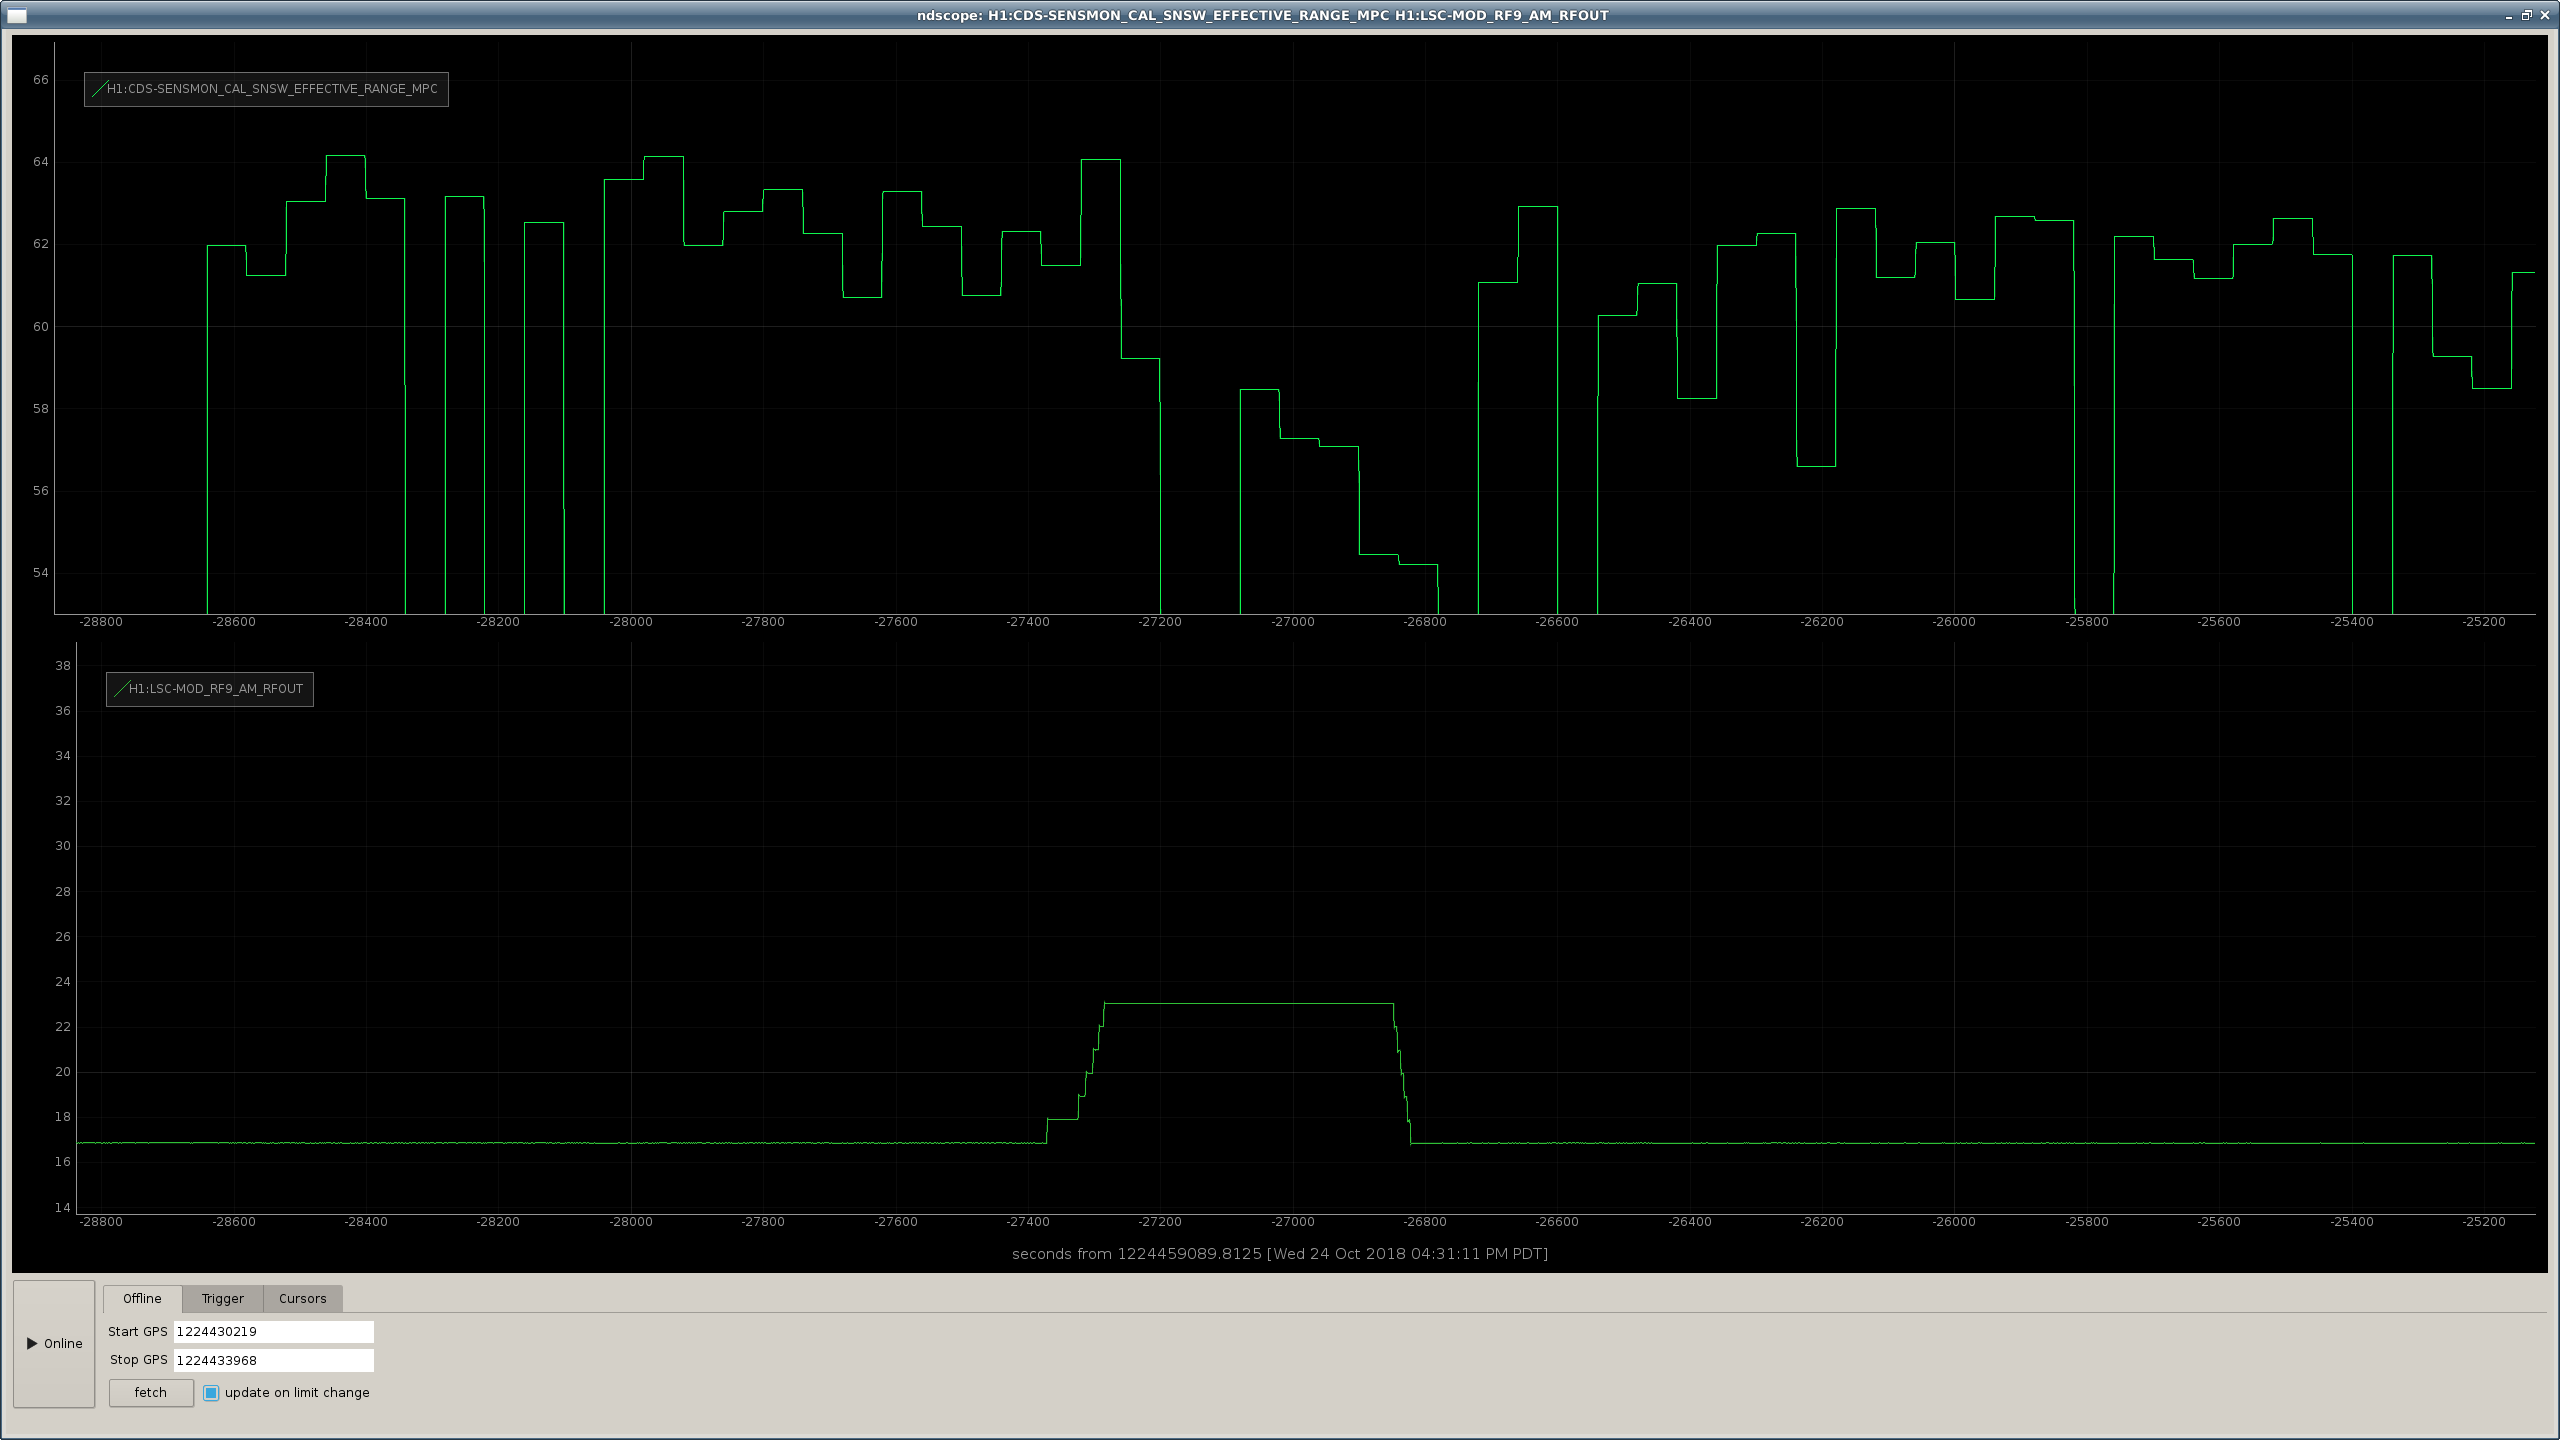
There is at least a bit of a change in the range during the on/off test that I meant to plot the times of from this morning.  See attached.

I've modified EvanH's old stepping modulation depth script so that it will change the modulation depth, wait 10 min, then change it back, repeating 5 times.  If the IFO is locked when the last person leaves for the night, please launch this (attached, and in /ligo/home/jenne.driggers/LHO_work/2018_10_24_9MHz_reduction/step_9MHz_many.py)

Images attached to this comment
Non-image files attached to this comment
craig.cahillane@LIGO.ORG - 02:53, Thursday 25 October 2018 (44812)ISC
I modified Jenne's modification of step9.py so that the user can CTRL+C the skip at any point and the PD gains will all be returned to their original values when the script starting running.  Useful for when we lose lock during the test.  

Pressing Ctrl+C while the gains are changed and the interferometer is locked is not recommended: the script will instantaneously return all gains to original values.

Code lives in:
/ligo/home/craig.cahillane/utils/step9mod.py

Started a run of this code at Oct 25 2018 09:52:44 UTC (1224496382).
keita.kawabe@LIGO.ORG - 11:07, Thursday 25 October 2018 (44826)

Yet another update:

For the moment I take back my statement about lower modulation index VS high kHz frequency noise, the coupling itself is slowly changing with time and I might have been tricked.

H1 DetChar (DetChar, ISC, PEM)
andrew.lundgren@LIGO.ORG - posted 14:58, Thursday 11 October 2018 - last comment - 08:02, Thursday 25 October 2018(44495)
56.84 Hz and harmonics in h(t)
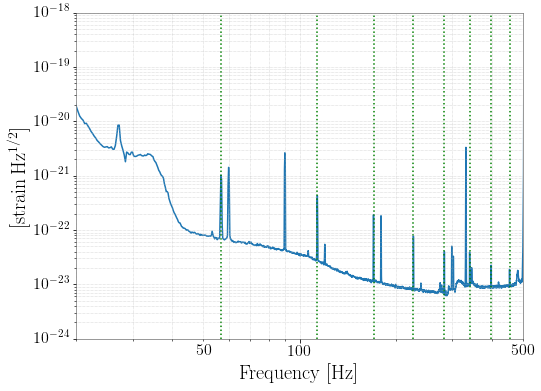
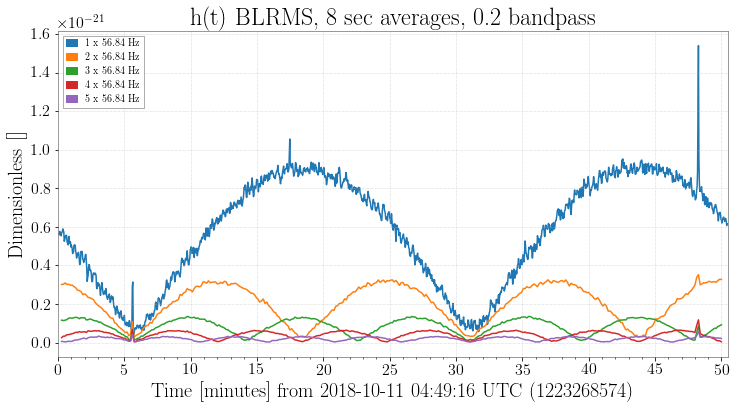
During the low noise lock at 4:50 UTC today (Oct 11), there is a comb of lines in h(t) at 56.84 and multiples. They are quite narrow lines. The most interesting characteristic is that they have extreme amplitude modulation.

The first attachment is the h(t) spectrum with the lines marked. The second shows narrow BLRMS around each of the lines. The fundamental at 56.84 Hz has a half-period of about 24 minutes. The amplitude goes very close to zero, and looks very periodic. Each multiple n has zeros in the same place, but the period is n times shorter. Maybe this could be all generated from the fundamental with the right kind of nonlinearity. I'm not sure what would give such a slow but extreme modulation - maybe some centering servo?

The BRUCO results show a lot of channels at End-X coherent. Accelerometers on BSC9 seem to see it, but without amplitude modulation. PCal X sees it in the TX and RX PDs, but stronger in RX; but it doesn't seem anywhere near the level to get into h(t).

Images attached to this report
Comments related to this report
keith.riles@LIGO.ORG - 15:13, Thursday 11 October 2018 (44497)DetChar
The 56.84 Hz comb is a blast from the past.  Here is an entry from March 2013 concerning H2 one-arm data suggesting that the comb could be purely DAQ-related:

https://alog.ligo-wa.caltech.edu/aLOG/index.php?callRep=5806

aidan.brooks@LIGO.ORG - 18:44, Thursday 11 October 2018 (44508)

This one is close enough to the 57Hz ETM HWS that we've seen in the past that I thought I should mention it here. However, we've recently overhauled that system and I've not confirmed what the new frame-rate is yet.

Here's the old analysis: https://alog.ligo-la.caltech.edu/aLOG/index.php?callRep=14778

john.zweizig@LIGO.ORG - 00:48, Tuesday 16 October 2018 (44579)DAQ, DetChar
I Looked at an empty EX ADC channel (H1:PEM-EX_ADC_0_08_OUT_DQ) and found that the 58.64 Hz comb is there too, indicating that the comb comes from some source independent of the interferometer (i.e. in the DAQ or RF pick-up). I have attached ASDs of the empty ADC in 0.1mHz bins both for the entire spectrum (0-1024Hz) and near to the 14th 56.84 harmonic (~795.76Hz). I was slightly surprised that a second nearby line (that would explain the amplitude modulation) was not seen even with the 0.1mHz resolution. 
Images attached to this comment
aidan.brooks@LIGO.ORG - 12:59, Wednesday 17 October 2018 (44627)

Yes - the ETM HWS are running at 57Hz. This doesn't mean that this is the issue since it appears to be DAQ related, buuuut .....

aidan.brooks@zotws11:~$ caget H1:TCS-ETMX_HWS_SYNC_FREQUENCY

H1:TCS-ETMX_HWS_SYNC_FREQUENCY 57 Hz

aidan.brooks@zotws11:~$ caget H1:TCS-ETMY_HWS_SYNC_FREQUENCY

H1:TCS-ETMY_HWS_SYNC_FREQUENCY 57 Hz


edwin.son@LIGO.ORG - 22:48, Sunday 21 October 2018 (44717)
I've searched EX channels and found some channels where amplitude modulation is seen:

H1:SUS-ETMX_L3_DRIVEALIGN_L_OUT_DQ
H1:SUS-ETMX_L3_ISCINF_L_IN1_DQ
H1:SUS-ETMX_L3_LVESDAMON_LL_OUT_DQ
H1:SUS-ETMX_L3_LVESDAMON_LR_OUT_DQ
H1:SUS-ETMX_L3_LVESDAMON_UL_OUT_DQ
H1:SUS-ETMX_L3_LVESDAMON_UR_OUT_DQ
H1:SUS-ETMX_L3_MASTER_OUT_LL_DQ
H1:SUS-ETMX_L3_MASTER_OUT_LR_DQ
H1:SUS-ETMX_L3_MASTER_OUT_UL_DQ
H1:SUS-ETMX_L3_MASTER_OUT_UR_DQ

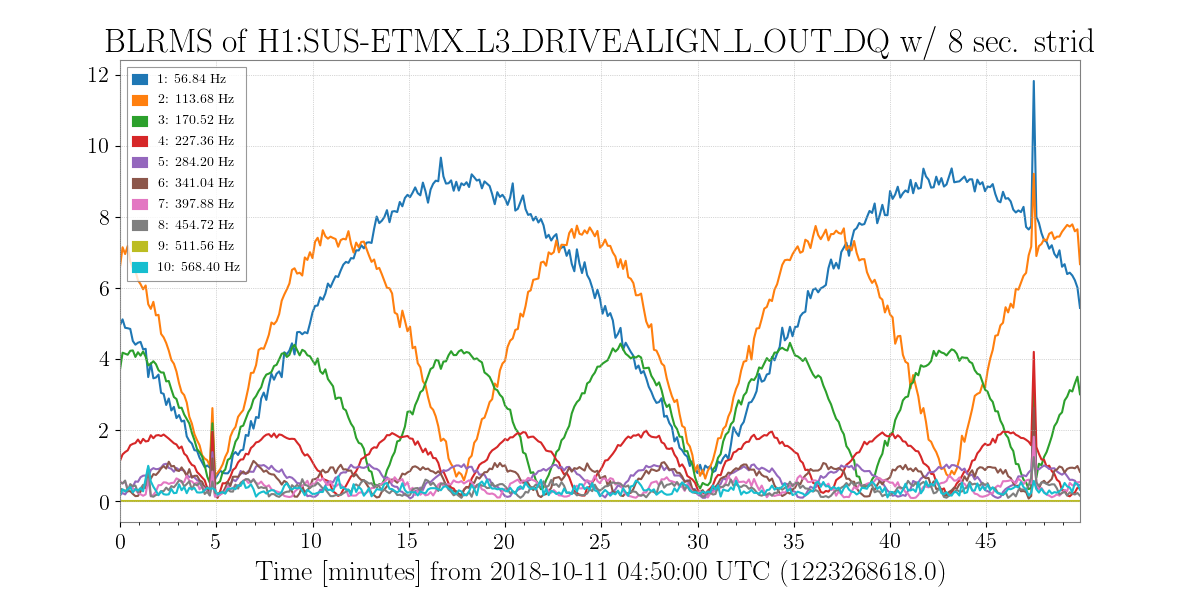
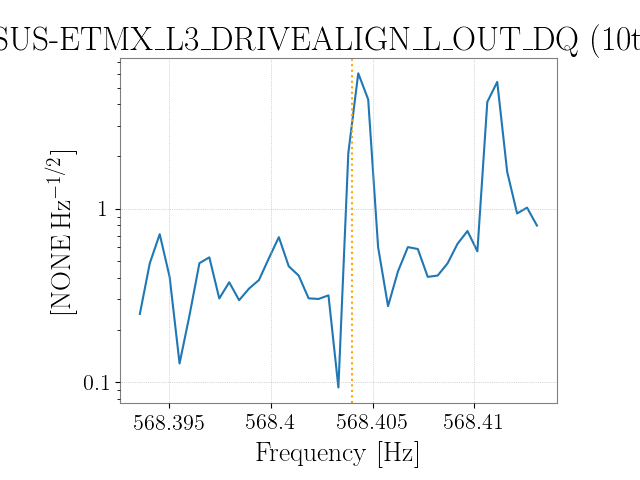
Attached plots are BLRMS and zoomed spectrum of H1:SUS-ETMX_L3_DRIVEALIGN_L_OUT_DQ as an example.
The vertical line (orange, dotted) in the zoomed spectrum is at 568.404 Hz (10th harmonics).
Images attached to this comment
rana.adhikari@LIGO.ORG - 20:59, Wednesday 24 October 2018 (44805)AOS, COC, DetChar, INJ, TCS

NO

we moved the Hartmann sync frequency and the lines moved accordingly - its Hartmann, not DAQ.

Why does the Hartmann sensor so strongly couple to DARM?

daniel.vander-hyde@LIGO.ORG - 21:35, Wednesday 24 October 2018 (44806)
Images attached to this comment
aidan.brooks@LIGO.ORG - 08:02, Thursday 25 October 2018 (44815)

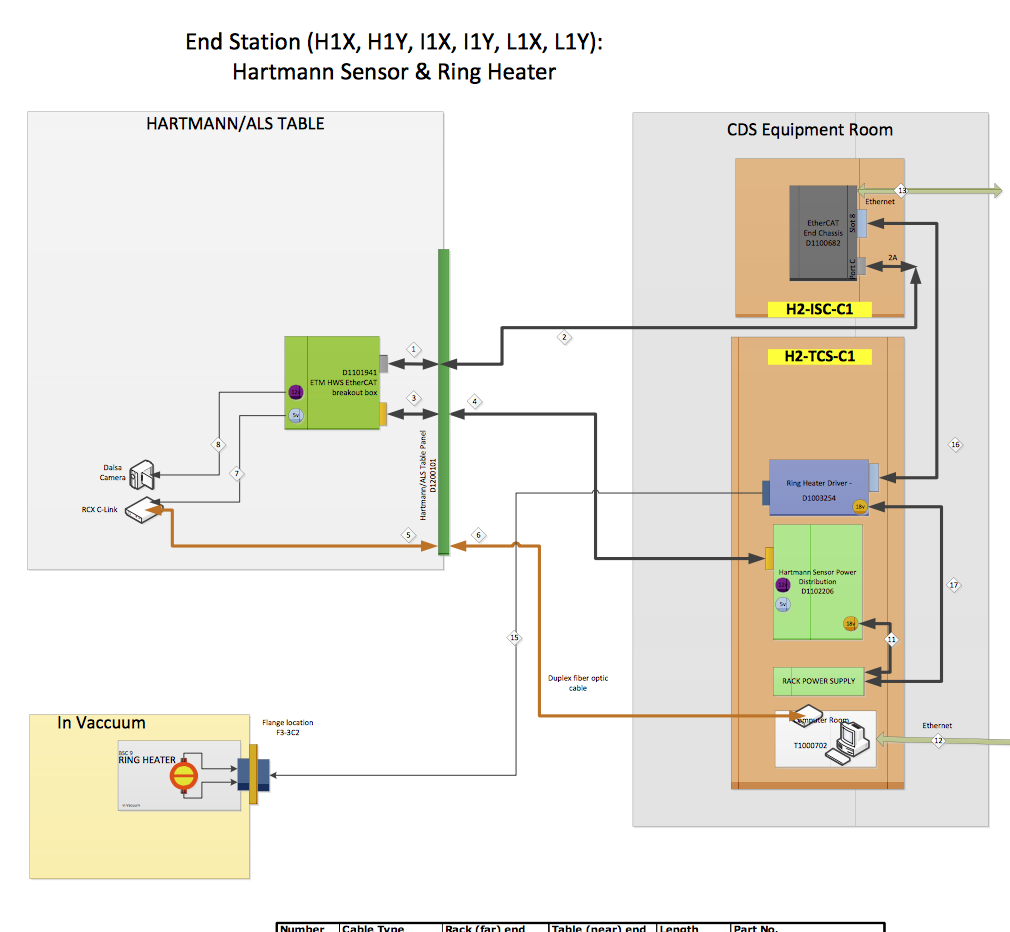
With regards to the coupling, the ETM HWS are served by the same power supply as the ring heaters. It's a long shot but it might be worthwhile to try disconnecting the ring heaters from the driver while the to see if the coupling of the 57Hz to DARM is changed.

https://dcc.ligo.org/LIGO-E1100891


Images attached to this comment
Displaying reports 44881-44900 of 88399.Go to page Start 2241 2242 2243 2244 2245 2246 2247 2248 2249 End