Jenne, Hang
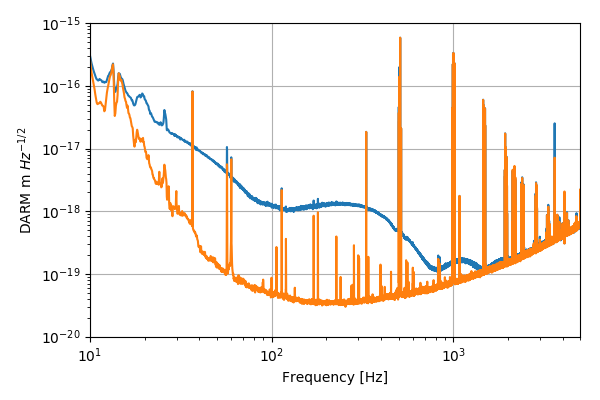
We added some extra ASC cutoff filters for C/DSOFT pitch and DHARD yaw, which improves the noise below 30 Hz. Please see the first attached plot.
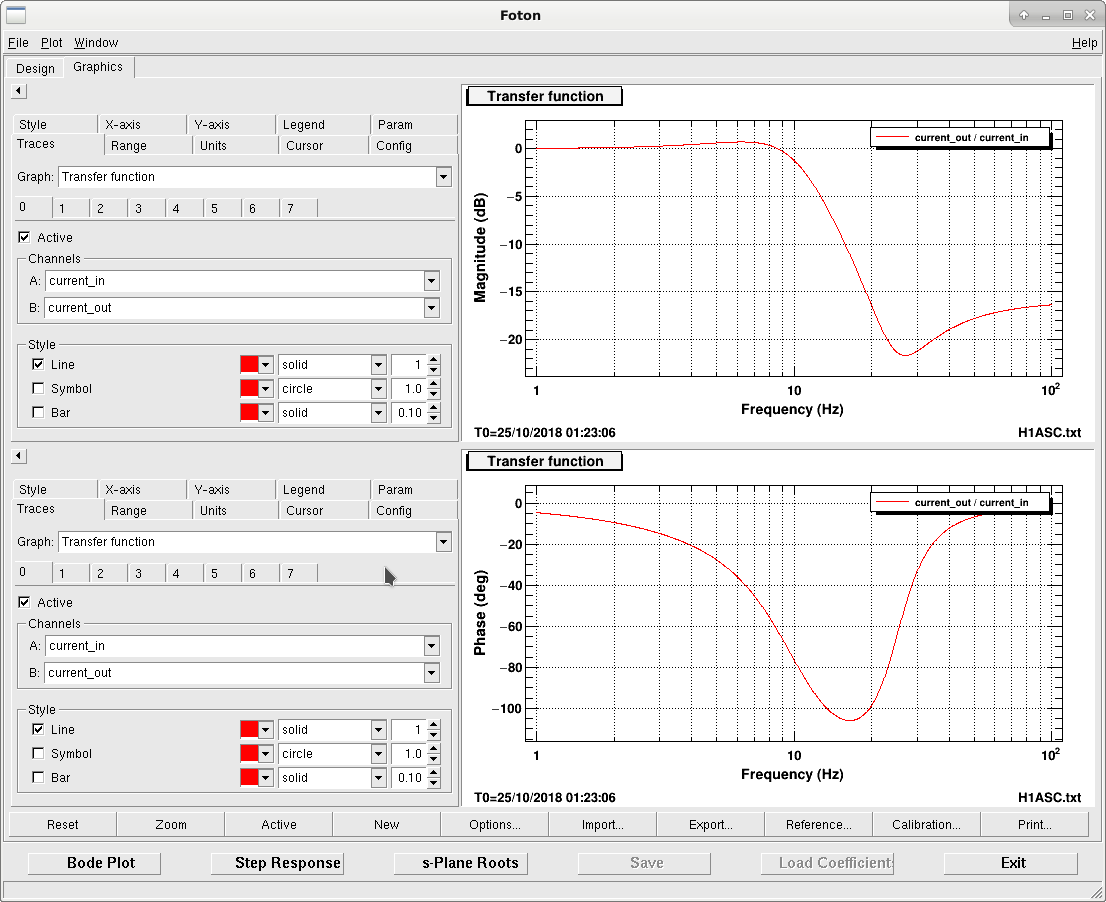
For the SOFT pitch loops, we increased their bandwidths to suppress the 0.5 Hz oscillation. This made their noise showing up in DARM (see, e.g., LHO:44746). To suppress this we added an extra LP filter in their ctrl filter banks whose shape is shown in the second plot. The filter is in FM7 for DSOFT_P and in FM5 for CSOFT_P. In the third plot we show the SOFT PITCH loop shape after the new LP engaged.
We also put the LP engagement in the guardian LOWNOISE_ASC state, which worked fine.
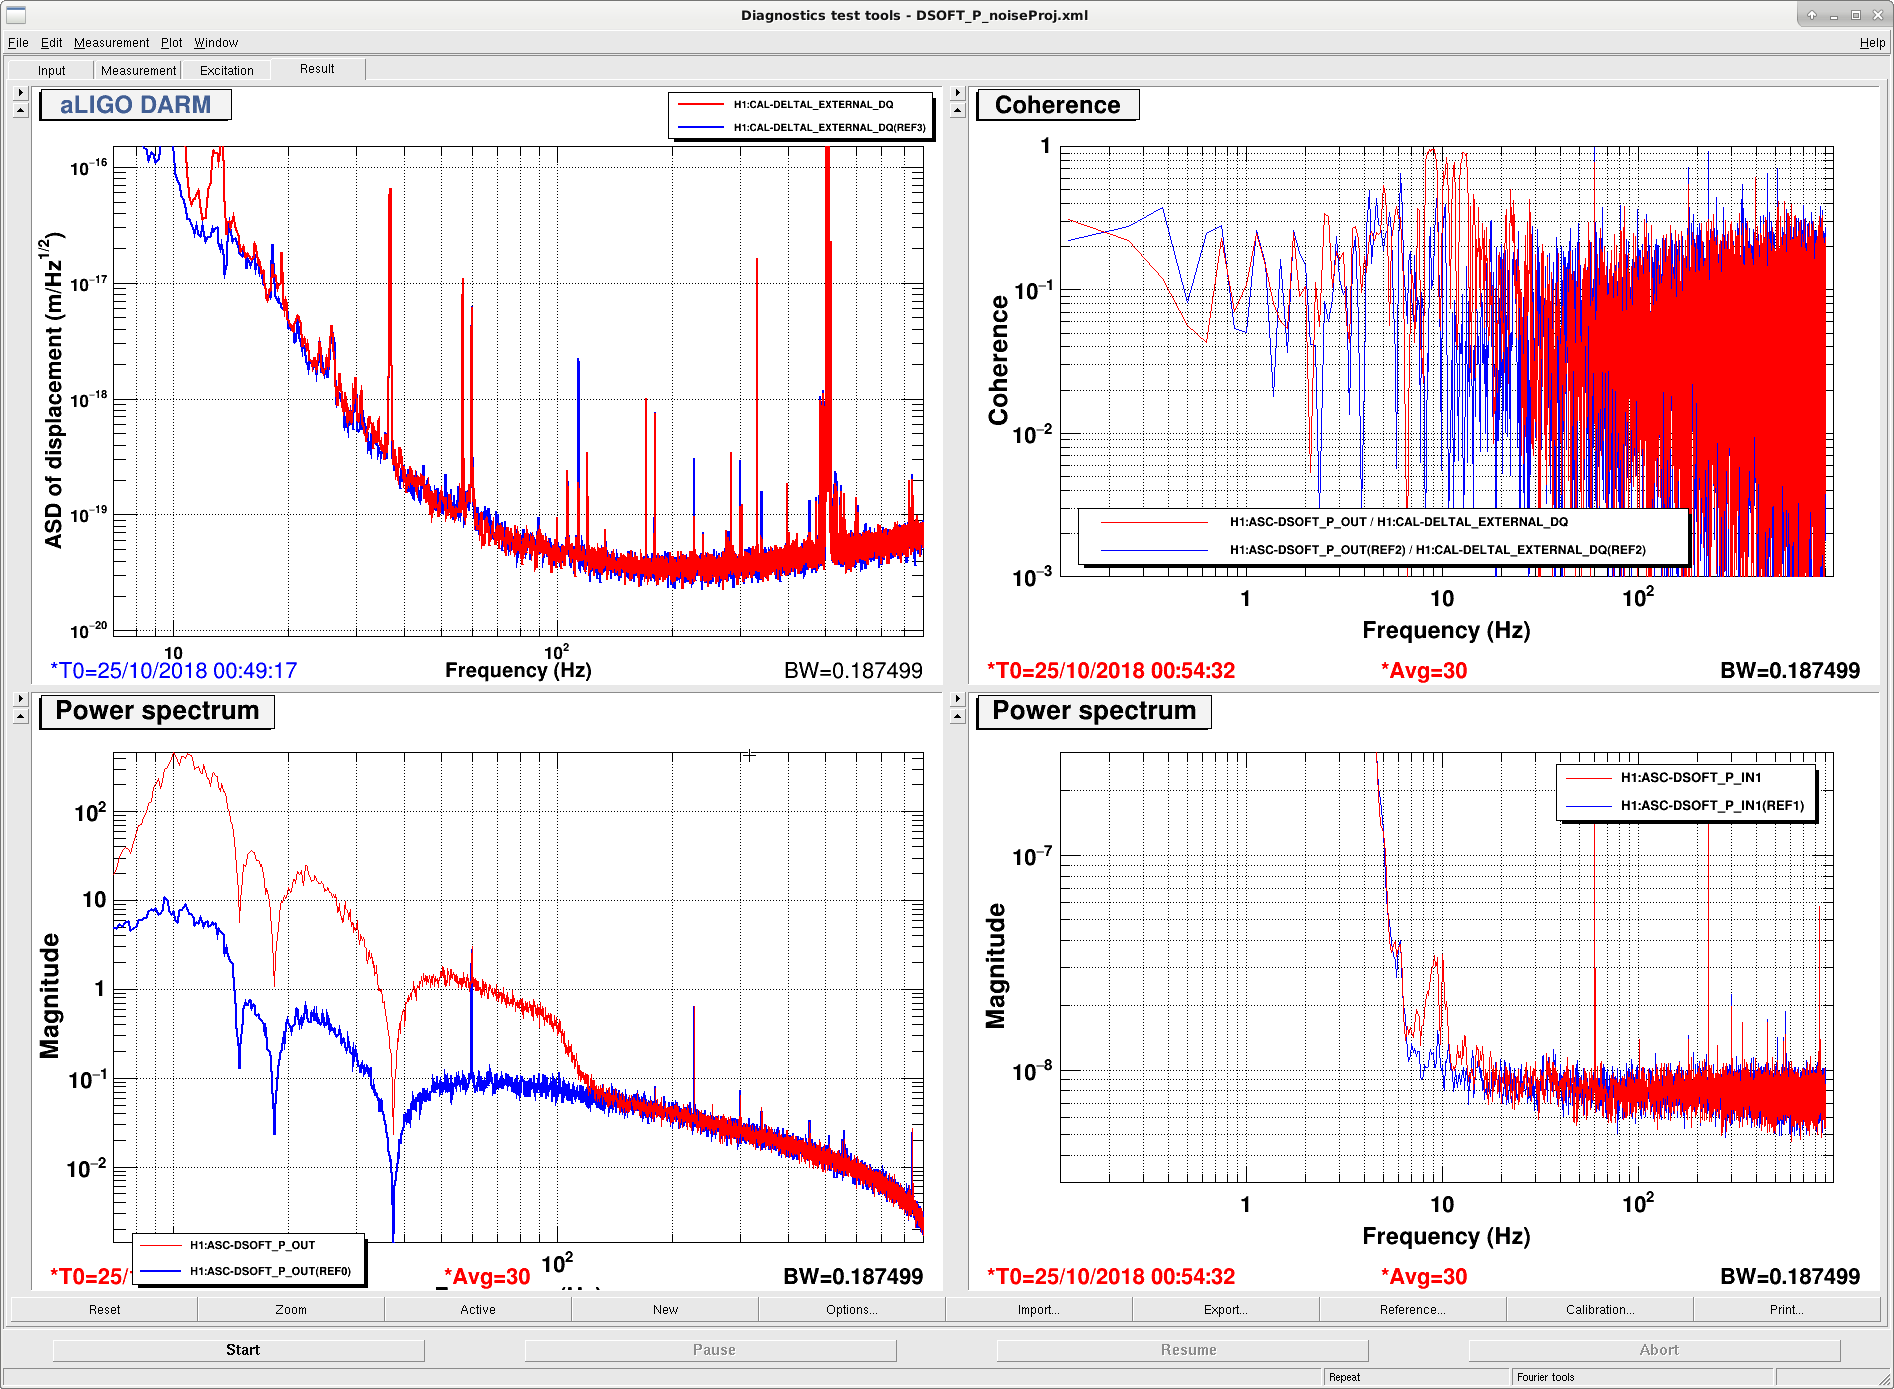
The forth plot shows the noise projection of DSOFT P to DARM with the LP on. The ref traces (blue) were without injection and the nonref ones (red) were with noise injection. No significant contamination showed up in DARM above 20 Hz when we excited the output by a factor of ~ 100. The CSOFT P projection is essentially the same. Both measurements' raw data are attached as well.
In addition we also engaged the an extra LP in the DH_Y loop. The LP's shape is shown in the last figure. It is fine to engage such a filter as at the DH_Y UGF we have ~ 50 deg margin previously (LHO:44736).
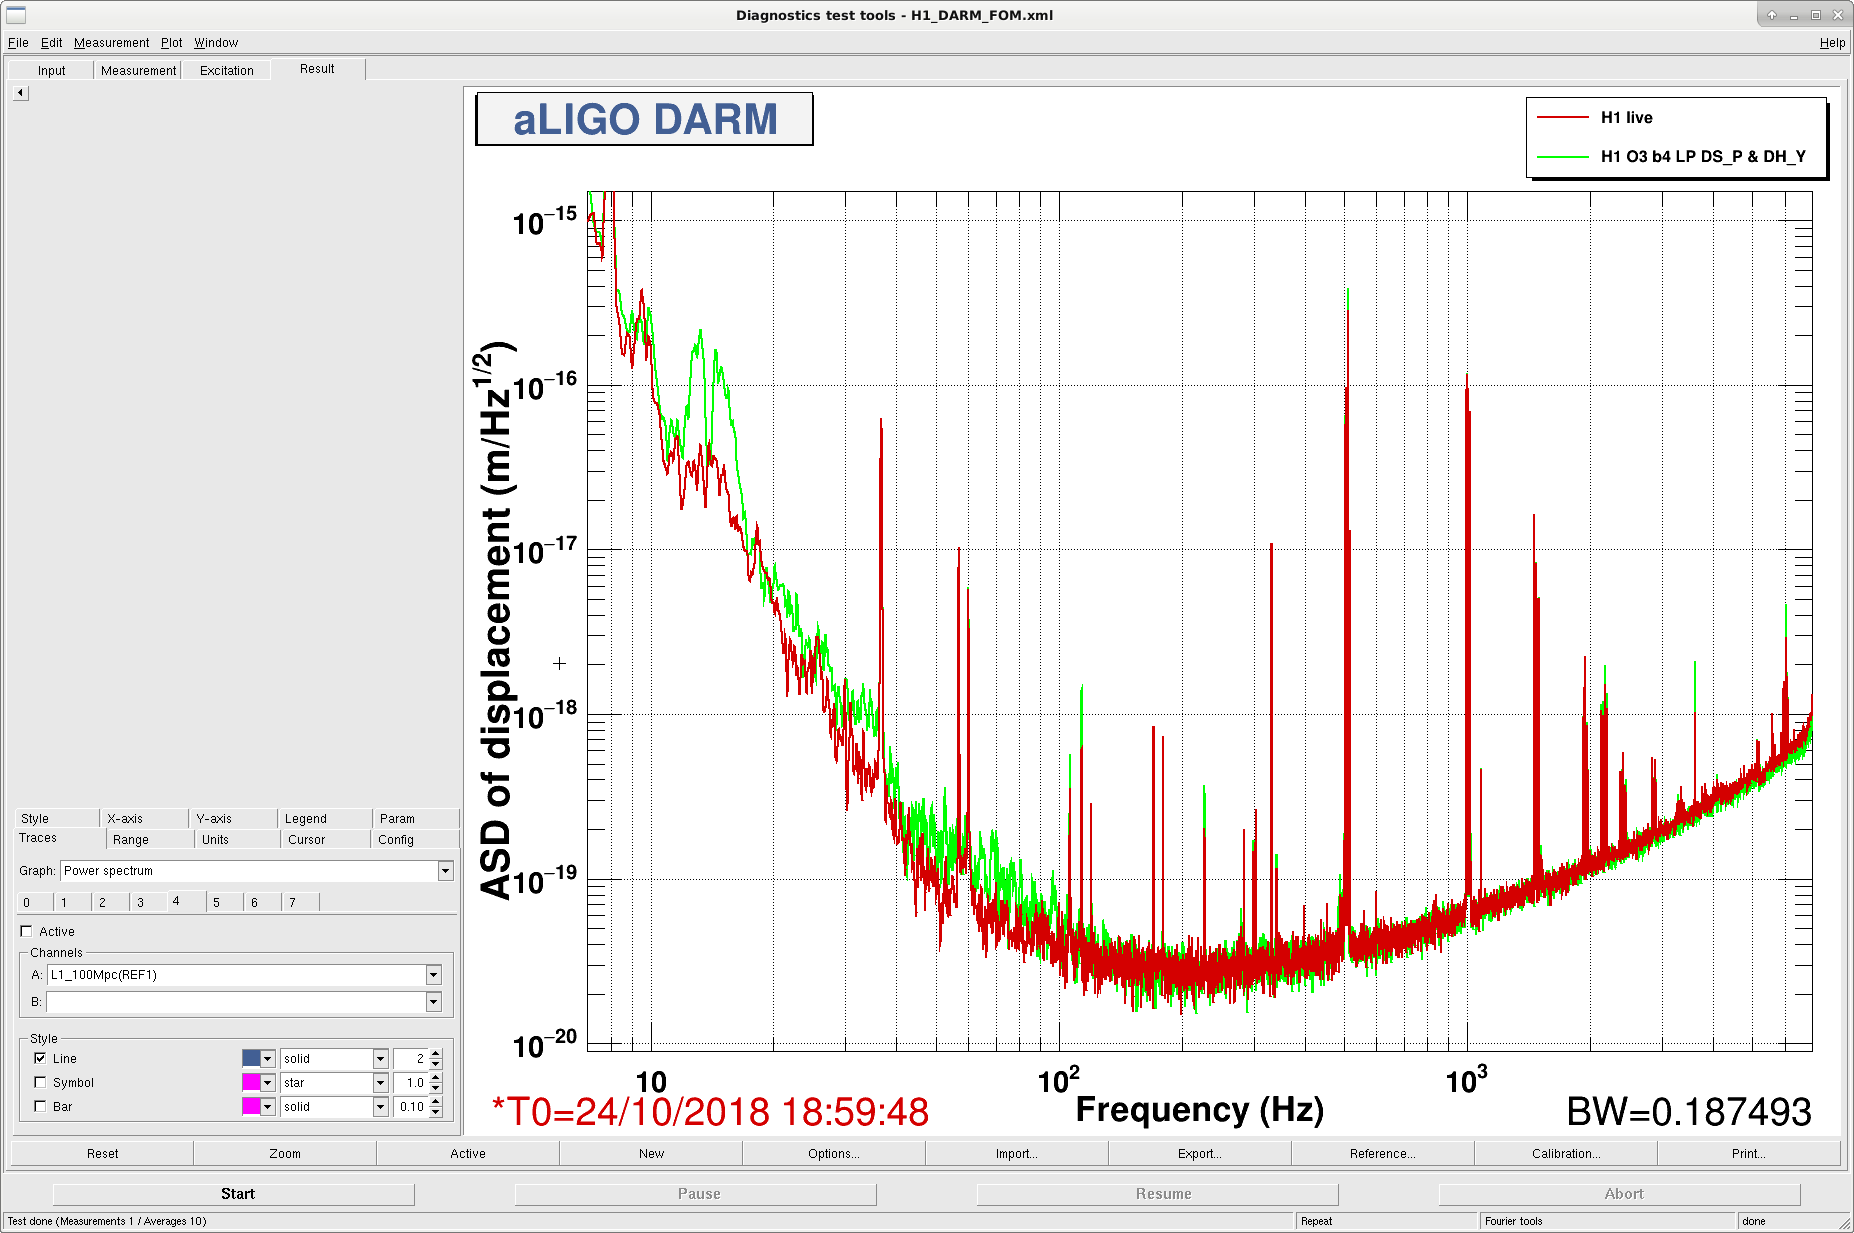
The first attachment shows a noise improvement up to 100 Hz. That is probably due to a time varying noise floor not the ASC cut offs, but it might be good to check with repeated on off tests.
In addition to Hang's study reported in 44780, here we show that
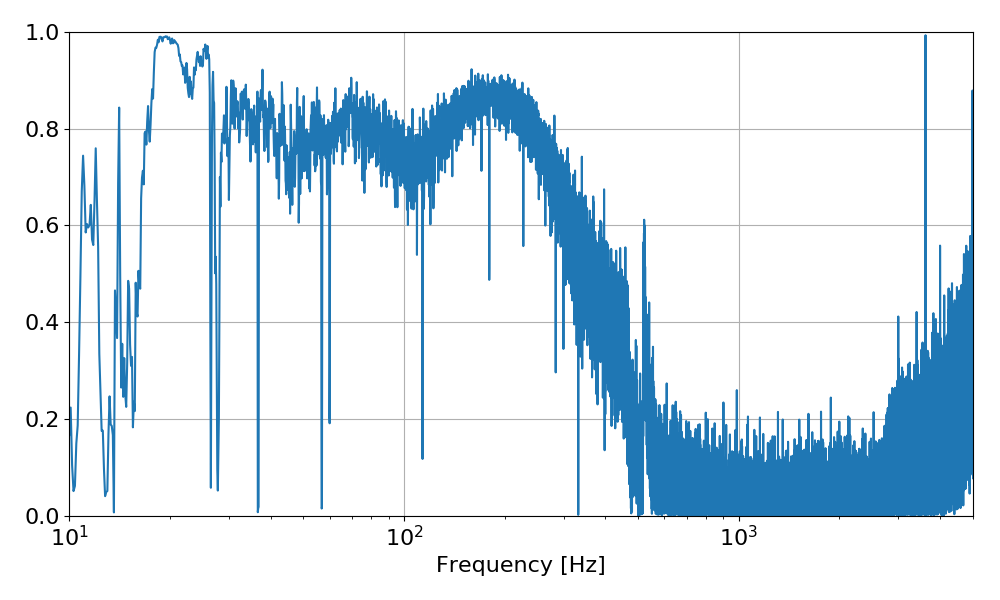
First of all, during the noise injection reported in 44772 (with MICH and SRCL feed forward on), we can see that DARM noise is largely increased, but the averaged coherence of DARM with SRCL is relatively low (0.8) considering that the noise dominates the DARM background by a large factor.
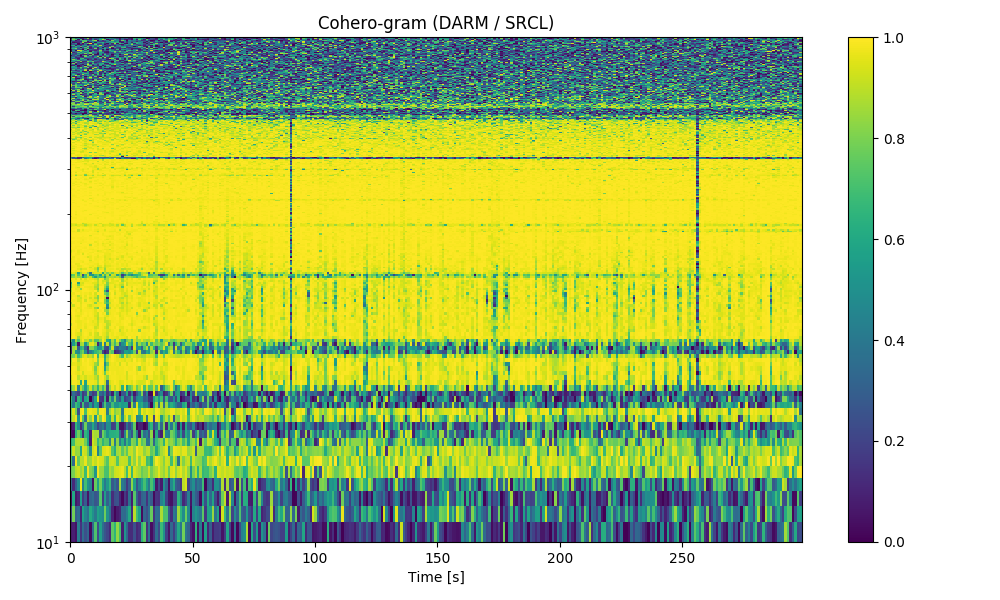
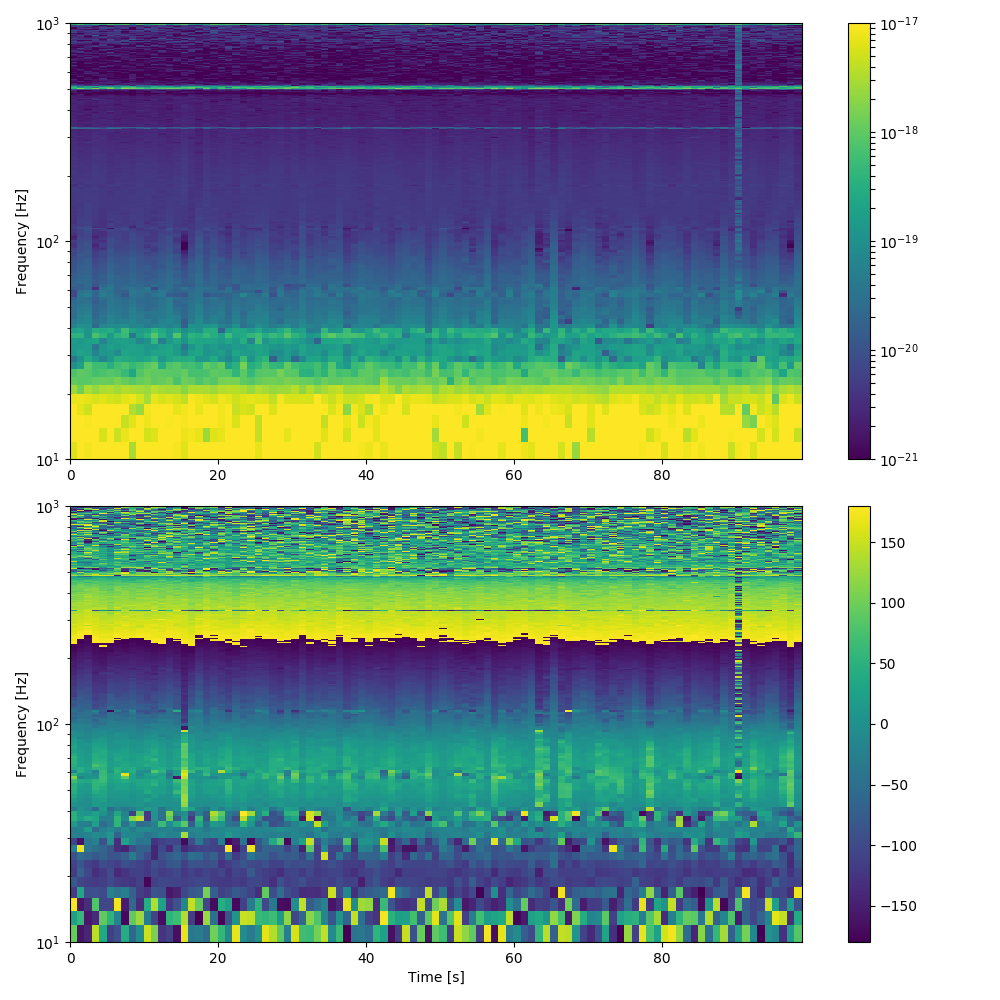
We can compute a "cohero-gram" and a 'transfer-function-gram" by computing the coherence and the transfer function over short times and stacking it up like a spectrogram:
Clearly the coherence is not constant, and sometime drops to zero, and also the transfer function shows variability. Note that those measurements are taken while injecting SRCL noise. We can also make an animation of the transfer function as time passes. This is shown in the attached movie file (I can't find an easy way to embed it here).
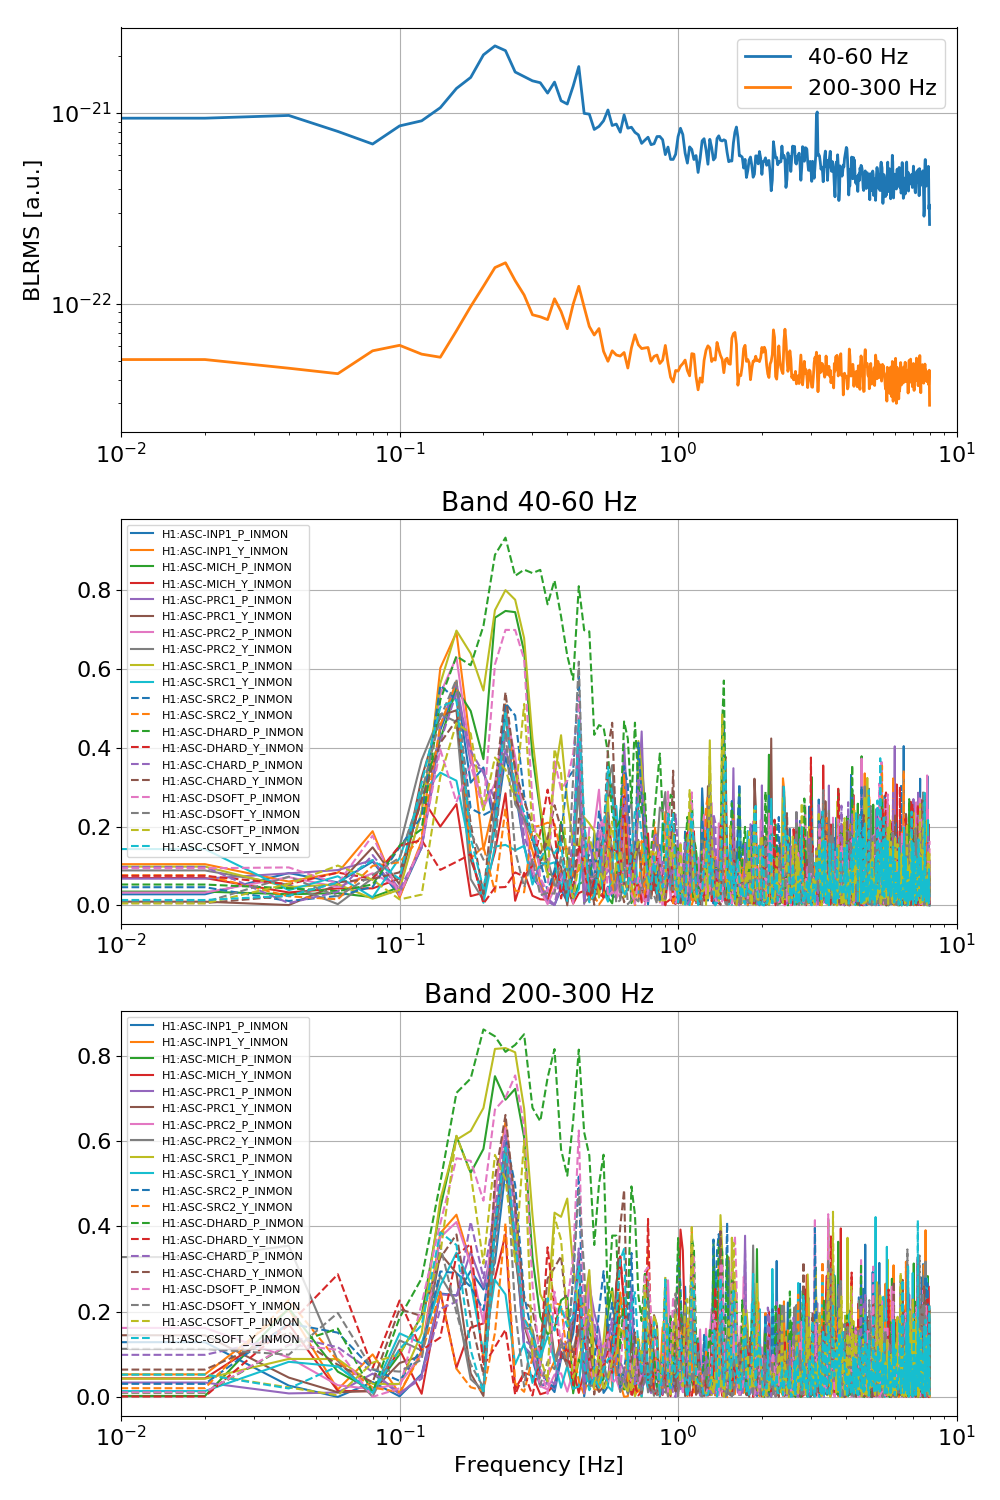
To be more precise, we can take the DARM band-limited RMS in the 40-60 Hz region (first component of the SRCL noise coupling) and in the 200-300 Hz region (second component of the SRCL noise coupling). Then we can compute the PSD os the band-limited RMS: this gives us an idea of what are the main frequencies at which the noise coupling changes. Moreover, we can compute the coherence of the BLRMS time series with all angular error signals, and found out which ones are the most important, as shown below
So it looks like that tightening the controls for DHARD_P, SRC1_P and MICH_P would help reducing the modulation of SRCL noise, and hence improve the feed-forward performance.
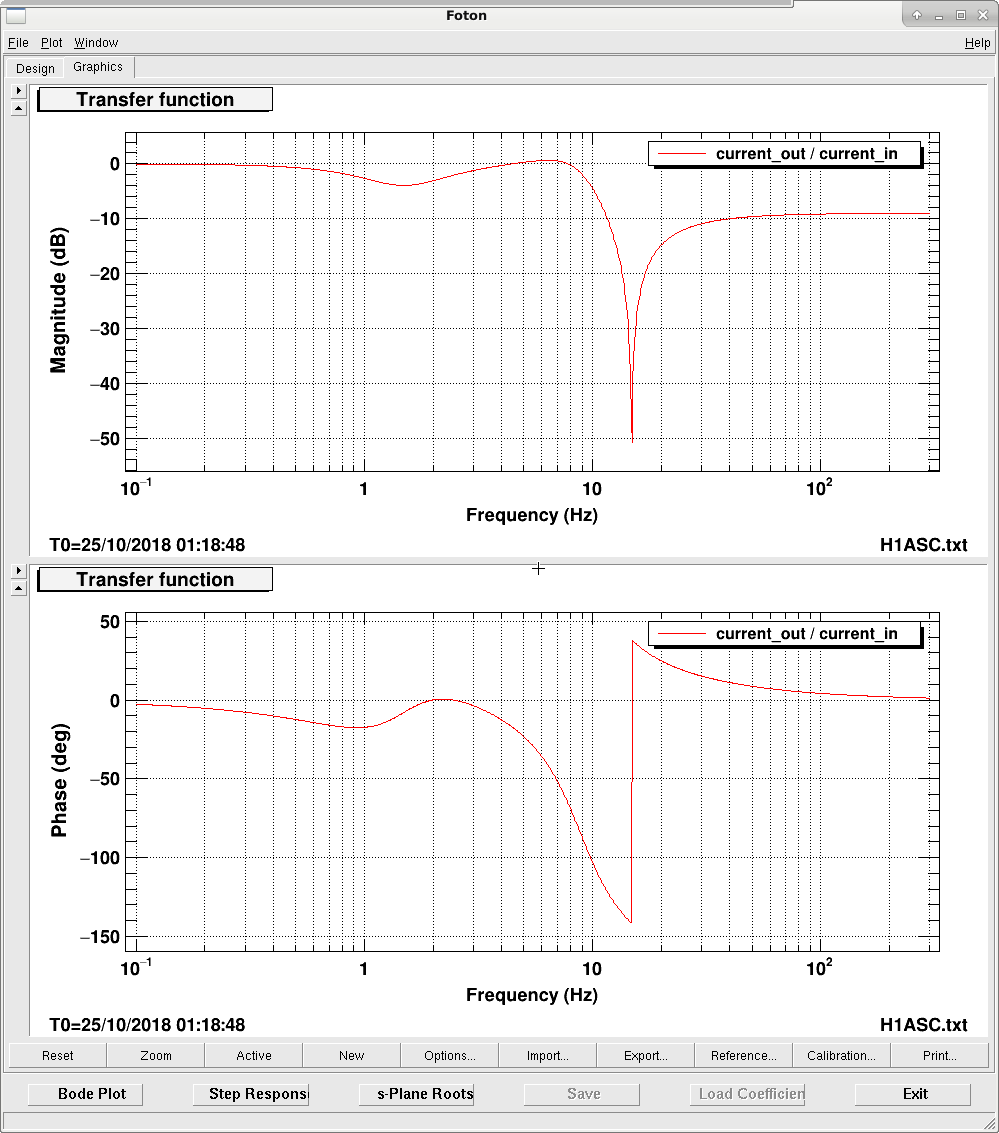
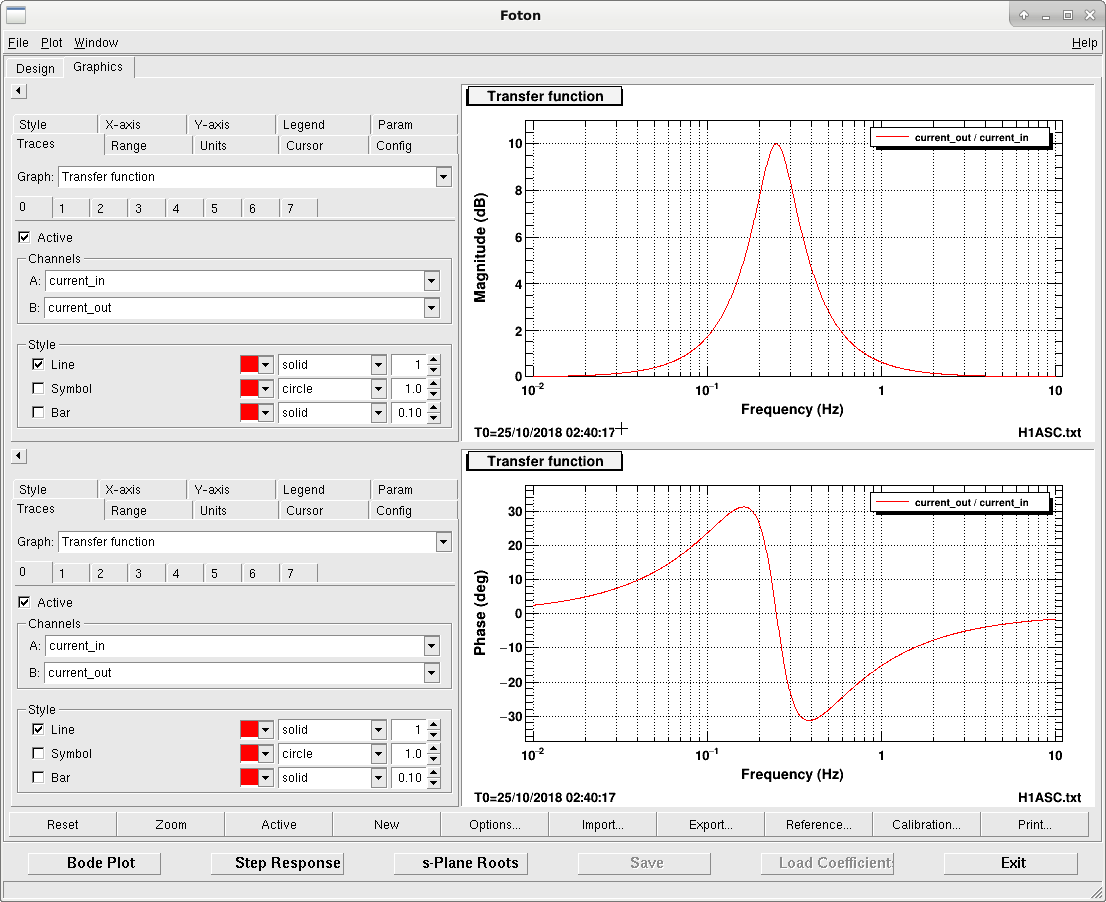
To reduce the DHARD PIT motion at the microseismic ~ 0.25 Hz, we added a resonant gain in the DHARD PIT filter bank (FM4).
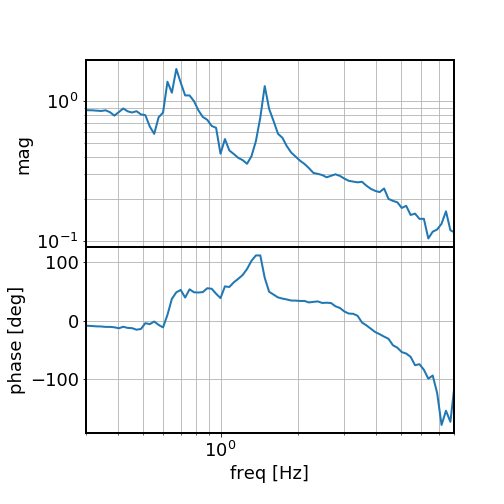
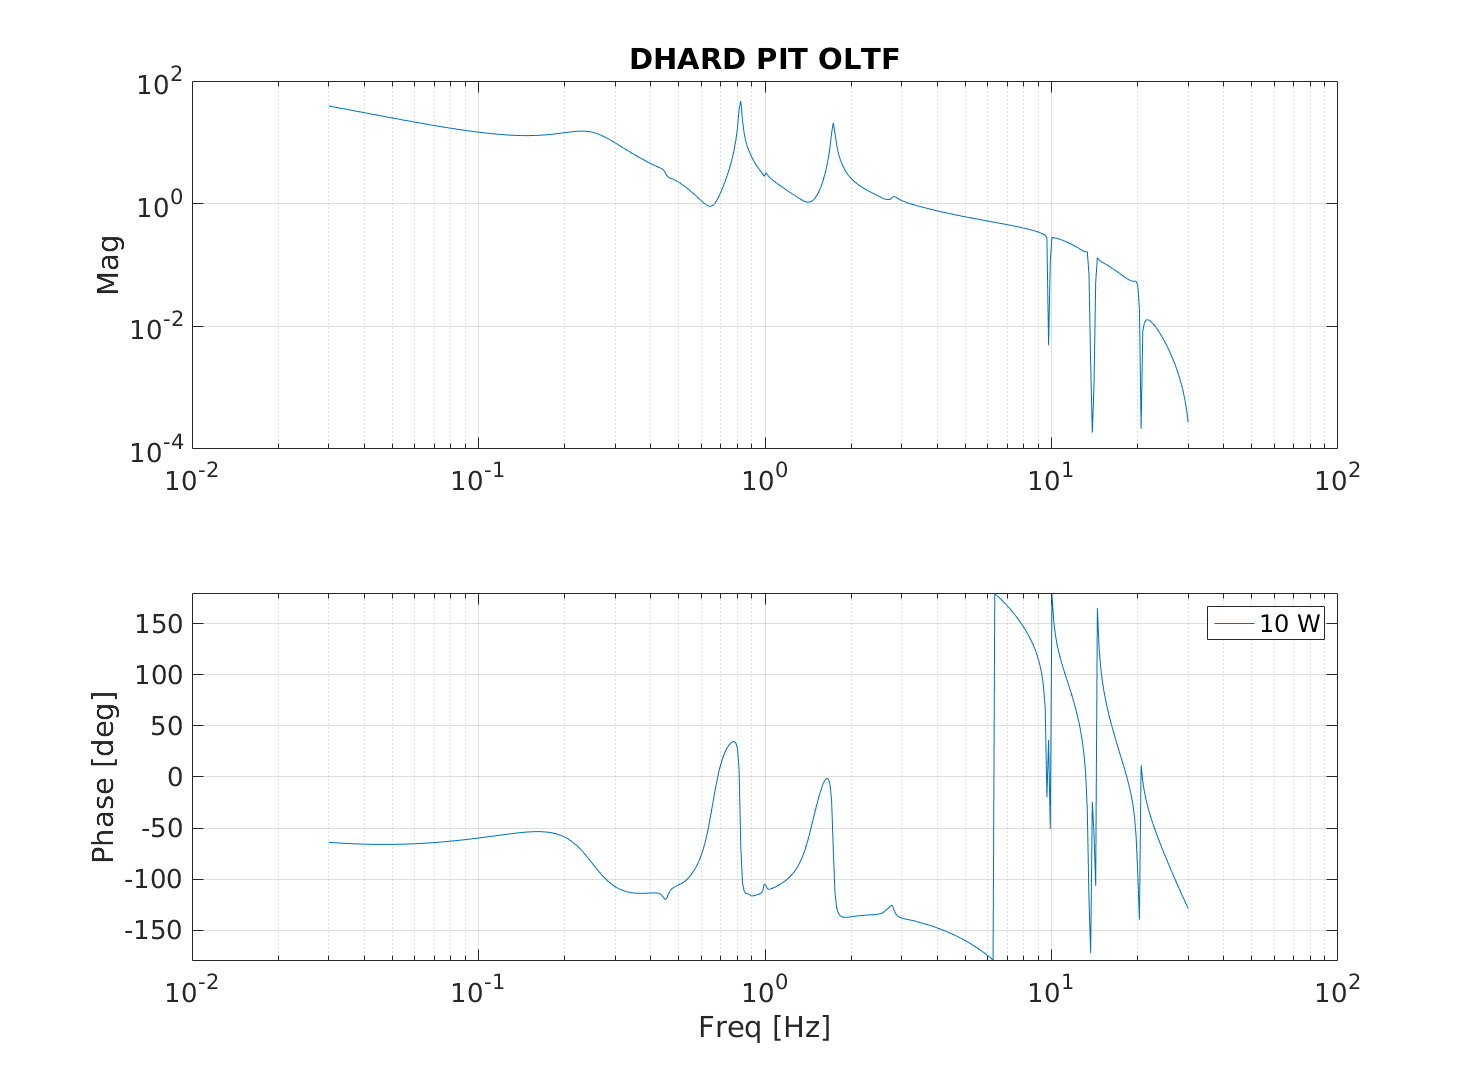
The filter shape is shown in the first attached plot. It gives 10 dB more gain at 0.25 Hz. We can engage the filter without causing any angular instabilities, which is consistent with our model prediction (Fig. 2).
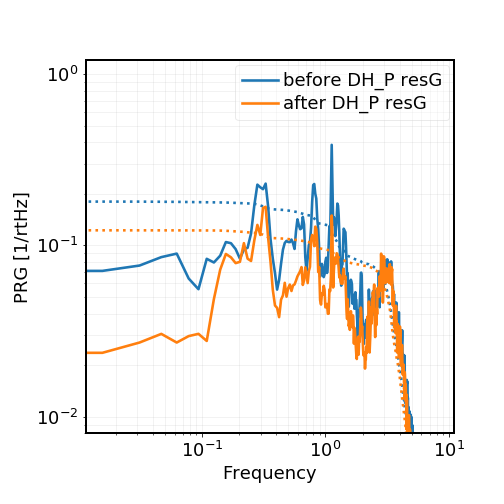
After turning on the res g, the interferometer seemed to be quieter w/ less power fluctuation (see Fig. 3).
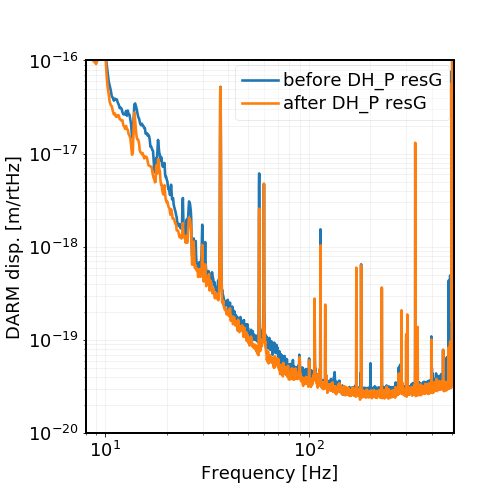
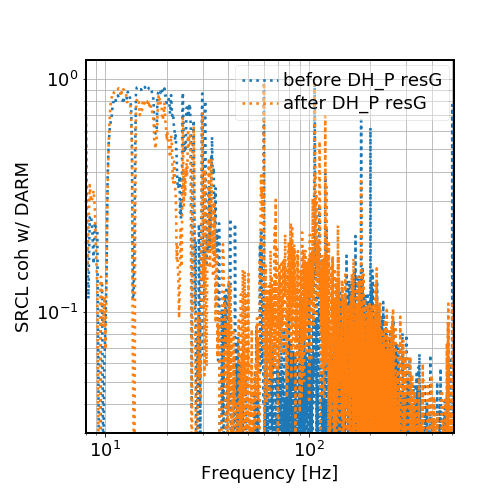
The DARM noise also seemed improved (Fig. 4), whereas for SRCL's linear coherence w/ DARM, we saw it reduced in the 10-30 Hz range but in the around 80 Hz band it seemed to get worse (Fig. 5). Nonetheless, in those bands the SRCL coupling is mostly nonlinear (or at least the coupling is non-stationary) so the linear coherence might not be representative.
The caveat is that for the last 3 figs, I only looked at 2 pieces of time: gps 1224465018 (before turning on res g) and gps 1224469218 (after res g), each lasts 512 sec. A more comprehensive study looking multiple times would be nice.
For a while this morning I wrote down times that I saw glitches, whether or not they saturated the ESD, that looked similar to me to the glitches that we gete when we have fast locklosses. It would be helpful if Team DetChar could look around to see if there are other channels that see the glitch, that could help us understand what is going on and where the glitch is coming from. A hypothesis is that this could be a family of similar-looking glitches that sometimes cause lockloss, and sometimes don't. But, since these fast locklosses are one of our big limitations to how long the H1 IFO can stay locked, we need to figure them out.
Times are in UTC on 24 Oct 2018, glitches happened within 1 minute prior.
14:52 (This one I looked at very briefly - it's at 1224427963-0.18 sec. I see a small glitch in DARM_OUT and in the EX ESD)
15:01, 15:08, 15:13, 15:13 later in the same minute, 15:15, 15:17, 15:42, 15:58, somewhere btwn 16:04-16:07 there is a glitch, 16:27, 17:56, 18:13
At 18:14 we had a lockloss, and it could have been one of our mysterious fast ones, which could just be a larger version of this family.
I'll look more into this tomorrow if no one from DetChar is available.
Thanks for pointing to these glitch times, Jenne! Just to let you know, a few of us from DetChar have started looking into them, and we'll hopefully have more to report tomorrow.
I took a look for glitches in a 2 minute window around the times Jenne points out. Since most of the times Jenne posted pointed to obvious loud glitches, that's what I started looking for. I couldn't find anything similar to this for around 15:08, 15:13 and 15:15 though. For the rest of the times I found rather loud glitches, however they don't all look the same. Most are clearly overflows (if you just look at the spectrograms). Below I list the times of the glitches I found, and if an overflow which model it points to (sorry I'm rubbish at parsing simulink). I got the overflow information from the summary pages:
1224427963.30 - overflow in 98 2_0,3 (UR and LR ETMY L2 coil) and 88 3_1-4 (all quadrants of ETMX ESDs)
1224428469.55 - overflow in 98 2_0,3 (UR and LR ETMY L2 coil) 88 3_1-4 (all quadrants of ETMX ESDs), 10 0_12,13 (LSC) and 8 0_12,13 (OMC length dithers)
1224429544.87
1224430949.50 - overflow in 88 3_1-4 (all quadrants of ETMX ESDs)
1224431938.35 - overflow in 88 3_1-4 (all quadrants of ETMX ESDs)
1224432254.1 - overflow in 8 2_18 (OMC)
1224432439.6
1224433667.31 - overflow in 98 2_0-3 (all quadrants of ETMY L2 coils) and 88 3_1-4 (all quadrants of ETMX ESDs)
1224439031.89 - overflow in 98 2_0-3 (all quadrants of ETMY L2 coils) 88 3_1-4 (all quadrants of ETMX ESDs), 10 0_12,13 (LSC) and 8 0_12,13 (OMC length dithers)
1224440021.65 - overflow pretty much everywhere. This is ~63 seconds before a lockloss (98 2_0-3 (SUSETMY), 88 2_0-3, 88 3_1-4 (SUSETMX), 30 2_0-4 (SUSITMY), 29 2_4-9 (SUSITMX), 19 1_8-15, 19 24-31 (ASC), 10 0_7 (LSC), 8 0_7 (OMC)
Jonathan, Dave:
Yesterday we found that 3 of the beckhoff SDF faux-models were in an unresponsive state. It would appear that they run well for a while and break some time later.
Since this is a 'silent' failure (MEDMs show last good data) I am running a script (verify_beckhoff_sdf_is_working.py) once an hour which changes the displayed table from DIFFS to FULL-TABLE and back to DIFFS, verifying the number of displayed items change. If this switching becomes a nuisance I can reduce the test frequency.
The script is running in a tmux session on zotws6 for now. No failures on any node so far after over 24 hours of testing.
TITLE: 10/24 Day Shift: 15:00-23:00 UTC (08:00-16:00 PST), all times posted in UTC
STATE of H1: Commissioning
INCOMING OPERATOR: None
SHIFT SUMMARY: Commissioning continues.
LOG: See attached
This morning I ran my A2L decoupling script. Results are below
H1:SUS-ITMX_L2_DRIVEALIGN_P2L_GAIN OLD = -1.9978 NEW = -2.1862
H1:SUS-ITMY_L2_DRIVEALIGN_P2L_GAIN OLD = -0.9144 NEW = -1.0859
H1:SUS-ETMX_L2_DRIVEALIGN_P2L_GAIN OLD = +4.3666 NEW = +3.9067
H1:SUS-ETMY_L2_DRIVEALIGN_P2L_GAIN OLD = +3.6086 NEW = +2.9830
H1:SUS-ITMX_L2_DRIVEALIGN_Y2L_GAIN OLD = -0.4938 NEW = -0.3852
H1:SUS-ITMY_L2_DRIVEALIGN_Y2L_GAIN OLD = +0.5500 NEW = +0.4461
H1:SUS-ETMX_L2_DRIVEALIGN_Y2L_GAIN OLD = +2.6323 NEW = +2.7184
H1:SUS-ETMY_L2_DRIVEALIGN_Y2L_GAIN OLD = +3.2478 NEW = +2.9410
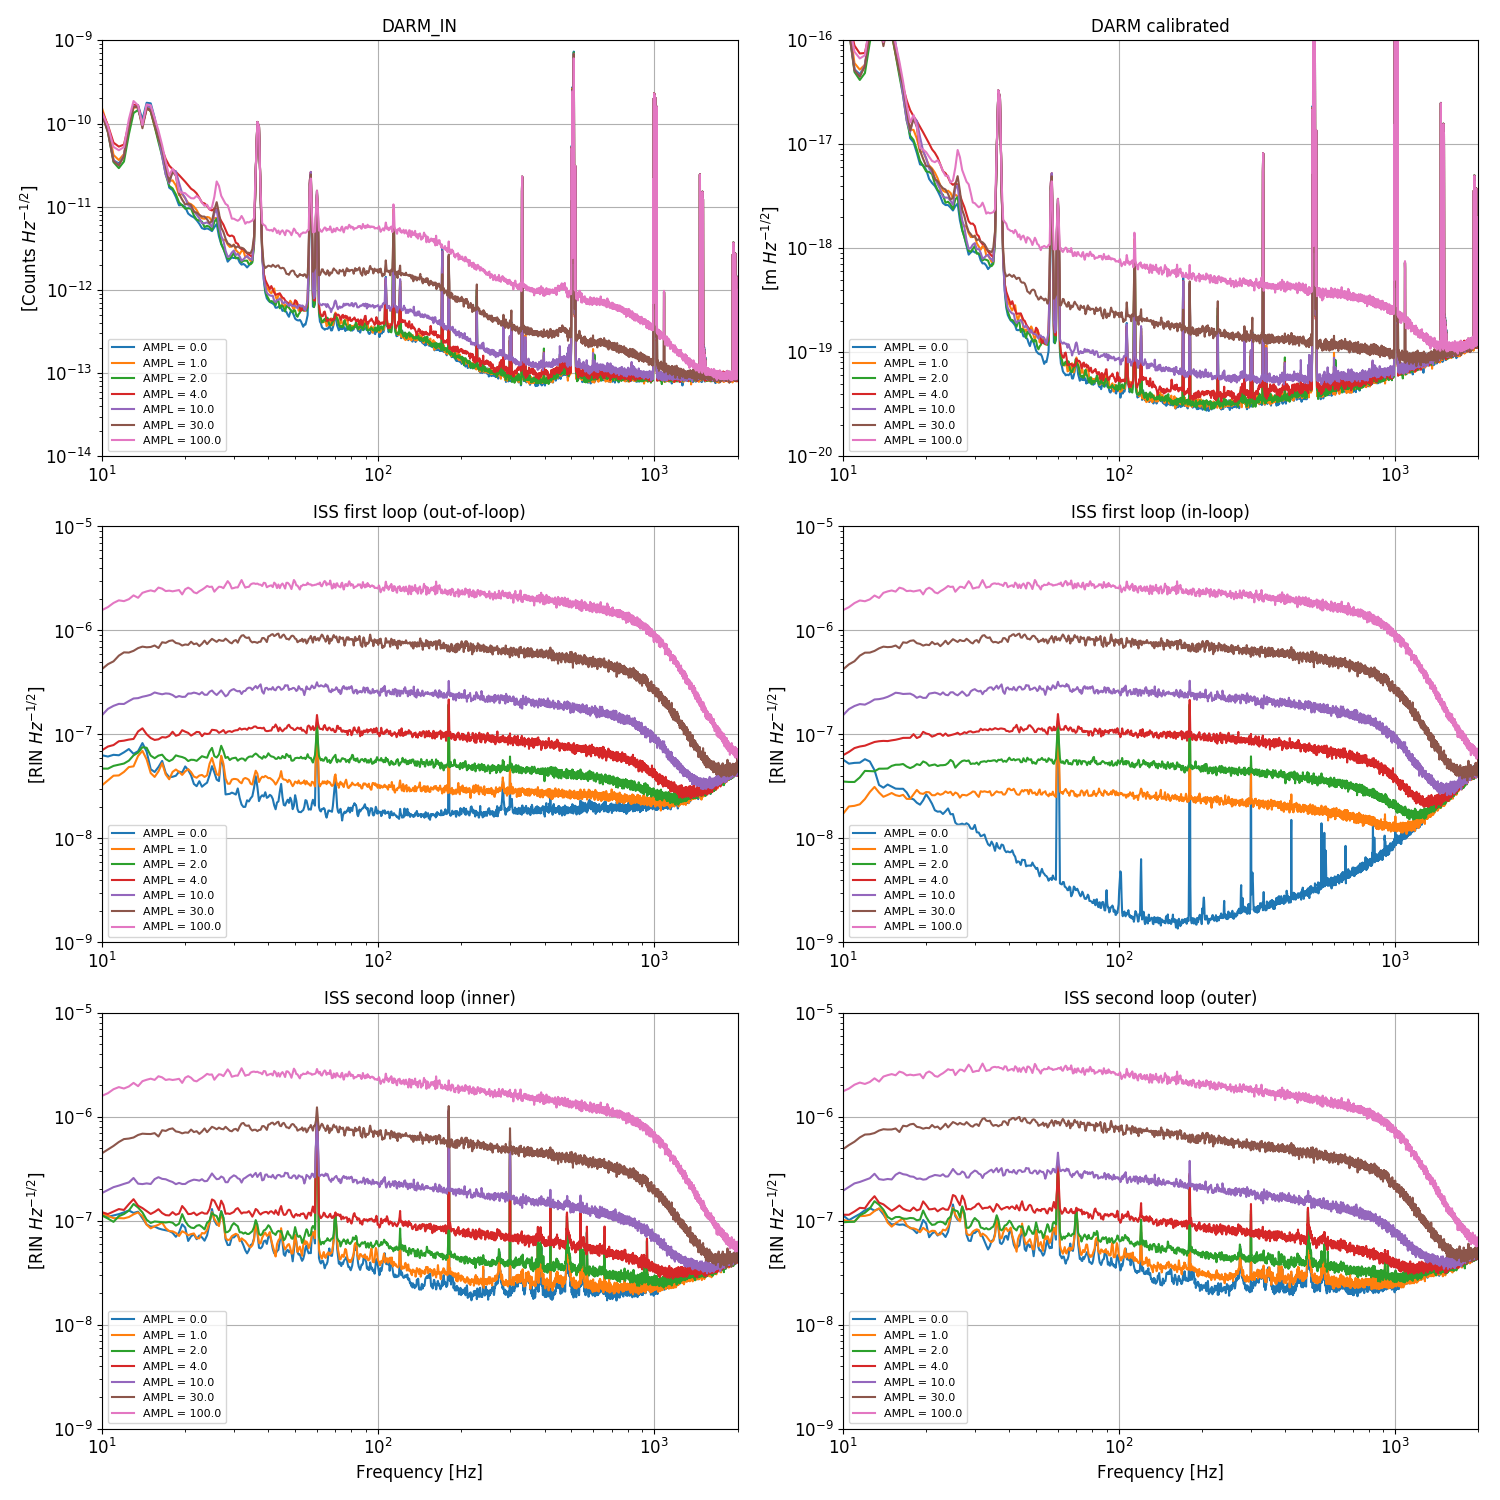
To investigate further the excess noise described in 44779, I performed some intensity noise injection, using the digital excitation path of the ISS second loop, with the ISS second loop open, but the ISS first loop closed.
In summary, the coupling of intensity noise does not show any significant non linear or non stationary coupling, and the projected level is below the measured DARM sensitivity. Therefore the increase of noise described in 44779 is not compatible with the hypothesis that it's intensity noise.
Details
Injection times are below. Using a filter butter("BandPass",4,10,1000)zpk([10],[100],1,"n")
no noise 1224437621 1224437742
ampl 1.0 1224437764 1224437884
ampl 2.0 1224437901 1224438034
ampl 4.0 1224438051 1224438171
ampl 10.0 1224438184 1224438304
ampl 30.0 1224438322 1224438423
ampl 100.0 1224438433 1224438556
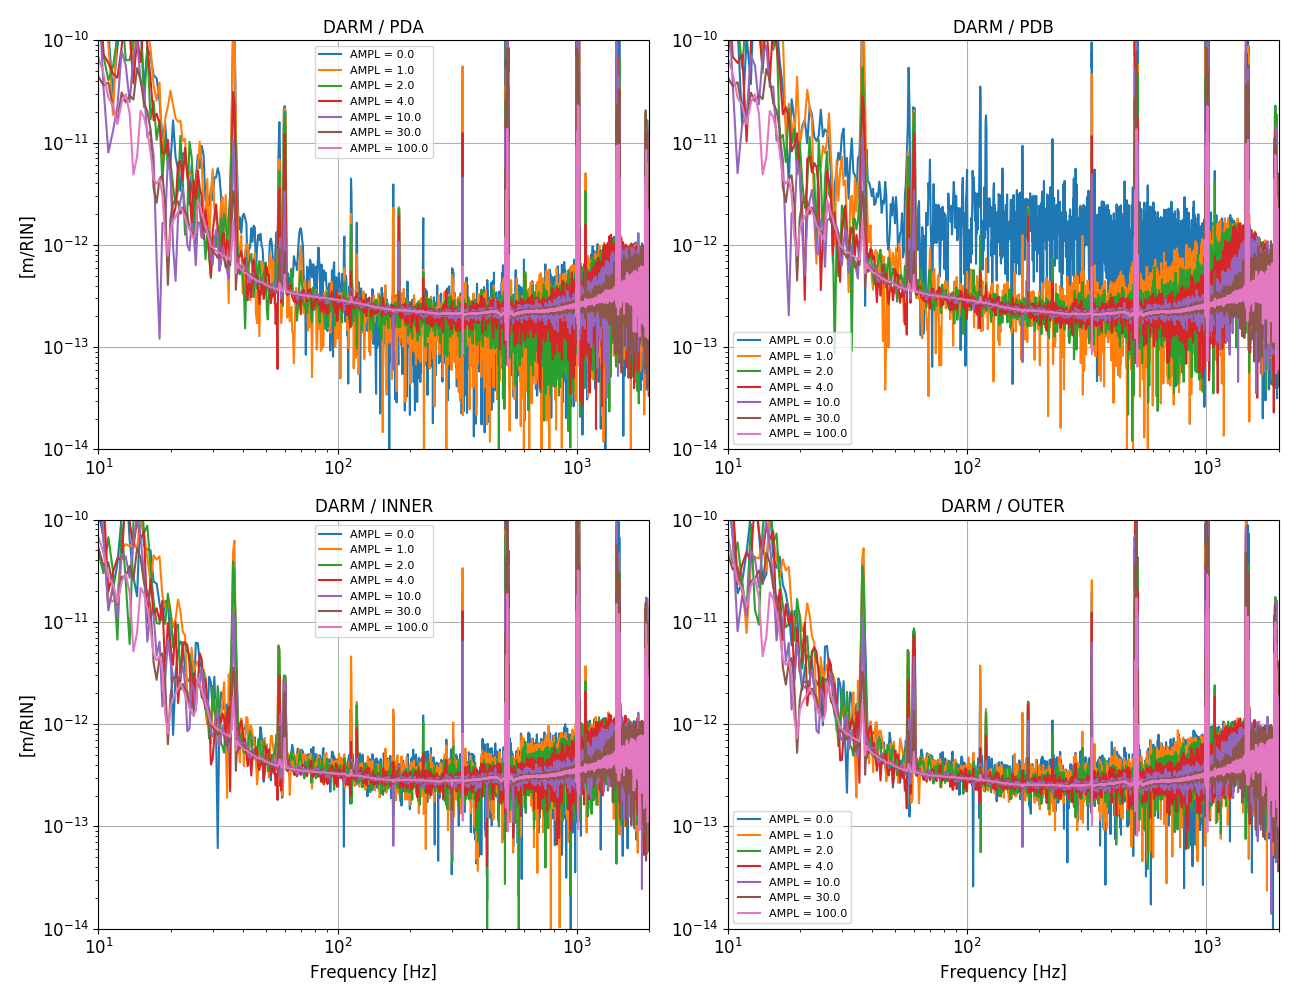
The first attached plot shows various signals during the quiet period and the injections. The noise is very well visible in all ISS first and second loop signals. The coherence with DARM is shown in the second attachment, and it increases with amplitude as expected. The third attachment shows that the transfer function is the same for all amplitudes, so there's no sign of non linearities.
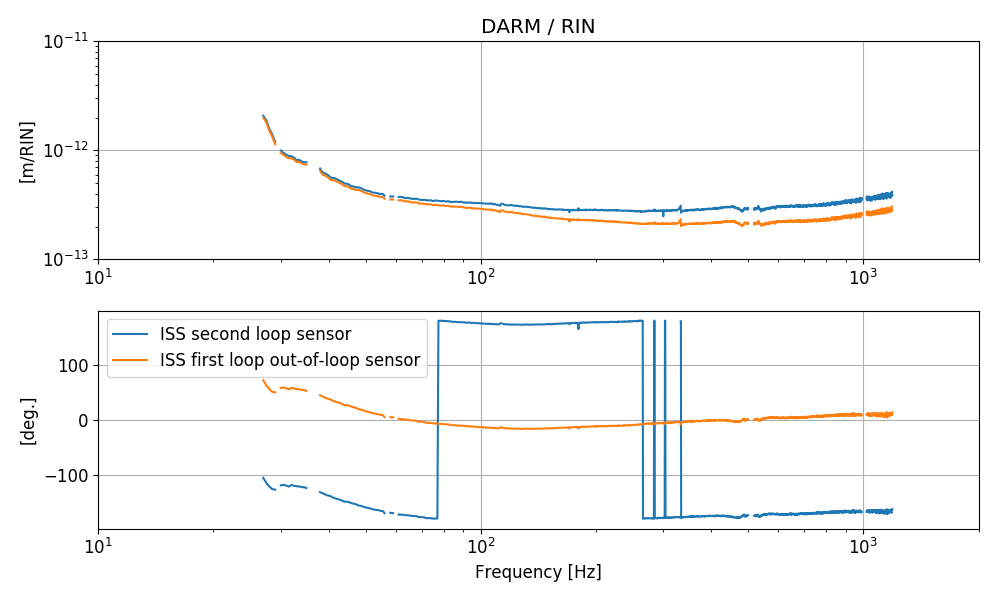
The transfer function DARM / RIN (measured either at ISS second loop signal or at the ISS first loop out-of-loop sensor) is shown below (and data is attached as an ASCII file. Format: 5 columns, frequency, real and imaginary part of DARM/ISS_secondloop, real and imaginary part of DARM/ISS_firstloop, NaN where the measurements had no coherence).
Using those transfer functions I projected the RIN in normal conditions into DARM. The result is shown below. There is more noise in the ISS second loop signal, so that projection is higher.
Intensity noise is about a factor of 5 lower than the measured DARM.
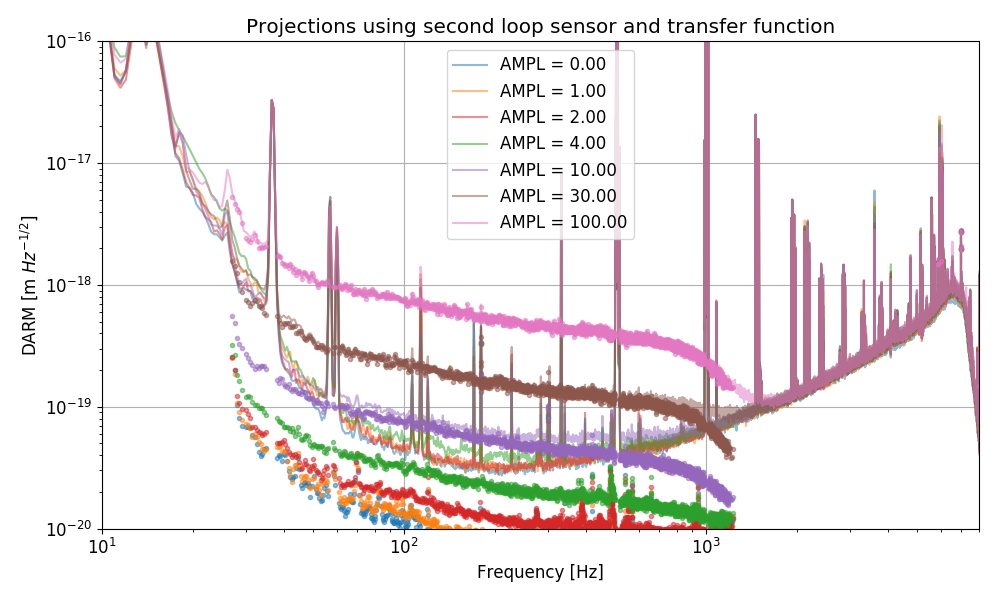
The last attached plot shows the projection into DARM using the ISS second loop transfer function, during the noise injections. The DARM noise levels are predicted correctly, so again there's no sign of large non linear behaviors.
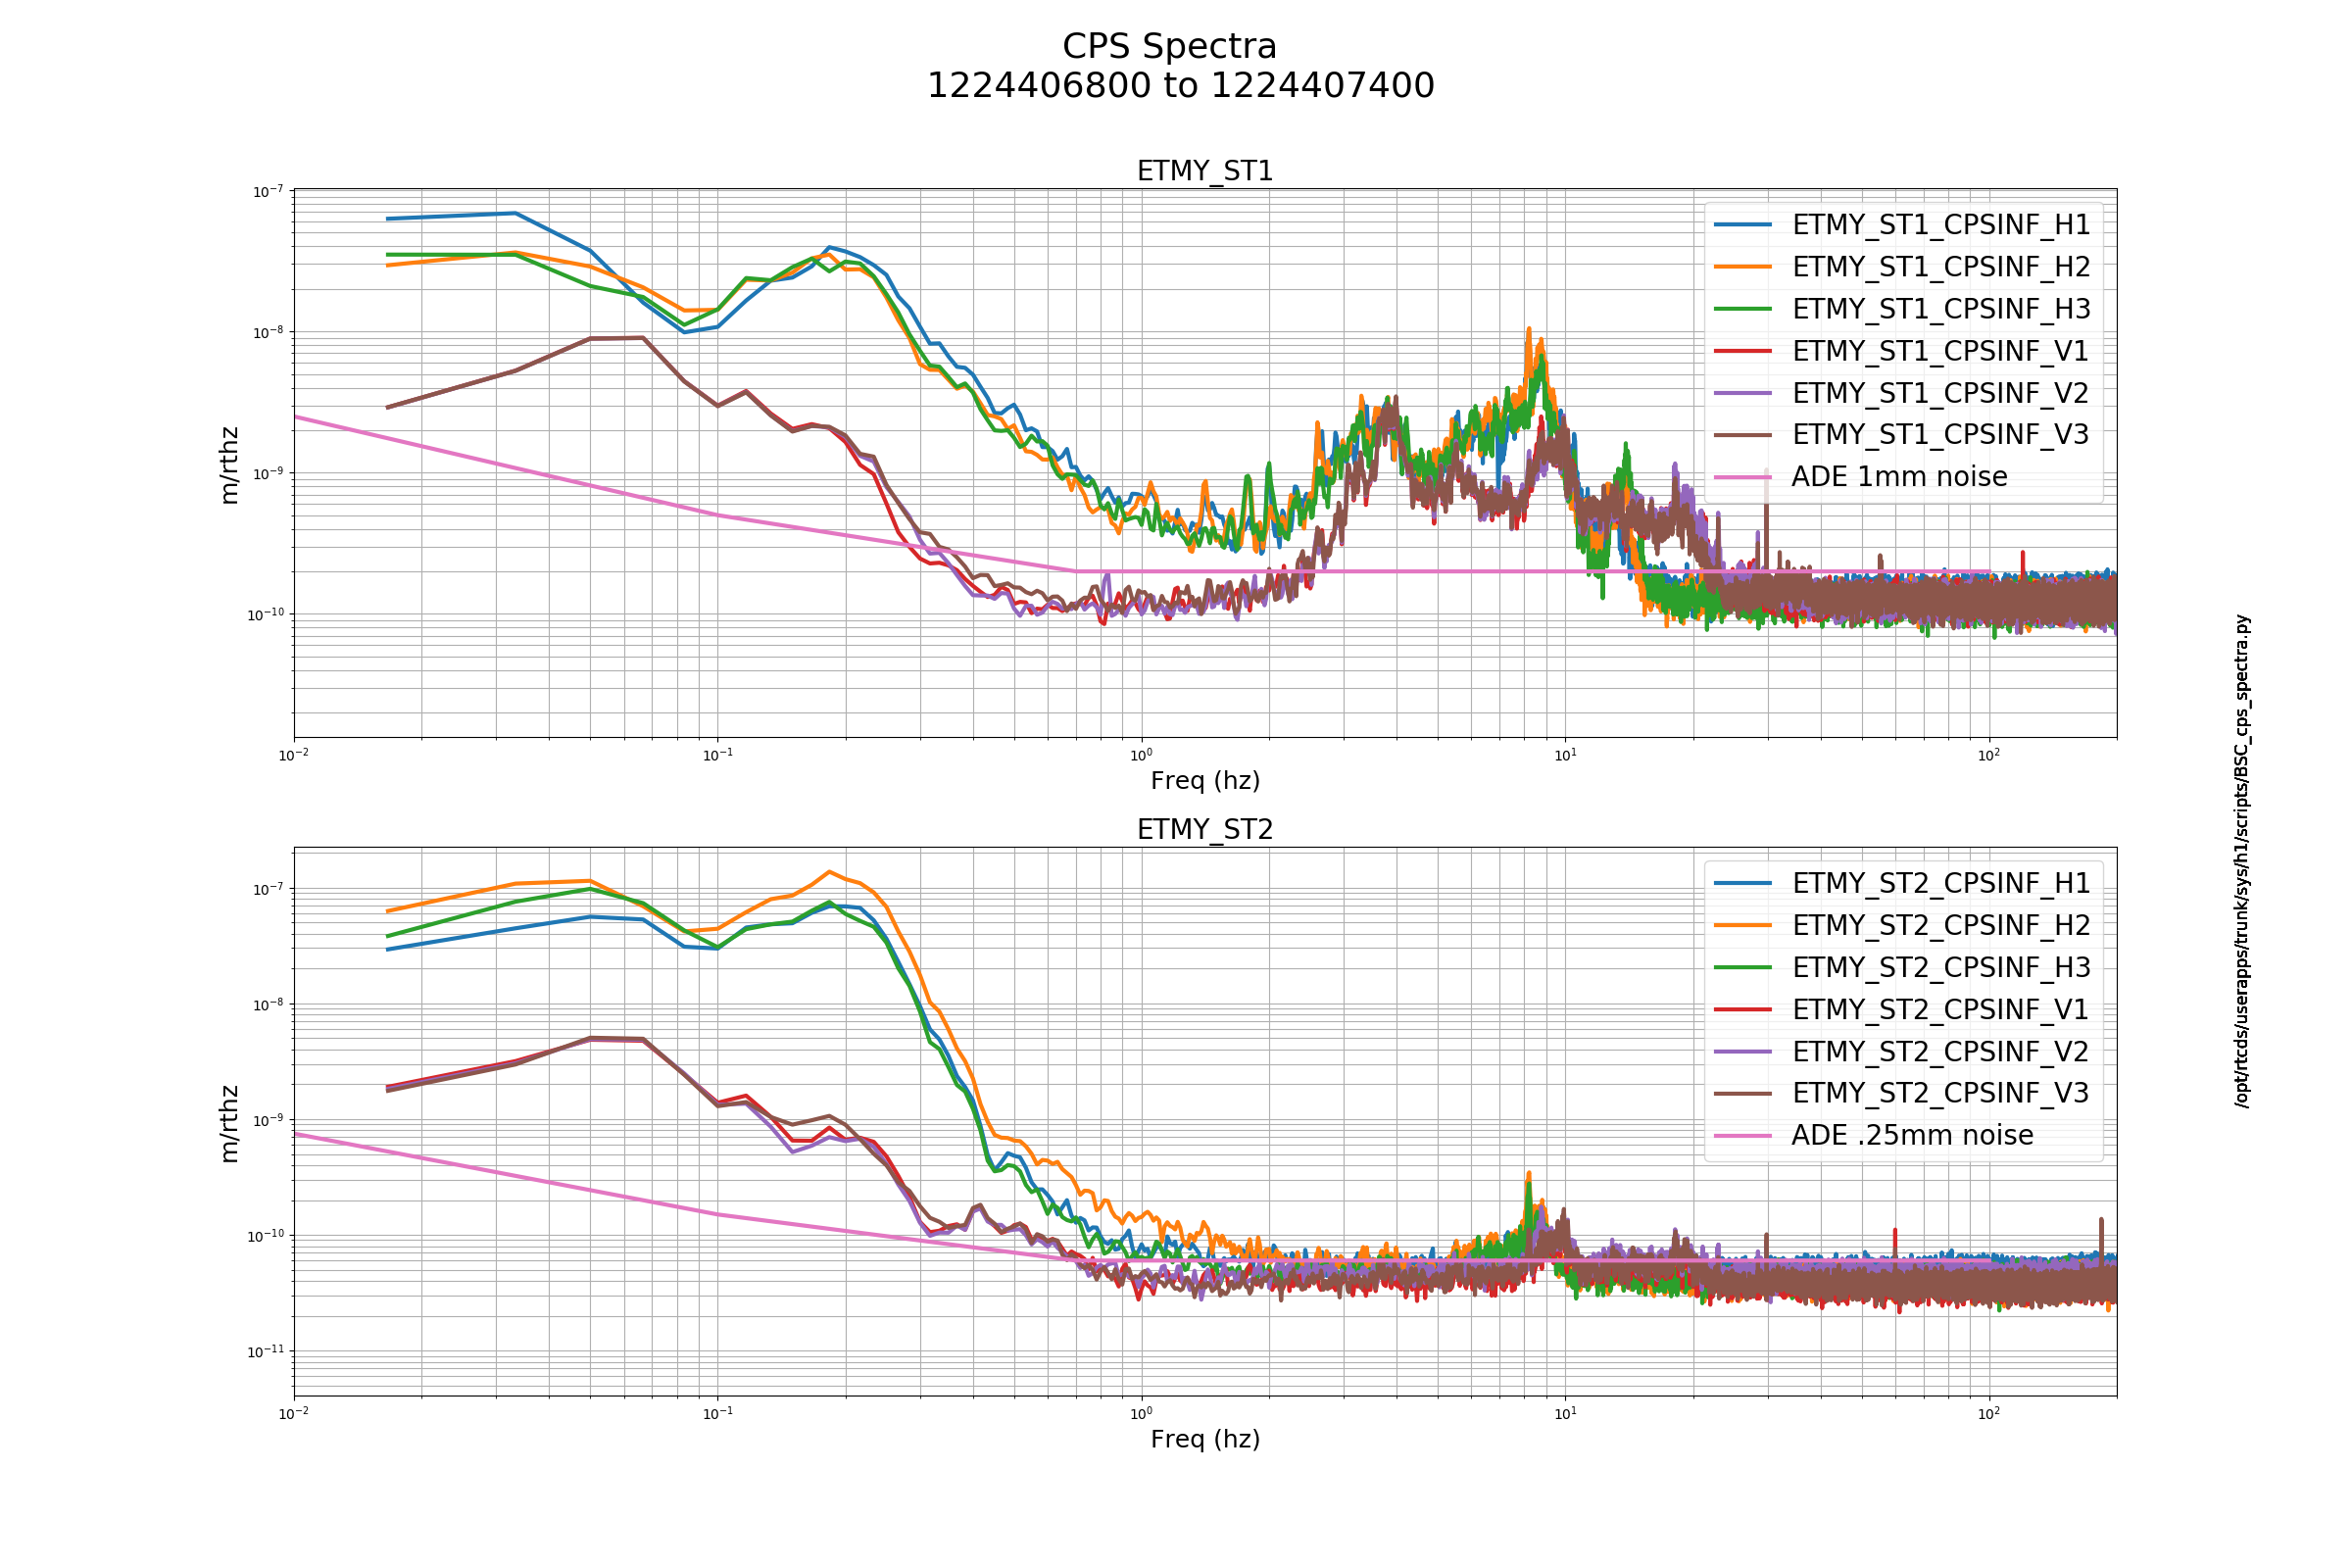
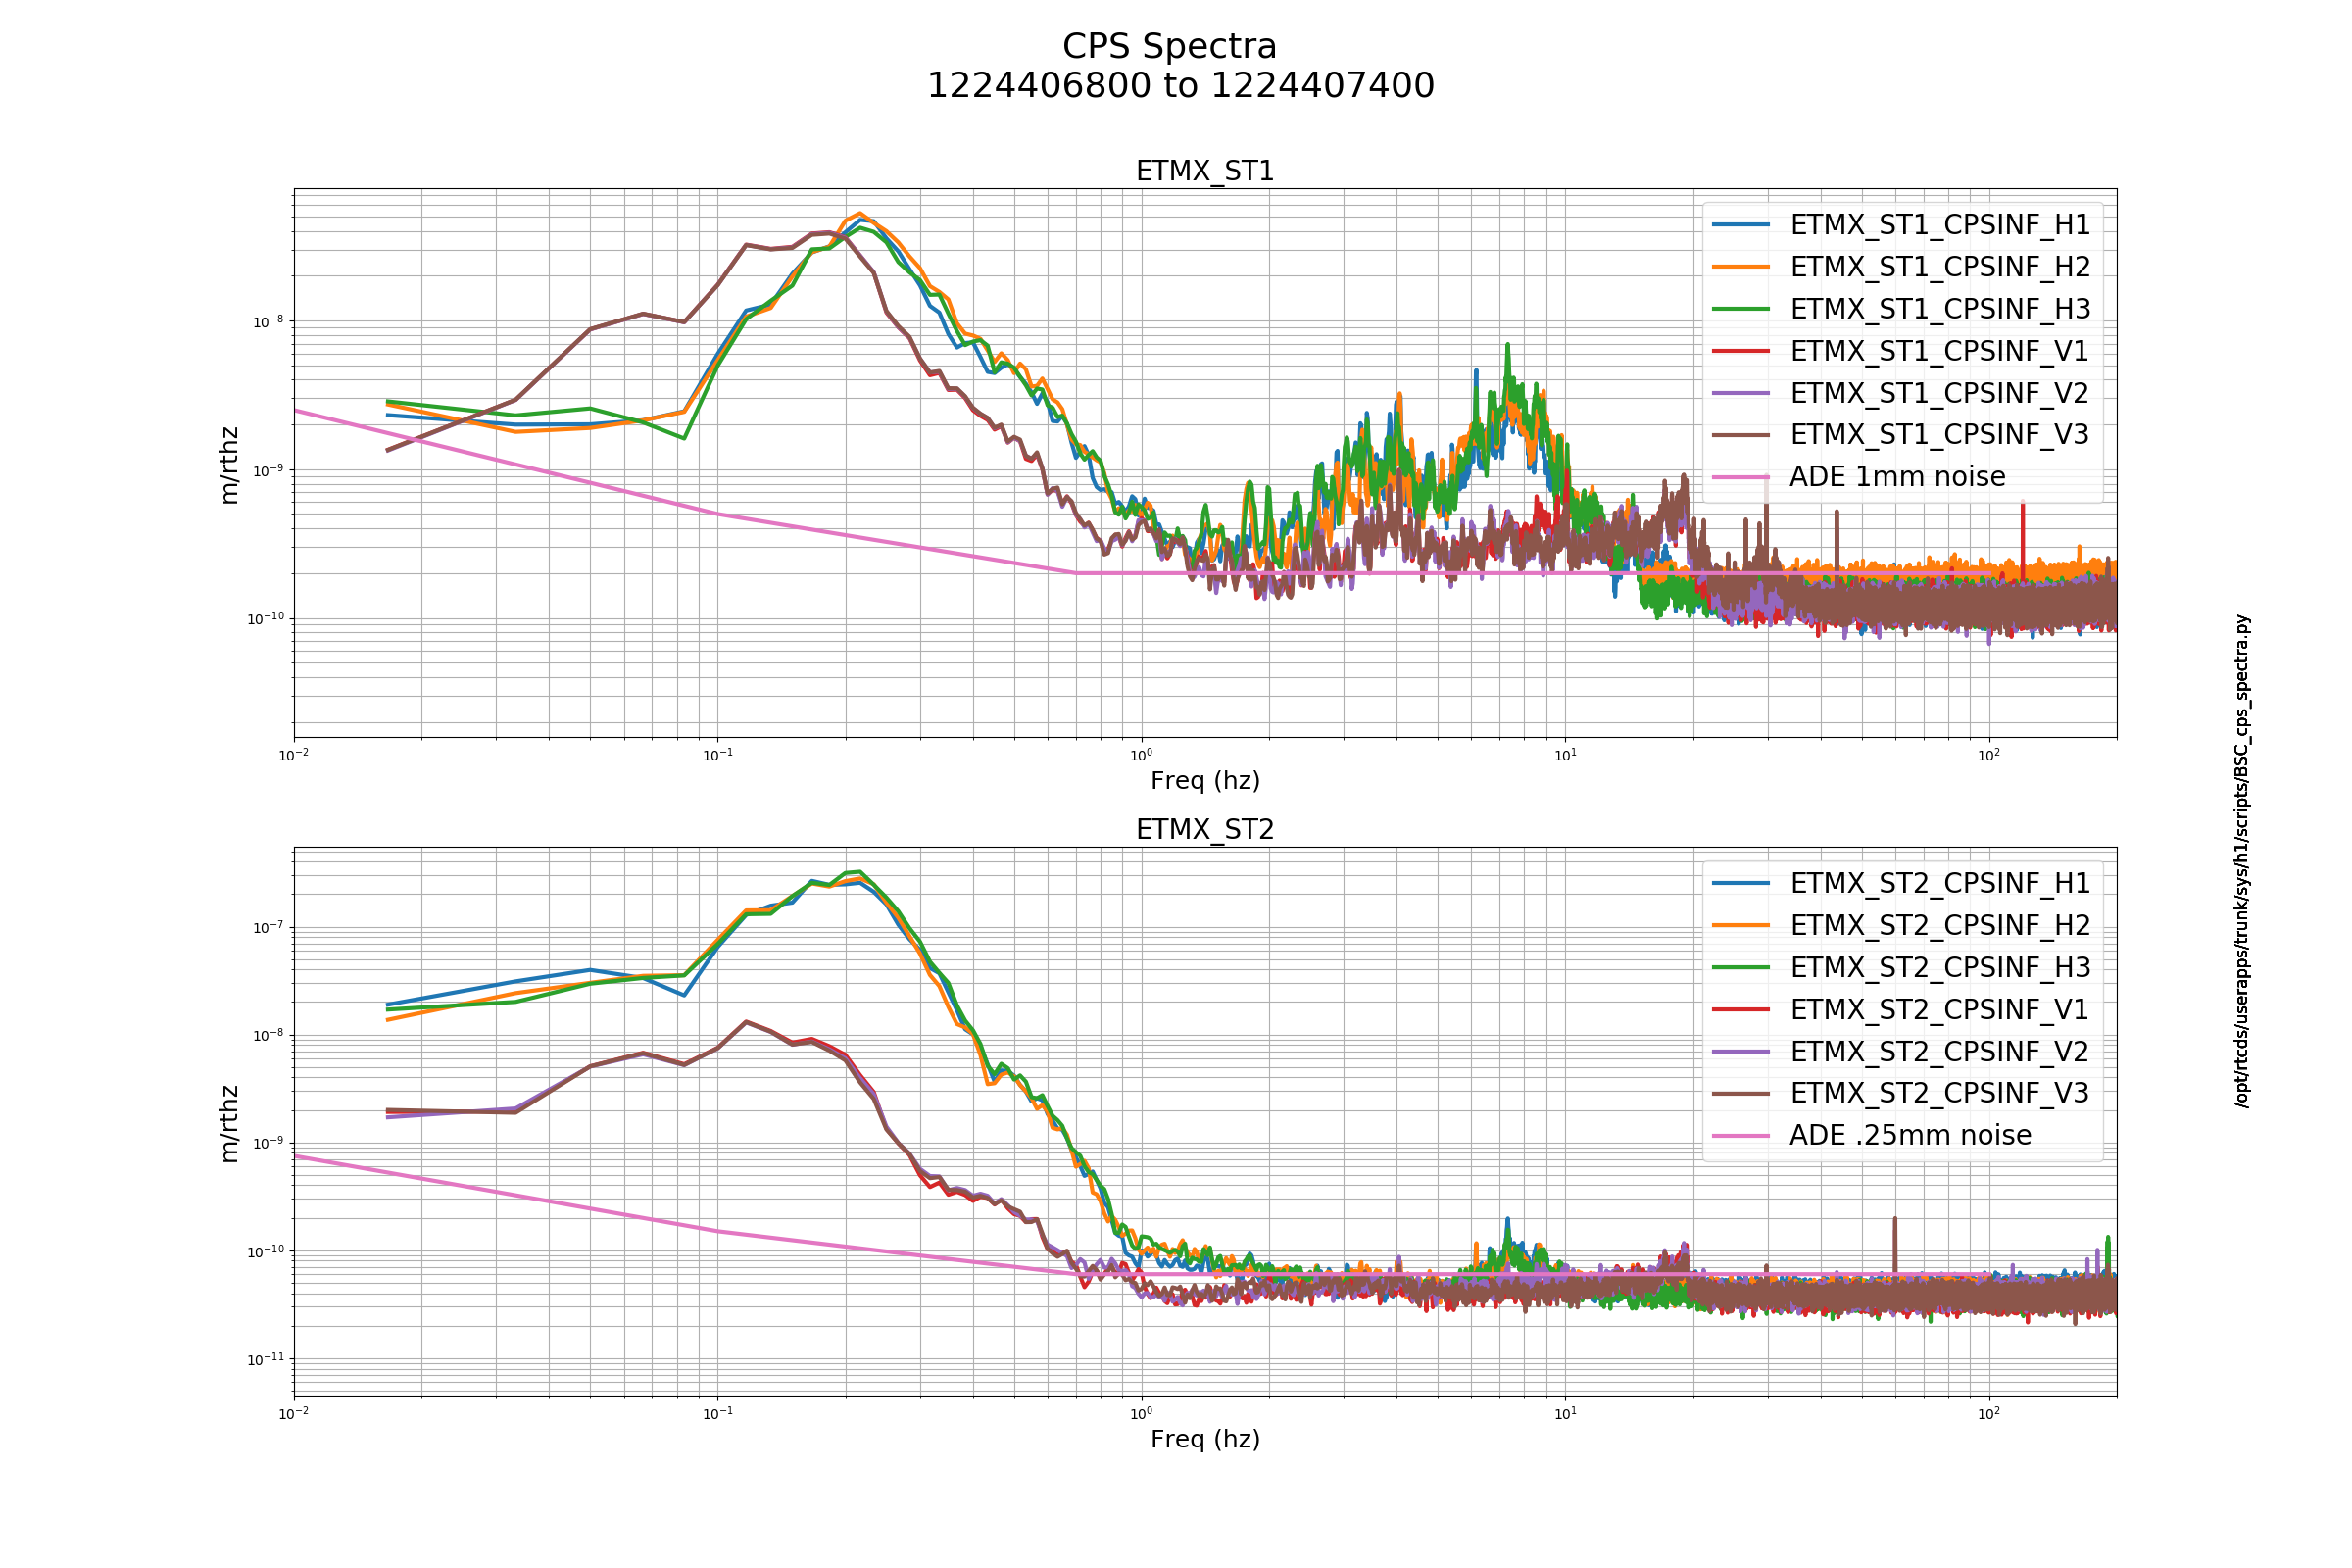
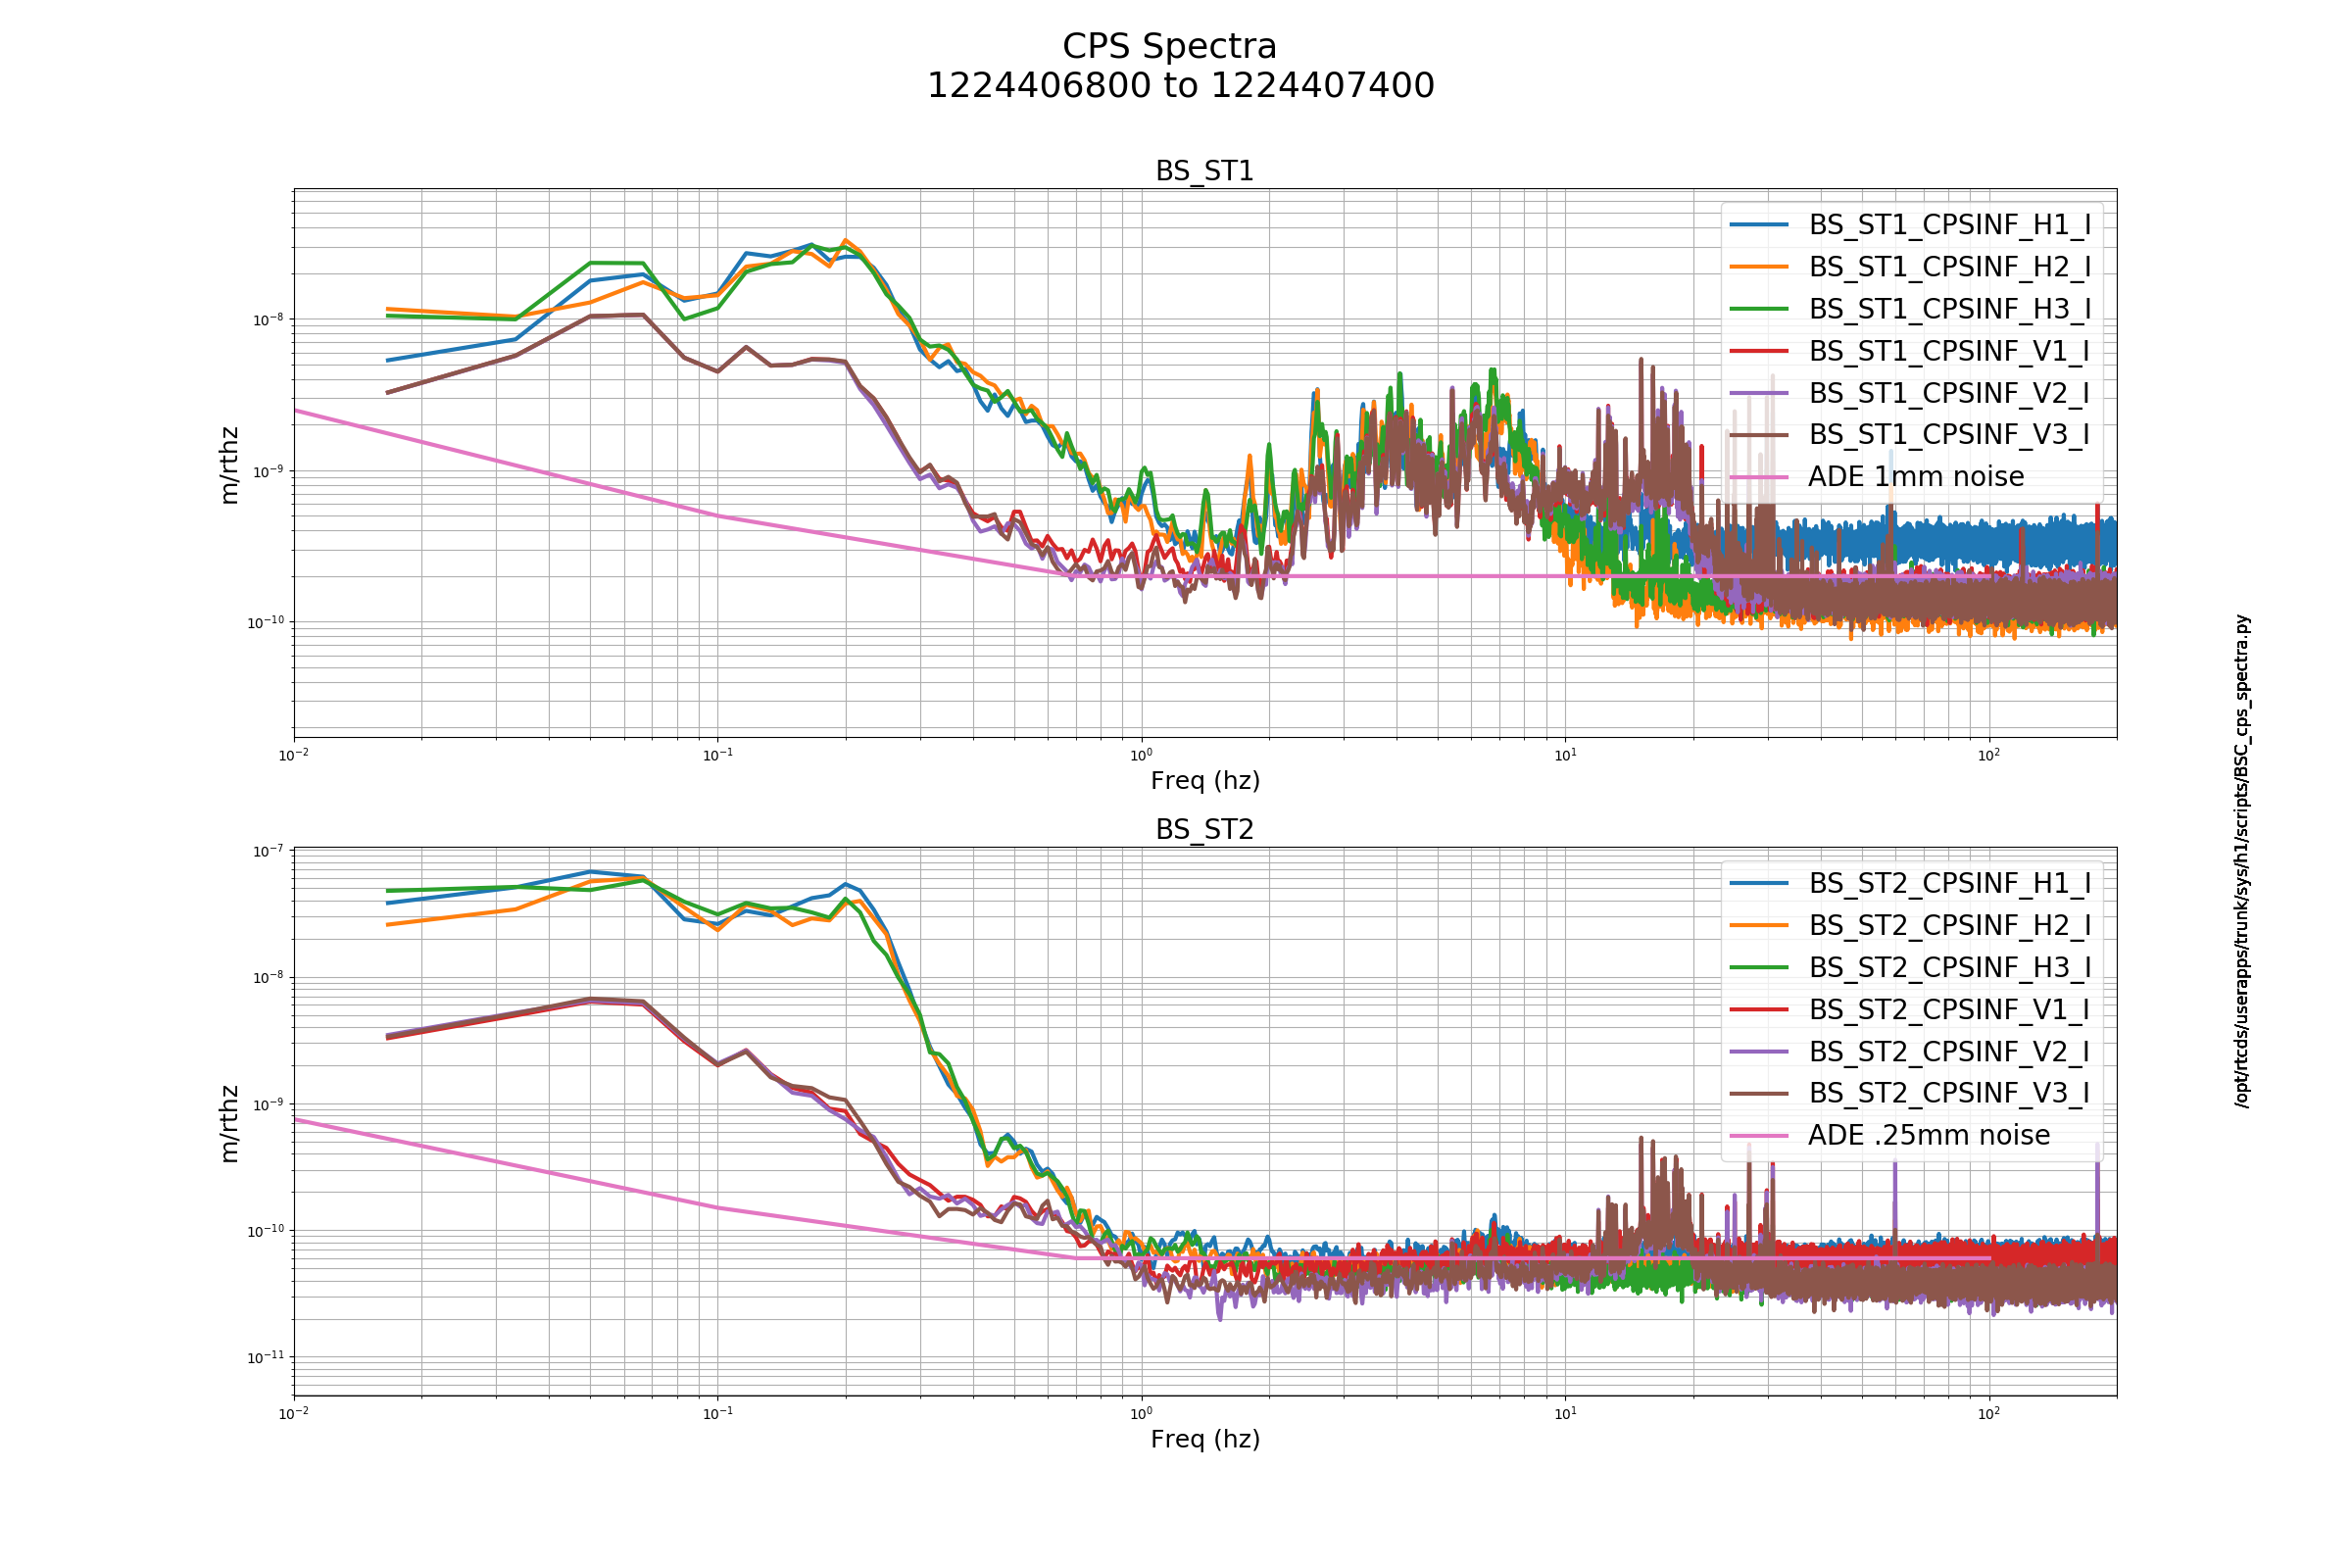
FAMIS7754
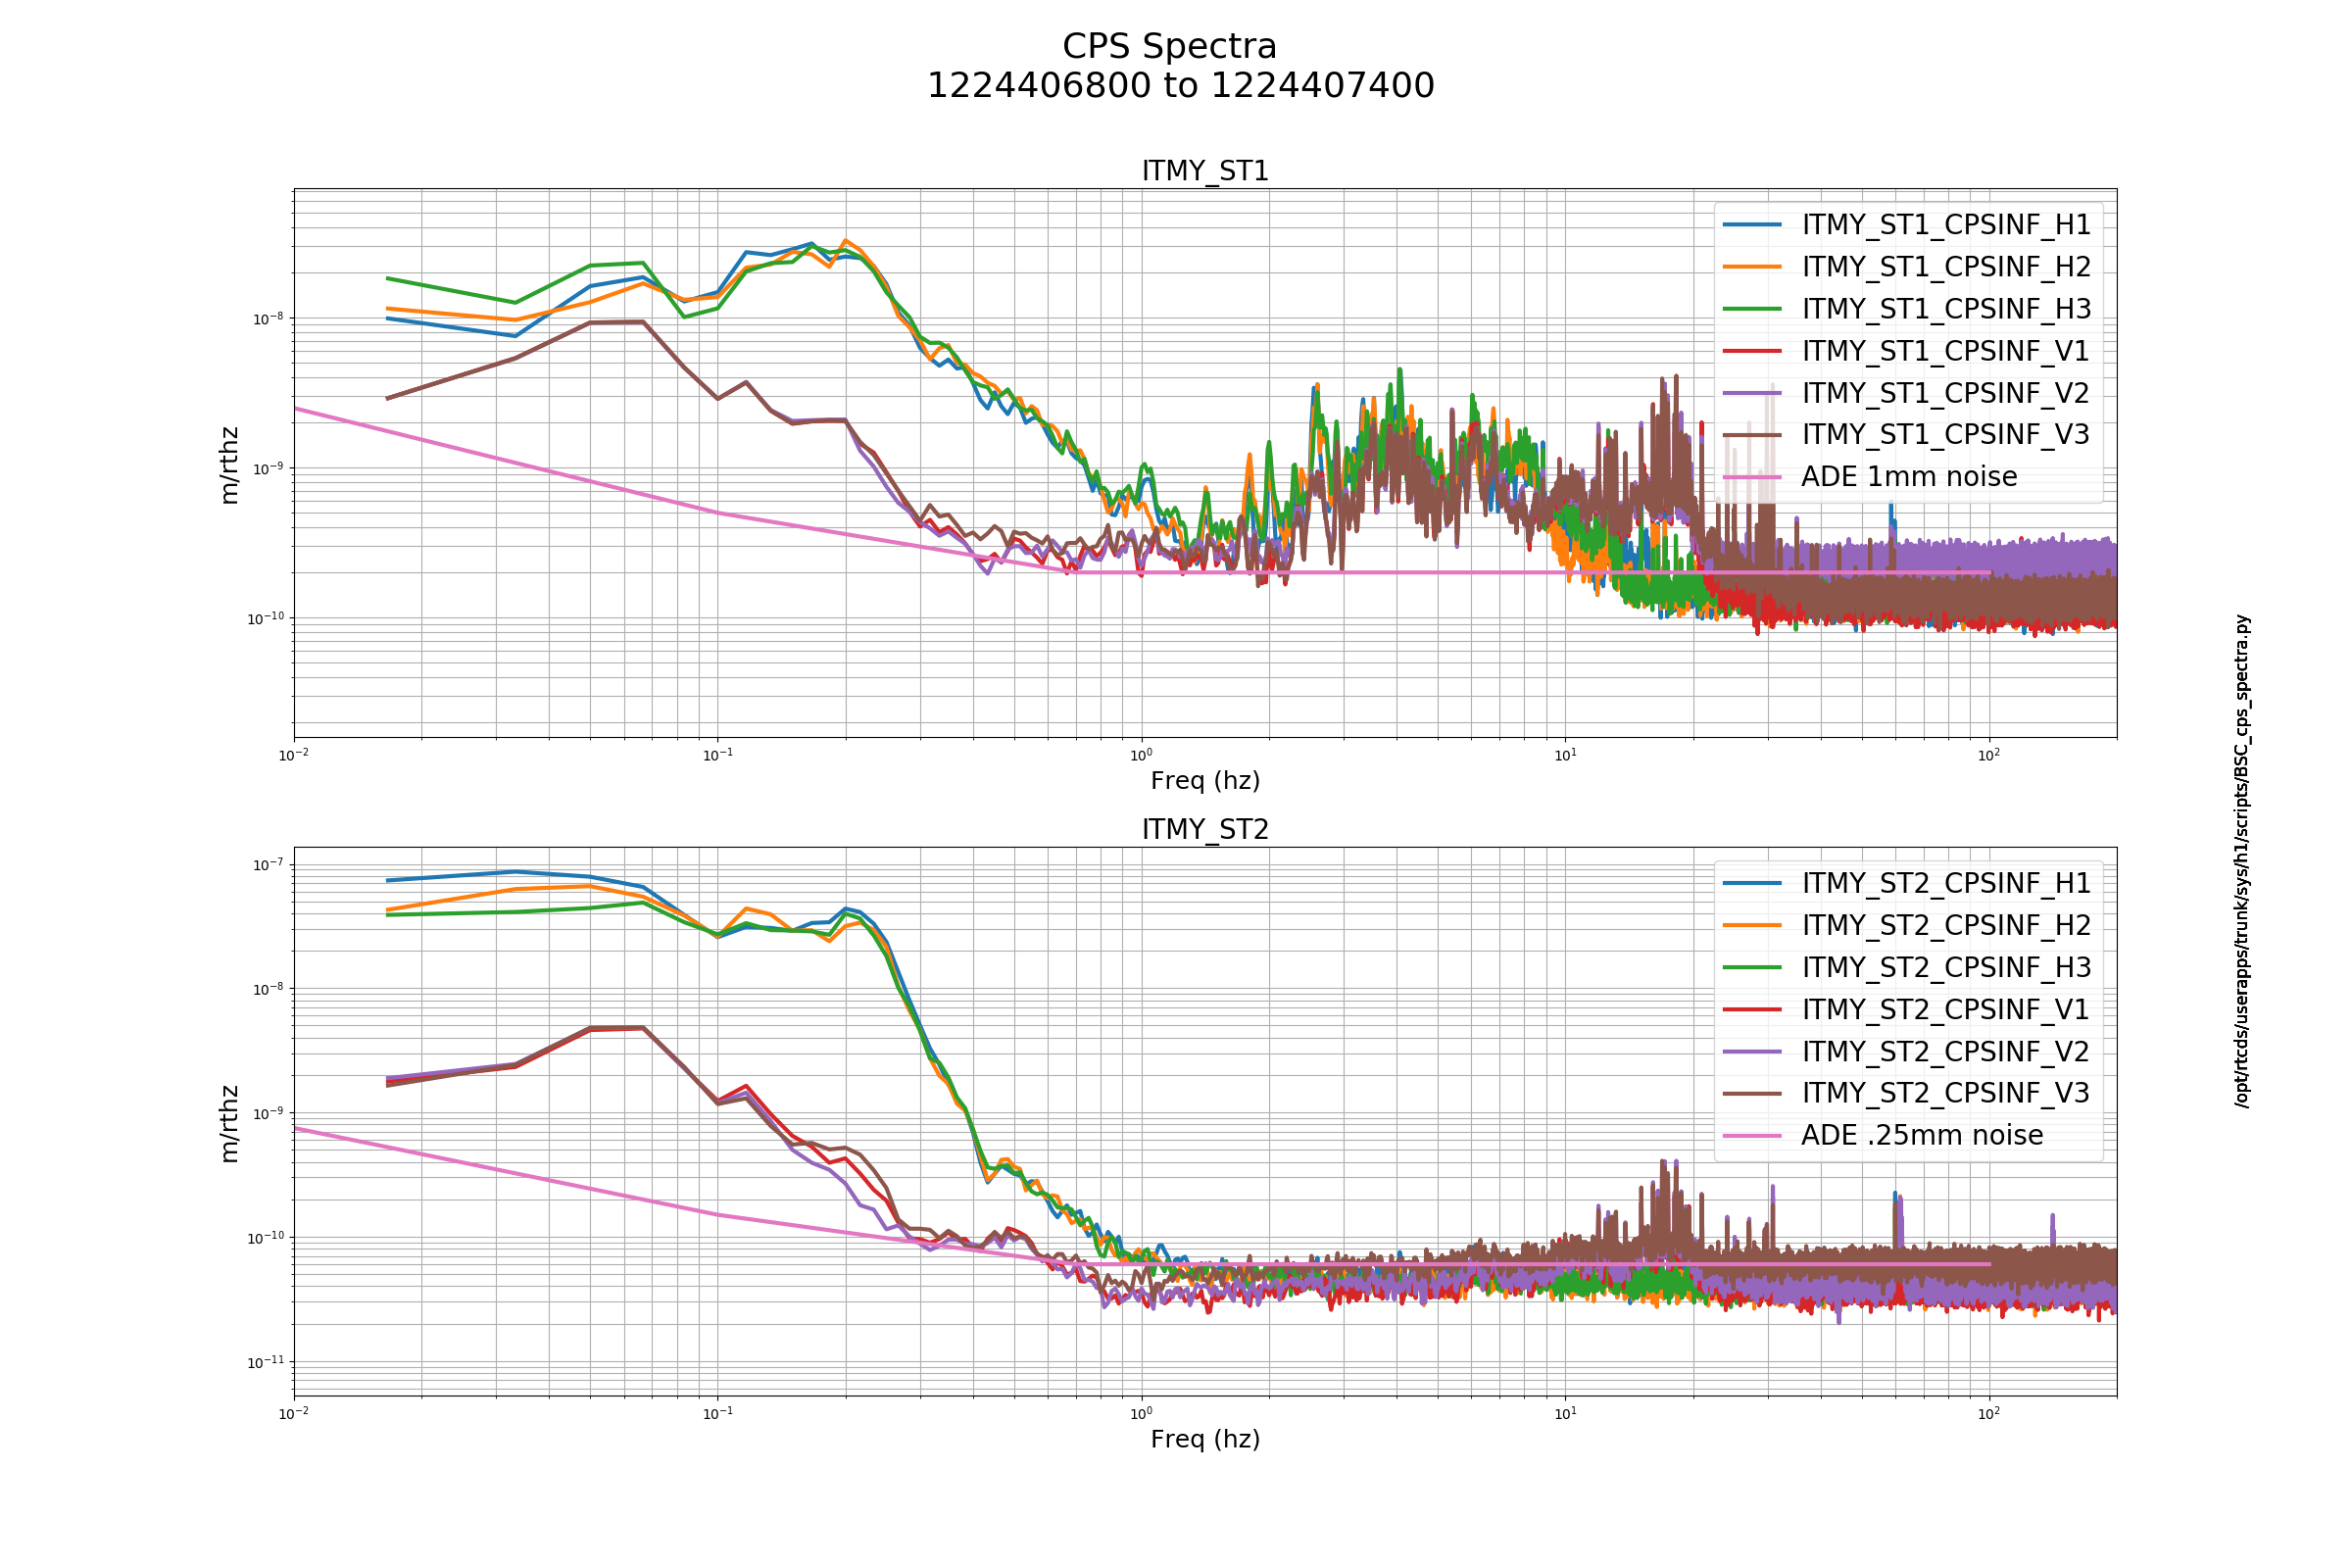
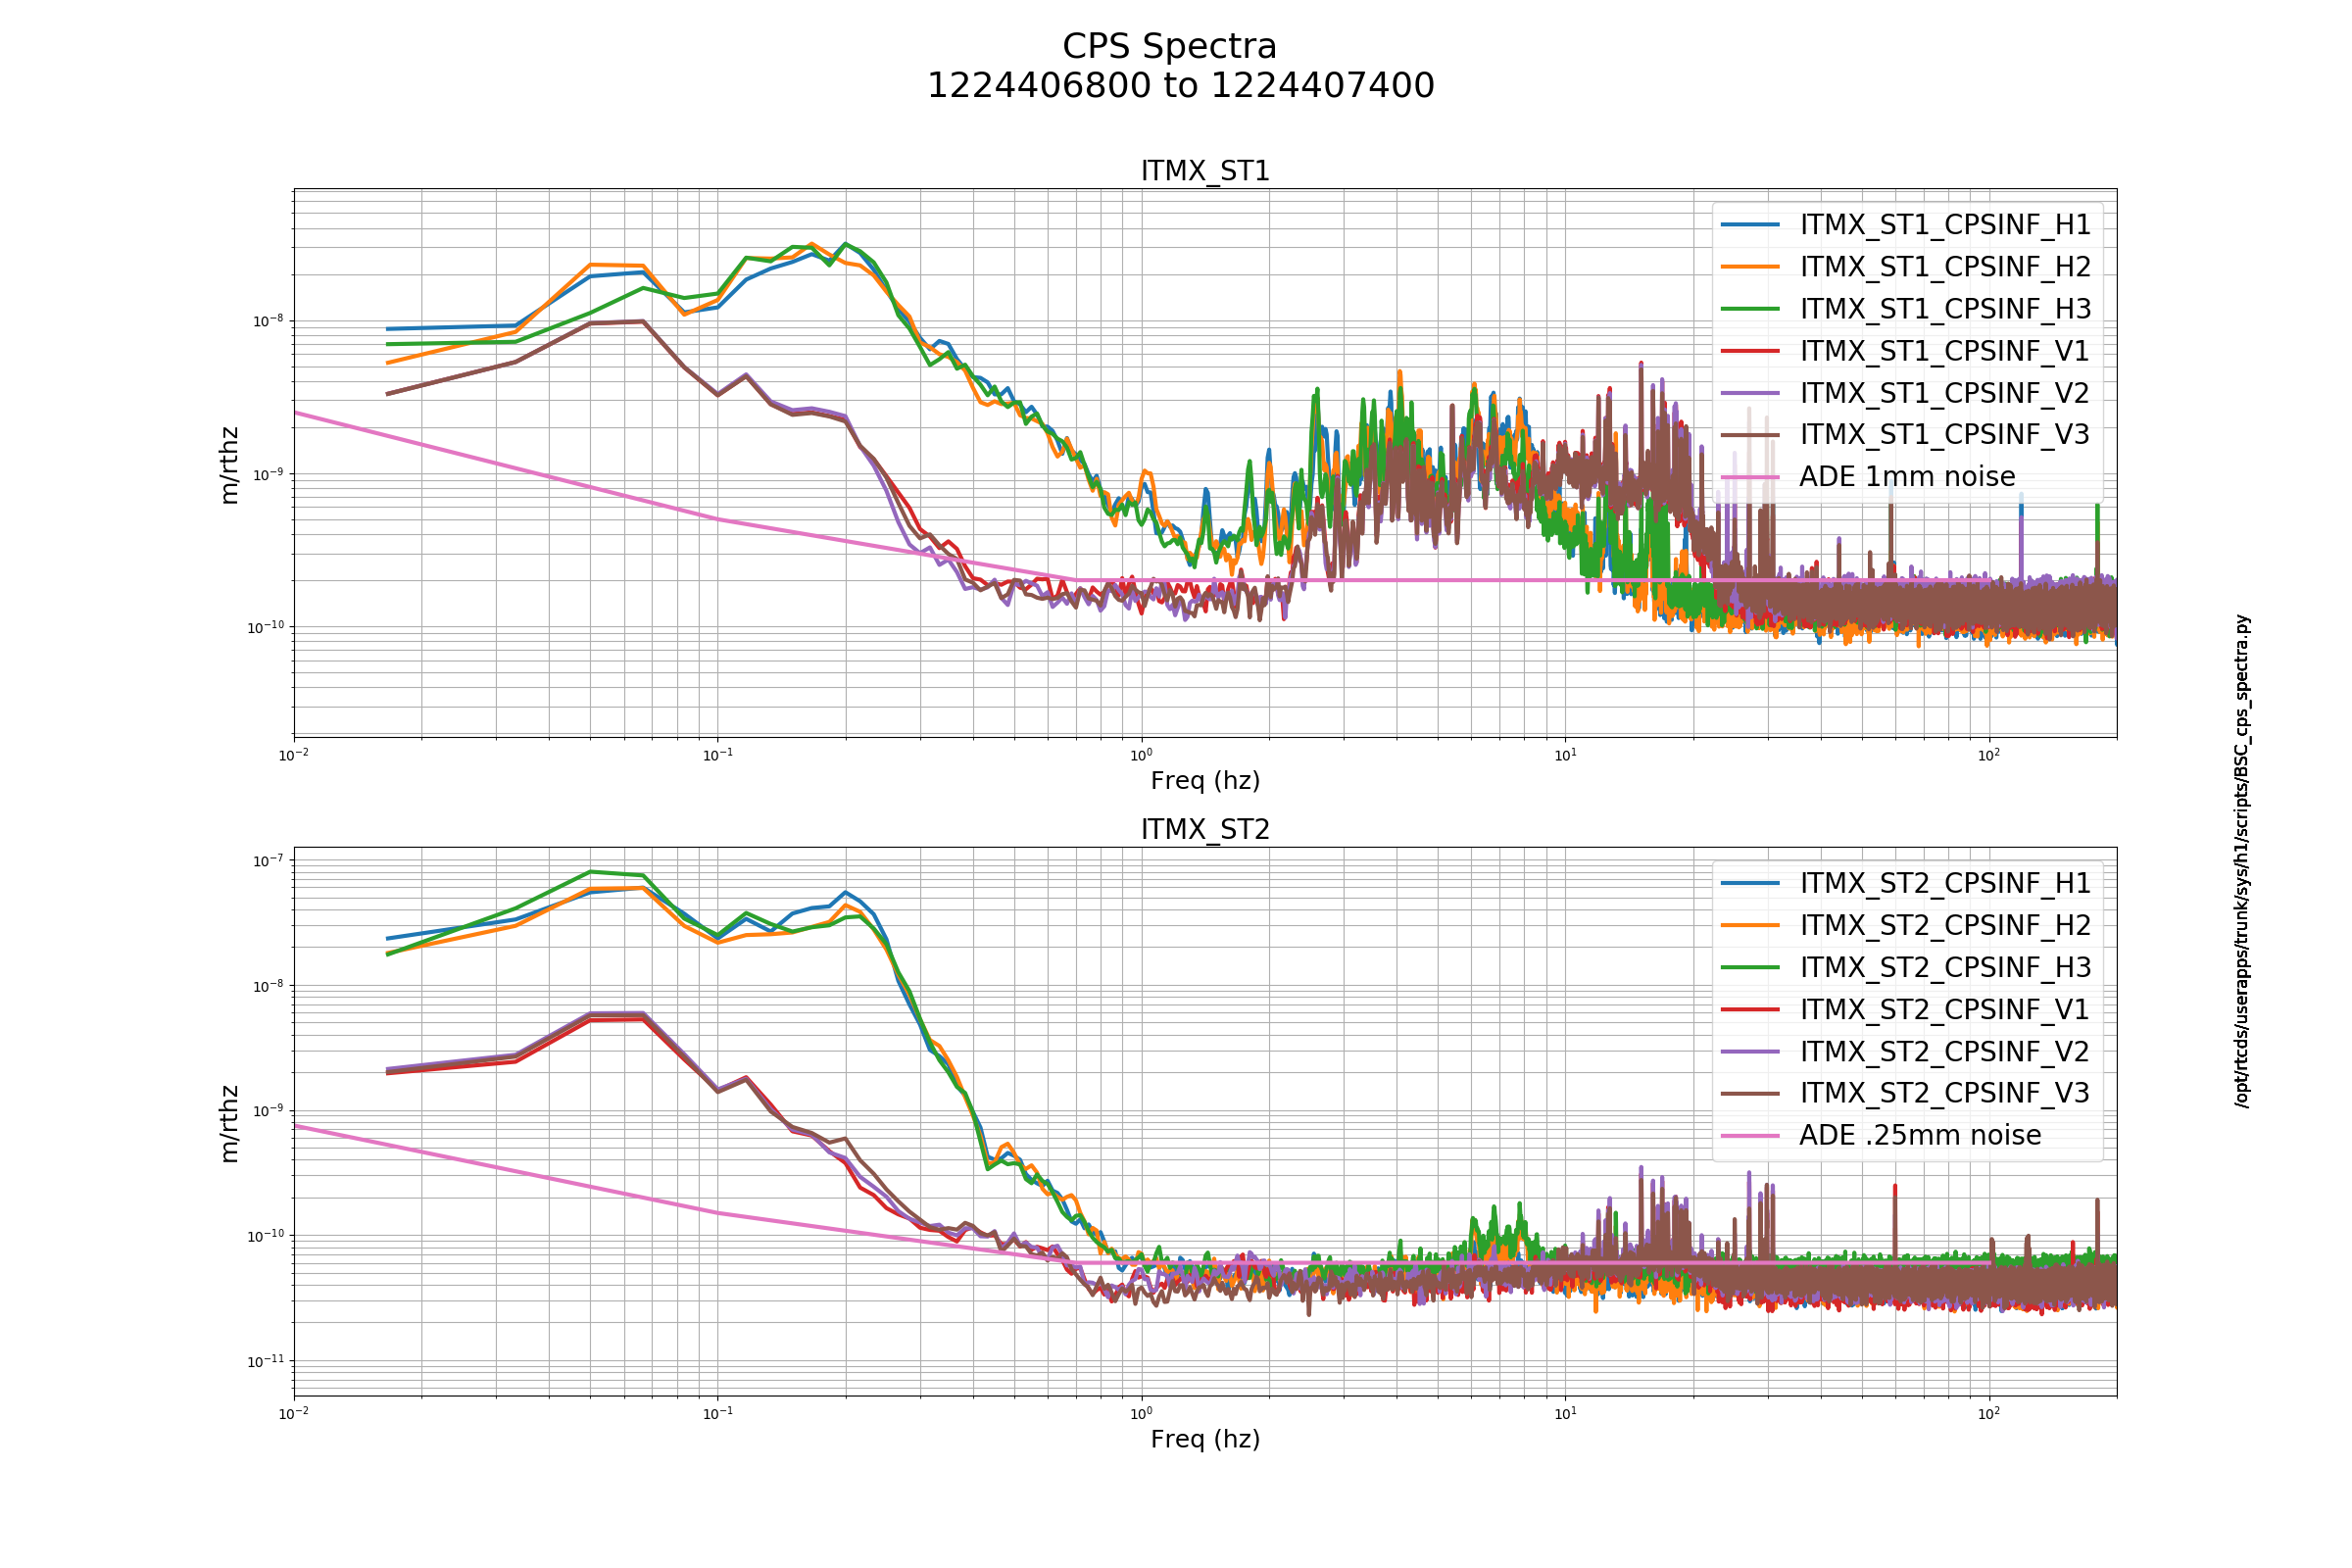
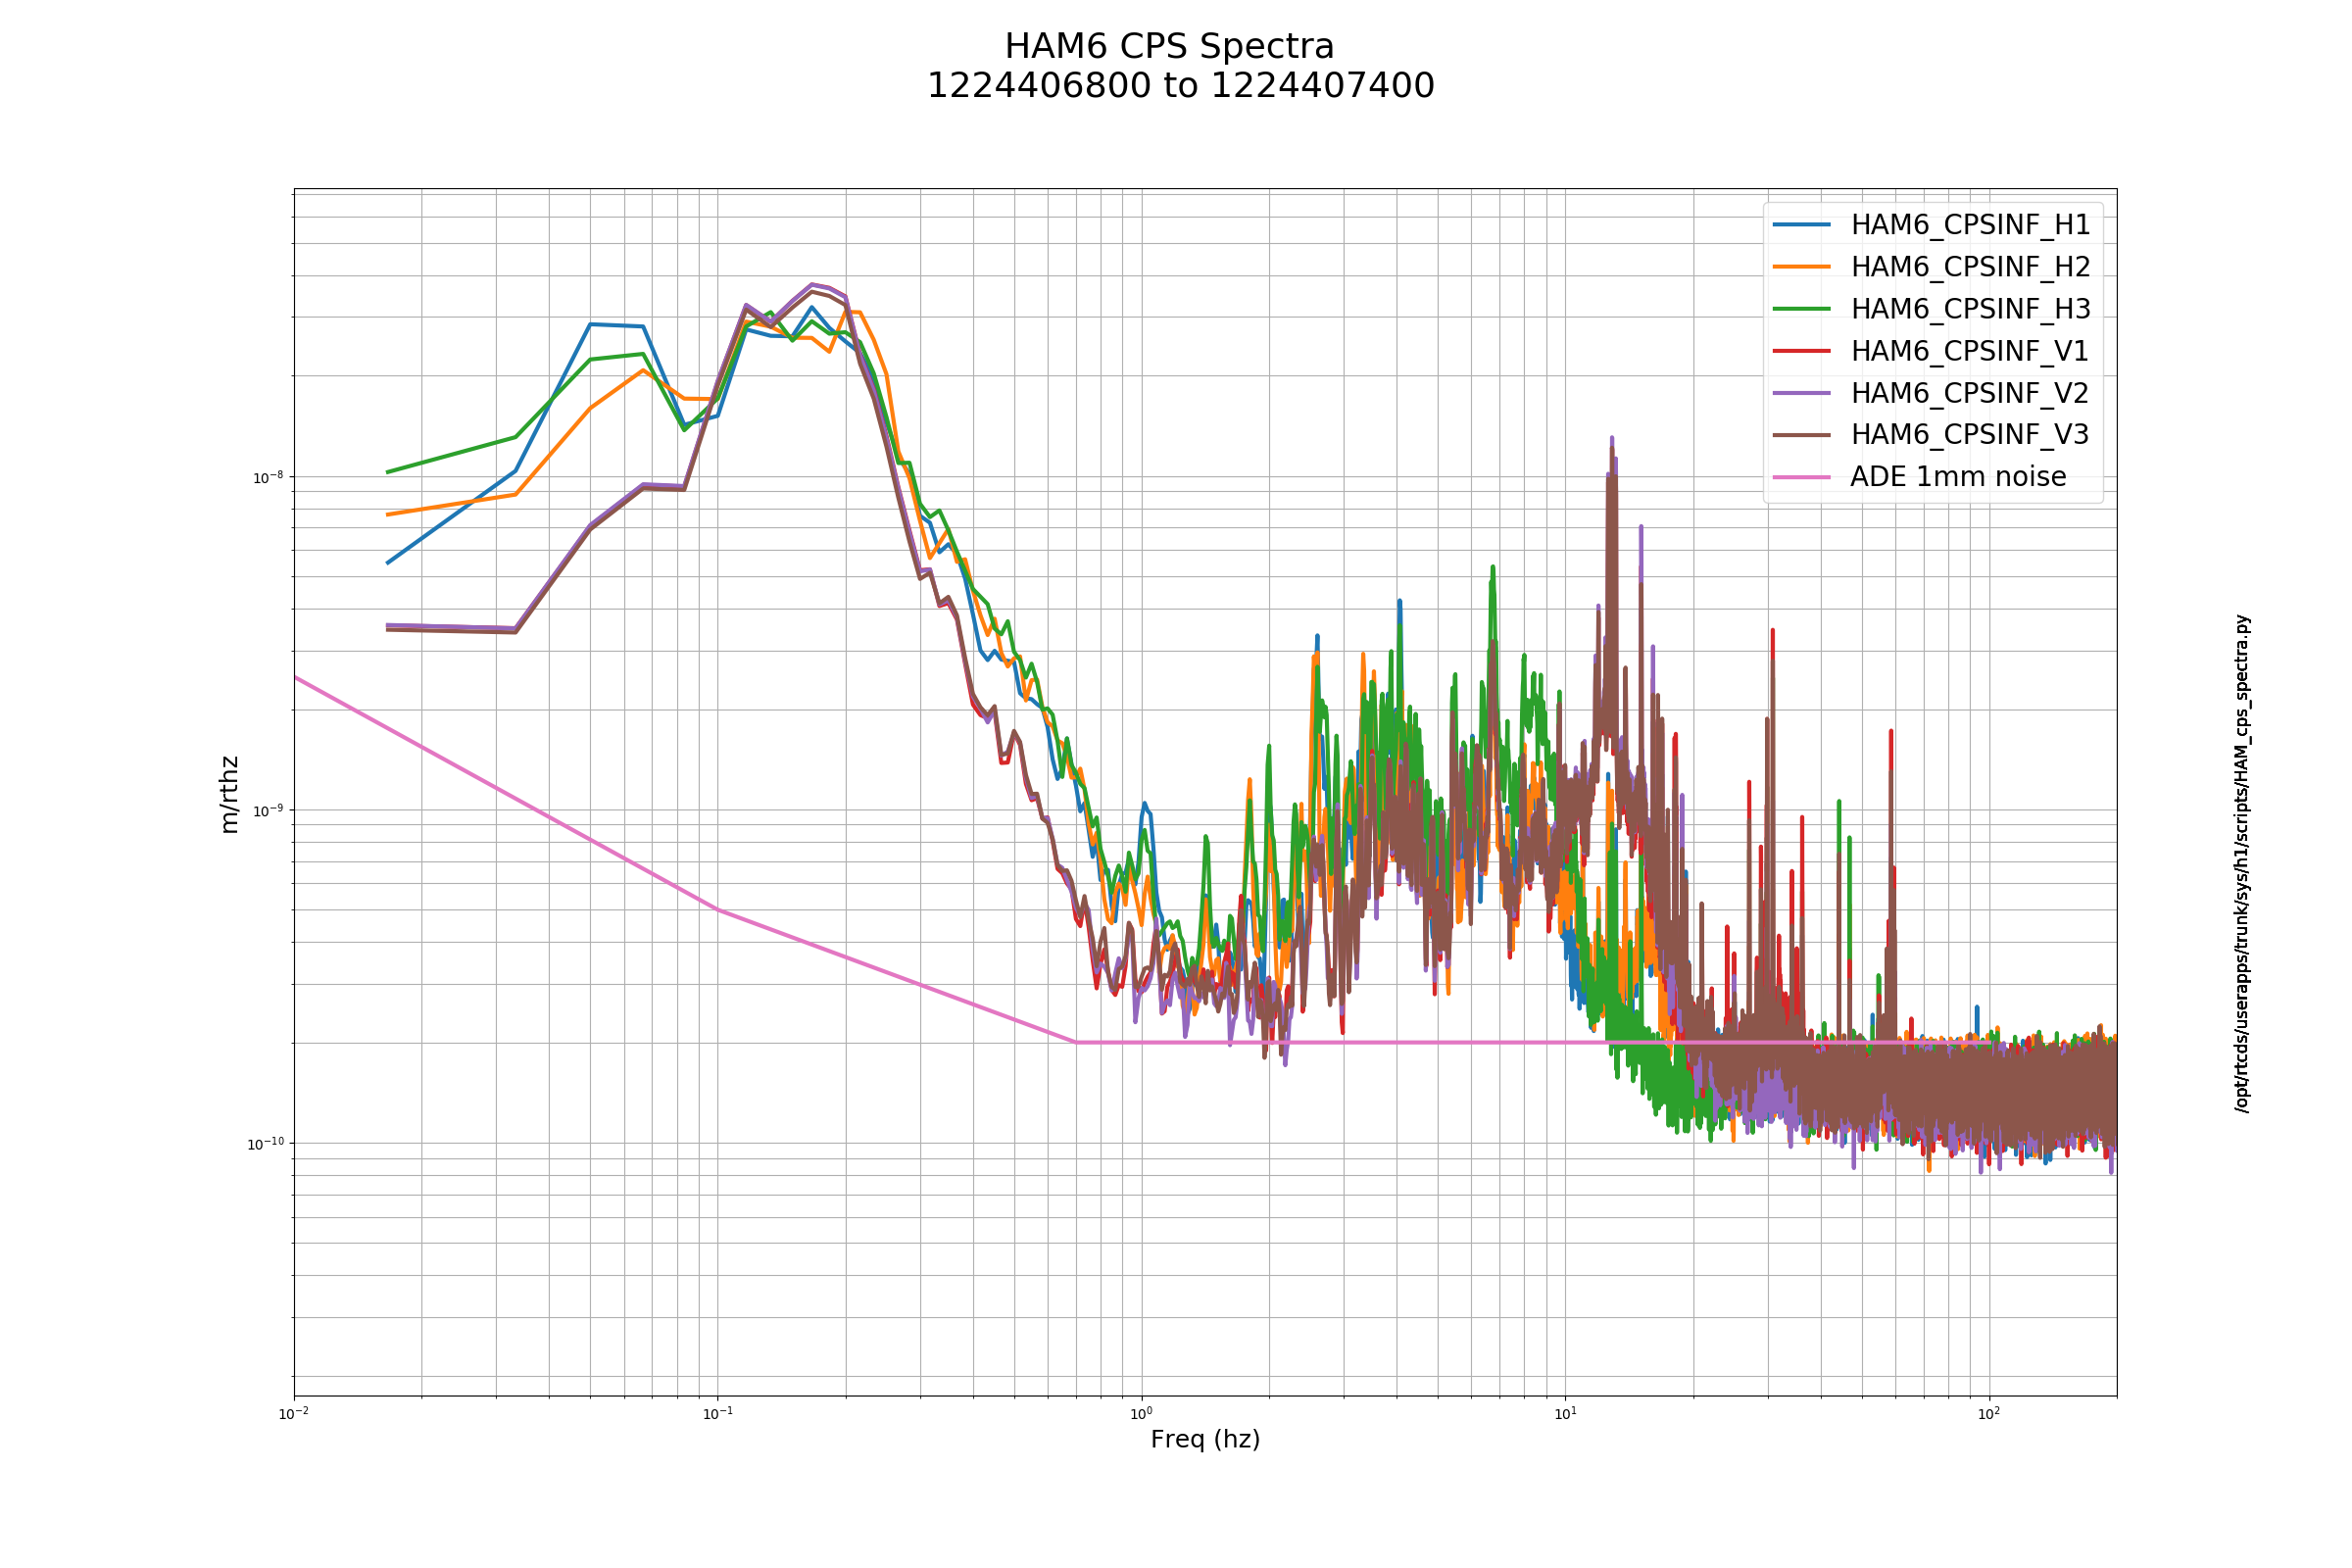
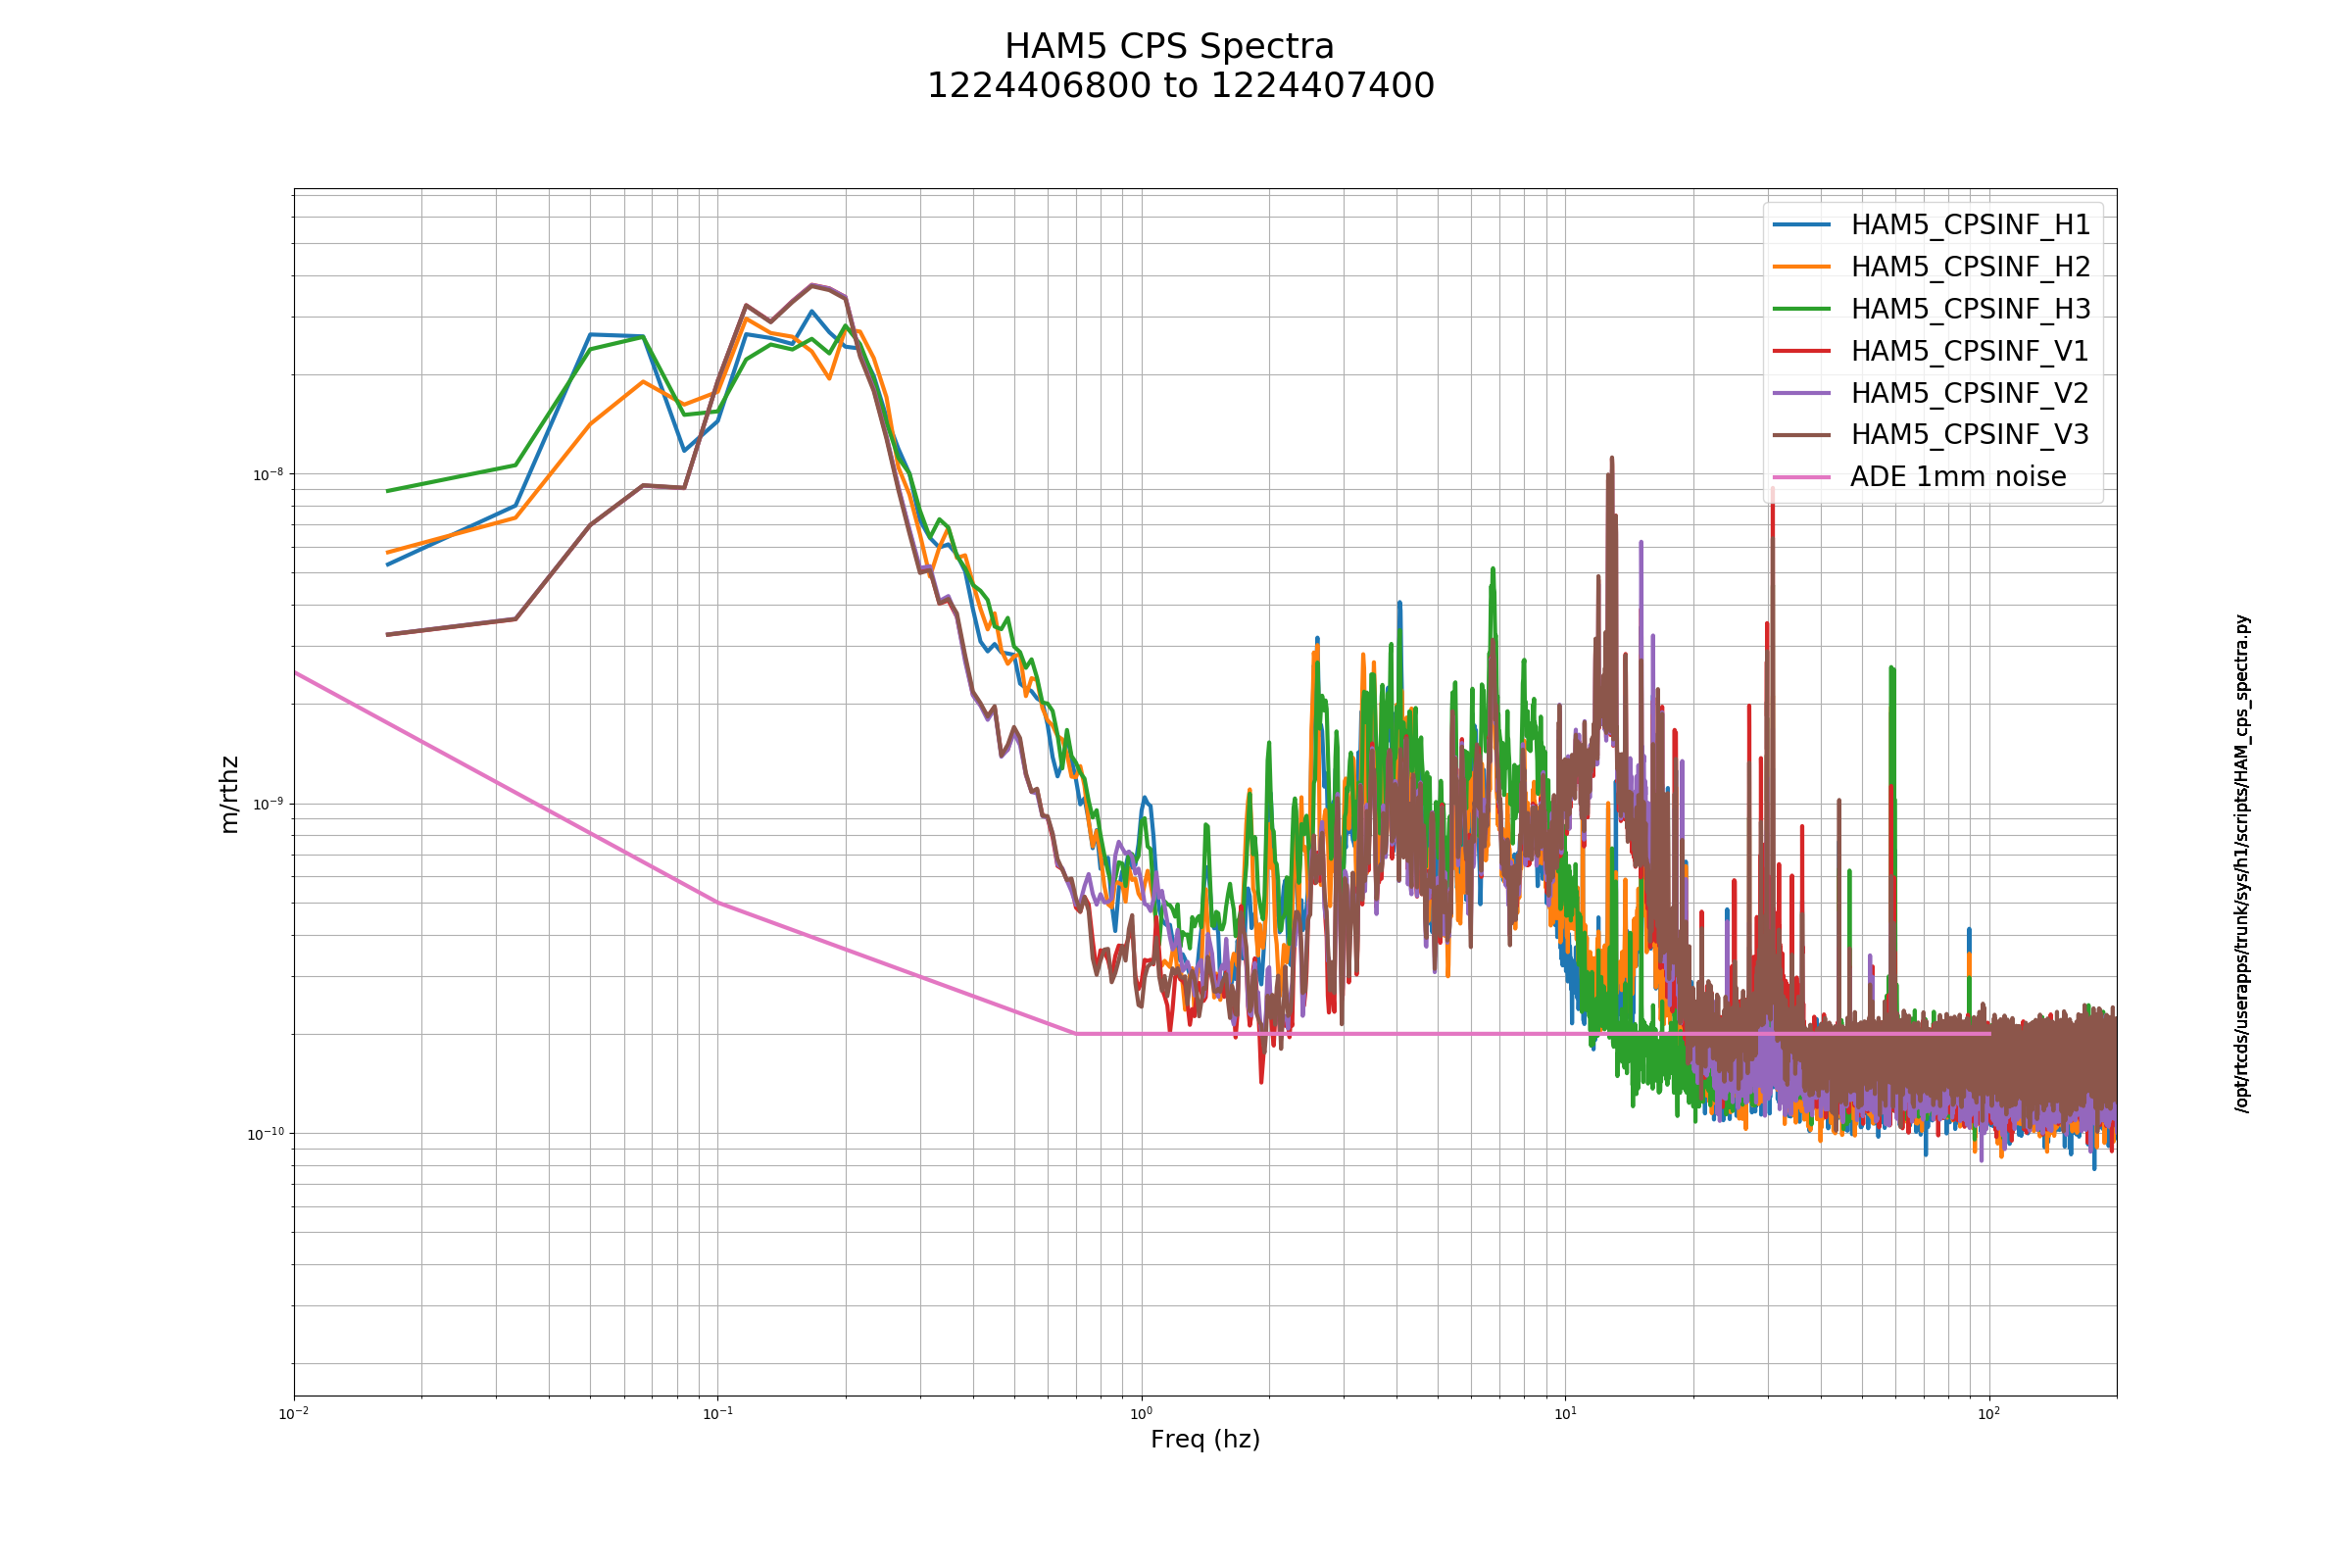
BS ST1 H1 seems to have higher noise about 20Hz, at least compared to the others. The script did not report any problems.
If we have another DAC/DACKILL crash of h1seih23/h1seih45 IOP models, could I ask that a script be ran before the models are restarted. The script will gather diagnostics information from the /proc area, data which is lost when the models are restarted.
The script is called sei_crash_get_diagnostics, in the controls home directory on the computer h1build. In the following example, what is typed is highlighted:
ssh controls@h1build
Password:
Last login: Wed Oct 24 12:53:40 PDT 2018 from zotws6.cds.ligo-wa.caltech.edu on pts/0
controls@h1build ~ $ ./sei_crash_get_diagnostics
The controls password can be obtained from the shared-secrets web page: link (authorized users only)
A directory with the current timestamp is created in the home directory and the diagnostics files are written to it.
Squeezer team
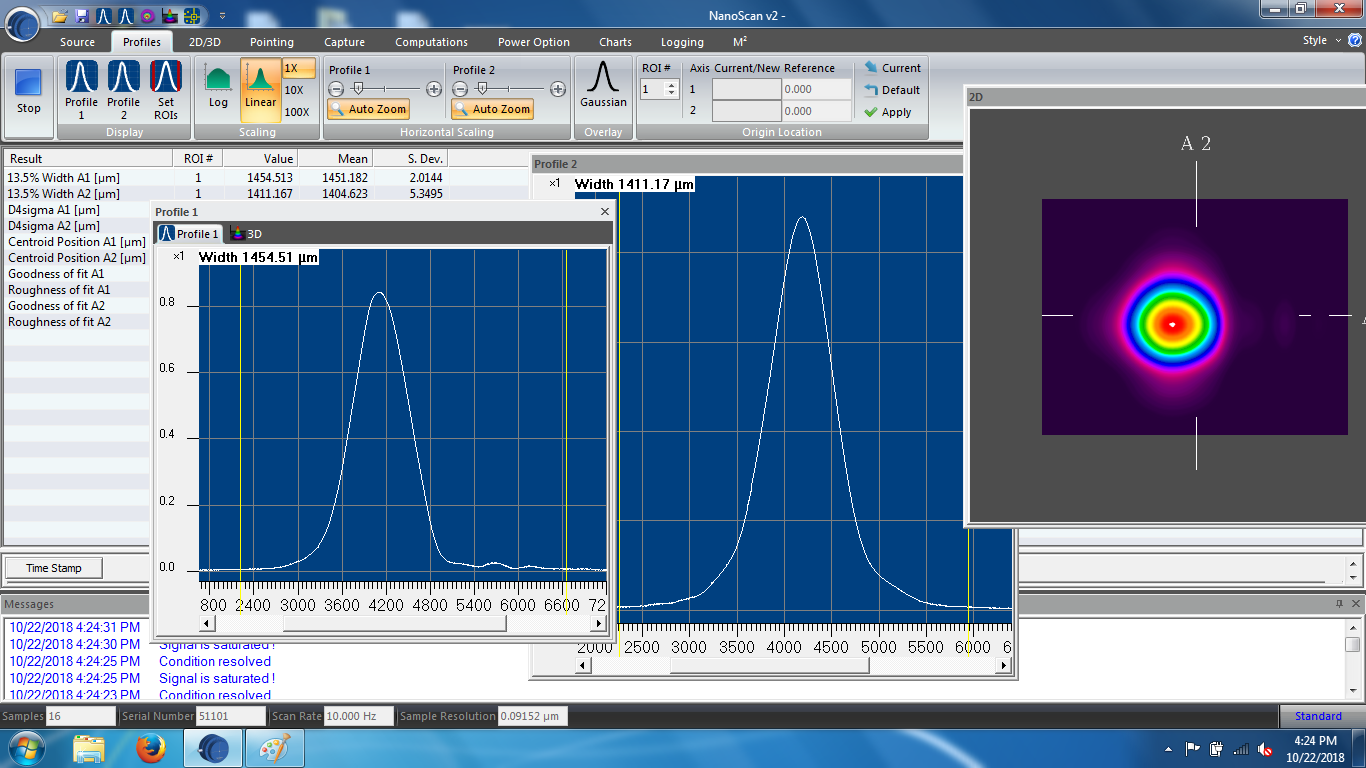
The mode matching solution on the green path from the SHG to the green fiber was changed (from SHGtoFiberOld.pdf to SHGtoFiberAM.pdf) to accommodate the small aperture AM (New Focus 4102).
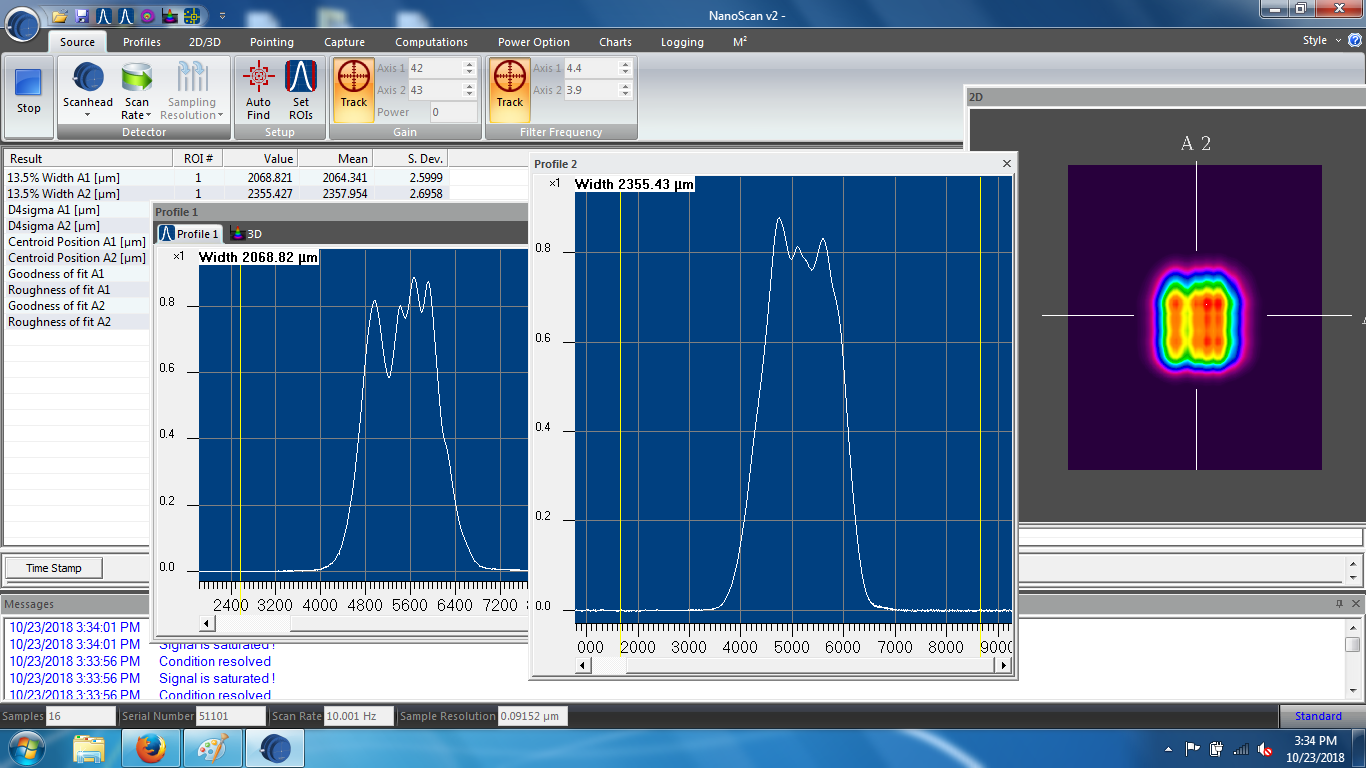
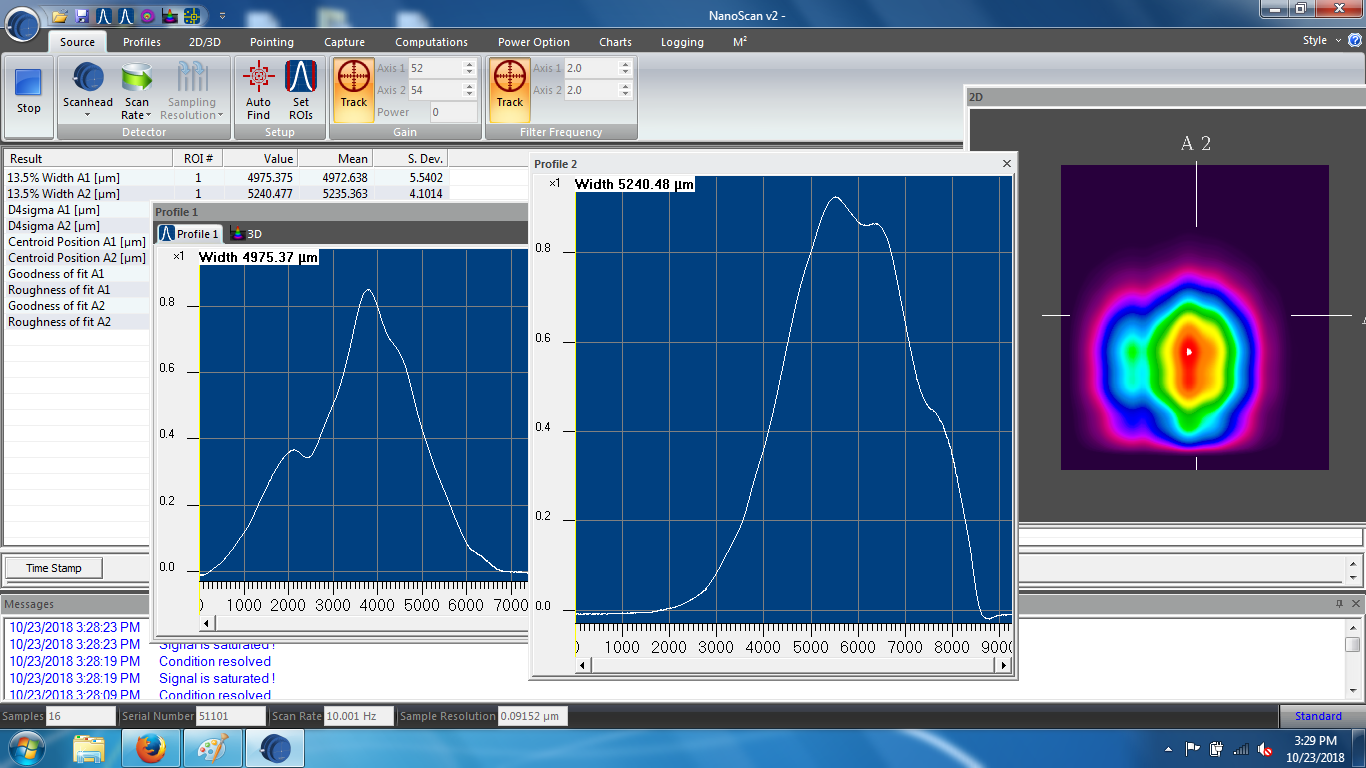
With very low powers (<3mW, with a spot size of 200-500 um) we can get a Gaussian image on the beam profiler when viewed after a PBS (AOM7.png).
With 11mW (11mWnoPol.png) the profile is distorted and a Gaussian profile cannot be reliably recovered with alignment or polarization control, it seems to be some complex dynamic of heating and birefringence of the crystal is limiting us.
As a last resort we tried putting the AM at the focus hoping for a symmetric effect on each crystal in the modulator (AOM11mWfocus.png) with no improvement.
Note the intensity .36W/mm^2 (@11mW for 200um beam diameter) is below the limit (.5W/mm^2, and we should be able to operate at a 500um spot size I just wanted to be sure strange beam profile were not due to clipping or diffraction). The Rayleigh range is about a factor of two larger than required by the modulator (minimum Rayleigh range is the length of the crystal). We should be able to operate at a max of 100mW with a beam diameter of 500um and throw away half the power operating as a noise eater. This would give us give us a potential operational range of up to 50mW which we can attenuate down to 20mW before the fiber (or just operate at lower power, point is there should be lots of head room here).
TVo, Danny
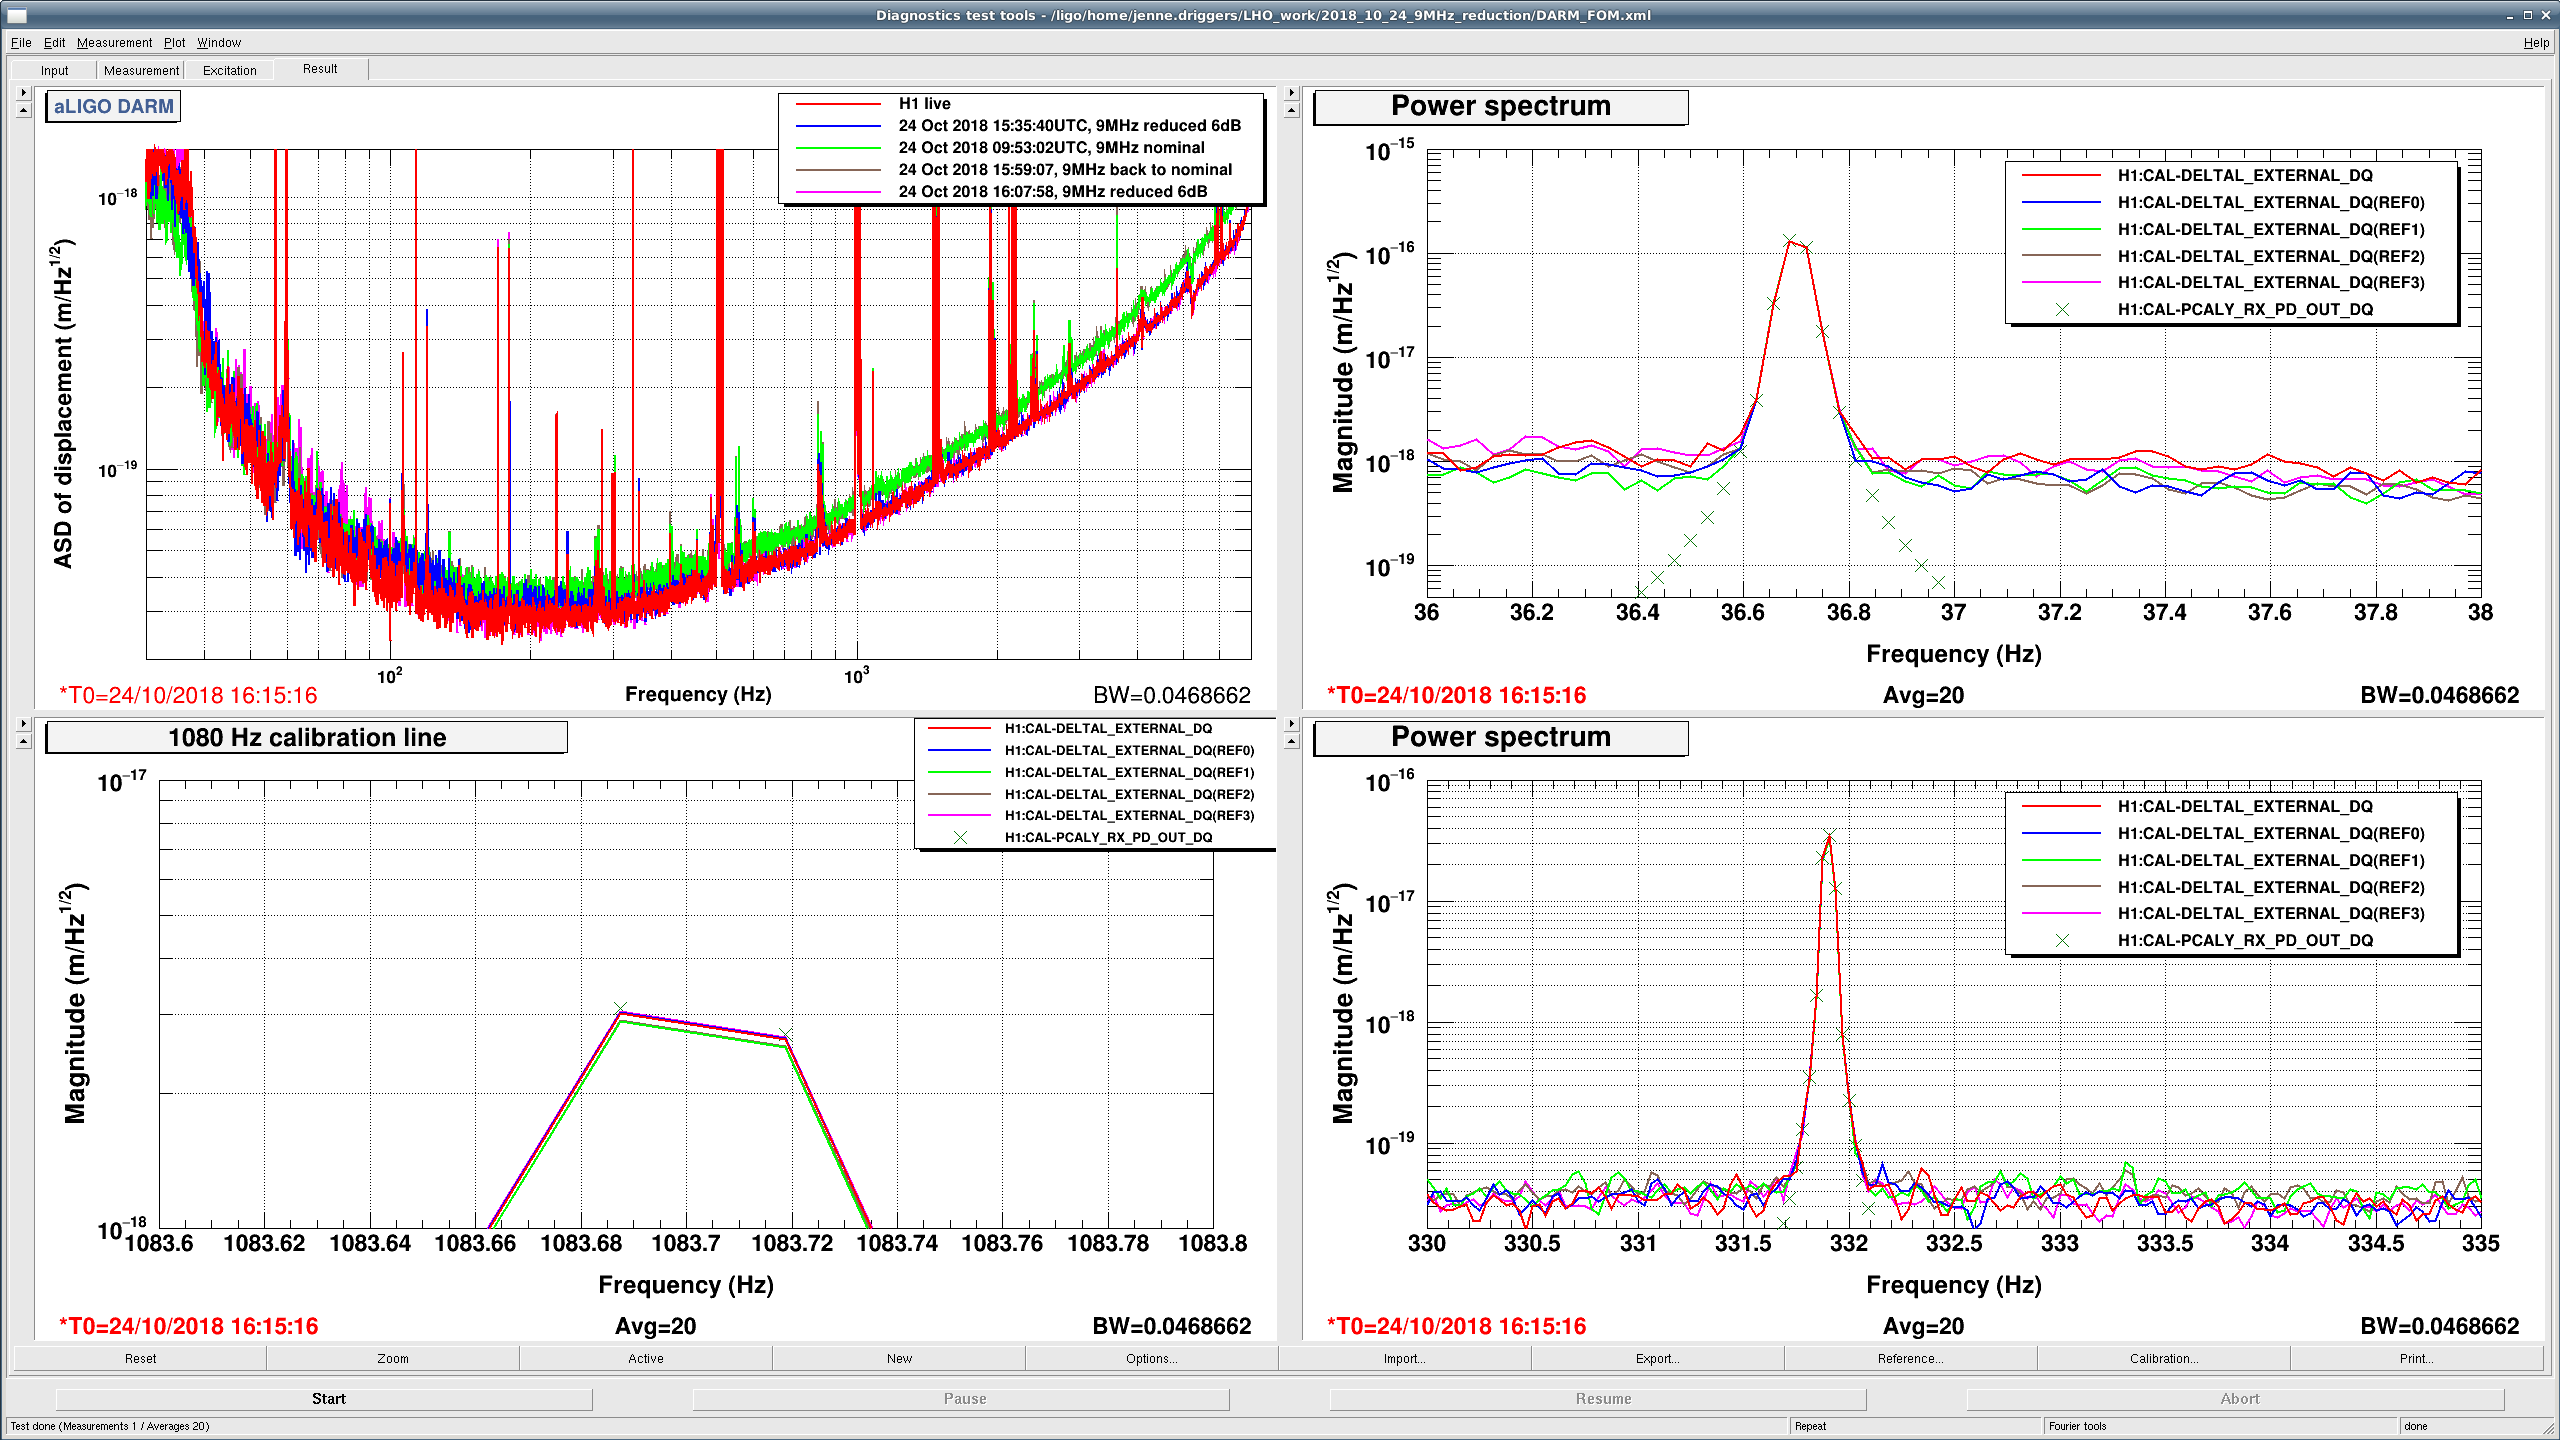
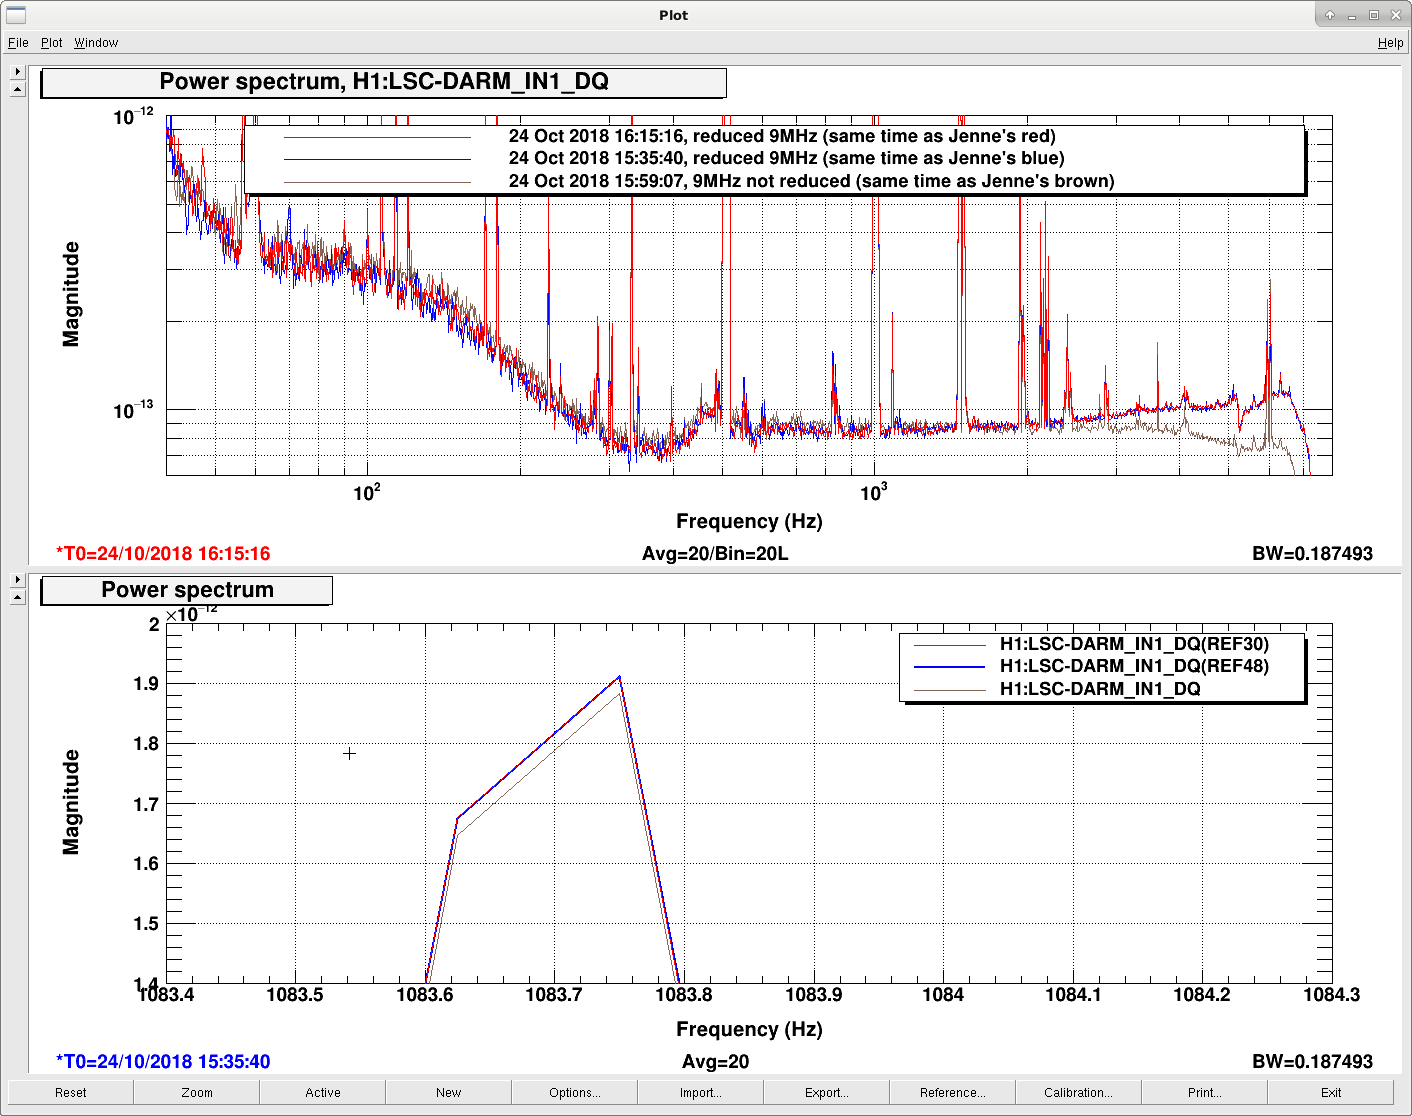
I reduced the 9MHz modulation depth by 6dB, and it seems like that gives us several more Mpc. It seems like our sensitivity is really improving when I reduce the modulation depth, although I'm not sure why it has such a significant effect, particularly at high frequencies. I plot here also 3 of the calibration lines, so you can see that their peaks are lining up pretty well. If anything, the green and brown traces with the 9MHz at it's lock acquisition value are a bit worse than they look here, since the 1080Hz line should be scaled up by a teeny bit.
Note that the lockloss around 16:45 was me, trying to reduce the 9MHz by another 3dB, but the old script that I use to step by hand further didn't include compensation for the analog CARM gain. I've fixed the script, so will likely try again next lock.
I have now put the 9MHz reduction into the main acquisition sequence path.
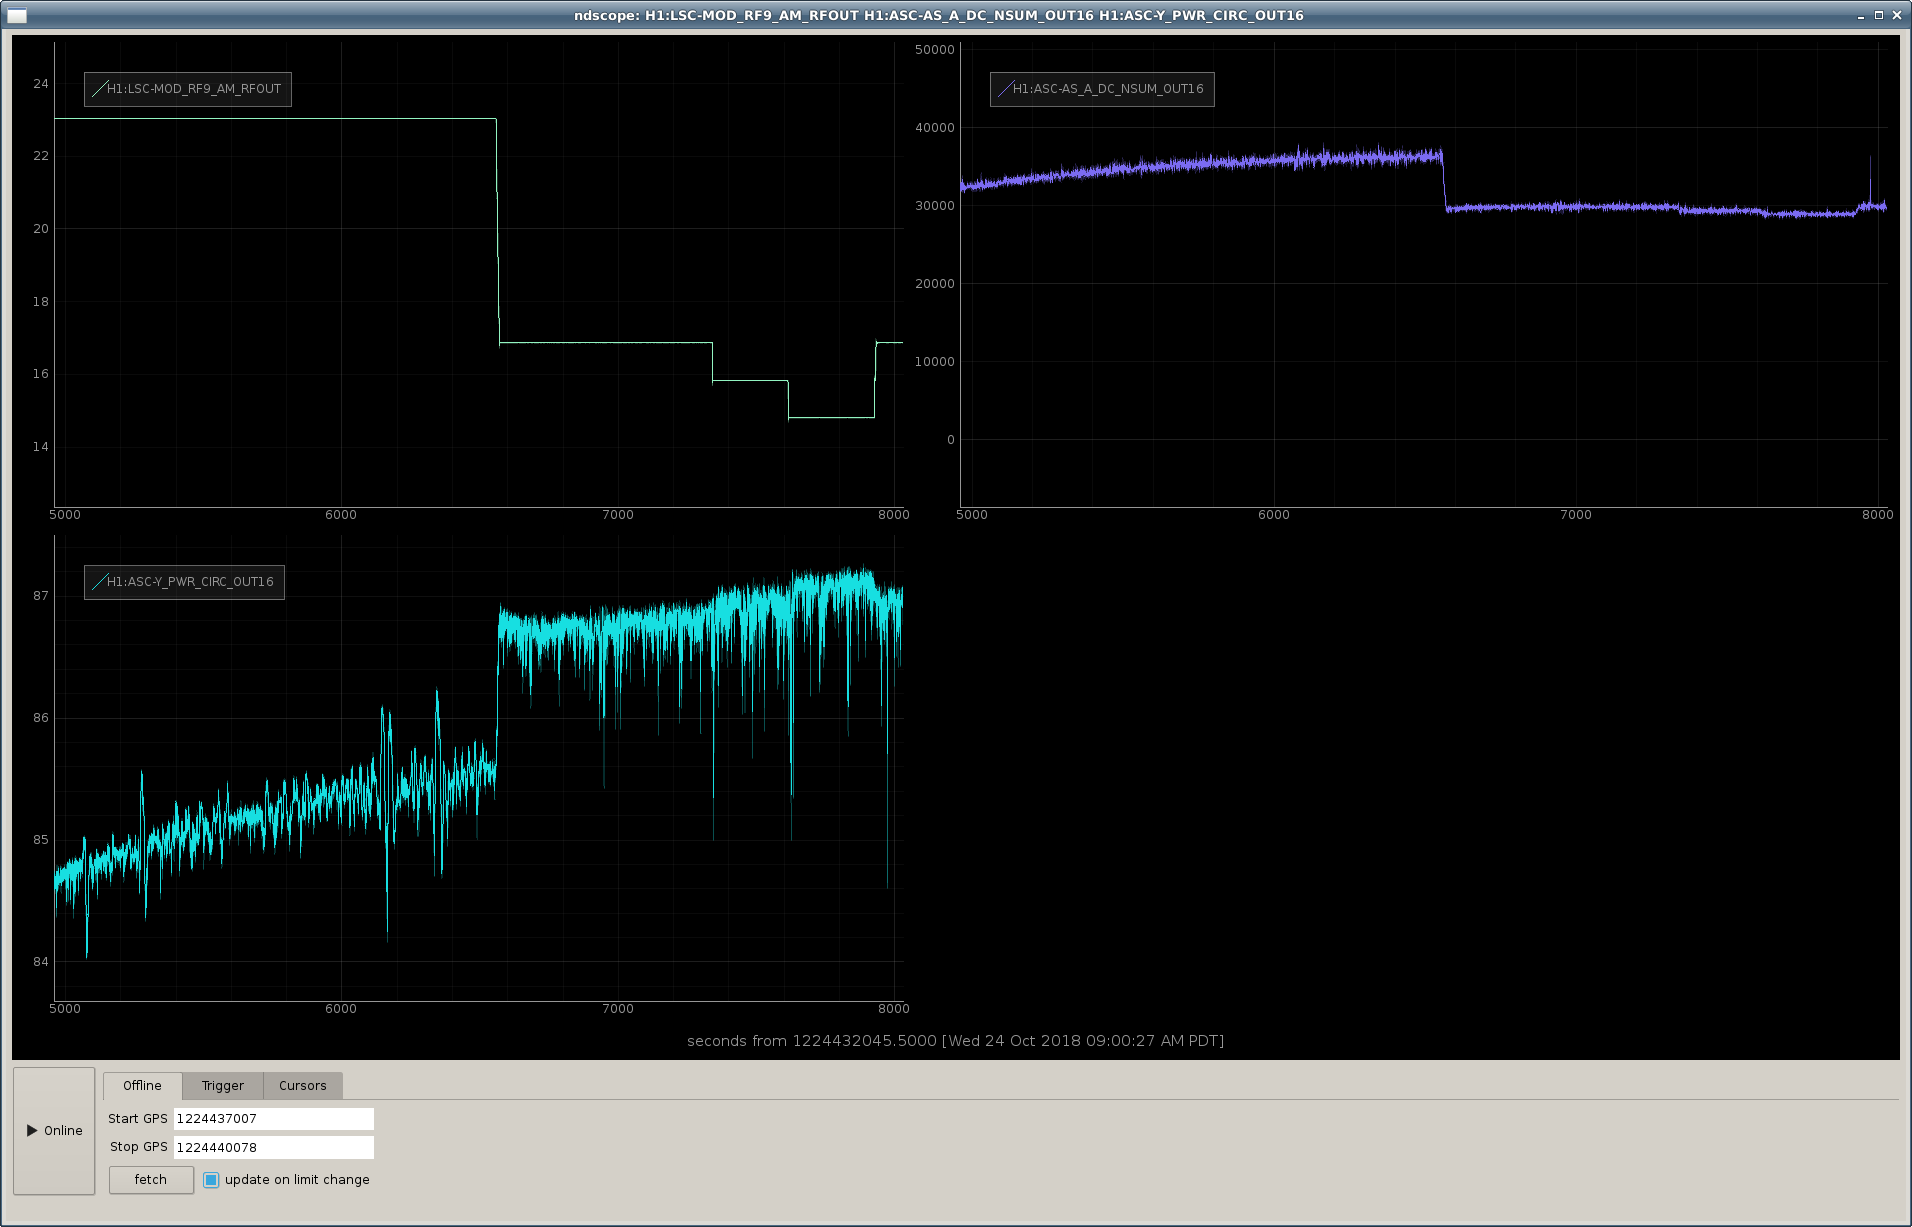
The attached plot shows that we are really seeing more power circulating in the arm cavities (and also less power at the AS port) when the 9MHz modulation depth is reduced. So, there must be some offset somewhere that we're reducing.
Also, I tried reducing the modulation depth by 8dB rather than just 6dB, and the IFO gets noticeably more glitchy when I do the extra 2dB. So, it seems like 6dB of reduction is a reasonable place, and we can work on finding what is causing this circulating power change.
Since we're reducing the 9MHz modulation depth from 0.2ish to 0.1, we're changing the 9MHz power from 4% to 1%, so should have ~3% more carrier power. That is consistent with the increase in circulating power that we see. However, the apparent shot noise reduction implies a much larger increase in power, so something is still not quite hanging together.
It would be worth checking the RF levels on the other LSC RFPDs used for LSC control (if you haven't already), as was done yesterday for REFL9.
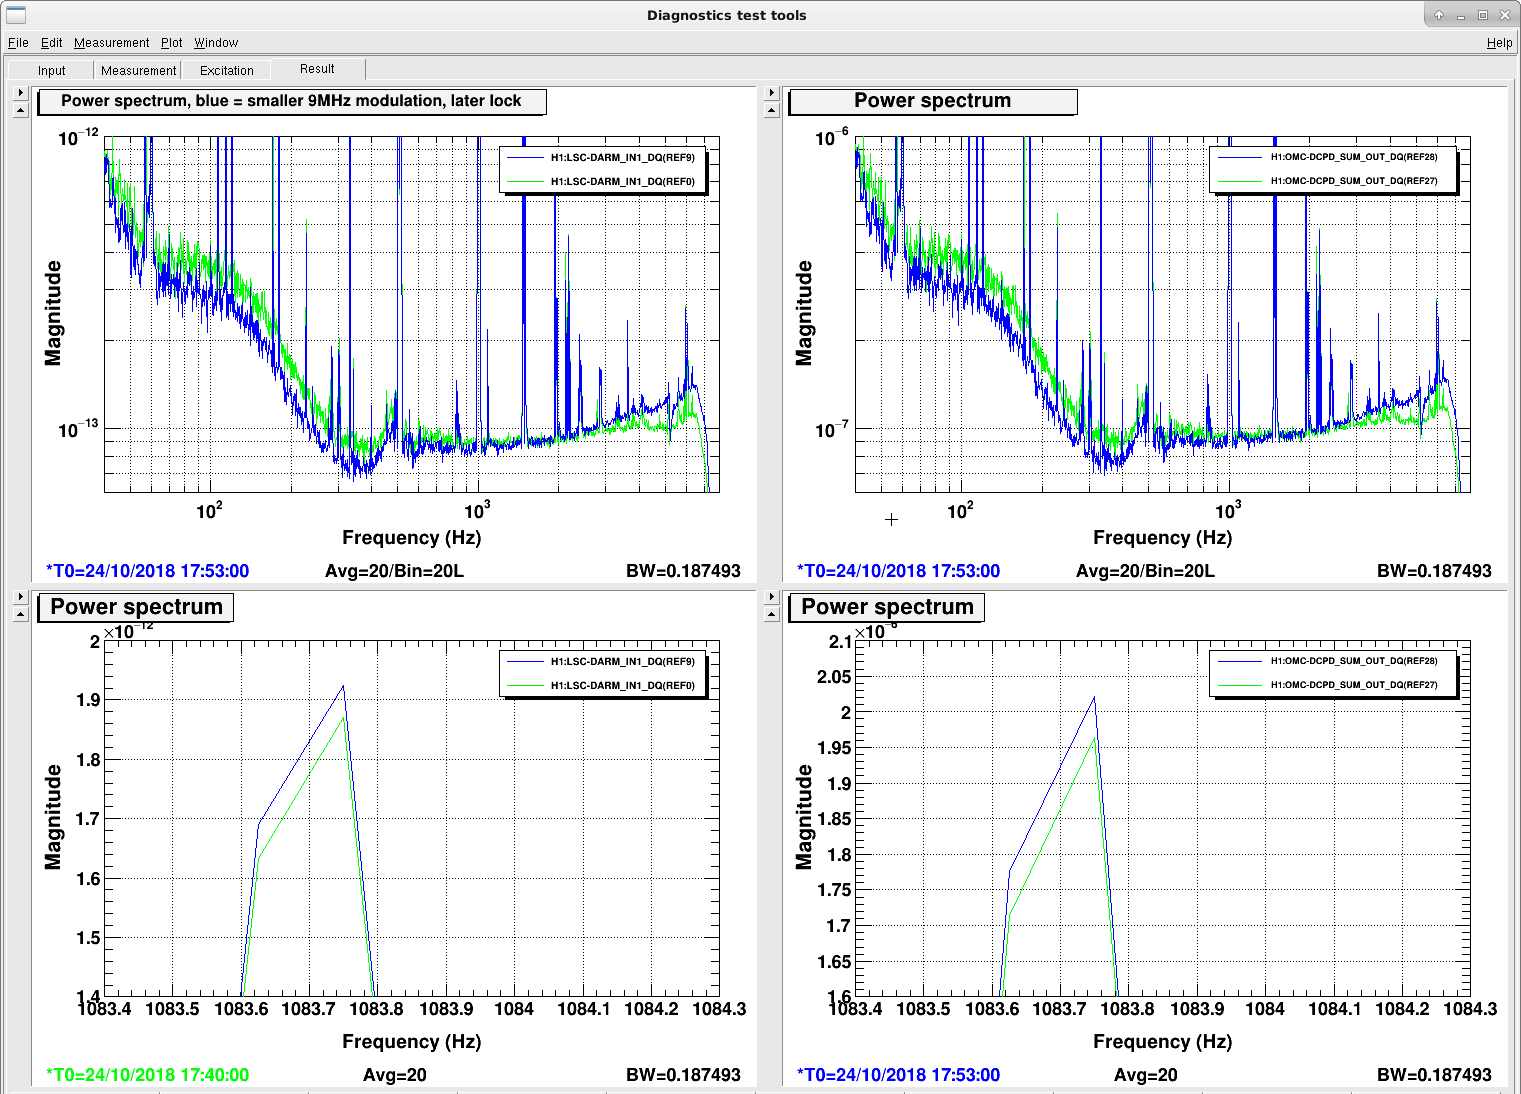
Premature to say we're gaining something, as I don't see the same reduction in uncalibrated DARM nor in OMC DCPD.
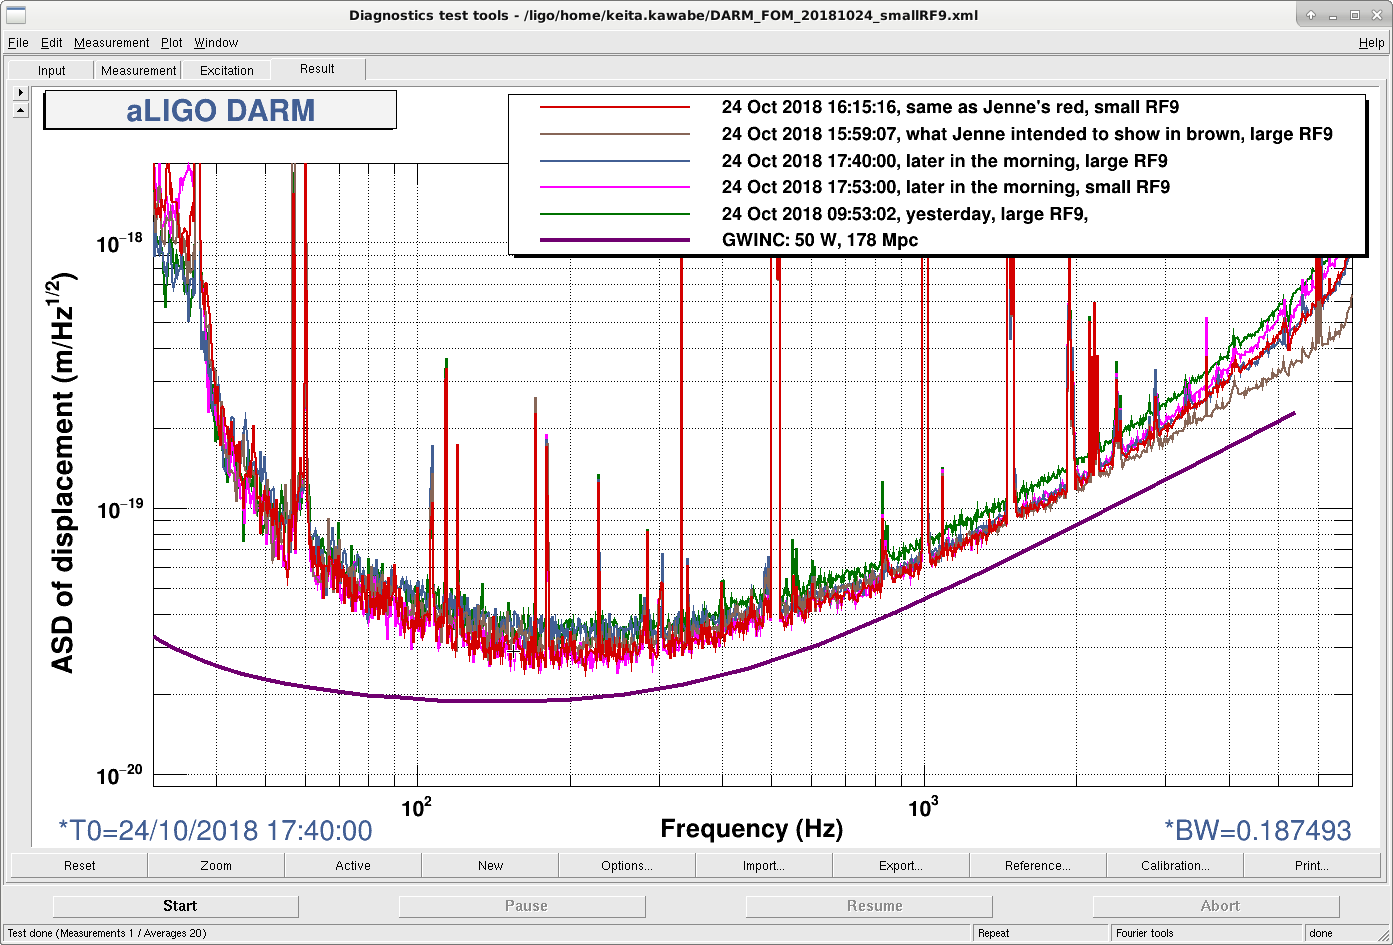
In the first attachment , red, blue and brown are from the single lock stretch corresponding to Jenne's red, blue and brown. No improvement at 1kHz at all, and the frequency noise part (f>2k or so) is worse when 9MHz was reduced. In Jenne's plot the improvement was pretty much 15 % or so over the large frequency region.
The second attachment is later in the morning. Blue is small RF9, green is large RF9.
In the latter there seem to be a difference at 100Hz but I don't know if this was due to high/low RF9 mod index.
Optical gain difference between high/low RF9 was no larger than a few % in both of the lock stretches.
Update (Jenne, Keita): Things makes more sense now.
In the attached, you should compare red (reduced RF9) with brown (not reduced) from the same lock stretch, or blue (not reduced) with pink (reduced) from another lock stretch. Legends are in UTC. In both of the cases, smaller modulation index increases the frequency noise in high kHz but seems to somewhat reduce noise at 100Hz.
It didn't make sense at first because there was an error in the legend of Jenne's plot.
Details:
Turns out that the legend for the brown trace (15:59:07, 9MHz back to normal) in Jenne's plot was incorrect, it was neither UTC nor local time, it was actually from 09:53:02 UTC, i.e yesterday. This means that all of her "9MHz reduced" traces are from today and all of "9MHz normal" traces are from yesterday.
But she intended to look at 15:59:07 UTC for brown trace, which was from today when 9MHz was reduced (but the CM gain setting was not changed to compensate). In the attached, red and brown are the same as Jenne's red and what Jenne intended to show in brown, these are from the same lock stretch.
Blue and pink are from another lock stretch later in the morning. (In this case, CM gain setting was changed to compensate for the optical gain.)
Low RF makes frequency noise worse at high-kHz due to lower S/N (pink VS blue). In the case of red VS brown, overall CM gain was lower, making the difference larger than pink VS blue.
To confuse the matter further, somehow at some point in yesterday the shot noise level seemed to have improved according to Sheila, and that is clearly seen in green trace from yesterday.
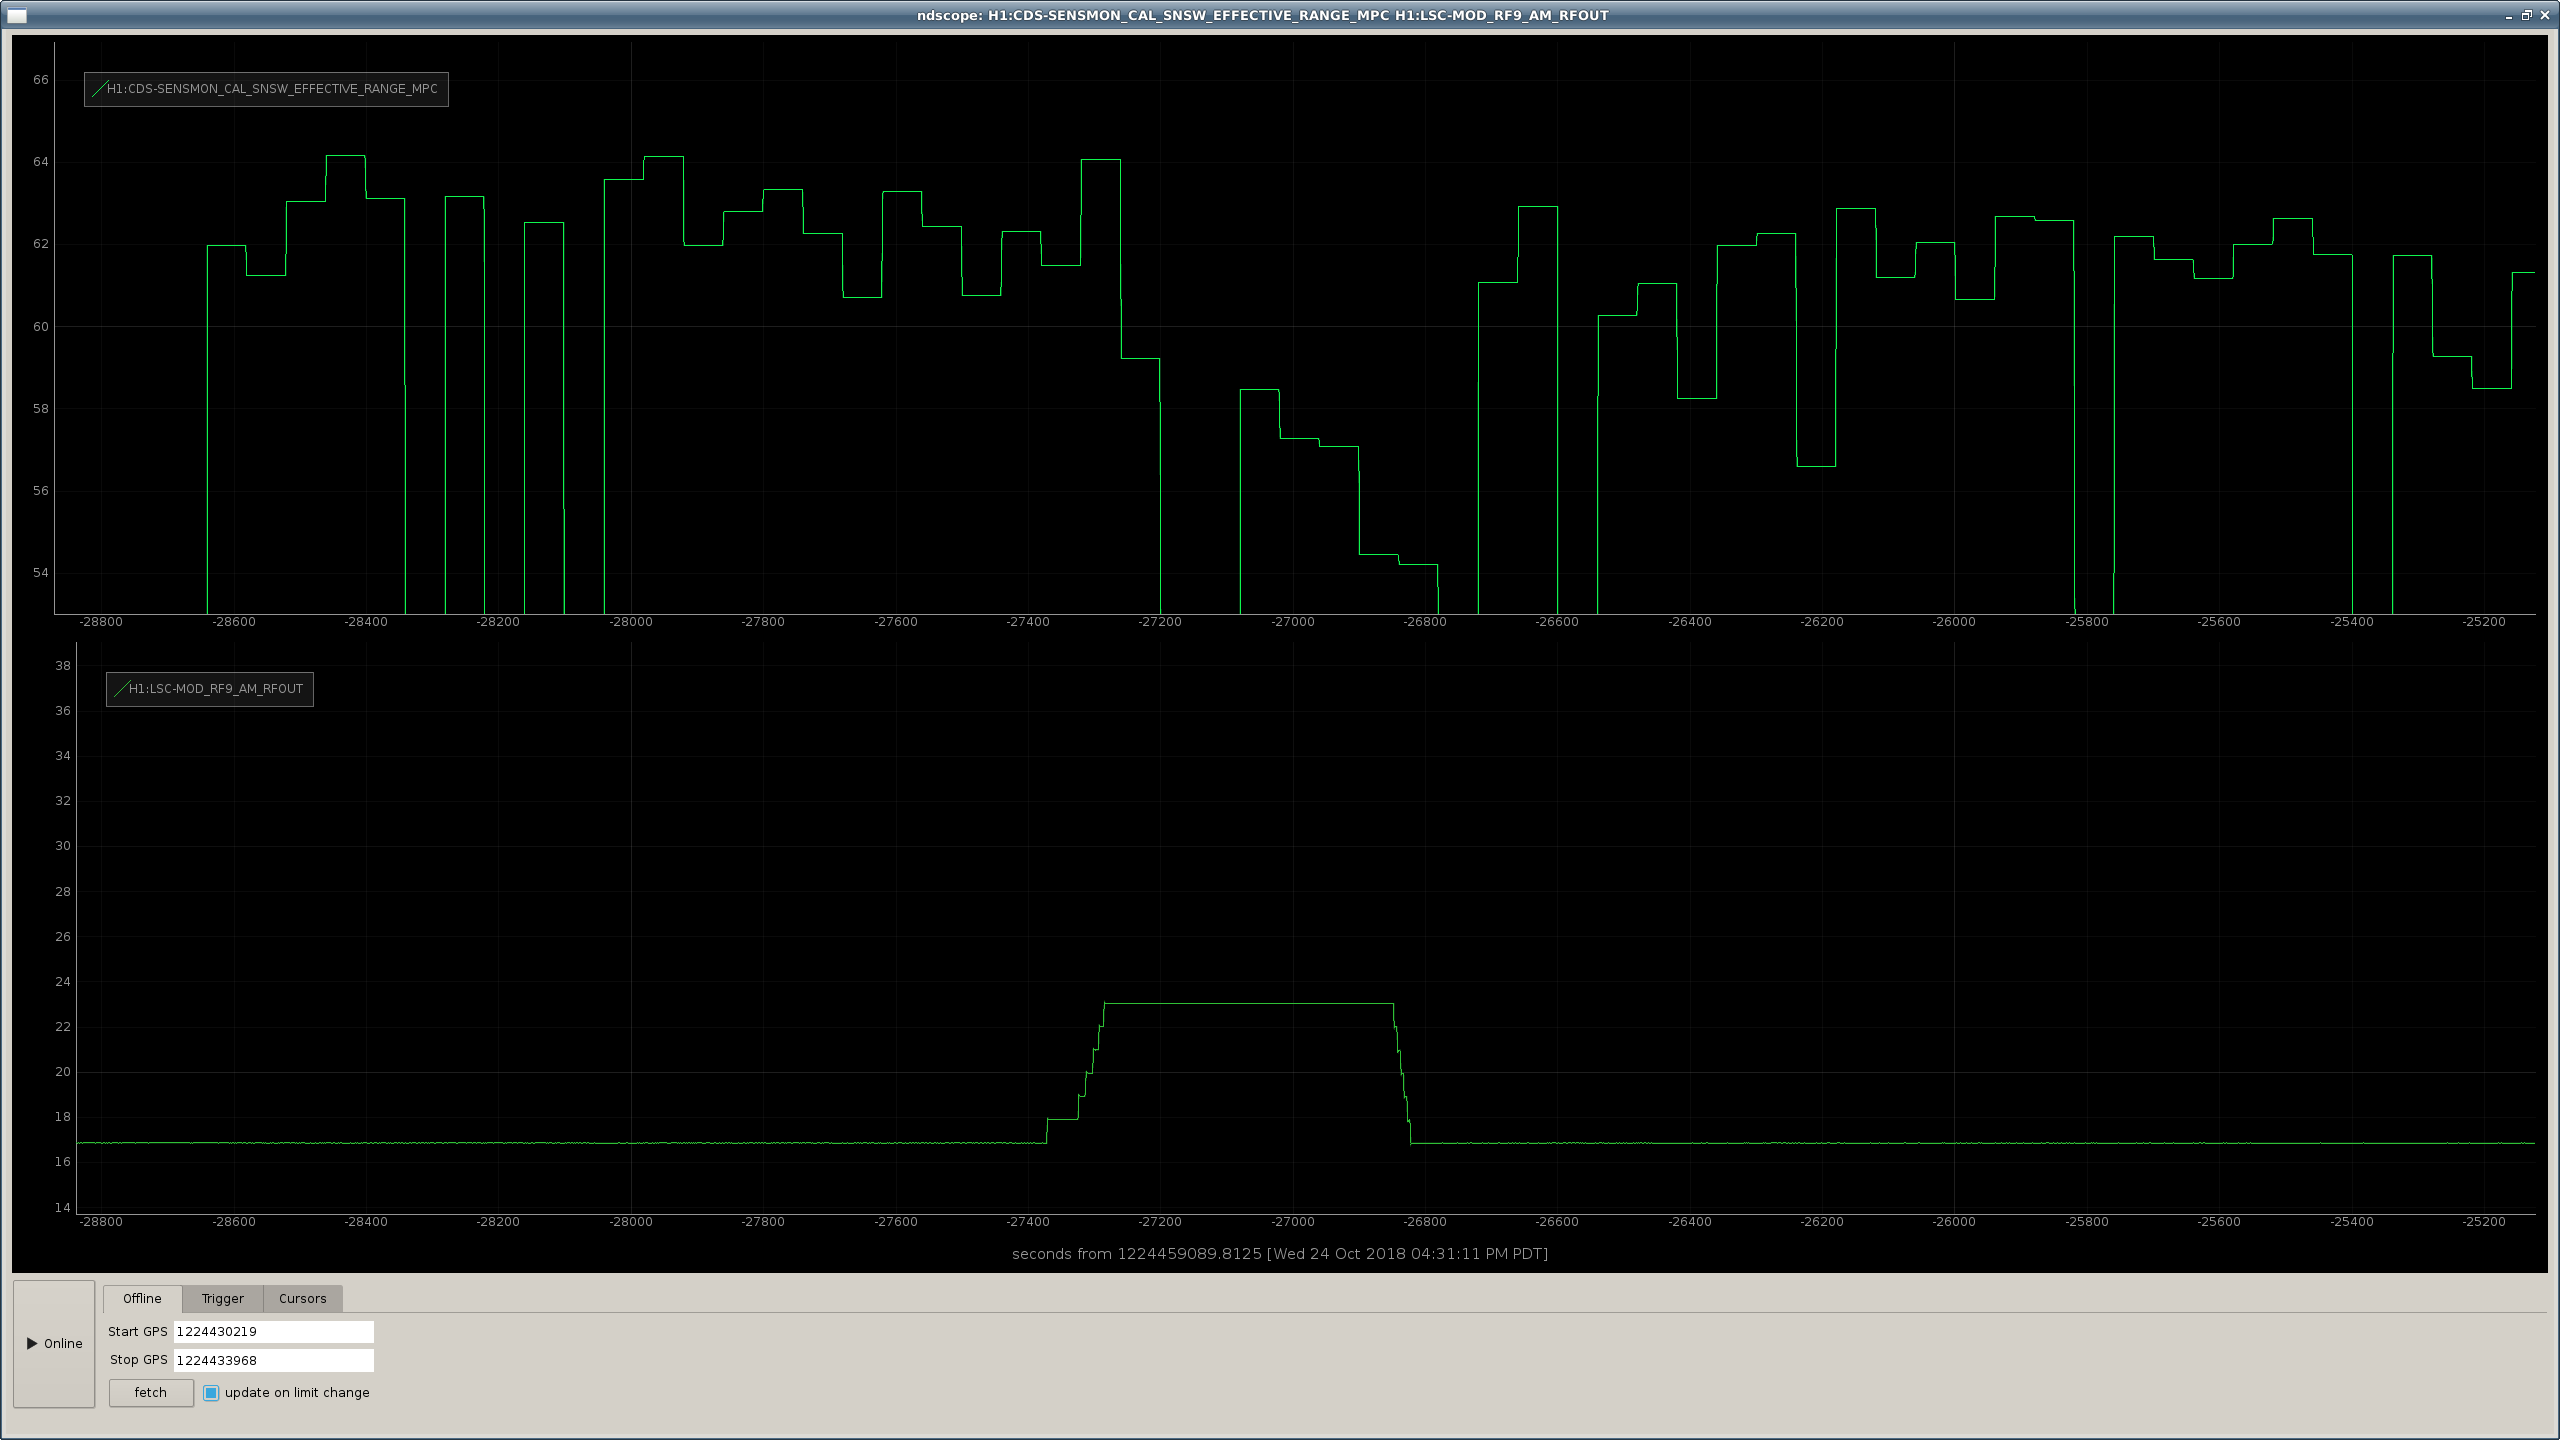
There is at least a bit of a change in the range during the on/off test that I meant to plot the times of from this morning. See attached.
I've modified EvanH's old stepping modulation depth script so that it will change the modulation depth, wait 10 min, then change it back, repeating 5 times. If the IFO is locked when the last person leaves for the night, please launch this (attached, and in /ligo/home/jenne.driggers/LHO_work/2018_10_24_9MHz_reduction/step_9MHz_many.py)
I modified Jenne's modification of step9.py so that the user can CTRL+C the skip at any point and the PD gains will all be returned to their original values when the script starting running. Useful for when we lose lock during the test.
Pressing Ctrl+C while the gains are changed and the interferometer is locked is not recommended: the script will instantaneously return all gains to original values.
Code lives in:
/ligo/home/craig.cahillane/utils/step9mod.py
Started a run of this code at Oct 25 2018 09:52:44 UTC (1224496382).
Yet another update:
For the moment I take back my statement about lower modulation index VS high kHz frequency noise, the coupling itself is slowly changing with time and I might have been tricked.
With the new front-end channels added to the GDS frame broadcaster channel list, I just restarted the testing calibration pipeline on DMT3. The restart occurred around GPS second 1224110900. The only feature we are unable to test at the moment is the calibration line subtraction, due to a few front-end channels that are still unavailable:
CAL-CS_TDEP_SUS_LINE1_REF_A_UIM_NOLOCK_REAL CAL-CS_TDEP_SUS_LINE1_REF_A_UIM_NOLOCK_IMAG CAL-CS_TDEP_SUS_LINE2_REF_A_PUM_NOLOCK_REAL CAL-CS_TDEP_SUS_LINE2_REF_A_PUM_NOLOCK_IMAG CAL-CS_TDEP_SUS_LINE3_REF_A_TST_NOLOCK_REAL CAL-CS_TDEP_SUS_LINE3_REF_A_TST_NOLOCK_IMAG
[Dave Barker, John Zweizig, Aaron Viets]
I restarted the calibration pipeline on the testing machine again to include calibration line subtraction, after Dave added the needed channels to the frame broadcaster. The restart occurred around GPS second 1224470390. John Z also restarted the DMTDQ process earlier today.