daniel.vander-hyde@LIGO.ORG - posted 22:43, Tuesday 16 October 2018 (44601)
SEI config state transitioned to WINDY_NO_BRSX
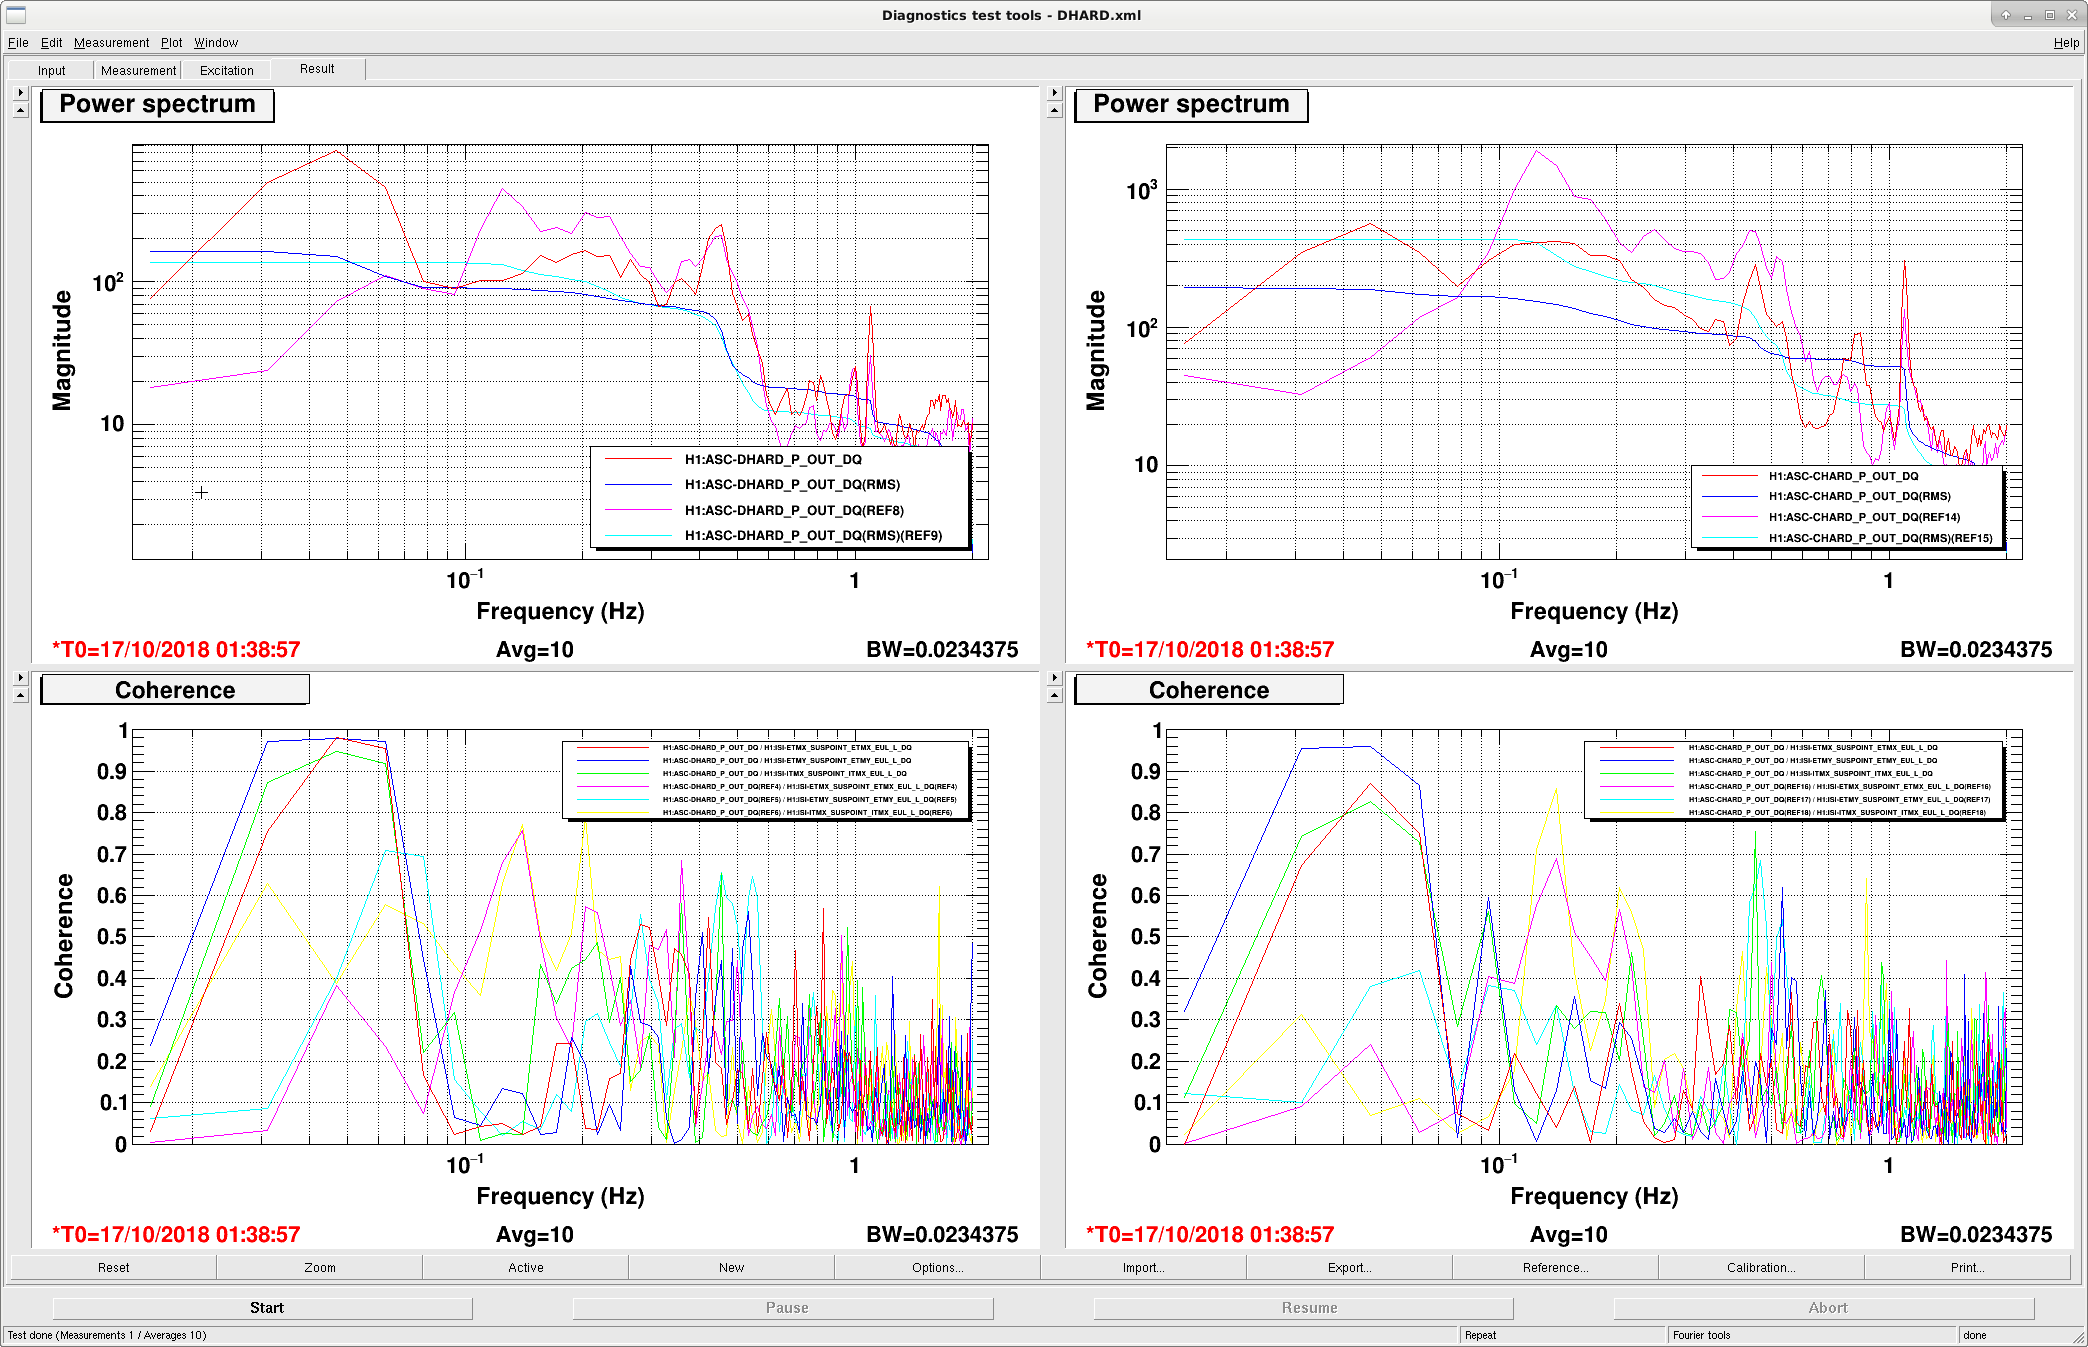
As the microseismic motion is rising back to its mean value, we tested again the performance of the ISIFF (currently L2P only; the ITMs have their filters updated in LHO:44406; the ETMs are still using their original filters). The microseismic motion was around 0.1-0.2 um/s in the 0.1-0.3 Hz band during the test. Please see the attached image for the results.
In the first plot we show the comparison for DHARD/CHARD ctrl output with and without ISIFF. The ref traces (pink/cyan/yellow) were without ISIFF and the red/blue/green ones with the ISIFF.
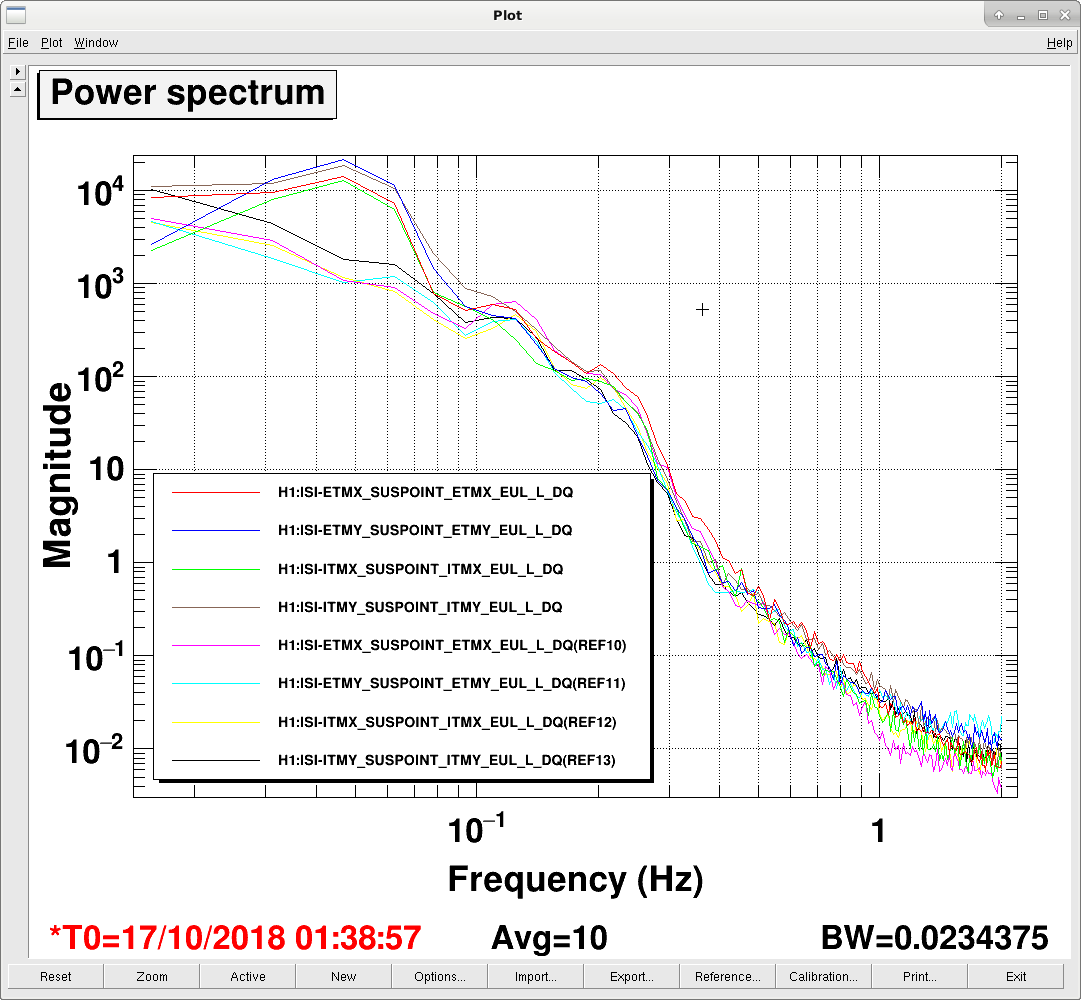
For DHARD we saw a factor of 2-3 reduction in the ctrl output in the 0.1-0.3 Hz microseismic band by turning on the ISIFF. The total rms got slightly worse, but it was because an earthquake happened during the ISIFF on measurement, causing the ground motion to be ~ 10 times larger around 0.05 Hz = 50 mHz, as shown in the second attached plot.
For CHARD the improvement was more significant. The peak at 0.12 Hz was reduced by a factor of 5, and the motion at 0.3 Hz by a factor of 3. A broadband reduction was seen from 0.1-0.7 Hz. Even an earthquake happened when we did the ISIFF on measurement, the overall ctrl rms was still reduced by a factor of 2.2 as we turned on the ISIFF.
Since CHARD has the largest noise contribution to DARM, reducing its motion should allow us reducing the required UGF for the CHARD loop a bit. Due to the constrains from radiation pressure torque we might not be able to reduce it below 2 Hz. However it is possible to push it down to maybe 2.5 Hz or so.
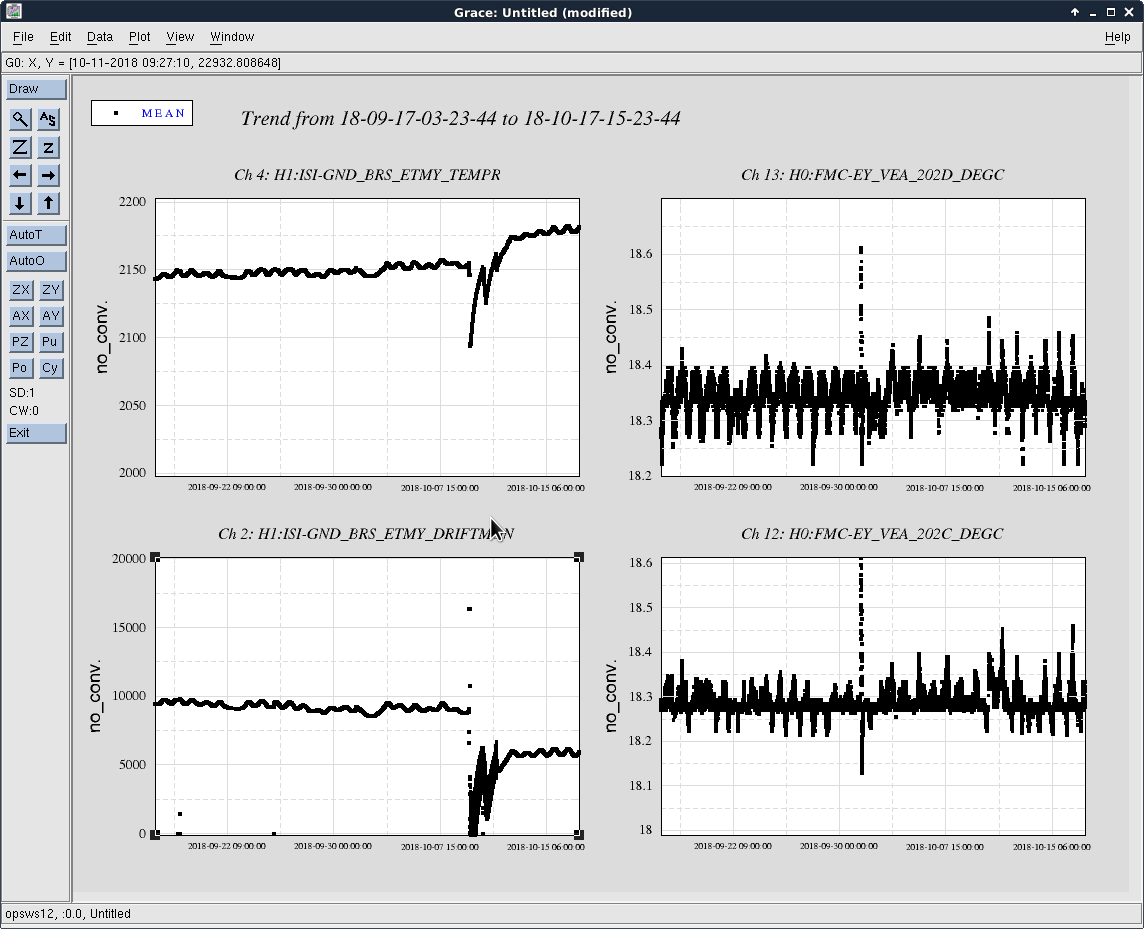
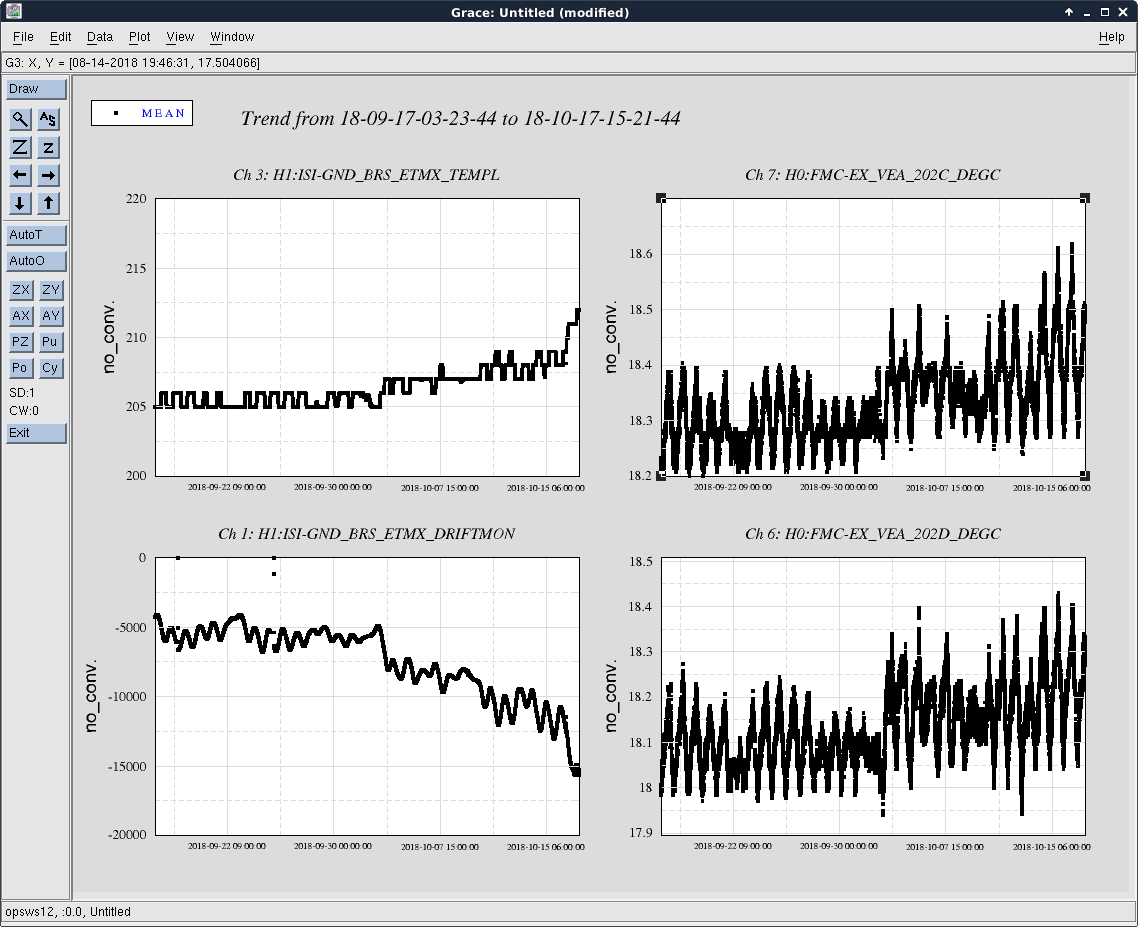
Attached plot shows 30 day trends of both BRSs DC positions and a temperature sensor in each box. Plots on the left are the DC position, plots on the right are the temps, EY is on top, EX is on bottom. It looks like both buildings have been heating up for a while, but BRSX is closer to it's limit and the temperature drift if pushing BRSX close to it's limits. The temperature in the box at EX is also about a half deg C higher than 30 days ago and that temperature is less stable now. This was going bad on it's own over the last two weeks, but the EX situation is made worse by my incursion today. I could re-balance if needed, but that's not a zero risk activity.

I'm attaching trends comparing both endstations for the last 30 days. For each plot, bottom left subplot is DC position of the BRS, top left is the temperature sensor in the box, and right side subplots are FMCS temperature sensors that seemed to have the strongest relationship to the BRS. First plot is EY, the upward tick in BRS temperature is me adding the thermos packs to the enclosure last week, this seems to have caused the equilibrium temp in the box to have moved up about .2 deg C, the building temps have been pretty stable over the whole period though. The second plot is the same for EX, with all the subplot ranges scaled to match the EY plot. Every sensor at EX sees about a factor of 2 greater peak to peak daily range than EY. Additionally, the EX temperatures see a couple of temperature bumps over the last two weeks and the day to day variation seems to have gotten worse over that same time period.
I probably still have to rebalance BRSX after the work yesterday, but this isn't something we want to be dealing with every month, and this could be increasing BRS noise at very low frequencies.
Filed FRS ticket 11660.
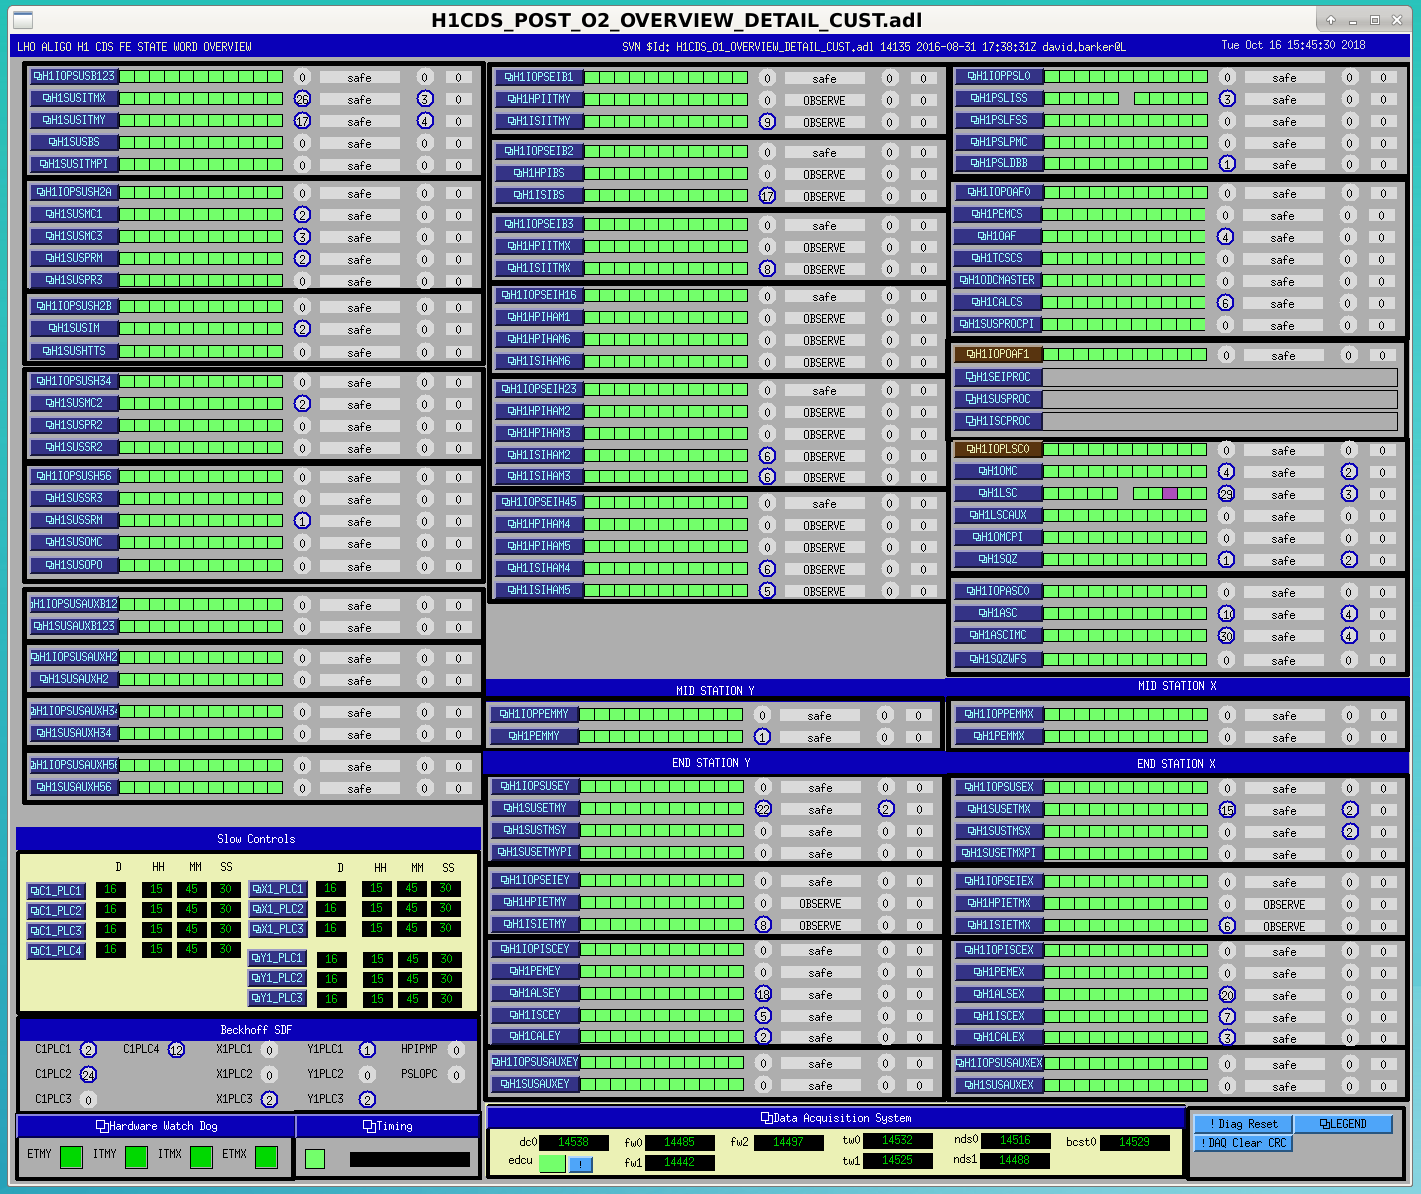
Attached is a plot of the new CDS Overview MEDM.
HWWD and Timing share lower-left area
Conlog and IFO removed
DAQ and commands moved down to share bottom-right area
Mid and End Stations slid downwards to make space for h1oaf1
top column header line removed, corner station slid upwards to make additional space for h1oaf1
h1oaf1 added below h1oaf0, currently only the h1iopoaf1 model is running on this computer
placeholders for new models h1seiproc, h1susproc, h1iscproc added *
h1iopoaf1 and h1ioplsc0 have a colour change to denote they are Dolphin timer master and slave units respectively **
* note that current place holders are not quite in the correct locations. h1oaf model will move to h1oaf1 computer and the new h1seiproc will most probably run on h1oaf0 computer due to its slow speed (4kH).
** h1oaf1 is unique in that it has no IO Chassis and obtains its timing from h1ioplsc0 via Dolphin. h1ioplsc0 is the timing master, h1iopoaf1 is a virtualIOP timing slave. This means that restarting h1ioplsc0 will require a restart of all the models on h1oaf1.
In the second attachment, the h1iopoaf1 virtualIOP GDS screen is shown against an regular IOP model. Note:

TITLE: 10/16 Day Shift: 15:00-23:00 UTC (08:00-16:00 PST), all times posted in UTC
STATE of H1: Commissioning
INCOMING OPERATOR: None
SHIFT SUMMARY: Maintenance recovered. Locking/commissioning underway, TCS settings are being tested.
LOG: See attached
Last evening, with Patrick Godwin's help, the FrontEnd (35-W laser) that has been sitting outside the H1 Ante-room since July 9 (Link) was moved to the optics lab.
Today, the 35-W amplifier was removed to access the underside where the quick-connect water fittings are mounted.
These fittings have internal valves (on both sides of the connection) to prevent water drips when they are disconnected.
It appears that it will be easy to replace them with similar fittings that don't have the internal shut off valves. We plan to replace the large red hoses with the same hose (8 mm OD, 6 mm ID) that was provided for the new 70-W amplifier (Link).
The CPC fittings we want appear to be:
Laser-side bulkhead fittings:
PLC12004 body, panel mount, 1/4" PTF (hoses on the amplifier side are nominally 1/4" OD - 6 mm x 4 mm x 1 mm wall)
PLC40004 insert, panel mount, 14" PTF
Hose ends"
PLC13006 body, free floating, 3/8" PTF
PLC20006 insert, free floating, 3/8" PTF
Photos in the attached .pdf composite file.
We'll replace the fittings in this unit, then make plans to replace the fittings and hoses in the H1 unit when we have the opportunity.
Note that one of the hoses (4 x 2 x 1 mm tubing) under the 35-W amplifier is significantly "kinked." This might need to be replaced. We'll share the photos with Maik and Basti at NeoLASE to see what they think.
The FrontEnd laser is partially disassembled and covered with Ameristat on the South end of the larger optical table in the center of the OSB Optics Lab awaiting the replacement fittings.
WP7878 Remove CP3 Thermocouple channels from cell phone alarms
Chandra, Dave:
The CP3 TE202A channels were removed from the cell phone alarm system.
WP7826 new h1oaf1 front end computer
Dave:
The new V4 h1oaf1 computer was joined to the Dolphin fabric using node_id=64. The new h1iopoaf1 model was started. For now I will just run the IOP model on the front end to check for stabilty.
WP7876 new h1sqz model
Daniel, Dave:
A new h1sqz model was installed.
WP 7850 New h1calcs model
Jeff K, Evan G:
New h1calcs model was installed.
Beckhoff SQZ code change
Daniel, Dave:
new h1ecatc1plc4 code was installed. Generated new DAQ ini file, new burt files, new SDF monitor file. h1sysecatc1plc4sdf faux-model was restarted and new channels were accepted and monitored en masse.
DAQ Restart
Dave:
DAQ was restarted at 11:42 to synchronize to new h1sqz, h1calcs, h1ecatc1plc4 INI files, and to add the new h1iopoaf1 model.
I have long been concerned about the IO High Power Beam Dump (IO HPBD) at the North End of the PSL table, and it's cooling hoses hanging down from the beam dump, as a source of PSL table vibration.
I talked to Jason about doing a quick test, buy putting strain relief on the IO HPBD, and then looking at the PSL accelerometers. The hoses are taped the side of the NE corner of the PSL table, wrapped in foam, so no direct contact with the table, and the hoses are not touching each other.
The results are clear, this change reduced the accelerometers broadband noise, and eliminated peaks in the Periscope accelerometers at 413Hz. There are some peaks and broadband noise that increased, but I'm not worried about that, since we literally used tape, and the decrease and elimination of other peaks shows that careful strain relief of cooling lines will have a positive effect on the PSL table motion.
The IO HPBD also needs a better mount, as it's a very heavy component, made from metal plates and SiC plates, and currently it is mounted with a post and fork clamp.
No a bad result, for three pieces of tape, a small bit of foam.
Plots show power spectrums for all PSL ACCs, and coherence between the Periscope X and Y ACCs and the table Accs.
In the plots, all data from yesterday, 10/15, at 19:17UTC are shown in black, and data from today, 10/16, at 19:17UTC are shown in colors other than black.
- Jason, Cheryl


Neat result, and thanks for the description and plots!!
Would it be too much to ask for a before photo and after photo overlaid onto a plot of the most insightful channel(s), with clear before/after labels? I am having trouble sifting through the >10 plots and trying to make sense of the various channels and states - some plots that I would expect to see no peak I see peaks, and I suspect I am just misinterpreting the state of the system when the data was captured.
Here are the considerations, references, and proposed candidates for O3 calibration lines.
Goals:
1) Move SUS, PCAL, DARM lines to lower frequencies between 15Hz - 20 Hz. Now there are four lines: UIM, PUM, TST, PCAL.
2) Move optical gain cavity pole line to ~ 425 Hz
We've used the following criteria to determine what those frequencies should be: The original criteria are in 2014 aLog.
(1) Avoid SUS rigid body resonances and violin mode frequencies
(2) Avoid known pulsar frequencies
(3) Avoid 60 [Hz] power line and harmonics
(4) Avoid the most sensitive region of the IFO ~50-100 [Hz]
(5) Avoid integer number frequencies, ensure frequencies are not harmonics of each other
(6) Use different calibration line frequencies per interferometer
(7) At least 0.5Hz separation between two calibration lines
SUS rigid body resonances:
| B (Hz) | R (Hz) | |
| QUAD | (see LHO alog) | highest at 13.927 |
| BSFM | 17.54 | 25.74 |
| HLTS | 28.10 | 44.72 |
| HSTS | 27.32 | 40.369 |
Known pulsar frequencies: (see pulsar gaps veto alog, may need to rerun and update)
Violin mode frequency (see tech doc)
Proposed line frequencies:
(1) Choose 8 frequencies between 15Hz - 20Hz: (at least meet the 0.1Hz non-vetoed bands in pulsar gaps veto alog, because the 0.5Hz non-vetoed bands are not enough)
LLO - Stay with the current choices - 15.7Hz, 16.3Hz, 16.9 Hz (this one meets 0.5Hz non-vetoed bands) (see alog), and add one more 18.1Hz (this one meets 0.5Hz non-vetoed bands)
LHO - 15.5Hz (this one meets 0.5Hz non-vetoed bands), 16.7Hz (this one meets 0.5Hz non-vetoed bands), 18.3Hz, 18.9Hz
(2) Choose optical gain cavity pole line: LLO - 441.7Hz, LHO - 443.3Hz
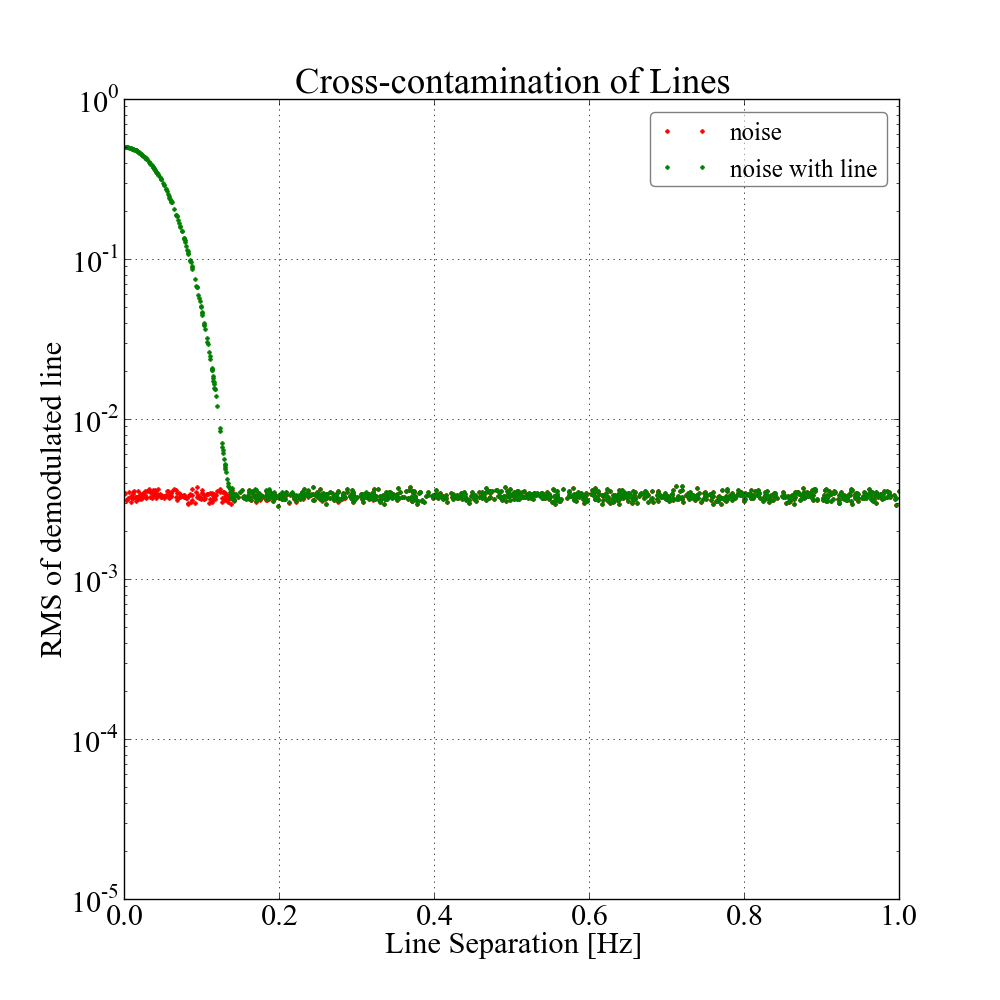
I did a quick study to assess cross-contamination of calibration lines that are close to each other in frequency. This was in relation to criterion #7, which is primarily motivated by stochastic searches. However, the purpose of the study was to determine how close in frequency two lines can be to each other before they start to affect measurements of each other. The test I did was to generate white noise an a sinusoid with a frequency of 16.3 Hz (one of LLO's line frequencies) with a line height comparable to the calibration lines. This data was demodulated at a randomly-generated frequency between 16.3 Hz and 17.3 Hz using the same algorithm used in the gstlal calibration pipeline to demodulate the calibration lines. The RMS of the result was plotted as a function of frequency-separation (first plot). It is seen that the signal is not visible beyond a separation of 0.15 Hz. Note, the kappas are median'ed and averaged for an additional 138 seconds, which would further reduce the signal.
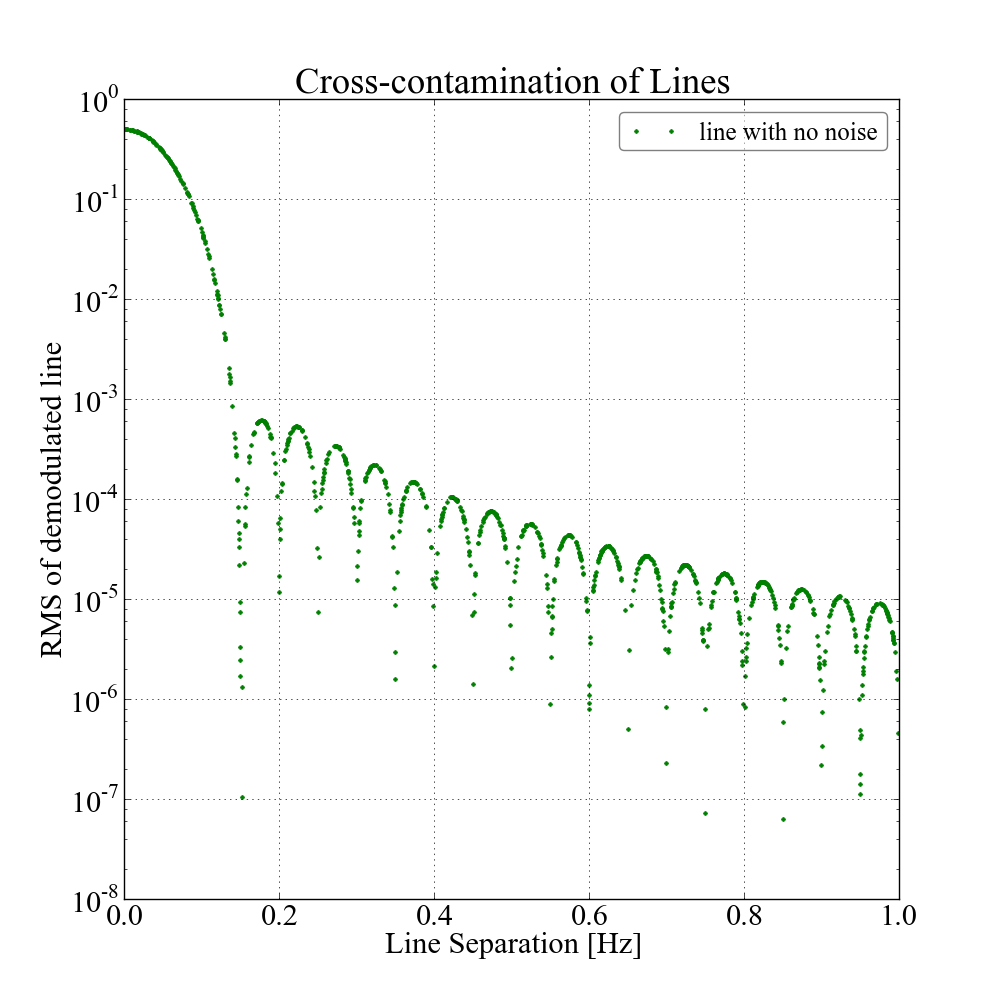
The second plot is similar, but without any white noise. It looks like the Fourier transform of a Blackman window, due to the fact that a 20-second Blackman window is used as a low-pass filter for demodulation. This shows that the separation between lines should be at least 3/T, where T is the length of the low-pass filter. Additionally, optimal frequency separations are given by (3 + n) / T, where n = 0, 1, 2, ...
I don't know the details of the demodulation technique used by the front-end calibration pipeline (i.e., low-pass filtering), but this result is valid for the gstlal calibration pipeline.
In case we need to choose different frequencies in the future, an added requirement will need to be avoiding the ADS lines that are used for alignment control.
The squeezer model now includes a power stabilization servo for driving a green AOM.
The following features were added to the TwinCAT code:

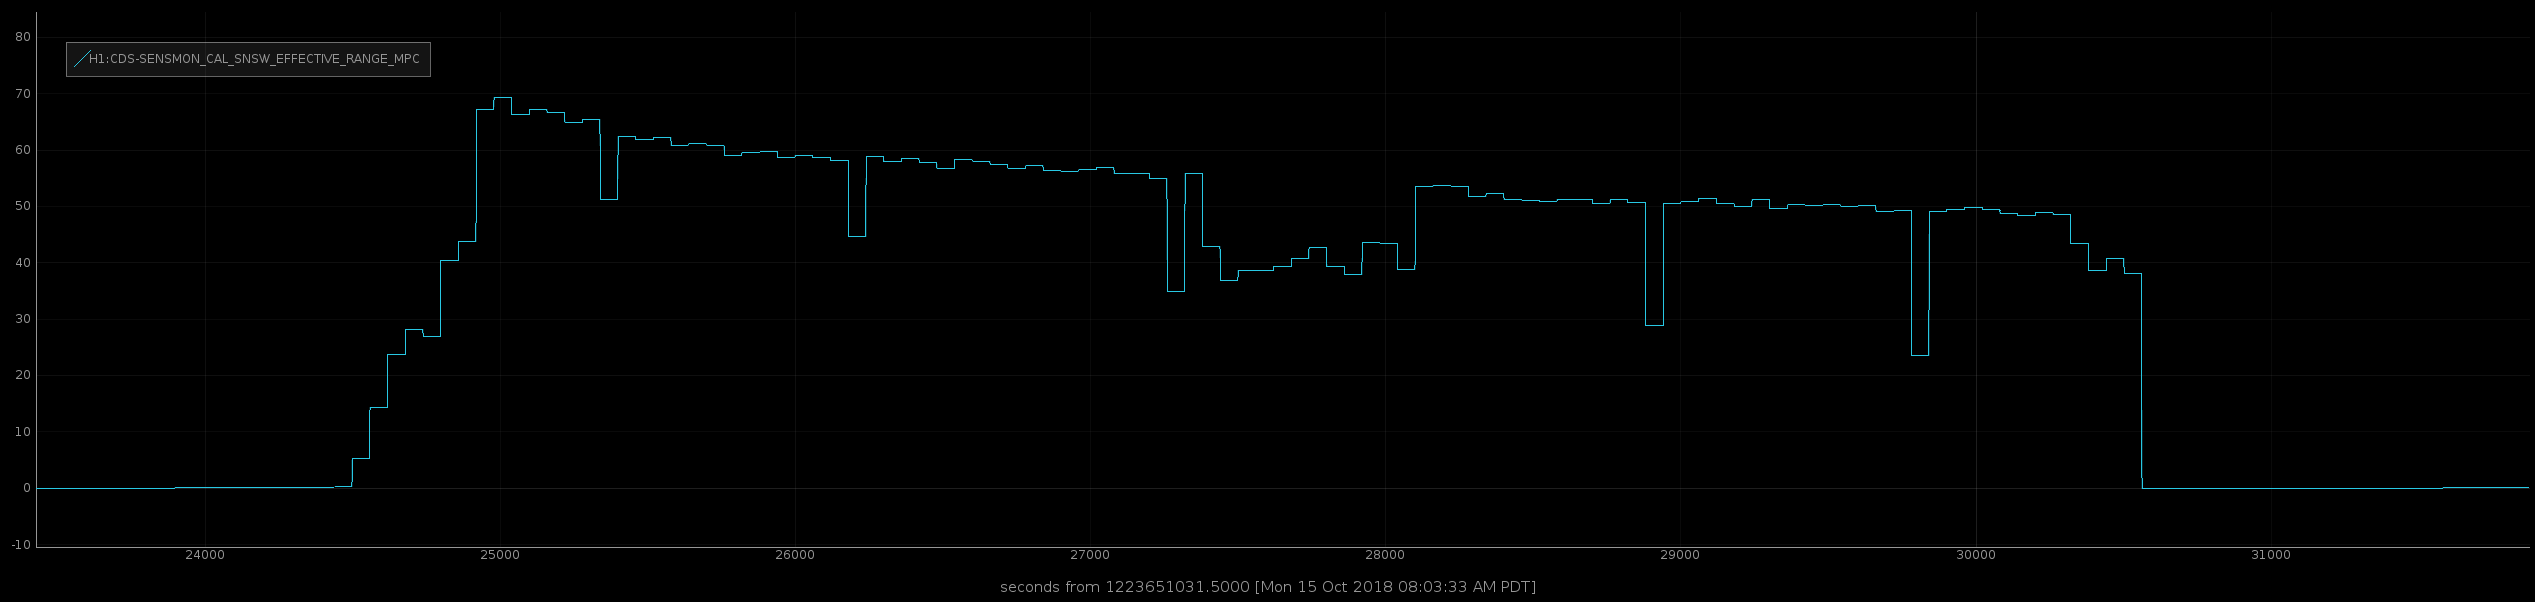
During all lock stretches, the sensitivity steadily degrades over time. The plot below shows the range trend over one of the last locks.
I picked a few times during the lock, when there were likely no actions on the IFO, and computed the DARM spectrum. The evolution is shown below
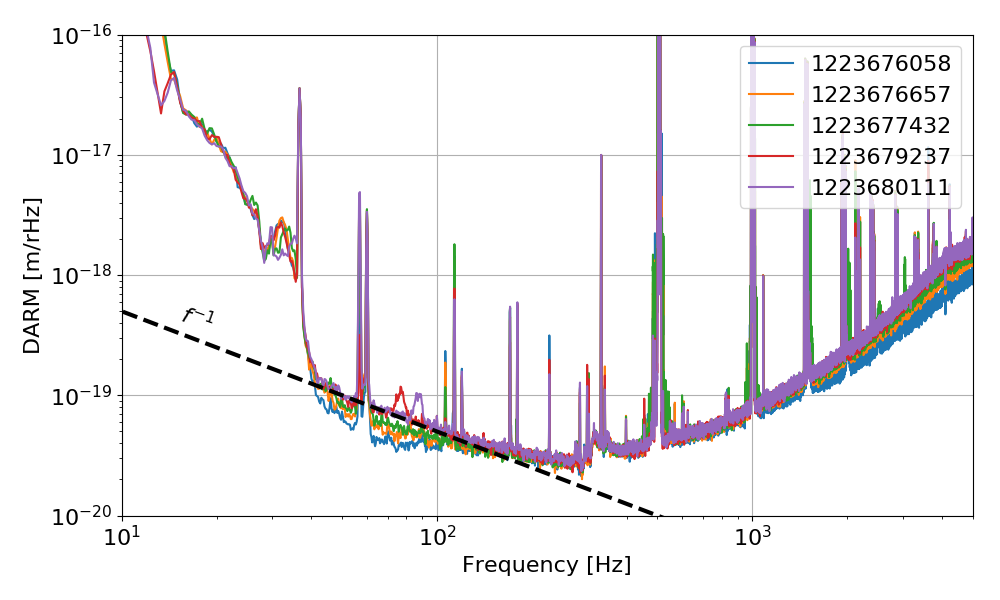
Clearly, what degrades the sensitivity is very well approximated by a 1/f displacement noise.
Here's a comparison of degrading sensitivity over another long lock stretch. Similar 1/f noise
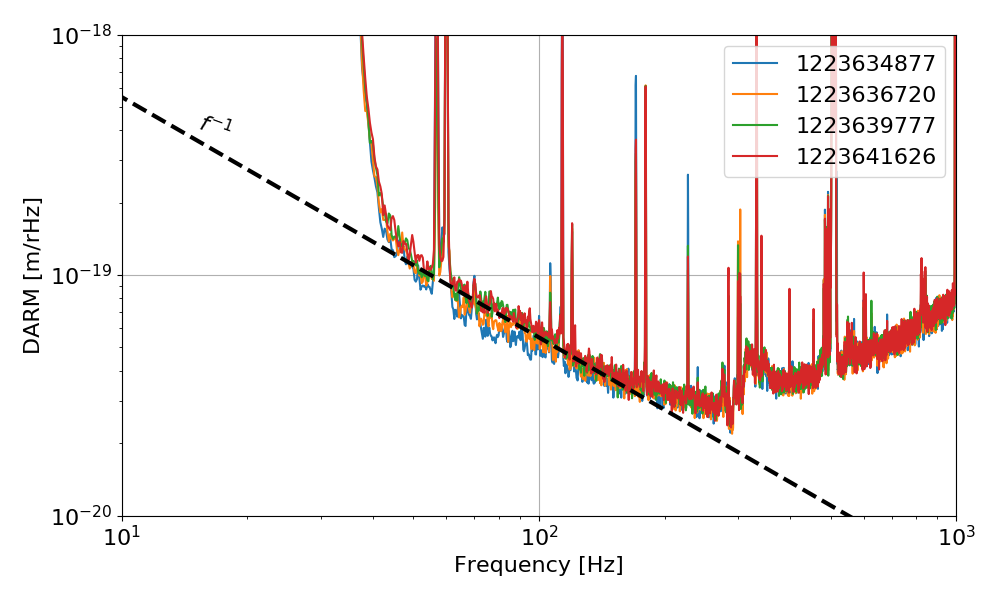
This seems to be the same noise that we saw when the CARM noise gain was accidentally low. As the high frequency noise get worse (presumably because the frequency noise coupling get worse) the noise at 100 Hz gets worse.
BruCo is running again on ldas-pcdev12. Here are two scans comparing the "low" and "high" noise times:
Low noise: https://ldas-jobs.ligo.caltech.edu/~gabriele.vajente/bruco_1223676058/
High noise: https://ldas-jobs.ligo.caltech.edu/~gabriele.vajente/bruco_1223680111/
It's CM settings that were somehow screwed up on Sunday evening. (Craig, Keita)
As noted in alog 44533 CM gain used to be low (that's what Sheila was talking about when she wrote "CM gain was accidentally low") before Craig changed in on Oct/11, and after the change the frequency noise (in kHz range) as well as 100Hz noise got better.
It stayed that way for 3.5 days or so, but the bad behavior came back on 2018/Oct/14 23:30 UTC and it stayed bad since then (first attachment.) That's Sunday 16:30 Pacific or so.
It turns out that CM settings were somehow changed (second attachment) at that time though people were not working on CM at all (second attachment).
I and Craig are trying to figure out what happened.
Note that when it was really bad the excess noise was not smooth, it had a bump (e.g. look at this plot from alog 44533).


Somehow, between the time Keita pointed out as "Something Happened" and the previous lock, there was an error added to step 13 of CARM_TO_ANALOG:


if self.counter == 13 and self.timer['wait']:
    if ezca['IMC-REFL_SERVO_IN2GAIN'] < 0:
        ezca['IMC-REFL_SERVO_IN2GAIN'] += 1 # from -12 to 0 dB
        ezca['LSC-MCL_GAIN'] *= round(10**(1./20),4) # from 34.6 to 47.6 dB
    else:
        self.timer['wait'] = 0.5
        self.counter += 1
    self.counter += 1


This error basically caused CARM_TO_ANALOG to skip this step without adding an additional 11 dB of gain to CARM.
The line highlighted in red has been removed.  Our frequency noise suppression should return.

As a test of 1/f noise, we can get to NOMINAL LOW NOISE and reduce the CARM gain to see if this low frequency coupling changes somehow.

D. Barker, J. Kissel
WP 7850
ECR E1800246
IIET 11305

Some more belated documentation in support of the front-end model changes that we made last week in order to support new / updated calibration code for O3:
Below is an explicit list of front-end generated channels that need to be removed from the GDS broadcaster, and a list of the new channels that should be used instead and/or replaced. It's also attached for any user's convenience.
One can cross-reference the list of new (slow) channels in our documentation that supports the new calculation for time-dependence, T1700106.

Channels to be removed:

FAST CHANNELS:
    CAL-CS_LINE_SUM_DQ                           # Agreed, disappears (DARM_LINE no longer exists)
    CAL-DARM_CTRL_WHITEN_OUT_DBL_DQ              # Agreed, replaced by simply DARM_CTRL_DQ (which is, yes, whitened, and stored as a double)
    CAL-DARM_ERR_WHITEN_OUT_DBL_DQ               # Agreed, replaced by simply DARM_ERR_DQ (which is, yes, whitened, and stored as a double)
    CAL-INJ_ODC_CHANNEL_OUT_DQ                   # Agreed, removed because we'll never do hardware injections from the cornerstation (i.e. on the ESD)

SLOW CHANNELS:
    CAL-CS_TDEP_DARM_LINE1_REF_A_TST_IMAG        # Agreed, disappears (no more DARM_LINE)
    CAL-CS_TDEP_DARM_LINE1_REF_A_TST_REAL        #      |
    CAL-CS_TDEP_DARM_LINE1_REF_A_USUM_IMAG       #      |
    CAL-CS_TDEP_DARM_LINE1_REF_A_USUM_INV_IMAG   #      |
    CAL-CS_TDEP_DARM_LINE1_REF_A_USUM_INV_REAL   #      |
    CAL-CS_TDEP_DARM_LINE1_REF_A_USUM_REAL       #      V
    CAL-CS_TDEP_DARM_LINE1_UNCERTAINTY           #      --
    CAL-CS_TDEP_ESD_LINE1_REF_A_TST_NOLOCK_IMAG        # Agreed, disappears (renamed to SUS_LINE1)
    CAL-CS_TDEP_ESD_LINE1_REF_A_TST_NOLOCK_REAL        # Agreed, disappears (renamed to SUS_LINE1)
    CAL-CS_TDEP_ESD_LINE1_REF_C_IMAG                   # Agreed, disappears (renamed to SUS_LINE1)
    CAL-CS_TDEP_PCALY_LINE1_UNCERTAINTY                # Agreed -- made generic to P    CAL_LINE1
    CAL-CS_TDEP_PCALY_LINE2_REF_A_TST_IMAG             # Agreed -- made generic to PCAL_LINE2
    CAL-CS_TDEP_PCALY_LINE2_REF_A_TST_REAL             #     |
    CAL-CS_TDEP_PCALY_LINE2_REF_A_USUM_IMAG            #     |
    CAL-CS_TDEP_PCALY_LINE2_REF_A_USUM_REAL            #     |
    CAL-CS_TDEP_PCALY_LINE2_REF_C_NOCAVPOLE_IMAG       #     |
    CAL-CS_TDEP_PCALY_LINE2_REF_C_NOCAVPOLE_REAL       #     |
    CAL-CS_TDEP_PCALY_LINE2_REF_D_IMAG                 #     |
    CAL-CS_TDEP_PCALY_LINE2_REF_D_REAL                 #     V
    CAL-CS_TDEP_PCALY_LINE2_UNCERTAINTY                #     --
    CAL-CS_TDEP_PCALY_LINE3_UNCERTAINTY                # Agreed -- made generic to PCAL_LINE3
    CAL-CS_TDEP_PCALY_LINE4_REF_A_TST_IMAG             # Agreed -- made generic to PCAL_LINE2
    CAL-CS_TDEP_PCALY_LINE4_REF_A_TST_REAL             # Agreed -- made generic to PCAL_LINE4
    CAL-CS_TDEP_PCALY_LINE4_REF_A_USUM_IMAG            #     |
    CAL-CS_TDEP_PCALY_LINE4_REF_A_USUM_REAL            #     |
    CAL-CS_TDEP_PCALY_LINE4_REF_C_NOCAVPOLE_IMAG       #     |
    CAL-CS_TDEP_PCALY_LINE4_REF_C_NOCAVPOLE_REAL       #     |
    CAL-CS_TDEP_PCALY_LINE4_REF_D_IMAG                 #     V
    CAL-CS_TDEP_PCALY_LINE4_REF_D_REAL                 #     --
    CAL-CS_TDEP_REF_CLGRATIO_CTRL_IMAG                 # Agreed -- no longer needed
    CAL-CS_TDEP_REF_CLGRATIO_CTRL_REAL                 # Agreed -- no longer needed
    CAL-CS_TDEP_REF_INVA_CLGRATIO_TST_IMAG             # Agreed -- renamed to (for a given SUS_LINE) INVA_$(ISOSTAGE)_RESPRATIO
    CAL-CS_TDEP_REF_INVA_CLGRATIO_TST_REAL             # Agreed -- renamed to (for a given SUS_LINE) INVA_$(ISOSTAGE)_RESPRATIO


New Channel List:

FAST CHANNELS:
('IFO generic channel name' 'sample rate' 'data storage type')
(when sample rate not listed, rate is 16384 Hz)
   CAL-CS_DARM_ERR_DQ double
   CAL-CS_DARM_CTRL_DQ double

   CAL-CS_DELTAL_RESIDUAL_DQ double
   CAL-CS_DELTAL_CTRL_DQ 4096 double
   CAL-CS_DELTAL_CTRL_TST_DQ 4096 double
   CAL-CS_DELTAL_CTRL_PUM_DQ 4096 double
   CAL-CS_DELTAL_CTRL_UIM_DQ 4096 double
   CAL-CS_DELTAL_EXTERNAL_DQ

   CAL-CS_CFTD_DELTAL_RESIDUAL_DQ double
   CAL-CS_CFTD_DELTAL_CTRL_DQ 4096 double
   CAL-CS_CFTD_DELTAL_CTRL_TST_DQ 4096 double
   CAL-CS_CFTD_DELTAL_CTRL_PUM_DQ 4096 double
   CAL-CS_CFTD_DELTAL_CTRL_UIM_DQ 4096 double
   CAL-CS_CFTD_DELTAL_EXTERNAL_DQ

SLOW CHANNELS:
   CAL-CS_TDEP_PCAL_LINE1_CORRECTION_REAL
   CAL-CS_TDEP_PCAL_LINE1_CORRECTION_IMAG
   CAL-CS_TDEP_PCAL_LINE2_CORRECTION_REAL
   CAL-CS_TDEP_PCAL_LINE2_CORRECTION_IMAG
   CAL-CS_TDEP_PCAL_LINE4_CORRECTION_REAL      # yes 4, not 3
   CAL-CS_TDEP_PCAL_LINE4_CORRECTION_IMAG
   CAL-CS_TDEP_SUS_LINE1_REF_INVA_UIM_RESPRATIO_REAL
   CAL-CS_TDEP_SUS_LINE1_REF_INVA_UIM_RESPRATIO_IMAG
   CAL-CS_TDEP_SUS_LINE2_REF_INVA_PUM_RESPRATIO_REAL
   CAL-CS_TDEP_SUS_LINE2_REF_INVA_PUM_RESPRATIO_IMAG
   CAL-CS_TDEP_SUS_LINE3_REF_INVA_TST_RESPRATIO_REAL
   CAL-CS_TDEP_SUS_LINE3_REF_INVA_TST_RESPRATIO_IMAG
   CAL-CS_TDEP_PCAL_LINE2_REF_C_NOCAVPOLE_REAL
   CAL-CS_TDEP_PCAL_LINE2_REF_C_NOCAVPOLE_IMAG
   CAL-CS_TDEP_PCAL_LINE4_REF_C_NOCAVPOLE_REAL
   CAL-CS_TDEP_PCAL_LINE4_REF_C_NOCAVPOLE_IMAG
   CAL-CS_TDEP_PCAL_LINE2_REF_D_REAL
   CAL-CS_TDEP_PCAL_LINE2_REF_D_IMAG
   CAL-CS_TDEP_PCAL_LINE4_REF_D_REAL
   CAL-CS_TDEP_PCAL_LINE4_REF_D_IMAG
   CAL-CS_TDEP_PCAL_LINE2_REF_A_UIM_REAL
   CAL-CS_TDEP_PCAL_LINE2_REF_A_UIM_IMAG
   CAL-CS_TDEP_PCAL_LINE2_REF_A_PUM_REAL
   CAL-CS_TDEP_PCAL_LINE2_REF_A_PUM_IMAG
   CAL-CS_TDEP_PCAL_LINE2_REF_A_TST_REAL
   CAL-CS_TDEP_PCAL_LINE2_REF_A_TST_IMAG
   CAL-CS_TDEP_PCAL_LINE4_REF_A_UIM_REAL
   CAL-CS_TDEP_PCAL_LINE4_REF_A_UIM_IMAG
   CAL-CS_TDEP_PCAL_LINE4_REF_A_PUM_REAL
   CAL-CS_TDEP_PCAL_LINE4_REF_A_PUM_IMAG
   CAL-CS_TDEP_PCAL_LINE4_REF_A_TST_REAL
   CAL-CS_TDEP_PCAL_LINE4_REF_A_TST_IMAG
   CAL-CS_TDEP_SUS_LINE1_REF_UIM_NOLOCK_REAL
   CAL-CS_TDEP_SUS_LINE1_REF_UIM_NOLOCK_IMAG
   CAL-CS_TDEP_SUS_LINE2_REF_PUM_NOLOCK_REAL
   CAL-CS_TDEP_SUS_LINE2_REF_PUM_NOLOCK_IMAG
   CAL-CS_TDEP_SUS_LINE3_REF_TST_NOLOCK_REAL
   CAL-CS_TDEP_SUS_LINE3_REF_TST_NOLOCK_IMAG


This should help alleviate some of the problems that folks have been having with the GDS Broadcaster since last week's upgrade (e.g. LHO aLOG 44454).
In addition to Jeff's list, the GDS calibration pipeline also needs these:
Fast channels:
Slow channels (all 16 Hz):
The following channels in the list of channels to be added do not ppear in the H-H1_R frames:

CAL-CS_DARM_ERR_DQ
CAL-CS_DARM_CTRL_DQ
CAL-CS_DELTAL_RESIDUAL_DQ
CAL-CS_DELTAL_CTRL_DQ
CAL-CS_DELTAL_CTRL_TST_DQ
CAL-CS_DELTAL_CTRL_PUM_DQ
CAL-CS_DELTAL_CTRL_UIM_DQ
CAL-CS_DELTAL_EXTERNAL_DQ
CAL-CS_CFTD_DELTAL_RESIDUAL_DQ
CAL-CS_CFTD_DELTAL_CTRL_DQ
CAL-CS_CFTD_DELTAL_CTRL_TST_DQ
CAL-CS_CFTD_DELTAL_CTRL_PUM_DQ
CAL-CS_CFTD_DELTAL_CTRL_UIM_DQ
CAL-CS_CFTD_DELTAL_EXTERNAL_DQ
CAL-CS_TDEP_SUS_LINE1_REF_UIM_NOLOCK_REAL
CAL-CS_TDEP_SUS_LINE1_REF_UIM_NOLOCK_IMAG
CAL-CS_TDEP_SUS_LINE2_REF_PUM_NOLOCK_REAL
CAL-CS_TDEP_SUS_LINE2_REF_PUM_NOLOCK_IMAG
CAL-CS_TDEP_SUS_LINE3_REF_TST_NOLOCK_REAL
CAL-CS_TDEP_SUS_LINE3_REF_TST_NOLOCK_IMAG

But these do, and were in the list I originally compiled from lists I received from Maddie and Aaron...

CAL-CS_TDEP_SUS_LINE1_REF_A_UIM_NOLOCK_IMAG
CAL-CS_TDEP_SUS_LINE1_REF_A_UIM_NOLOCK_REAL
CAL-CS_TDEP_SUS_LINE2_REF_A_PUM_NOLOCK_IMAG
CAL-CS_TDEP_SUS_LINE2_REF_A_PUM_NOLOCK_REAL
CAL-CS_TDEP_SUS_LINE3_REF_A_TST_NOLOCK_IMAG
CAL-CS_TDEP_SUS_LINE3_REF_A_TST_NOLOCK_REAL
CAL-DARM_CTRL_DBL_DQ
CAL-DARM_ERR_DBL_DQ
These channel names (similar to the names Jeff suggested) do appear in the H-H1_R frames:
Perhaps Jeff or Evan can confirm whether these are the correct channels.
Yes -- apologies -- I'd forgotten that the RCG adds "_DBL" to channels stored at double precision. Aaron's list is correct.
Replaced the TCS-X paddle-wheel flow meter, due to glitches and trips attributed to the original sensor. Followed the procedures outlined in aLOG #32776. The old flow meter came out very hard. These flow meters are assembled without Vaseline or a similar lube/sealant on the two O-Rings on the sensor shaft. This makes moving the flow meter very difficult and has the potential to drag the O-Ring(s) out of their groves. Will look into a suitable lube/sealant for future installations.
Reprogrammed the flow meter with the following values, taken from original flow meter.
The plot below shows the sideband powers during lock acquisition and power up.
The top panels shows the sideband powers from the OSA scans. The middle plot shows the power transmitted by the X arm (I shaded part of it, since during the power increase the normalization of this channel is not quite right). The bottom panel shows the set point for the input laser power.
As a note, right before the input power increase, you can see that the arm transmitted power increases (750 s < time < 790 s) by about 1.5%. This corresponds to the time when we are reducing the 45MHz modulation depth.
The reduction of transmitted power around t = 500 s is due to the engagement of the soft ASC loops, which are optimized for high power.
The second attached figure is a zoom in the vertical axis, to show that the 9 MHz sidebands are unbalanced even at 2 W.
The 45MHz sidebands change slightly in amplitude after power up, and their imbalance increases. The 9MHz sidebands instead show a large increase of amplitude at the antisymmetric port after power up (about a factor of two). We don't know if the 9MHz sidebands at the antisymmetric port are composed mainly of TEM00 mode or some high order modes. The fact that the transmission to the dark port increases seems to confirm that we have mostly differential lensing developing during power up. It would be useful to have an OMC scan to see what is the mode content of those sidebands.


Gabriele, Jenne, Shiela, Hang, Craig and Danny


After adding the "jel" packs last week, it looks like the lower frequency (10mhz-50mhz) noise is better on BRSY. In the first attached plot I compare some 3000 second spectra from Sept 26 2018 ~10:45 utc (before adding the packs) and Oct 15 2018 ~8:00 utc (after all the work done last week). Both of these windows are low wind times. The top plot shows that the RX out asd (ground tilt in nrad/rthz) is lower now with the packs. The second plot compares the tilt subtracted sts and the uncorrected sts asds. The unsubtracted asds are very similar betweeen 10mhz and 50 mhz for both time periods, but the supersensor is lower with the packs.
The .03-.1hz blrms channels for the BRS are also a quick way to evaluate the noise during low wind times. The second attached plot shows zoomed in 20 day time series of the blrms minute trends for both BRSX & Y, and during quiet times BRSY blrms are lower now than they were before adding the packs, BRSX is unchanged. It bears watching, but I saw a similar difference over 50 day trends.


I've added the packs to BRSX now. I'll repeat this there in a week or two. Managed to not bump anything this time. Also, the wire for the capacitive damper is just a single wire directly from the relay box to the can, a little hard to see in the attached photo, but it's on the upper left flange, next to the view port.

We used to do the angle to length decoupling of the test masses by adding lines on pitch and yaw of each test mass and demodulate DARM_IN1 at those lines to get centering signals. We then move the A2L coefficients to a few values, compute the average signals, and fit a line to the values to estimate the zero crossing. This approach has two problems:
The method I implemented in the last couple of days (and described in 44532 and 44542) does not suffer from this two problems: since I am using only one line at a time, I can notch it in CHARD and DHARD loops, solving (1); I directly measure the coupling from the angular drive to DARM and the coupling from the A2L path to DARM, and use the ratio: the phase of the ratio is always very close to 0 or 180 degrees, thus solving (2).
Today I tried yet another way to tune the A2L. I added lines between 20 and 34 Hz, spaced by 2 Hz, on yaw and pitch of all test masses (no notches). I then used FFTs in python to compute the transfer function of each line to DARM_IN1. I checked that the value obtained in this way responds to me changing the A2L values. Then I build a python servo loop that adjusts the A2L gains to zero the real part of the transfer function.
The servos work, and they managed to drive the real part of the A2L transfer functions to zero. However, as shown below, the imaginary parts are not zero. Moreover, the residual coherence between CHARD and DARM is not as low as I could get yesterday with the single test mass, single shot, measurement. This is another example of the issue (2) highlighted above.
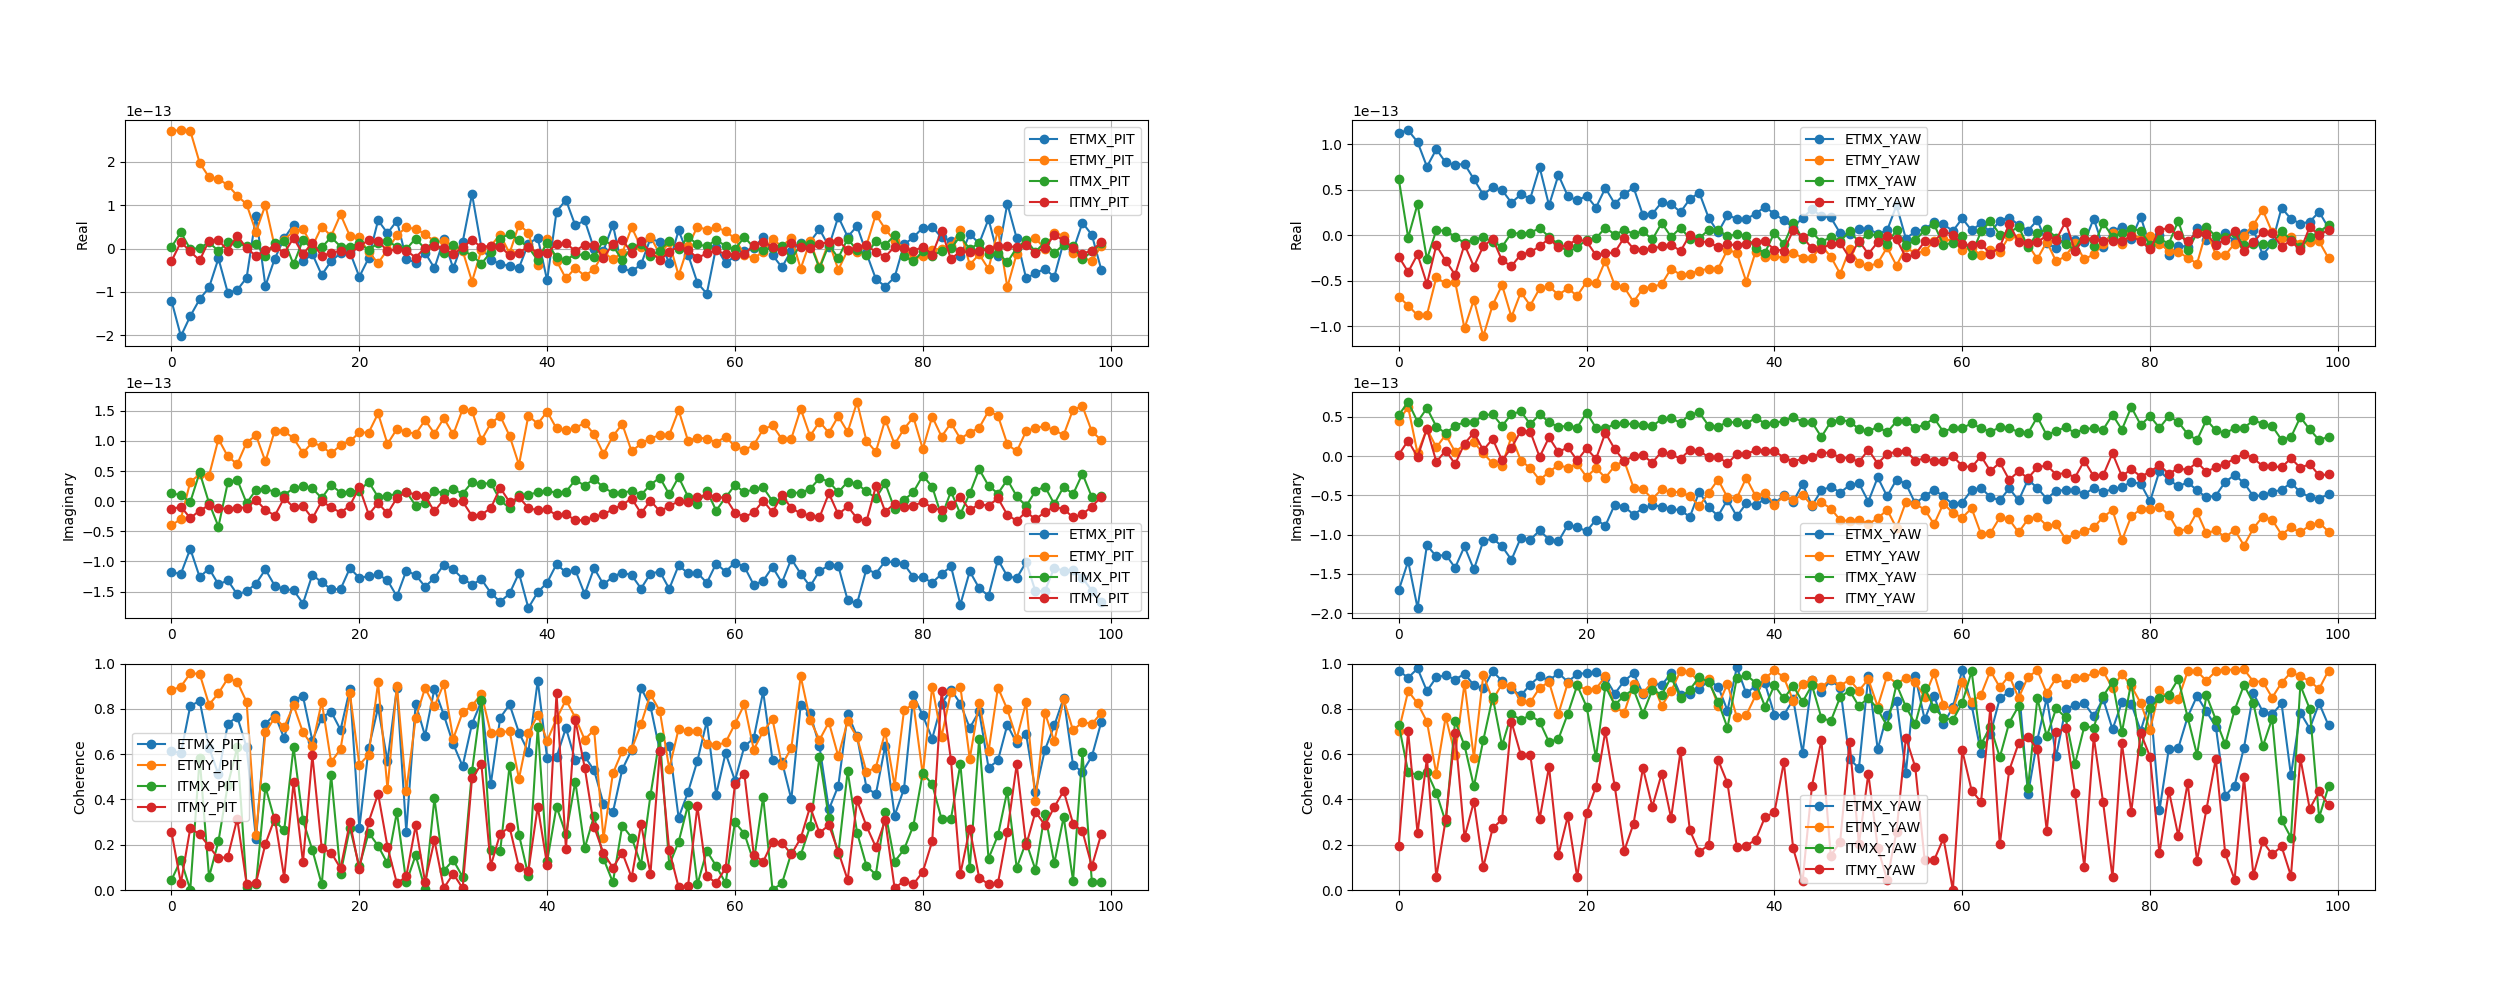

This method works, but suffers from the same problems as the standard method.
Hang, Sheila
Thanks Gabriele, you make a good point about needing notches for the A2L.
The A2L script Hang wrote several years ago rotates the demod phase in the script to maximize the signal, so the result is independent of the demod phase set in the front end.

