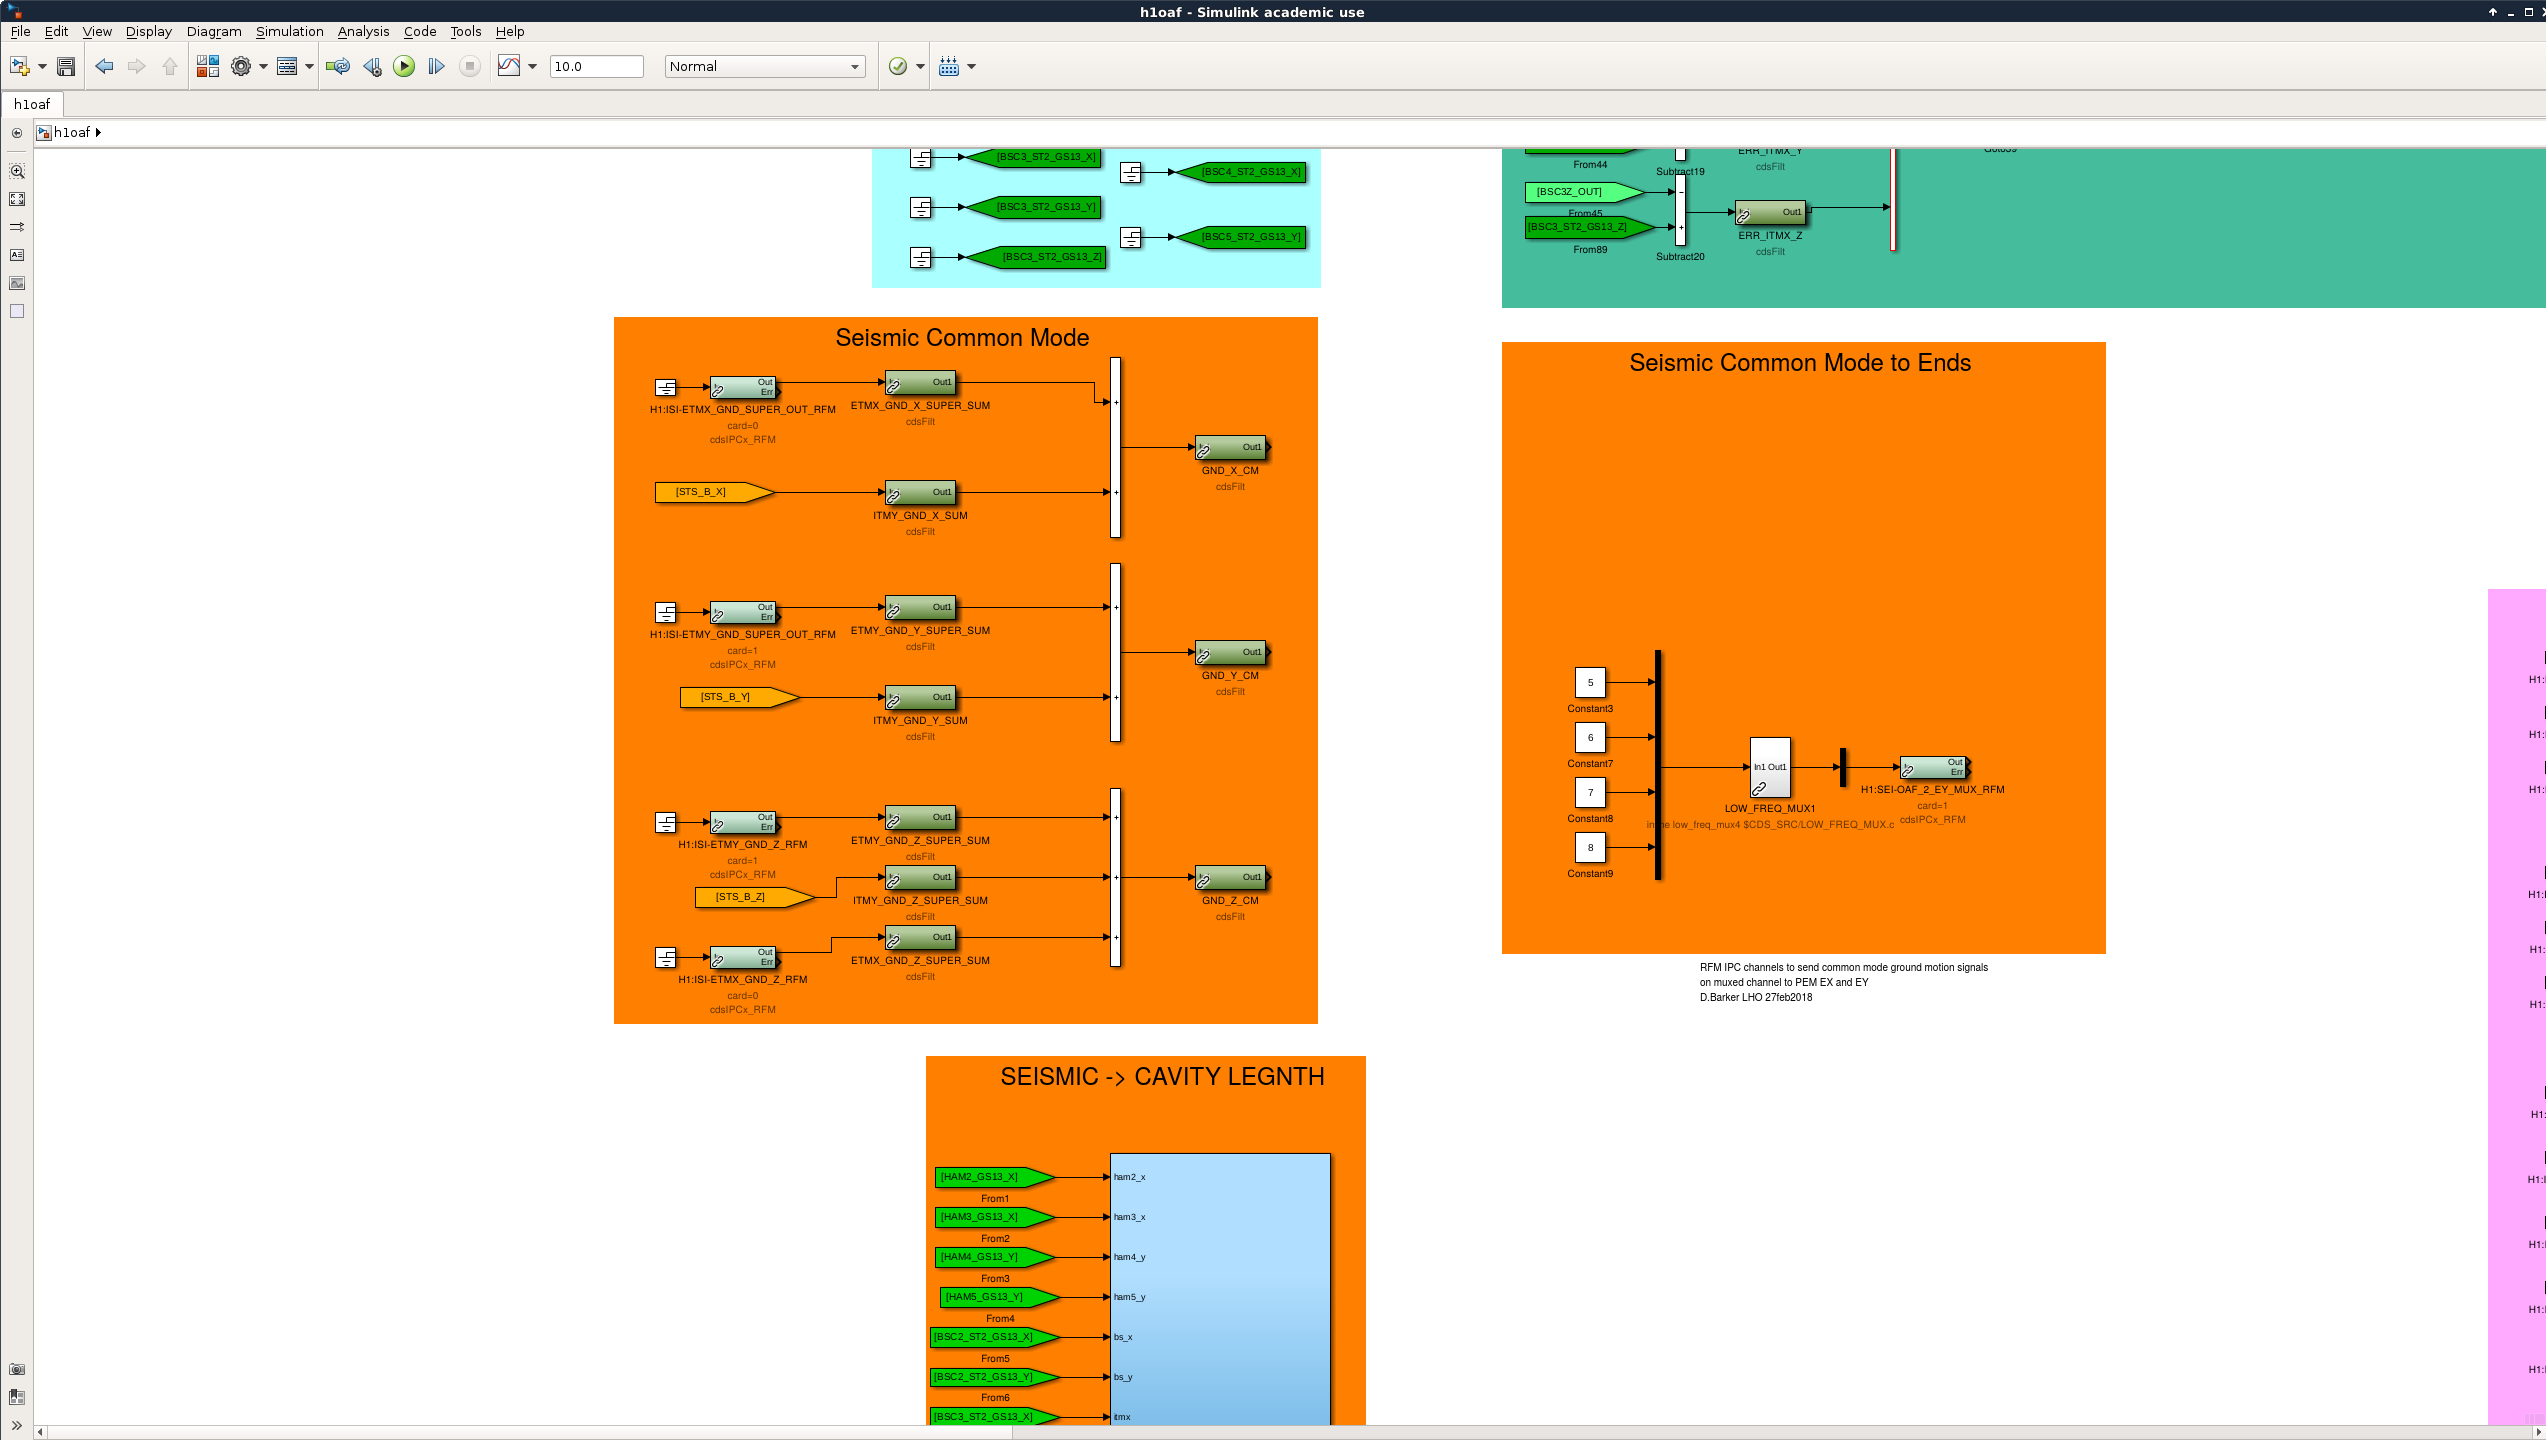
Displaying reports 45481-45500 of 83724.Go to page Start 2271 2272 2273 2274 2275 2276 2277 2278 2279 End
Reports until 12:34, Thursday 09 November 2017
H1 SEI
hugh.radkins@LIGO.ORG - posted 12:34, Thursday 09 November 2017 - last comment - 08:22, Monday 13 November 2017(39356)
WHAM5 ISI Optical Table Level check--Very Level

Gerardo stated that the Optical Table was not very level using a small T-Level and that the OFI needed adjustment to hang properly after doing all the adjustments on an optical table bench.

So I used the Optical Auto Level to look at the table.  With seven shots, above the walls at every corner and in the center of the table, the range of level was +-0.1mm--very level in our books.  I did manage to tie it into our LVEA monuments to put an actual elevation on the table: -325.8mm Lz.  Adding the -0.3mm conversion from local the global gives -325.8mm Gz (See T1100187.)  Looking at D0901129, it shows the Optical table to be 325mm below the BEAM TUBE CL.  I can't tell or remember if this is below the HAM5 BT CL or below the BSC2 BT CL where global 0 0 0 is positioned.  Either way, we are within 0.5 to 0.8mm of ideal elevation for this Optical Table and again very level.  Frankly, I'm relieved!  Attached are my field notes.

Non-image files attached to this report
Comments related to this report
hugh.radkins@LIGO.ORG - 08:22, Monday 13 November 2017 (39400)

I've got a couple typo above:


Gerardo stated that the Optical Table was not very level using a small T-Level and that the OFI needed adjustment to hang properly after doing all the adjustments on an optical table bench.

So I used the Optical Auto Level to look at the table.  With seven shots, above the walls at every corner and in the center of the table, the range of level was +-0.1mm--very level in our books.  I did manage to tie it into our LVEA monuments to put an actual elevation on the table: -325.8 325.5mm[see notes] Lz.  Adding the -0.3mm conversion from local the to global gives -325.8mm Gz (See T1100187.)  Looking at D0901129, it shows the Optical table to be 325mm below the BEAM TUBE CL.  I can't tell or remember if this is below the HAM5 BT CL or below the BSC2 BT CL where global 0 0 0 is positioned.  Either way, we are within 0.5 to 0.8mm of ideal elevation for this Optical Table and again very level.  Frankly, I'm relieved!  Attached are my field notes.

H1 IOO (IOO)
cheryl.vorvick@LIGO.ORG - posted 19:12, Wednesday 08 November 2017 (39349)
IM alignment slider calibration, details to remember

The alignment slider gains are set to 0.05urad/slider count, see alog 30106.

H1 ISC
sheila.dwyer@LIGO.ORG - posted 18:46, Wednesday 08 November 2017 - last comment - 13:43, Friday 10 November 2017(39333)
fast shutter triggering

I started to look at times when the fast shutter fired to check if there are times when more energy passed the shutter than desired (in part because of the broken beam dump in HAM6).  I wrote a script that looked at about 40 days of minute trend of the AS WFS (which are behind the shutter) and picked out times when they were high.  Attached are plots of the three events where the most energy seems to be getting past the shutter in those 40 days.  In all of these three cases, the power on the AS_C PD doesn't seem to have exceeded the threshold for the shutter to fire until there had already been several seconds of large power fluctuations at the AS port.  The shutter triggers as expected when the power goes over the threshold.

Images attached to this report
Non-image files attached to this report
Comments related to this report
sheila.dwyer@LIGO.ORG - 21:52, Thursday 09 November 2017 (39370)

This afternoon Gerard and Koji helped me confirm that the fast shutter is cabled correctly by shining a flashlight on AS_A, AS_B, and AS_C.  Indeed AS_C is connected to the fast shutter trigger.  

Fil also helped me interpret the PCB layout for the transimpedance amp, I peaked inside the one for AS_C and confirmed that when looking from the front of the chassis (side where the LED is on the board) the red jumpers are on the left side, between pins 1 and 2, which means that the whitening is used.  This means that the whitening is correctly compensated in the front end calibration of AS_C. 


sheila.dwyer@LIGO.ORG - 13:43, Friday 10 November 2017 (39379)

After talking with Daniel, my confusion was caused by the AS_C readback saturating in the whitening stage of the transimpendance amp.  Since the sum output bypasses this whitening stage, it does not saturate and the signal readback by the beckhoff (Trigger Volts) reflects the realistic power on the PD. 

So it looks like it is not really feasible to check how much energy is getting past the fast shutter using one of our HAM6 PDs.  The AS WFS saturate the ADC during the lockloss transient, so they aren't very useful, and AS_C saturates the whitening stage. 

H1 IOO (IOO, ISC, OpsInfo, SEI, SUS, VE)
jeffrey.kissel@LIGO.ORG - posted 17:30, Wednesday 08 November 2017 - last comment - 21:52, Wednesday 08 November 2017(39347)
IO Work Day Summary Nov 8th 2017
J. Kissel, E. Merilh, C. Vorvick

Below is a summary of what Cheryl led us through today:

 - PRM and PR2 Irises placed in-vacuum
 - Performed daily alignment of IMC by adjusting PSL PZT, and IMC Mirrors
 - IMC flashing speed reduced by turning down HAM2/HAM3 purge air
 - IMC alignment fine-tuned by driving MC2 broadband in L from 0.2 to 0.25 Hz (to have RMS velocity dominated by a slower pulse than the 12 Hz HEPI pier resonance noise)
 - IM1&2 alignment finalized (via sliders / actuators) using IR card views of flashing beam at Faraday Isolator input and output apertures 
 - Flashing beam routed through to PR2, but found that IM3 needs entire DAC range in Yaw (consistent with what was seen during first observing runs)
 - IM3 alignment mechanically offloaded in Yaw using OSEM sensors
 - Re-tightened all IM3 cage / structure bolts

A video of the flashing can be seen here: https://youtu.be/8DJnQ45cmK0. The speed at which the IMC is flashing through alignment fringes is reflective of the 12 Hz pier resonances transmitted through the locked HEPI and ISIs in HAM2 / HAM3 (see LHO aLOG 39328).

Attached are screenshots of:

 - The evolution of alignment sliders during the daily re-alignment of the IMC in Pitch and Yaw
 - Screenshots of OSEM positions and alignment sliders after we finalized the IMC alignment 
 - Screenshots of OSEM positions and alignment sliders after we finished alignment of IM1 and IM2, and after mechanically offloading IM3

We ran out of time today given the extra work with IM3, but we will resume tomorrow morning around ~10a, with the end-goal to install the IMC bypass and hand off to further down-stream alignment of the IFO.

Any work that needs laser safe will be free to work laser glasses free for a few hours in the early morning.
Images attached to this report
Comments related to this report
cheryl.vorvick@LIGO.ORG - 21:52, Wednesday 08 November 2017 (39353)


*** UPDATE: IO work will resume asap tomorrow morning - LVEA will be Laser Hazard ***


H1 OpsInfo (IOO, OpsInfo, PSL)
jeffrey.kissel@LIGO.ORG - posted 16:47, Wednesday 08 November 2017 - last comment - 16:57, Wednesday 08 November 2017(39346)
LVEA is LASER SAFE; Purge Air Restored
J. Kissel, G. Moreno, E. Merilh, C. Vorvick

The IOO HAM2 / HAM3 crew is done for the day.

The LVEA is LASER SAFE.

The HAM2 / HAM3 purge air is being restored by Gerardo.
Comments related to this report
jeffrey.kissel@LIGO.ORG - 16:57, Wednesday 08 November 2017 (39348)
J. Kissel for G. Moreno

Purge air has been restored.
H1 General
jeffrey.bartlett@LIGO.ORG - posted 16:00, Wednesday 08 November 2017 (39345)
Ops Day Shift Summary
Ops Shift Log: 11/08/2017, Day Shift 16:00 – 00:00 (08:00 - 16:00) Time - UTC (PT)
State of H1: Unlocked - Vent
Intent Bit: Engineering
Support: N/A
Incoming Operator: N/A
Shift Summary: Vent activities continue per Betsy’s plan.
 
Activity Log: Time - UTC (PT)
16:00 (08:00) Start of Shift
16:10 (08:10) All dust monitors are on line
16:25 (08:25) Terry – Going into Squeezer Bay
16:27 (08:27) Richard & Ken – Going into LVEA electrical survey
16:42 (08:42) Filiberto – Going to End-Y to add connection for Ion pump
17:22 (09:22) Sheila – Going to Squeezer Bay
17:34 (09:34) Sheila – Back from LVEA
17:46 (09:46) Ken – Going into LVEA to survey electrical needs for tables
18:08 (10:08) Cheryl, Jeff K., Ed – Going to HAM2
18:15 (10:15) LVEA transitioned to Laser Hazard
18:20 (10:20) Greg – Going to work on TCS-X and TCS-Y tables
18:27 (10:27) Karen & Vanessa – Cleaning at Mid-Y then Mid-X
18:28 (10:28) Betsy & Travis – Going to Biergarten
18:32 (10:32) Platt Electric – Delivery for Richard
18:43 (10:43) Kyle – Going to End-Y to work on Ion pump
18:50 (10:50) Filiberto and Richard – Back from End-Y
19:12 (11:12) Kyle – Back from End-Y
19:25 (11:25) Betsy, Travis, and Jason – Out of the Biergarten
19:34 (11:34) Karen & Vanessa – Finished cleaning and both Mids,
20:36 (12:36) Cheryl, Jeff K., & Ed – Out of LVEA for lunch
20:41 (12:41) Greg – Out of the LVEA
21:00 (13:00) Richard & Filiberto – Going to End-X for HEPI pump controller
21:10 (13:10) Jim & TJ – Going to HAM3 for baffle assembly and install
21:30 (13:30) Cheryl, Jeff K., & Ed – Going back to HAM2 to continue IO work
21:39 (13:39) Terry – Out of the Squeezer Bay
21:40 (13:40) Richard & Filiberto – Back from End-X
21:50 (13:50) Jason & Travis – Going to the Biergarten
22:00 (14:00) Chiller alarm for End-X – Has been addressed
22:18 (14:18) Jim & TJ – Out of the LVEA
23:12 (15:12) Patrick & Filiberto – Going to End-X
23:15 (15:15) Koji – Going to Optics Lab
23:18 (15:18) Betsy – Going to Biergarten
23:45 (15:45) Patrick & Filiberto – Back from End-X


H1 AOS
betsy.weaver@LIGO.ORG - posted 15:17, Wednesday 08 November 2017 - last comment - 09:00, Friday 10 November 2017(39344)
BS HR Elliotical Baffle Alignment

Since Monday, Jason, Travis and I have been working on (amongst other things) the BS elliptical baffle rebuild and realignment.  Once all parts were in hand, the rebuild was straight forward.  Travis used the removed HR and AR baffle assemblies to line up and preassemble the mounting brackets so that the new baffles went in roughly where the old ones used to be positioned on the BS suspension structure.  However when we put the target on the HR panel, we discovered one of GariLynn's earlier worries - the baffle was off center by many millimeters.  Looking at the baffle relative to the structure seemed to indicate the same thing - the beam was left and down when looking at the HR surface target (meaning, the baffle was potentially too far up and right relative to the simulated IFO beam).

Unfortunately, this target-mounted-to-the-elliptical-baffle is what was used to align the entire BS SUS/ISI cartridge in the chamber install in ~2013, as per IAS procedure E1200795.  This fact lead us to spend a day or 2 sorting out how to tell if the BS optic is misaligned in the chamber (without any IAS measurement ability), and how we possibly could have installed the elliptical baffle out on the cartridge in the first place many years ago.  During this we went back in-chamber to make "precise" measurements.  We used Class B rulers to measure where the IFO simulation beam was hitting the BS, how well the BS is centered in the structure, and exactly where the beam was hitting the target.  Attached are actual sketches and pictures with detailed numbers.

Here's what we were able to measure to within ~1mm error since it's by-eye and other knowns:

1) The beam is hitting the center of the BS optic 2mm to the left of the optic centerline.

2) The optic is suspended in the structure to within 1mm or less of error.

3) The beam is hitting the HR target baffle 5.5 mm left of the target center.

4) Our Y-arm IFO simulator beam which runs between the ITMy center and the SR3 center ran dead center on the ITMY elliptical baffle (prior to it's removal) and the HWSY path a few weeks ago when HAM4 work was checked.

5) Per IAS procedure E1200795, the BS suspension to ISI locations were performed via more direct methods which did not involve the Baffle target, so we believe the BS to ISI mounting is correct.

Point 1) and 2) give us some confidence that the error of the BS optic placement is not as bad as how the baffle target indicates.

Some consult with GariLynn and Jenne, to understand what centering is most important from various aspects (including looking at some modeling done by Hiro in T1400055) and we have come to the conclusion that we will carry on as planned.  Namely, to first order it is best to have the baffle aligned very well to the beam.  Our next steps will be to recheck the IFO simulation beam pointing again, align the HR baffle to it, and take a series of pictures to ensure that the edges of the baffle are lined up correctly with the edges of the BS optic from the beam POVs.

Also during our walkabout over the last 2 days, we re-interpreted Keita's BS centering/beam clipping alog 28196, pointed out by Sheila.  Because it is difficult to see the edges of the BS optic when the baffle is installed, it seems Keita made some geometrical analysis of the HR and AR baffle positions to determine the position of the BS center.  However, since we believe the baffle was mounted in the wrong position by a few mm, his centering numbers likely are not correct.  Still, his numbers indicate the same directions of error as we see - the beam is hitting left and low of the baffle/optic.  I think we can repeat this measurement in the future by scaling the known diameters of the baffle holes and BS optic size on the camera view pictures.  Will think on this more.


Images attached to this report
Comments related to this report
betsy.weaver@LIGO.ORG - 09:25, Thursday 09 November 2017 (39354)

Attached is the sketch of the vertical beam displacement measurement at the BS HR surface we took yesterday (checked 2x).  While it is good that the target position and the optic position (relative to the beam) agree, the beam is low on the both by 3.5mm.  We do not understand this.  More to story will come when we align more baffles, and get a peek with the PSL beam later today or tomorrow.

(Note, we re re re checked the IFO simulator AUX beam yesterday and it does not indicate any mis-centerings from ITMy center to SR3 center.)

(Jason, Travis, GariLynn via CIT, Betsy)

Images attached to this comment
betsy.weaver@LIGO.ORG - 09:00, Friday 10 November 2017 (39376)

My link to IAS docs in the above is incorrect.  The IAS doc for the baffle and BS alignment procedure is

https://dcc.ligo.org/LIGO-E1200795

H1 FMP (FMP, PEM)
krishna.venkateswara@LIGO.ORG - posted 13:37, Wednesday 08 November 2017 - last comment - 09:38, Friday 10 November 2017(39343)
End Station Temperature Control

Krishna

The End Station VEA temperatures are currently locked to H0:FMC-EY_VEA_AVTEMP_DEGF, which is an average of various sensors mounted to the walls of the VEA. As has been discussed before, what we'd like to hold constant is the temperature of the suspensions or the vacuum chambers. The attached plot shows various temperature sensors (refer to Jeff's alog for calibration) in the VEA which all show a rising trend (the M0 has a negative temp coefficient), whereas the FMC average sensor shows a constant trend. The reason for this is it is getting colder outside, so the walls are cooler. Therefore to keep the walls at the same temperature, the inside has to get warmer.

Robert and others had noted this for the corner station earlier and I've been told that this was fixed at the corner station but not at the end stations. I would recommend fixing this problem for both the end-stations as well. One possible solution is to simply mount the FMC sensors on or closer to the vacuum chamber.

Images attached to this report
Comments related to this report
krishna.venkateswara@LIGO.ORG - 09:38, Friday 10 November 2017 (39377)

Just wanted to show similar data for EX. Again, all temperature sensors other than the FMC sensors show the mean drift with the approach of the cold weather outside. I again urge this situation be improved by having the FMC sensors closer the chamber.

Images attached to this comment
H1 SEI (SEI)
krishna.venkateswara@LIGO.ORG - posted 11:59, Wednesday 08 November 2017 - last comment - 08:34, Friday 10 November 2017(39336)
BRS-X upgrade: Complete. Monitoring Mean Position.

Krishna

The reconfiguring of BRS-X is complete. The new resonance frequency of BRS-X is 5.6 mHz (T ~180 s) and d is zero for all practical purposes. The BRS-X calibration filters have been modified. I have also modified the tilt-subtraction filter banks. The big change is that there is no acceleration correction for the finite d.

The pdf attachment shows the tilt-subtraction achieved under mild wind speeds of ~10-15 mph. The one noteworthy change is that the tilt-subtraction is slightly better in the 5-20 mHz frequency range, likely due to the lower resonance frequency.

I have also modified the C# code, which calculates the Beam angle, to also make an online subtraction of the reference beam angle. Previously, we did not do this since the reference beam angle noise was usually much smaller than the main Beam angle, hence it didn't help much. However, I have recently noticed that during times of excess temperature noise in the VEA, the reference beam angle noise is worse and does contribute to the main Beam angle. In order to do the subtraction (requires extra calculations), I had to reduce the update frequency of the C# code (from 140 Hz to 70 Hz). I have confirmed that this does not negatively affect the tilt-subtraction, though it does increase the high frequency noise floor slightly (by ~sqrt(2)). This code change will also be implemented at BRS-Y.

The pressure in the vacuum can (BRS_X_PumpPressure.png) is currently at ~1e-6 torr and going down steadily. The mean position (driftmon) of BRS-X was reset on Monday (see BRS_X_DriftMon.png). Acceptable range is +/- 16k counts. It seems to be stable now and I will continue monitoring.

Edit: The capacitive damper/actuator on BRS-X now works the same as that on BRS-Y. The Q is set to ~10 when the angle exceeds the high threshold (which is nominally set to 2000 = 2 micorad). Below that, the Q is set to ~100. It is time to say goodbye to the gravitational damper! It was fun while it lasted smiley!

Images attached to this report
Non-image files attached to this report
Comments related to this report
krishna.venkateswara@LIGO.ORG - 08:34, Friday 10 November 2017 (39374)

I adjusted the mean position yesterday after it looked like it was drifting towards the positive end. Currently it looks ok and is at ~8k counts. It's hard to judge the trend over this short stretch, especially given the temperature fluctuations of the end-stations (see 39343).

Images attached to this comment
LHO VE
kyle.ryan@LIGO.ORG - posted 11:51, Wednesday 08 November 2017 (39342)
LVEA purge-air dewpoint
As measured just before the low pressure regulator; -31C when supplied by left drying tower and -28C when supplied by the right drying tower.  

Also, the Kobelco compressor portion of the LVEA vent/purge supply has had a "Service Alert" in effect for the past few days.  We have a field service technician from Roger's Machinery coming out on Monday.  
LHO VE
kyle.ryan@LIGO.ORG - posted 11:45, Wednesday 08 November 2017 (39341)
Beam Tube port Y2-8 ion pump back up and working
Richard M., Filiberto C. 

The EE guys installed a new King's SHV pump-end HV connector (modified?) in place of the shorted unit from a week or two ago.  I energized the IP and everything seems to be working again.  

H1 SEI
jim.warner@LIGO.ORG - posted 11:28, Wednesday 08 November 2017 (39340)
HAM4 transfer functions also look clear

Was able to run long transfer functions on the HAM4 ISI last night and got the data this morning. Again, I don't see anything unusual for the chambers state. Attached plots are for the tf last night (first plot, act to gs13) and the best similar tf from 2014 I could find (second plot). Unfortunately it looks like there was some rubbing or something on the old measurement, cause the data around suspension mode looks bad. Jeff hasn't posted B&K measurements of the new baffle yet, but unless there's something nasty hiding in the high frequency stuff (hidden by the purge air or whatever), looks okay.

Images attached to this report
H1 SEI (SEI)
krishna.venkateswara@LIGO.ORG - posted 11:12, Wednesday 08 November 2017 - last comment - 09:45, Friday 10 November 2017(39337)
BRS-Y and the Platform Seismometer

Krishna

The attached pdf file shows the comparison between BRS-Y, the ground seismometer (an STS-2) and the platform seismometer (a T240), called a PEM signal in this case (since we are using spare PEM channels for it). Also shown are the online tilt-subtracted super-sensor output (online residual) and a second tilt-subtracted signal between the T240 and BRS-Y (PEM residual). Page 2 shows the coherences between various signals and Page 3 shows the wind-speeds. As I showed before, the coherence between BRS-Y and the platform seismometer (T240) is better than that between BRS-Y and the ground seismometer (STS-2).

Note that in this plot I have used the normal calibration factor for BRS-Y and STS-2. For the T240, I matched its output to the STS-2 at the secondary microseism. You'll notice that while the STS-2 and BRS-Y are coherent below 0.1 Hz, their outputs differ by 20 percent. Initially some had suspected we got our calibration wrong, but this is now known to be due to differential floor tilt. For the online tilt-subtraction we use a factor of 0.78 for BRS-Y to correct for this. However, the platform seismometer agrees very well with the raw BRS-Y calibration (we did get our calibration right!). This confirms that the two instruments are now seeing the same tilt.

The tilt-subtracted T240 signal (PEM residual) is now marginally better than the tilt-subtracted STS-2 signal in the 15-50 mHz range. It is possible that this is still limited by temperature noise on the T240, since the tilt-subtracted noise looks similar at lower wind speeds too (not shown). Hugh will attempt to improve the thermal insulation when possible.

The most important test is to now see if the two residual curves diverge even more when wind speeds pickup above 20 mph. If so, this would confirm the differential floor tilt hypothesis. If not, it would suggest some other noise/nonlinearity limits the tilt-subtraction. Unfortunately, it looks like we'll have to wait till next week for higher wind speeds.

Non-image files attached to this report
Comments related to this report
krishna.venkateswara@LIGO.ORG - 09:45, Friday 10 November 2017 (39373)

Adding one other case with slightly higher wind speeds.

Non-image files attached to this comment
H1 PSL
jim.warner@LIGO.ORG - posted 11:01, Wednesday 08 November 2017 (39339)
PSL weekly status

Not sure how relevant this is right now.


Laser Status:
SysStat is good
Front End Power is 35.66W (should be around 30 W)
HPO Output Power is 154.0W
Front End Watch is GREEN
HPO Watch is GREEN

PMC:
It has been locked 0 days, 0 hr 27 minutes (should be days/weeks)
Reflected power = 26.11Watts
Transmitted power = 50.55Watts
PowerSum = 76.66Watts.

FSS:
It has been locked for 0 days 0 hr and 27 min (should be days/weeks)
TPD[V] = 2.491V (min 0.9V)

ISS:
The diffracted power is around 0.71% (should be 3-5%)
Last saturation event was 0 days 0 hours and 26 minutes ago (should be days/w

Possible Issues:
PMC reflected power is high
ISS diffracted power is Low

H1 SEI
jim.warner@LIGO.ORG - posted 10:59, Wednesday 08 November 2017 (39338)
Monthly seismometer centering FAMIS 6092

All the STSs are okay. Corner station ISIs are in air. ETMY is somewhat out of spec, though.

2017-11-08 10:52:36.354536
All STSs prrof masses that within healthy range (< 2.0 [V]). Great!


Here's a list of how they're doing just in case you care:
STS A DOF X/U = -0.718 [V]
STS A DOF Y/V = 0.064 [V]
STS A DOF Z/W = -0.195 [V]
STS B DOF X/U = 0.388 [V]
STS B DOF Y/V = 0.944 [V]
STS B DOF Z/W = -0.609 [V]
STS C DOF X/U = 0.368 [V]
STS C DOF Y/V = -0.065 [V]
STS C DOF Z/W = 0.938 [V]
STS EX DOF X/U = -0.164 [V]
STS EX DOF Y/V = 0.47 [V]
STS EX DOF Z/W = 0.151 [V]
STS EY DOF X/U = 0.144 [V]
STS EY DOF Y/V = 0.169 [V]
STS EY DOF Z/W = 0.51 [V]


Assessment complete.


Averaging Mass Centering channels for 10 [sec] ...
2017-11-08 10:52:39.355680


There are 17 T240 proof masses out of range ( > 0.3 [V] )!
ETMX T240 2 DOF X/U = -0.327 [V]
ETMX T240 2 DOF Y/V = -0.574 [V]
ETMY T240 3 DOF Z/W = 0.347 [V]
ITMX T240 1 DOF X/U = -0.418 [V]
ITMX T240 1 DOF Z/W = -0.337 [V]
ITMX T240 2 DOF Y/V = -0.37 [V]
ITMX T240 3 DOF X/U = -0.652 [V]
ITMY T240 1 DOF X/U = -0.386 [V]
ITMY T240 1 DOF Z/W = -0.549 [V]
ITMY T240 2 DOF Z/W = -0.654 [V]
ITMY T240 3 DOF X/U = -1.001 [V]
ITMY T240 3 DOF Y/V = -0.389 [V]
ITMY T240 3 DOF Z/W = -0.604 [V]
BS T240 1 DOF Z/W = -0.564 [V]
BS T240 2 DOF Y/V = -0.491 [V]
BS T240 3 DOF X/U = -0.683 [V]
BS T240 3 DOF Z/W = -0.469 [V]


All other proof masses are within range ( < 0.3 [V] ):
ETMX T240 1 DOF X/U = 0.296 [V]
ETMX T240 1 DOF Y/V = 0.19 [V]
ETMX T240 1 DOF Z/W = 0.222 [V]
ETMX T240 2 DOF Z/W = 0.125 [V]
ETMX T240 3 DOF X/U = 0.171 [V]
ETMX T240 3 DOF Y/V = 0.284 [V]
ETMX T240 3 DOF Z/W = 0.223 [V]
ETMY T240 1 DOF X/U = -0.003 [V]
ETMY T240 1 DOF Y/V = 0.109 [V]
ETMY T240 1 DOF Z/W = -0.123 [V]
ETMY T240 2 DOF X/U = 0.201 [V]
ETMY T240 2 DOF Y/V = -0.161 [V]
ETMY T240 2 DOF Z/W = 0.0 [V]
ETMY T240 3 DOF X/U = -0.132 [V]
ETMY T240 3 DOF Y/V = -0.004 [V]
ITMX T240 1 DOF Y/V = -0.046 [V]
ITMX T240 2 DOF X/U = -0.106 [V]
ITMX T240 2 DOF Z/W = -0.093 [V]
ITMX T240 3 DOF Y/V = -0.047 [V]
ITMX T240 3 DOF Z/W = 0.016 [V]
ITMY T240 1 DOF Y/V = -0.178 [V]
ITMY T240 2 DOF X/U = 0.263 [V]
ITMY T240 2 DOF Y/V = -0.239 [V]
BS T240 1 DOF X/U = 0.131 [V]
BS T240 1 DOF Y/V = -0.262 [V]
BS T240 2 DOF X/U = -0.041 [V]
BS T240 2 DOF Z/W = 0.032 [V]
BS T240 3 DOF Y/V = -0.024 [V]


Assessment complete.


H1 SEI
jeffrey.bartlett@LIGO.ORG - posted 10:48, Wednesday 08 November 2017 (39335)
Weekly H1 ISI CPS Noise Spectra Check
FAMIS Task #6923

   Attached are the plots for the BSC and HAM ISI CPS checks.  
Images attached to this report
H1 SYS (AOS, DetChar, ISC, PEM, SEI, SUS, SYS)
jeffrey.kissel@LIGO.ORG - posted 13:47, Monday 30 October 2017 - last comment - 15:22, Tuesday 14 November 2017(39212)
H1 SUS PRM & PR3 B&K Hammer Results: Venetian Baffles Have Resonances b/w 30-100 Hz
J. Kissel

I've taken new, more comprehensive B&K hammer response measurements of the H1SUSPRM and H1SUSPR3 cages, now that they have newly installed (what I'm calling) Venetian Baffles (see attached HAM2_NewBaffling_WithLabels.pdf for names of baffles) whose installation was finished last week LHO aLOG 39170.

These baffles have pretty high-Q, low-frequency drum-head / longitudinal resonances (roughly aligned with ISI / IFO Y axis).
  
    PRM Upper: 42.38 & 46.75, 91.00
    PRM Lower: 42.38 & 46.75, 75.62 

    PR3 Upper: 36.75, 75.6
    PR3 Lower: 36.75, 83.12 

My guess is that the lower frequency of the modes are the baffles bending in longitudinal in concert on the Venetian bracket, and the upper frequencies are their individual longitudinal modes. This mode-shape guess is based only on intuition, and that the lower frequency modes are seen in both upper and lower excitations.

The cage's transverse modes appear to be relatively unaffected by the new baffles. I'm little surprised it hasn't stiffened up any of the transverse modes; oh well.

These resonances have been identified by comparing against the history or cage resonance measurements for each of the SUS -- see the three pdfs: 
    2017-10-30_H1SUSPR3_CageResponse.pdf
    2017-10-30_H1SUSPRM_CageResponse.pdf
    2017-10-30_H1SUSPRMvsPR3_CageResonance_Comparison.pdf

Note, also new with these measurements -- data out to 1.1 kHz. The former data is from 
LHO aLOG 6014 -- VA ON vs OFF data for H1SUSPRM and H1SUSPR3
LHO aLOG 8654 -- Former Cage Baffles on H1SUSPR3

Photos attached (and remaining HitLocations.pdf) are for historical reference for future repetition.
Images attached to this report
Non-image files attached to this report
Comments related to this report
norna.robertson@LIGO.ORG - 10:59, Thursday 09 November 2017 (39355)SUS

From Stephen and Norna

We (Stephen, Norna, Calum, Cormac) have done further experiments in the lab at Caltech to better understand the effect of the addition of the "Venetian blind" baffles ( D1700256 HSTS BAFFLE ASSY.PRM), on an HSTS and to help with the interpretation of the results seen at LHO.

A few caveats which should be noted:

a) We only have a bare structure - no vibration absorbers, hanging suspension, cables etc. attached. Also not as well dogged down as on site due to potential interference with baffle (our HSTS is not on a spacer). We have included baseline results displaying excitation of this structure without baffles mounted for comparison, see figures 2a and b described below.

b) We only used one baffle panel - so it was either attached at lower or upper position. See figure 1 for set-ups.

Basic findings

1) We show with and without damped baffle in upper position, exciting at top of structure in longitudinal (beam) direction and transverse. Basic conclusion, we do not see noticeable new resonances when exciting structure itself. See figures 2a and 2b

2) We only see extra low frequency ( ~ 40 Hz in our case) resonance introduced by baffle when directly hitting on the baffle. It is not seen when excitation is done to the structure itself. It is also only seen when hitting the baffle in its upper position, not in the lower position. See figure 3 for upper position results.

*We strongly suggest that if time permits, a test where the structure itself is hit in the longitudinal (beam) direction is done at LHO to see if this finding also holds for the PRM suspension now in situ.*   From our experience we expect those low frequency peak(s) not to appear or least to be less prominent when the structure itself is excited.

3) The viton O-rings in the attachment units make a significant beneficial difference to the behaviour. Adding a baffle without viton introduces extra features which are suppressed or damped with the introduction of the viton.
See figures 4 (upper)  and 5 (lower) baffle results.

4) The viton also adds some damping to the original structure resonances, apart from the first two flagpole resonances at 65 Hz (longitudinal) and 75 Hz (transverse) for our set-up. The dominantly torsional mode  at ~160 Hz in our set-up shows some damping, as does  the ~350 Hz feature. This can be seen particularly in the transverse results.
See figures 6 (upper) and 7 (lower).

5)We also did some investigations of different tightening levels corresponding to different levels of compression of viton O-rings within the two different flavors of attachment unit, D1700232 and D1700236. Basic result: the system is quite tolerant to different levels of tightening,with similar results over a range from hand tightened plus 1/4 turn to hand + full turn.

We will write this up more fully on the DCC at T1700473, including posting all data sets.

Non-image files attached to this comment
norna.robertson@LIGO.ORG - 15:22, Tuesday 14 November 2017 (39426)

I have added one further set of comparison traces. In figure 8 we show the effect of including the damping O-rings in the baffle attachment units, where we are now comparing the results when hitting directly on the baffle in its upper position, rather than hitting the structure  as shown in figure 4. We see again that the damping makes a significant beneficial difference.

Non-image files attached to this comment
Displaying reports 45481-45500 of 83724.Go to page Start 2271 2272 2273 2274 2275 2276 2277 2278 2279 End