Team TCS
After having the ring heaters on last night we put in the CO2 pre loading estimates suggested in alog 43979.
After testing out this initial setting and various other differential lens settings (Please see attached time series (ignoring the high frequency noise of the Michelson losing lock)) we observed the following:
The estimate for the CD accounts for the sideband contribution from the Schnupp asymmetry.
TVo, Danny, Hang
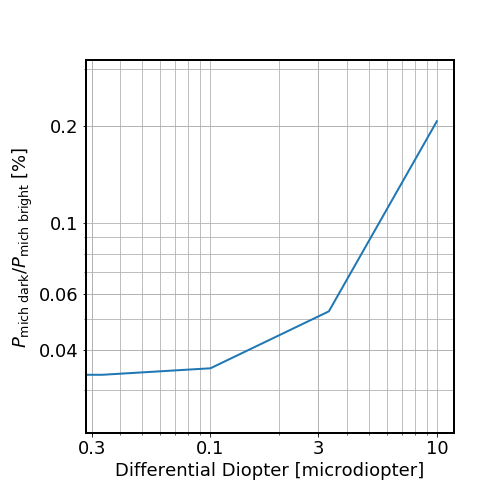
We did a quick Finesse simulation to see how much contrast defect we should expect at the simple mich configuration, as a function of differential ITM thermal lens. Here the contrast defect was defined as the AS power at MICH dark/ power at MICH bright.
Please see the first attached figure. We expect around 0.2% contrast defect at 10 microdiopter (100 km differential ITM lens). This should roughly serve as a requirement on TCS.
On the other hand, to get good SRM alignment signal & small SRM detuning (which affects the low freq DARM response), we need to control the differential lens to <~ 10 microdiopter.
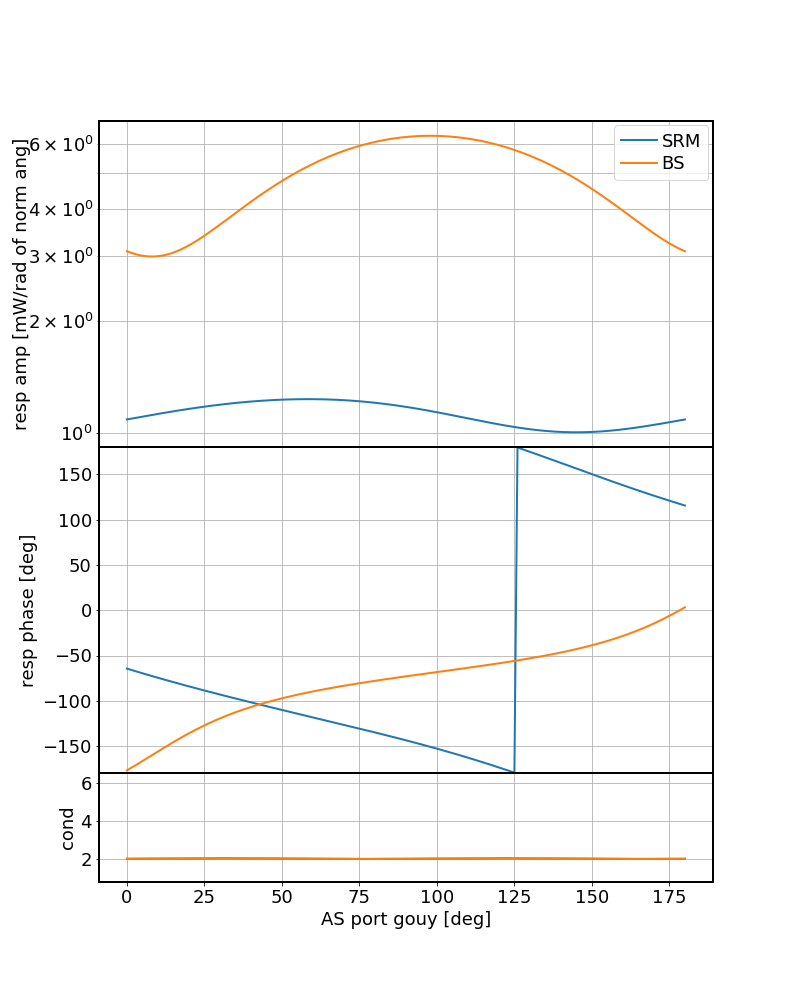
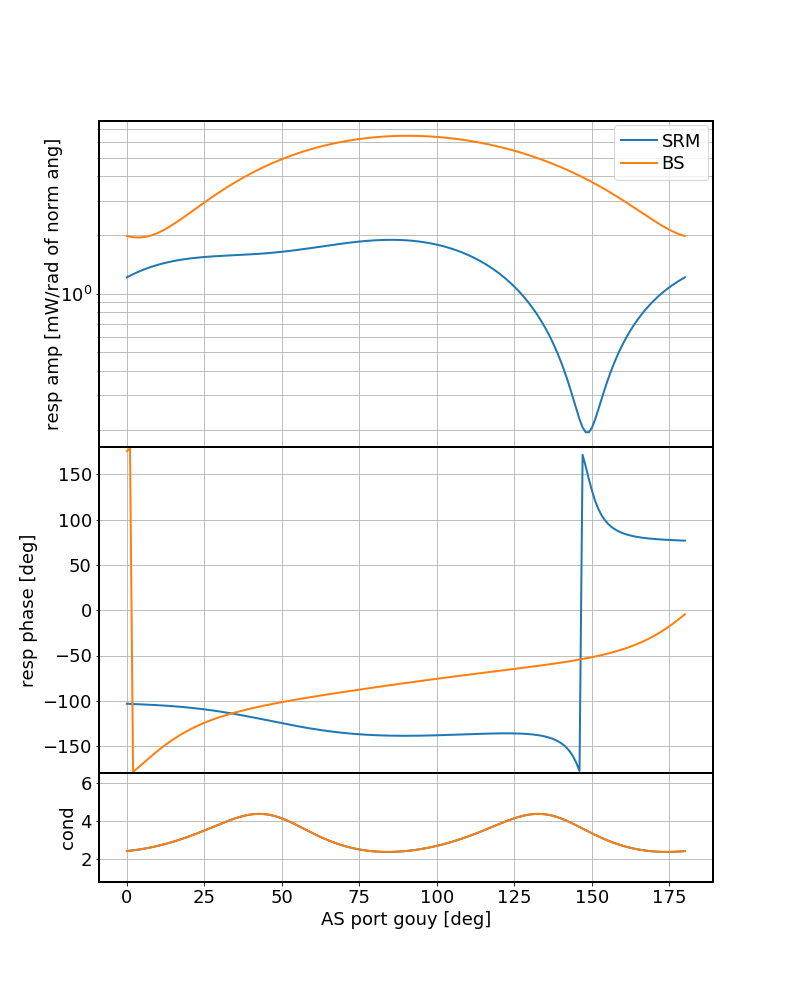
The second (no diff lens) and third figures (100 km diff lens) show how the AS72 signal changes.
The last figure show the simulated DARM TF at different levels of thermal lens.
To make space for the new h1cdsrfm machine (long-range dolphin), I moved h1build up by 2U in the MSR rack. After h1build was restarted, I restarted all the Slow Controls SDF targets.
TITLE: 09/13 Day Shift: 15:00-23:00 UTC (08:00-16:00 PST), all times posted in UTC
STATE of H1: Commissioning
INCOMING OPERATOR: None
SHIFT SUMMARY:
Day mostly dominated by TCS work
LOG:
15:30 Vanessa out to LVEA - cleaning
16:30 Nutsinee out to HAM6 area - ISCT6
16:59 Vanessa out to EX
17:15 Haocun out to LVEA - w/Nutsinee
17:33 Nutsinee out
17:34 Vanessa out to EY
17:41 Mark, Tyler, and Chris out to work on the outside of EX sealing bat-holes.
18:37 Marc and Dave ou to LVEA - cabling from H2 building into LVEA
20:00 Commissioning meeting
21:13 Mark, Tyler, and Chris back from EX
21:18 Marc and Gerardo pulling cables back into H2 building from LVEA - Gerardo into LVEA; Marc into H2 building
21:25 Gerardo back
21:38 Gerardo out to LVE to valve in neg pumps - aLog
22:11 Nutsinee, Haocun, and Terry out to TCSY area
22:37 Terry back - Nutsinee and Haocun still out
{Gerardo, Chandra}
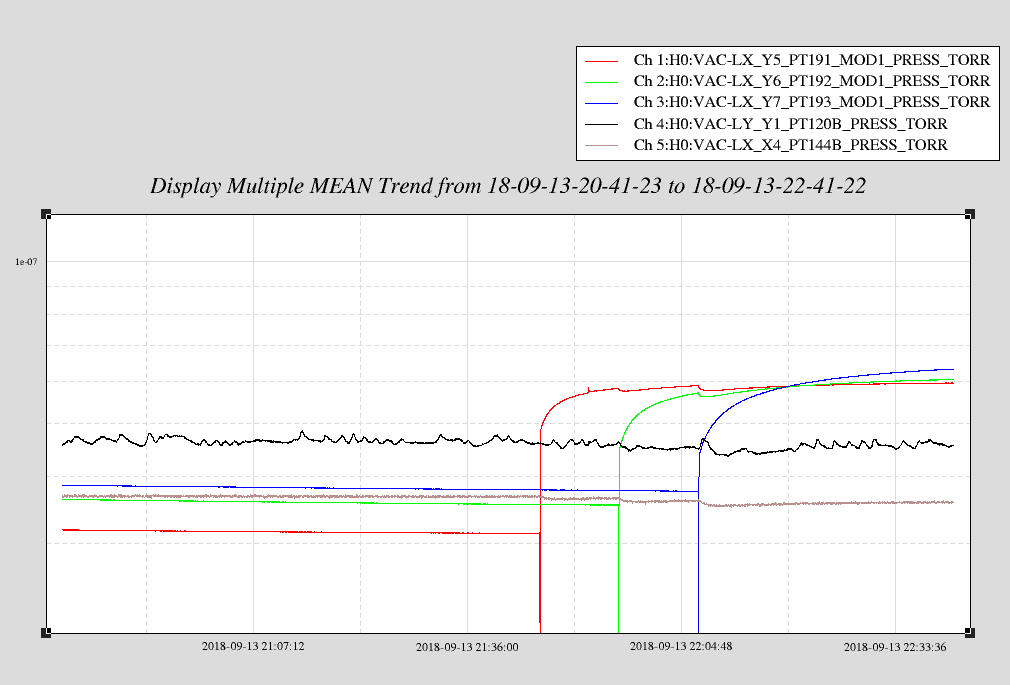
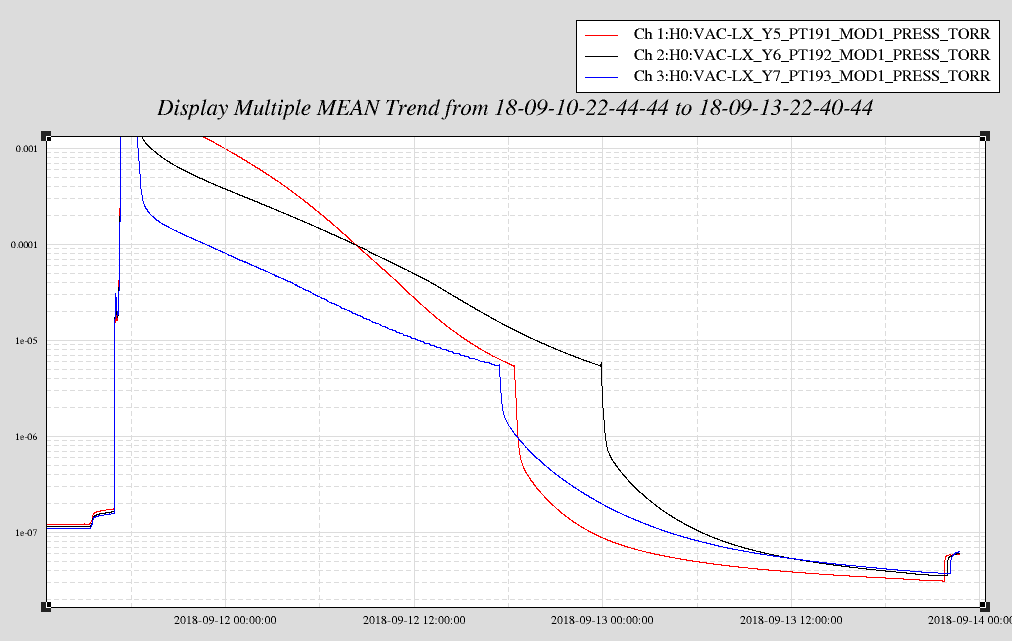
After regenerating the three corner station NEG pumps on Tuesday, we observed the local housing pressures at NEG 1,2,3 for a couple of days before valving into main volume. While valving in (waiting 10 minutes between each NEG), we scanned the RGA and observed no noticeable change in AMU peaks. The total pressure decreased slightly.
Time stamps of each for RGA correlation (all local times):
Gerardo noticed gappy flanges on the BT side of the NEG isolation gate valves and Kyle does not recall spraying He directly at these on Tuesday when we "fire hose" leak checked the corner. These three units are near the RGA, where we observed the most notable increase in He signal while leak checking on Tuesday, so we would like to leak check these again.
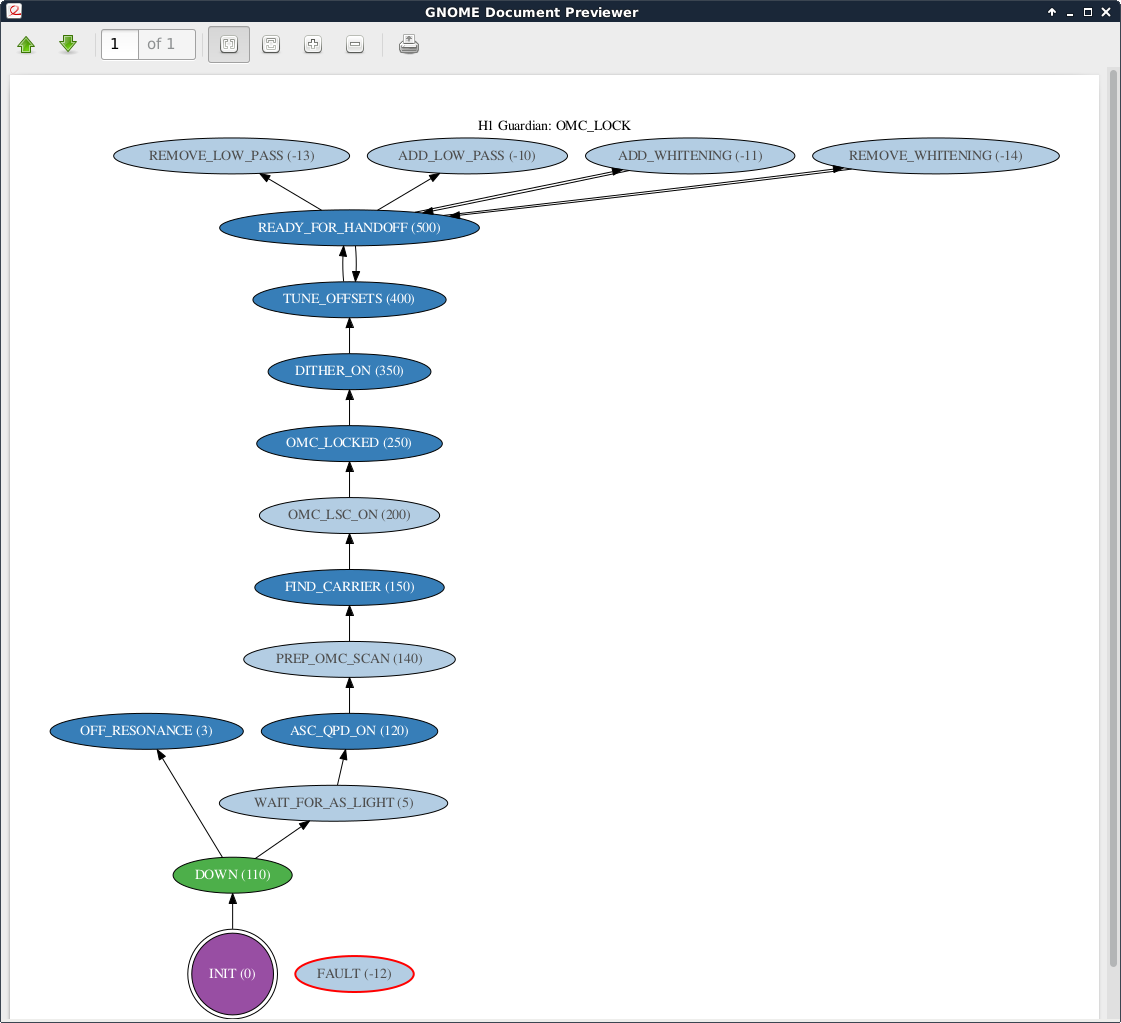
The OMC whitening chassis has been modified (42361) so that the second whitening stage is now a low pass filter. The idea is that we can engage this if the violin modes get rung up so badly that we need to reduce the analog gain to avoid commissioning. Jeff K installed the compensation filters yesterday, and now I have modified the OMC_LOCK guardian so that it can be used to engage this low pass or remove it, and so that the add and remove whitening states will only change the stages that are still whitening stages.
I've tested this without the OMC locked and it works, but it would be a good idea to test it with the OMC locked before trying it at DC readout to make sure everything is OK with the filter and it's compensation.
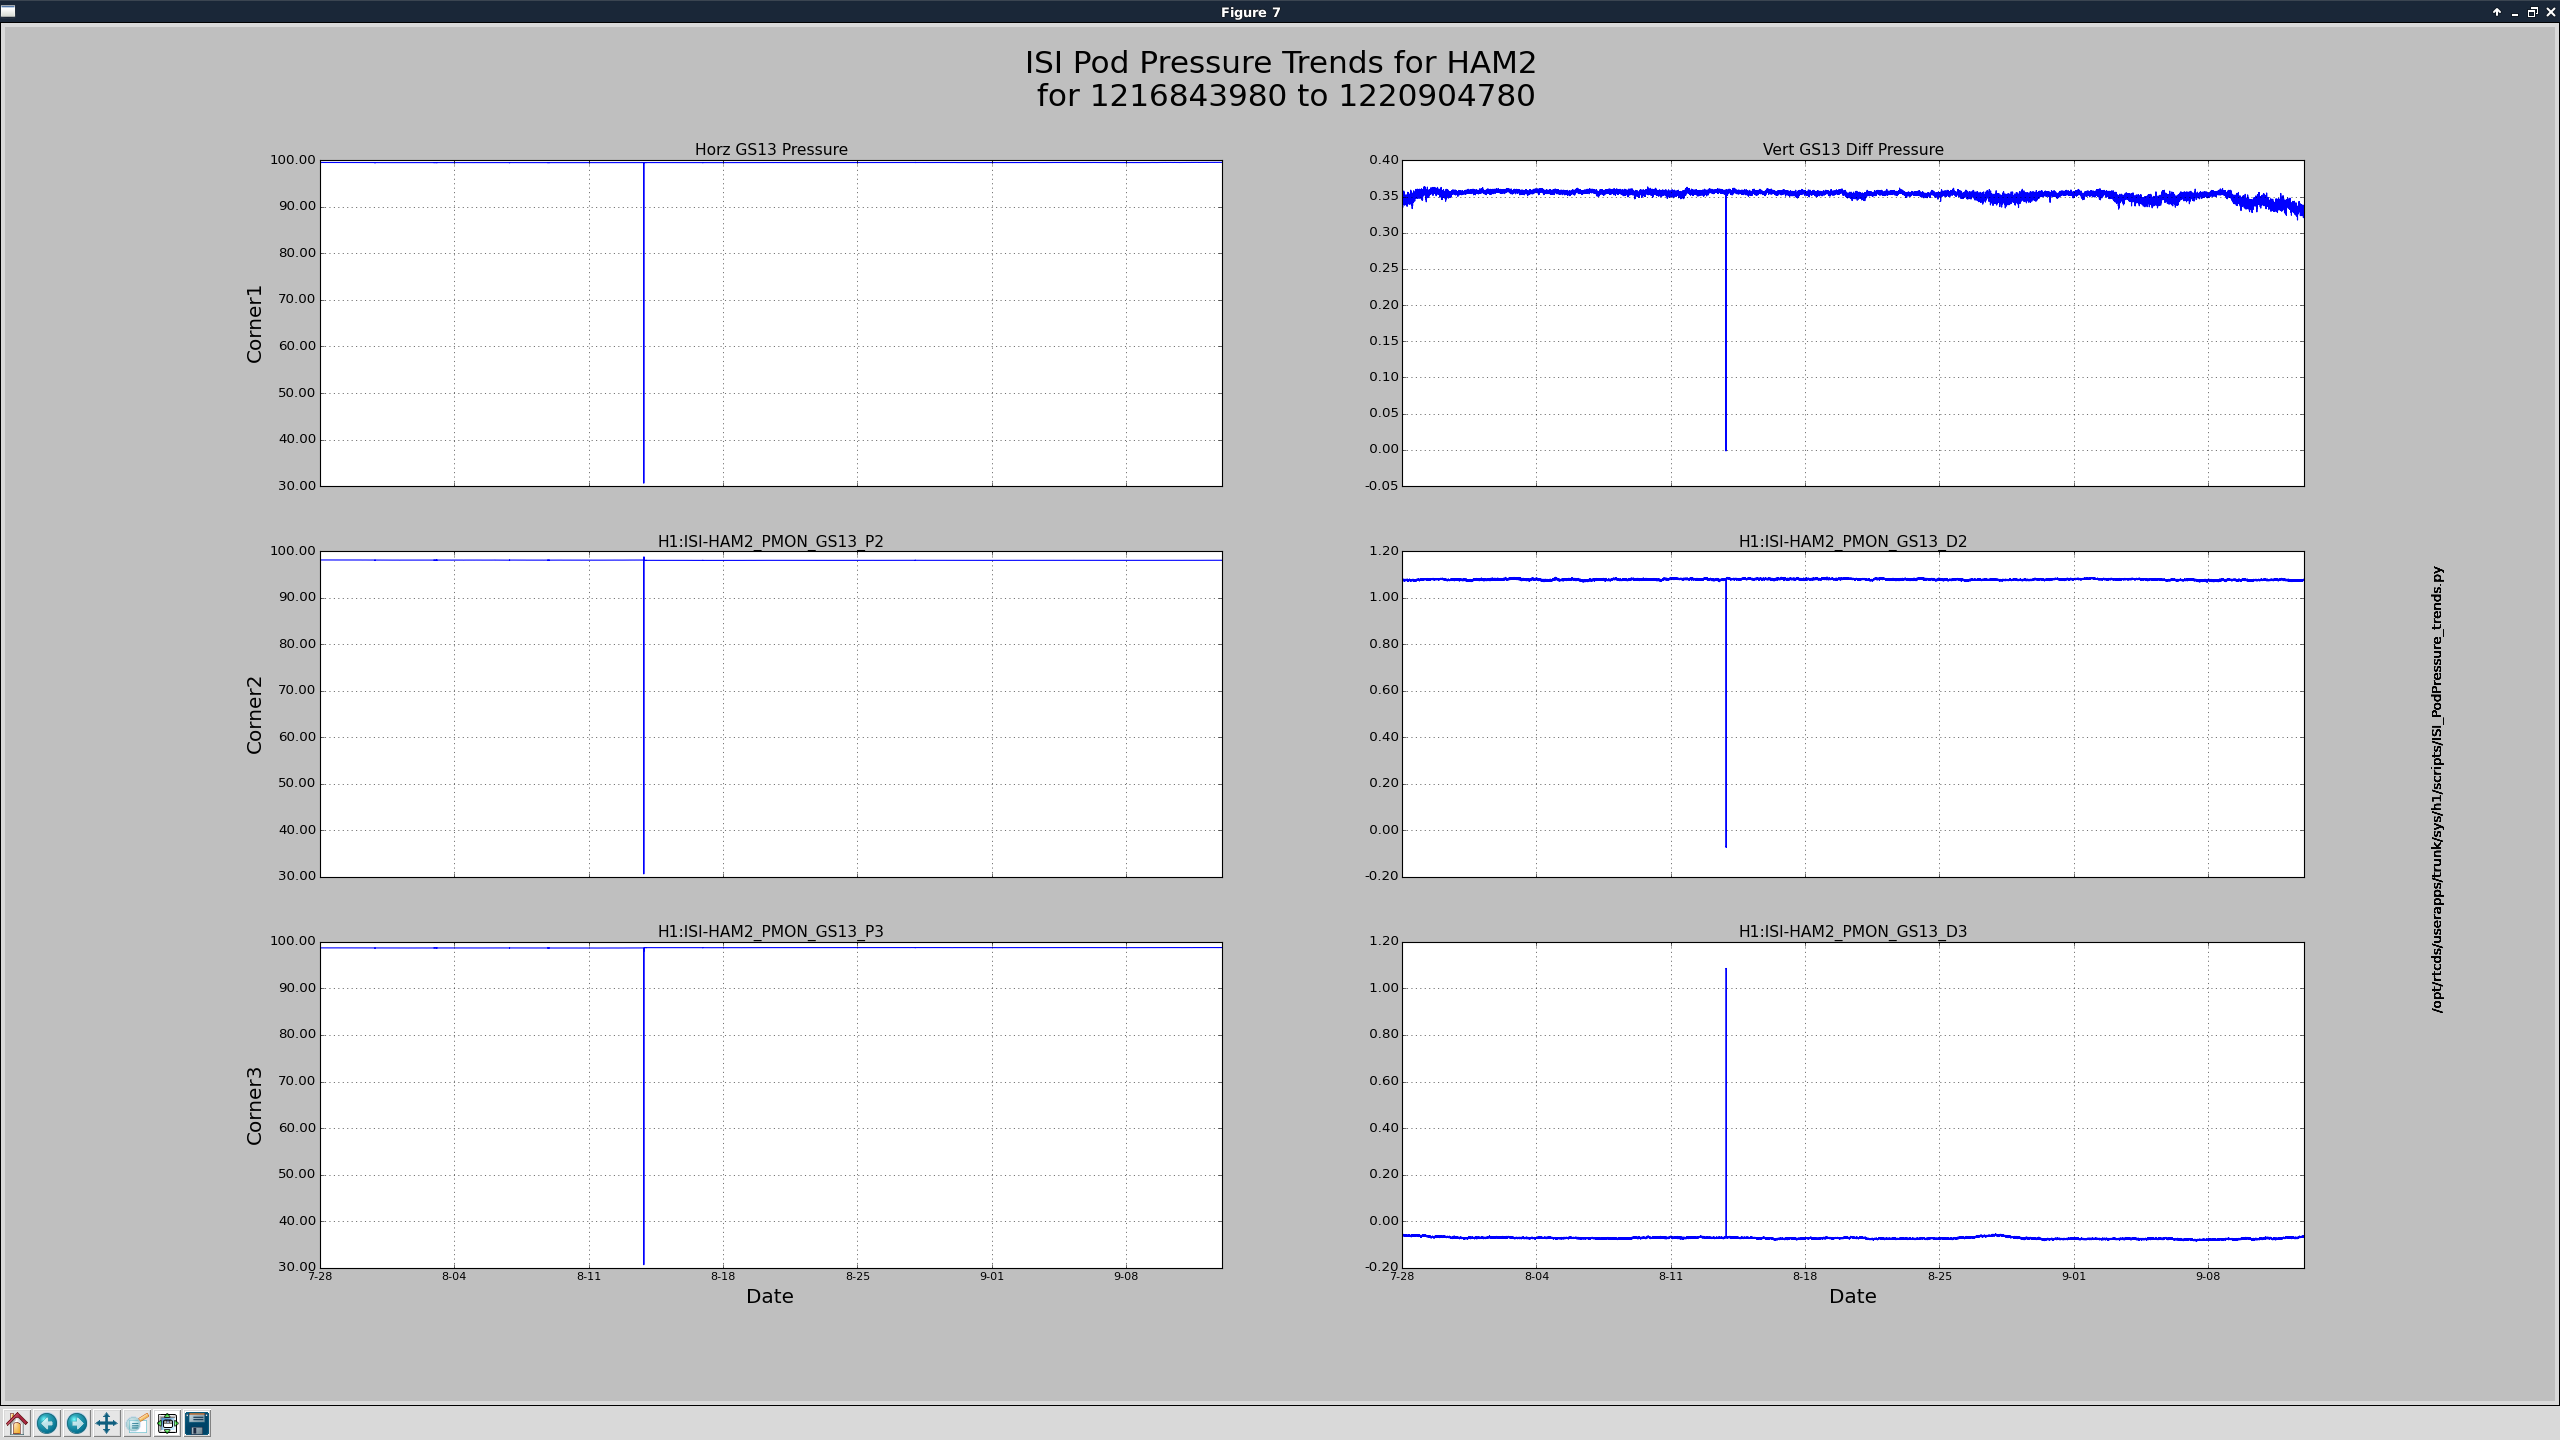
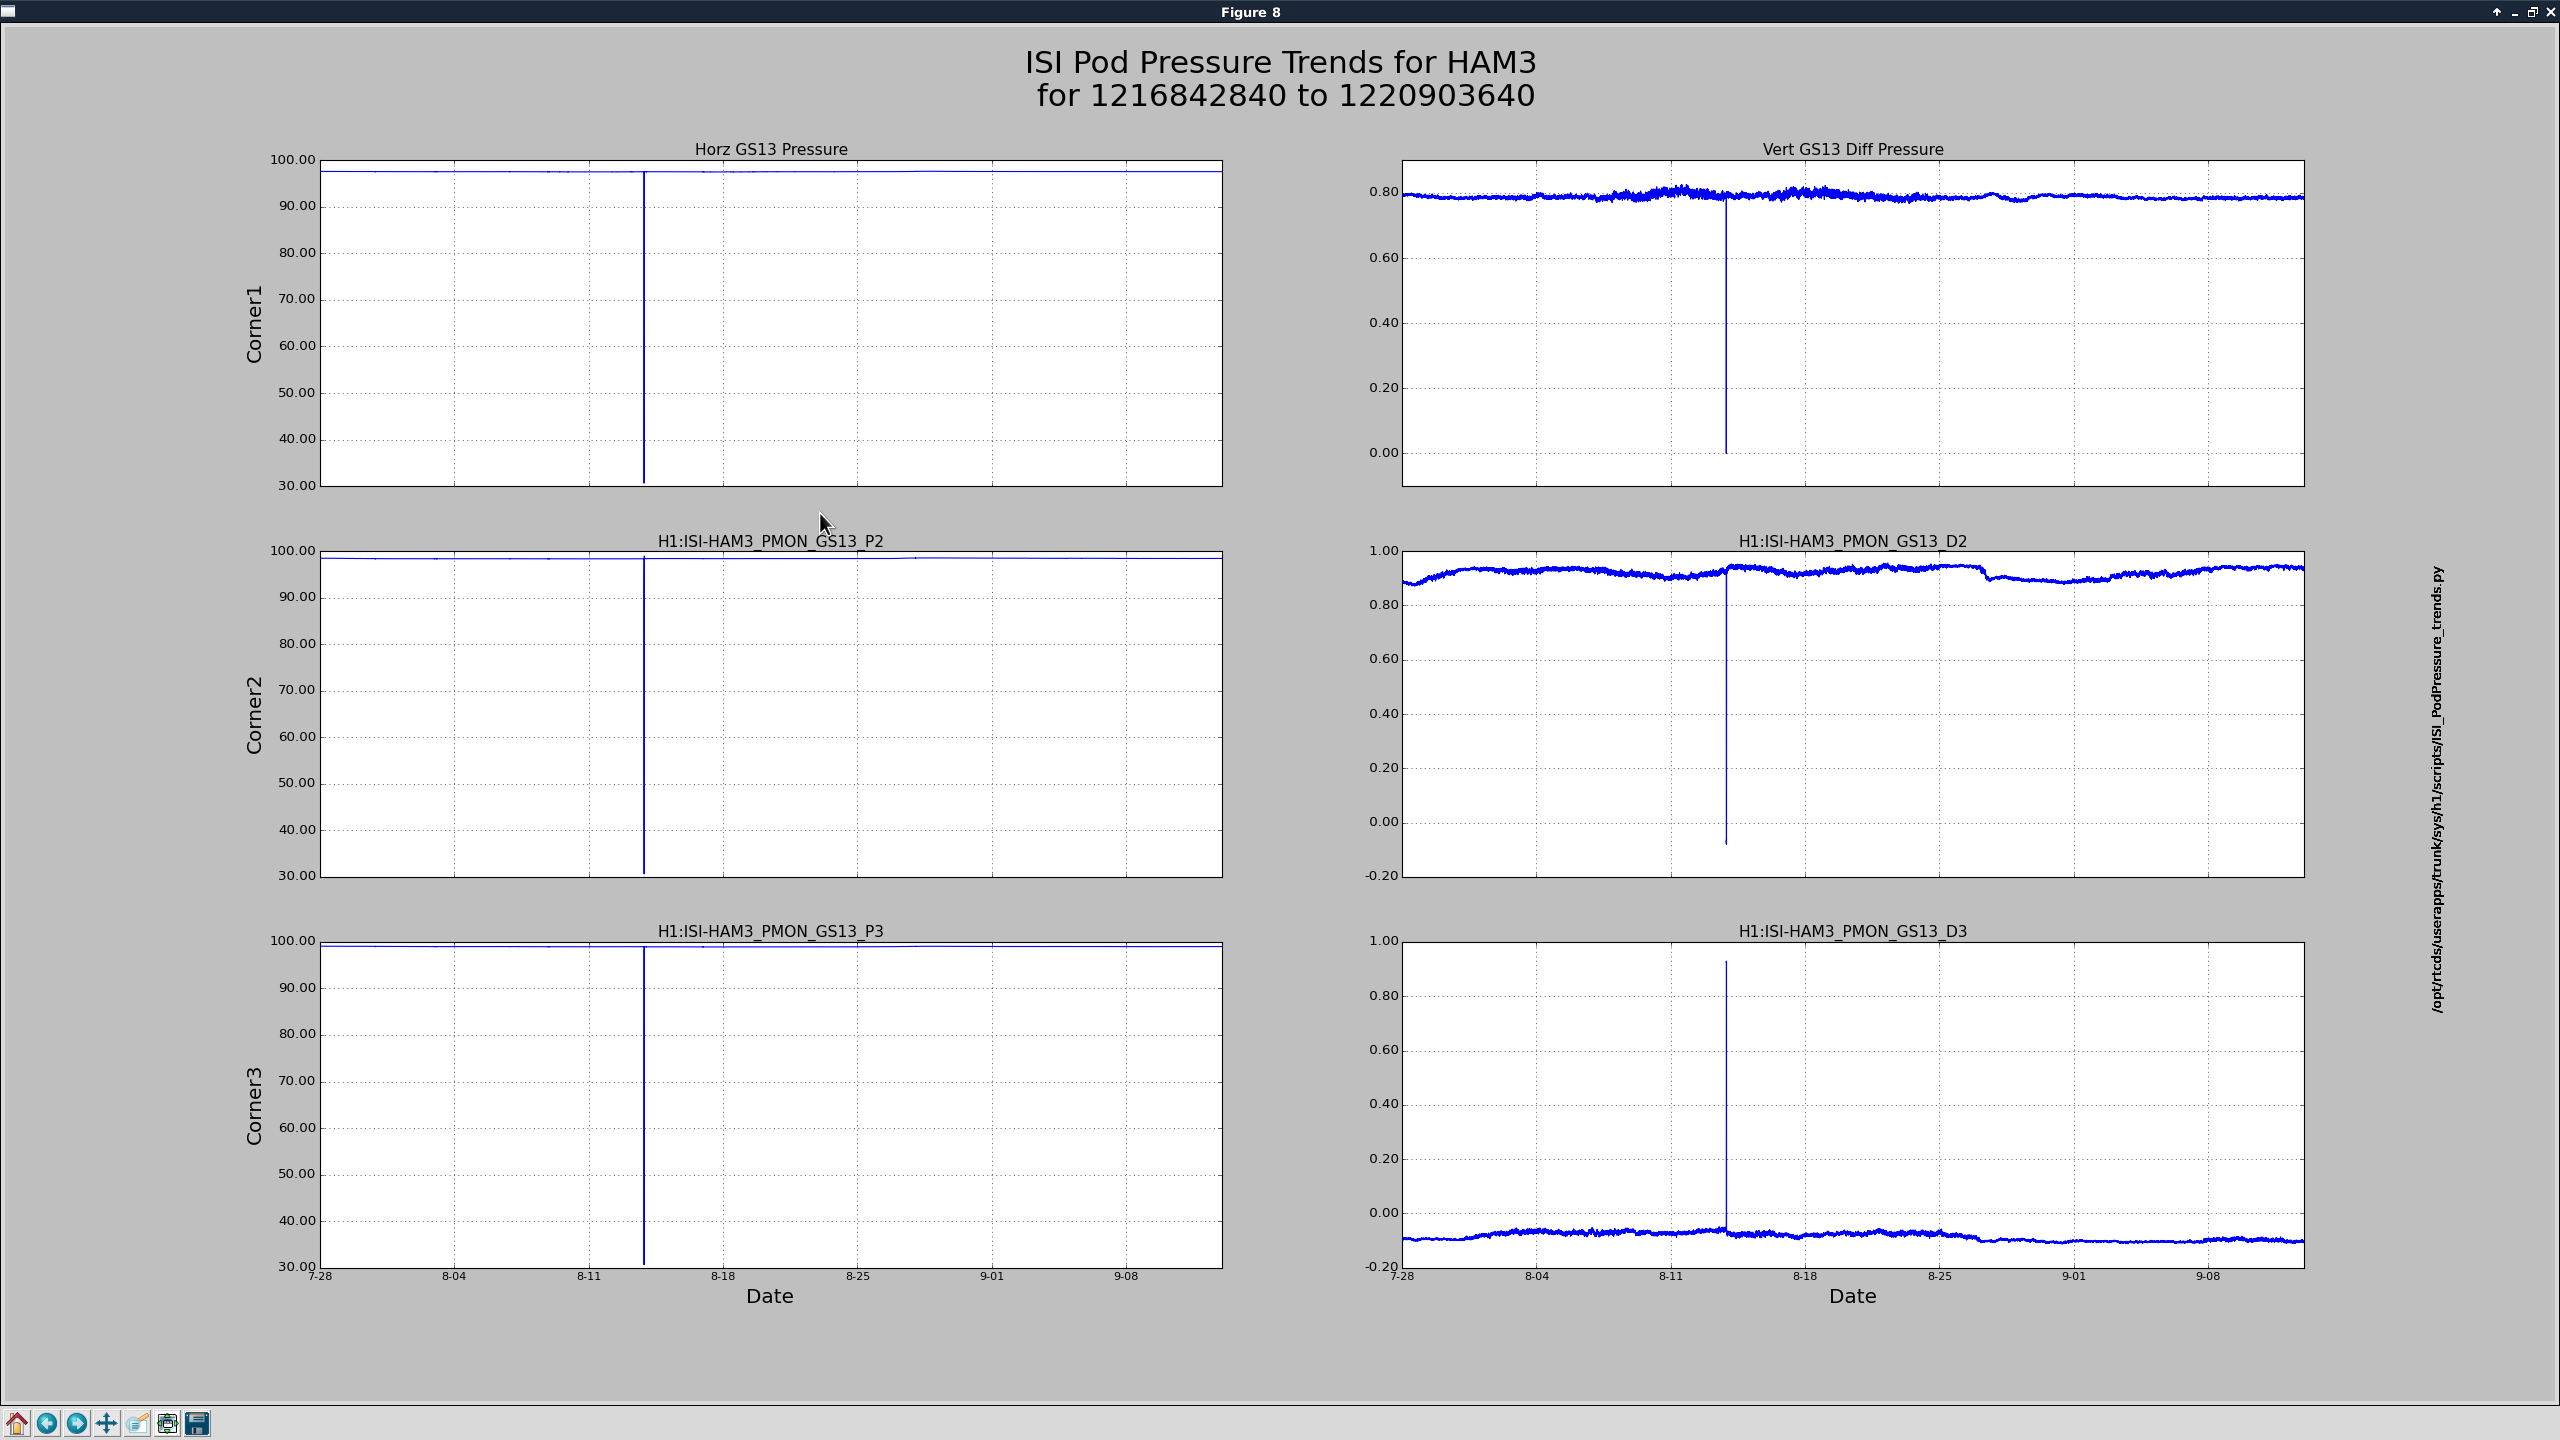
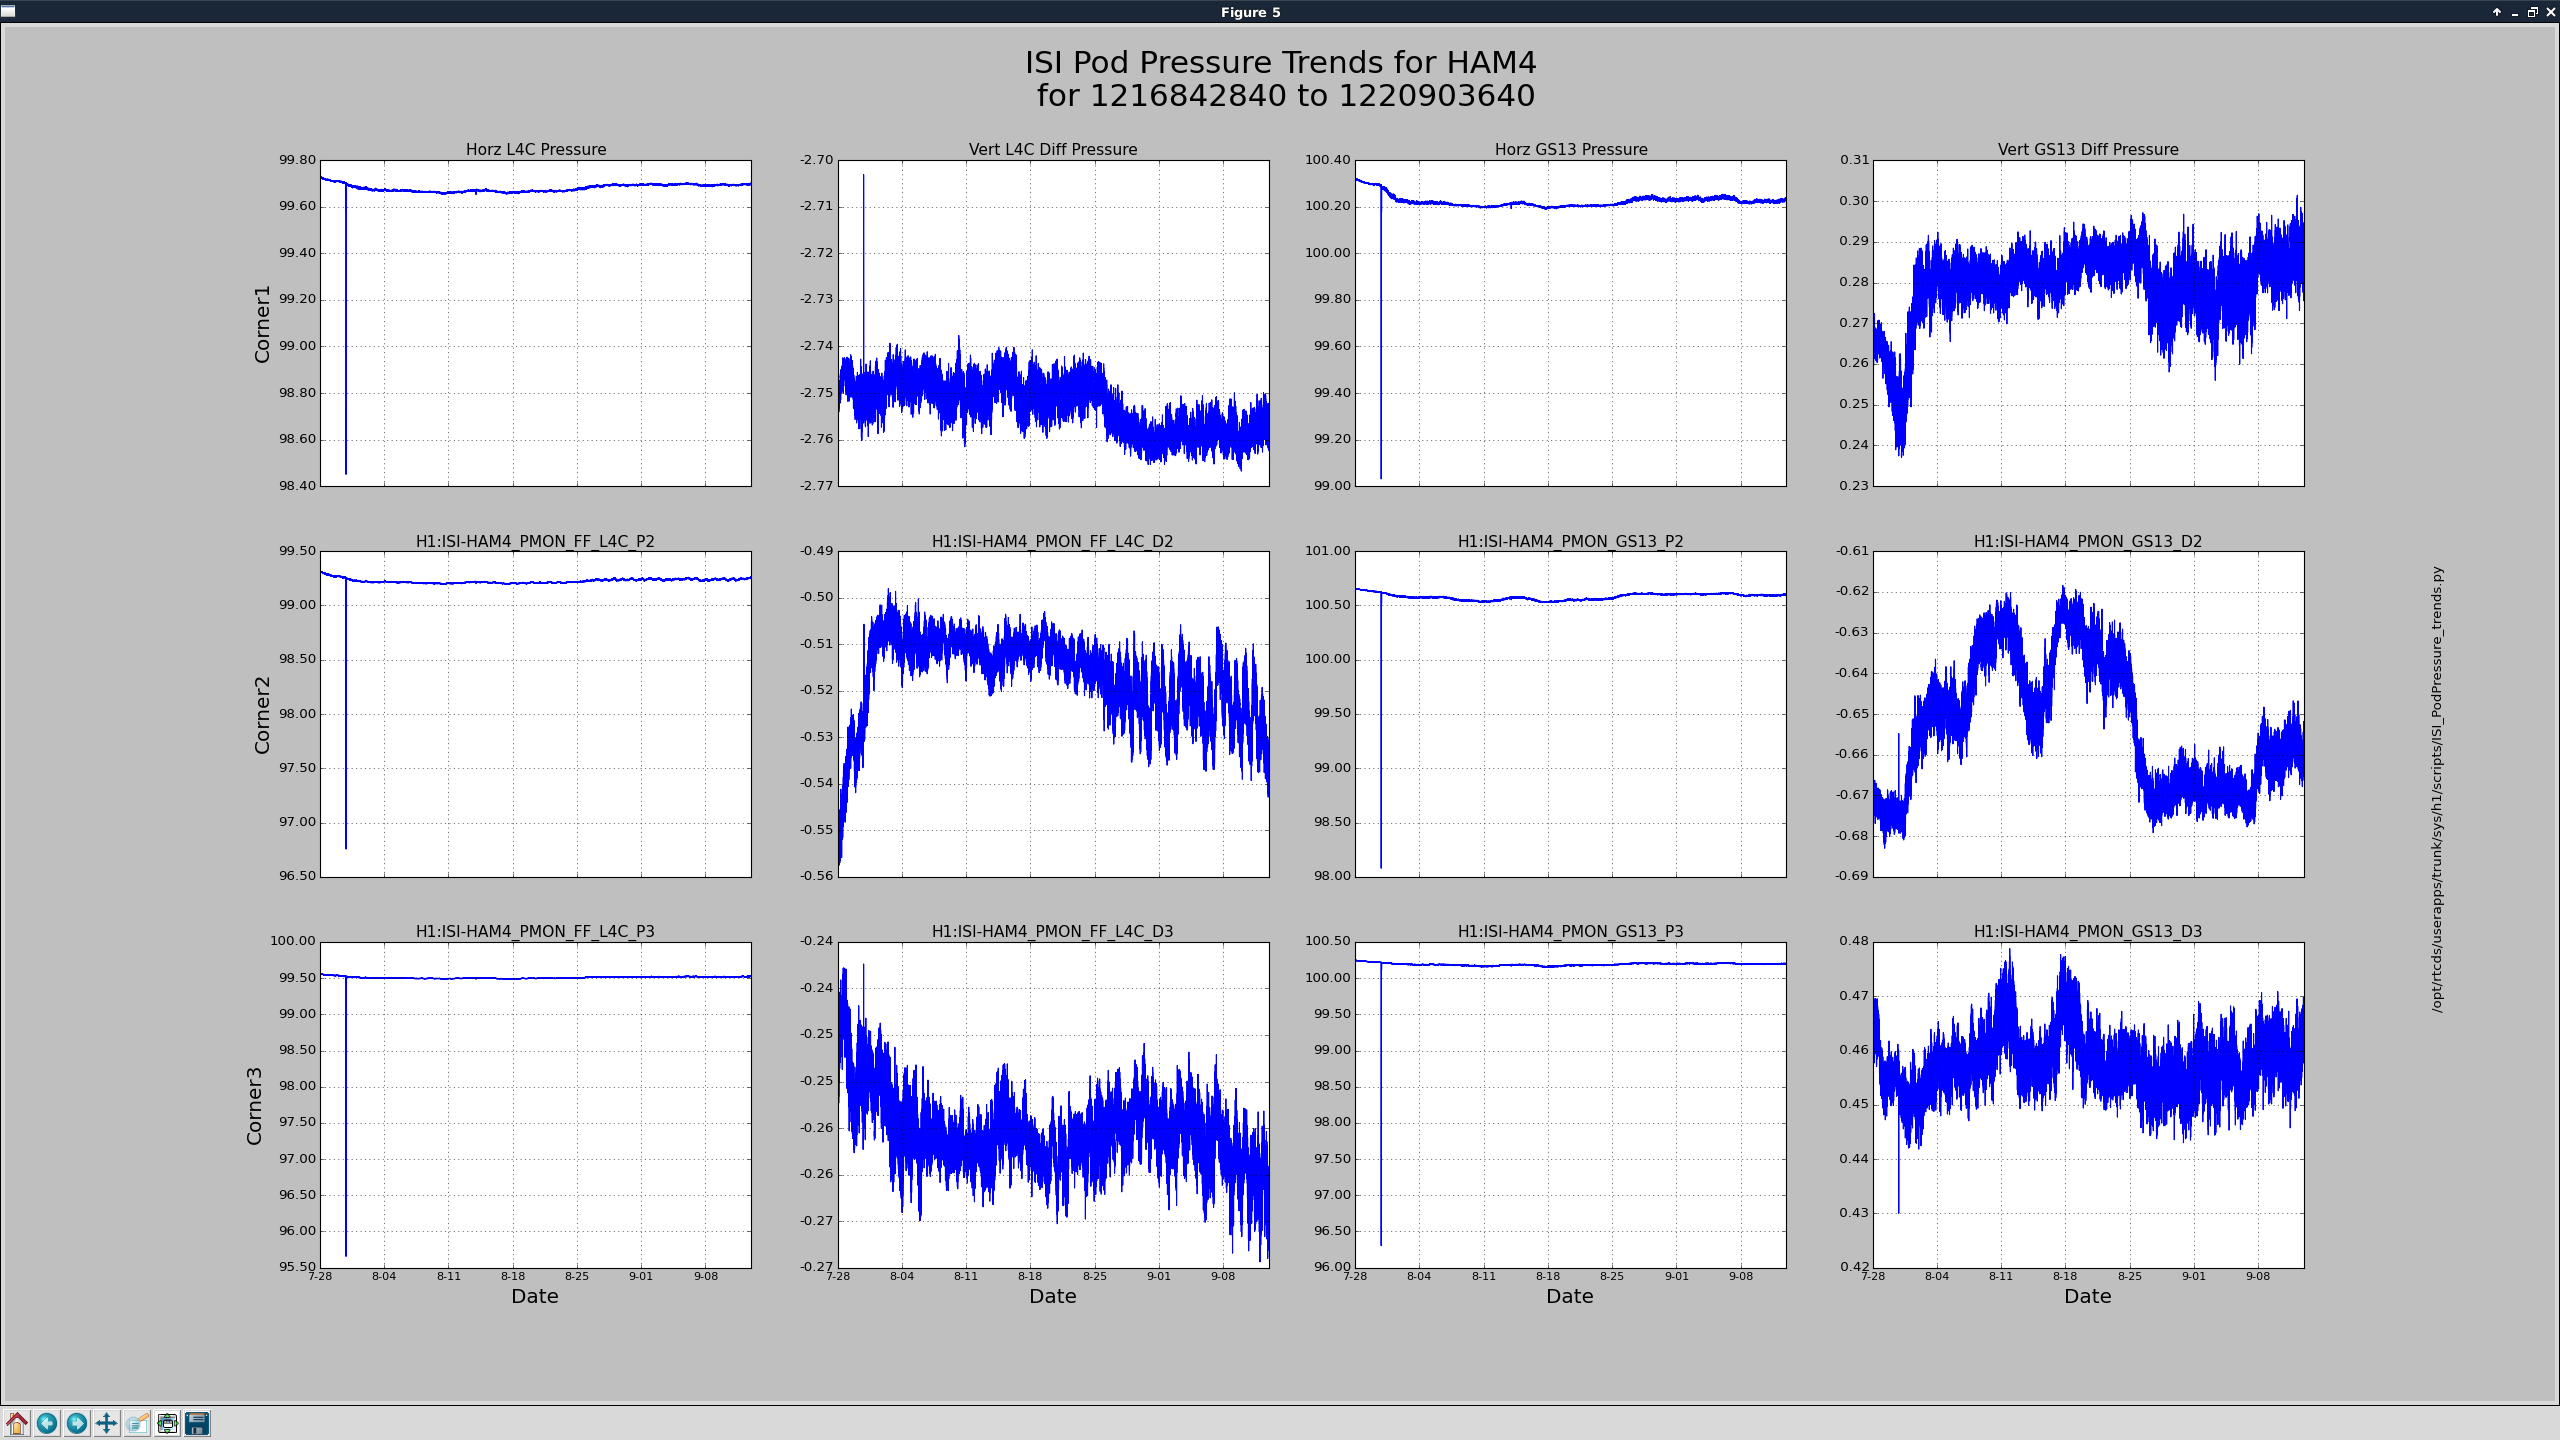
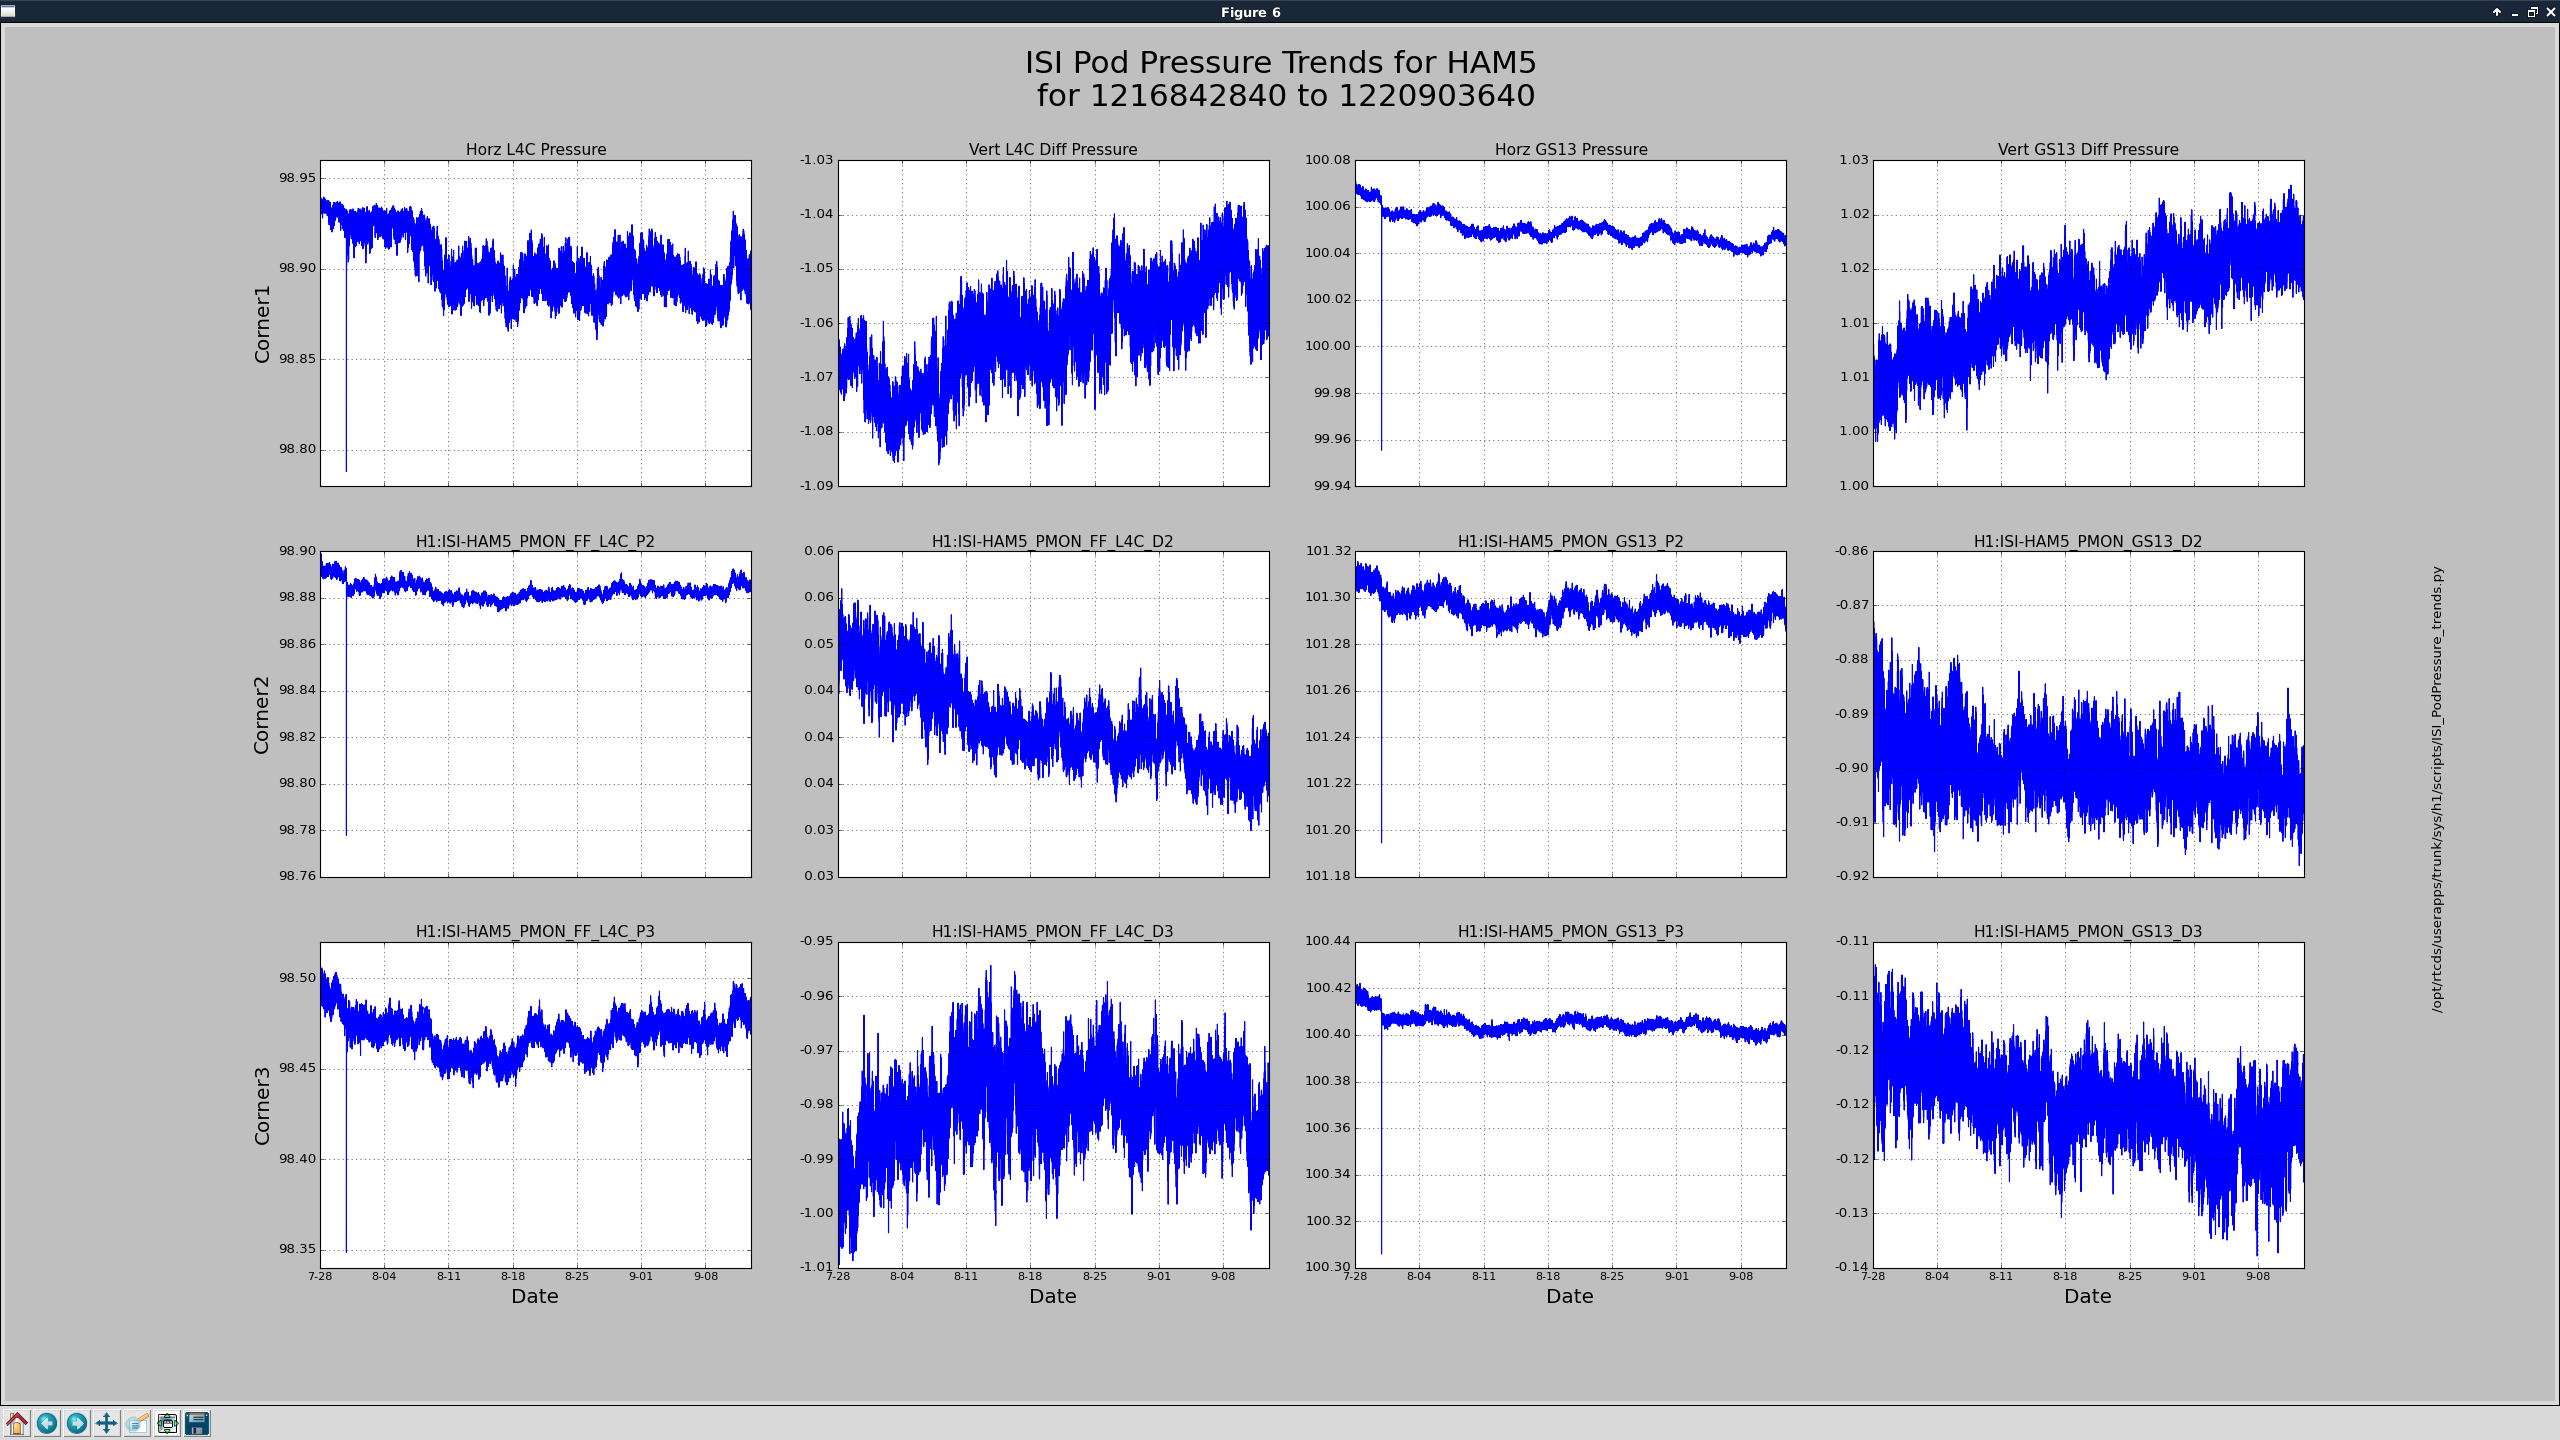
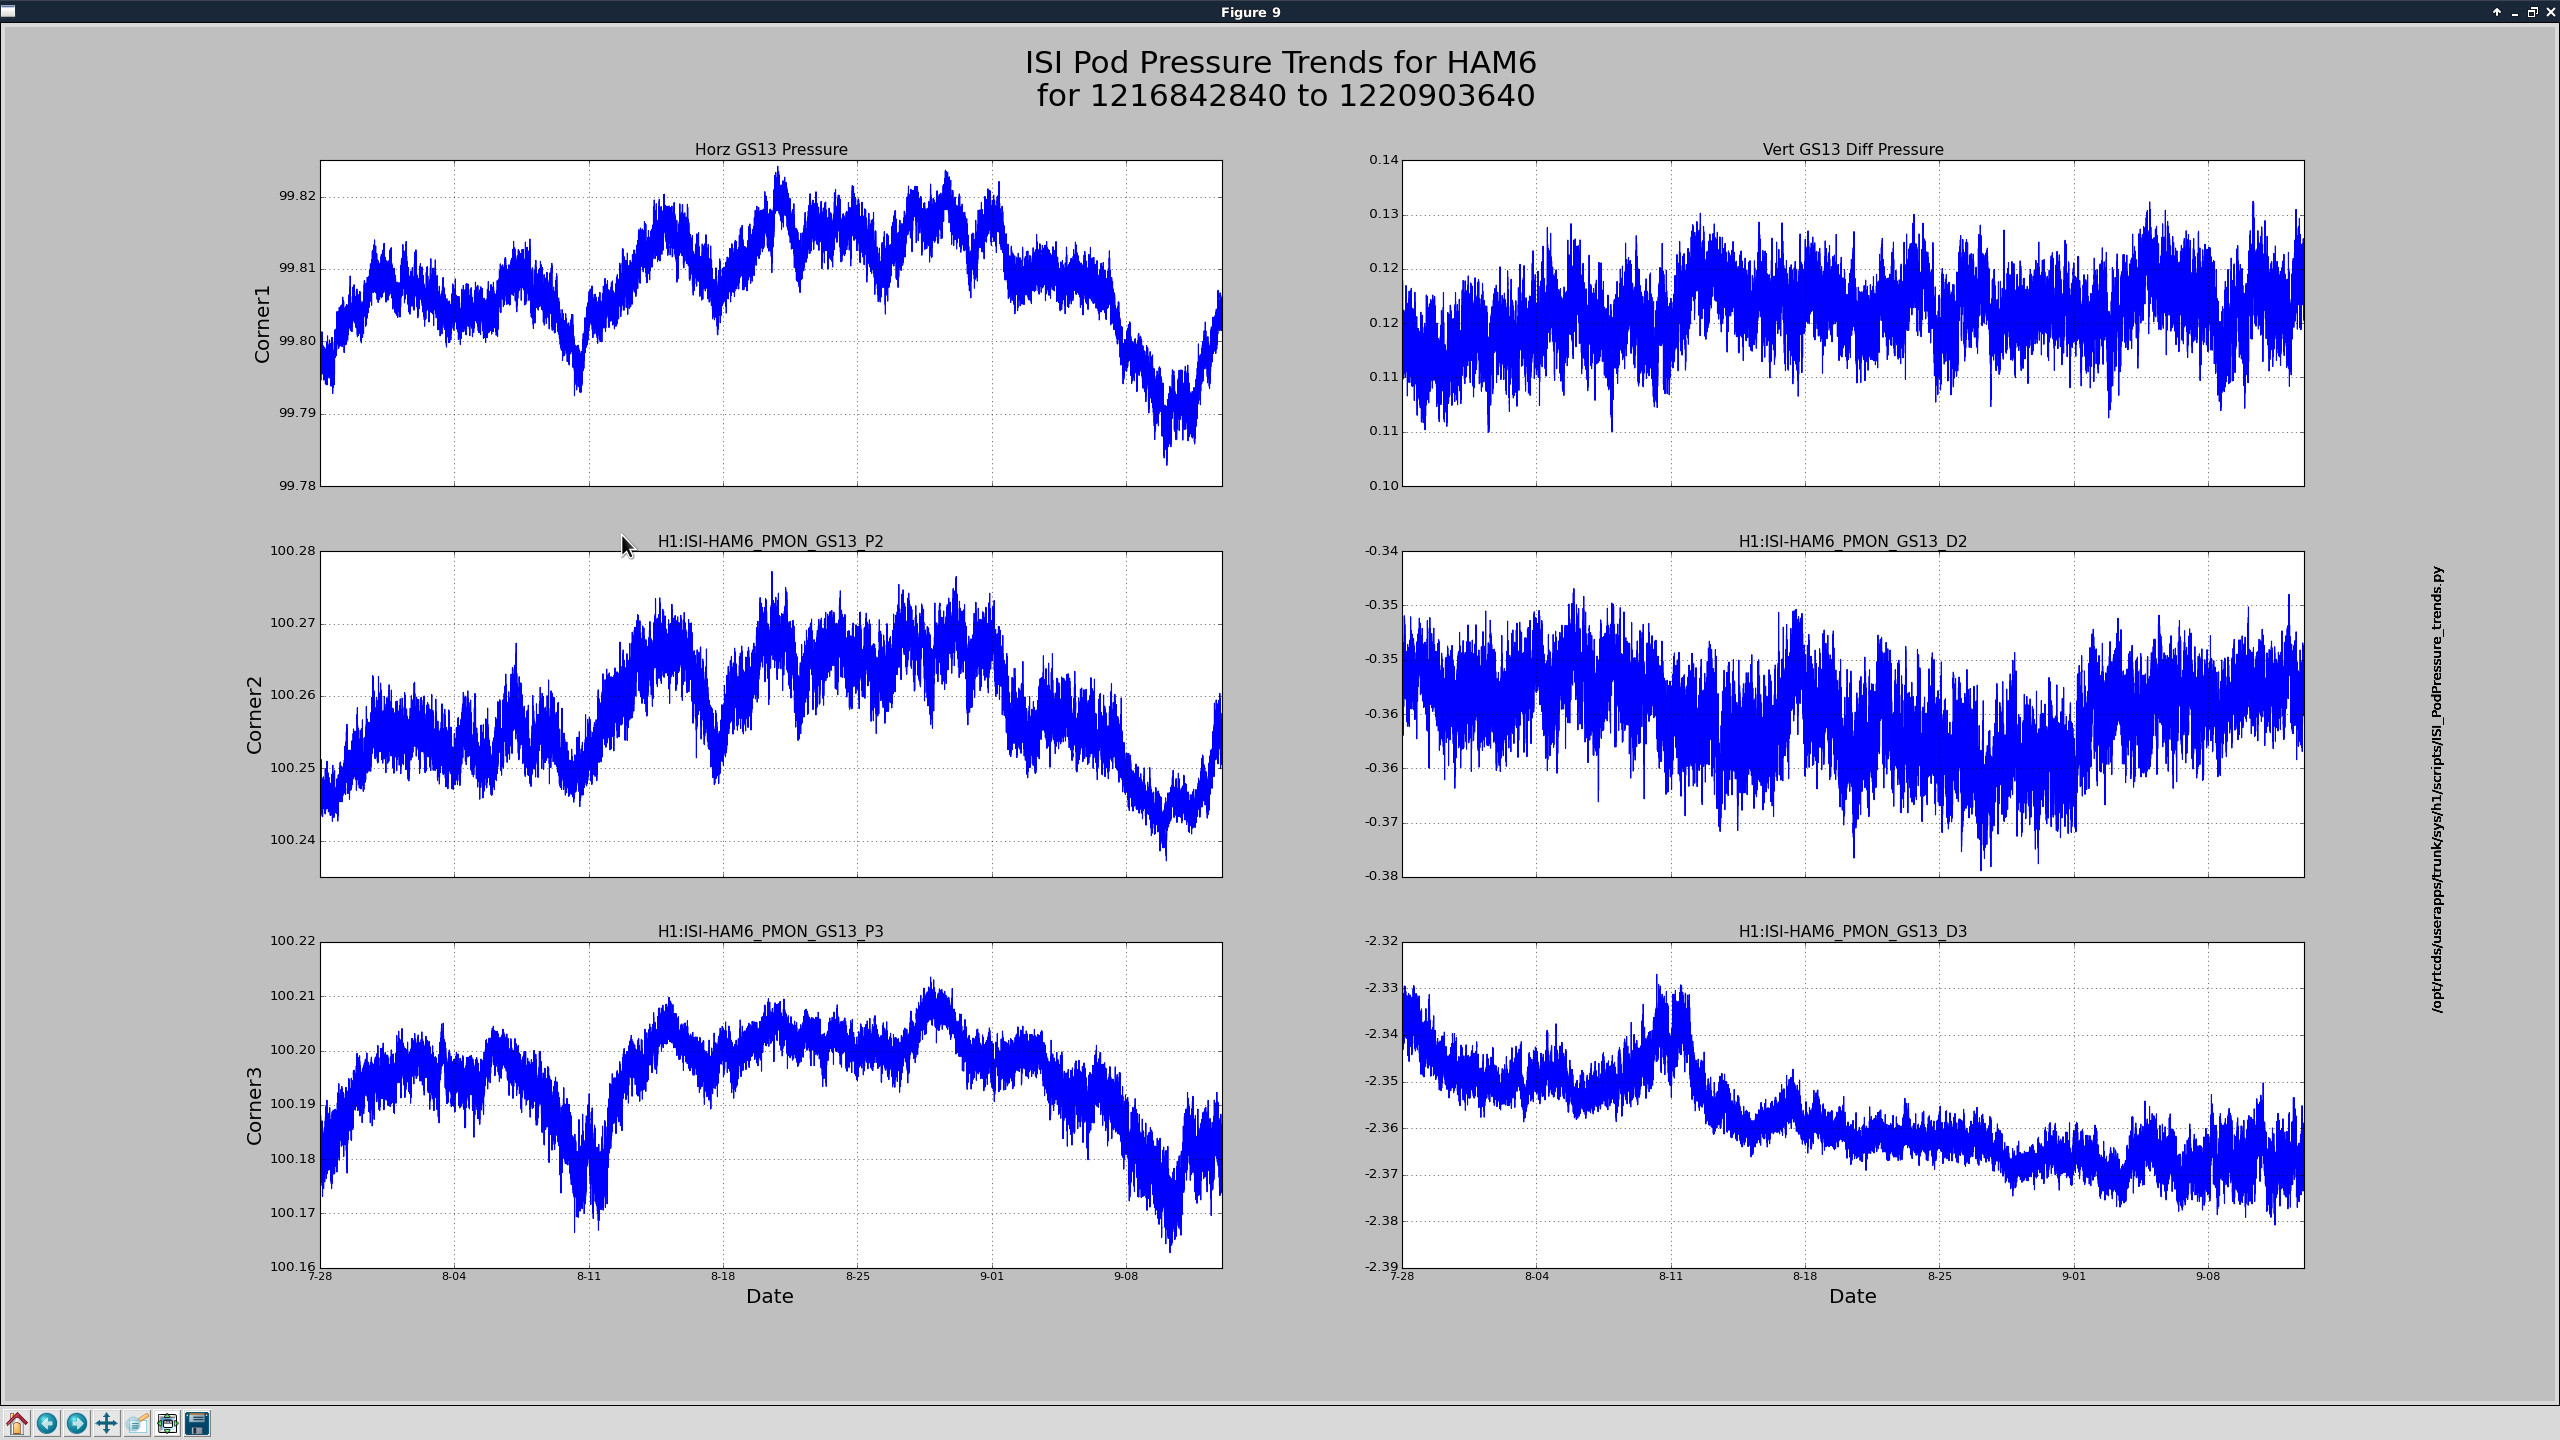
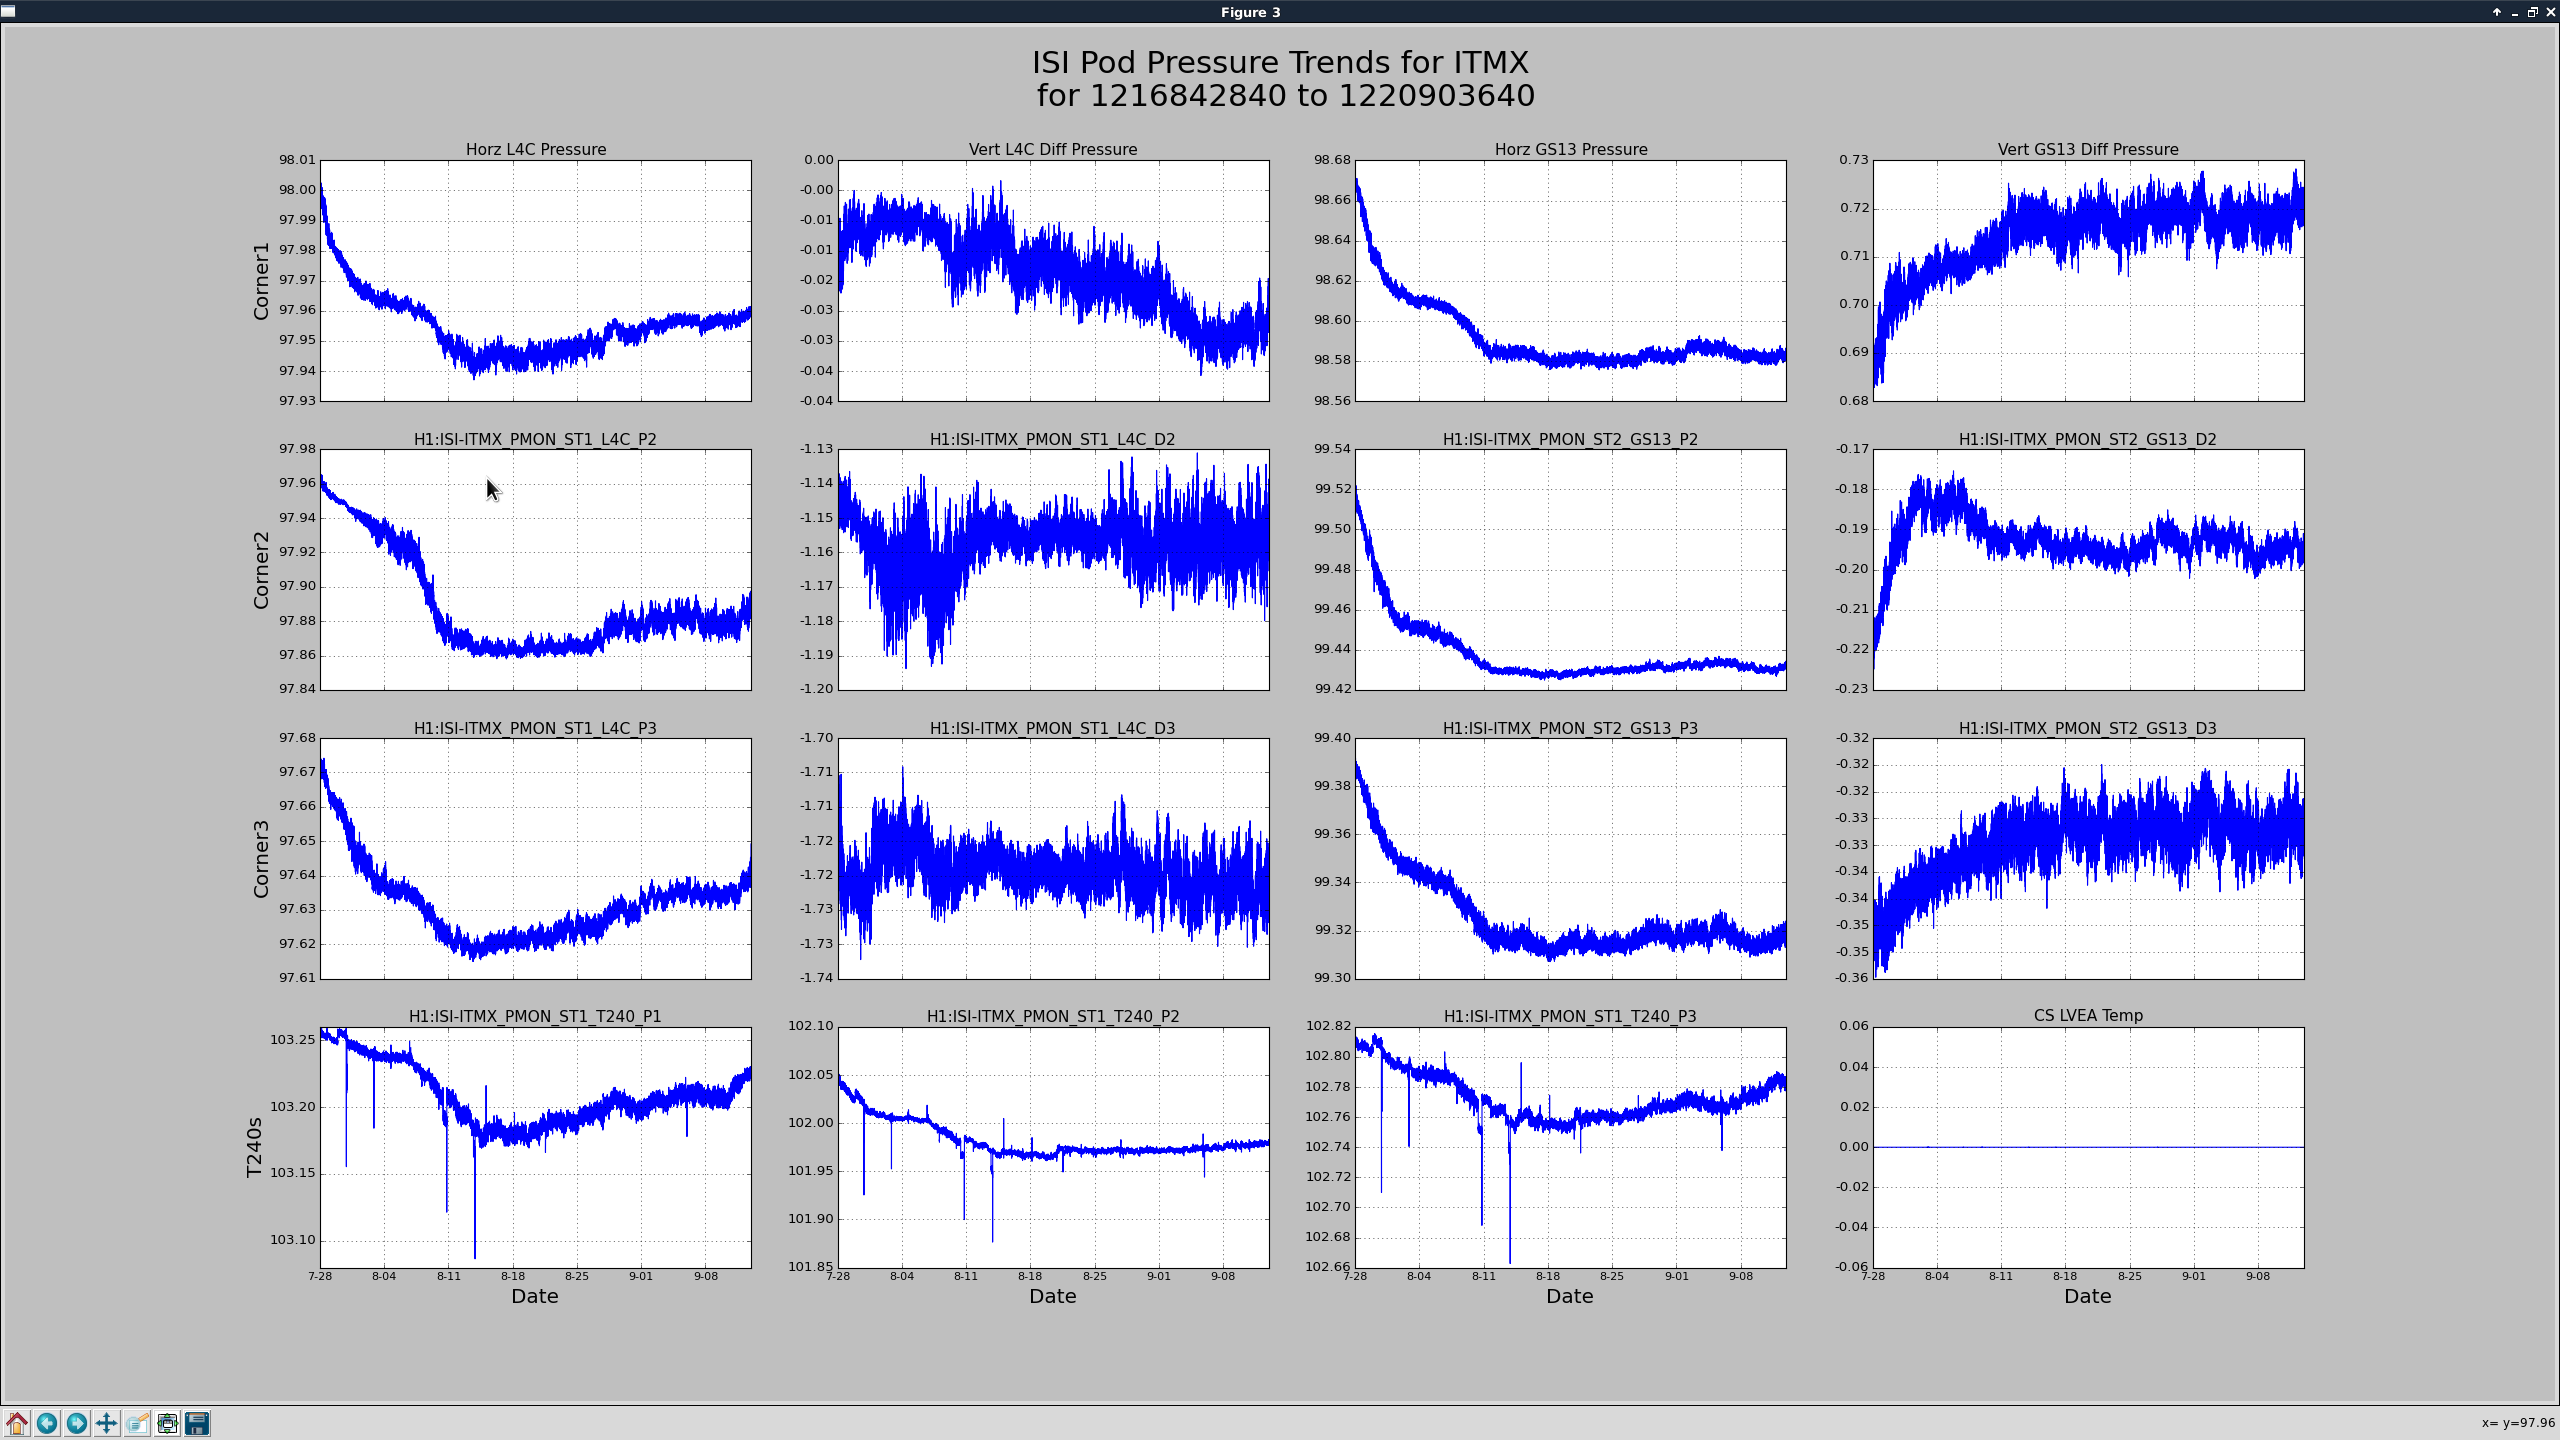
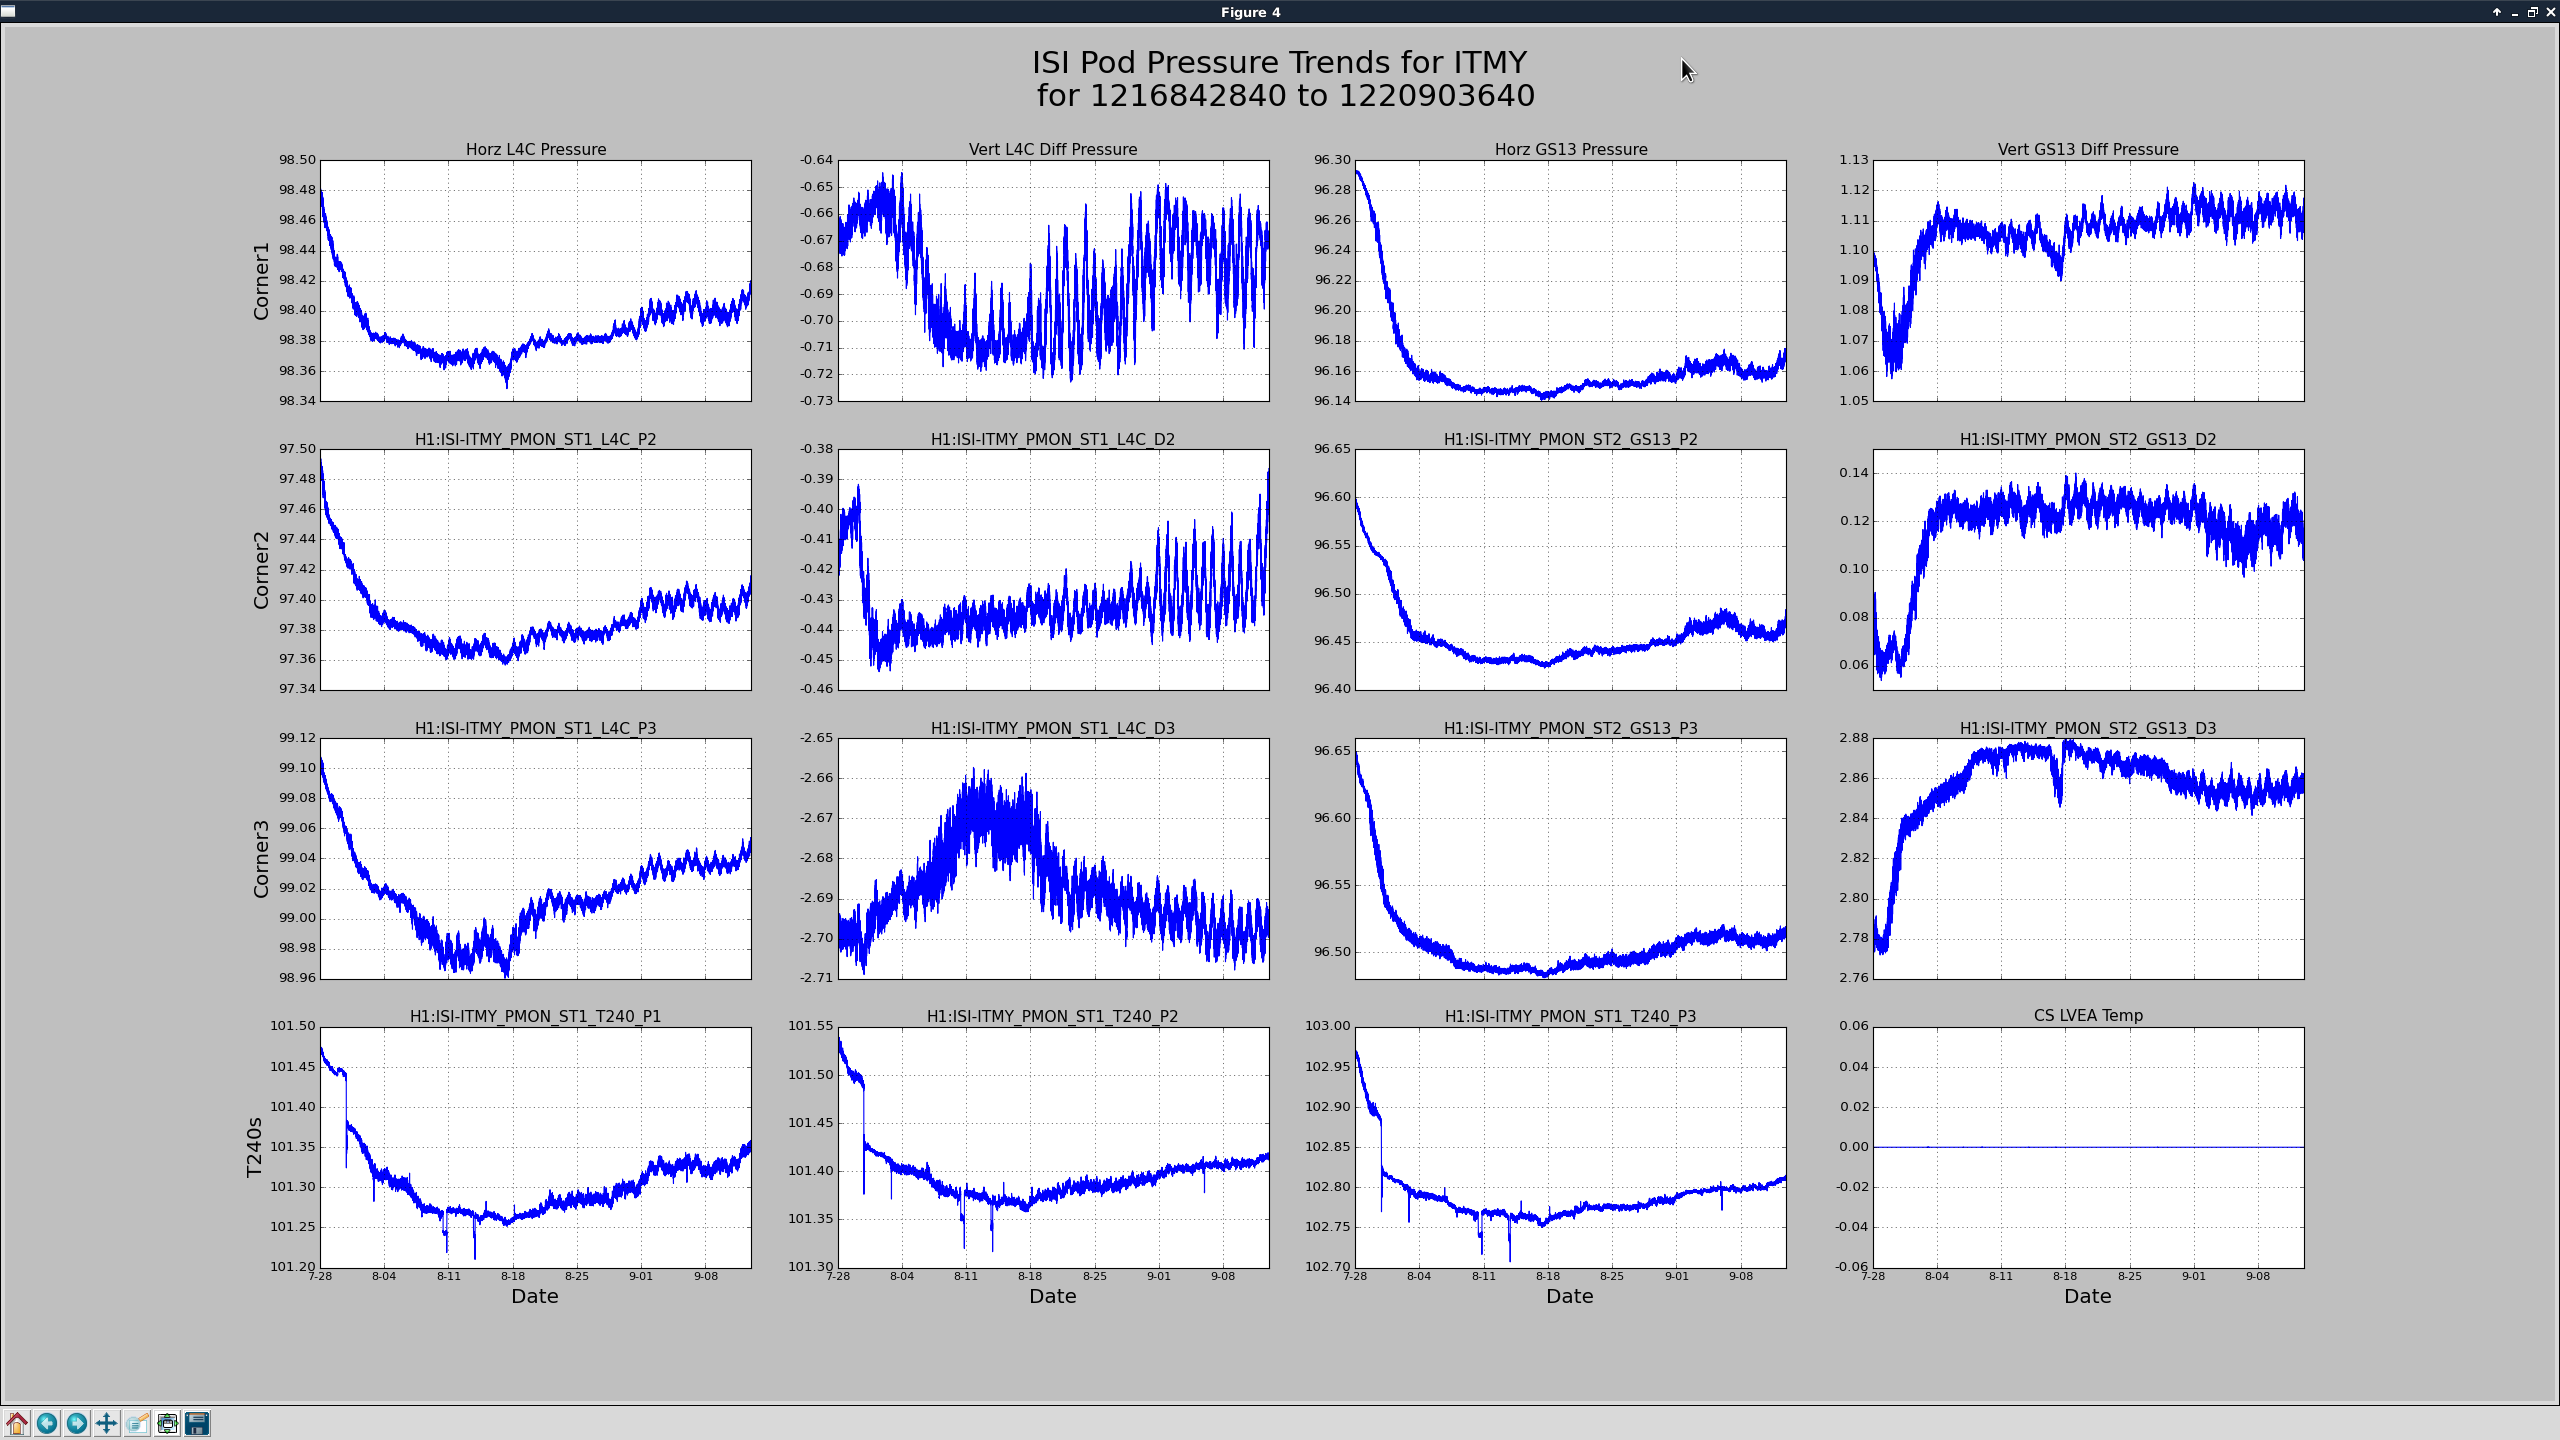
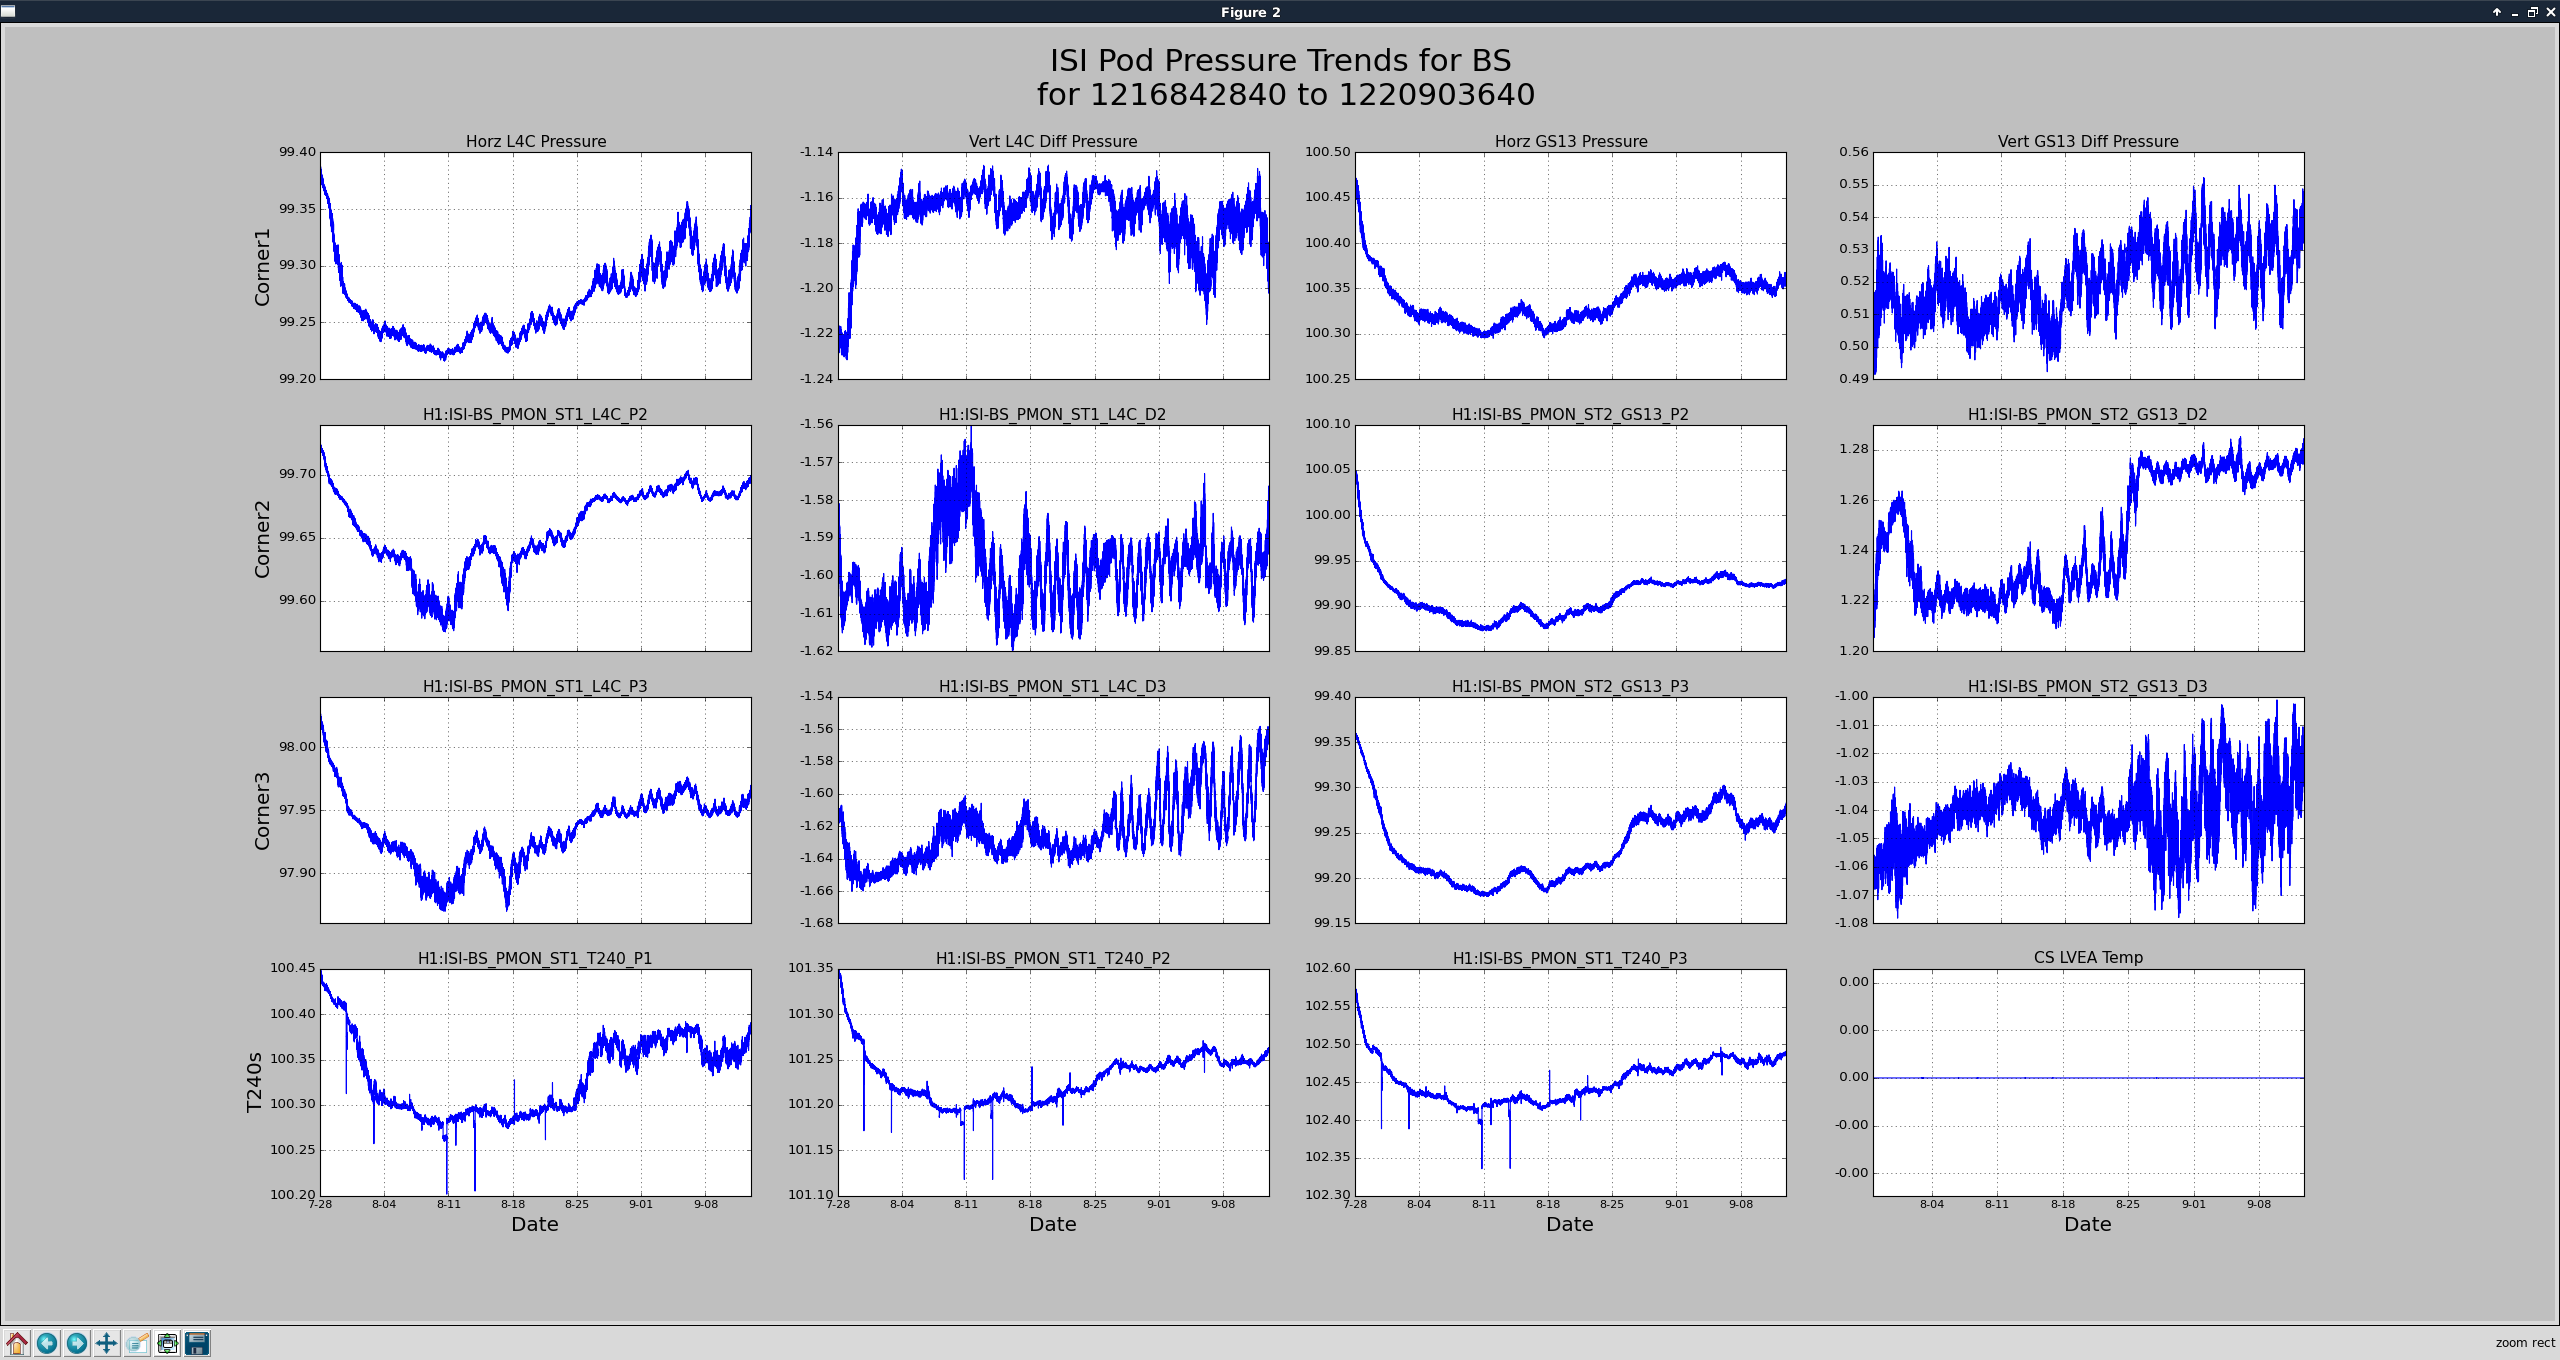
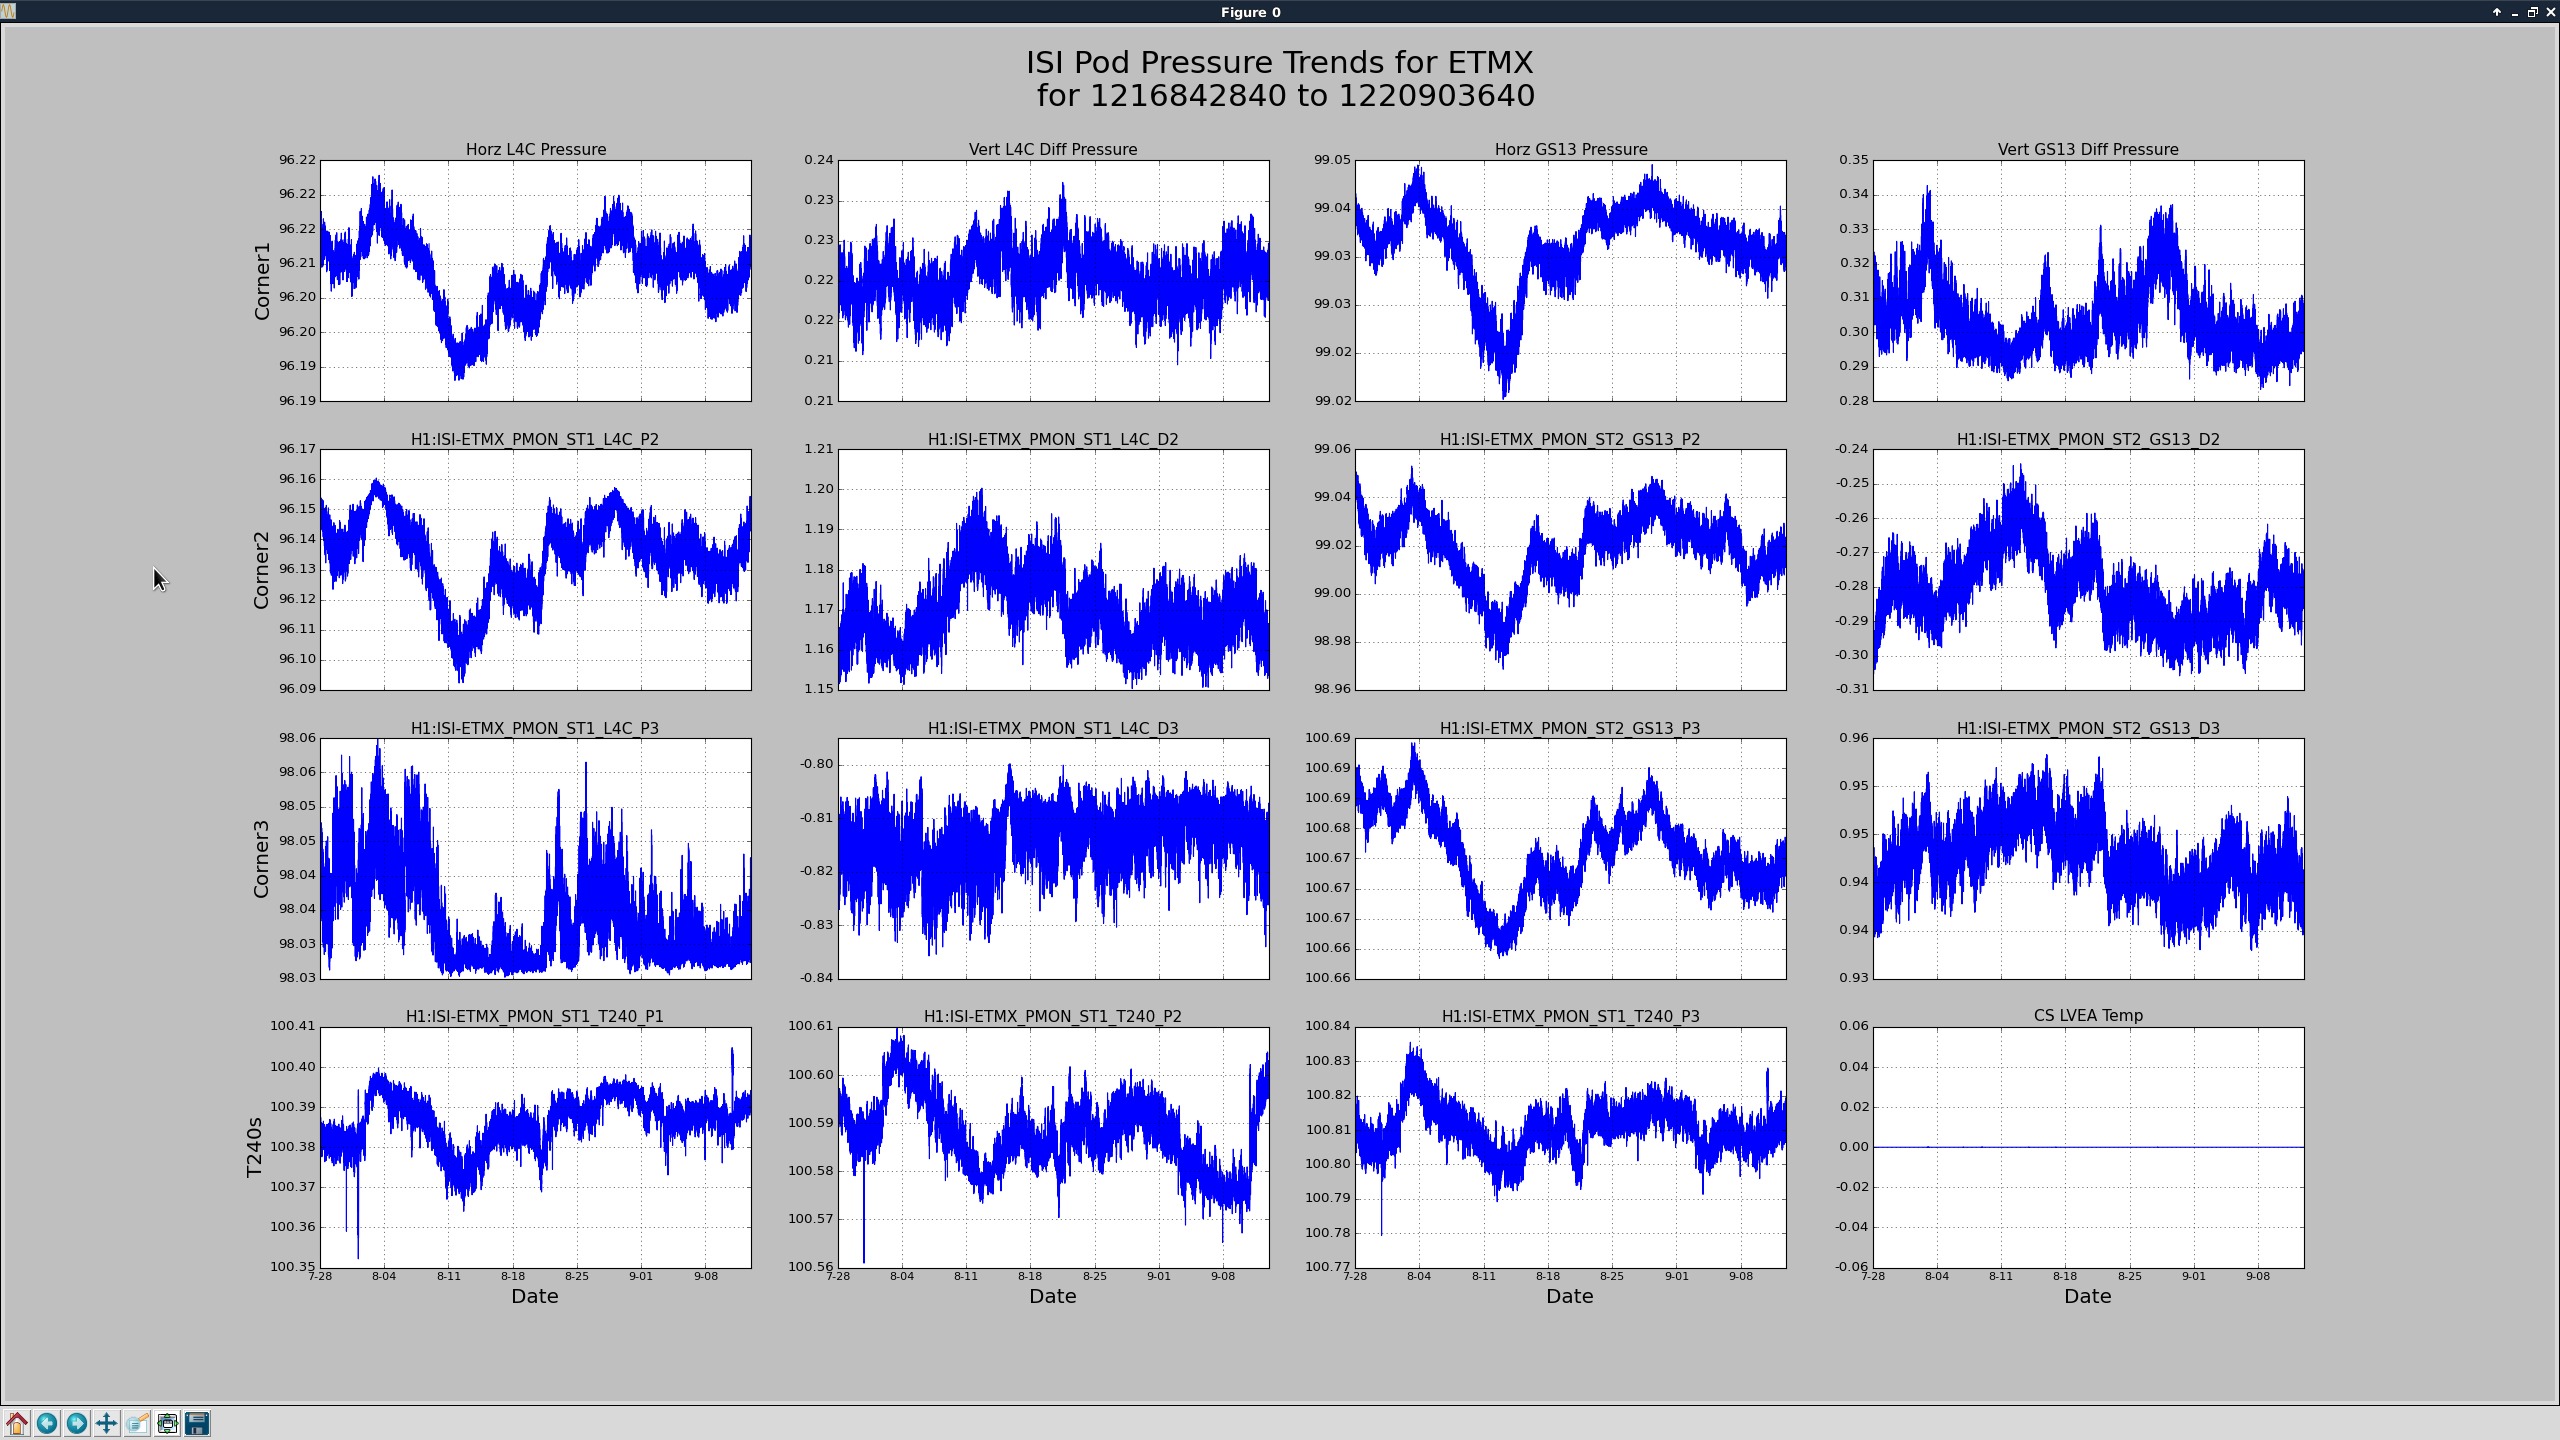
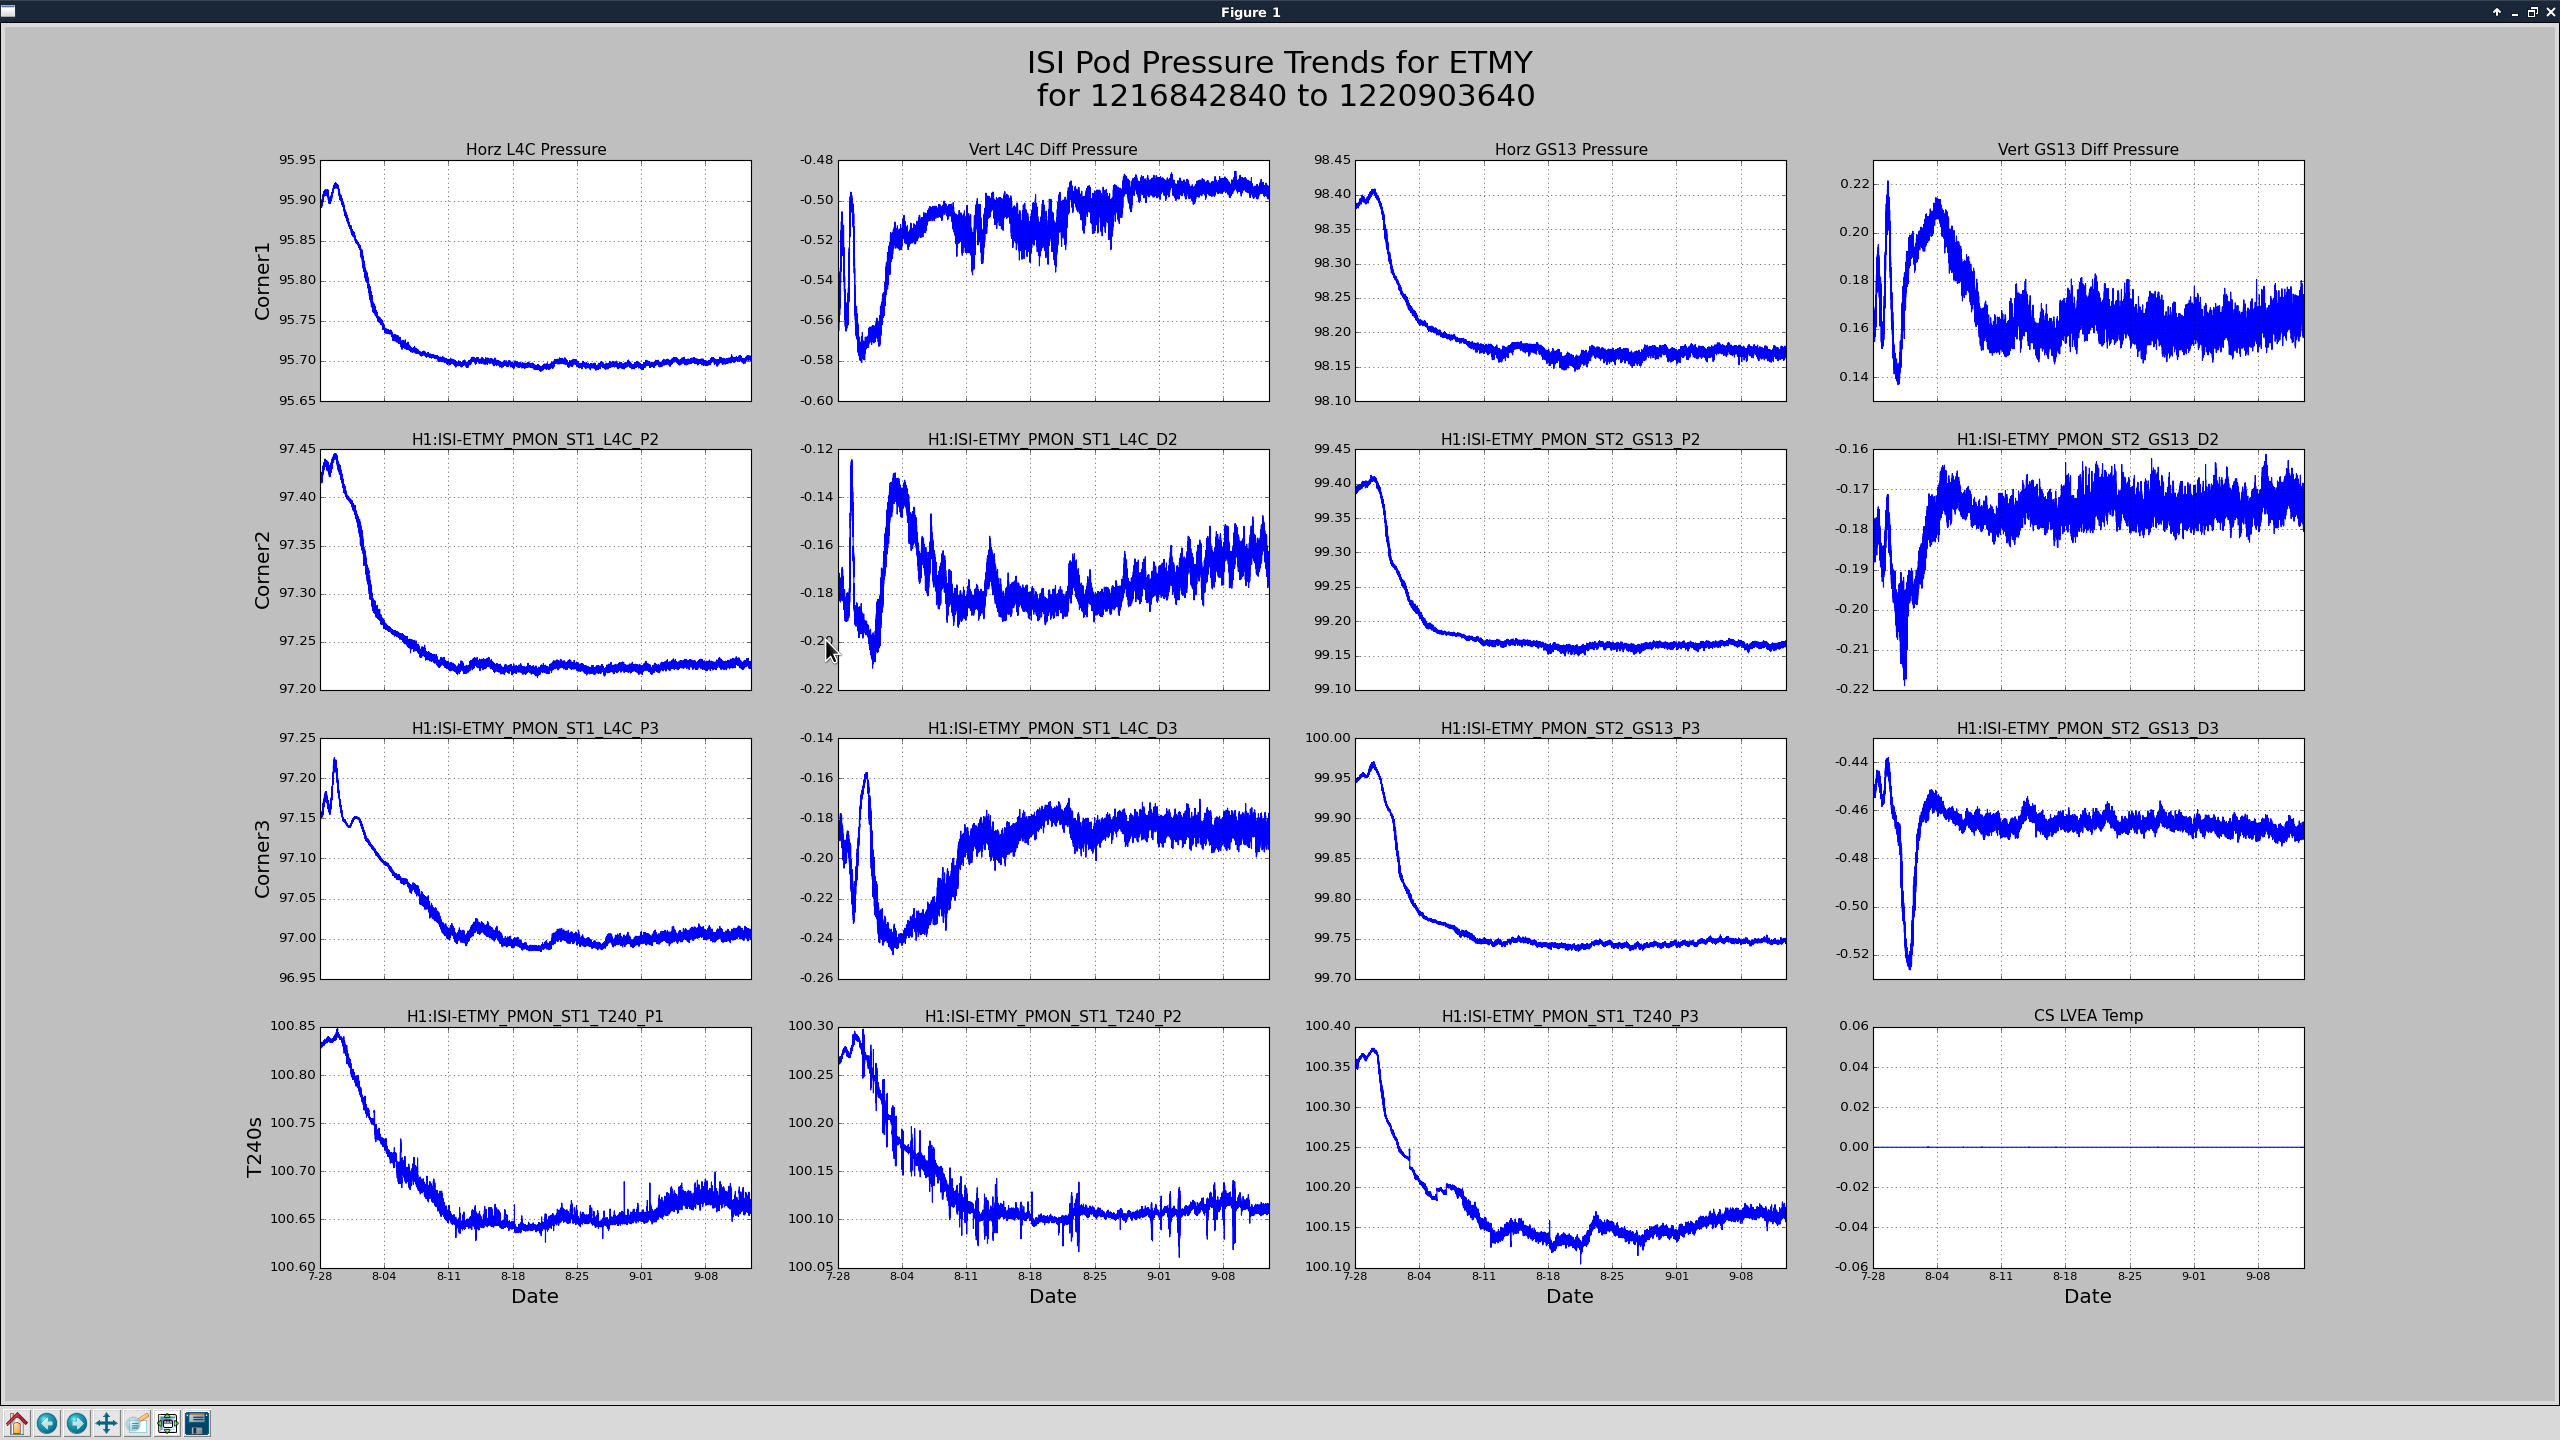
Chandra asked about pod pressures, so here they are. I thought this was a FAMIS task, but I don't remember seeing it in a while. Maybe we put a hold on it during the vent? Searching for "pod pressures" gave me nothing about ISI pods at least as far back as the end of May, too lazy to look harder.
The corner BSCs and ETMY show some trend down at the end of July of about .2 kpa that doesn't seem to show up on the HAMs or ETMX. But otherwise I don't think any of the pods are leaking.
Daniel, Nutsinee
TTFSS
Instead of a phase-frequency discriminator we now have a IQ demod inside the new TTFSS. It's working, but not quite as it should. The input plus/minus switch needs fixing, UFG looks miserable (33kHz zero crossing, used to be 300kHz and can be pushed to 500kHz), need more gain. We are now lock our pump laser to the OPO error signal with this TTFSS (S1812013).
Here's a transfer function taken at the common path.

Pump refl PD saturation
Looking at the RF mon signal (signal before going to demod board), not only we saw 80MHz and 160MHz (2 omega) but also
35.3MHz, 44.4MHz, 70.6MHz, 115.4MHz, and 199.9MHz
35.3 MHz is likely our 35.5MHz modulation frequency for the SHG (I used peak search button on the Agilent not sure how accurate the frequency is). Though we didn't expect it to be as high as the 80MHz. From my note we were driving the EOM with 1.5Vpp, the EOM modulation depth spec is 15mrad/V. So total is 22.5 mrad/2 ~ 0.01 modulation depth. This is Newport 4004. Could it be that our carrier is so large that .01 of that is equal to 80MHz sb magnitude? SHG linewidth for green is 30MHz. 35.5MHz will mostly reflects back and goes to OPO. SHG is locked on transmitted red.
Here attached a photo from Agilent screen, left is when the cavity is unlocked (but hanging on resonance), and right is when it's locked. This was taken with ND1 filter in front of the PD. RF mon has 23 dB attenuation, ND1 counts for 20 dB. So before when we weren't locked at the peak the PD used to have -30+23+20 = 13dBm of 80MHz.
Don't know where the rest of the lines came from. They're not that small either. All of these probably contributed to our refl PD saturation problem.

These RF levels cannot explain the observed "saturation" and the required locking offset at higher intensity. Looking back at the sweeps without the ND filter, the signal actually get squashed at higher power. The next thing to check is the size of the beam on the PD. A beam that is way too small could locally saturate the charge carriers.
The observed modulation strength of the 35.5 MHz sidebands on the green light is about a factor 10 higher than expected. It should be much smaller than the 80 MHz modulation index.
With the ND1 filter in front of the OPO REFL PD, the TTFSS doesn't have enough common gain. This explains some of the funny transfer function. The ugf needs to be well above 100 kHz for the EOM/PZT crossover to work correctly.
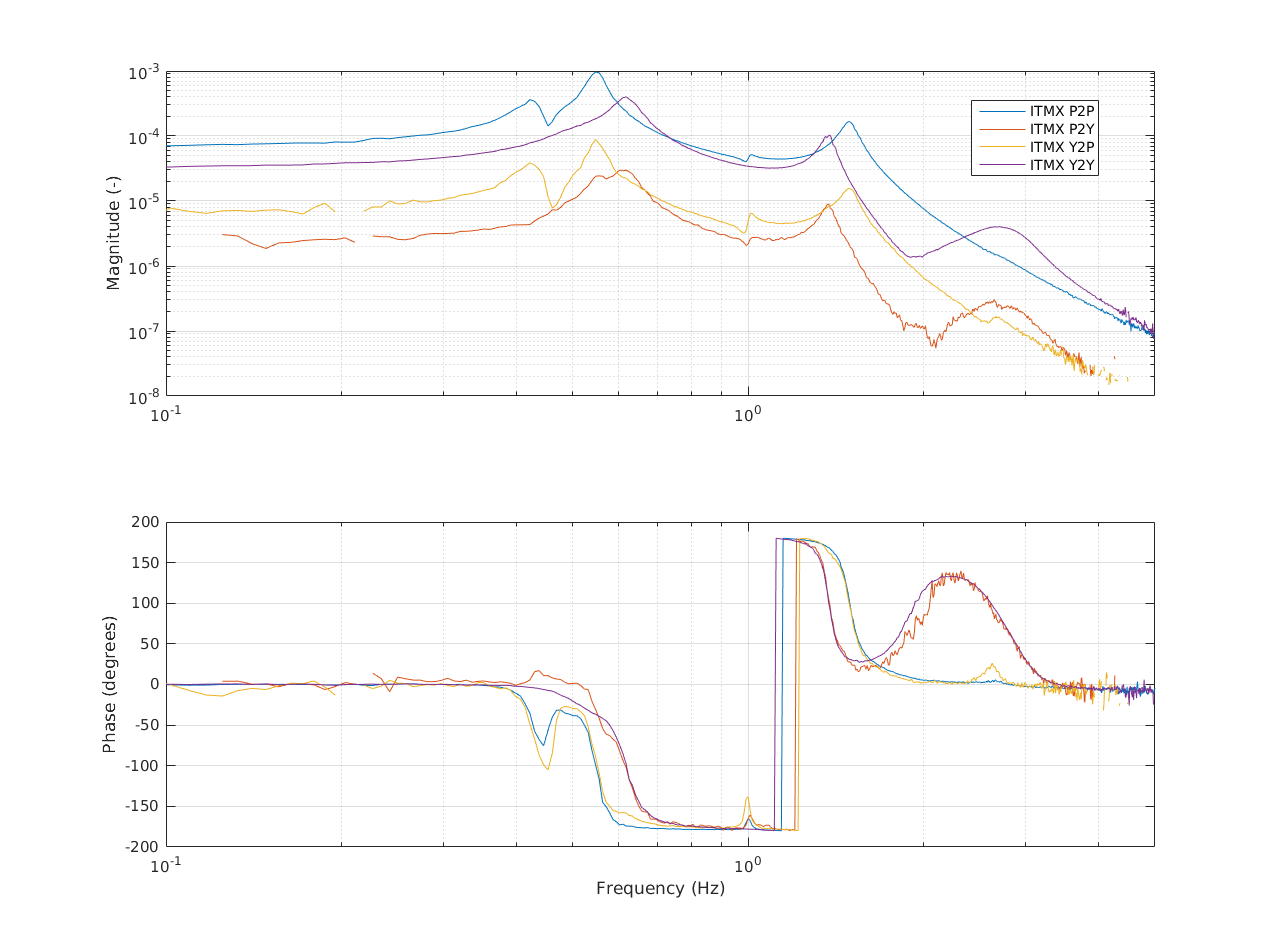
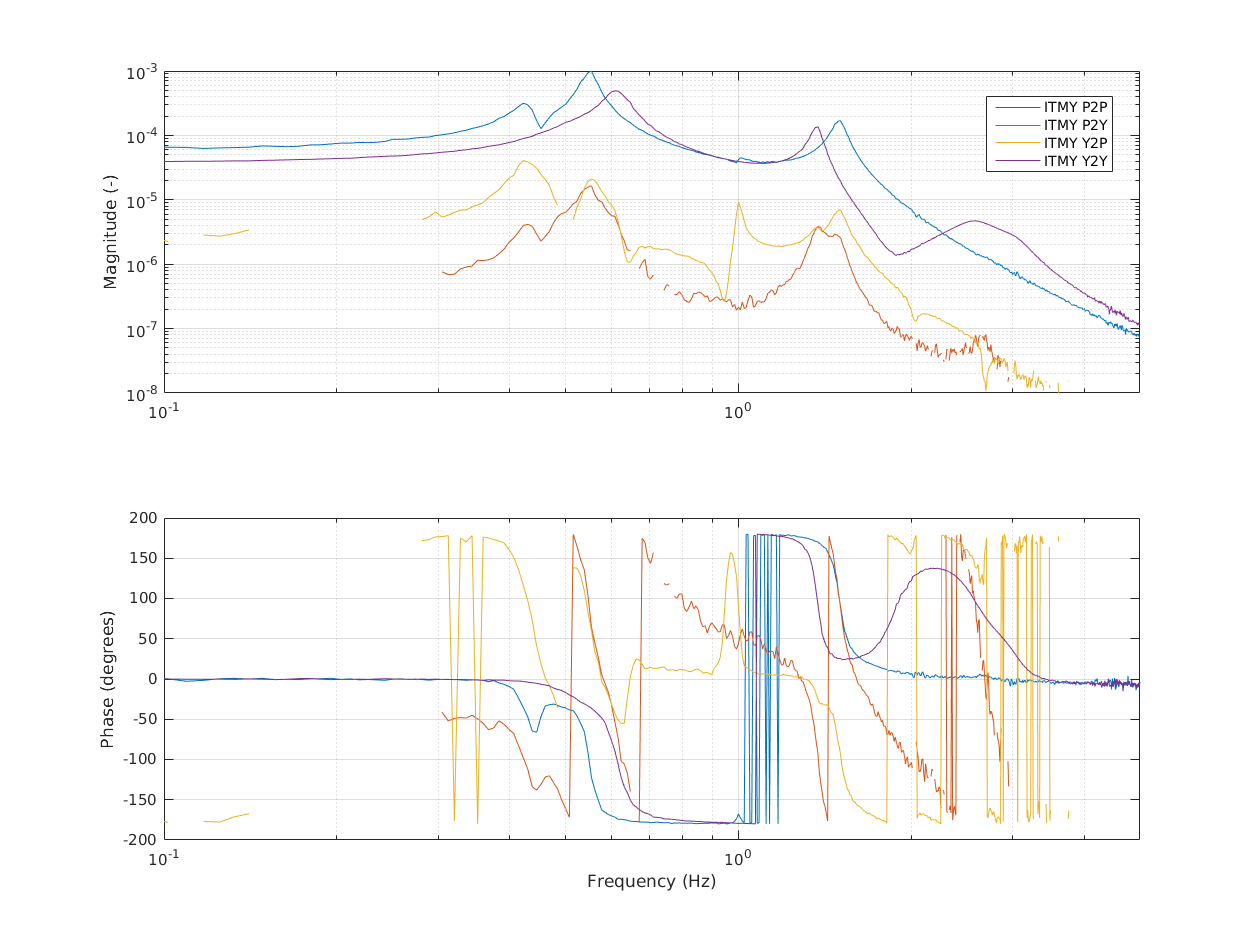
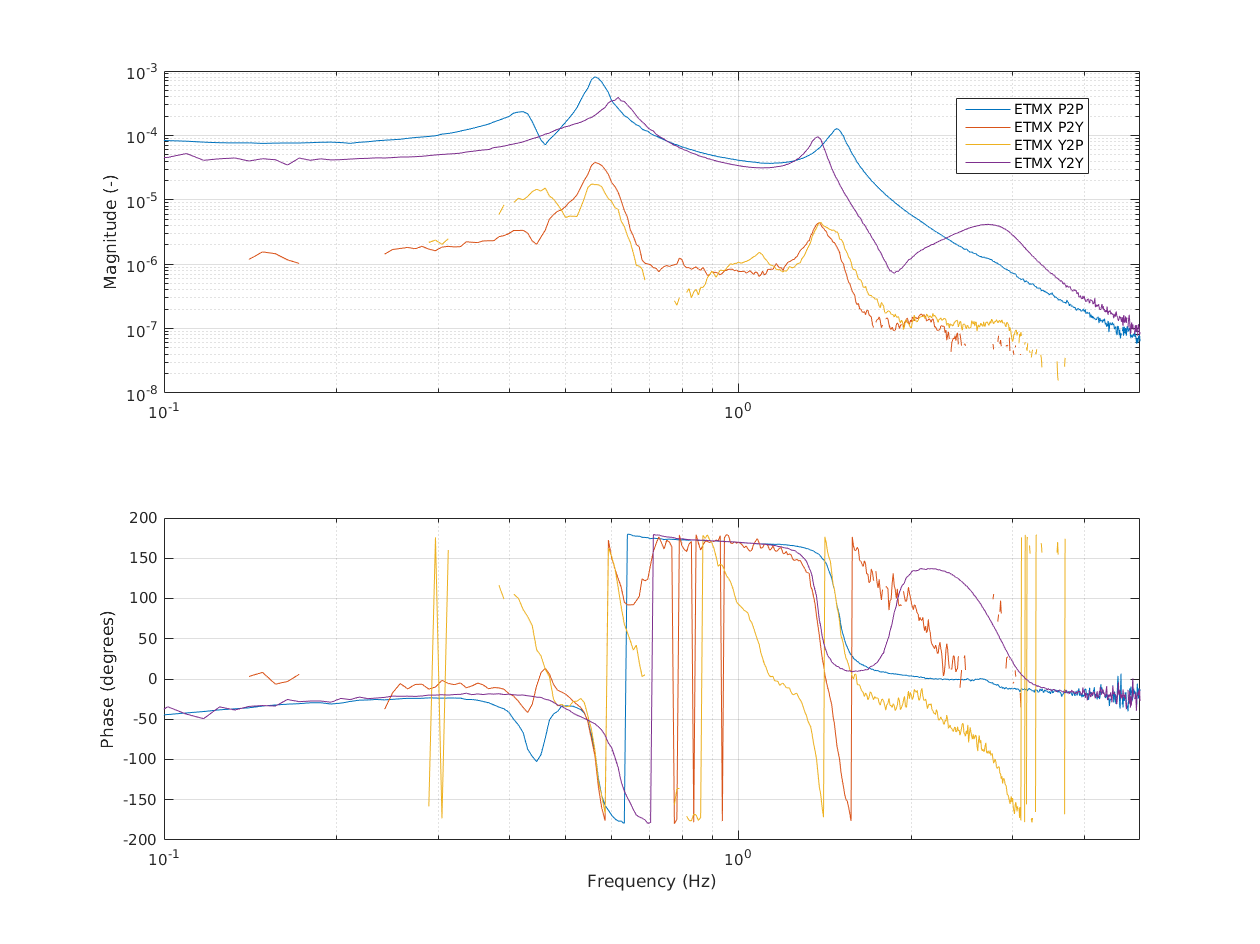
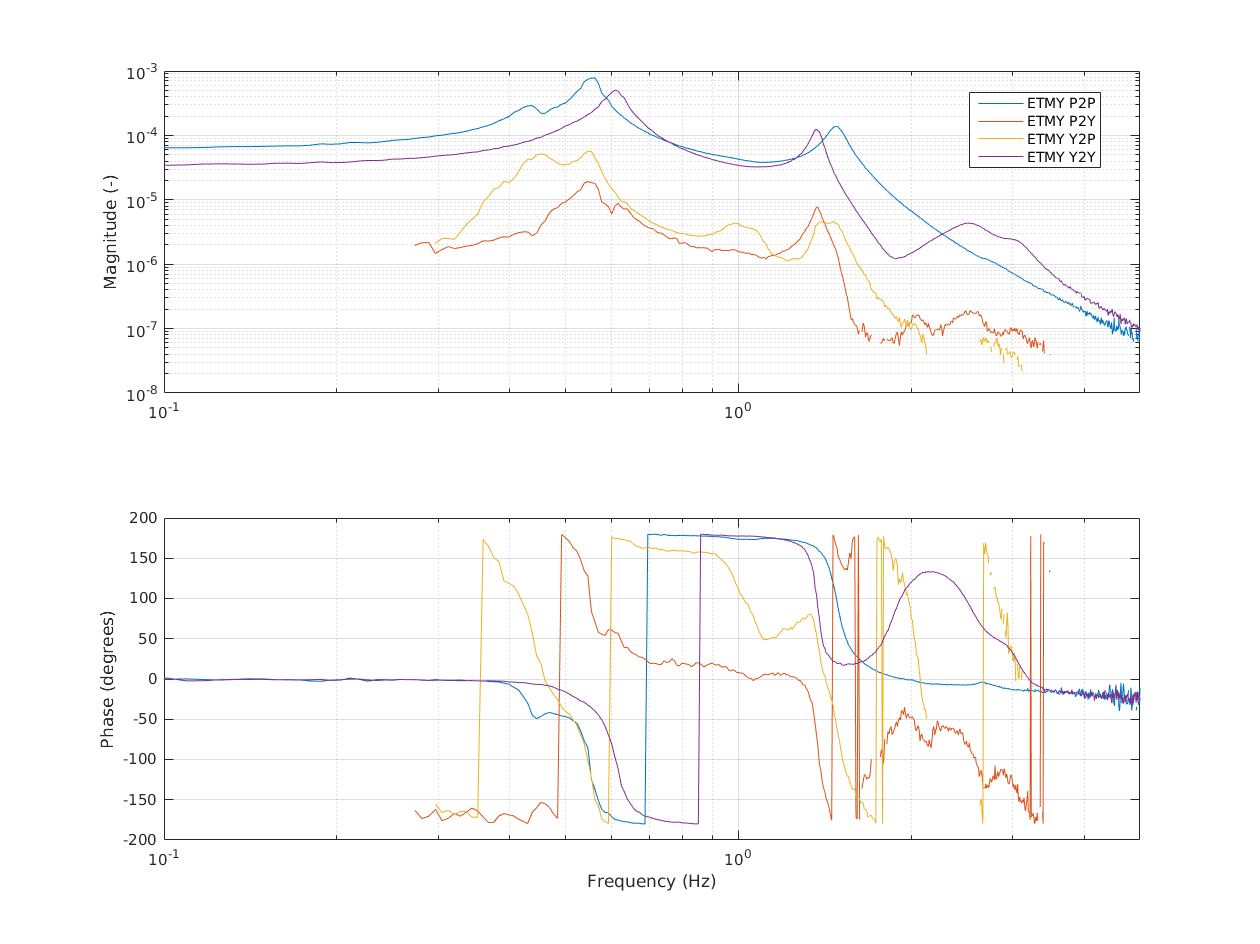
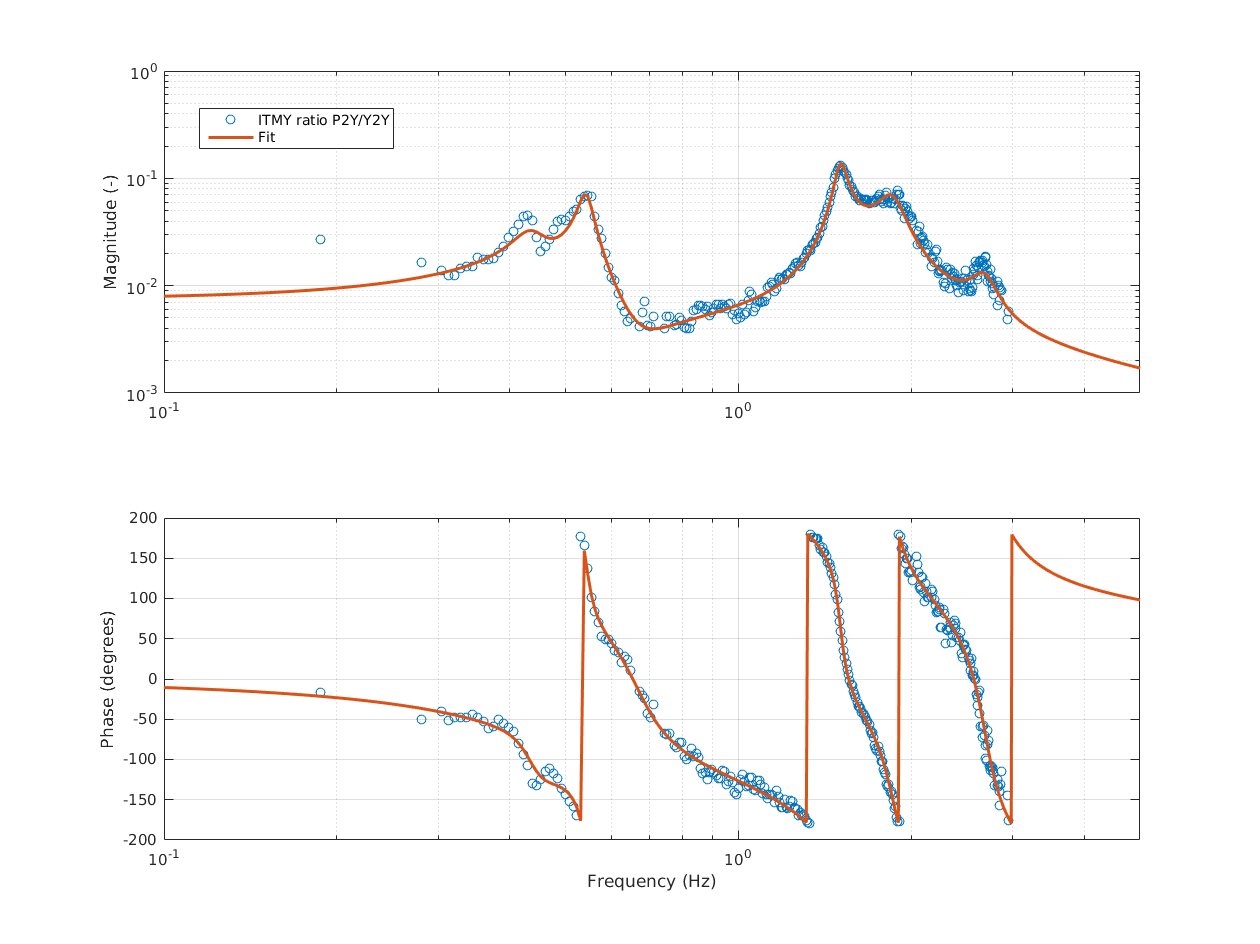
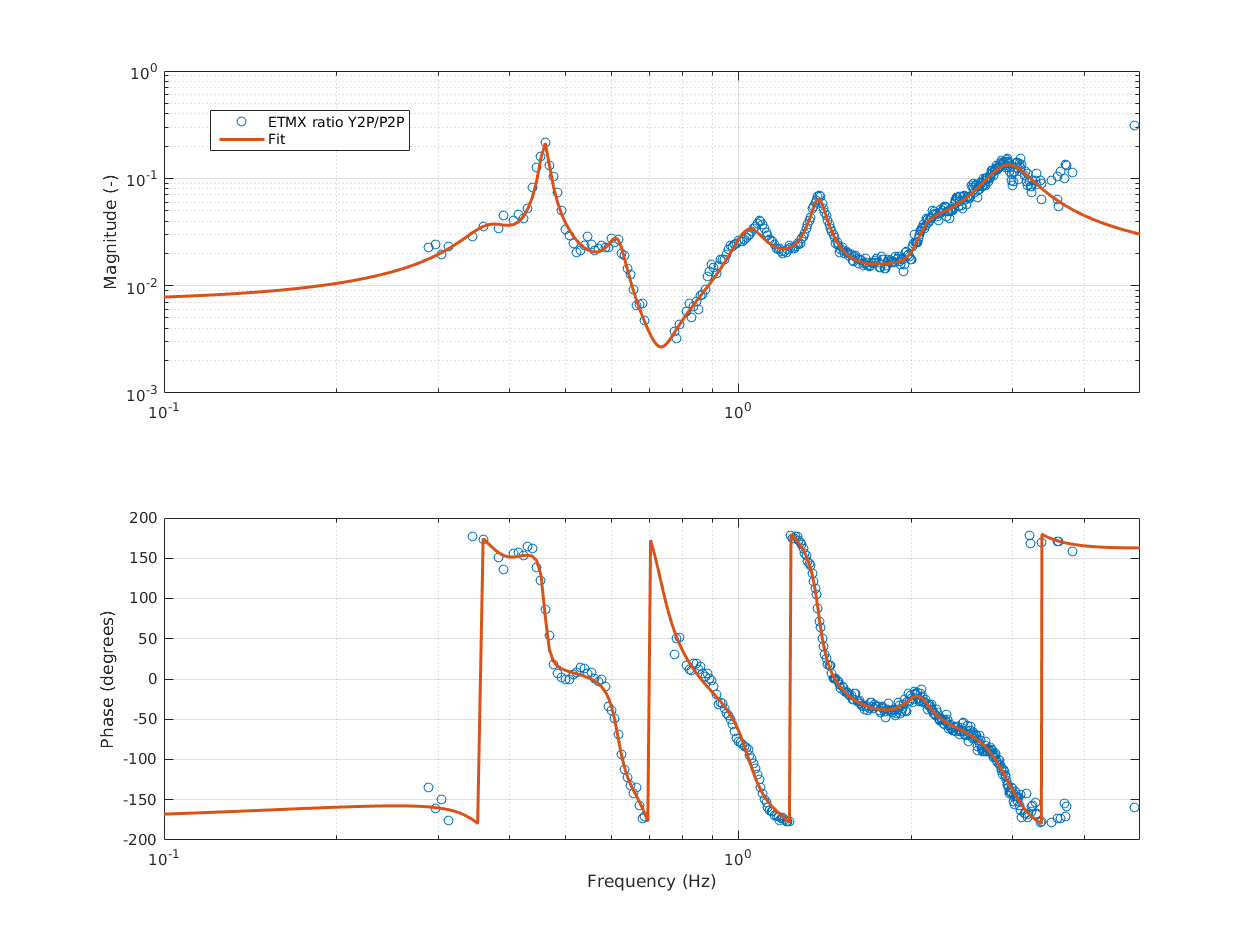
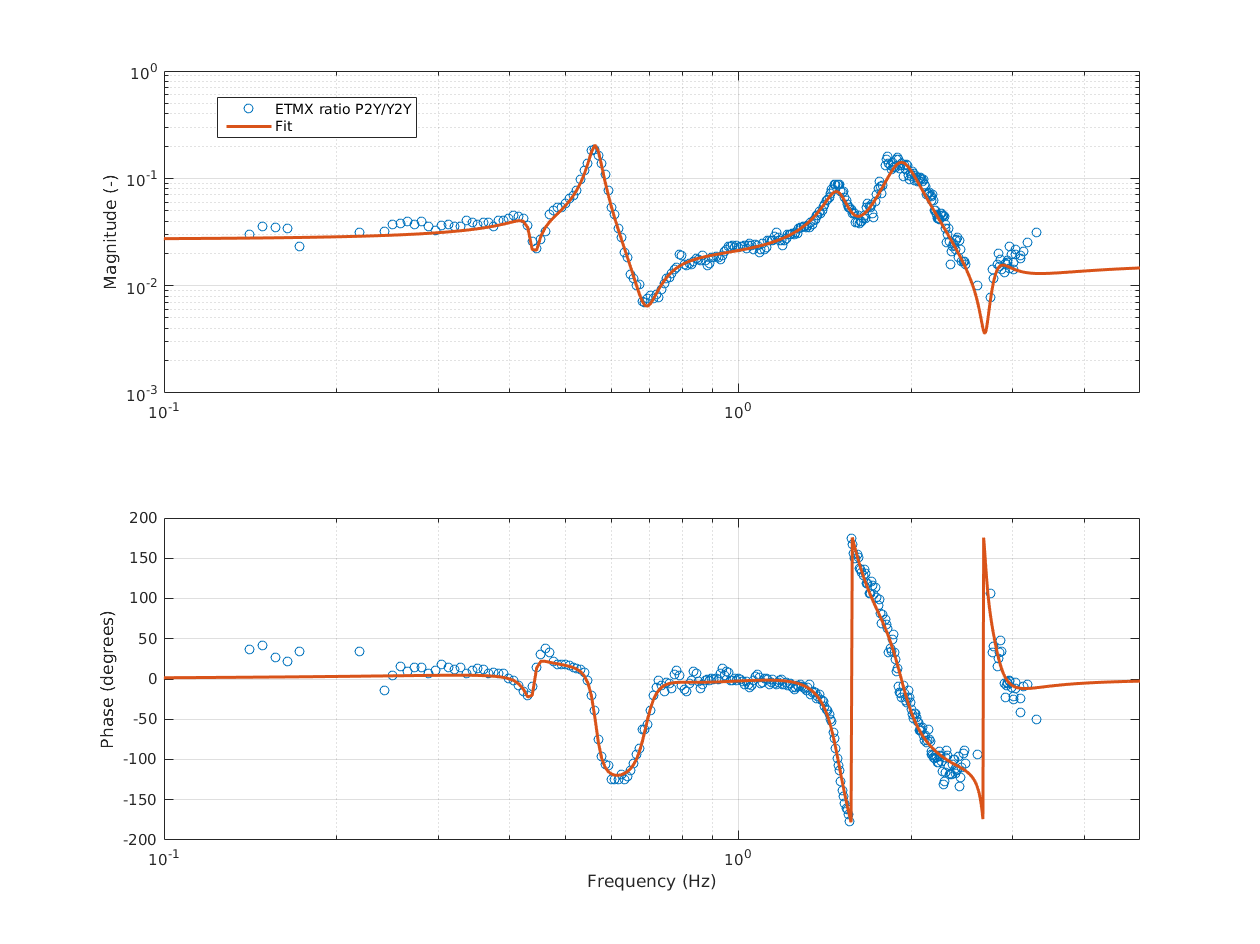
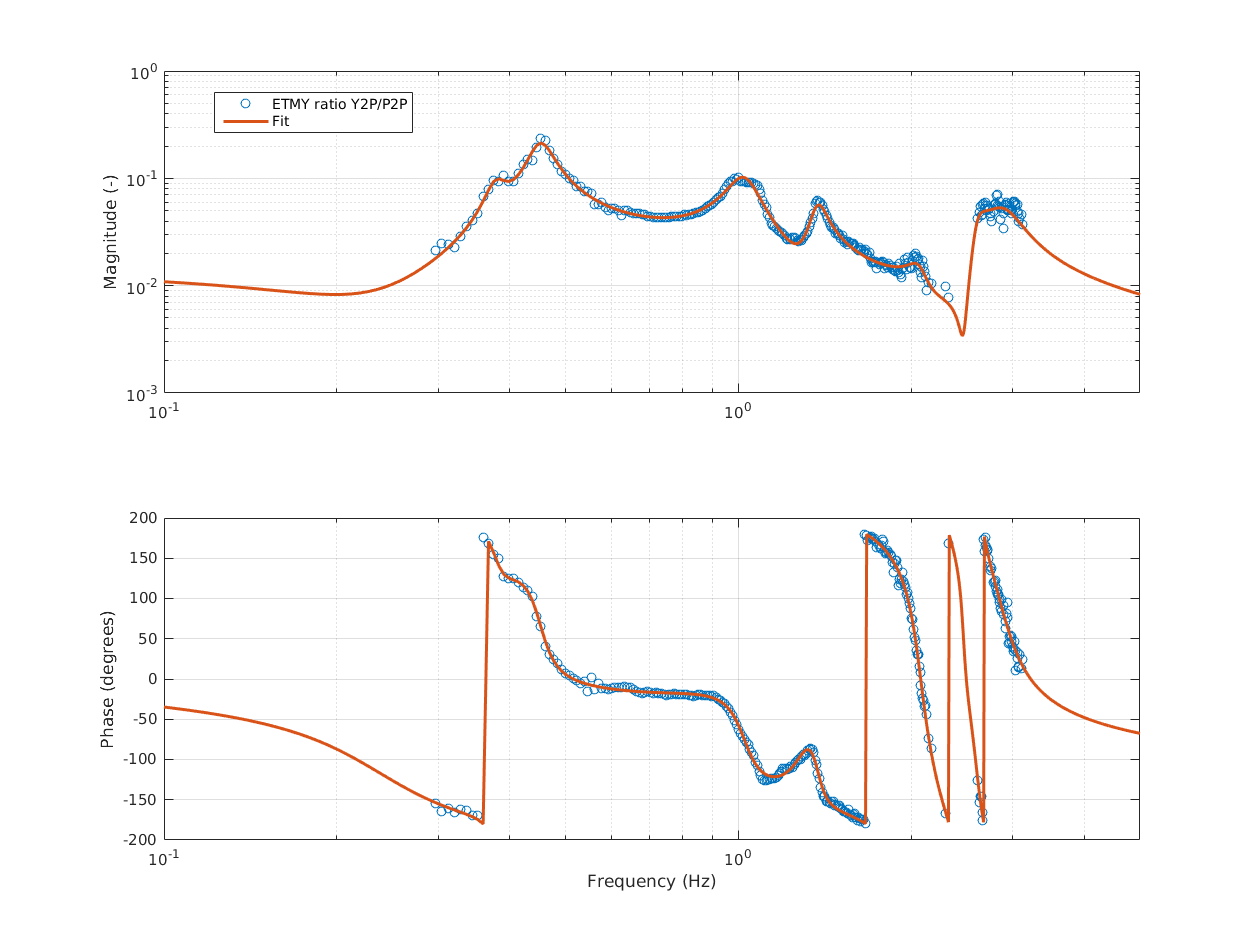
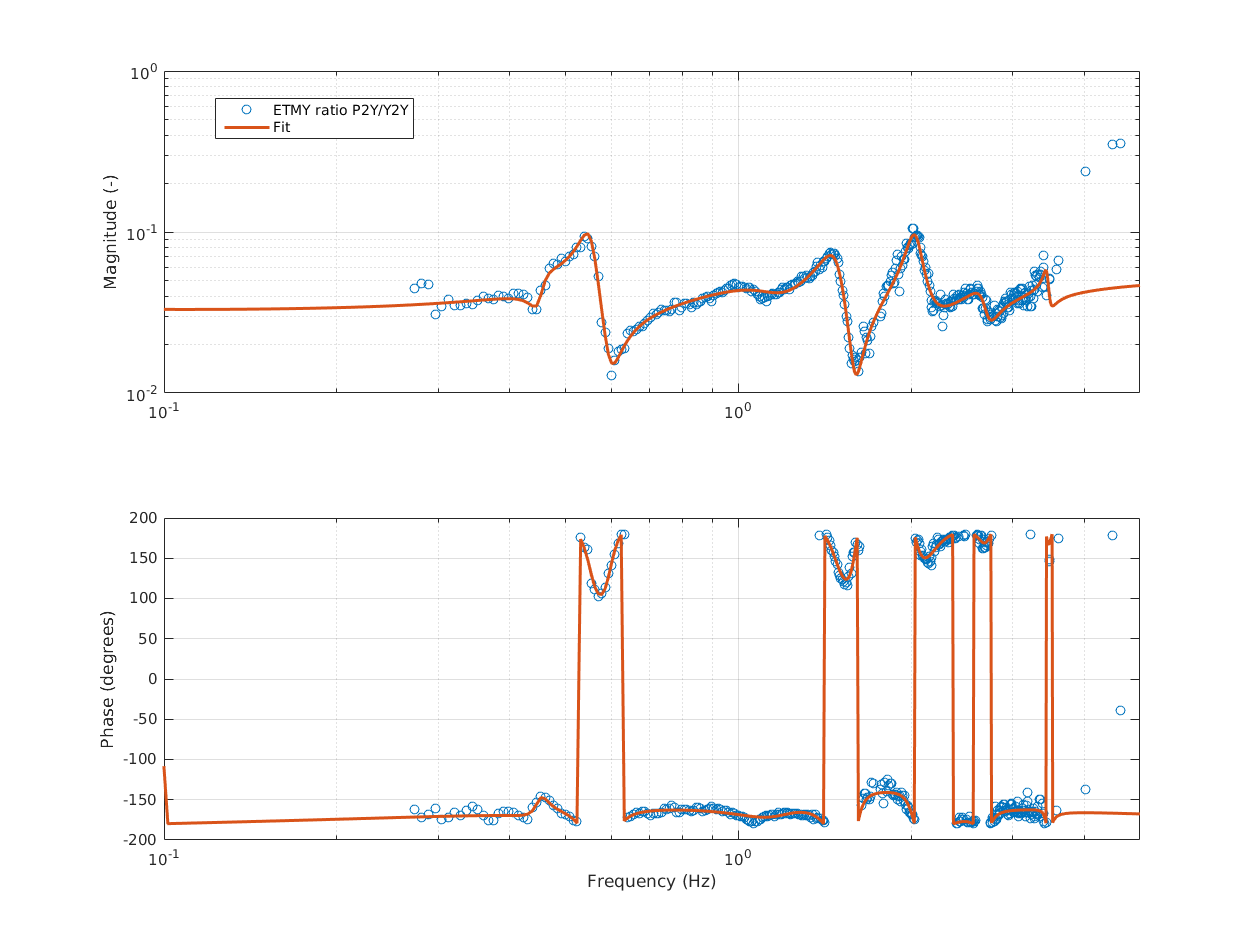
As a by-product of out recent investigations to understand the CHARD angular response, we measured again the angular response of all four test masses, by driving the L2 stage from the ISCINF_P and ISCINF_Y channels and reading out the motion using the optical levers. We also measured the cross coupling, i.e. yaw to pitch (Y2P) and pitch to yaw (P2Y).
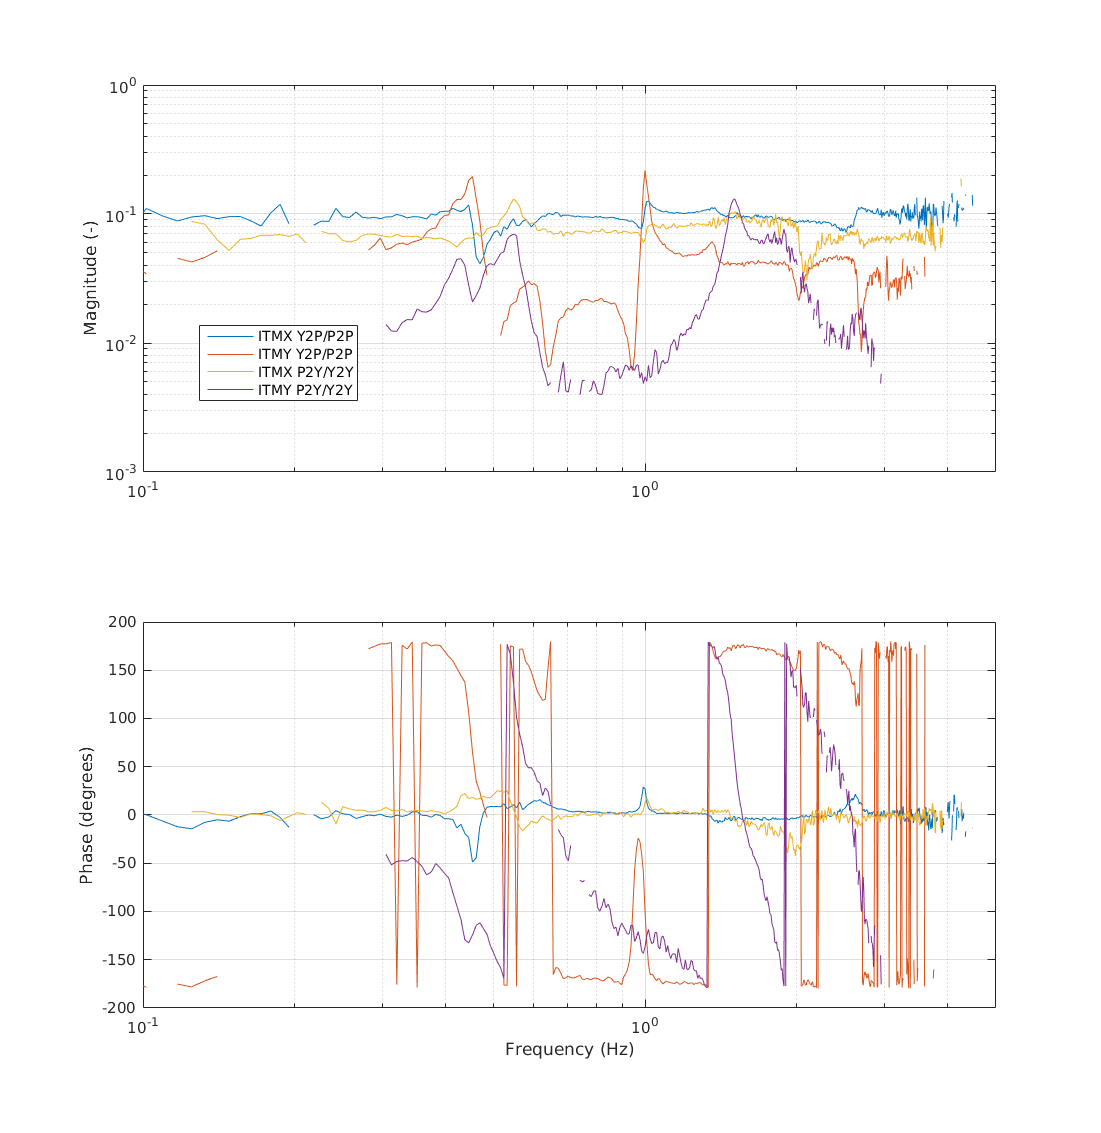
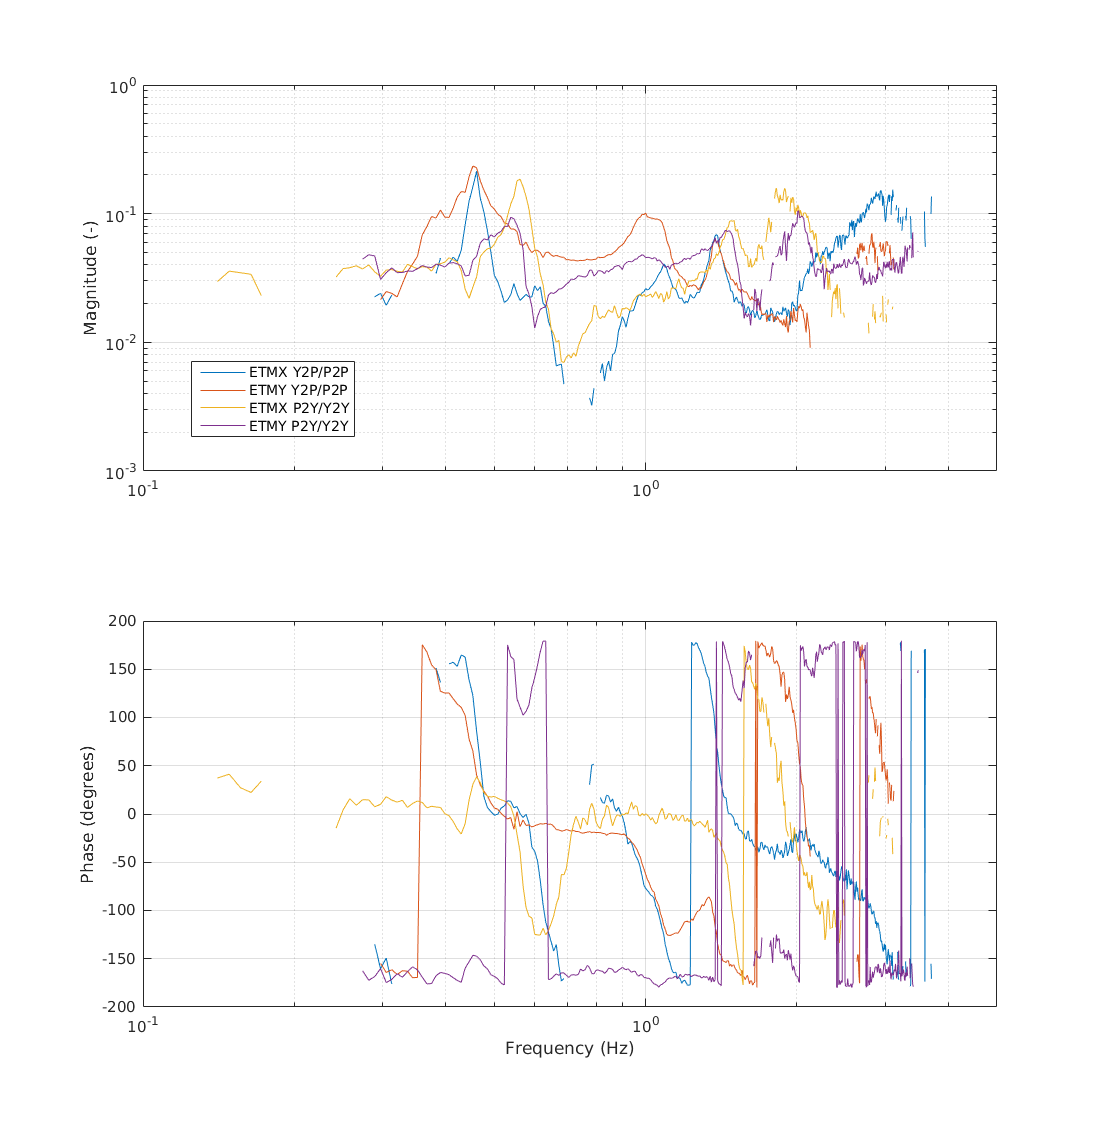
In summary: the ETMs have reasonably low P2Y and Y2P cross-coupling, but the two ITMs show quite high Y2P cross coupling. In particular, ITMX shows a 1:1 coupling of yaw to pitch around 1.5-2.0 Hz.
If we want to compensate for those cross-couplings in the suspension drive, we need to compute ratios like Y2P/P2P and P2Y/Y2Y for each suspension and fit them. The two plots below show all such terms for ITMs and ETMs
As already commented, the ITM yaw to pitch coupling is larger than any other cross coupling.
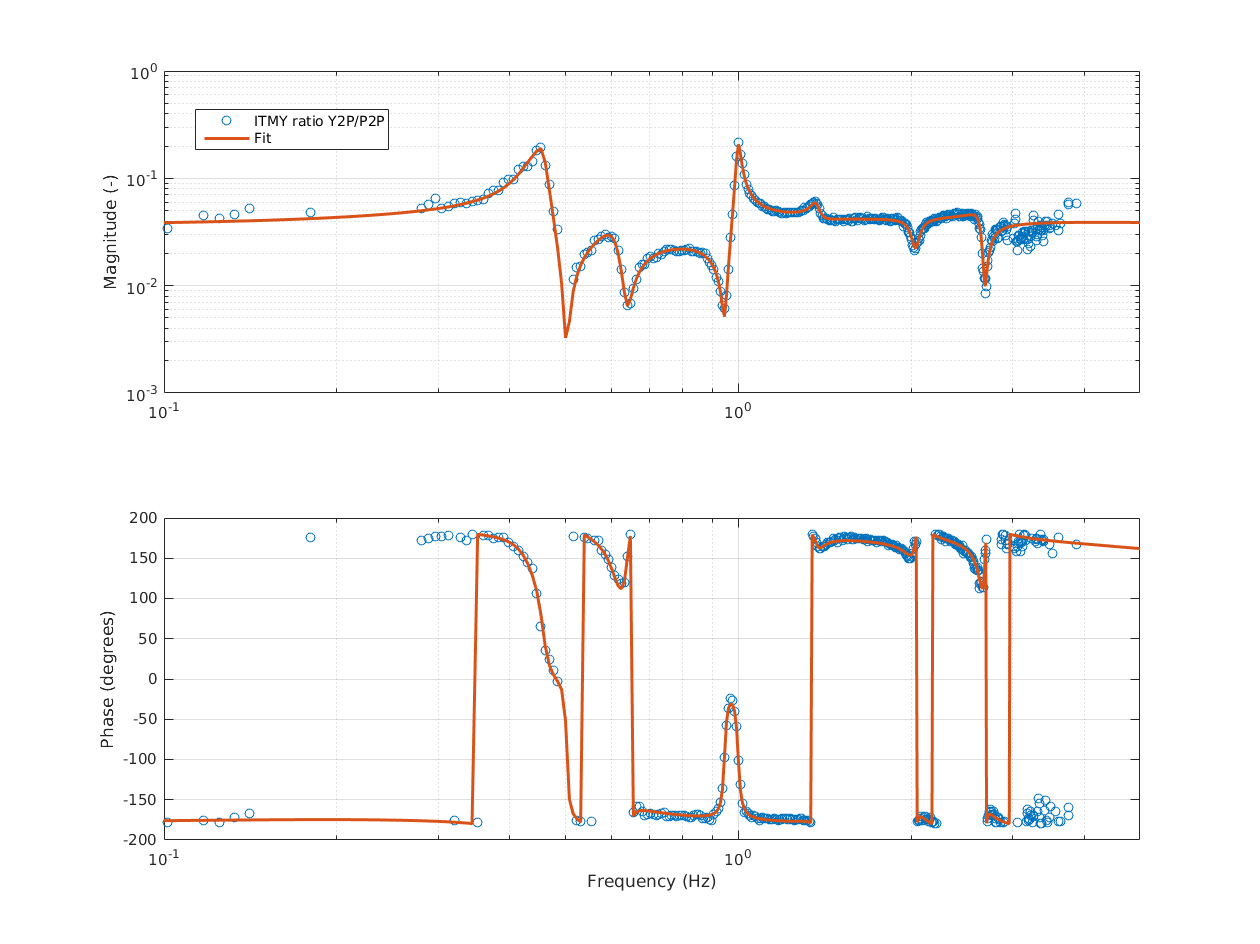
I fitted all the ratios above with MATLAB and vectfit, to obtain the filters listed below, in foton format. The fit plots are also attached to this entry.
Filters have been uploaded to the suspension L2 DRIVEALIGN, but not engaged. The gain in the P2Y and Y2P filter banks should be -1 for all of them.
| Filter | |
| ITMX Y2P |
zpk([-5.3229+i*18.2835;-5.3229-i*18.2835;-0.59707+i*16.3425;-0.59707-i*16.3425;-0.51745+i*8.5794;-0.51745-i*8.5794;-0.078188+i*6.2385;-0.078188-i*6.2385;-0.17768+i*2.5529;-0.17768-i*2.5529;-0.043129+i*2.9229;-0.043129-i*2.9229;-0.26585+i*3.6894;-0.26585-i*3.6894],[-0.1698+i*2.5692;-0.1698-i*2.5692;-0.091751+i*2.8733;-0.091751-i*2.8733;-0.28013+i*3.7396;-0.28013-i*3.7396;-0.075776+i*6.2775;-0.075776-i*6.2775;-0.45674+i*8.5589;-0.45674-i*8.5589;-0.57686+i*16.5756;-0.57686-i*16.5756;-5.9231+i*18.1013;-5.9231-i*18.1013],1) Gain 0.102717 (-18.772328 db) at 1.000000 Hz |
| ITMX P2Y |
zpk([-8.9695+i*10.3701;-8.9695-i*10.3701;-0.63089+i*13.3055;-0.63089-i*13.3055;-0.37947+i*12.8329;-0.37947-i*12.8329;-2.0554+i*10.679;-2.0554-i*10.679;-0.062706+i*6.2917;-0.062706-i*6.2917;-0.077033+i*2.6657;-0.077033-i*2.6657;-0.21137+i*3.4105;-0.21137-i*3.4105],[-0.096751+i*2.6734;-0.096751-i*2.6734;-0.11292+i*3.4272;-0.11292-i*3.4272;-0.071345+i*6.3081;-0.071345-i*6.3081;-1.6284+i*10.2847;-1.6284-i*10.2847;-0.40536+i*12.5843;-0.40536-i*12.5843;-0.71506+i*13.4462;-0.71506-i*13.4462;-8.5593+i*11.2668;-8.5593-i*11.2668],1) Gain 0.060268 (-24.140847 db) at 1.000000 Hz |
| ITMY Y2P |
zpk([388.7201;-0.10941+i*16.8749;-0.10941-i*16.8749;-0.20001+i*12.7684;-0.20001-i*12.7684;-0.22548+i*8.6218;-0.22548-i*8.6218;-0.050536+i*5.9432;-0.050536-i*5.9432;-1.7281;-0.065067+i*4.0201;-0.065067-i*4.0201;0.019856+i*3.156;0.019856-i*3.156;-0.19392+i*2.8299;-0.19392-i*2.8299],[-0.39321+i*16.6698;-0.39321-i*16.6698;-0.15878+i*2.7541;-0.15878-i*2.7541;-0.06782+i*2.8676;-0.06782-i*2.8676;-0.18203+i*3.8527;-0.18203-i*3.8527;-0.058+i*6.2735;-0.058-i*6.2735;-0.17162+i*8.5836;-0.17162-i*8.5836;-0.3794+i*12.7654;-0.3794-i*12.7654;-2.4661;-100.2194],1) Gain -0.045658 (-13.661215 db) at 1.000000 Hz |
| ITMY P2Y |
zpk([86.1116;2.0023+i*16.7497;2.0023-i*16.7497;2.6275+i*9.4817;2.6275-i*9.4817;5.4093;-4.9971+i*1.1709;-4.9971-i*1.1709;0.47217+i*4.1757;0.47217-i*4.1757;-0.32142+i*2.8487;-0.32142-i*2.8487],[-0.19284+i*2.7361;-0.19284-i*2.7361;-1.7198+i*2.7035;-1.7198-i*2.7035;-0.098375+i*3.4118;-0.098375-i*3.4118;-0.22943+i*9.4543;-0.22943-i*9.4543;-0.61662+i*11.6268;-0.61662-i*11.6268;-0.86734+i*16.8508;-0.86734-i*16.8508],1) Gain -0.003954 (-43.581748 db) at 1.000000 Hz |
| ETMX Y2P |
zpk([-18.2675;-0.82779+i*12.6514;-0.82779-i*12.6514;1.5007+i*8.6156;1.5007-i*8.6156;-2.0987+i*7.1924;-2.0987-i*7.1924;-2.1174;1.1736+i*4.216;1.1736-i*4.216;-0.34513+i*2.568;-0.34513-i*2.568;0.26111+i*4.5841;0.26111-i*4.5841;-0.54416+i*3.9492;-0.54416-i*3.9492],[-0.2503+i*2.3263;-0.2503-i*2.3263;-0.04334+i*2.8892;-0.04334-i*2.8892;-0.13102+i*3.8733;-0.13102-i*3.8733;-0.81627+i*4.5349;-0.81627-i*4.5349;-0.42007+i*6.5251;-0.42007-i*6.5251;-0.24996+i*8.6606;-0.24996-i*8.6606;-0.8313+i*13.142;-0.8313-i*13.142;-1.7617+i*18.4144;-1.7617-i*18.4144],1) Gain 0.011744 (-31.428269 db) at 1.000000 Hz |
| ETMX P2Y |
zpk([-2.9959+i*17.4066;-2.9959-i*17.4066;0.24399+i*16.8876;0.24399-i*16.8876;0.74797+i*9.9451;0.74797-i*9.9451;-3.1397+i*8.8362;-3.1397-i*8.8362;-0.039055+i*2.7658;-0.039055-i*2.7658;-0.16956+i*4.3284;-0.16956-i*4.3284;-1.032+i*4.1641;-1.032-i*4.1641],[-0.078526+i*2.737;-0.078526-i*2.737;-0.08389+i*3.5445;-0.08389-i*3.5445;-0.74422+i*4.4789;-0.74422-i*4.4789;-0.44597+i*9.3427;-0.44597-i*9.3427;-0.73729+i*12.0387;-0.73729-i*12.0387;-3.1449+i*12.2137;-3.1449-i*12.2137;-0.73493+i*17.5513;-0.73493-i*17.5513],1) Gain 0.021259 (-33.440821 db) at 1.000000 Hz |
| ETMX Y2P |
zpk([160.5975;3.7643+i*14.634;3.7643-i*14.634;0.21604+i*15.4741;0.21604-i*15.4741;0.82573+i*13.2127;0.82573-i*13.2127;-0.54752+i*8.1177;-0.54752-i*8.1177;-2.682+i*5.9597;-2.682-i*5.9597;-1.4634;0.49594+i*1.4111;0.49594-i*1.4111;-0.20198+i*2.4277;-0.20198-i*2.4277],[-1.449+i*18.1053;-1.449-i*18.1053;-0.106+i*2.3741;-0.106-i*2.3741;-0.14739+i*2.8351;-0.14739-i*2.8351;-0.41064+i*6.4234;-0.41064-i*6.4234;-0.3058+i*8.6157;-0.3058-i*8.6157;-0.54587+i*12.968;-0.54587-i*12.968;-0.48895+i*16.3143;-0.48895-i*16.3143;-1.02;-3.9062],1) Gain 0.053527 (-20.036136 db) at 1.000000 Hz |
| ETMX P2Y |
zpk([-0.30816+i*21.8034;-0.30816-i*21.8034;-0.54171+i*17.0654;-0.54171-i*17.0654;-1.0045+i*13.3852;-1.0045-i*13.3852;-0.24706+i*10.0314;-0.24706-i*10.0314;-1.0325+i*7.4193;-1.0325-i*7.4193;-4.5852;-0.19665;-0.12813+i*3.7513;-0.12813-i*3.7513;-0.080833+i*2.8183;-0.080833-i*2.8183],[-0.25429+i*21.6639;-0.25429-i*21.6639;-0.1032+i*2.849;-0.1032-i*2.849;-0.12771+i*3.4715;-0.12771-i*3.4715;-1.2787+i*7.1274;-1.2787-i*7.1274;-0.48506+i*9.3168;-0.48506-i*9.3168;-0.42904+i*12.7624;-0.42904-i*12.7624;-0.62721+i*16.809;-0.62721-i*16.809;-0.1506;-12.3275],1) Gain -0.042433 (-27.268564 db) at 1.000000 Hz |
TITLE: 09/13 Day Shift: 15:00-23:00 UTC (08:00-16:00 PST), all times posted in UTC
STATE of H1: Commissioning
OUTGOING OPERATOR: None
CURRENT ENVIRONMENT:
Wind: 6mph Gusts, 4mph 5min avg
Primary useism: 0.02 μm/s
Secondary useism: 0.14 μm/s
QUICK SUMMARY:
For the TCS+ISC team
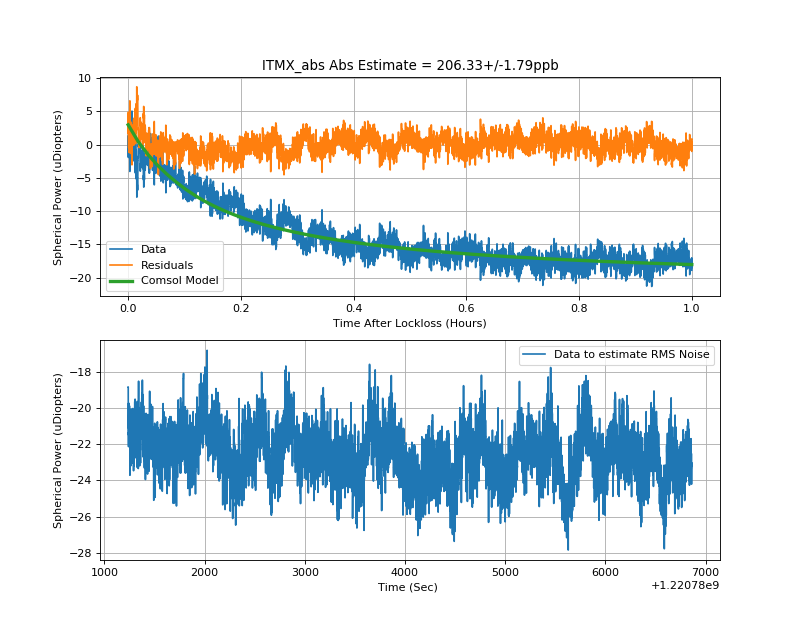
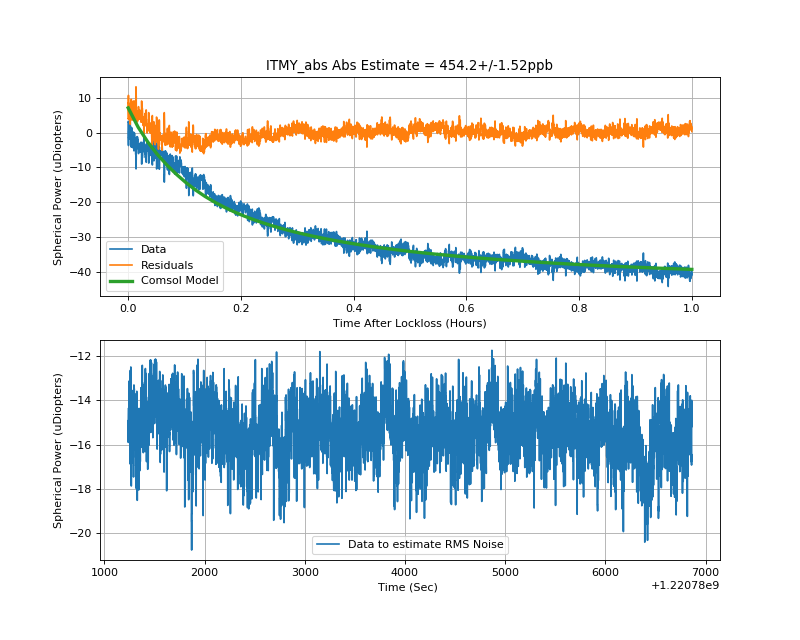
With the success of increasing the power last night to about 17 Watts input, the chance to make an absorption measurement for the ITMs became a reality and we were able to use both Hartmann sensors to extract a spherical power which we fit to a Comsol model, this technique is the same as Aidan's and Georgia's method.
ITMX absoprtion: 206 +/- 1.8 ppb
ITMX_RH tuning for 50 Watts: 0.44 Watts Total
ITMX_CO2 pre-loading: 1.03 Watts Central
ITMY absoption: 454 +/- 1.5 ppb
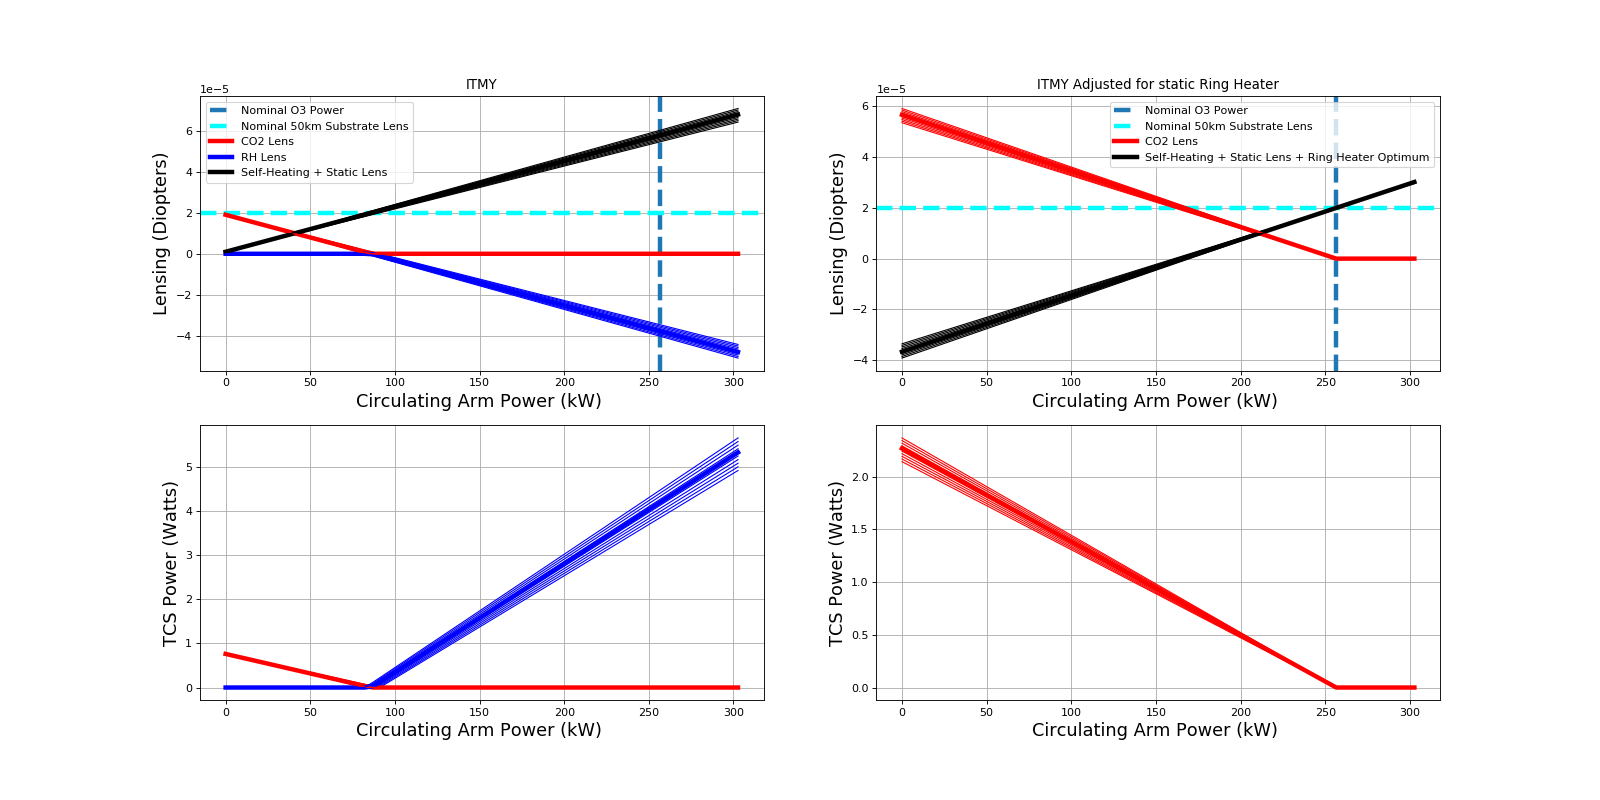
ITMY_RH tuning for 50 Watts: 4.19 Watts Total
ITMY_CO2 pre-loading: 2.27 Watts Central
Plan for tomorrow:
- We'll plug in these values for the ring heater tonight, by the morning they should be relatively close to thermal equillibrium.
- Turn up the power of the CO2 lasers, and measure the simple michelson contrast defect. If it works, we should be able to lock at 2 Watts.
Details
I was hoping to figure out a way to estimate the uncertainty in this measurement but it's a little bit more involved than I thought, the method is essentially using a least squares fit to get the coefficients for the exponential decay of the thermal lens after losing lock, but the residuals seem to be pretty good which leads to about a 1% accuracy which should be taken with a large grain of salt because the absorption estimate is made by interpolating the scale of the thermal lens' exponential decay and then dividing the coefficient by the arm power in Watts. However, the arm power is an estimate as well with its own error bars which I'm still trying to figure out.
P_arm = 17 Watts * 45(PRC_Gain) * 0.5(BS) * 282(Arm_gain)
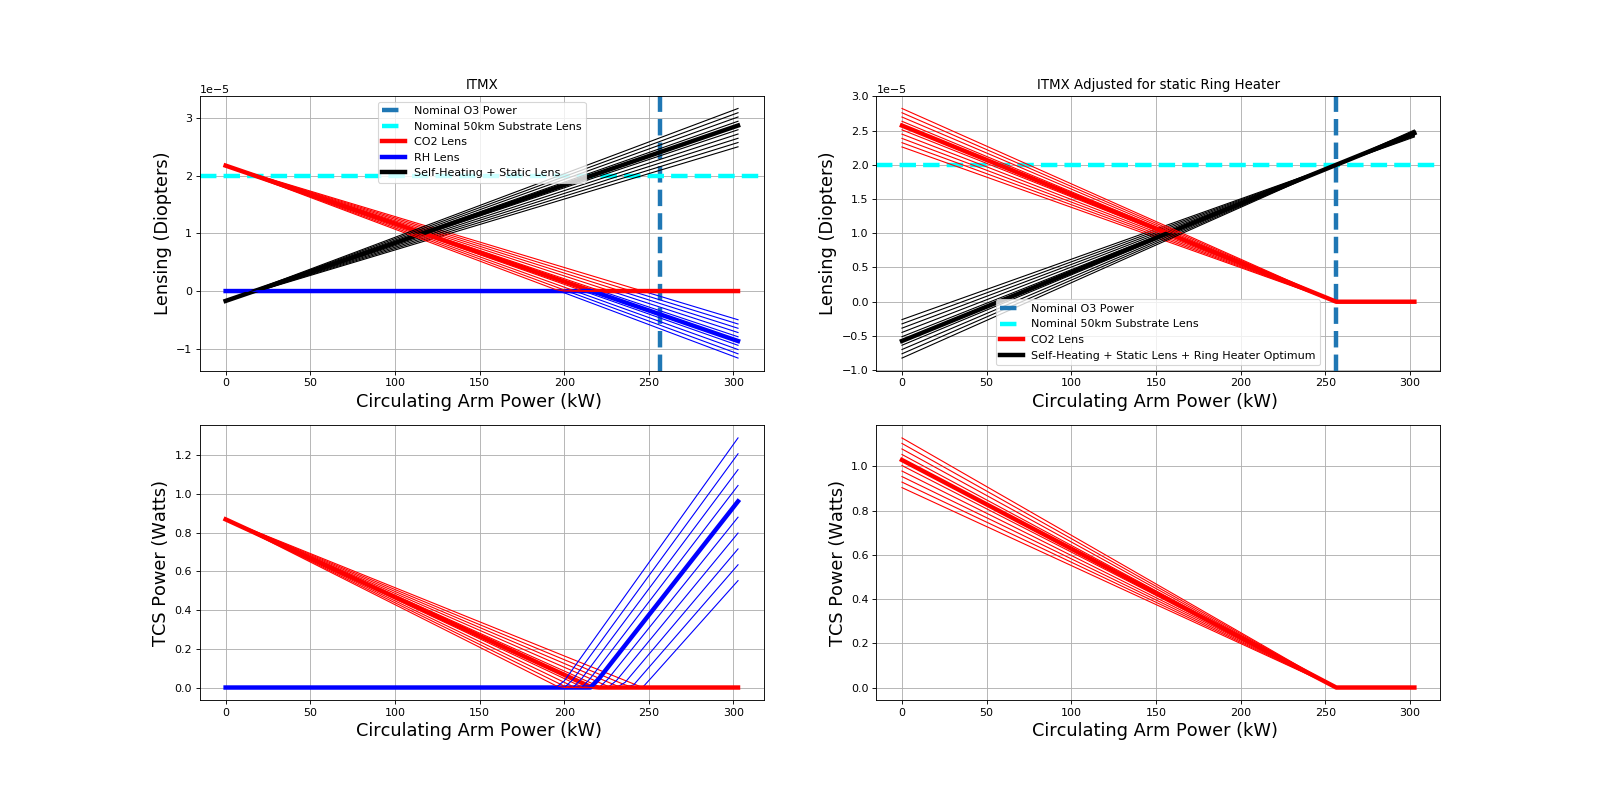
Once we got estimates for the absorption (1st and 2nd attachment), we re-ran the calculations which gave ring heater settings to compensate for the 50 Watt nominal power based off the absorption. ITMY ring heater requirement is particularly high because of excess absorption. Also to pre-load the system, the CO2 laser settings are also calculated (3rd and 4th attachment).
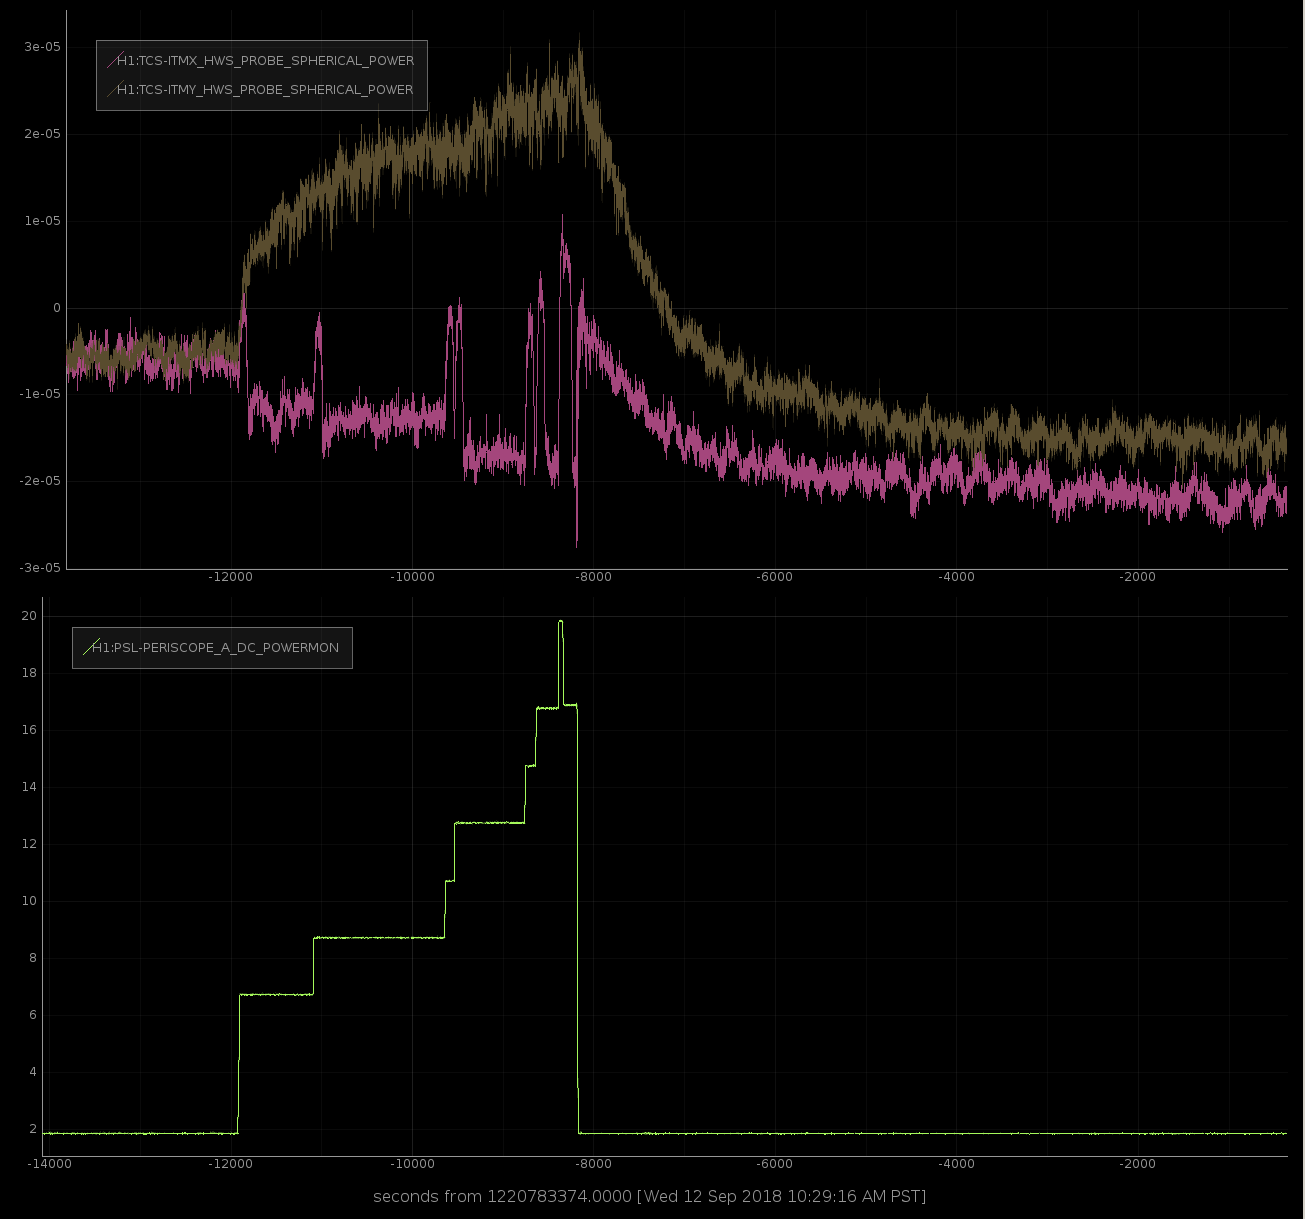
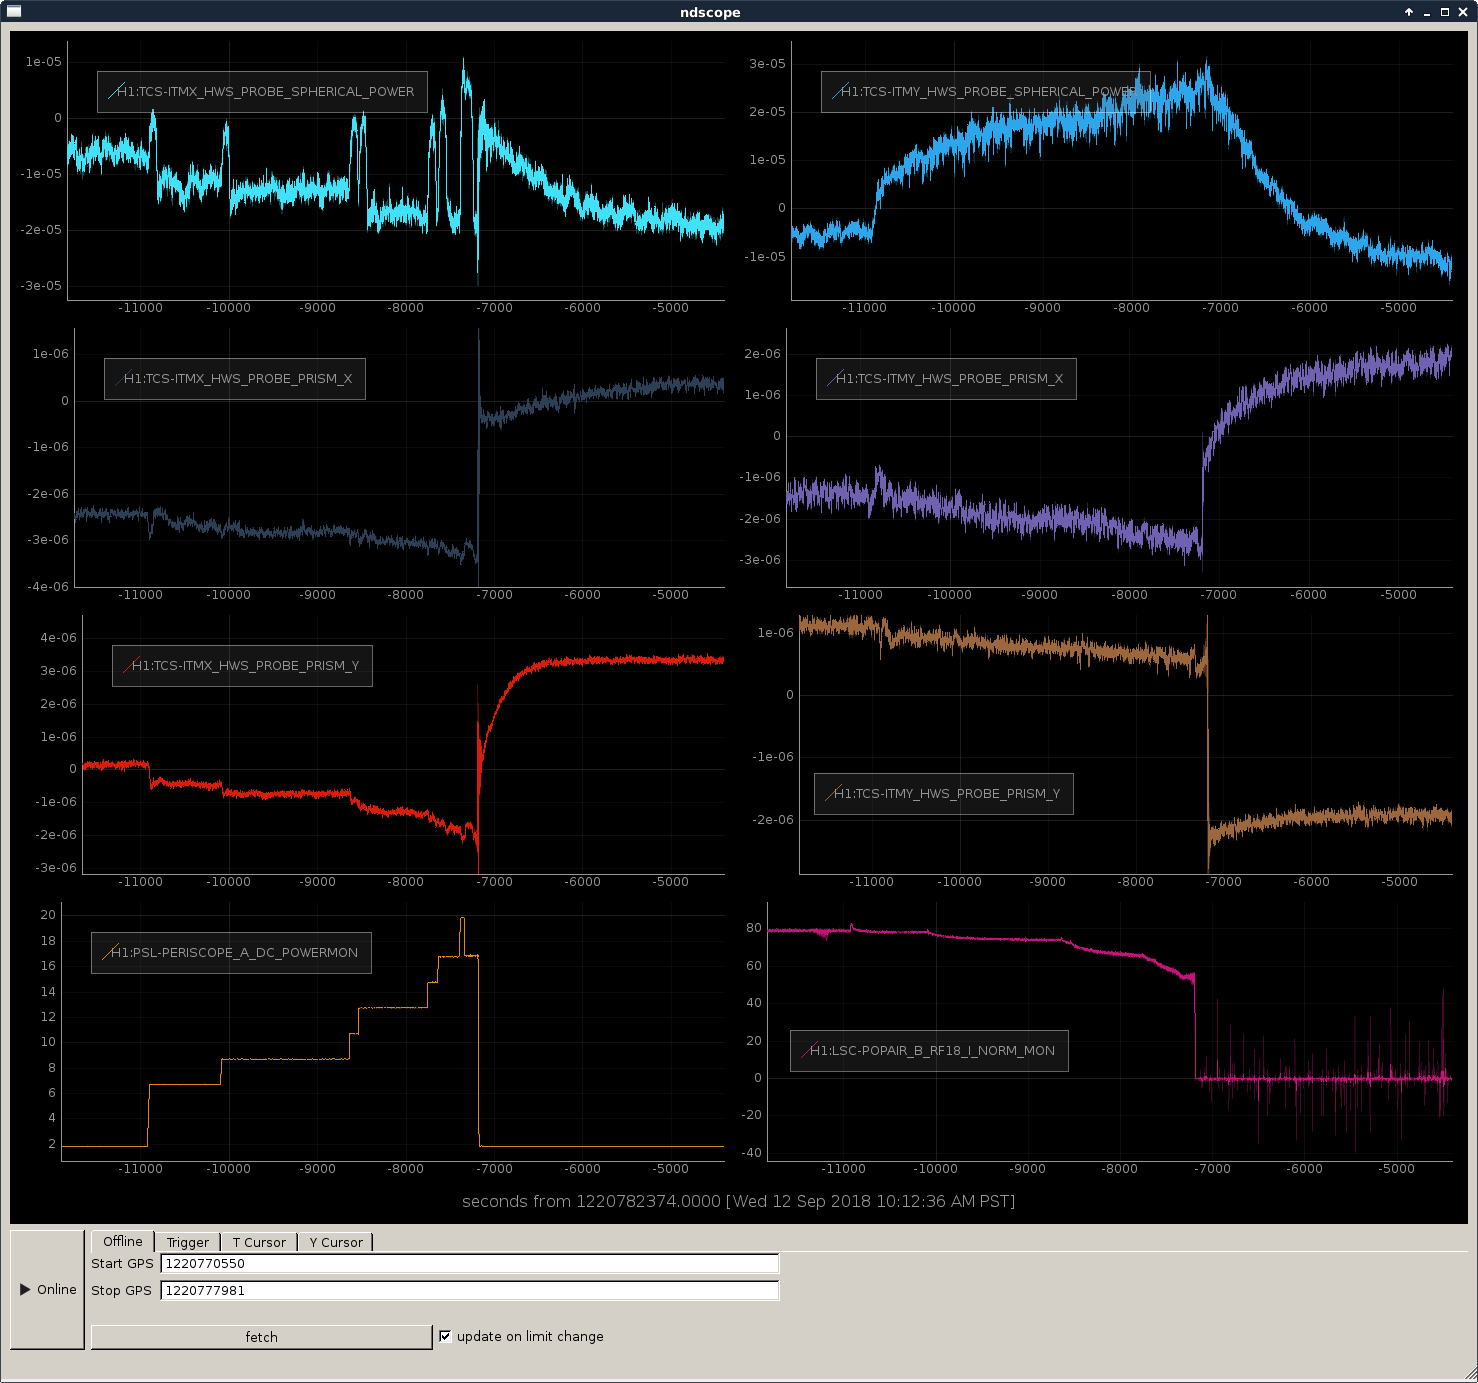
Some extra Hartmann plots from last night's power up:
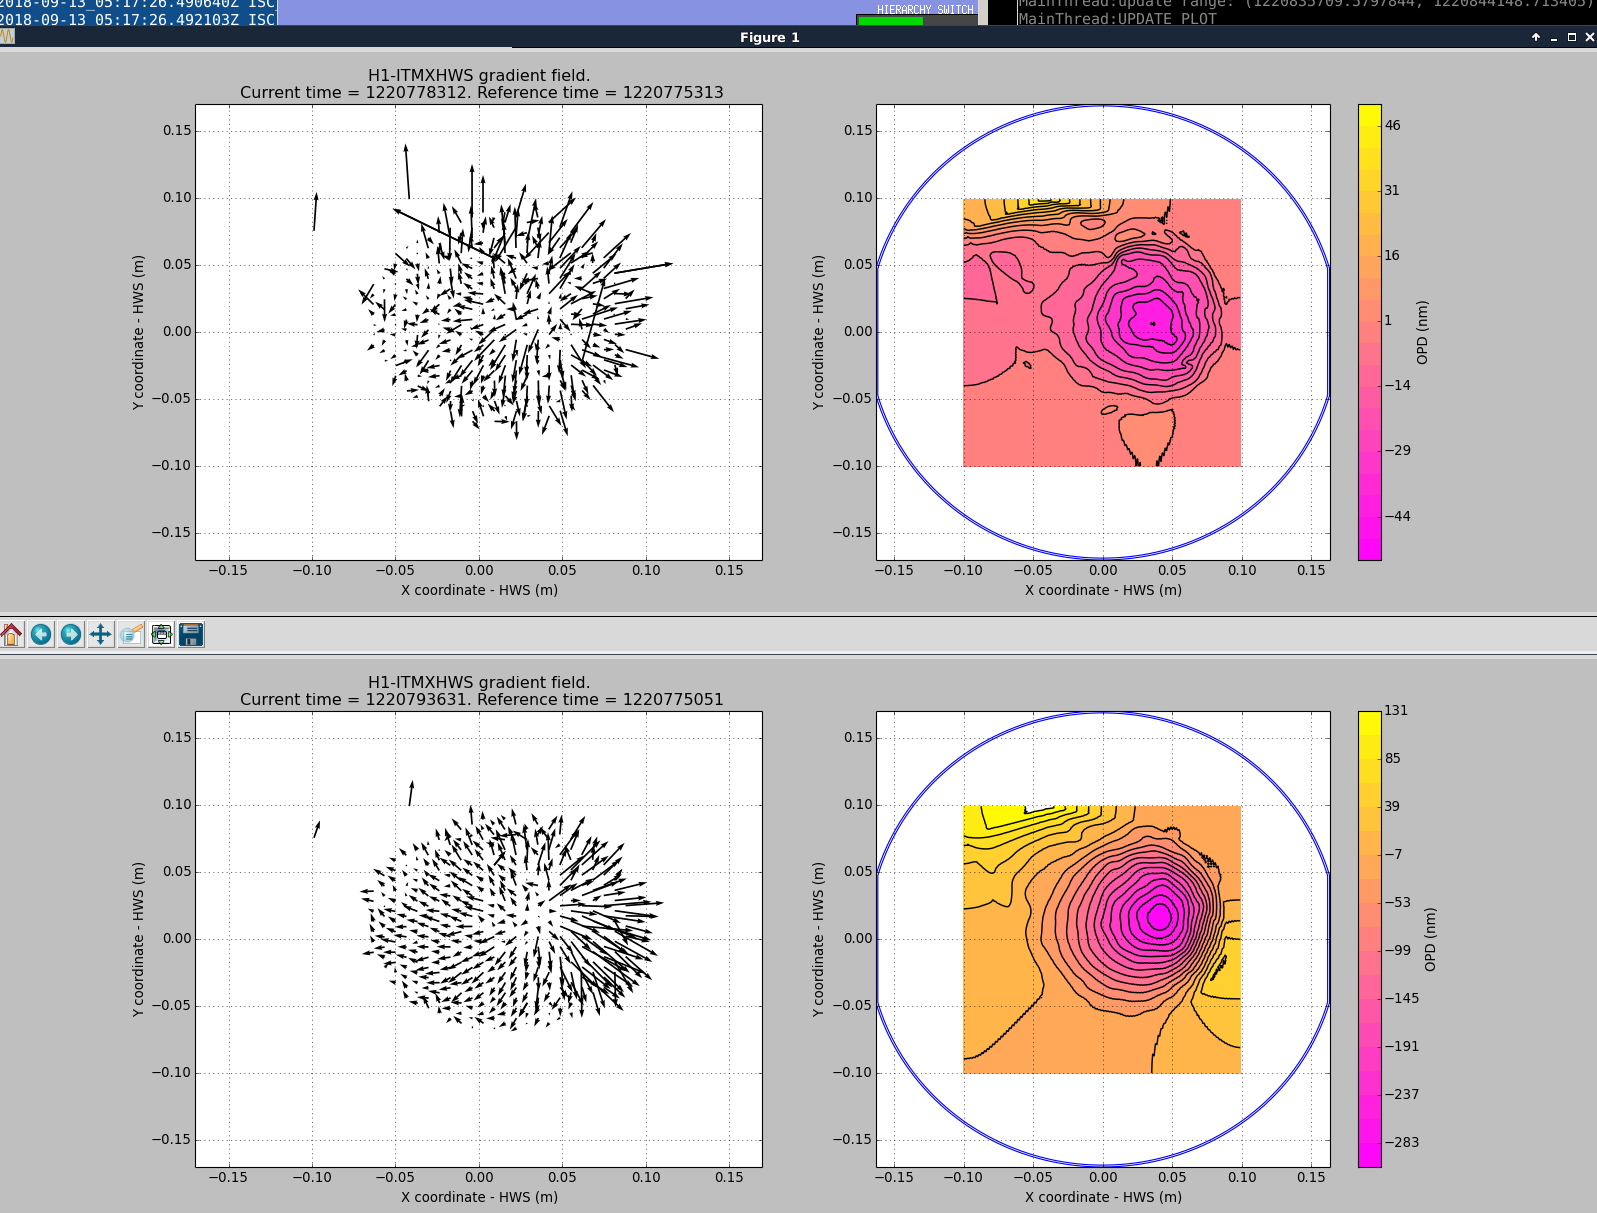
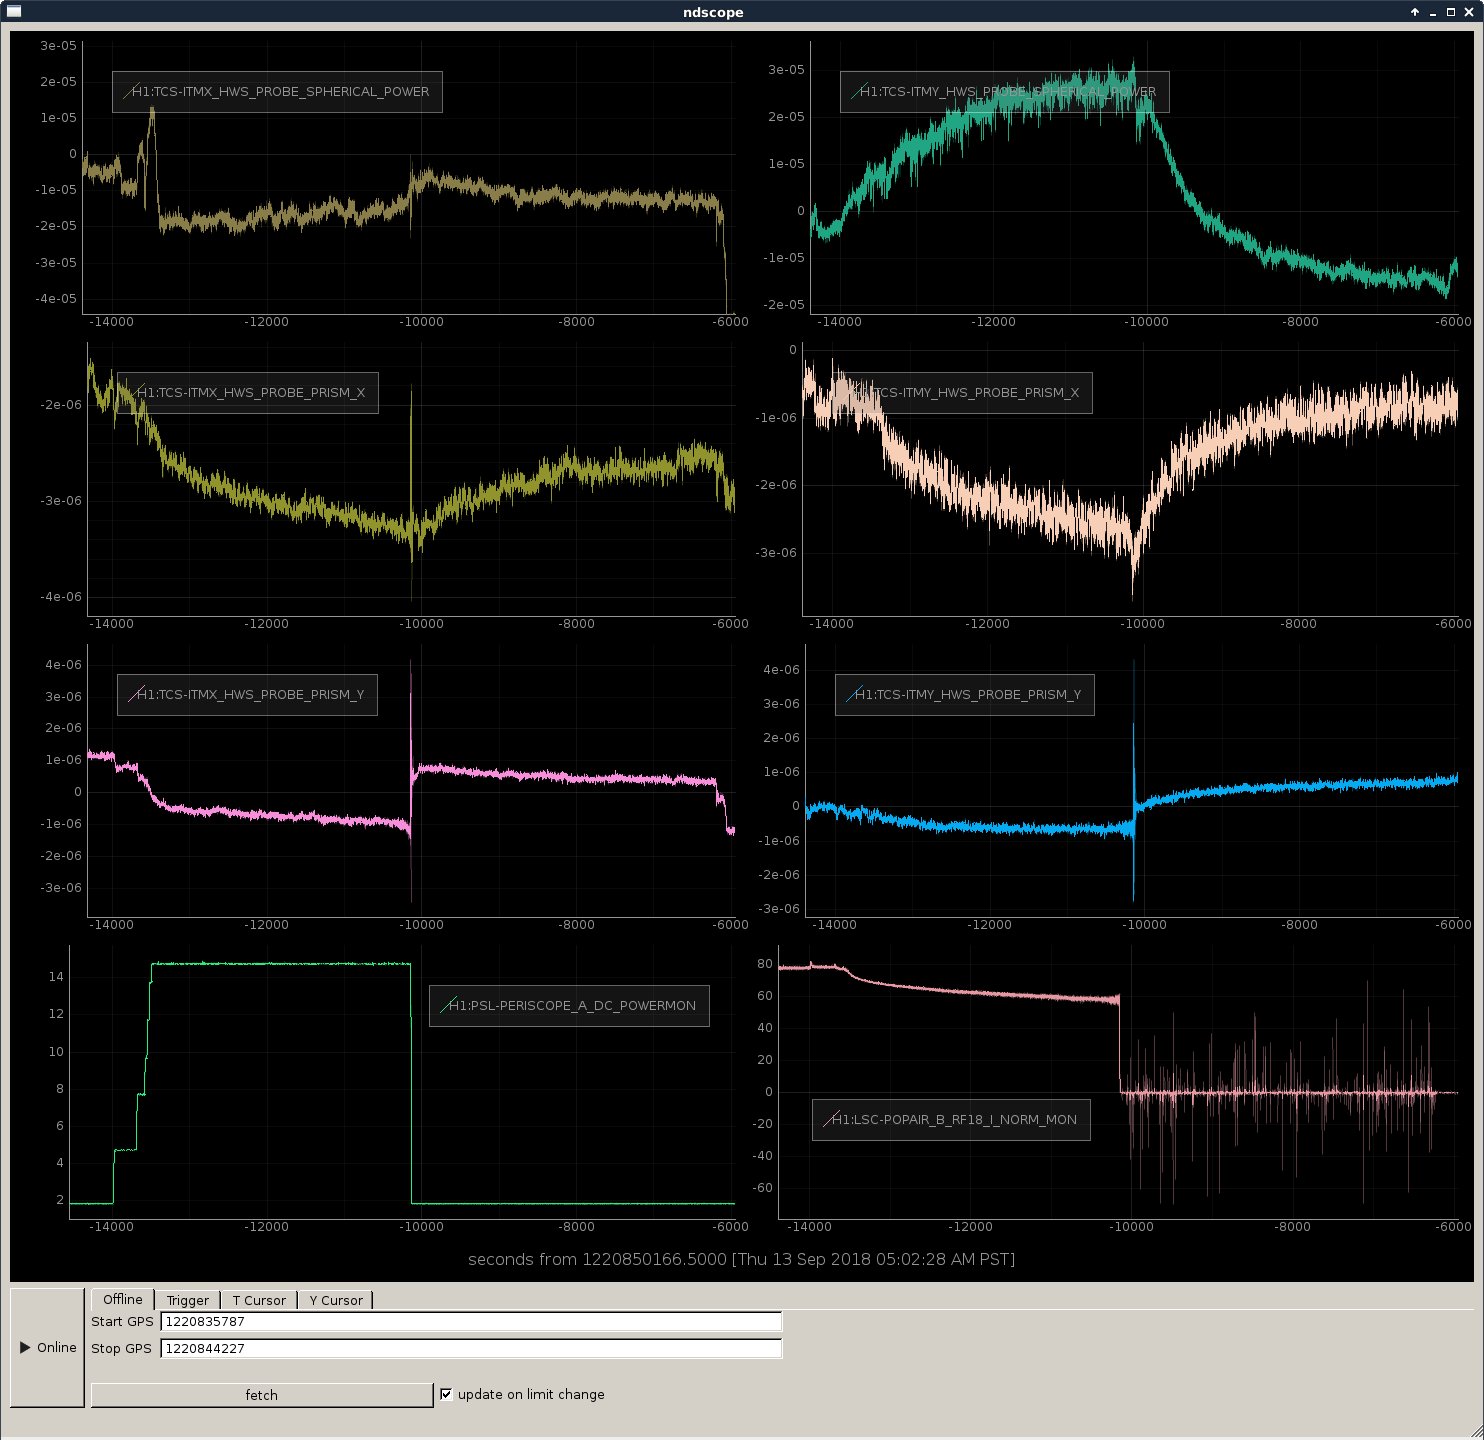
1. Spherical power for ITMX and ITMY as we power up and cool down. ITMX has glitches when the laser power is changed.
2. PRISM values for ITMX and ITMY as we power up and cool down (second and third row of plots) with spherical power (top row) for reference, and power and POP 18 sidebands for reference.
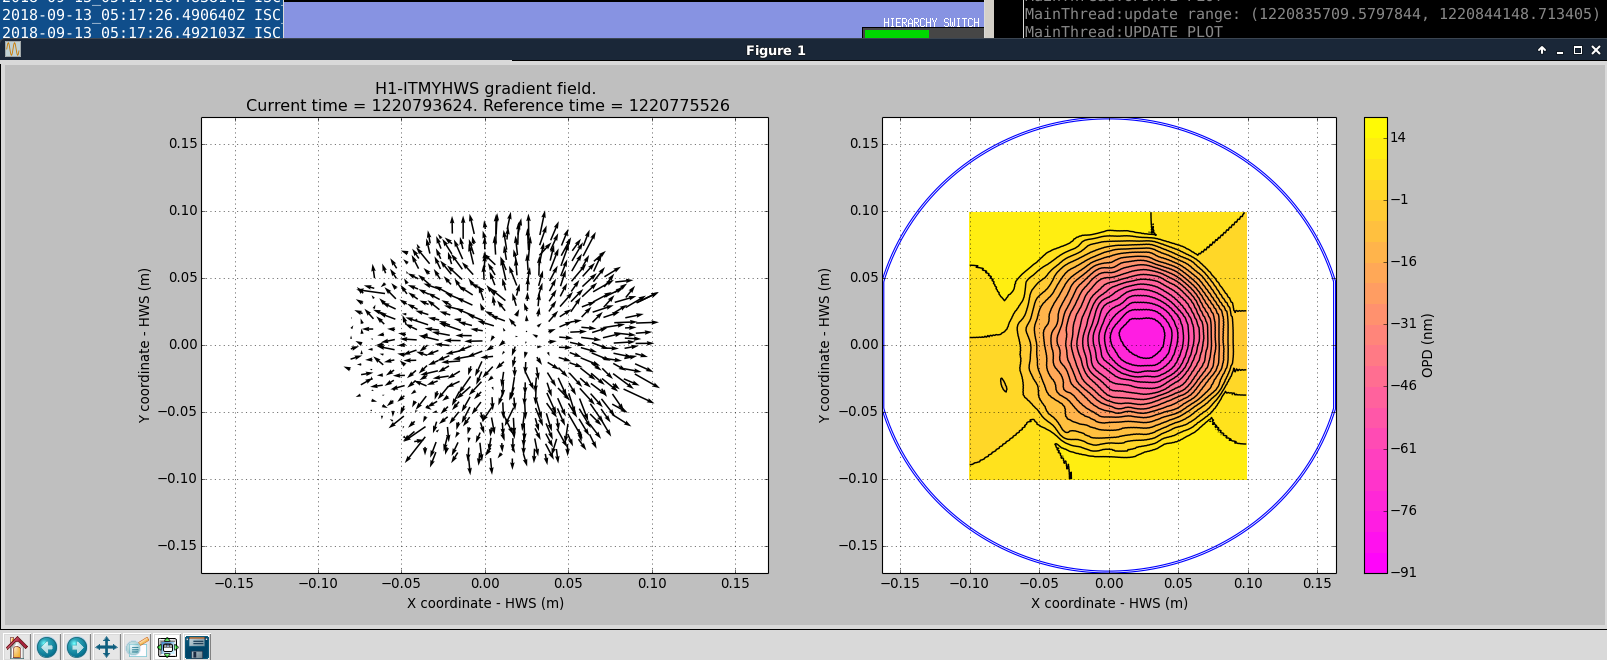
3. Contour plots of the ITMX cool down. Top plot is using "current" and reference times both in the cool down, bottom plot using a "current" time just before we lost lock, when the spherical power was ~5e-6, not sure if this is legit.
4. Contour plots of ITMX cool down.
Last night before we lost lock we increased the power to 19 W and decreased it to 17 W shortly after. This made the absorbed power in the optic a little confusing. This evening we powered up to ~15 W and stayed there for an hour before losing lock, to let the thermal lens settle before powering down.
The ITMY spherical power for this cool down was consistent with previous measurements however ITMX is even more confusing, with the exponential decay not obvious in the spherical power, see attachment which can be compared to the second attachment of my last comment which talks about last night's data.
The ITMX Hartmann has an iris directly before the camera which is blocking a ghost beam, and the beam also reflects off the beamsplitter, which underwent some alignment changes recently. Perhaps we should check the iris centering on table again. A quick stream of the Hartmann image (with the plate still on, so it only shows an array of dots) shows nothing amiss though.
For now TVo has used last night's 17 W cool down data to measure the ITM absorption.
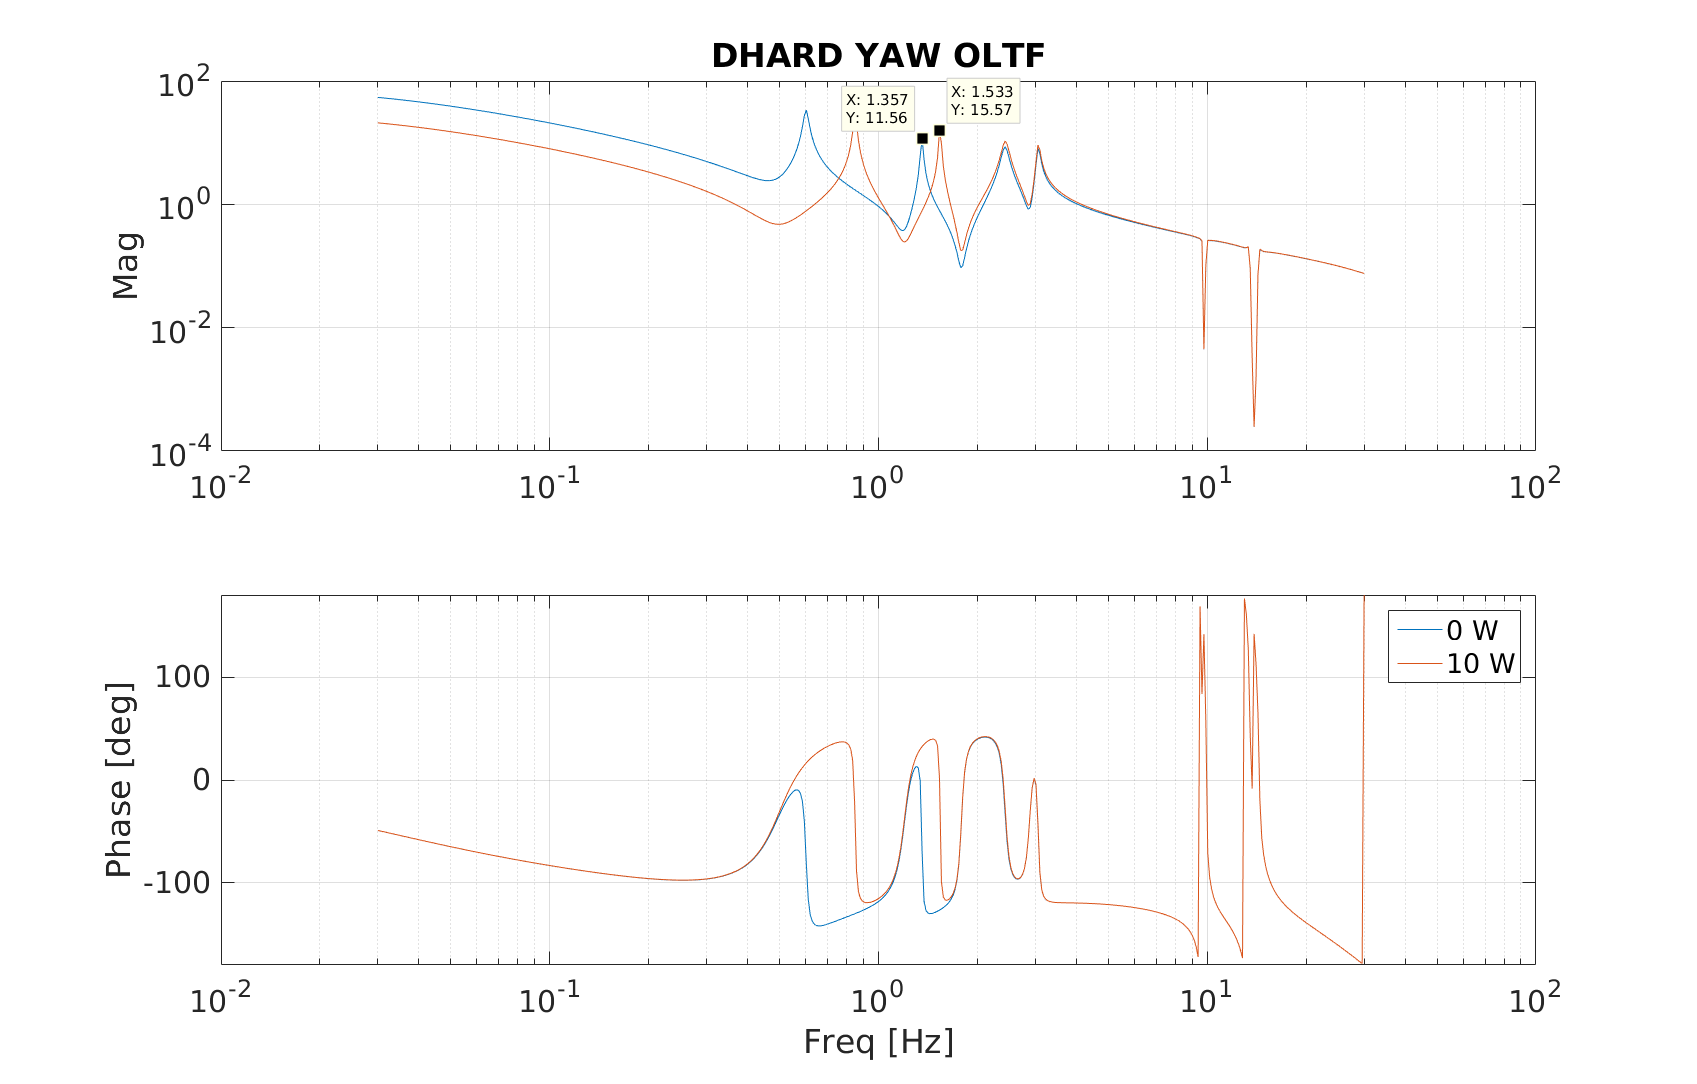
We were able to modify the ARM ASC plant by digitally adding the Sidles-Sigg torque.
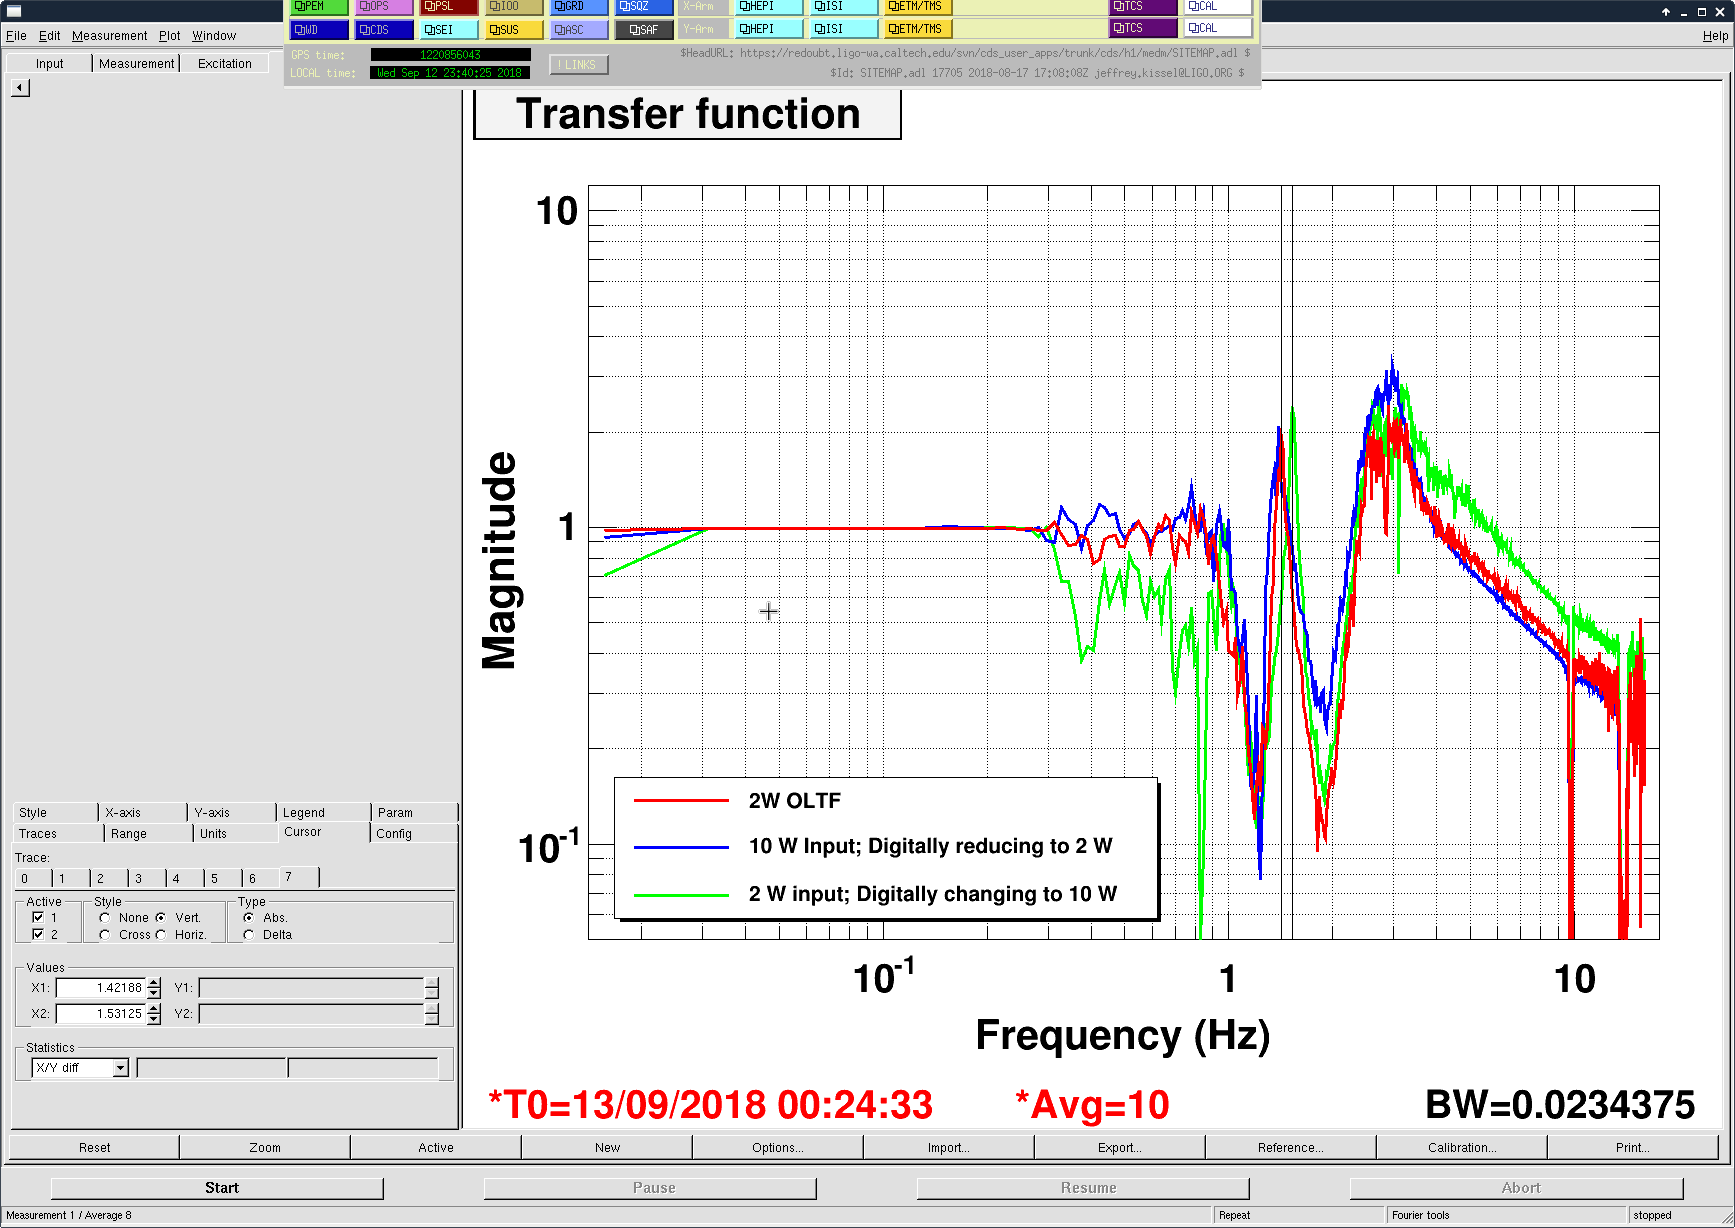
Please see the first attached plot.
Here the red trace was the DHARD YAW OLTF measured at 2 W input power without digital compensation.
The blue trace was the DHARD YAW OLTF at 2 W input power but with a digital Sidles-Sigg torque added so that it looked like a 10 W plant. Note that the sus resonance was shifted digitally from 1.4 Hz to 1.5 Hz. (We increased the overall loop gain to make the UGF 6 Hz for this measurement.)
The green trace was the OLTF measured at 10 W input power with the digital compensation to reduce the plant back to the 2W one, as the resonance peak was shifted back to 1.4 Hz. (As we power up the optical response decreased a bit thus the UGF reduced to 4 Hz; yet this is only a dc factor and can be tuned easily. Also we do not need a perfect subtraction here. With 10% error we can already reduce the 50 W plant to a 5 W one which we can control without modifying filters. The DC gain also provides us a measurement of the )
As a reference, in the second plot we also show the matlab modeled DHARD YAW OLTF. My sus model was just the default one so the resonance frequencies did not match the real LHO quads exactly, but the point is that from 0 W to 10 W (50 kW per arm circulating power), we should expect the secondary suspension resonance at 1.4 Hz to be shifted to 1.5 Hz, as illustrated in the measurements.
==================================================================================================================
Details:
We currently do not have the path dedicated for this digital compensation. Thus we borrow the DC 5 filter bank for this compensation. The same error signal for DHARD Y ctrl was sent here and the output goes to the same output matrix as DHARD Y ctrl. The details of the filters was detailed in LHO:43849. We updated the optical response FM5 [rad/ct] by increasing it by a factor of 3. Changing the 2 W plant to 10 W we put a DC gain of +1. To compensate for the 10 W plant to make it back to 2 W we put a gain of -0.8 (due to lose in the optical gain as we increased power; again this is just a DC factor and tuning it to 10-20% accuracy should be much easier than designing different ctrl filters at different input powers).
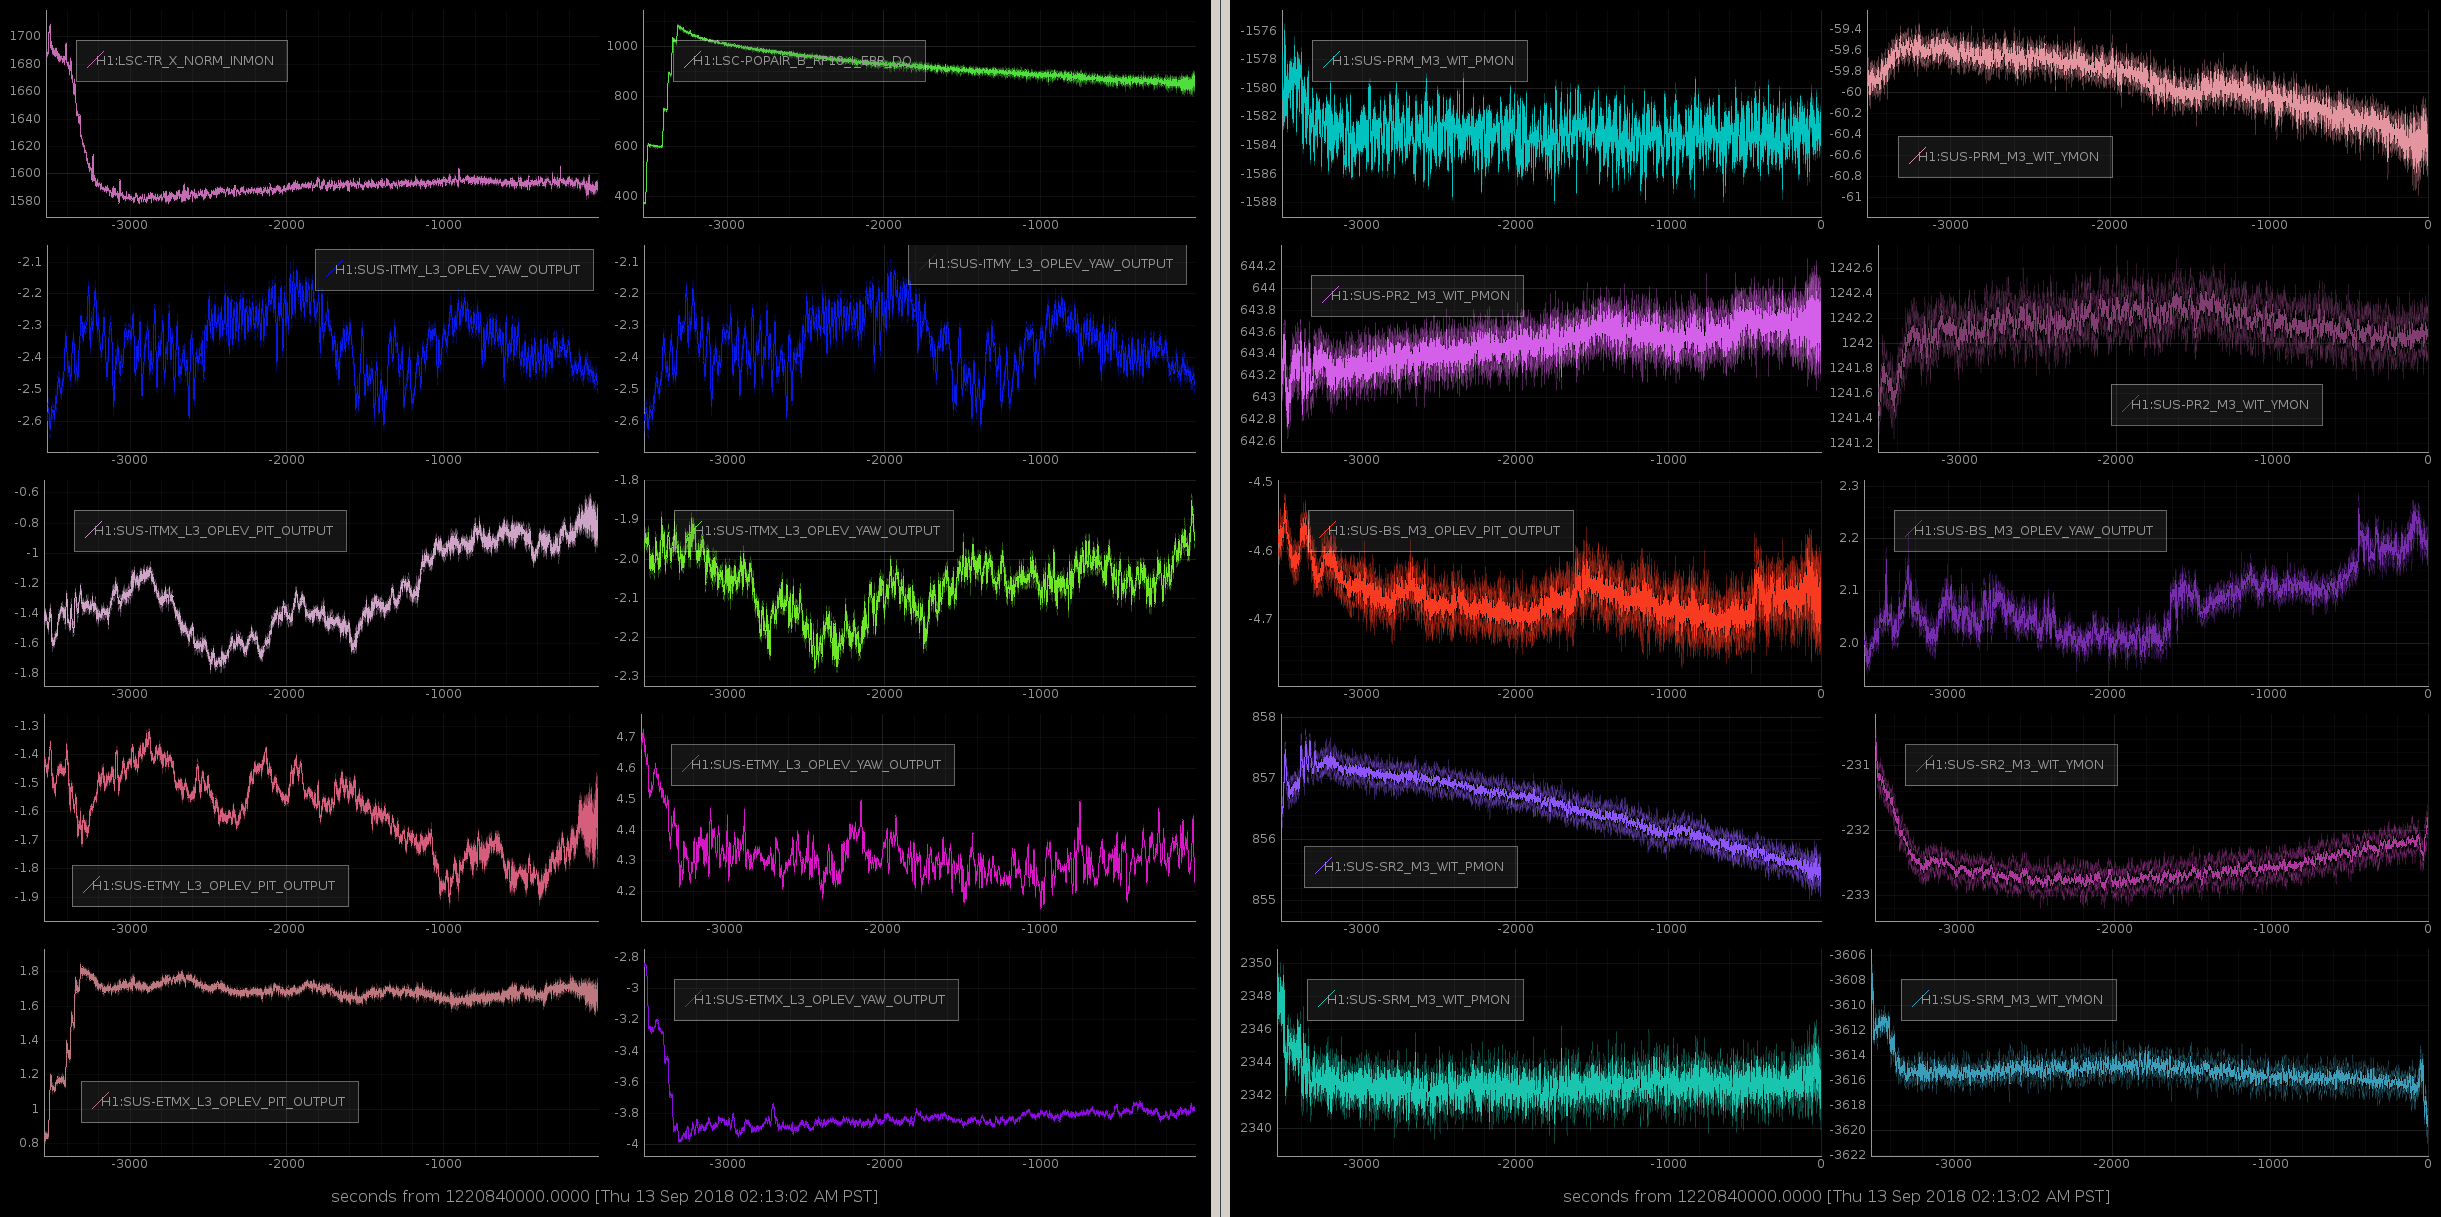
Tonight we stayed locked at almost 15 W for an hour to get a nice steady state thermal lens measurement for the Hartmann (with limited success for ITMX, see log post 43981)
We lost lock in the same manner as last night, with the OMC suspension saturating. Hang and I had a quick look at the witness sensors for many optics and can see that over the duration of the lock PRM and SR1 are shifting by roughly 1 urad.
This attachment has many plots: top left is X arm transmission and pop rf18, which increase as we acquire but then decrease as we sit at 15 W and the thermal lens increases. Bottom left shows the test mass positions as measured on the op levs. Right plots shows PRM, PR2, BS, SR2, SRM witness monitors on the same timescale.
We reduced the ASC loops gain by a factor of 4 in the MICH_DARK_ALIGN state in ALIGN_IFO guardian and now it seems to be working again. We should be able to use it for again for doing simple mich contrast defect measurements.
MICH_DARK_ALIGN was not working this morning.
The reason was that the PREP_MICH_DARK_ALIGN state will set the sensing matrix and engage the input of the ASC-MICH filter banks, with zero gain. But FM3 is almost an integrator, with a pole at 0.03 Hz. Therefore any input offset in the error signal was running into this low frequency pole, accumulating history.
I changed the way the ASC-MICH loops are engaged and now MICH_DARK_ALIGN works:
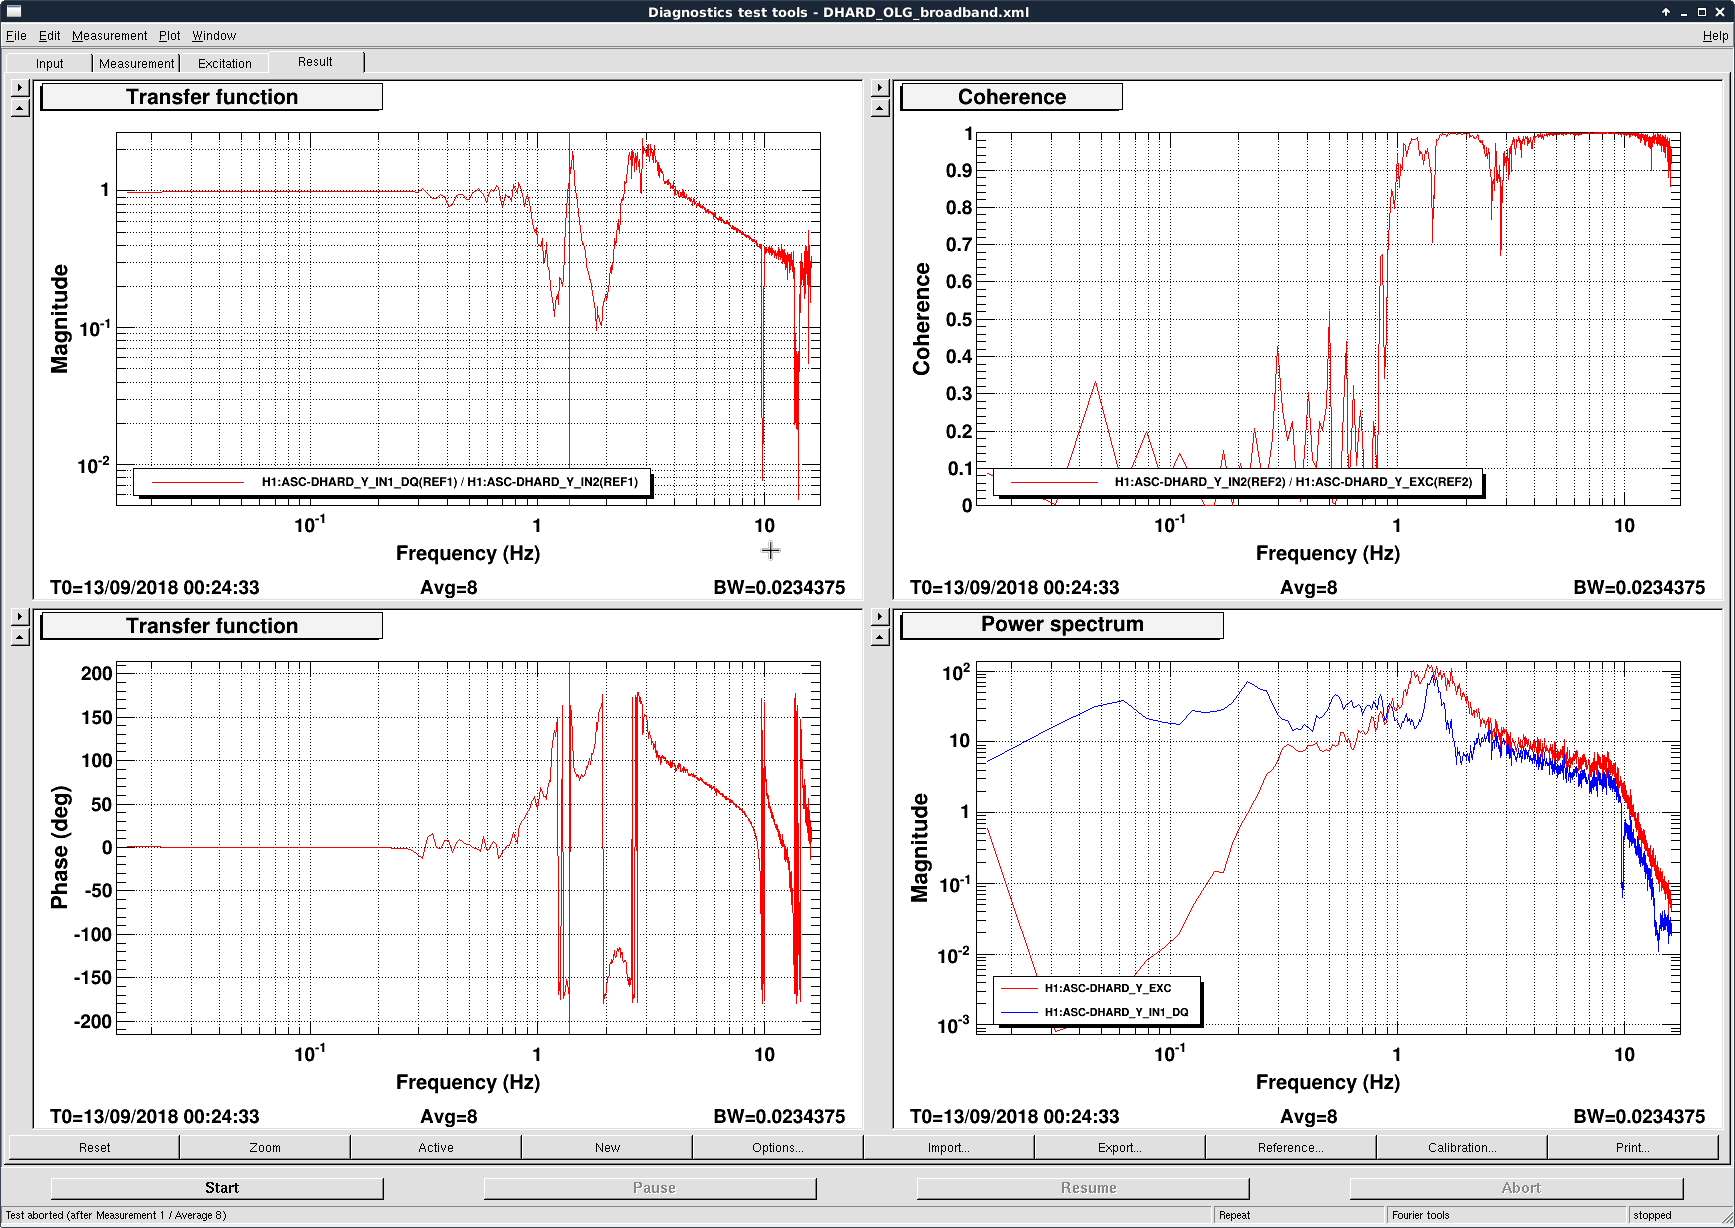
We took a DHARD YAW measurement at 2 W at GRD state DARM_TO_DC_READOUT. See the first attached plot. The UGF was 4 Hz yet it seemed fine to increase it up to 6 Hz as we still had a phase margin of 50 deg. Thus we increased the DH_Y gain from -40 to -60. Similarly we increased DH_P gain from -30 to -50 to make the loop more robust for power up.
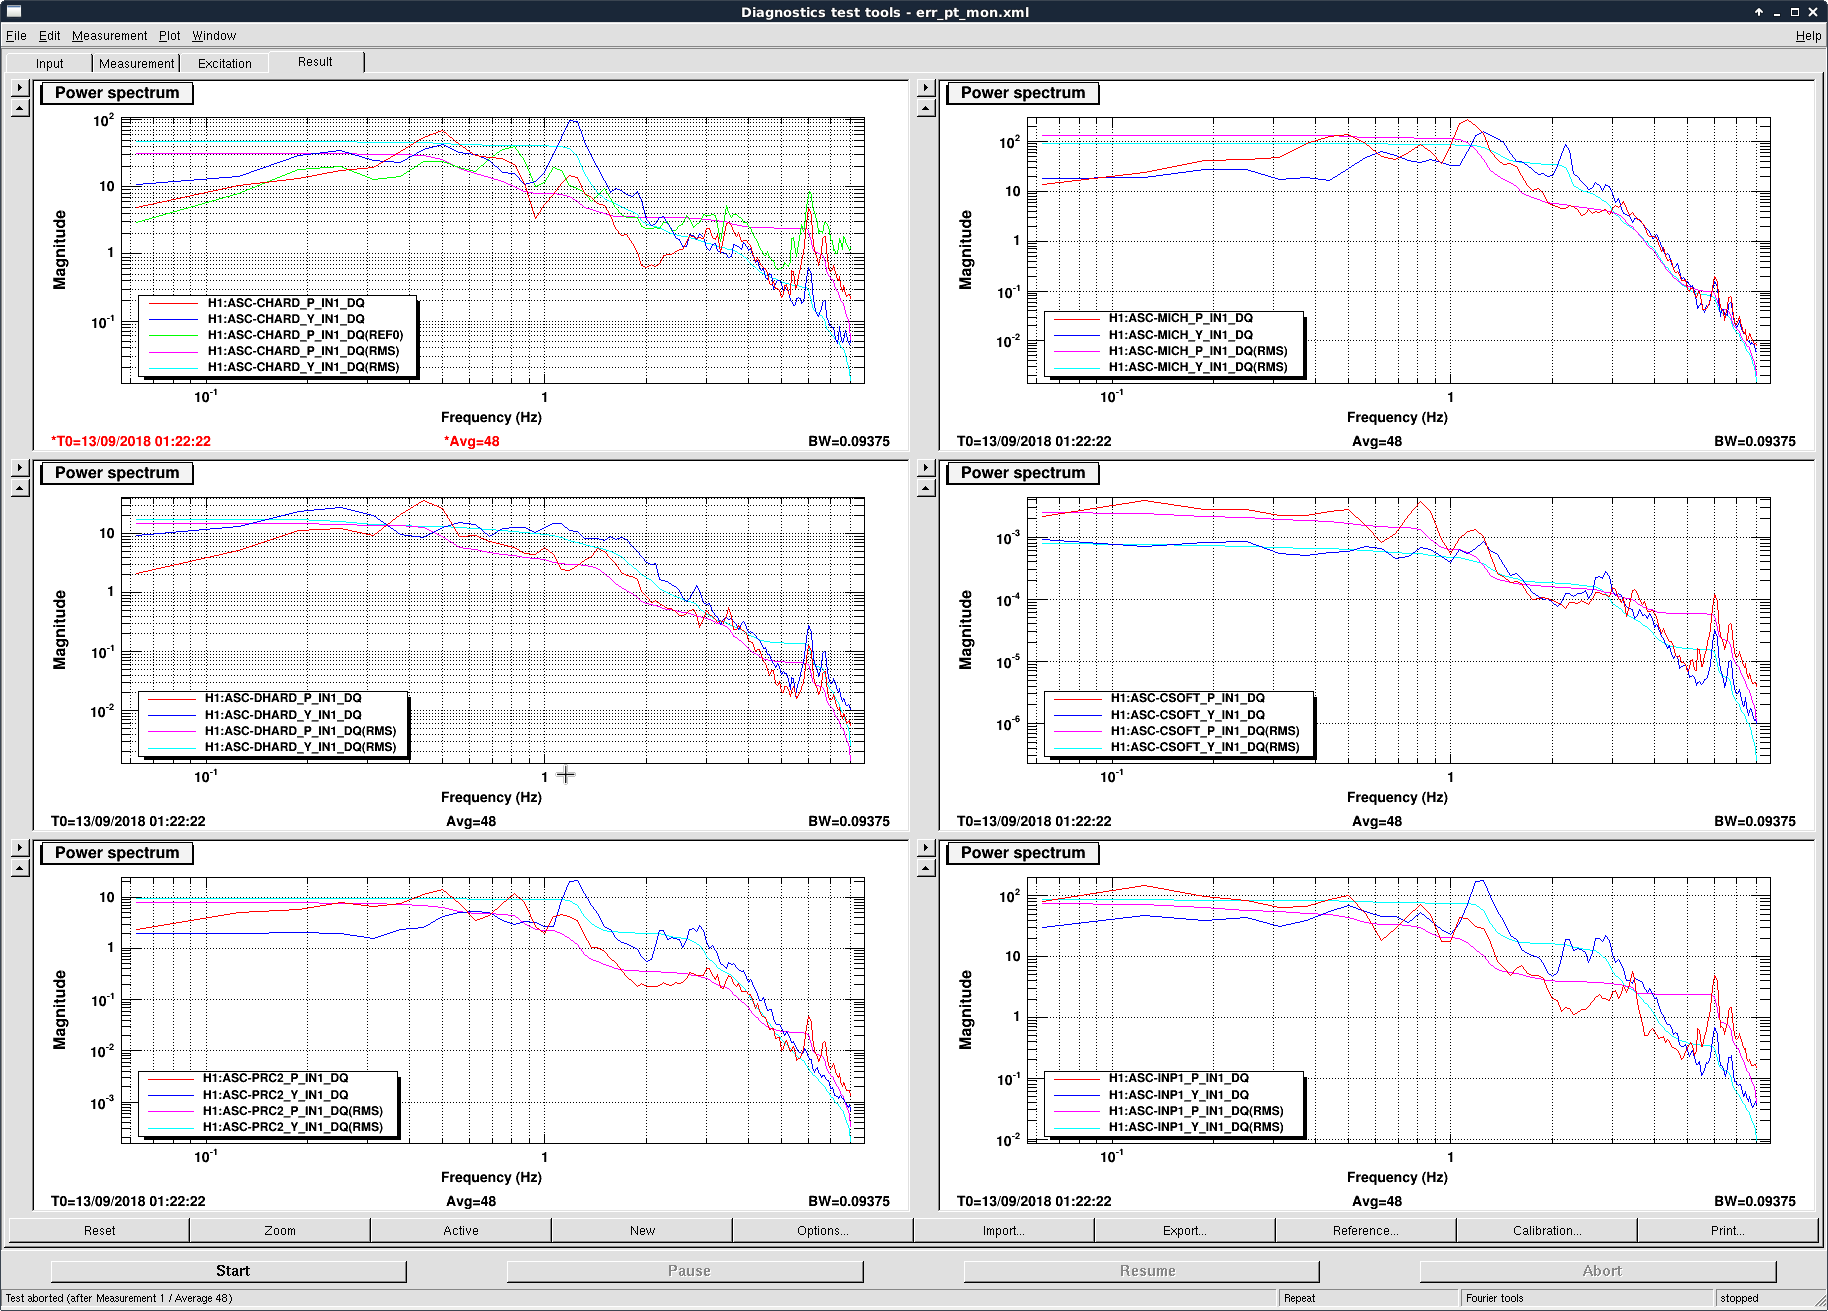
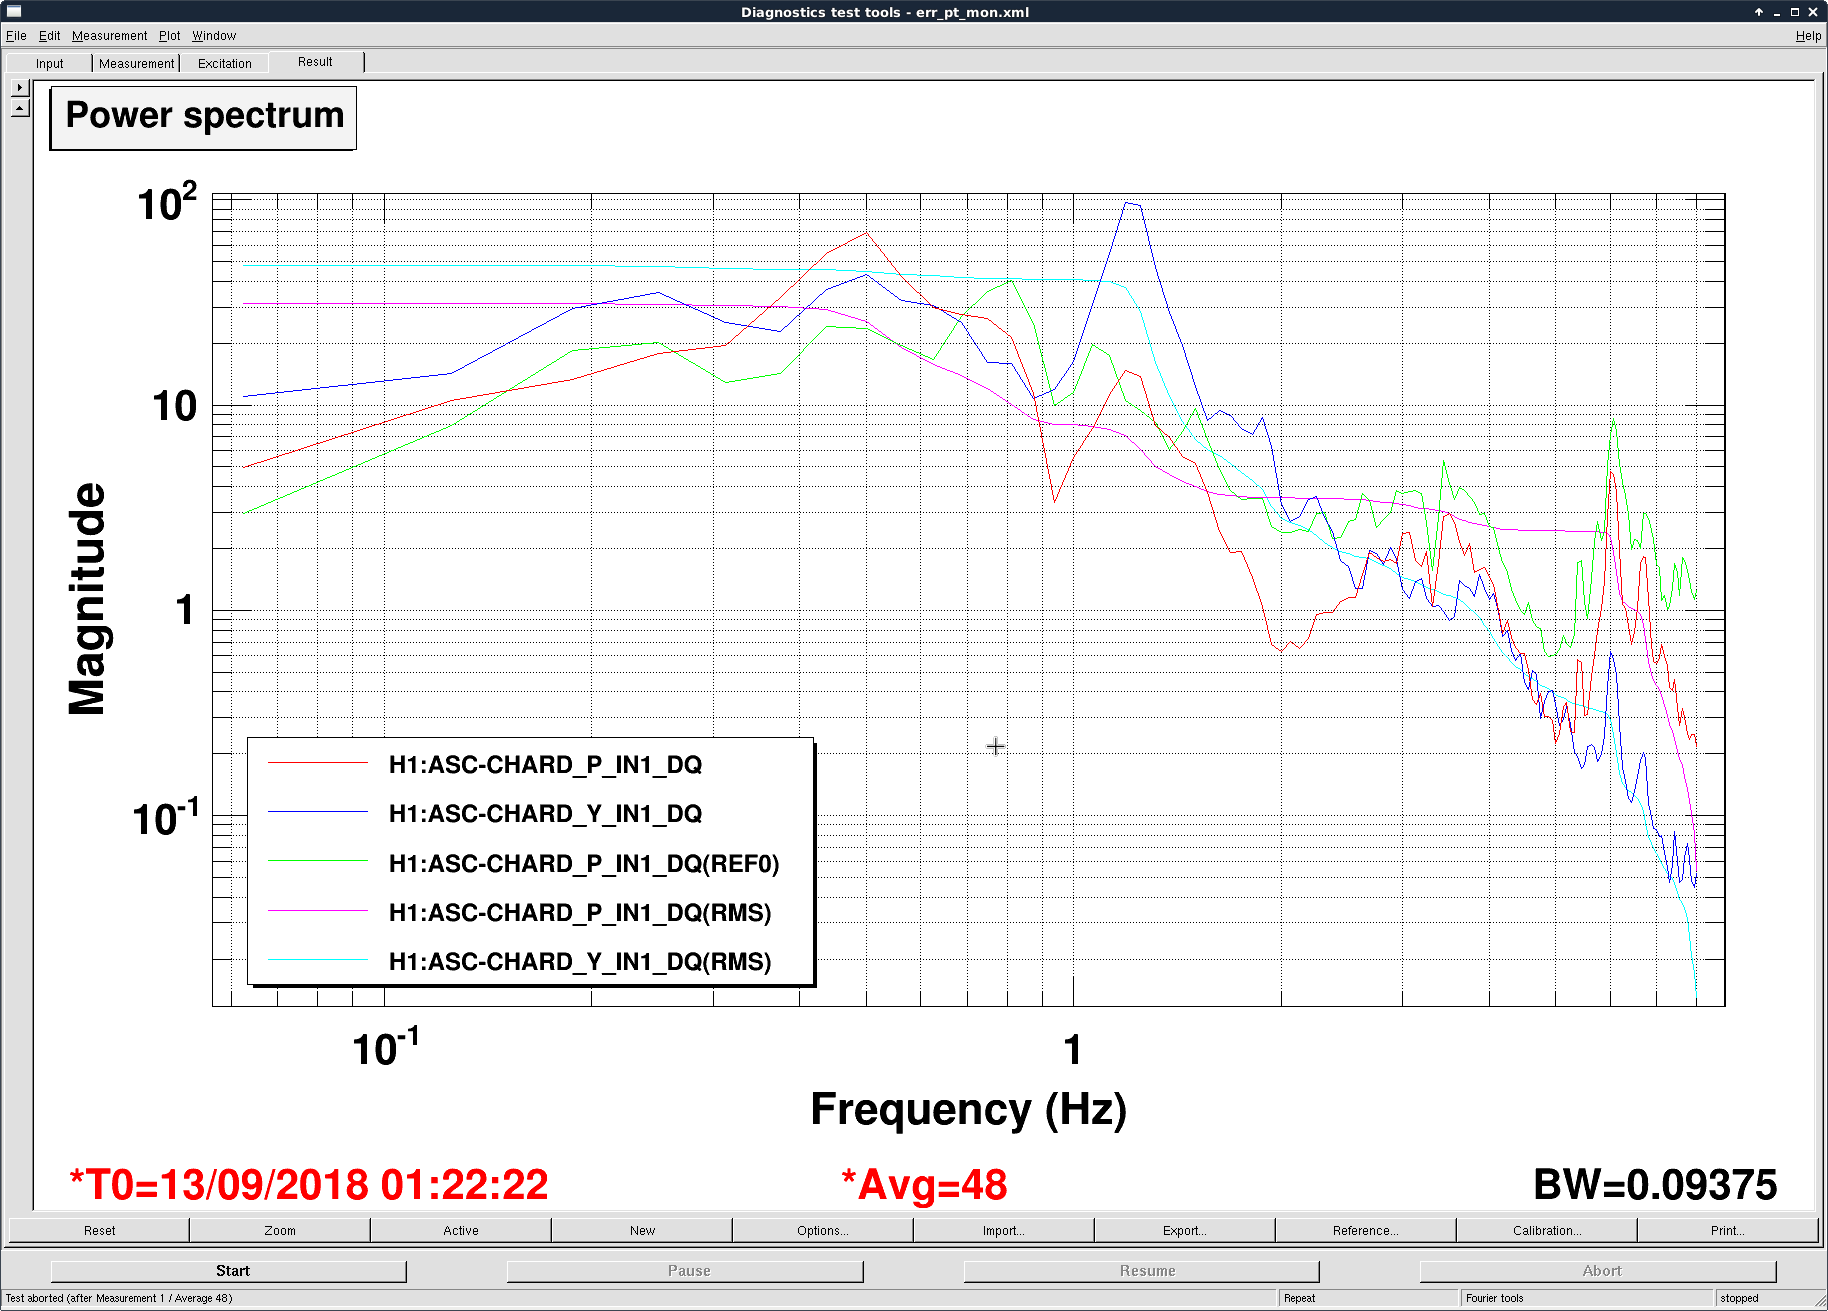
On the other hand, we noticed some oscillation in CH_P at 6 Hz (and also seen in many other loops as shown in the second plot; yet CH was the only loop had a UGF high enough at this point that could potentially cause gain peaking). The oscillation was present even before we increase the DH loops gain. We tried to reduce CH P gain yet the gain peaking got worse. Instead we increased CH_P gain from 0.3 to 0.4 and it slightly reduced the 6 Hz oscillation. Also turning up the DH loop gains also mildly helped. See the third plot. The green trace was before all the gain increasing and the red one was after we increased CH_P from 0.3 -> 0.4, DH_P from -30 -> -50, and DH_Y from -40 -> -60.
Will try to get a high-resolution CH OLTF once we have chance.
[Sheila, Hang, Gabriele]
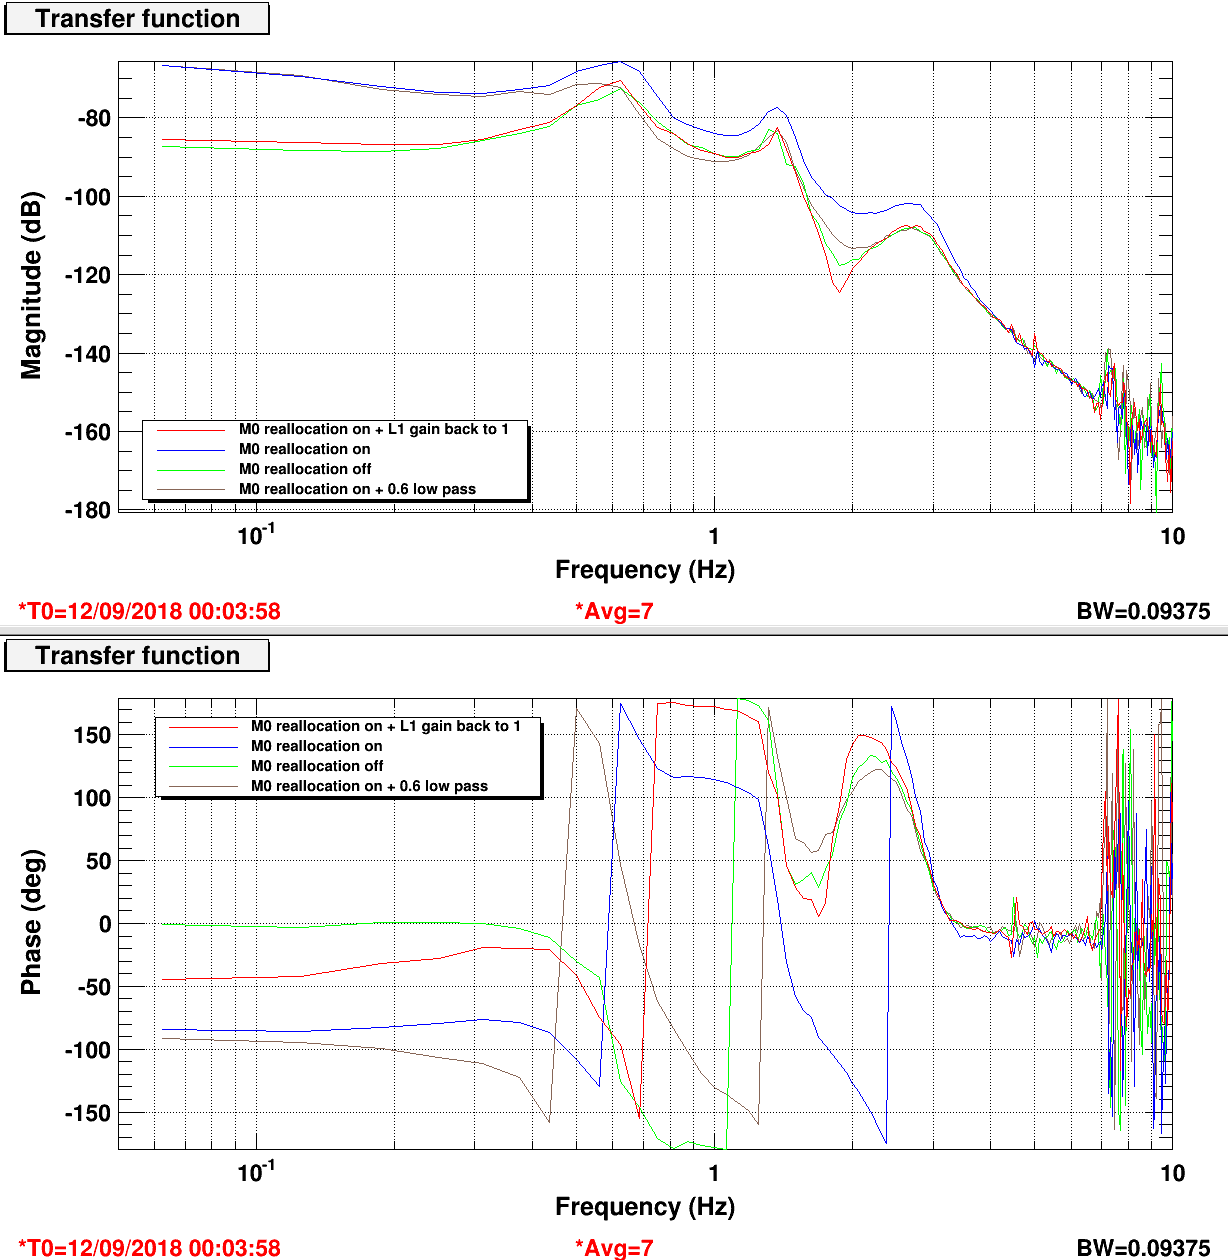
In brief, the L1 LOCK gain in ITMX was 10 instead of 1 (as it used to be during O2). Therefore the reallocation of pitch and yaw to M0 was ten times stronger, and it modified the suspension angular response as seen by the ASC at the lower stages. This created a crossover at about 1 Hz that produced the right-half-plane zero we measured in CHARD and DHARD. This wrong gain was there only in ITMX. We reverted it to 1 as it was during O2. The gain was changed from 1 to 10 on Saturday June 2nd 2018 at about 21:55 UTC. Nothing relevant written anywhere in the elog.
The plot below shows the yaw to yaw response of ITMX, measured with the optical lever, in a few different configurations.
The expectation is that this will fix the DHARD/CHARD plants (43844)
We implemented the low pass filters in all test mass M0 stages, since it gives us some more phase and gain margin at about 1.8 Hz, where there is still a zero.
The story of how we found this problem is long and convoluted. A brief summary below:
As part of this story, Jenne Hang and I checked the calibration of the test mass oplevs using the baffle PDs.
ITMY pit oplev is about 4% larger than what I got from the baffle PD, yaw is 3.5% lower, ETMY pit oplev is 13% high and yaw is 2% high. Jenne did a similar check for the Y arm optics, and I think that she also found that the optical lever calibrations are OK. (for locations of baffle PDs see D1200657)
The check that there wasn't a cross coupling between pitch and yaw on the ITM optical levers, Jenne and Hang steered the green beams to PD2 +PD4 on the ETM baffles, and in both cases the optical lever response in yaw was about 2% of the pitch response.
It would be great if someone could follow up on the ITM pitch to yaw cross coupling during some down time (without the confusion about top mass offloading).
For the yaw to pitch coupling, we already have good measurements of all test mass actuation responses. We only have to repeat the ITMX measurements since they were taken with the wrong M0 offloading. This will take about (10+10)*100 s = 2000 s of interferometer offline.
I will post more details with the measurements tomorrow, and hopefully there will be time to repeat the ITMX measurement.
Commenting on Sheila's log about oplevs checks:
To check the calibration:
To check that true pitch motion is reported by the oplev as pitch-only, and not a combination of pitch and yaw:
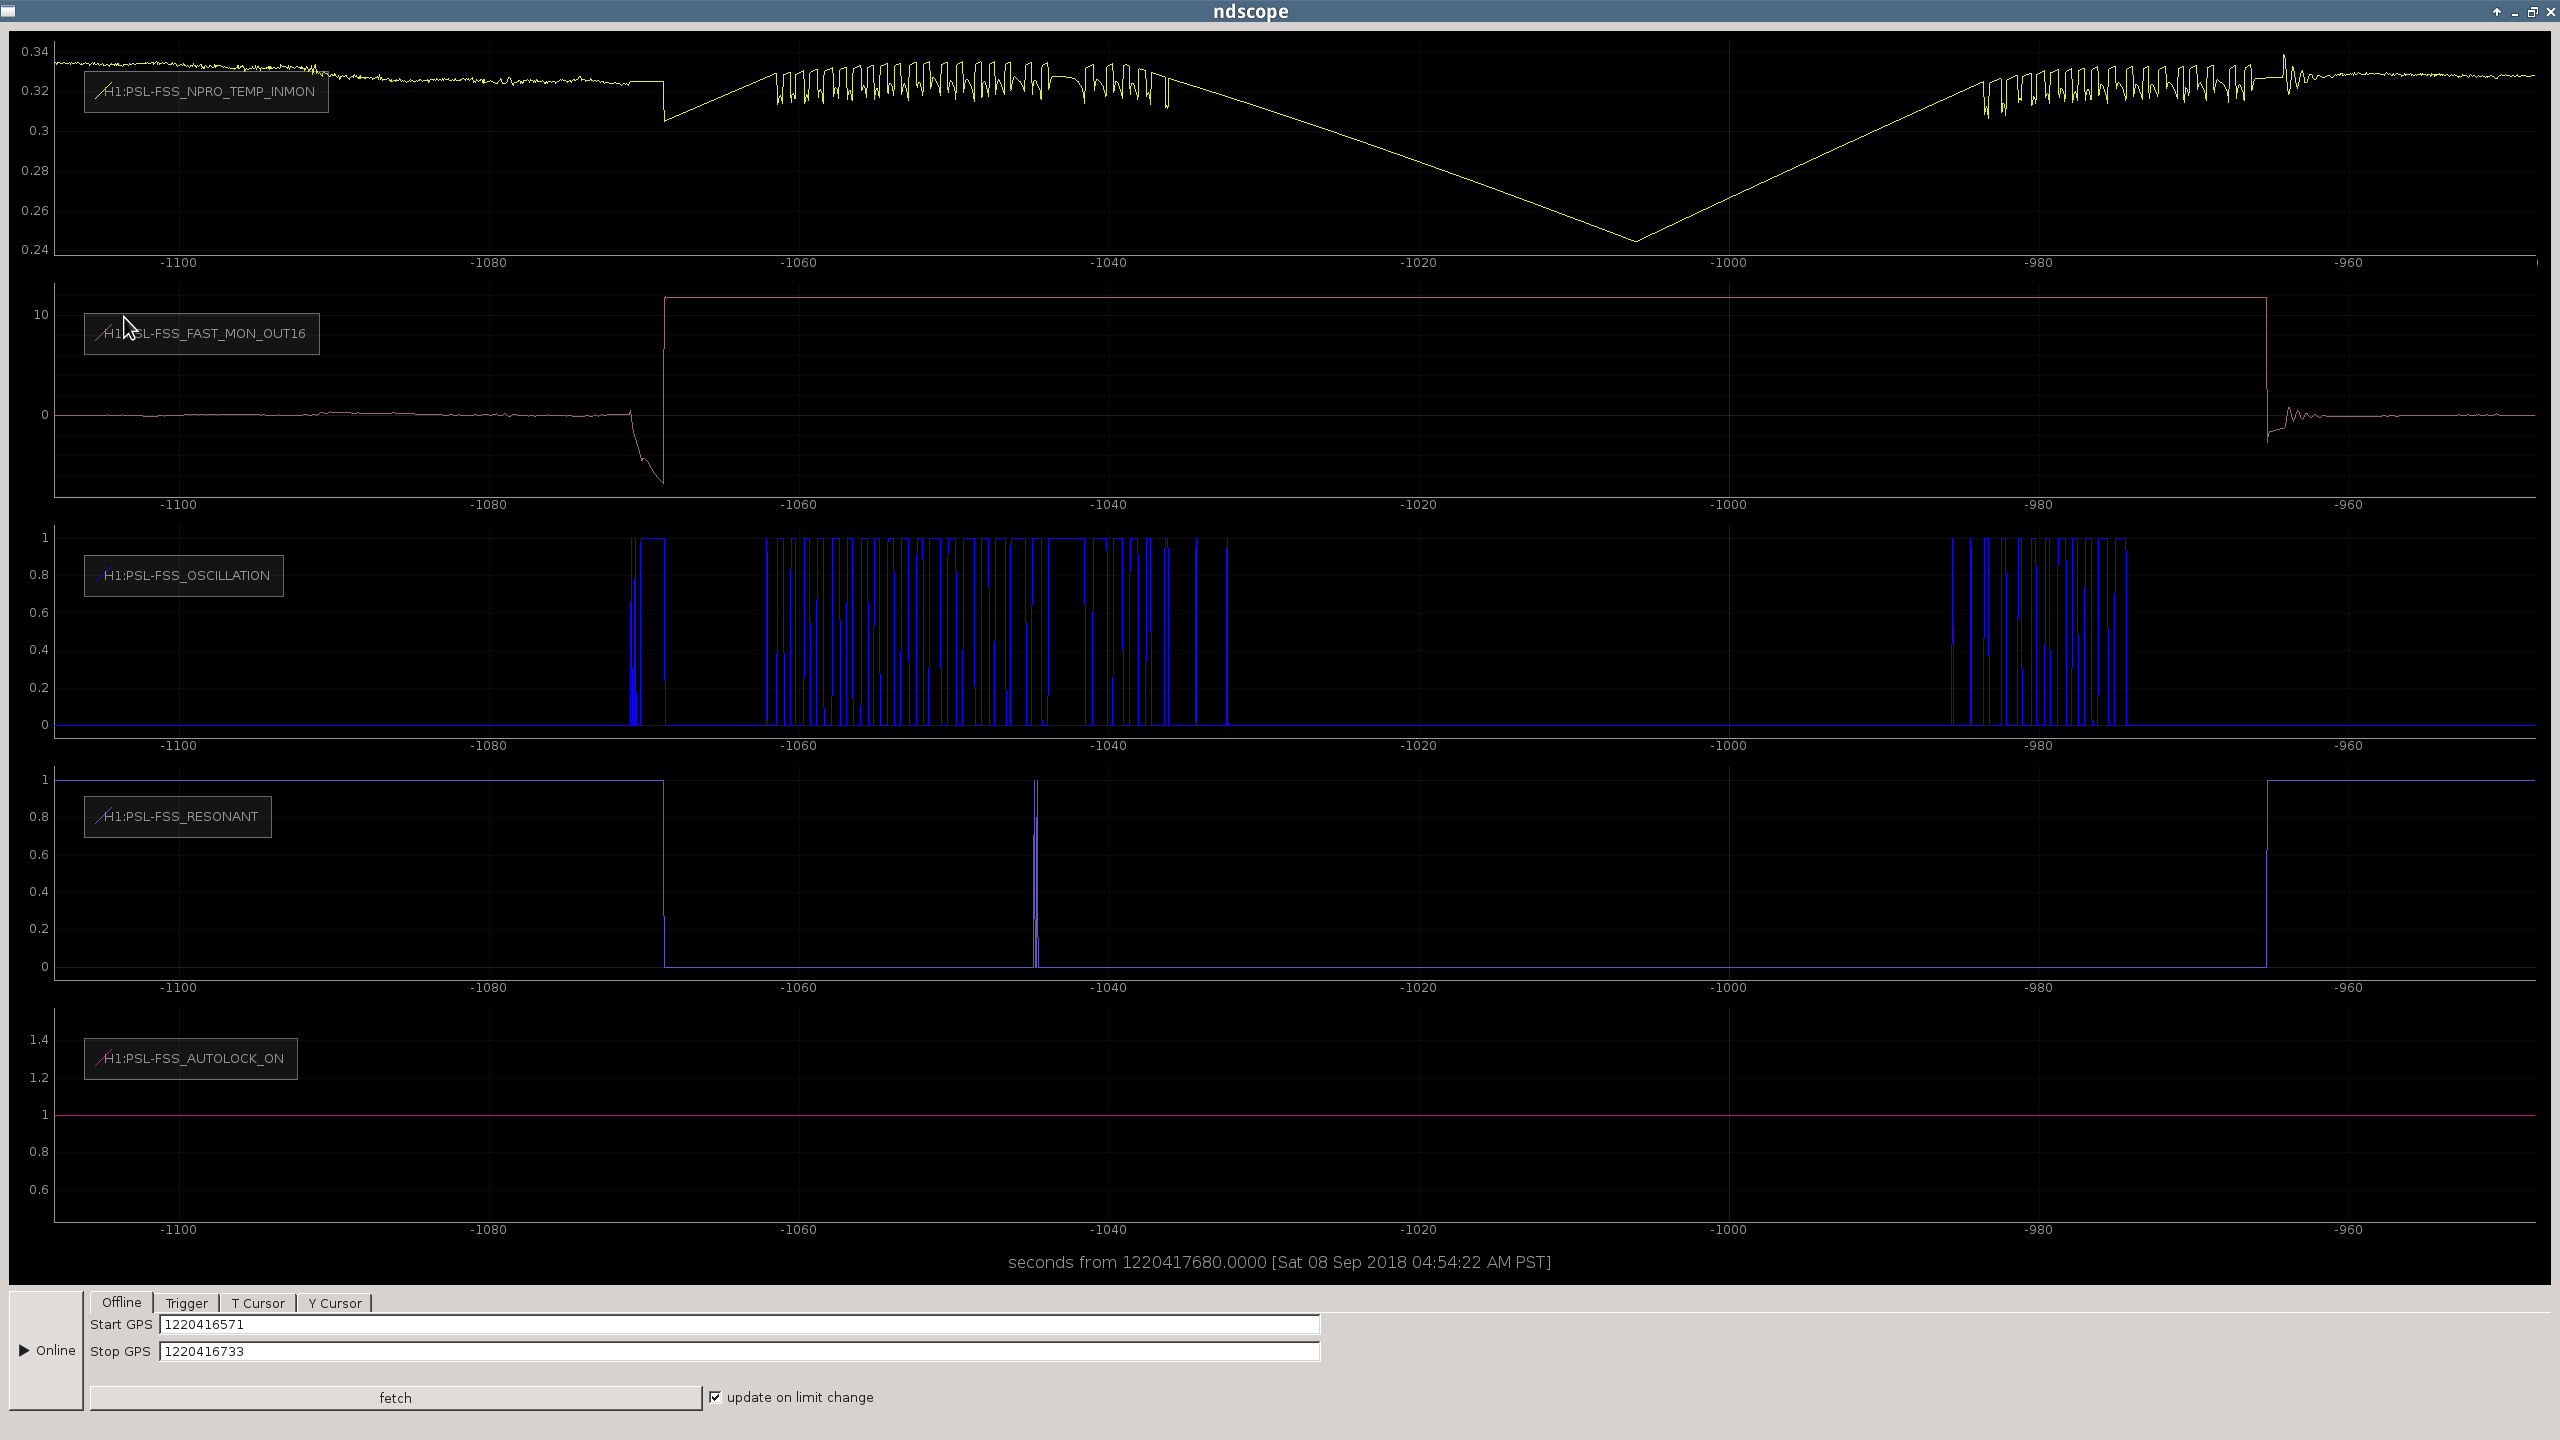
(In this post I mean "railing" as "parked at the maximum actuation range", where "oscillation" means "PZT is fighting the EOM") The FSS Fast Path has been railing recently, preventing the FSS from locking. (Pic 1) It seems as though FSS_OSCILLATION does not in fact monitor the FSS RMS, but triggers on a threshold. When the FSS voltage would pass a certain value, the PSL_FSS guardian would send it to state FSS_OSCILLATING. This state brings the common gain down to -10 dB, then slowly back up to wherever it started. This works great for stopping oscillations, but not for permanent rails. I modified the PSL_FSS code to increase the oscillation threshold from 0.6 to 3 V for five seconds whenever the fast voltage is railed at greater than 10 volts with extremely low RMS. This should allow the FSS loop to close and bring the temperature within range. Railing hasn't happened again, so I haven't had a chance to test the state, but it does still suppress actual oscillations.
[Hang Gabriele]
There might be some problem with the logic of the FSS_OSCILLATION state. This morning the guardian was continuously reducing the gain to -10 db, and then ramping it up to more than +100 db. Our guess is that the self.high_gain variable which is set in the main() function got a wrong, large value. Maybe we should hard code a gain of 20 db there?
We fix the problem by stopping the guardian, setting the FSS common gain to 20 db and restarting the guardian.
For now we hacked the PSL_FSS guardian the FSS_OSCILLATING state so that the FSS_COMMON_GAIN could not exceed 20 dB. We could thus lock the IMC without needing to manually pause the PSL every time.
Specifically, we modified the original
if not ezca['FSS_OSCILLATION'] or not ezca['FSS_RESONANT']
into:
if (not ezca['FSS_OSCILLATION'] or not ezca['FSS_RESONANT']) and (ezca['FSS_COMMON_GAIN']<20.)
H1:PSL-FSS_OSCILLATION is set whenever H1:PSL-FSS_PC_PP exceeds the threshold.
More info in alog 43970.
Above comment of mine, "H1:PSL-FSS_OSCILLATION is set whenever H1:PSL-FSS_PC_PP exceeds the threshold.", is totally false, see Jason's alog.