For the TCS+ISC team
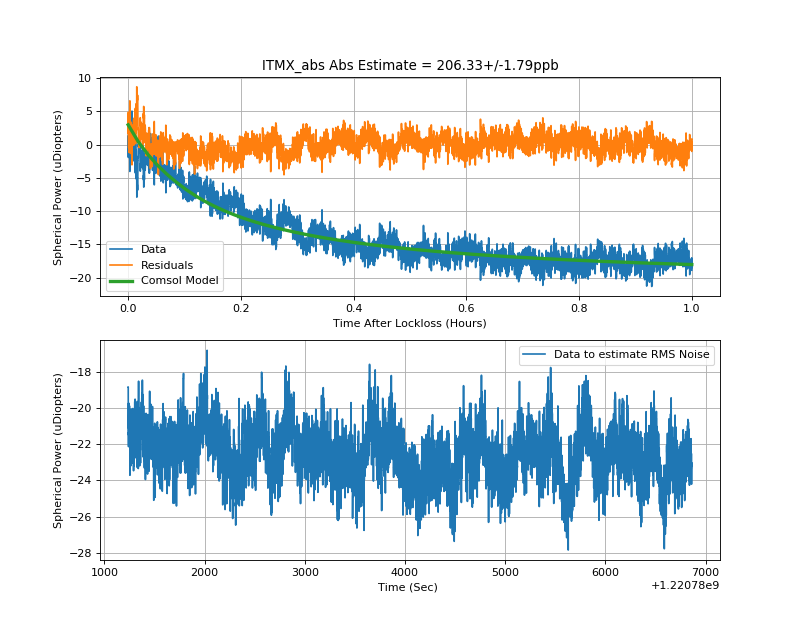
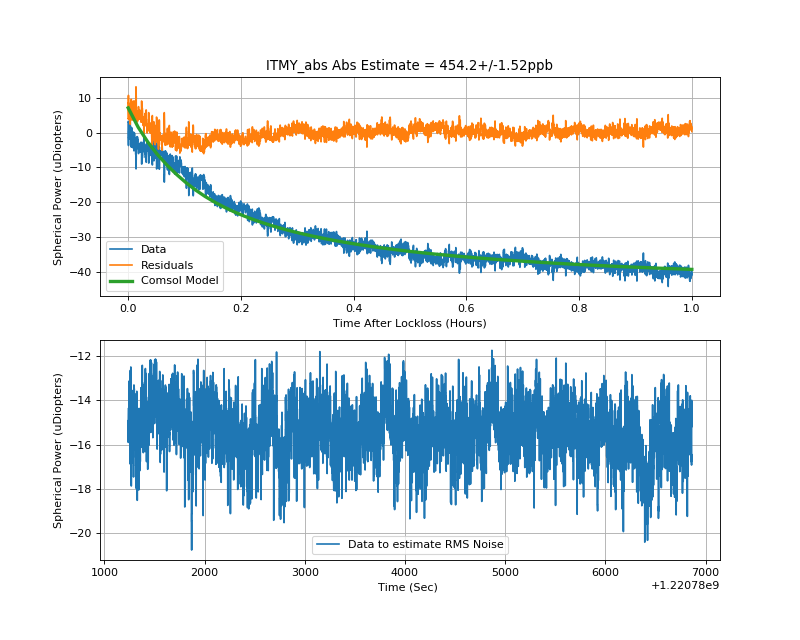
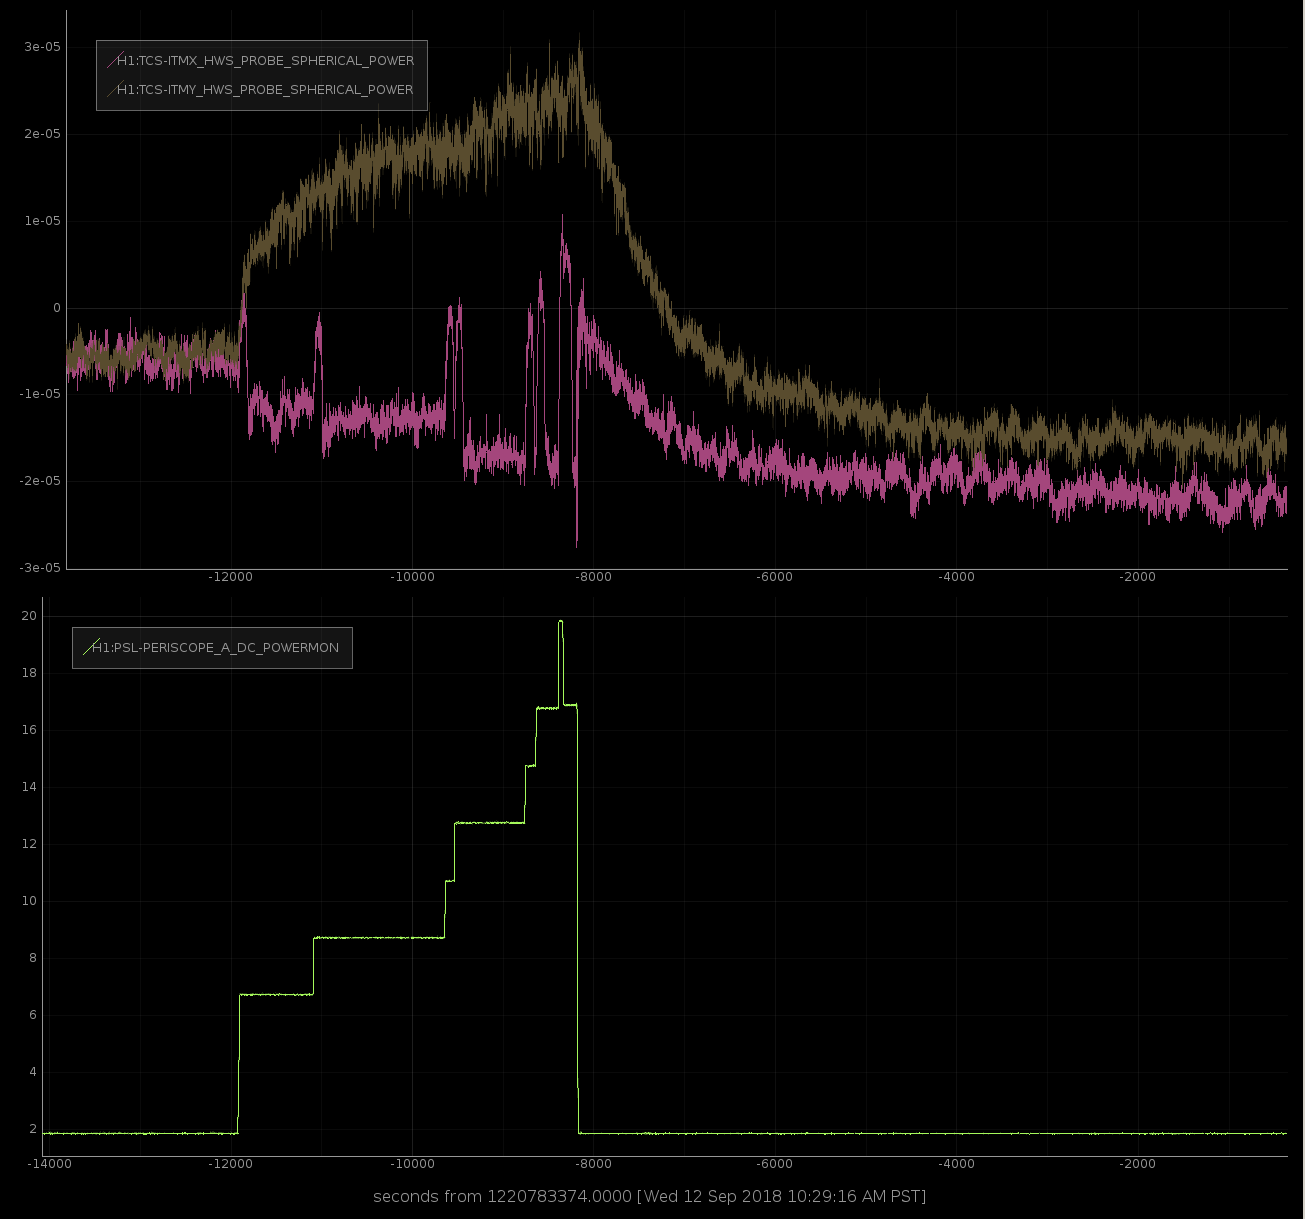
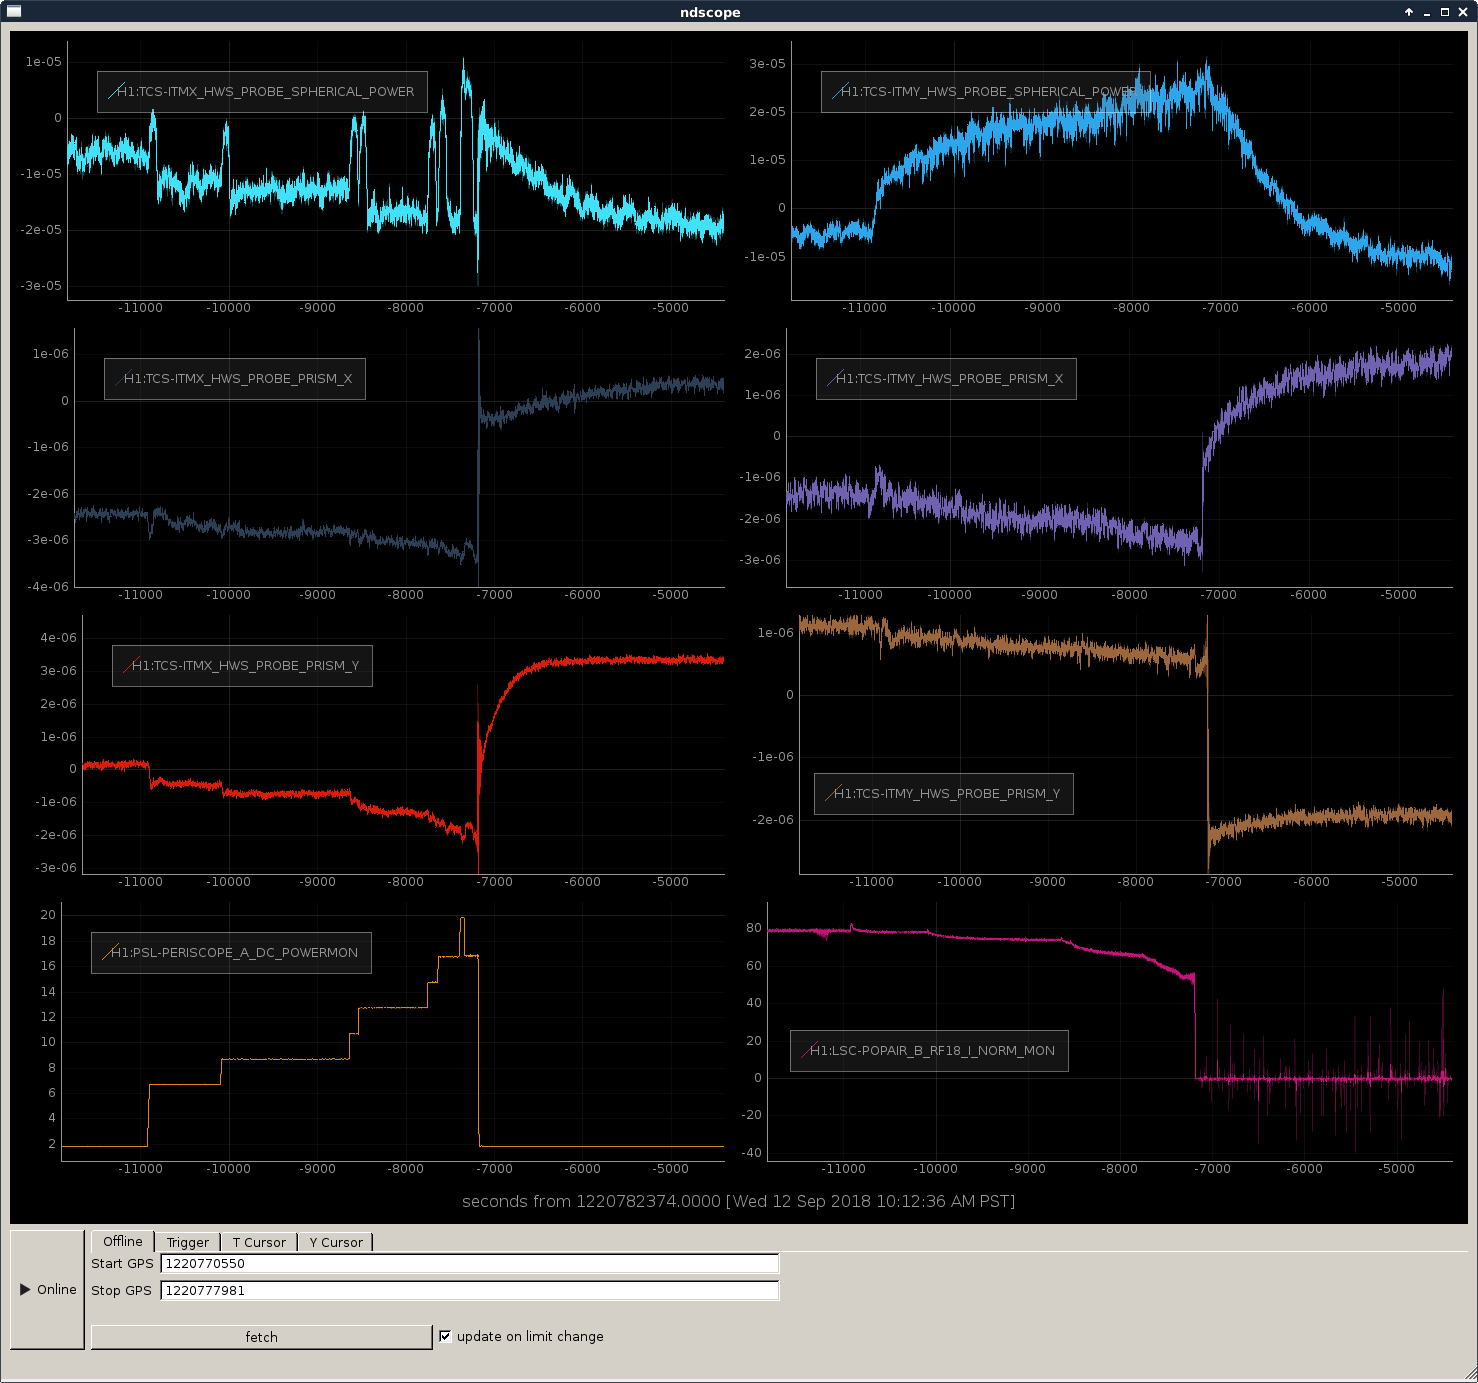
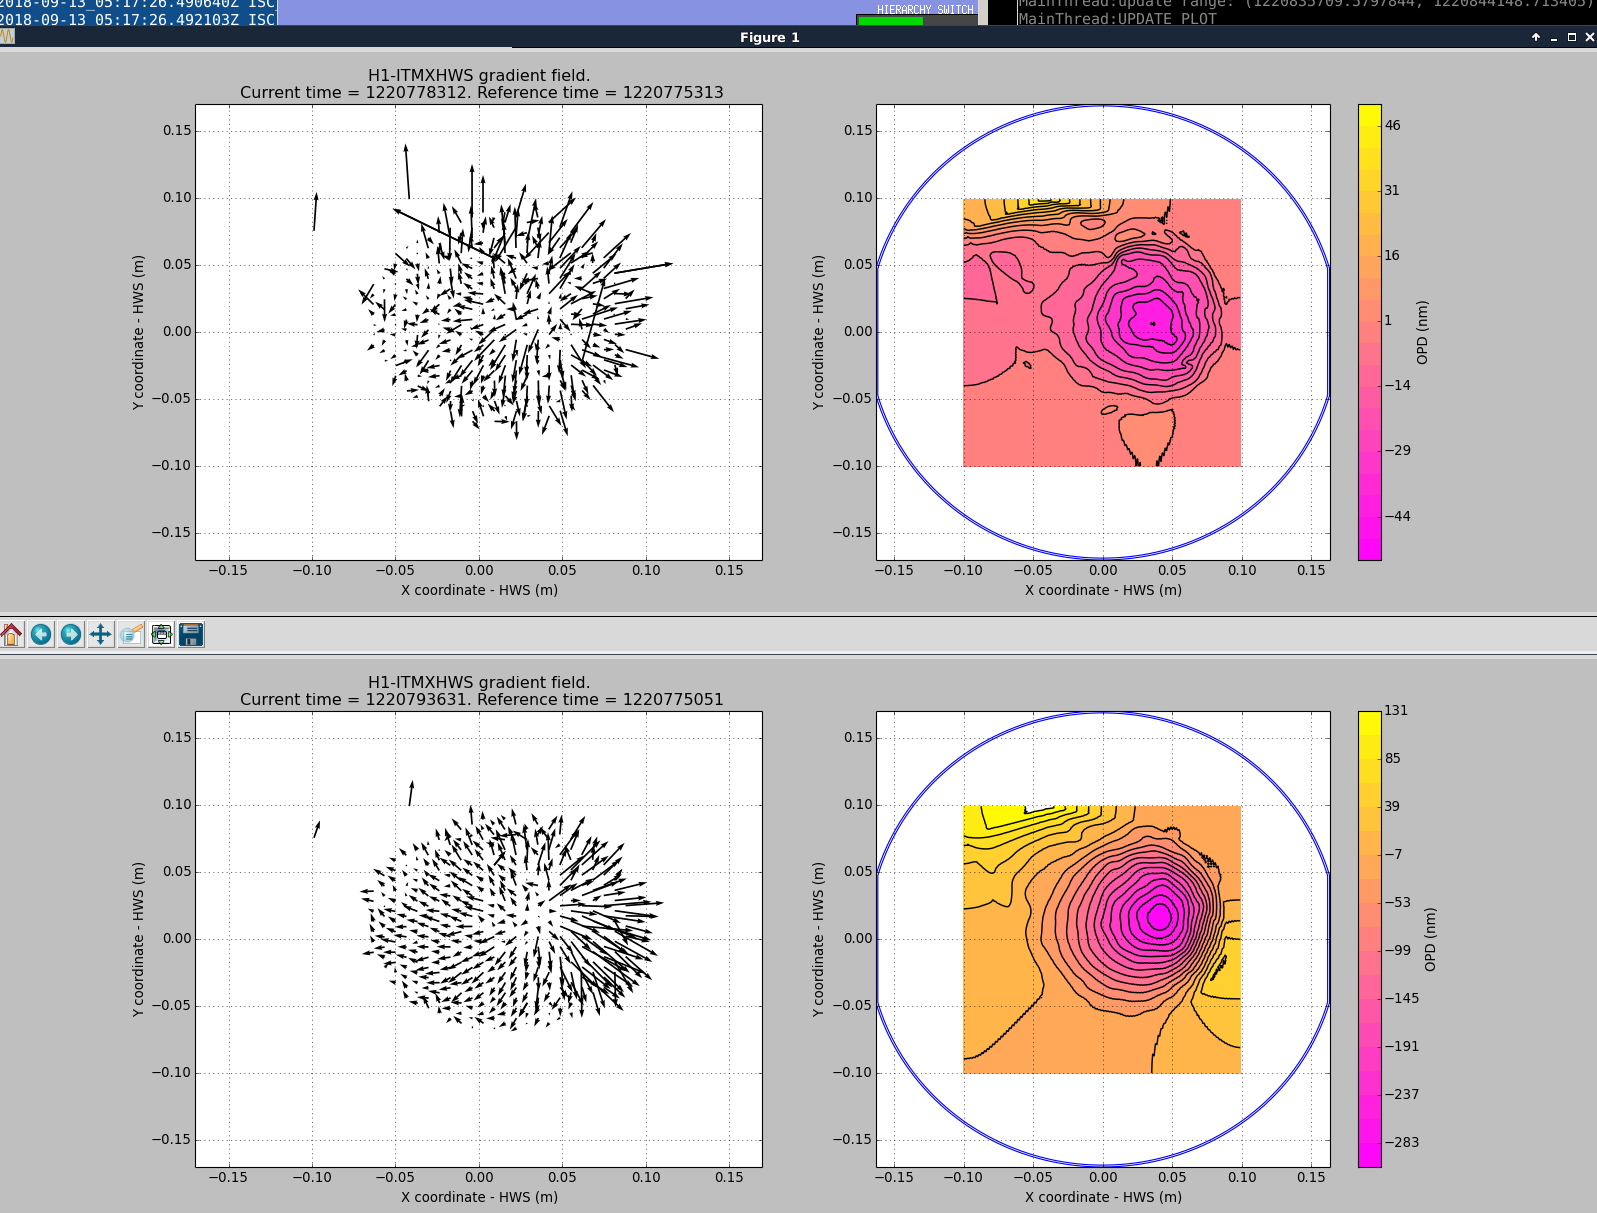
With the success of increasing the power last night to about 17 Watts input, the chance to make an absorption measurement for the ITMs became a reality and we were able to use both Hartmann sensors to extract a spherical power which we fit to a Comsol model, this technique is the same as Aidan's and Georgia's method.
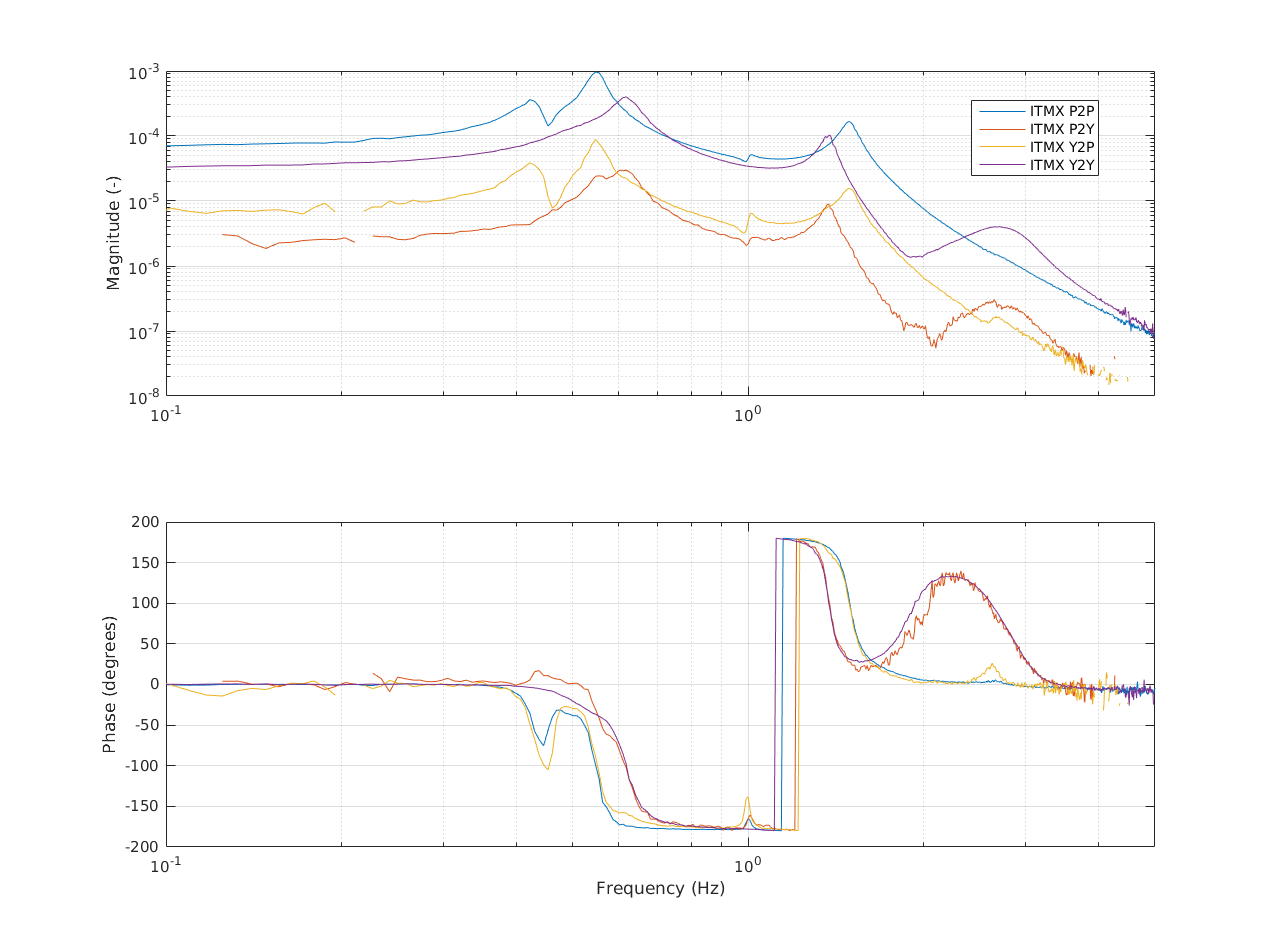
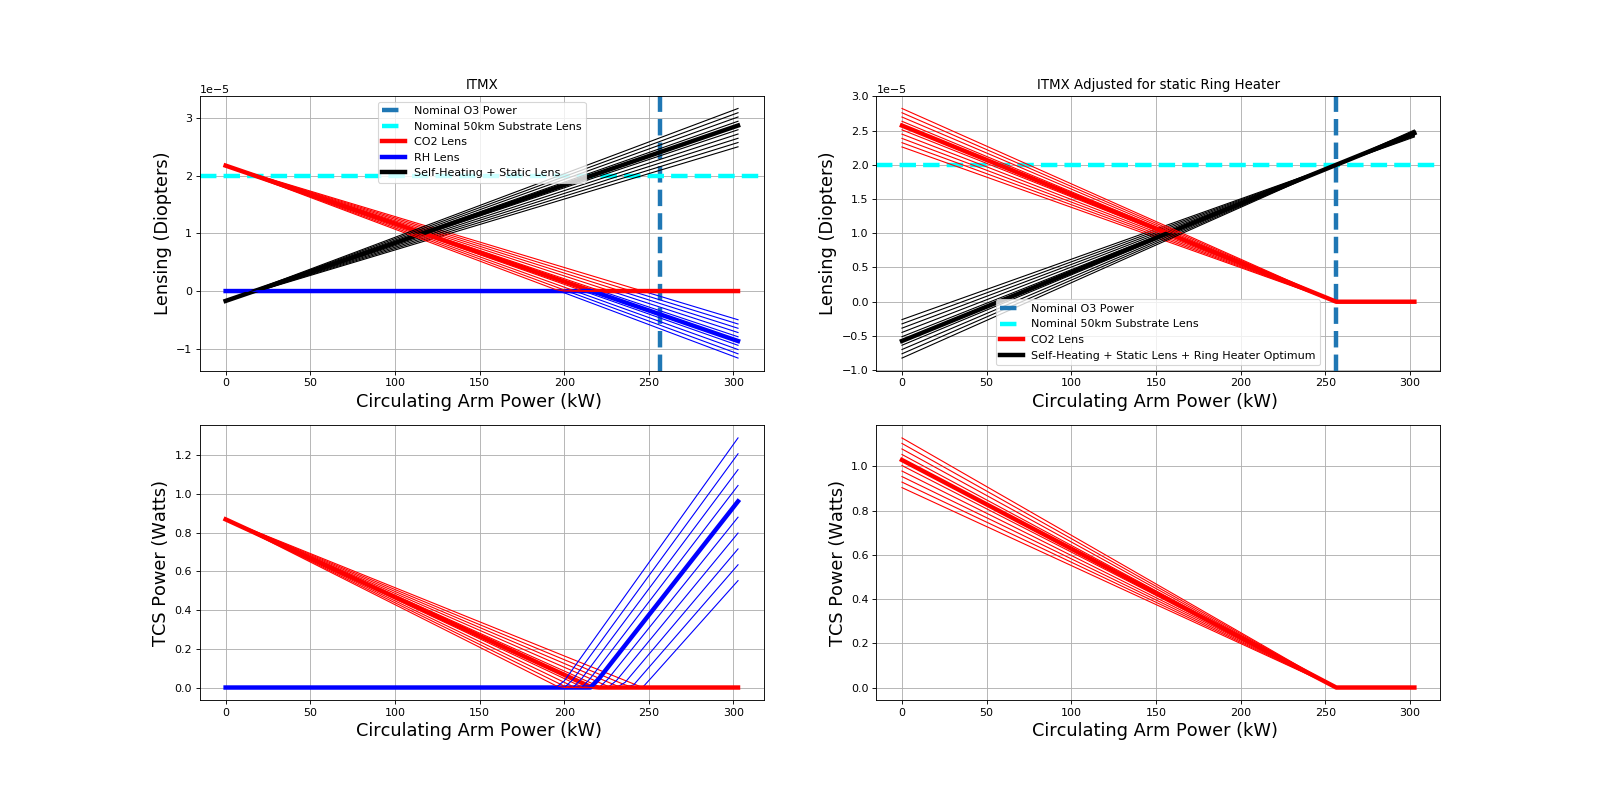
ITMX absoprtion: 206 +/- 1.8 ppb
ITMX_RH tuning for 50 Watts: 0.44 Watts Total
ITMX_CO2 pre-loading: 1.03 Watts Central
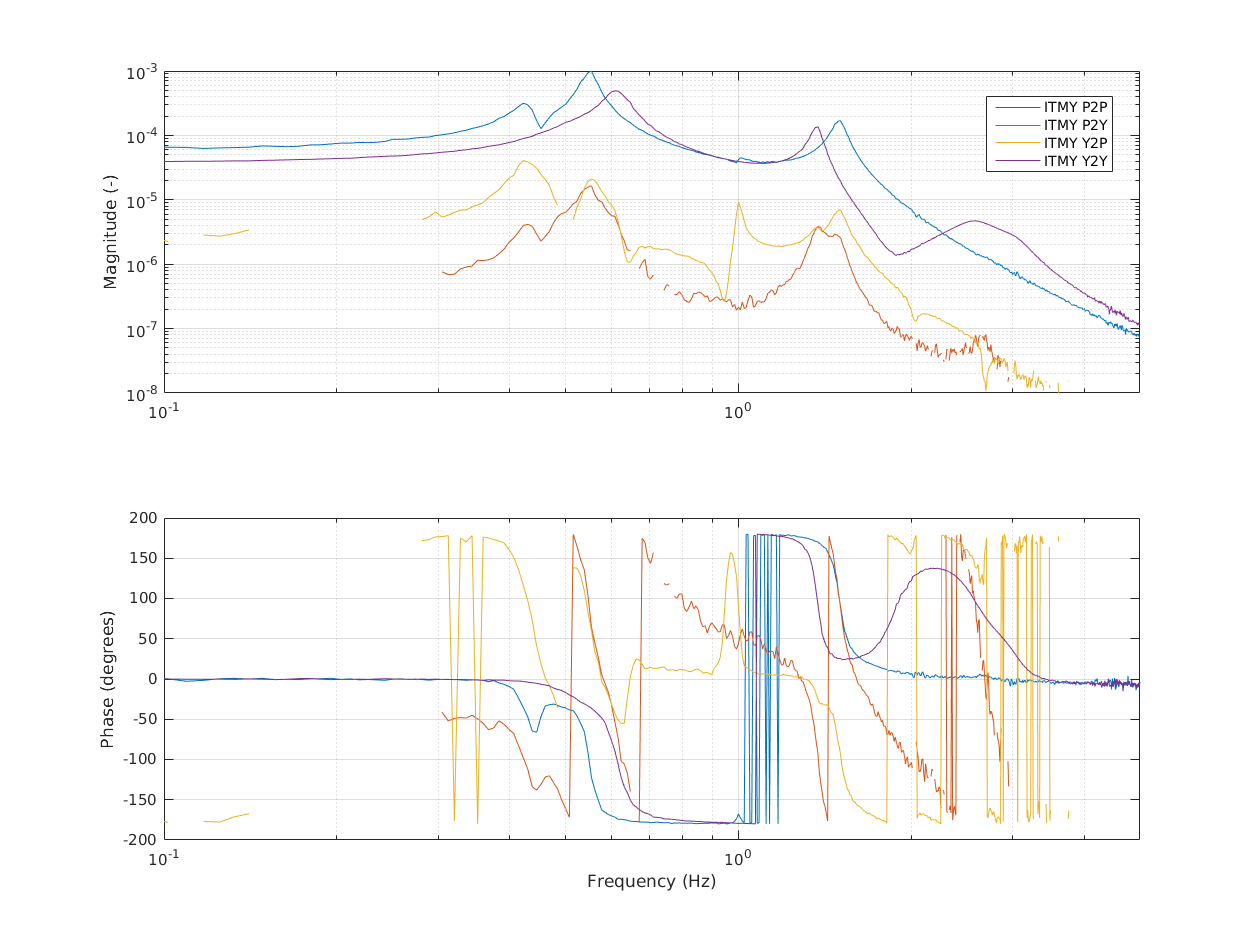
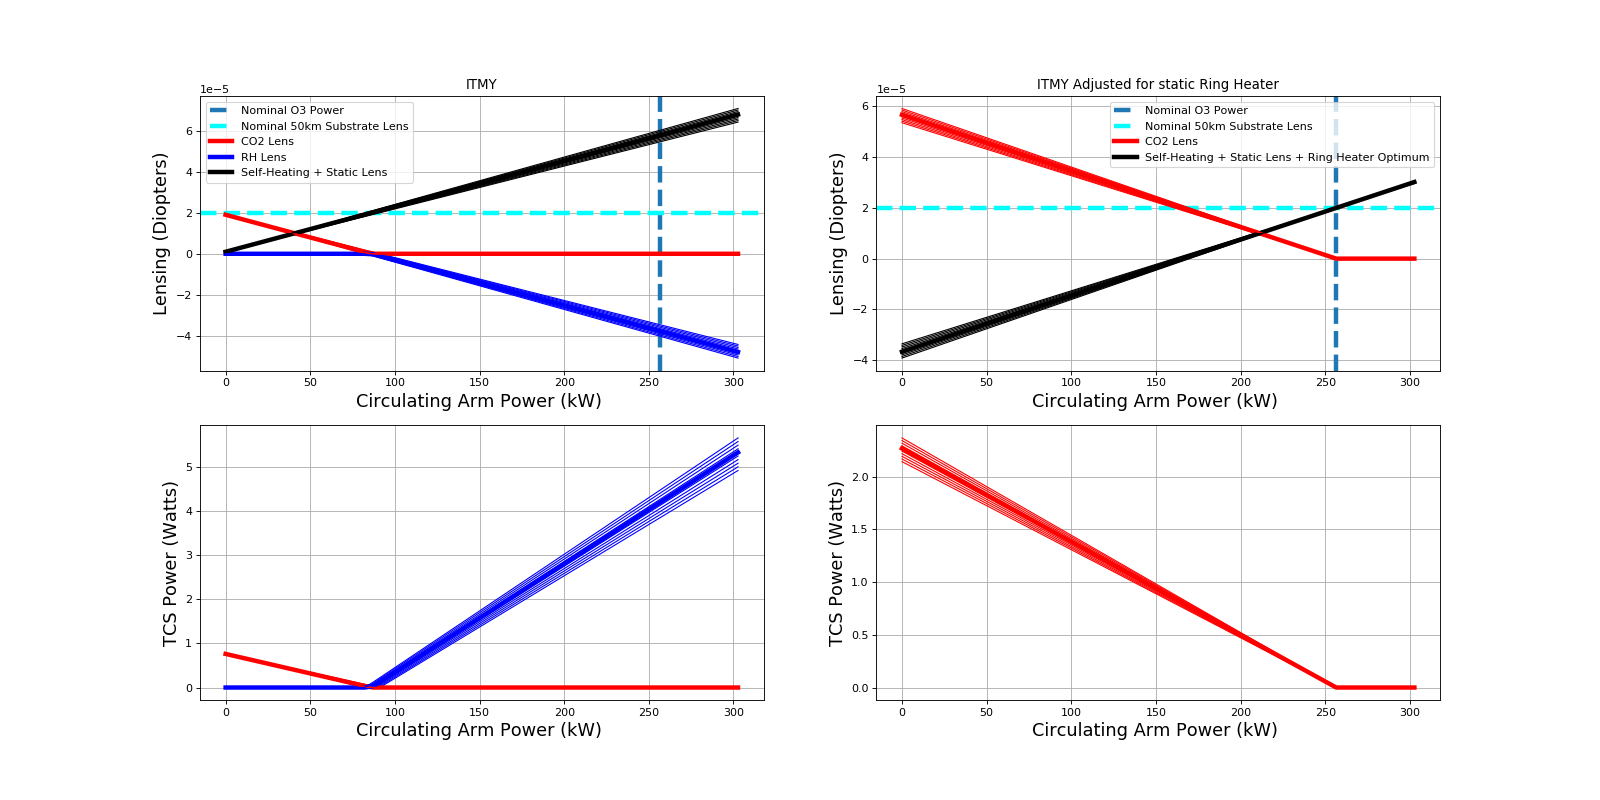
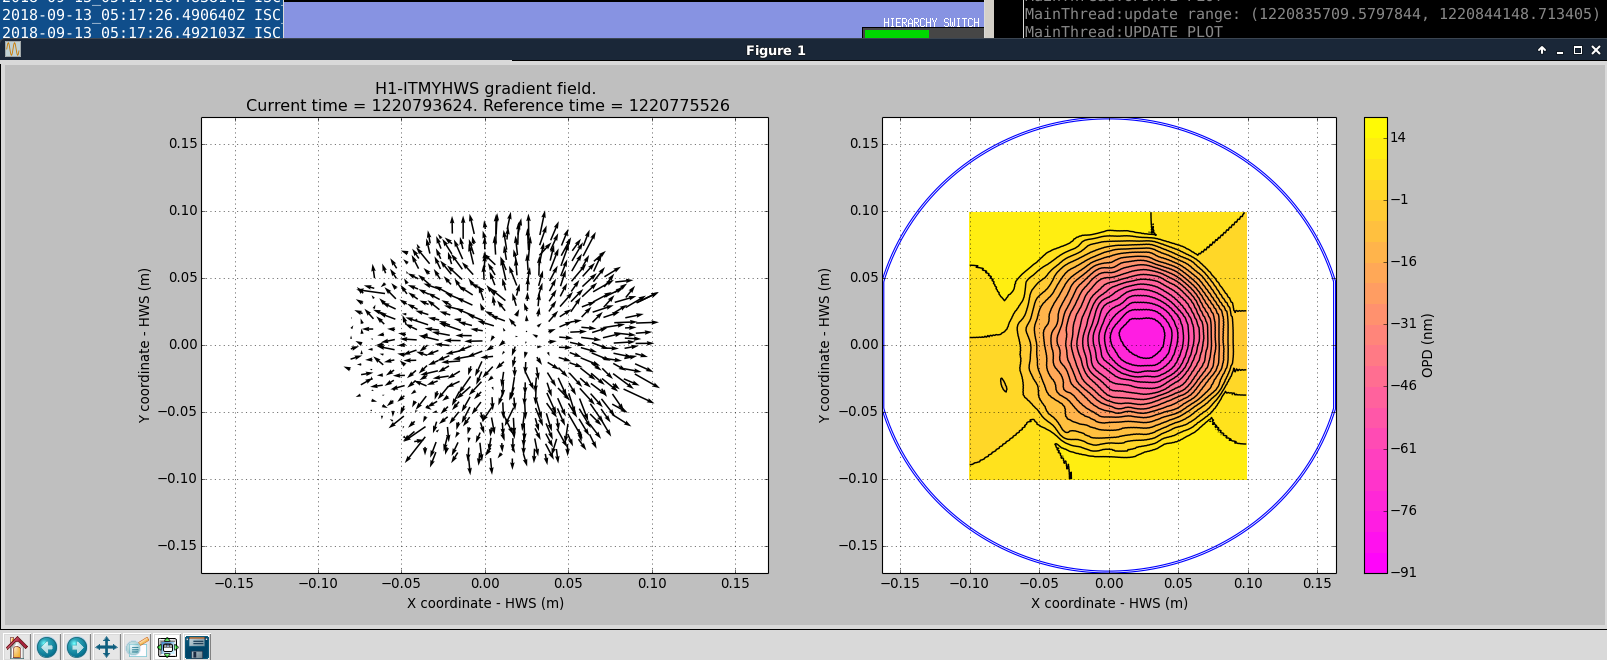
ITMY absoption: 454 +/- 1.5 ppb
ITMY_RH tuning for 50 Watts: 4.19 Watts Total
ITMY_CO2 pre-loading: 2.27 Watts Central
Plan for tomorrow:
- We'll plug in these values for the ring heater tonight, by the morning they should be relatively close to thermal equillibrium.
- Turn up the power of the CO2 lasers, and measure the simple michelson contrast defect. If it works, we should be able to lock at 2 Watts.
Details
I was hoping to figure out a way to estimate the uncertainty in this measurement but it's a little bit more involved than I thought, the method is essentially using a least squares fit to get the coefficients for the exponential decay of the thermal lens after losing lock, but the residuals seem to be pretty good which leads to about a 1% accuracy which should be taken with a large grain of salt because the absorption estimate is made by interpolating the scale of the thermal lens' exponential decay and then dividing the coefficient by the arm power in Watts. However, the arm power is an estimate as well with its own error bars which I'm still trying to figure out.
P_arm = 17 Watts * 45(PRC_Gain) * 0.5(BS) * 282(Arm_gain)
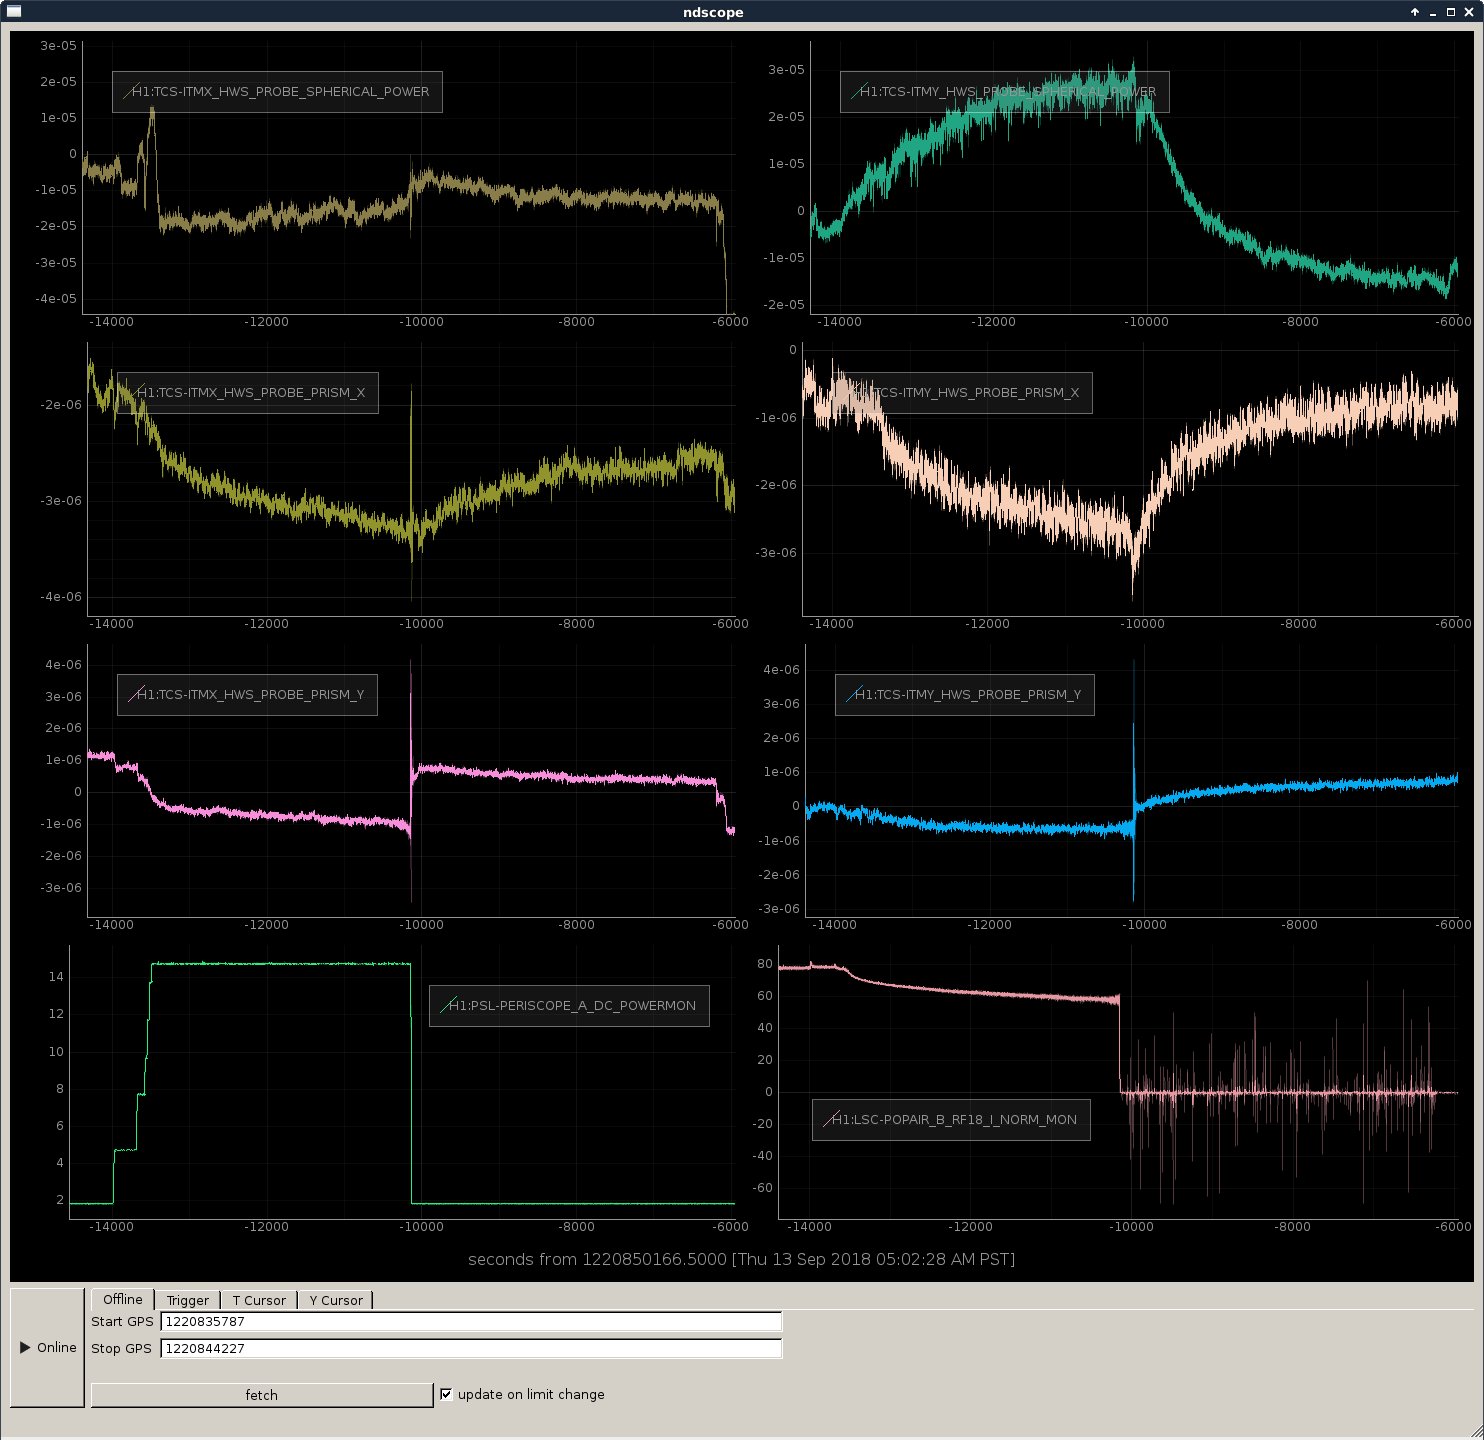
Once we got estimates for the absorption (1st and 2nd attachment), we re-ran the calculations which gave ring heater settings to compensate for the 50 Watt nominal power based off the absorption. ITMY ring heater requirement is particularly high because of excess absorption. Also to pre-load the system, the CO2 laser settings are also calculated (3rd and 4th attachment).


Hmmm, maybe I'm changing my mind. I don't think I can trust the current camera position. It's been weird like this at least as far back as the on-disk data goes (~8 days), but clearly it has been working. But, when I let the alignment loops run, the COMM beatnote wouldn't get above -17dBm. When I open the camera loop and just use the other 2 loops and put ITMX where it was when we were last locking, the COMM beatnote is back to -5dBm where it should be.
Keita pointed out to me that the rate of update is related to the exposure rate, and the Xarm exposure is set much higher than the Yarm, so the slowness is expected (why the exposures are different I don't know yet if it's an accident or intentional). The camera setpoints were changed to reflect our latest good full IFO alignment. I had mistakenly thought that we had done an initial alignment since the camera setpoints were changed (in which case someone would have caught the poor COMM beatnote, and realigned ISCT1), but looking at the guardian states, that's not true. So, this first alignment with the latest camera setpoints is just telling us that we need to realign on ISCT1.
Team TCS has the IFO right now, but if they finish or take a break to do calculations, we'll touch up the ISCT1 ALS alignment.
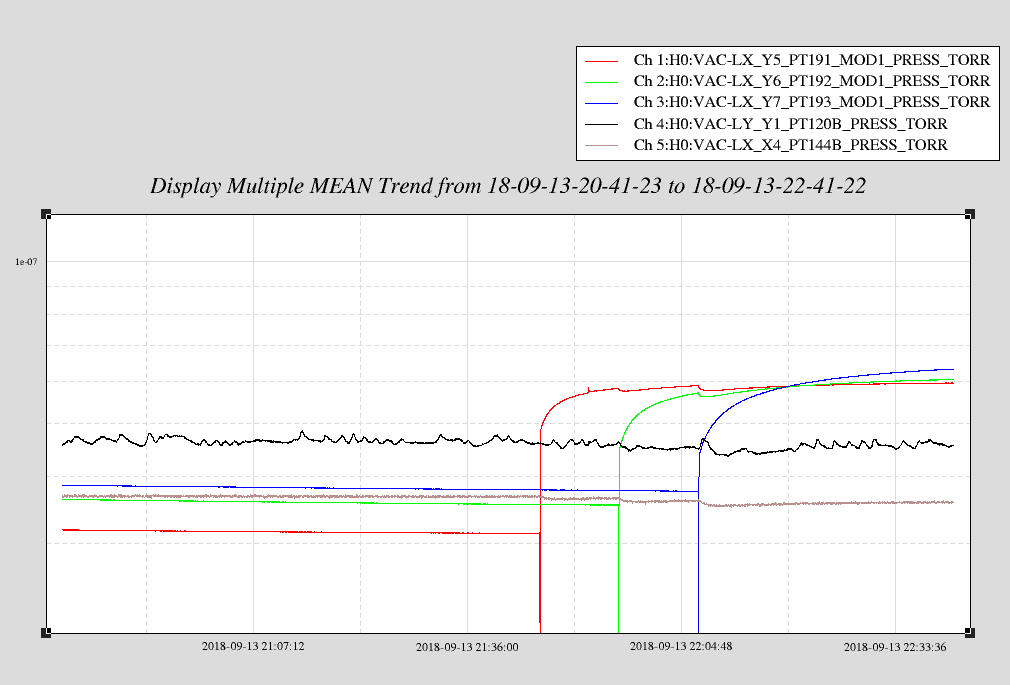
It looks like the x arm camera position was updated on Wednesday morning, but the alignment onto ISCT1 was not corrected with the picomotors in HAM3. This explains the poor comm beat note level. Attached plot shows camera references, PR gain and picomotor position over the last 5 days.
We can fix this when we next do initial alignment.