Displaying reports 45721-45740 of 88272.Go to page Start 2283 2284 2285 2286 2287 2288 2289 2290 2291 End
Reports until 09:56, Wednesday 05 September 2018
H1 SUS (ISC, SYS)
jeffrey.kissel@LIGO.ORG - posted 09:56, Wednesday 05 September 2018 (43831)
Re-Balance of H1SUSITMX PUM/L2 Stage Actuators
J. Kissel
https://tinyurl.com/LIGOSUSActuatorTuning Table

I've balanced the ITMX PUM/L2 coils using the demodulated optical lever method (LHO aLOGs 11392 and 9453).

I'll characterize in more detail later, but here're the results:
      Former          New       % Difference 100*(former-new)/former
UL   +0.909        +1.13552      -24.92%
LL   -0.965        -0.973361     -0.86642%
UR   -1.035        -1.02334      +1.1266%
LR   +1.099        +0.877201     +20.182%

These new balance values have been accepted into the SDF system.

If anyone wants to get a jump on it, I've measured broad-band transfer functions characterizing the L 2 LPY, P 2 LPY, and Y 2 LPY transfer functions for the new balance. They live in templates here:
/ligo/svncommon/SusSVN/sus/trunk/QUAD/H1/ITMX/SAGL2/Data/
2018-09-05_1602_H1SUSITMX_L2_WhiteNoise_L_0p02to50Hz.xml
2018-09-05_1602_H1SUSITMX_L2_WhiteNoise_P_0p02to50Hz.xml
2018-09-05_1602_H1SUSITMX_L2_WhiteNoise_Y_0p02to50Hz.xml
Images attached to this report
Non-image files attached to this report
H1 PSL (PSL)
peter.king@LIGO.ORG - posted 08:41, Wednesday 05 September 2018 - last comment - 11:44, Wednesday 05 September 2018(43830)
ISS work
Before touching anything, this was the state of the first loop power stabilisation with the loop disabled.
 - 0.708 W diffracted
 - AOM modulation input 0.353 V
 - REFSIGNAL on -2.00
 - AOM monitor voltage (on MEDM screen) 0.417 V
 - offset slider 8.00
 - the Transfer 1A and Transfer 1B signals displayed on the MEDM screen were fluctuating wildly
 - the pre-modecleaner transmission seemed quite stable

    The input beam alignment to the AOM looked acceptable compared to the input aperture.  The angle
of incidence of the AOM with respect to the input beam was okay.

    With the offset slider on 0, 0.289 W was diffracted.  On 8, 2.986 W was diffracted.  In both cases
the REFSIGNAL slider was moved all the way to -10.00 to take it out of the equation.  With the REFSIGNAL
slider at -2.00 (the setting it has been in for a while), something like 6.8 W was diffracted.

    My guess is that with the servo settings as they were, the BUF634 high speed buffer that drives the
AOM RF driver was in a state where the in-built thermal protection kicked on and off.  I have no hard
evidence to prove this, other than the observation that as the offset slider voltage increases, the
diffracted power is a little less stable at the milliwatt level (based on a 10 second average) and
the AOM modulation voltage starts varying by 2 mV.

    The offset slider was lowered to 5.60.  The percentage diffracted power needs to be re-calibrated.

    A couple of other observations in passing.  With the AOM monitor reading 0.385 V, a multimeter measuring
the applied AOM modulation voltage read 0.324 V with the offset slider at 5.60.  When the AOM driver was
disconnected, the multimeter read 0.488 V.  There appears to be an offset between the displayed AOM modulation
voltage and the measured one of ~20 mV.
Comments related to this report
peter.king@LIGO.ORG - 09:52, Wednesday 05 September 2018 (43832)
The spare ISS servo card needs to be tested (or re-tested as the case may be).
gabriele.vajente@LIGO.ORG - 11:44, Wednesday 05 September 2018 (43834)

[Keita, Gabriele]

The ISS second loop seems to be working fine, but the RIN with the first loop closed is higher than usual.

With the first loop on (and the second loop off), the RIN is of the order of 1e-6, while it used to be much lower.

The second loop is doing its job by suppressing the RIN, but the net effect on the power transmitted by the IMC is quite small.


Images attached to this comment
H1 ISC (ISC)
hang.yu@LIGO.ORG - posted 19:59, Tuesday 04 September 2018 - last comment - 19:30, Wednesday 05 September 2018(43827)
Designing optimal ctrl (H-inf syn) of MICH pitch

We designed an optimal controller using H-inf synthesis (see, e.g., G1501583, T1800077) for MICH PIT ASC.

In the attached plot we show the comparison for between the original (blue) and the new, optimal control filters (red). The new controller provides 6 dB more suppression in both the microseismic band ~ 0.5 Hz and 4 dB more at the earthquake band ~0.003 Hz. At the same time the high-freq row-off is similar for the two configuration (as we already put a very aggressive LP filter for MICH ASC). At around the ugf ~ 1 Hz we lose only 10 deg of phase which should not affect the loop stability.

The new filters are now put in FM4 & 8. The old FM4 was unused and FM8 was simply a cheby2("BandStop", 4, 20,83,93). We will further optimize the weighting functions as well as our knowledge of the plant to improve the filter performance.

Images attached to this report
Comments related to this report
hang.yu@LIGO.ORG - 19:30, Wednesday 05 September 2018 (43851)

We are able to lock MICH pitch with the filter designed with mu-synthesis. Relative to the previous design we modified the weighting so that the high-freq cutoff was more sharp. See the first plot. The second plot showed the MICH P error signal and control signal. Right now there is some gain peaking at 1.1 Hz. This seemed to be due to that our knowledge on the plant was not good enough and our inversion of the secondary resonant peak was a bit off. Once we get some chance to do a detailed BS plant measurement we should be able to avoid the 1.1 Hz peaking.

Images attached to this comment
H1 ISC
jenne.driggers@LIGO.ORG - posted 18:35, Tuesday 04 September 2018 - last comment - 18:05, Wednesday 05 September 2018(43826)
Changes to locking of green arms

[Keita, Jenne]

The Yarm VCO for green locking was struggling to keep the beatnote in range, so we altered the Tune Voltage limit (H1:ALS-Y_VCO_TUNELIMIT) from 5 to 7, to allow the VCO a little more leeway.  Right now, with green PDH and ALS locked, the Yarm VCO is sitting at a tune voltage of -6.3.  I don't know if this is a repercussion of the ALS lasers being tripped off last night, but the Xarm green PDH locking has been fine all day.  The lasers were both turned on around 9 or 10am, so they should be thermally equilibrated. 

Also, we were occasionally seeing oscillations in the green locking PDH servos, particularly on the Yarm.  We lowered the UGF of the tidal offloading (H1:LSC-Y_ARM_CTRL_UGF) from 0.08 Hz to 0.04 Hz, and that seems to have stopped the oscillations.  We lowered the Xarm UGF so that the 2 arms match.

However, we are still struggling to hold the arms on resonance.  We're just flopping over the resonance pretty quickly.  This is likely related to the ISS problems that we've been having all day.  (Right now the first loop is just off, which is better than having it on and oscillate.)  For the rest of the evening, we can work on things like DRMI ASC commissioning.  In the morning, PeterK will continue his diagnosis and debugging of the ISS first loop.

Comments related to this report
jenne.driggers@LIGO.ORG - 18:05, Wednesday 05 September 2018 (43847)

We reverted this change to the tidal UGFs, since that problem wasn't happening today, but other things were (see alog by Craig), and we wanted to get as close to our old nominal settings as possible.

H1 ISC (ISC)
craig.cahillane@LIGO.ORG - posted 18:32, Tuesday 04 September 2018 - last comment - 20:28, Tuesday 04 September 2018(43824)
IMC Error Signal Spike at 53.4 kHz
I took an IMC spectrum at the MC servo board while ALS_COMM and CARM have been down today.  There's a spike at 53.4 kHz.  Not clear to me what's causing this.

Edit: It's gain peaking.  Attached IMC OLG.  Adjusted IMC_power_adjust_func() in ISC_library.py to give 3 dB less gain and put the IMC UGF at around 25 kHz where we have heaps of phase margin.
Non-image files attached to this report
Comments related to this report
craig.cahillane@LIGO.ORG - 20:28, Tuesday 04 September 2018 (43828)
I actually brought the IMC servo board IN1 Gain down 6 dB (from 23 dB to 17 dB at 2 watts input power) because there was still significant peaking with a 3 dB reduction.
New IMC spectrum/OLG posted.  

IMC UGF = 21 kHz

This low of frequency suppression could have implications down the road, from direct coupling to DARM to vertex LSC noise coupling.  More quantitative statements are forthcoming.
Non-image files attached to this comment
H1 ISC
gabriele.vajente@LIGO.ORG - posted 18:14, Tuesday 04 September 2018 (43822)
More on CHARD/DHARD YAW response

Summary (aka TLDR)

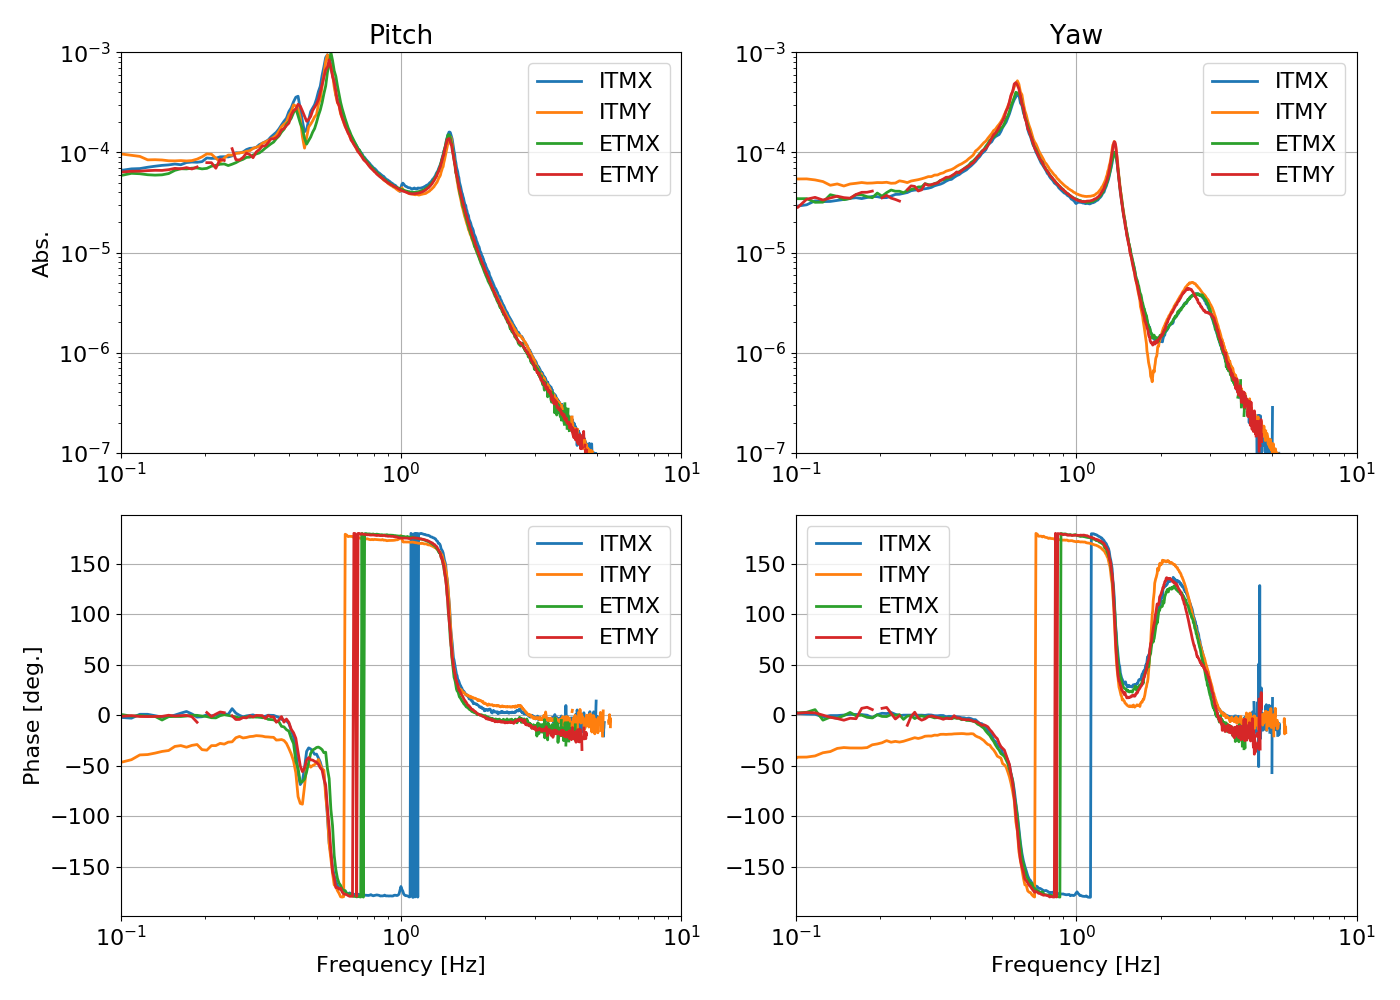
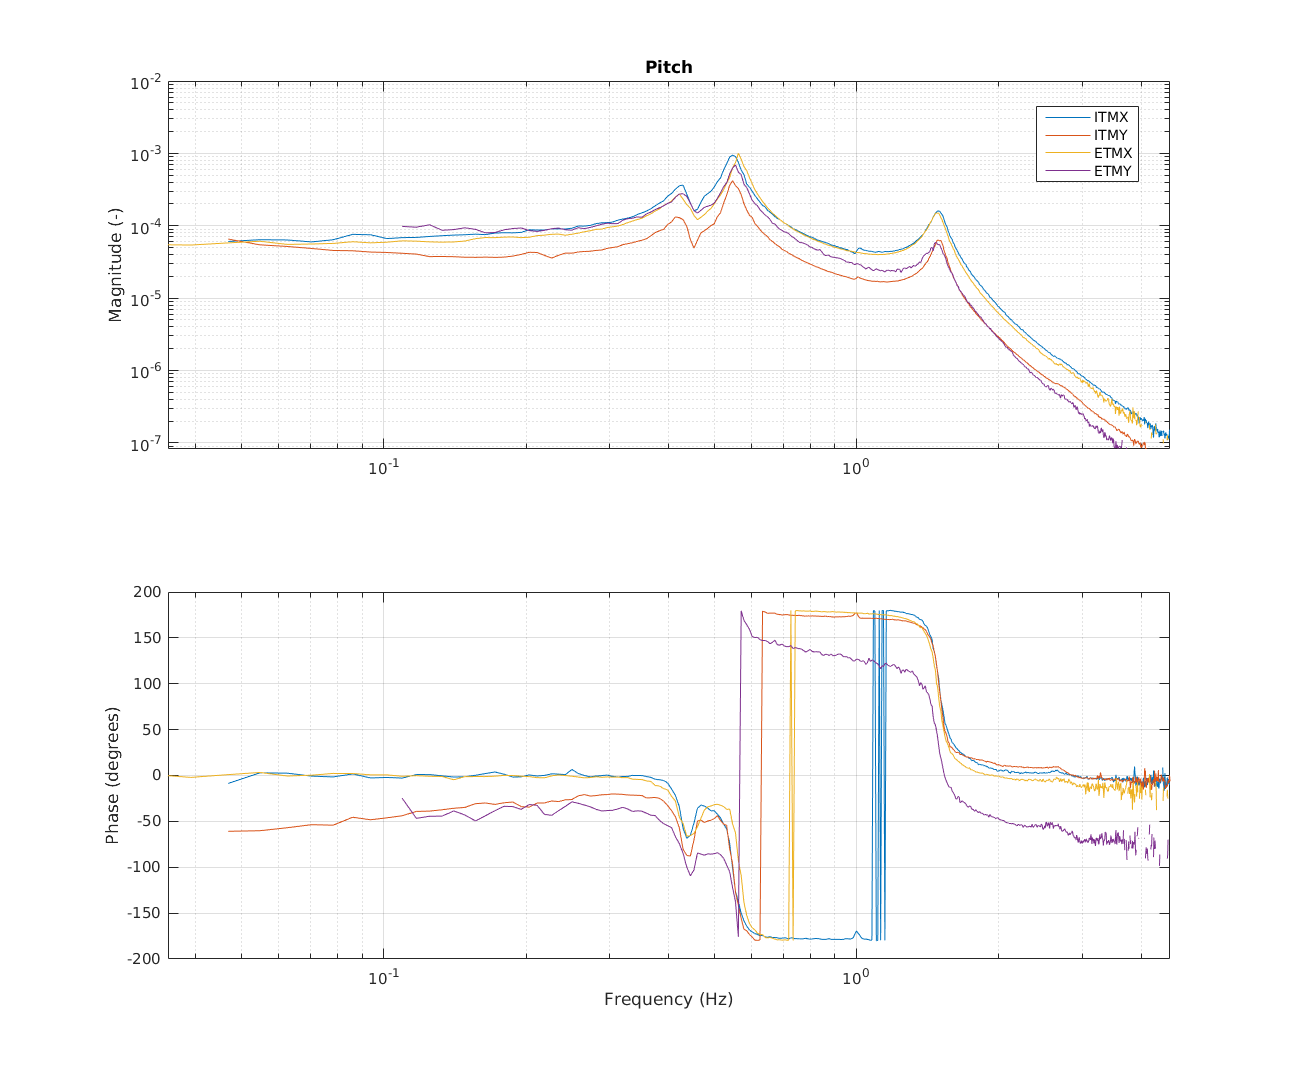
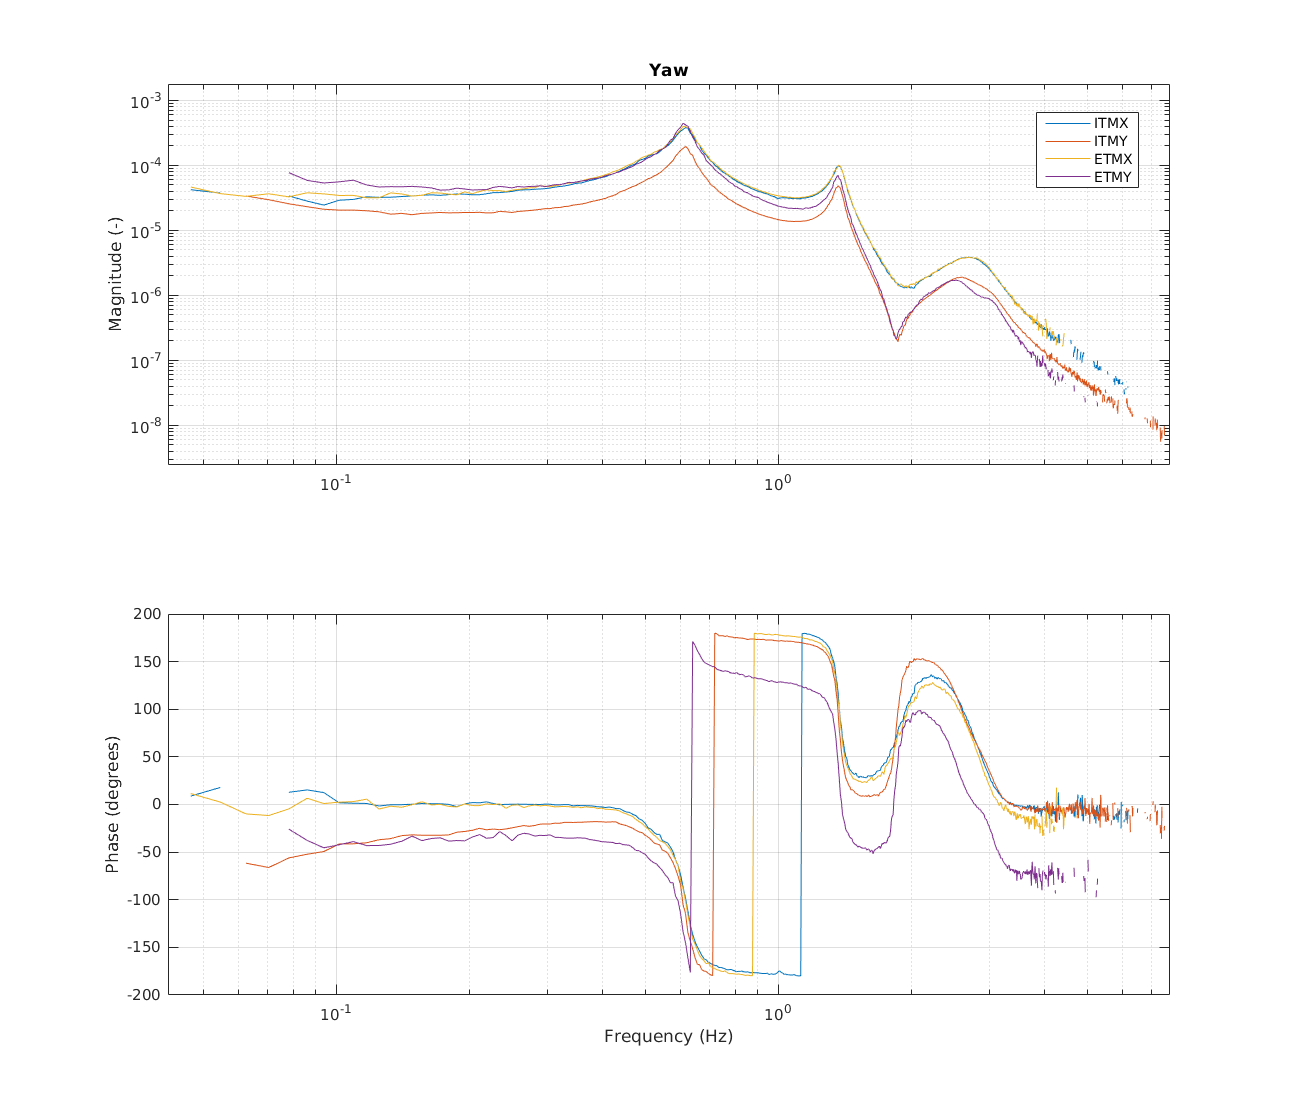
Updated single test mass responses

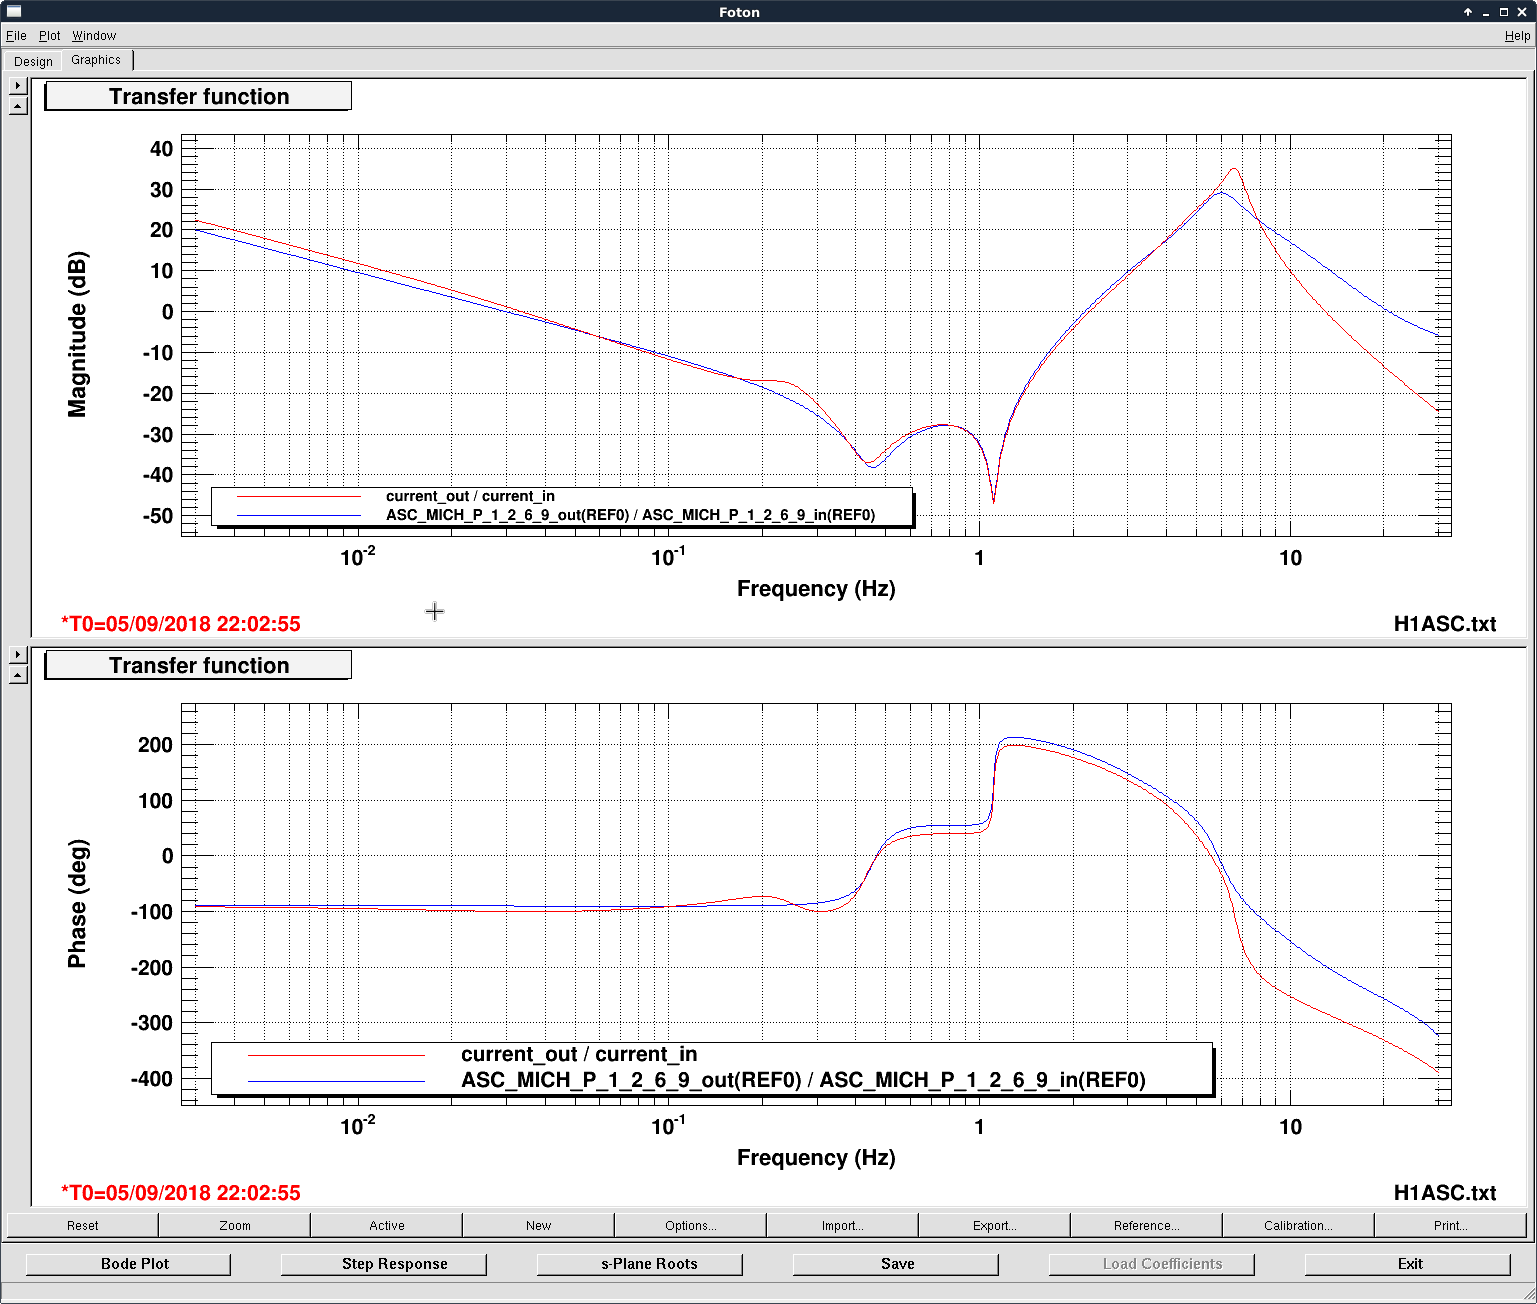
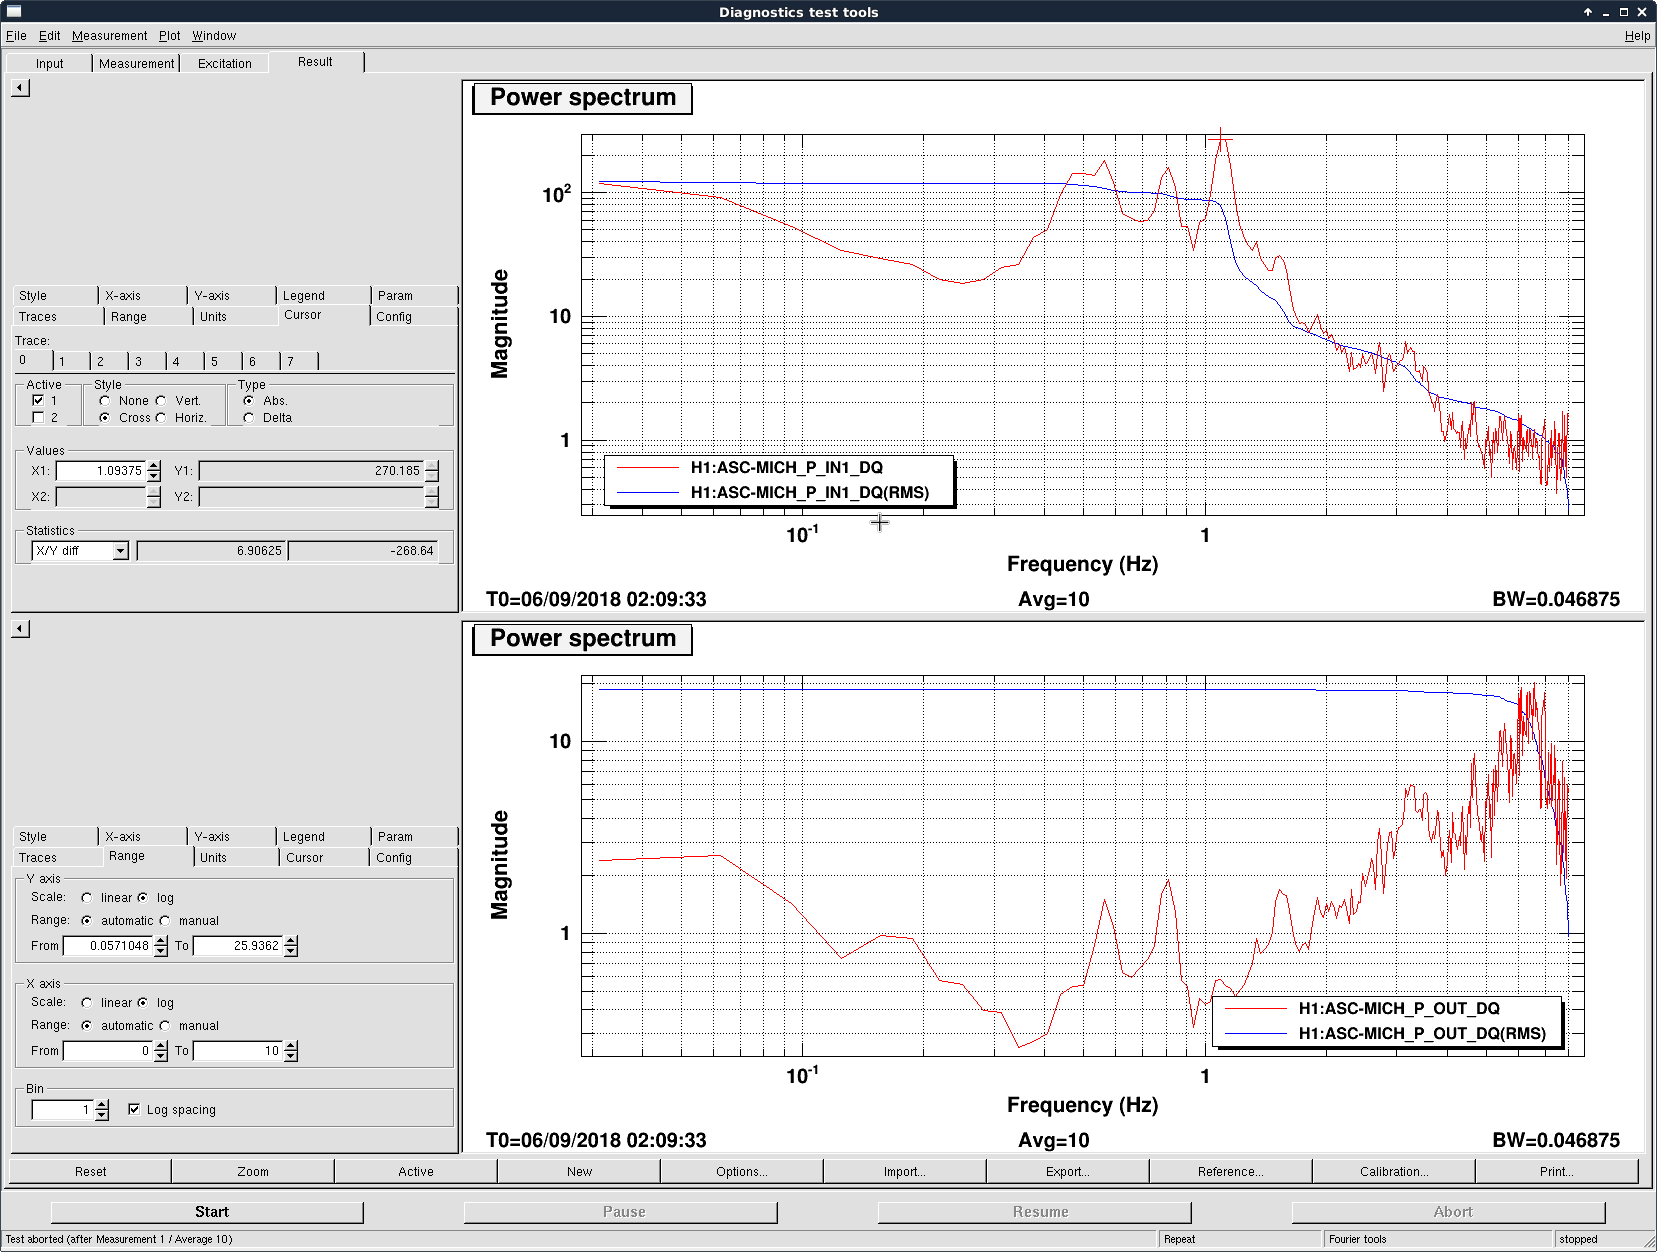
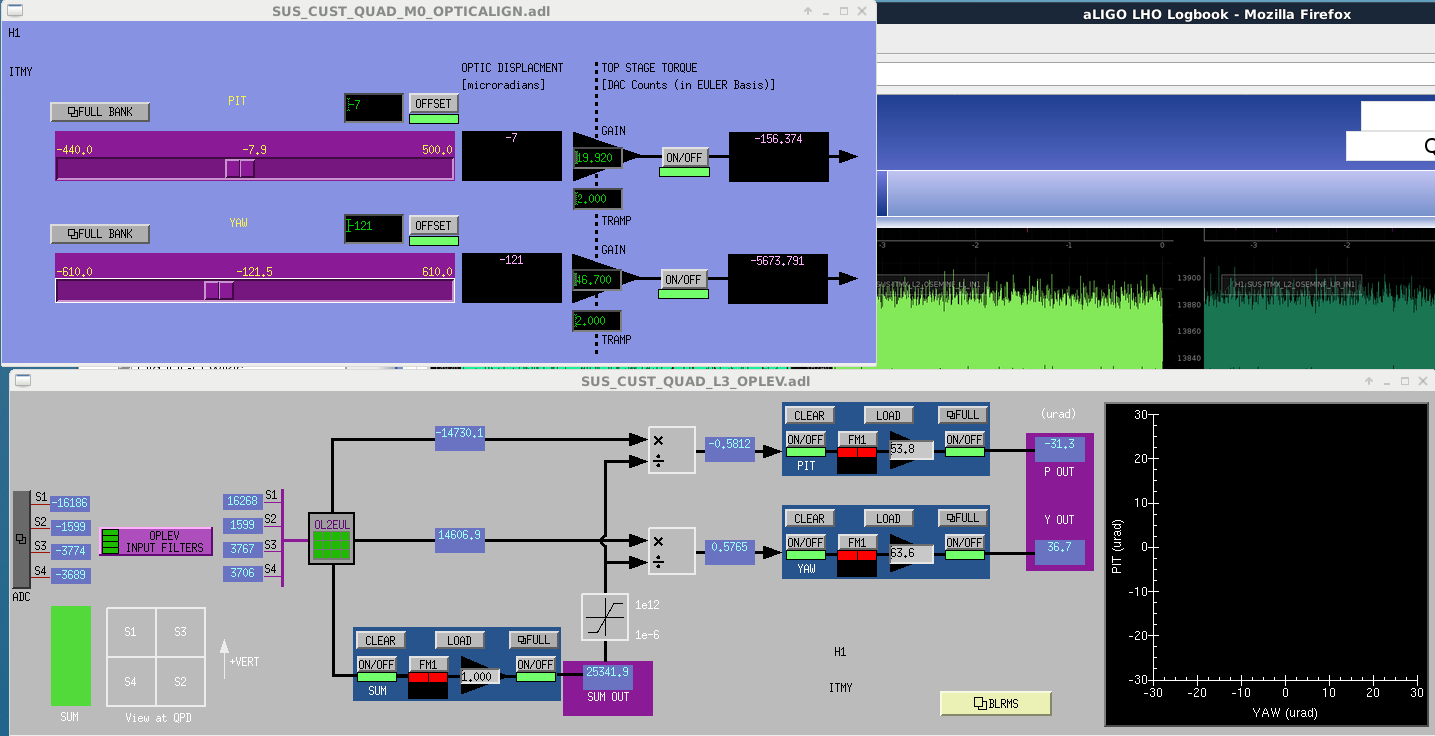
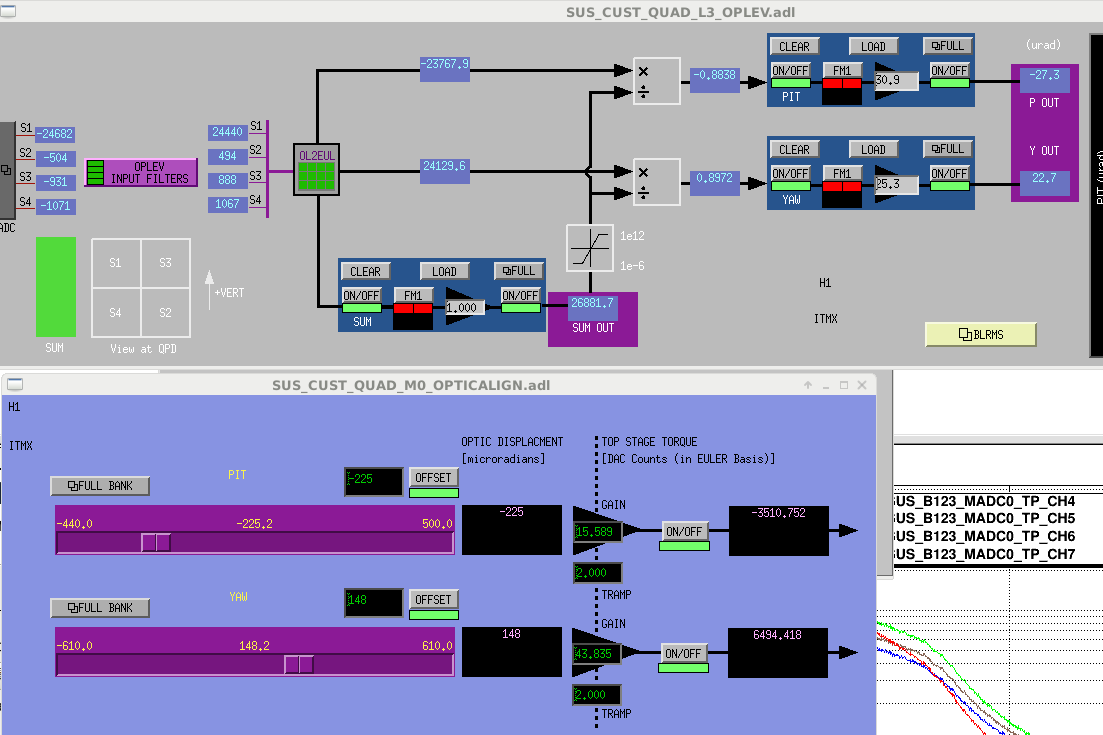
This afternoon I measured again the ETMY picth and yaw response, after the whitening was fixed. Now ETMY behave like all other test masses. Also, Sheila checked that the ITMY optical level calibration was wrong by a factor of roughly 2 (see 43816). Now the response in pitch and yaw of all four test masses is consistent. As a reminder, this response is measured by acting on each suspension individually, and injecting at the same point where the ASC control signal is entering the suspension model. Therefore the measurements below are good starting point to build the hard and soft degrees of freedom plants.


Reconstruction of hard and soft d.o.f.s

The reconstruction happens in three steps. First of all I copied the actuation matrixes from the ASC screen:

#           DHARD  DSOFT  CHARD CSOFT
Mat_PIT = [[-0.87,  1.00, -0.87,  1.00],   # ITMX
           [ 0.87, -1.00, -0.87,  1.00],   # ITMY
           [ 1.00,  0.87,  1.00,  0.87],   # ETMX
           [-1.00, -0.87,  1.00,  0.87]]   # ETMY

#           DHARD  DSOFT  CHARD CSOFT
Mat_YAW = [[ 0.87,  1.00,  0.87,  1.00],   # ITMX
           [ 0.87,  1.00, -0.87, -1.00],   # ITMY
           [ 1.00, -0.87,  1.00, -0.87],   # ETMX
           [ 1.00, -0.87, -1.00,  0.87]]   # ETMY

Then I computed the geometrical combination of ITM and ETM motions that gives the soft and hard d.o.f.s. To do this, I computed the eigenvectors of the stiffness matrix of Sidles and Sigg. The angular conventions used in the paper are different from those used in the suspension. So for pitch the soft mode corresponds to a motion +ITM +ETM (meaning that both angles of the mirrors increases in value), while the hard mode corresponds to +ITM -ETM. In yaw the suspension convention for the angles is different, so we have that soft is +ITM -ETM and hard is +ITM +ETM.

Using this convention and the eigenvectors, I could build the geometrical matrix that convert the mirror motions to the d.o.f.s.
PITCH =
[[-0.247  0.247  0.285 -0.285]
[ 0.285 -0.285  0.247 -0.247]
[-0.247 -0.247  0.285  0.285]
[ 0.285  0.285  0.247  0.247]]
YAW =
[[ 0.247  0.247  0.285  0.285]
[ 0.285  0.285 -0.247 -0.247]
[ 0.247 -0.247  0.285 -0.285]
[ 0.285 -0.285 -0.247  0.247]]

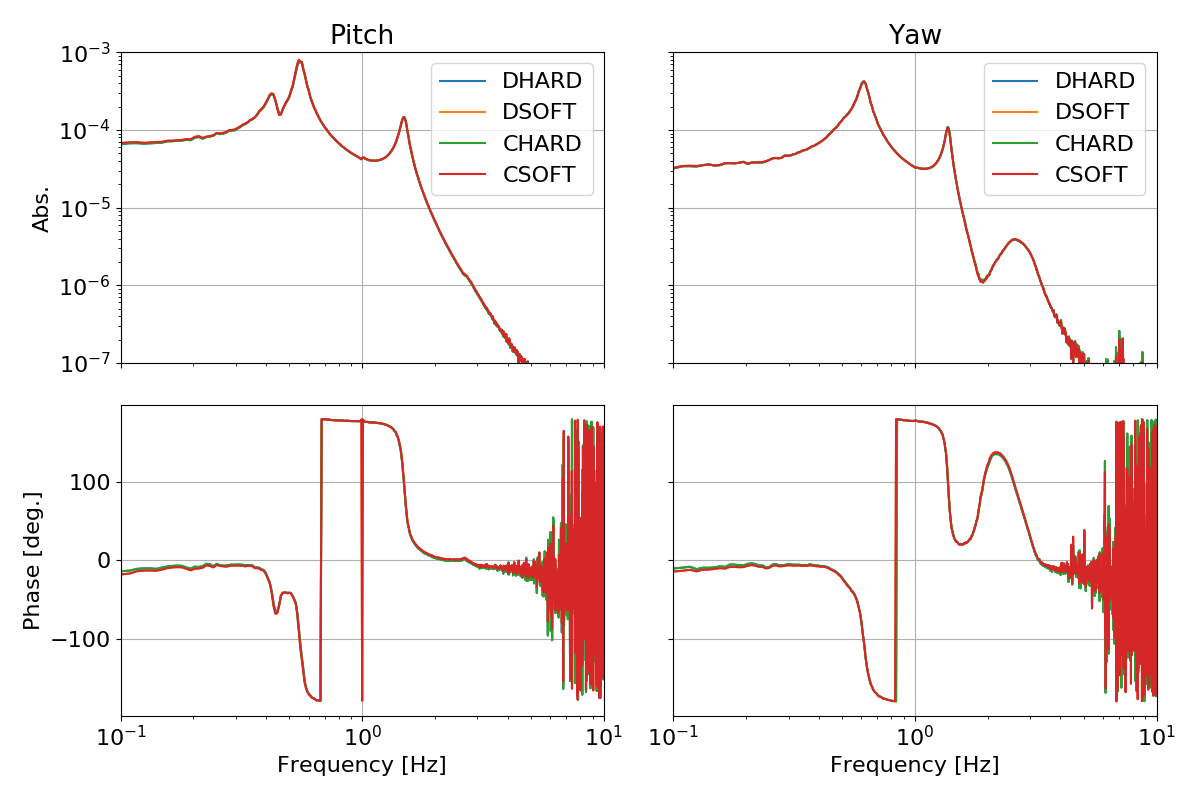
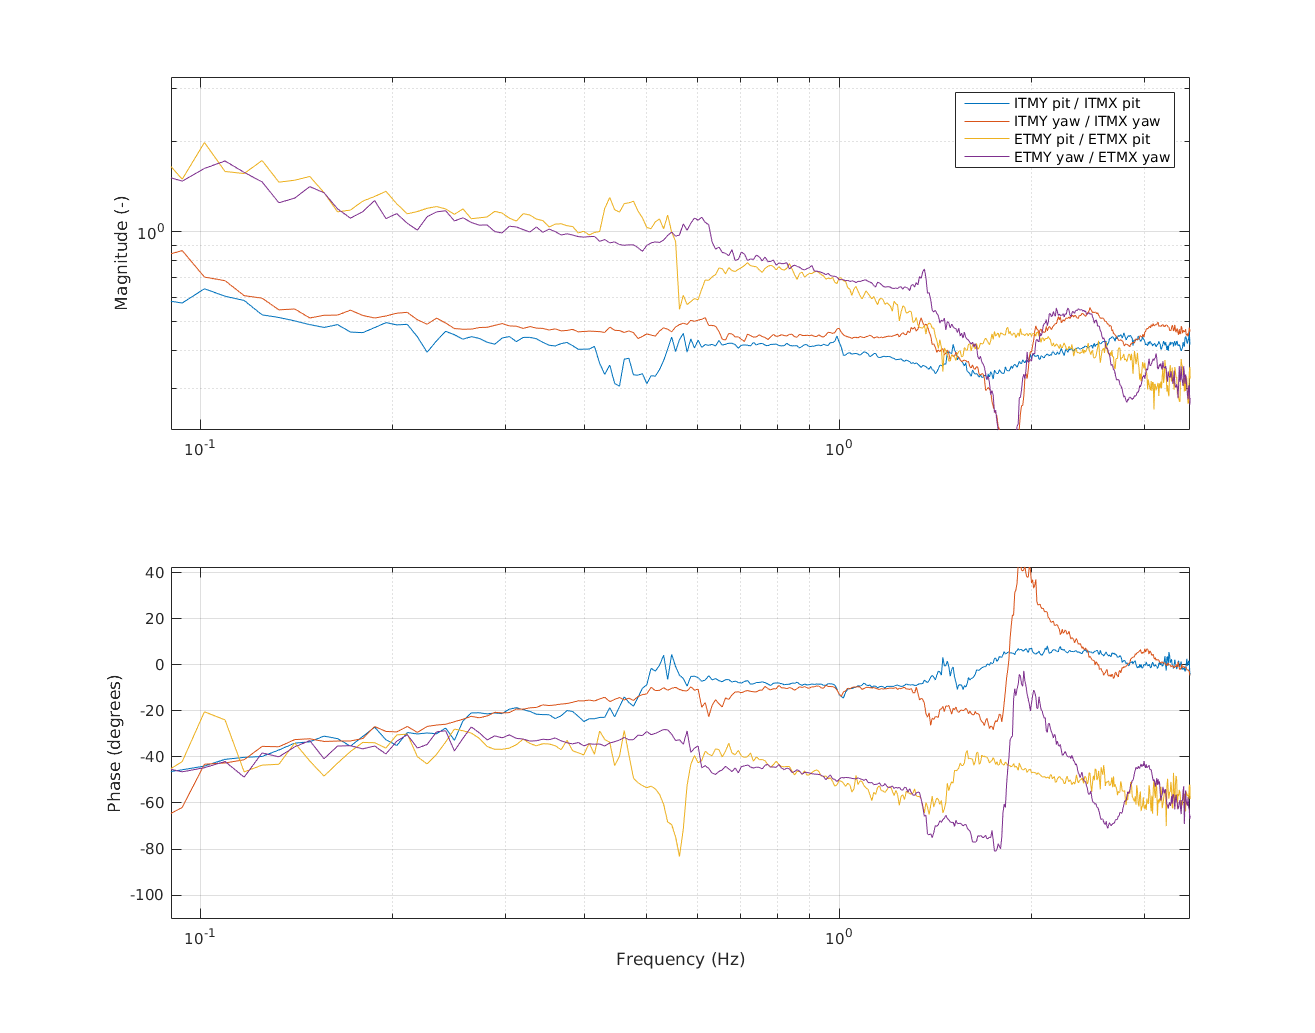
I checked that by multiplying the driving matrix with my geometrical matrix I get a unity matrix. So our driving is consistent with the geometrical definition of soft/hard and common/differential, provided that all test masses have exactly the same response function.

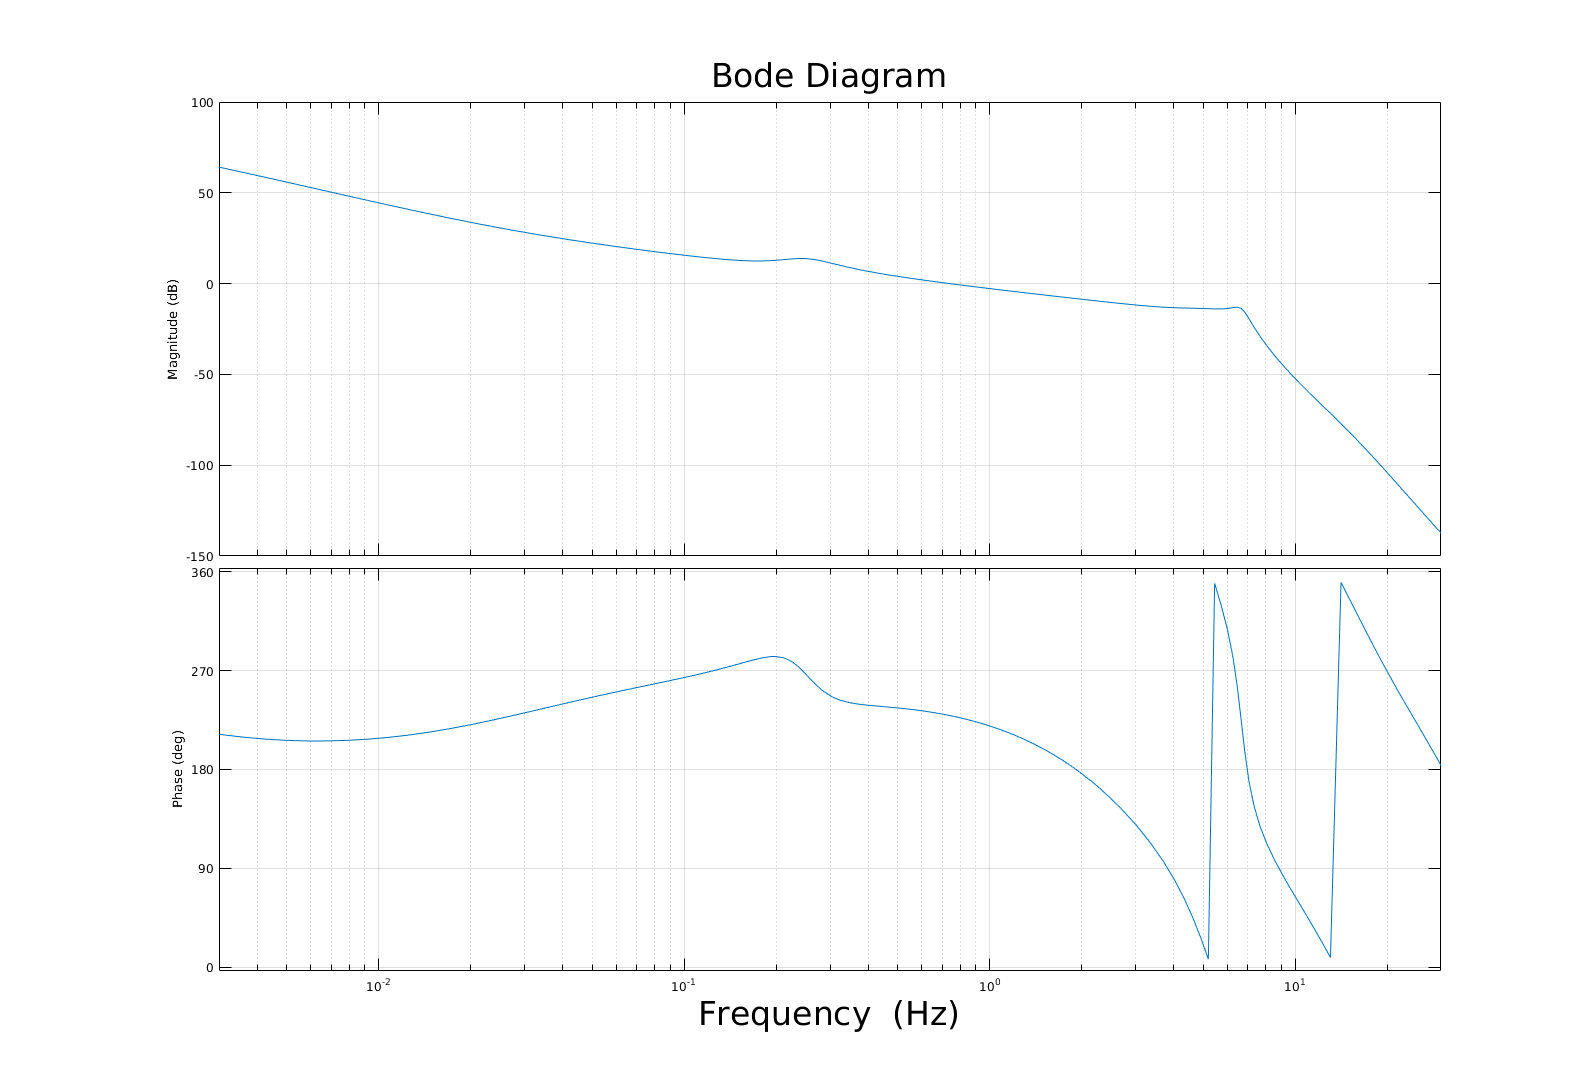
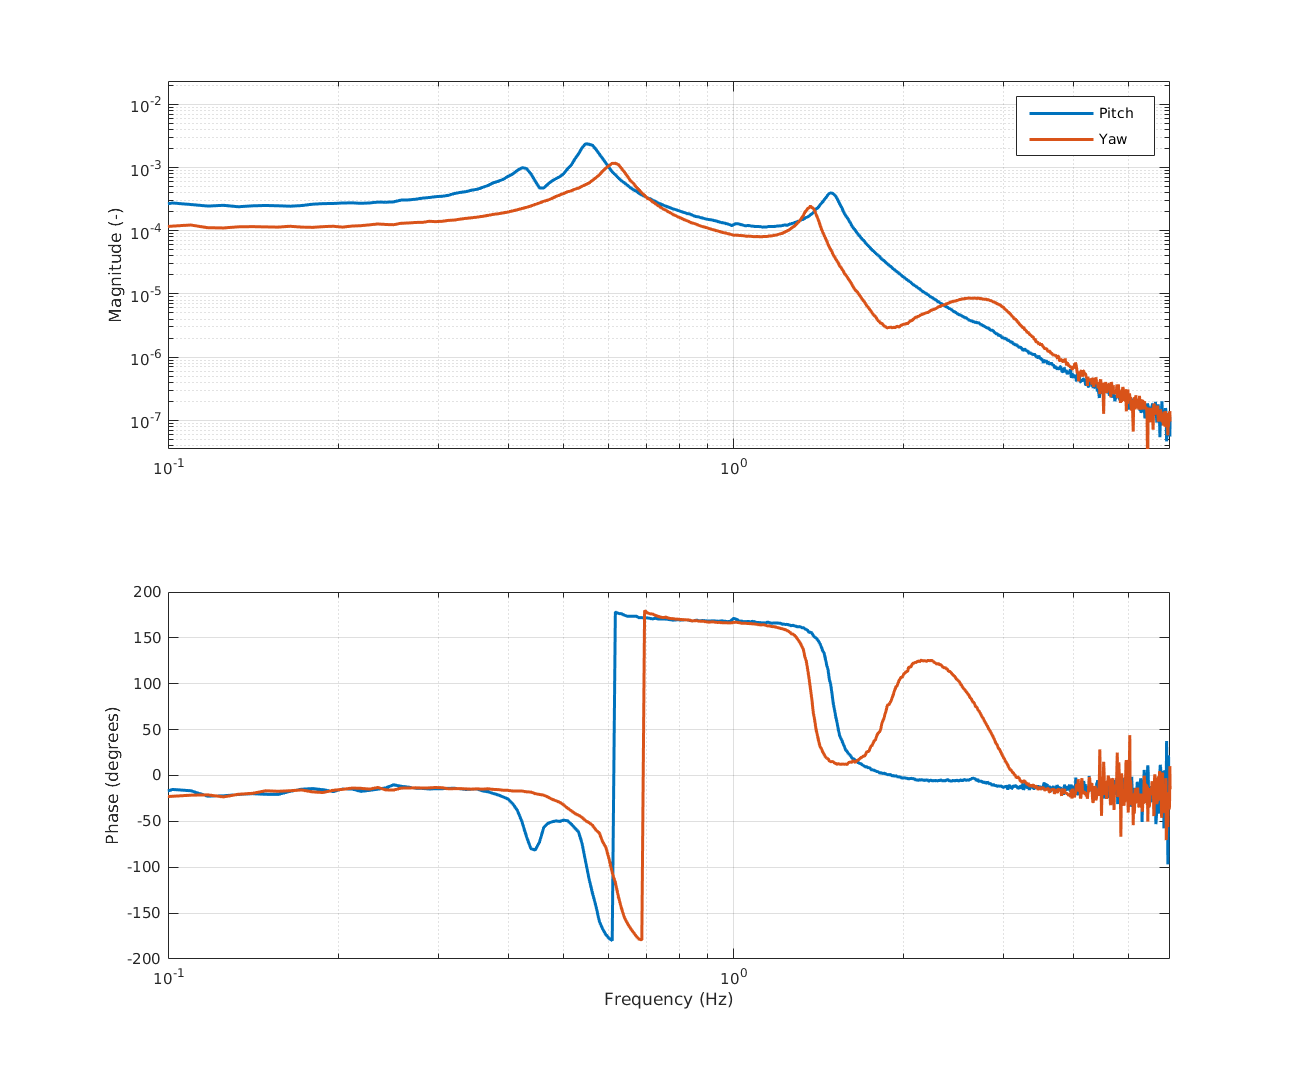
Using those results and the measurements, I can now compute the transfer function from driving of each d.o.f. to motion of each other d.o.f. The two plots below show that the actuation should be quite diagonal (left is pitch, right is yaw)


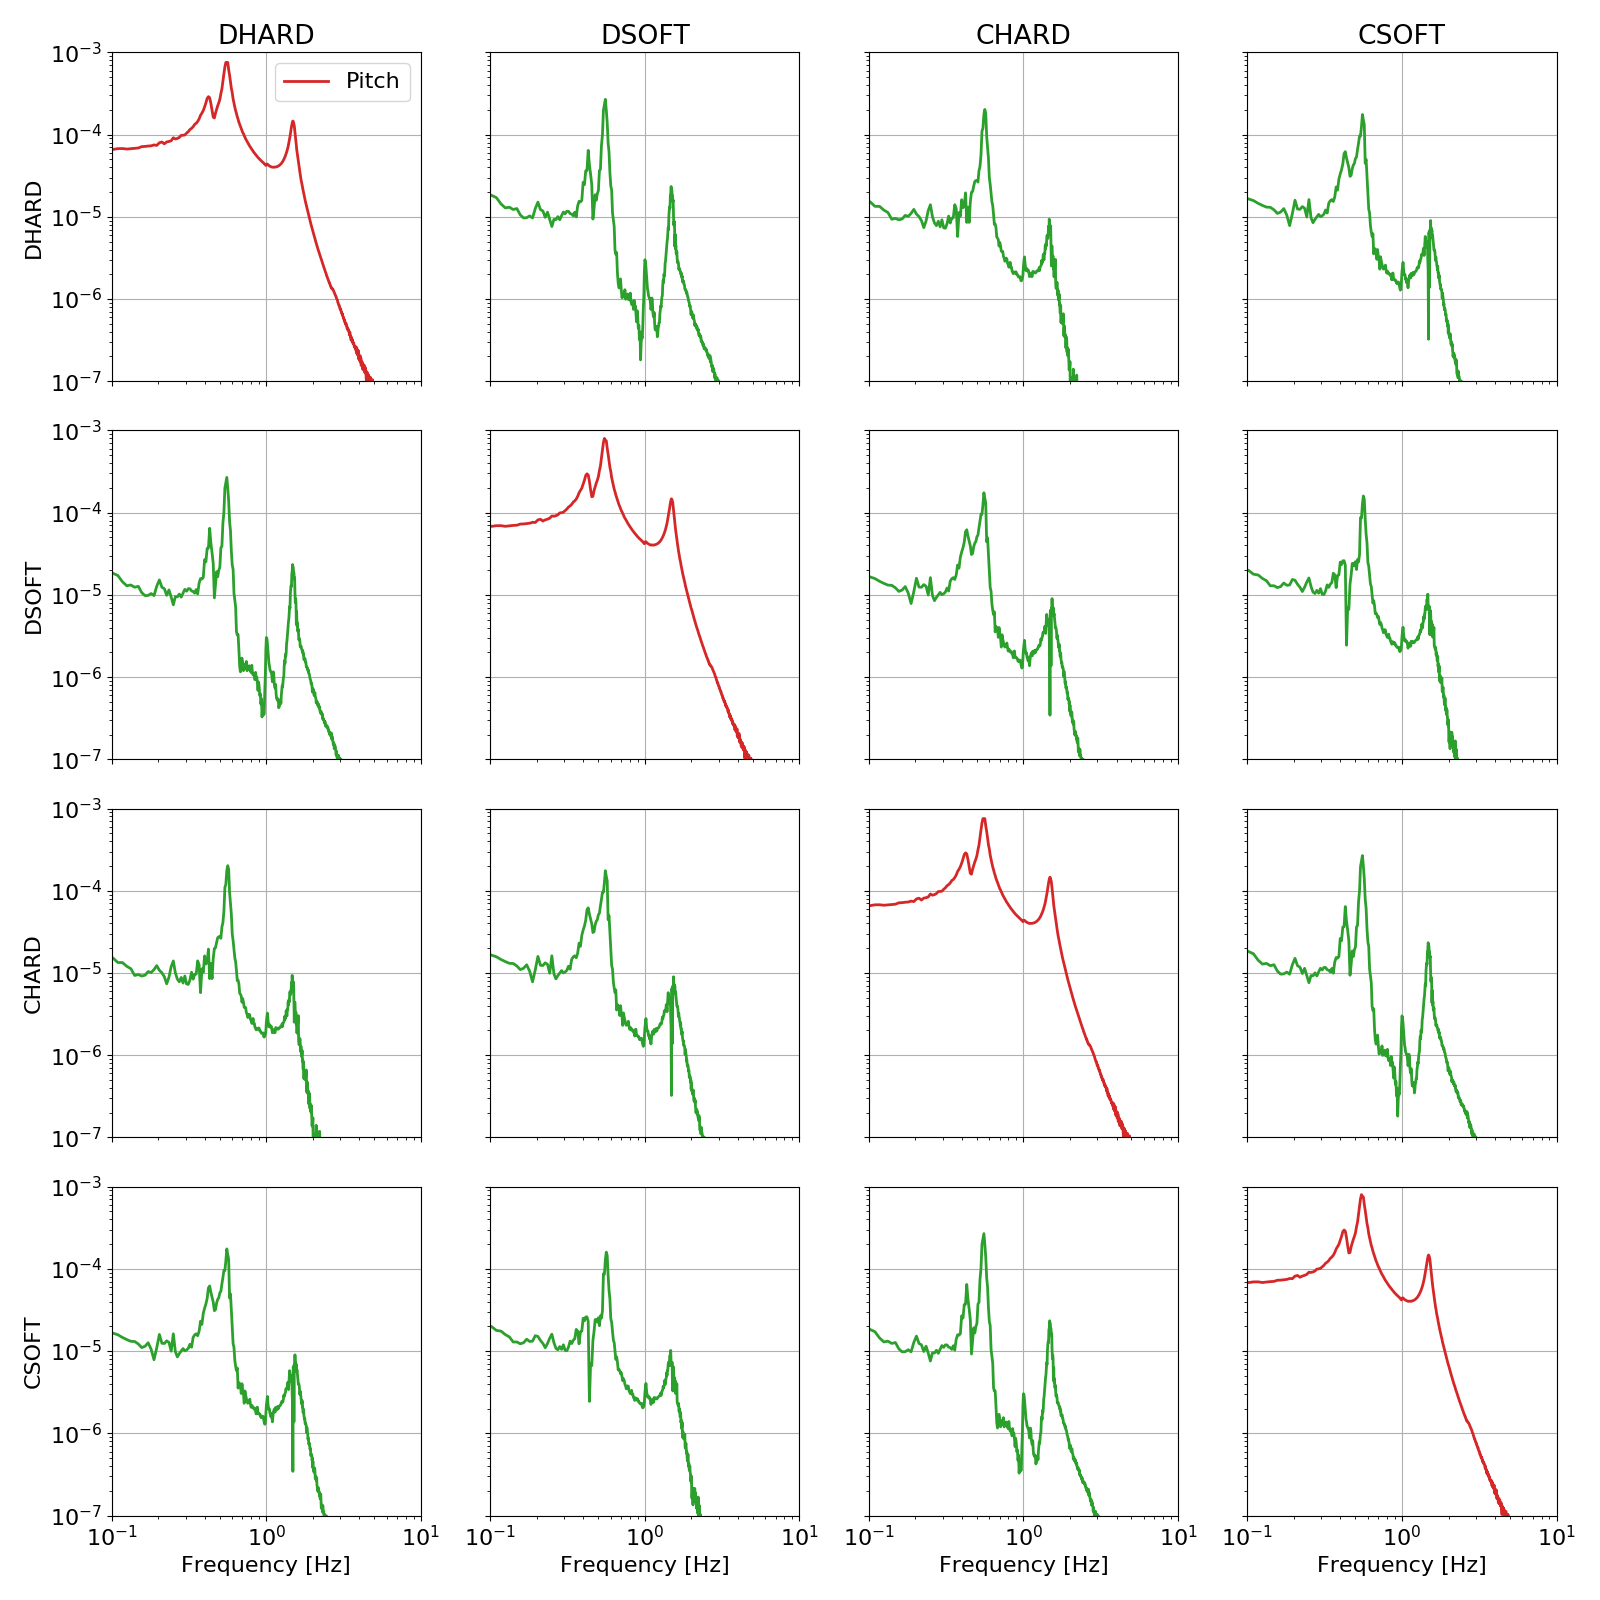
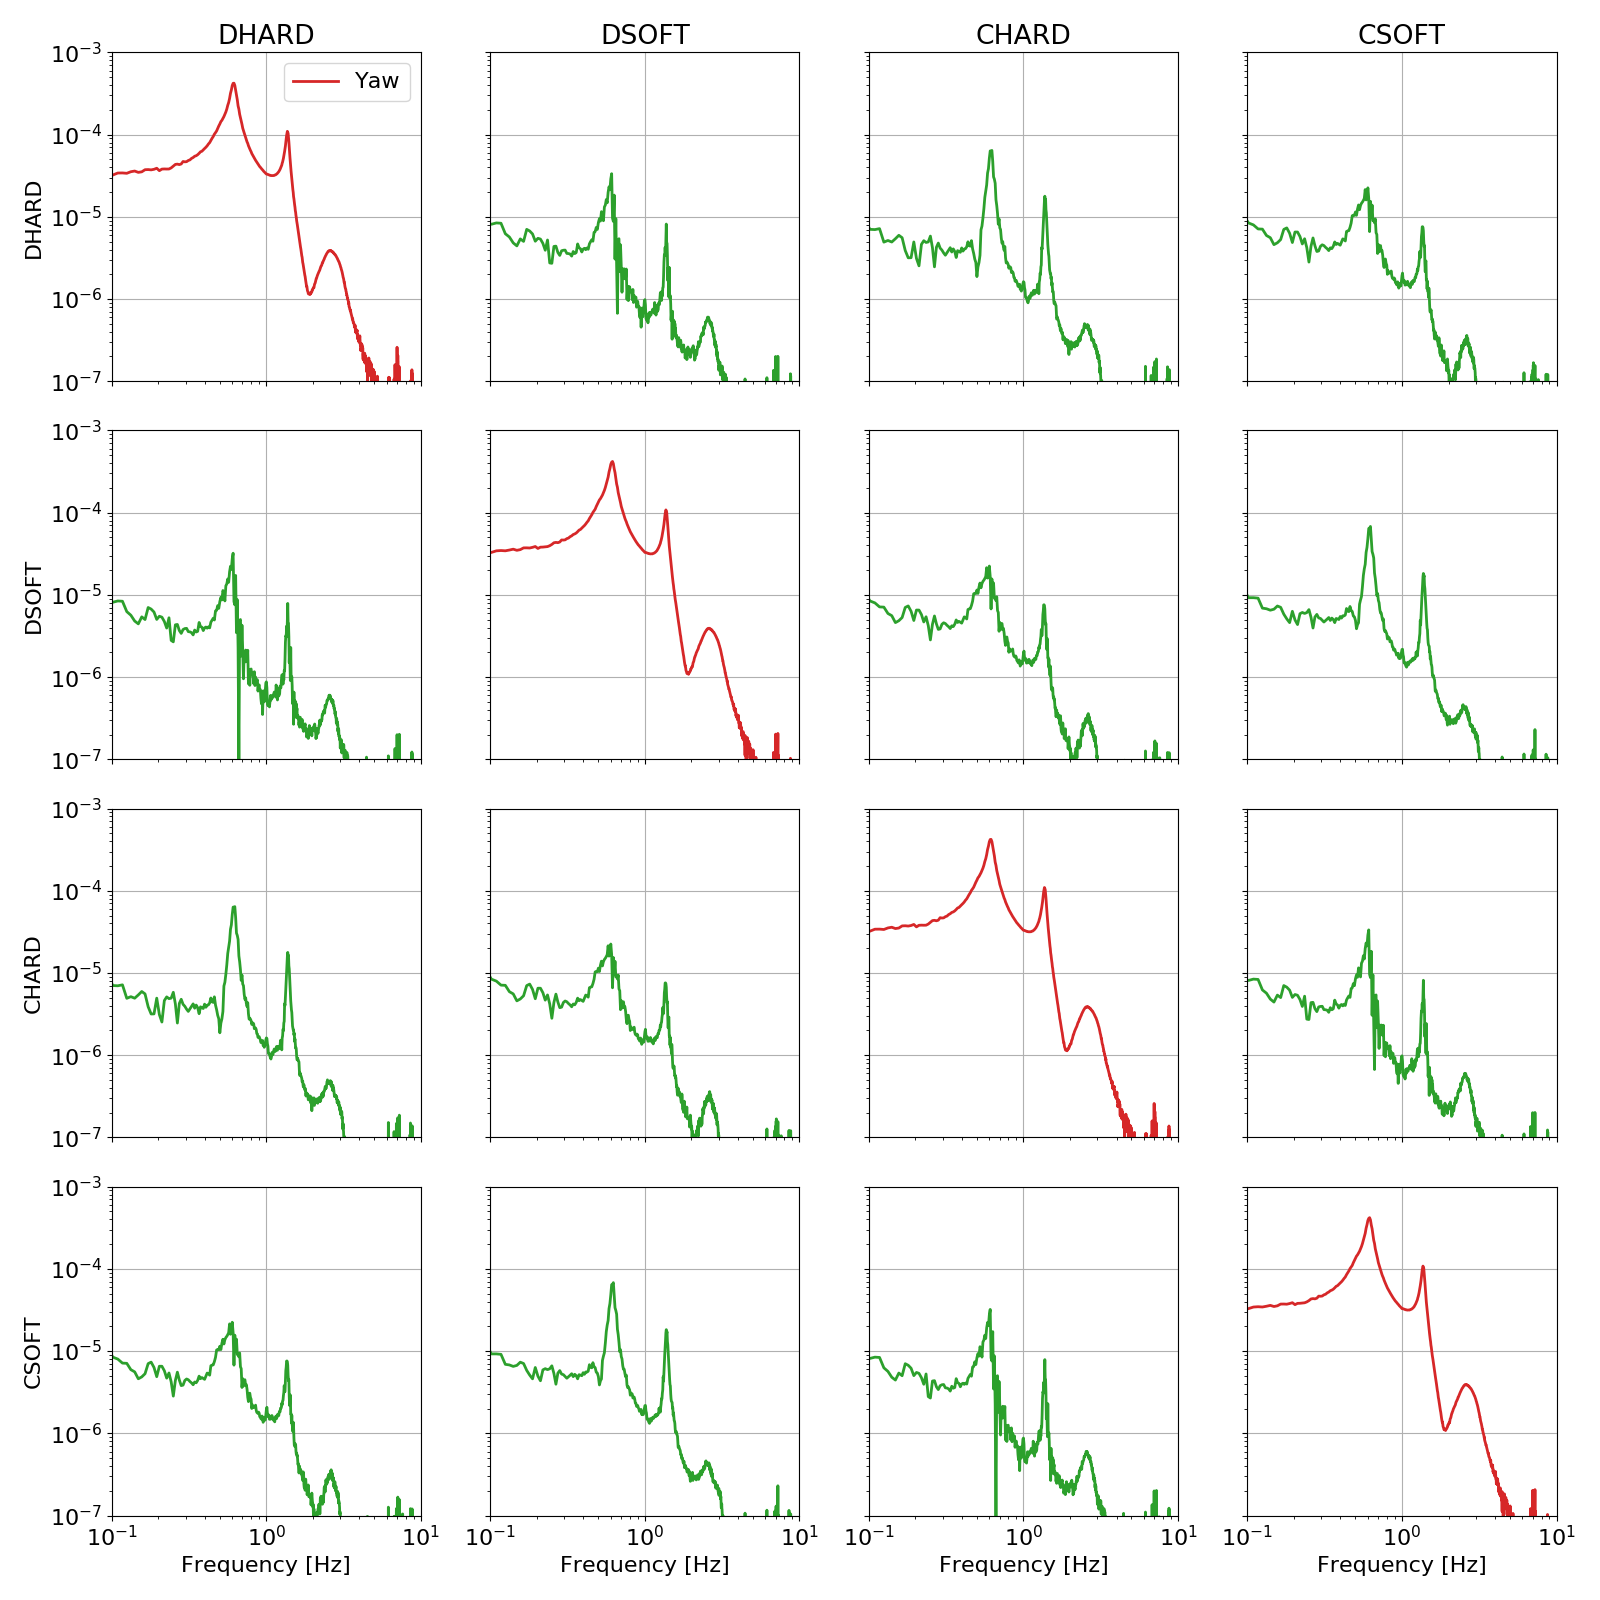
Neglecting the off diagonal terms, we can see that the measurements and the model give us the expected results that all d.o.f.s have the same pitch response and the same yaw response.


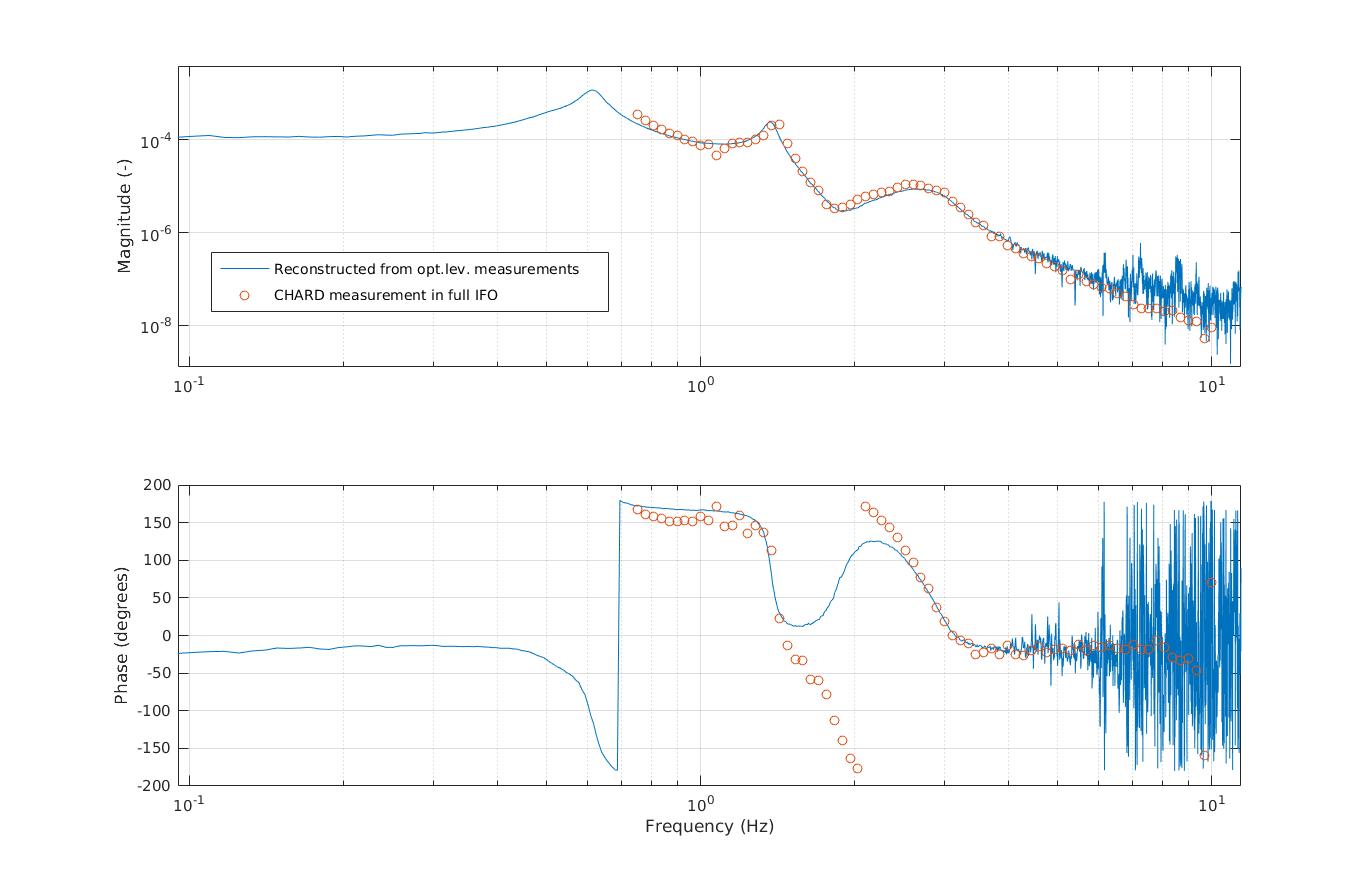
Comparison of single+model with full IFO measurements

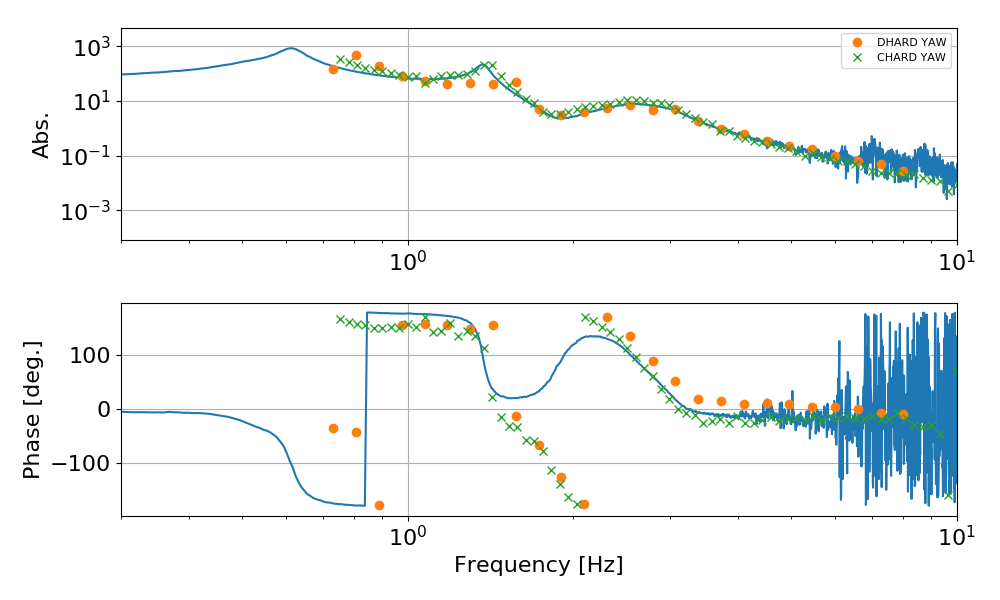
We have measured good quality transfer functions of DHARD pitch and yaw, and of CHARD yaw, with the ASC loops closed, in full lock, at 2 W input power. Apart from a global scaling and possibly a sign (I didn't track all gains), we have the comparison below for pitch and yaw (those plots show the plant transfer function, which are obtained from the measured OLTF in full lock by factoring out the control filter):


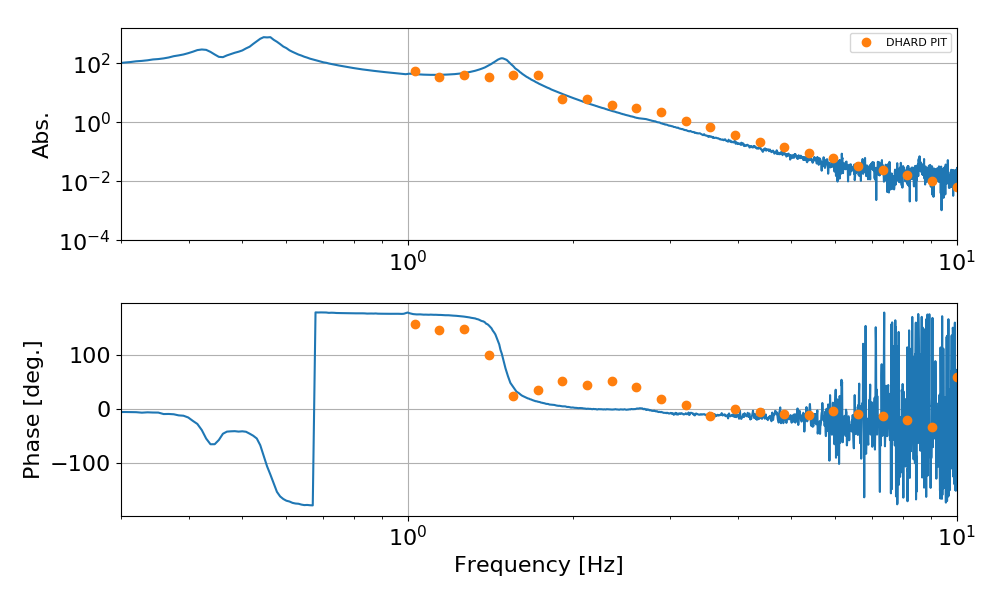
One could argue that the full IFO pitch transfer function is not very different from the one reconstructed from the single mirror measurements, apart from a phase bubble around a couple of Hz. However, for yaw:

So we cannot reconstruct the yaw CHARD and DHARD responses from the single mirror responses: there is something missing here

One possible explanation: pitch-yaw cross coupling

If we take one mirror, and mix a fraction (20-30%) of the pitch transfer function with the yaw transfer function (I know this sounds like a cooking recipe, but bear with me), then we can produce a phase lag very similar to what we measure:


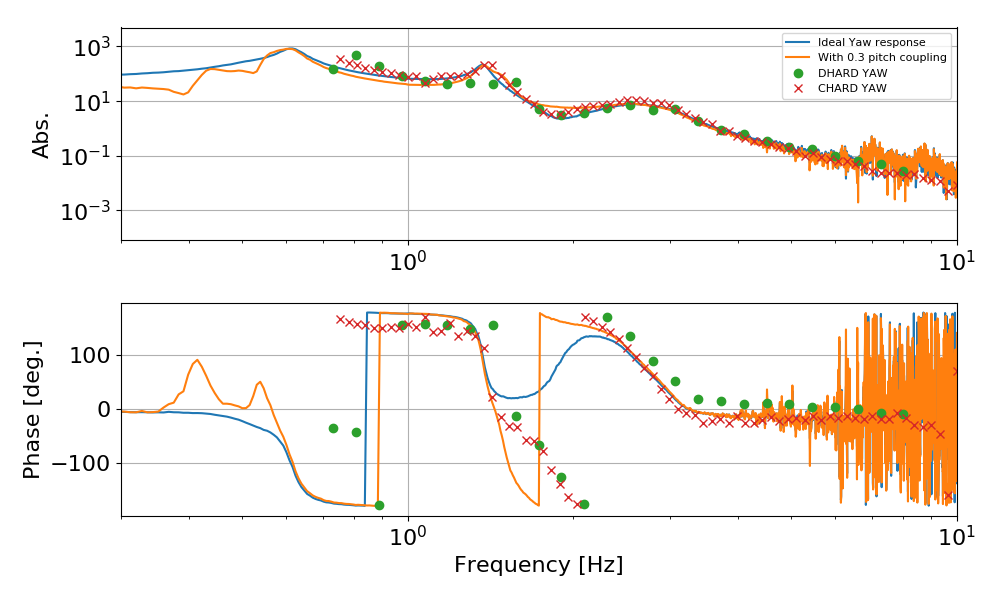
To produce this I had to assume that the yaw response of ETMY is a mix of the yaw an pitch response. The amount is not very important, as it changes a but the shape. Here I also assumed a coupling described by a frequency independent constant, while it is more likely to have some frequency dependency.

A possible origin of this coupling could be due to bad A2L, which couples yaw and pitch to longitudinal. Maybe we don't even need to involve pitch, and a mixing of yaw and longitudinal degrees of freedom might be sufficient. I don't have a measurement of the longitudinal actuation, so I can't model this.

Images attached to this report
H1 SUS (ISC, SUS)
georgia.mansell@LIGO.ORG - posted 18:03, Tuesday 04 September 2018 (43825)
No surprises in today's charge measurements

Patrick, Georgia

This morning Patrick ran the op lev charge measurements for ETMY. After h1iopsusex was restarted I ran a shorter measurement on ETMX (less averages). Long term trends attached in this order: ETMY quadrant-by-quadrant, ETMX quadrant-by-quadrant, ETMX pitch-and-yaw-4-parameter.

I also flipped the sign of the bias at ETMX which I mentioned in last week's log post but did not actually do until today. New sign accepted in the SDF.

Images attached to this report
H1 IOO (IOO)
cheryl.vorvick@LIGO.ORG - posted 17:22, Tuesday 04 September 2018 (43823)
IMC_IN power change seen on sensors in pitch and yaw

IMC_IN power change from 2W to 10.3W:

My unverified calculation from the GigE camera centroid change would result in a change of 1.5mm at MC2 (based on 5.6um pixels, and distances of 0.508m to the camera, and 20m to MC2).

The IMC WFS output for MC1 and MC2 see the beam change, but are slow to react, but clearly see it.

Images attached to this report
H1 General
cheryl.vorvick@LIGO.ORG - posted 16:39, Tuesday 04 September 2018 (43821)
End of Shift Summary:

Current Activities:

LHO VE
kyle.ryan@LIGO.ORG - posted 15:05, Tuesday 04 September 2018 - last comment - 15:13, Tuesday 04 September 2018(43818)
IP5 isolated for a few minutes

IP5's pump current is noticeably higher than any of the other 2500 l/s ion pumps that are pumping from the Corner Station.  So, today, I valved-out IP5 for 10 - 15 minutes so as to observe the response.  The increase in Corner Station pressure (as shown in IP1's pump current) is attached.  This implies that IP5 is "seeing" a higher than typical gas load and that this is coming from the YBM-side of its 12.8" gate valve.  Hmmm......

Non-image files attached to this report
Comments related to this report
chandra.romel@LIGO.ORG - 15:13, Tuesday 04 September 2018 (43819)

We will leak check the beam tube side of IP5's isolation gate valve next Tuesday. I dug through old log entries to see if we explicitly mention doing this and this aLOG is all I found which isn't clear if BT side was checked. https://alog.ligo-wa.caltech.edu/aLOG/index.php?callRep=41296

H1 SUS
sheila.dwyer@LIGO.ORG - posted 14:58, Tuesday 04 September 2018 - last comment - 12:27, Monday 10 September 2018(43816)
ITMY optical lever calibration was wrong by about a factor of 2

We've had two measurements which suggest ITMY actuation is weaker than it should be, (Georgia's measurement of the ITM ESD actuation strengths 42315 and 42302 and Gabriele's measurement of the ASC actuators 43797), so I have double checked the optical lever calibration. 

I found a time in the past when (August 13th at 21:22 to 21:25 UTC) we ran the script that adjusts the alignment of the ITM by pointing the green beam onto the EMT baffle PD's. 

The optical lever indicates a 16.5 urad change in ITM pitch between the time when the beam hits PD1 and PD4, and a 14.1 urad change in yaw.  

According to the drawing that Keita and Gerardo put together, 9087, the ITM pitch difference between pointing to the two diodes should be 11.76''/4km/2 = 37.2 urad pitch and 37.4 urad for yaw.  

This means that our current calibrations (pit gain = 23.9 yaw gain = 24.0) are too small by 2.25 for pit and 2.65 for yaw. 

I have not attempted to check the slider calibration since people are locking the interferometer right now. 

The calibration has not changed since October 5th 2014, and this is the closest alog I can find: 14312


Comments related to this report
keita.kawabe@LIGO.ORG - 11:19, Wednesday 05 September 2018 (43833)

Summary:

Now OL PIT and YAW agree with M0 PIT and YAW sliders within 10%-ish, so everything is sane now.

I confirmed that the whitening was OK.

I see that OL beam size on the OL diode for IY is much bigger than IX though it's not clear how long this has been the case. This explains why IY OL has a smaller sensitivity and thus needs larger digital gain.

It seems like either IY OL calibration was off from the start or the OL beam size changed at some point.

What I did:

1. Moved M0 PIT and YAW sliders and confirmed that OL reasonably agrees with the sliders (1st attachment).

2. Misaligned ITMY so the output of OL SEG1 is maximized, then SEG4, SEG2, SEG3, each time looking at the spectrum.

Maximized segments look all similar (except f>1kHz), which it should be as this is dominated by the intensity noise. This means that whitening is OK. (2nd attachment).

3. Also looked at DC and saw that the beam is larger than the segment.

When a segment output is maximized, the output is ~16.3k regardless of which one is maximized (attachment 3, SEG1 was maximized here).

When OL is centered, SUM is about 30.4k, so each segment can accommodate only slightly more than 50% of the entire beam at best.

Dark offsets are negligible (~>10 counts).

4: ITMX OL beam is smaller than ITMY.

When SEG1 of ITMX oplev (not ITMY) was maximized it was ~24.4k (4th attachment) while, when OL is centered, SUM is about 27.6k, so this is about 90% of the entire beam contained in one segment.

Apparently OL beam is smaller on ITMX OL diode than on ITMY, which explains why the OL sensitivity is smaller for ITMY now.

Images attached to this comment
jeffrey.kissel@LIGO.ORG - 12:27, Monday 10 September 2018 (43918)
I've accepted the changes to the ITMY optical lever calibration into the SDF system. See attached screenshot.
Images attached to this comment
LHO VE
kyle.ryan@LIGO.ORG - posted 14:37, Tuesday 04 September 2018 (43817)
miscellaneous IP1 and IP6 followup

Chandra R., Kyle R.

Today I removed the turbo and leak detector equipment from IP1 that had been left connected but de-energized from last week's maintenance day .  I then installed a 1 1/2" O-ring valve in-series with IP1's 1 1/2" AMV pump port valve and evacuated the space between these two valves.  Chandra R., later, valved-in IP1 to the site vacuum volume and it seems to be working.

Next, I removed the existing turbo from IP6's 1 1/2" pump port and installed the one just removed from IP1 in its place.  The turbo which had been used during last week's leak checking of IP6 was suspected of confusing the test results by causing crosstalk permeation helium signal responses.  These were thought to be via that turbo's oversized and incorrect vent valve O-ring which has proven to be quite permeable to helium - even when only briefly exposed and in low concentrations - basically, a nuisance.  Also, that turbo had a KF inlet flange.  The turbo moved over from the IP1 setup has a CFF inlet and a minimally-permeable vent valve O-ring.  With new turbo + leak detector configuration up and running, Chandra R. and I then reapplied an audible flow of helium to re-test the new IP6 CFF joints.  This time there were no ambiguous signal responses (background < 5 e-9 torr*L/sec throughout testing). 

After letting the locally mounted turbo pump IP6 for an hour or so, I energized IP6's High Voltage.  82 mA - 40 mA - 11 mA - 2.6 mA etc...  I then closed the 1 1/2" AMV pump port valve, vented and spun down the turbo and shut down the leak detector.  IP6 will remain valved-out from the site vacuum volume but energized and pumping itself until "dry" enough to valve-in. 

H1 ISC
gabriele.vajente@LIGO.ORG - posted 16:51, Monday 03 September 2018 - last comment - 14:20, Tuesday 04 September 2018(43797)
Investigation on CHARD YAW

Since I could not lock the IFO due to the slow controls at X end, I decided to follow a different approach to characterize the CHARD yaw loop.

Single test mass measurements

First of all, I measured the pitch and yaw plants for each test mass, in standalone configuration, i.e. driving an excitation on the ISCINF pitch and yaw inputs, and measuring the motion using the optical lever. All measurements are high resolution (10 mHz) and gave me good coherence between 0.1 and 4-5 Hz. See below the results for pitch and yaw and all test masses:


The first observation is that ETMY behaves in a different way than all other test masses: the response has a steeper slope and there is an additional phase lag. To be more precise, the plot below shows the ration of the two ITMs and of the two ETMS, in both pitch and yaw. Again, the two ITMs have similar shapes, while ETMY is clerly steeper than ETMX, both in pitch and yaw. The response of ETMY changes more steeply than ETMX, in both pitch and yaw, by a factor of about 5 if we compare between 0.1 and 3 Hz.  A cursory check in the SUS screens did not show any good reason for this difference, but honestly there's a lot going on in those models. Nevertheless, this difference is worth investigating, since teh way we decoupled hard and soft modes relies in the assumption that all test masses have the same response.

Also ITMY seems to have a smaller response than the other test masses over all frequencies.


Reconstruction of hard and soft modes

Using the responses measured as explained above, I reconstructed the response in the DHARD, CHARD, DSOFT and CSOFT basis. The assumptions are

For some reason that I am currently not understanding, my reconstruction is ok in pitch, but swaps hard and soft modes in yaw. Unclear why. Nevertheless, I get a reasonable diagonalization. Below is an example of the CHARD pitch and yaw responses, reconstructed from the local measurements


Below I'm comparing the CHARD yaw transfer function measured in full IFO with this reconstruction. The magnitude (rescaled with a overall gain) matches quite well, but clearly the transfer function measured in full IFO shows a significant phase rotation between 1.5 and 2 Hz. Incidentally, I think this phase rotation is what is causing our problems when we try to increase the gain. Indeed, yesterday I tried to fit the CHARD plant transfer function, and discovered that it's not minimum phase: there is a zero with negative frequency, which is indeed needed to explain the excess phase rotation. We should investigate the origin of this non minimum phase behavior: my bet is on a wrong sign or gain somewhere in the driving matrix, or maybe it is coming from the weird behavior of ETMY. Of course I cannot exclude that my reconstruction of the d.o.f. responses from the local measurements is just wrong.


Images attached to this report
Non-image files attached to this report
Comments related to this report
gabriele.vajente@LIGO.ORG - 14:20, Tuesday 04 September 2018 (43815)

The ETMY issue was solved, it was related to a mismatch between whitening and compensation in the optical levers. See 43814

H1 ISC (ISC, SEI)
hang.yu@LIGO.ORG - posted 13:58, Monday 03 September 2018 - last comment - 03:15, Wednesday 05 September 2018(43793)
Requirements on the residual RMS angular motion

The Birmingham low-frequency workshop participants

Motivation:

The ASC noise dominates DARM below 30 Hz. To reduce this noise, we need to reduce the control bandwidth as much as possible (at least in the final low-noise state). In the first attached figure we show the aLIGO/A+ design sensitivity and ASC noise projections for different UGFs. Here we only consider a single DOF, assuming that the sensing noise is 5e-15 rad/rtHz and the a2l coupling is 1mm/rad. For each loop we low-pass it as aggressively as possible so that the phase margin is 30 deg. The point is that if we want to reach the design sensitivity, we can at most have an ASC UGF of 3 Hz. 

On the other hand, we need to have sufficient gain to suppress the residual mirror motion to maintain the IFO at its working point. Yet what defines 'sufficient gain', and how much RMS motion of each dof can be tolerated? Here we explore what kind of requirements should be set on the RMS angular motion, which can then be converted as requirements on the minimum ASC loop bandwidth given a seismic configuration. 

=======================================================

ARMS:

1). DARM sensitivity requirement -- ARM buildup

Note that while the shot-noise-limited DARM sensitivity scales with input power as sqrt(P_in), it scales LINEARLY with ARM buidup (see, e.g., https://arxiv.org/abs/1702.03329, eqs. 1 and 7).  This means that if we lose x% buildup, we will lose x% DARM sensitivity. 

In the second plot we show how the ARM buildup varies with respect to misalignment rms for different dofs. Here we define 1 HARD = 1 * ETM + 0.87 * ITM, and 1 SOFT = 1 * ETM + 1.15 * ITM. We see that the buildup is mostly sensitive to the hard mode misalignments and for CH/DH, 3 nrad rms for each dof seems to be good enough as we would only lose 0.5% DARM sensitivity. 

2). DARM sensitivity requirement -- A2L coupling

The RMS angular motion leads to a RMS spot position on the TM, which can then couple with the AC angular motion to become a length noise (i.e. a2l). The gain is dy/d heta = -4.5e4 m/rad for the hard mode, and 2.1e3 m/rad for the soft mode. This means that for a 3 nrad of CH/DH, it creates a spot motion on the TMs of 0.14 mm. This is smaller than the DC miscentering from the pointing dof ~ 1 mm, and thus is not a major limitation. Nonetheless, it sets a limits on how well we can reduce angular noise based on a2l feedforward. 

3). PR-CARM linear range

One concern people have in the workshop is that if the misalignment would reduce the linear range of high-finesse cavity PR-CARM. We thus perform a finesse simulation to see the CARM error signal with different CHARD misalignment. See the third plot. 

From it we conclude that the linear range is not affected. The decrease in the optical (PDH) gain is also mild <1%. A small offset appears in CARM yet this is not an issue as the longitudinal loop will correct for it. Consequently, 3) is trivially satisfied once 1) is satisfied. 

=======================================================

PRC:

4). PRC buildup

Here for simplicity we only consider misaligning PRM. The PR2/PR3 effects can be converted to PRM one accordingly (roughly speaking the conversion factor is the ratio of spot sizes on the PR mirror). In the forth figure we show the PRC buildup as a function of PRM misalignment. The shot-noise-limited DARM sensitivity scales as PRC build up as sqrt(G_prc). Thus it seems we can tolerate 7 urad of PRM misalignment, which corresponds to 2% decrease in PRG and 1% drop in DARM.

=======================================================

SRC:

5). SR-DARM pole frequency. 

The SR-DARM pole is affected by the SRC build-up. In the fifth plot we show how the DARM pole (assuming Tsrm=0.325, leading to a nominal pole at 426 Hz) varies with respect to SRM misalignment. If we want the darm pole to fluctuate within 1 Hz (3 Hz) then we need to control the SRC misalignment (after propagating SR3/SR2 to SRM) to 3 urad (5 urad). 

=======================================================

(Controlling the angular RMS to a certain level is just one aspect of the ASC bandwidth requirement. The other requirement coming from suppressing the Sidles-Sigg radiation torque. Specifically, the hard mode needs to be controlled around its resonance which can be as high as 3 Hz @ 125 W input. Using a regular 1/f-like controller would require a UGF of 5.5 Hz which clearly would not meet the noise requirement...)

=======================================================

All the analysis codes available at (requiring an installation fo finesse to run it):

https://ldas-jobs.ligo.caltech.edu/~hang.yu/ASC/general/work_min_asc/


Images attached to this report
Comments related to this report
daniel.sigg@LIGO.ORG - 03:15, Wednesday 05 September 2018 (43829)

The differential arm cavity misalignment rms also couples jitter into DARM, see T1700080 and references therein.

H1 AOS
daniel.vander-hyde@LIGO.ORG - posted 18:30, Thursday 23 August 2018 - last comment - 15:24, Tuesday 04 September 2018(43628)
Contrast Defect measurement (with CO2)

Hang, Gabriele, TVo, Amber, Stefan, Danny

This morning we measured, using the AS_A and AS_B DC SUM, MICH dark and estimate 9 counts with 50 mW CO2 central heating on ITMY and 8000 counts for MICH bright (with no CO2) which leaves us with about 0.1% contrast defect.

We followed up the measurement by estimating the amount of sideband power we could be seeing :

Where P_f is the power of the sidebands of frequency f at the Michelson output,  P_o is the input power to the Michelson, Gamma_f is the modulation depth of the sideband of frequency f, and t_f is the amplitude transmission coefficient of the sideband frequency f for the Michelson.

P_9MHz: 3.77*10^(-2) counts (0.4% of what we see when dark)

P_45MHz:  1.3 counts (14.4% of what we see when dark)

Hang and TVo also thought about low frequency movement of the beamsplitter and how this could introduce higher order misalignment modes. We looked at the power spectrum of the beamsplitter oplevs below 0.5 Hz and estimate 10*10^(-9) radians (in both pitch and yaw) is dominant at those frequencies. We estimate the amount of HOM misalignment mode that could be contributing: 

Where P_o is the input power to the Michelson, alpha is the beamsplitter misalignment (in rad), w(z) is the beam size at the misaligned optic, and lambda is the wavelength of the carrier. (The factor of 2 is added to include both pitch and yaw)

P_HG01 = 14.4*10^(-2) counts (1.6% of what we see when dark)


Comments related to this report
thomas.vo@LIGO.ORG - 18:54, Thursday 23 August 2018 (43632)

The model for differential lensing in a single bounce Michelson contrast defect should be simple conceptually.  After the beamsplitter, the phase change that the X and Y beams see is dominated by the prompt reflection off the HR surface of the ITM as well as the double passing static substrate lens from the compensation plate+ITM substrate.  

Using the galaxy page numbers:

#### static lens for substrate and cp
ITMXstat = -1/310812.+1/664100.
ITMYstat = 1.7E-6-1/1392000.

# Parameters work out the TCS settings for O2 [diopters/watt]
RH_SUBdef = -9e-6
CO2_SUBdef = 6.23e-5 #alpha_co2 in my equation

# Parameters for surface deformation 
RH_SURFdef = 9.91e-7

# ITMX and ITMY Radii of Curvature 
R_ix= 1940.3
R_iy= 1939.2

Converting this to the required ring heater power to get this effect is the along the same lines of logic but the ring heater will change the substrate (double pass) as well as the HR surface (single pass) and of course, because the ring heater is annular heating instead of central, we will want to try this on ITMX ring heater.

We can try to run the ring heater over the weekend as Sheila suggested and see if this improves the Michelson contrast over time. The loops that Hang and Gabriele designed seem to be stable enough to run for many hours.

thomas.vo@LIGO.ORG - 15:24, Tuesday 04 September 2018 (43820)

Correction

The previous estimate of the actuation calibration for the CO2 lasers on the substrate was off by a factor of 3, this was due to the changing out the mask:

Old: 6.23e-5 diopters/watt

New: 2.50e-5 diopters/watt

So the estimate of the CO2 power for the best simple Michelson contrast defect is:

which still fits with our measurement.

H1 TCS (AWC, TCS)
thomas.vo@LIGO.ORG - posted 15:52, Thursday 09 August 2018 - last comment - 15:21, Tuesday 04 September 2018(43347)
First estimate of TCS Settings for O3

Summary:

The nominal substrate lens is 50km and a combination of ring heaters and CO2 lasers are used to achieve this level while the interferometer powers up.  At the operating point with 50 Watts of input power (375kW of circulating power), the required substrate lensing will need to be achieved with the ring heaters.  However, because the thermal constant for the ring heaters is very slow, they will need to be turned on all the time.  The CO2 lasers will have to compensate for the static lens, the self-heating lens, and the constant ring heater lens as the interferometer powers up. Using the radii of curvature from the galaxy page as well as the calibration parameters from the TCS_IFO_SIM MEDM screen, a decent starting point for the ring heaters and CO2 laser is given by:

ITMX
 
Nominal Ring Heater Setting    
1.646 W
Nominal CO2 Pre-heating power     
0.586 W
ITMY
 
Nominal Ring Heater Setting    
1.945 W
Nominal CO2 Pre-heating power     
0.586 W
ETMX 

 
Nominal Ring Heater Setting  
0.92 W
ETMY                         

 
Nominal Ring Heater Setting 
1.46 W

Details:

The power up graphs similar to Aidan's analysis, shows that the nominal circulating power will require annular heating which is mostly easily achieved with the ring heaters for varying absoprtion (.25ppm +/-0.025ppm).  Because the ring heaters take so long to warm up they should always be turned on so that they are ready for full circulating IFO power (375kW), however, the CO2 laser will have to compensate for this static ring heater tuning in addition to adjusting for the static lens and self-heating from the absorption.   The right plots shows the adjusted required CO2 central heating such that the CO2 laser power is scaled to zero once the interferometer has reached full power.  

Now that we've used up the ITMX and ITMY ring heaters to adjust for the substrate lensing, this inherently changes the radius of curvature of the ITM HR surface, therefore it changes the modal content of the arm cavities.  Assuming we have control over the ETM ring heaters (PIs effectively being solved by AMDs) we have to tune those heaters to modematch the arms to each other as well as the power recycling cavity.  Using Finesse to calculate the PRC mode with a 50km lens in the substrate of the ITM and keeping the common mode lensing to keep the arms mode-matched to each other.  This graph shows that a linear line that is a combination of ETM ring heater powers which keeps that arms well modematched to each other, and the color plotting shows which of those combinations gives the best possible PRC (the darker the better, notice the units of color are in mode-mismatch):

Of course, these calculations are just a good place to start assuming we have uniform absorption and that our estimate of absorption is good enough, more measurements with the HWS at higher power will refine the model.

Images attached to this report
Non-image files attached to this report
Comments related to this report
thomas.vo@LIGO.ORG - 15:21, Tuesday 04 September 2018 (43807)

Correction

The previous estimate of the actuation calibration for the CO2 lasers on the substrate was off by a factor of 3, this was due to the changing out the mask:

Old: 6.23e-5 diopters/watt

New: 2.50e-5 diopters/watt

That being said, the values for CO2 pre-loading changes but the algorithm remains the same:

The optimal setting for CO2 X and Y is close to 1.461 Watts on central heating.

Images attached to this comment
Non-image files attached to this comment
Displaying reports 45721-45740 of 88272.Go to page Start 2283 2284 2285 2286 2287 2288 2289 2290 2291 End