Blades were selected for the baffle, best ones, but discovered that the hole on blades needs to be cleaned up (deburr) to be able to complete the assembly. Tools are in the oven, need them to be "class B".
The entire batch of blades produced 3 that have coating issues, one is coated about 10%, a second one about 70% and a third one has reddish hue all over it.
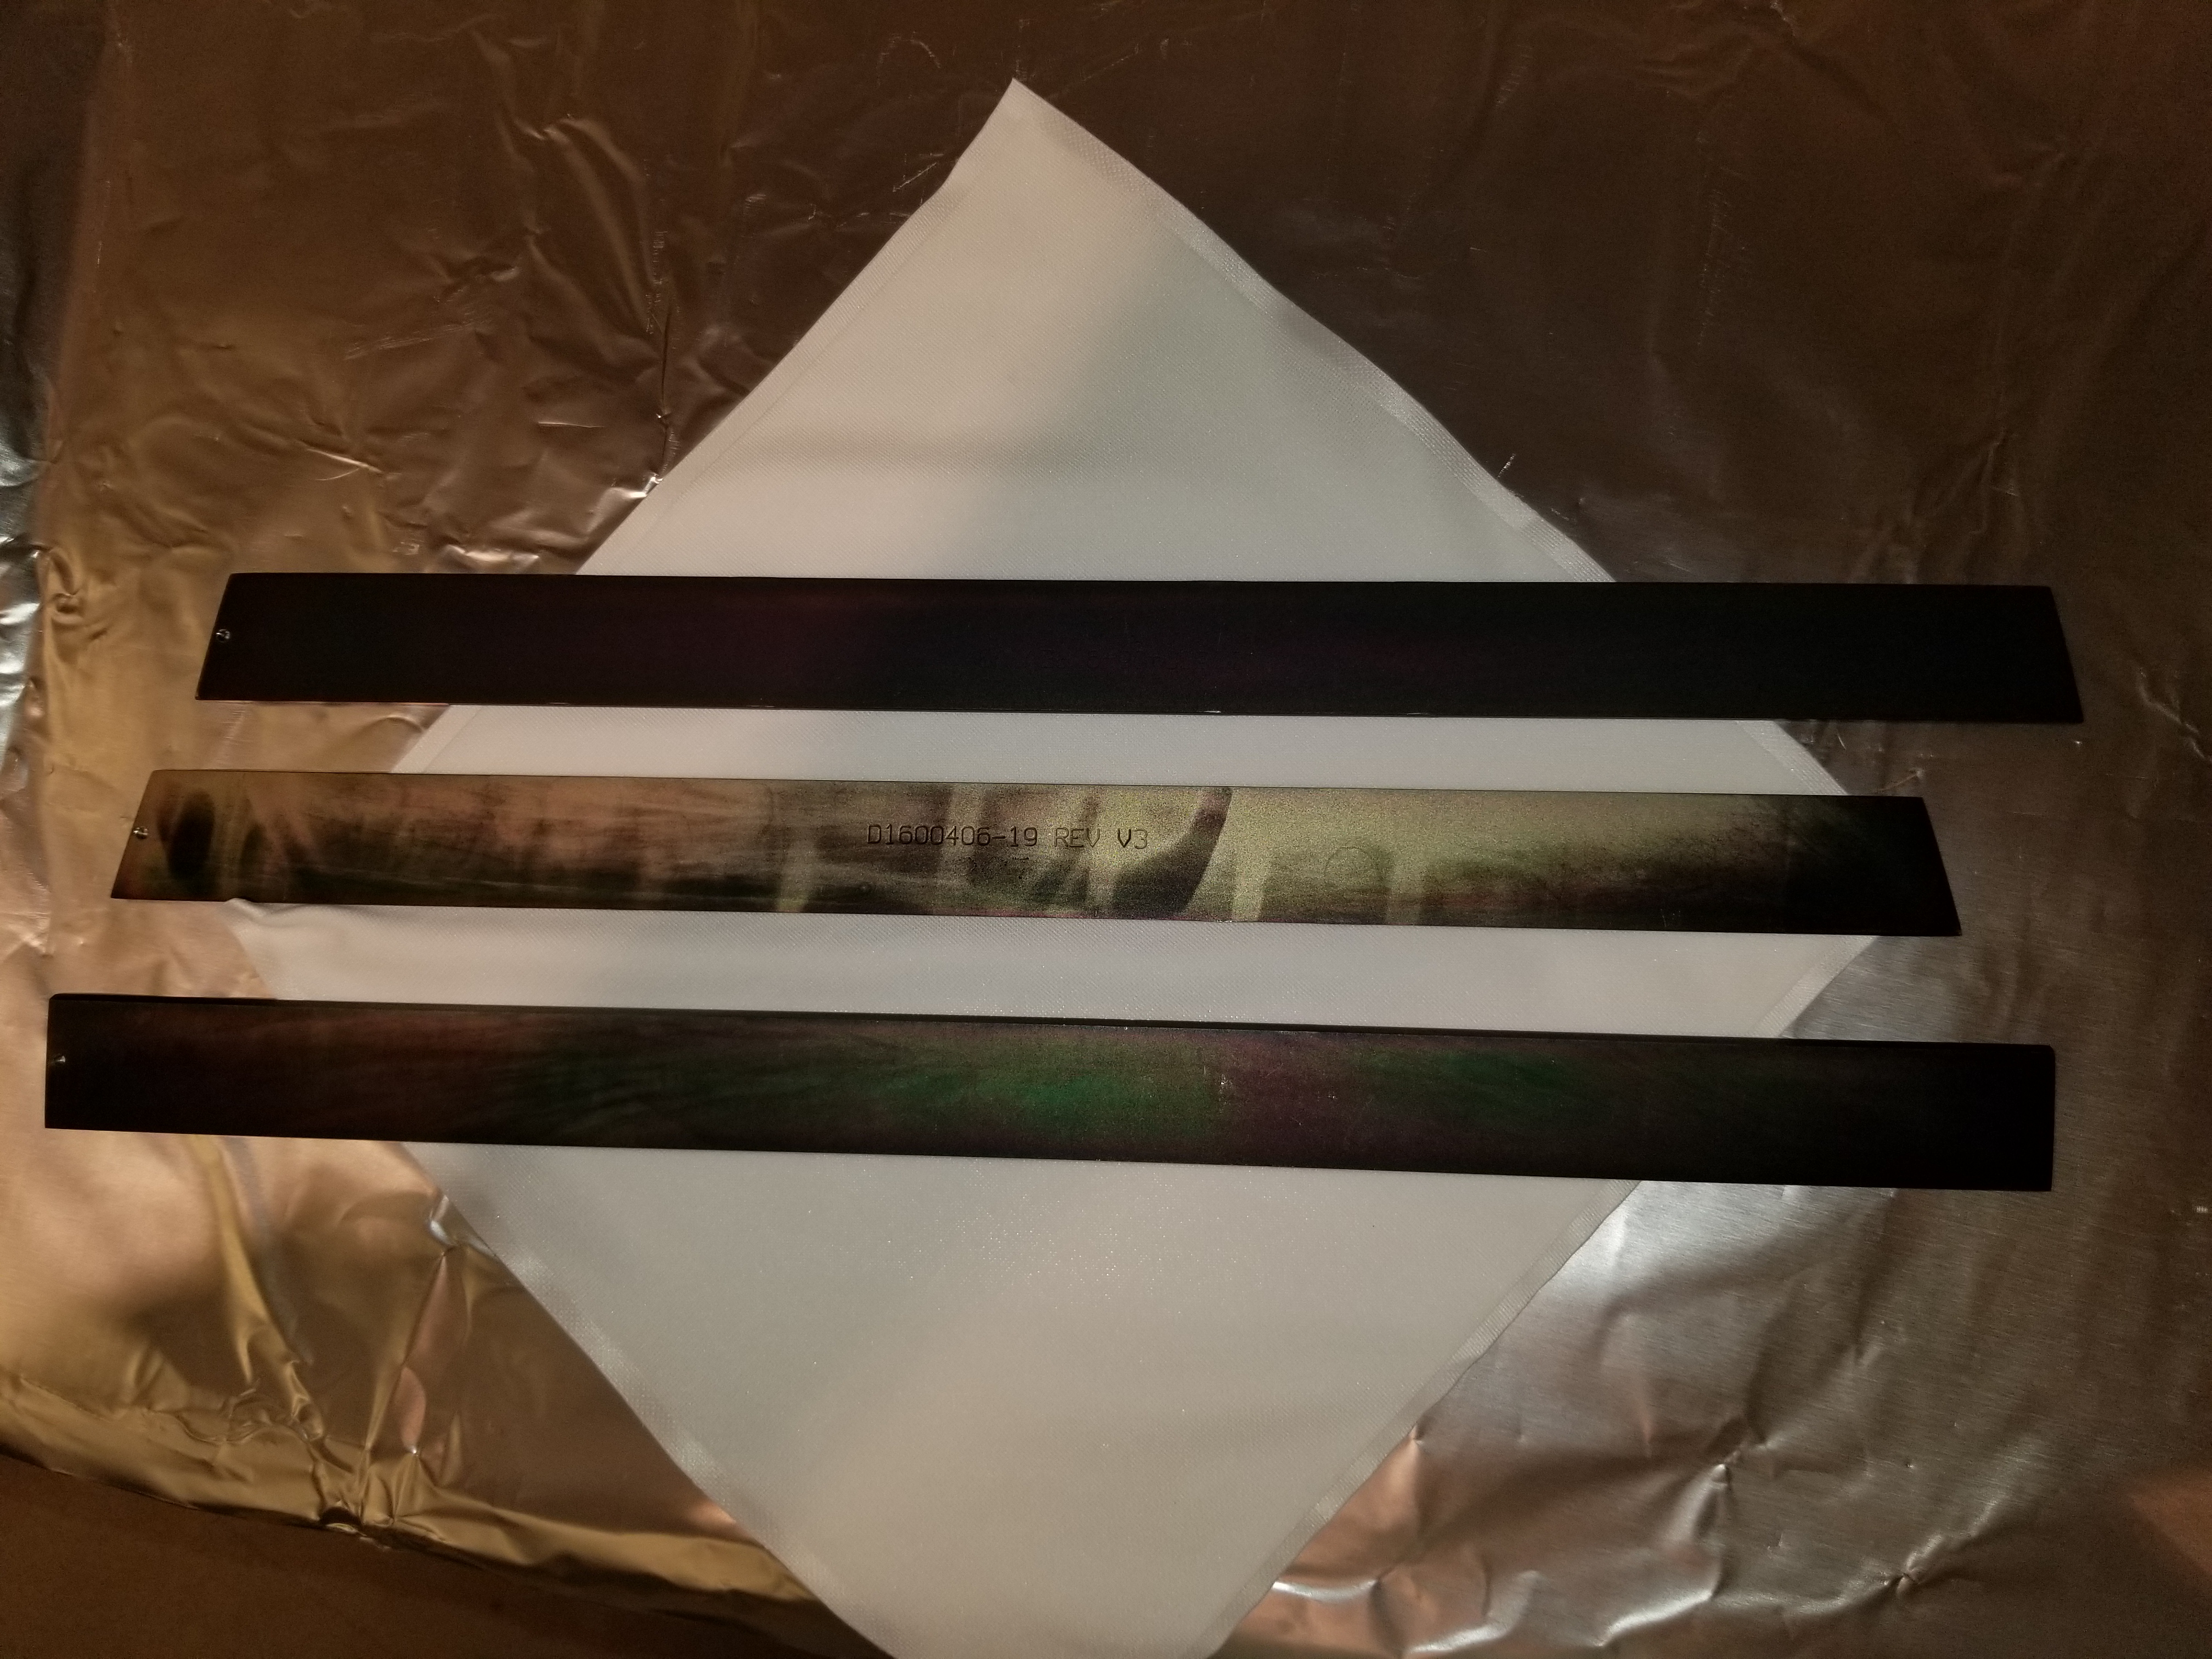
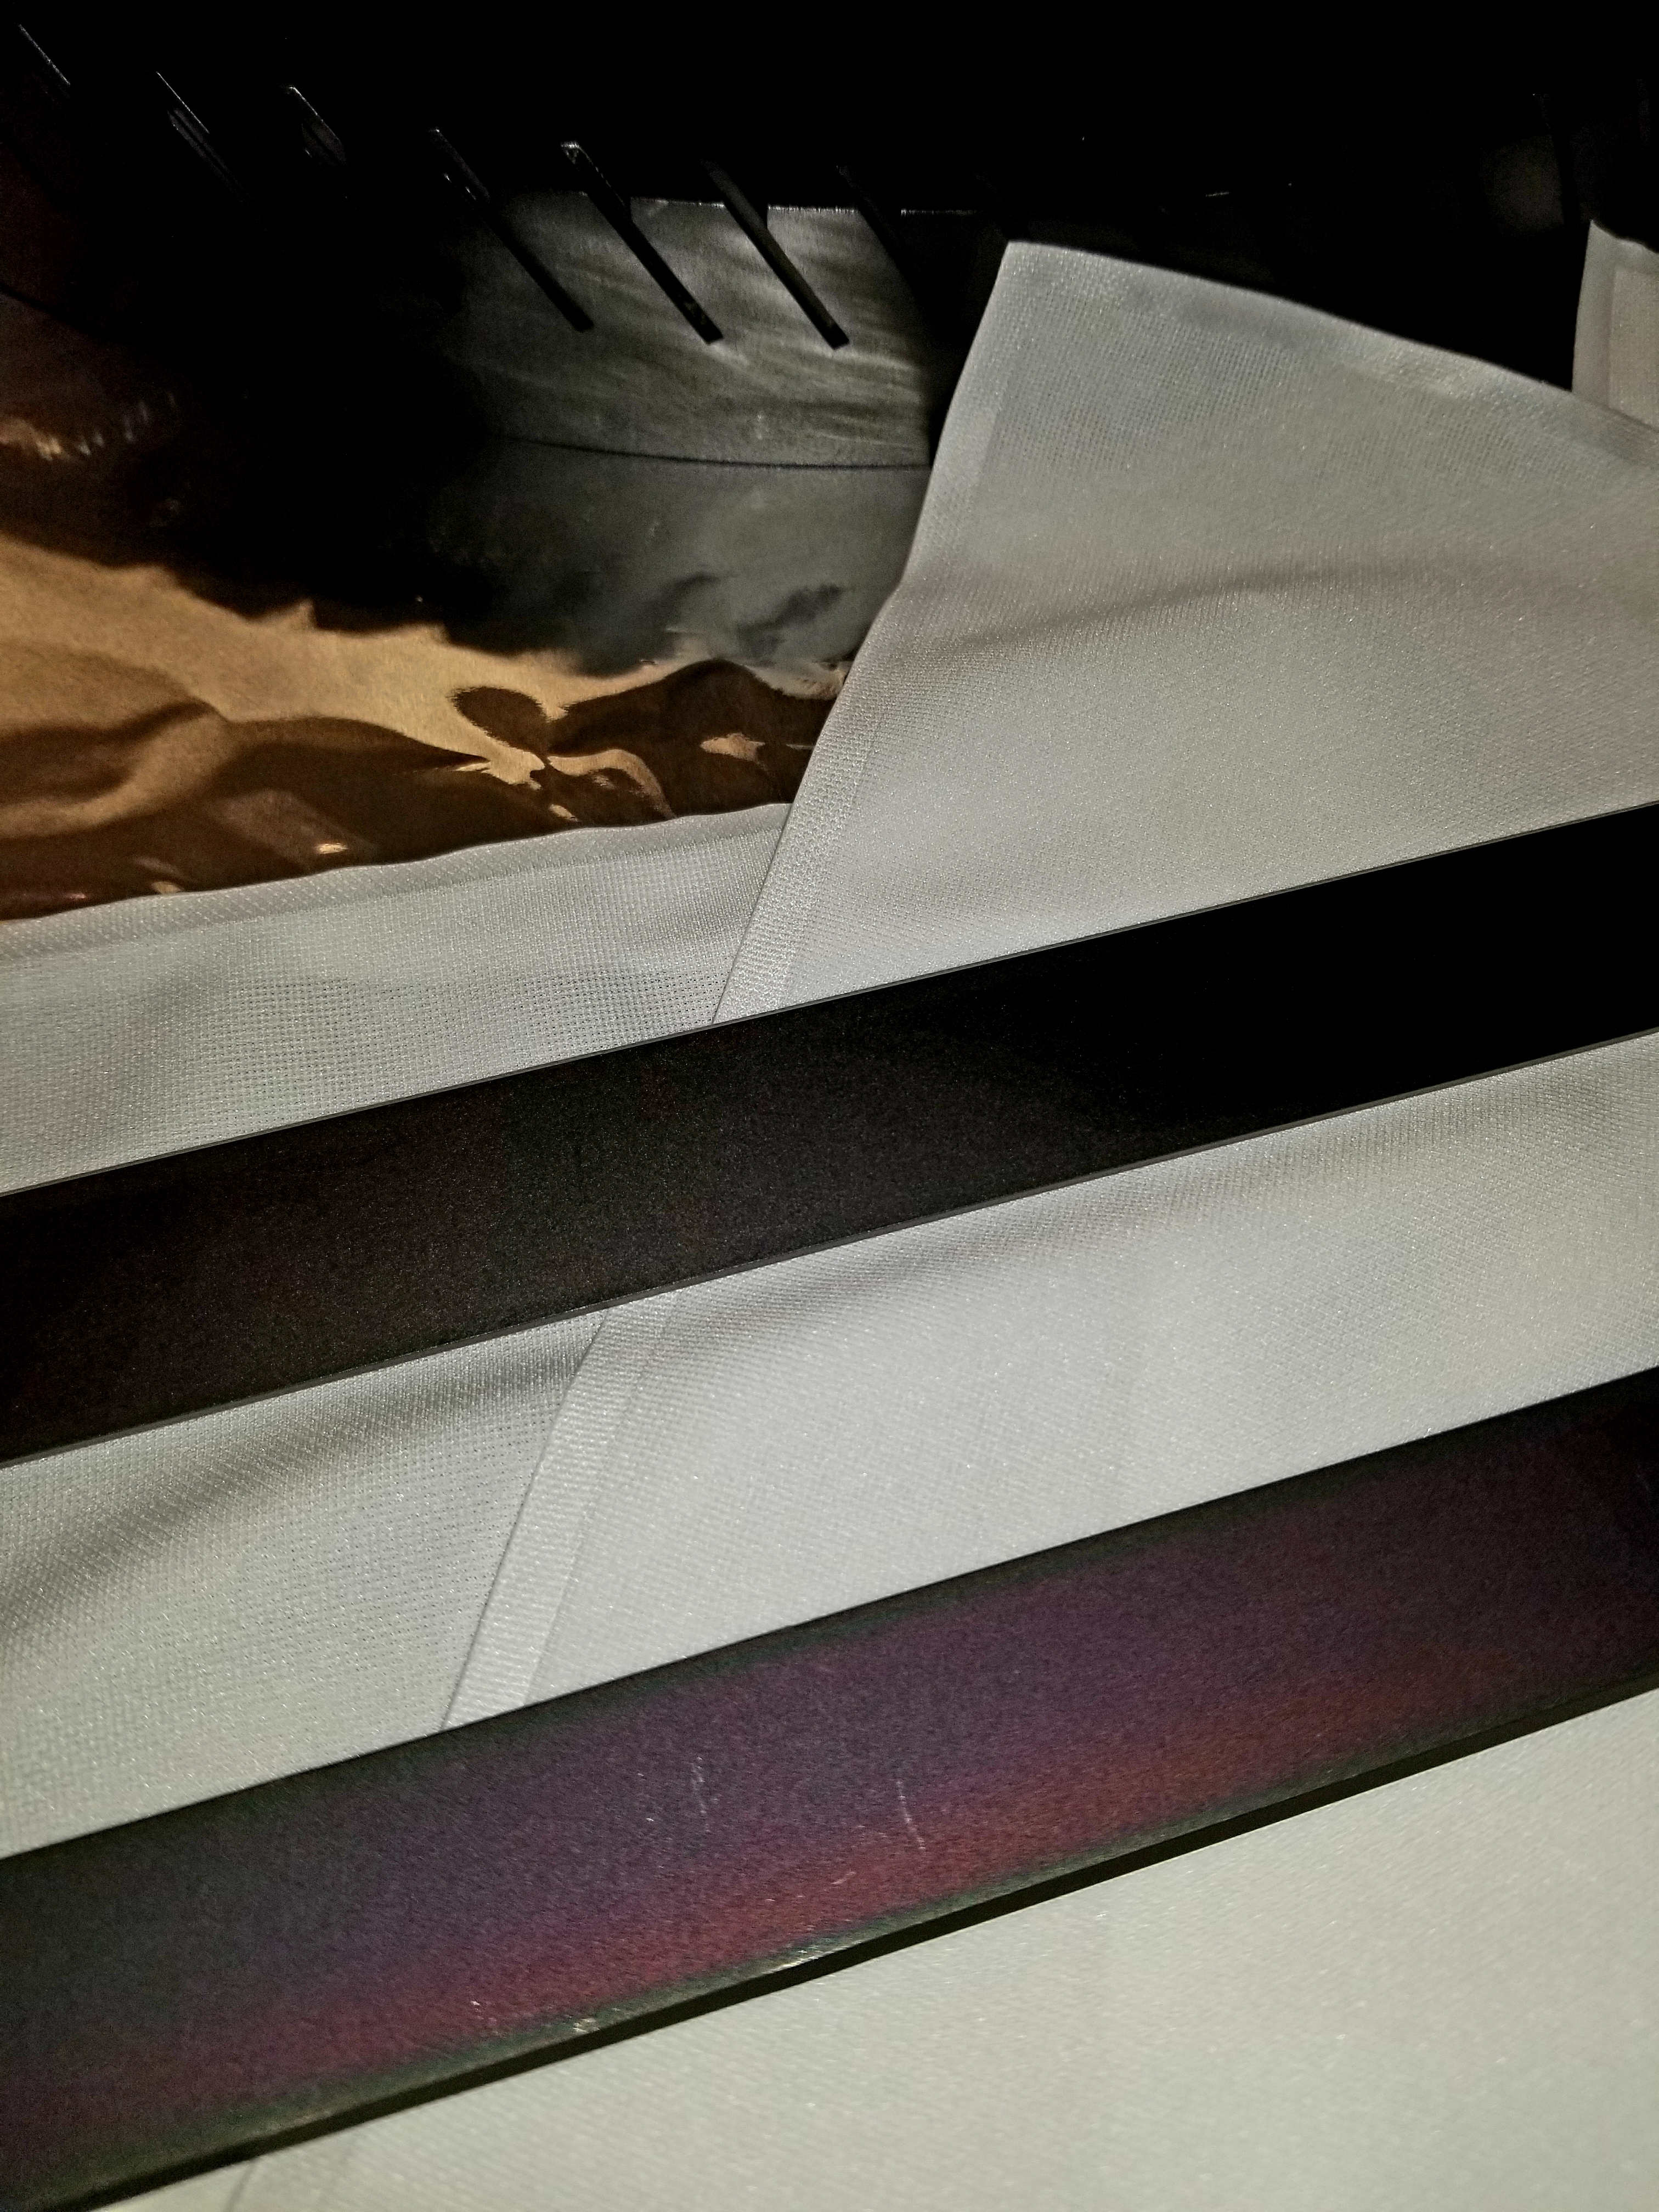
These louvers should be rejected and the disposition should be to send for rework by the vendor. Thanks for the log of these coating issues!
@Gerardo: Was the prior deburring of the fixturing hole insufficient, or did it appear that no deburring had taken place?
Sheila pointed out that the ops overview only shows if the ISI or HEPI watchdogs are tripped, they don't give an indication if the seismic platforms are actually in the right state. I've added red triangles that pop up if the chamber guardian is not fully isolated (and at least isolated-damped for the BS), see first attached screenshot.You won't see these if the chamber is in its nominal state, trying to keep the clutter down.
FRS Ticket 11294
Contractor work in one of the diode room panels disconnected the LDR FAC Interlock. This tripped off the PSL for about an ~1.5 hour this morning. PSL was brought back online by Peter King once interlock issues were addressed.
We upgraded zotws17 to Debian 9. This was to get some more testing before further control room roll-out, and in a response to move to a system with a newer scipy stack to allow running the py darm code in the control room. I also set puppet to install some root-plugin-* packages that were needed to get plotting on diaggui (we saw this as an issue on zotws6 the other test Debian 9 box). For some reason they were not being pulled in automatically. root-plugin-geom-gdml root-plugin-geom-geombuilder root-plugin-geom-geompainter root-plugin-graf2d-asimage root-plugin-graf2d-x11 root-plugin-gui-guibuilder root-plugin-hist-histpainter root-plugin-io-xml root-system-bin root-system-common
The attached plot shows the output of the CLF servo, when the CLF was locked in co-resonance. Typically, the range was within ±0.5V, with the worst case around 1.2V max. There is now plenty of headroom with the new OCXO.
Danny TVo Georgia
This morning we pico'd the top periscope mirror on the CO2X table, it is now roughly centered on ITMX. From last night's long-duration low-power ring heater test we know where the center of the test mass is relative to the centre of the HWS beam. We then used 5-10 minute blasts of 1-2 W CO2 to see where the CO2 beam is, and approximately aligned this with the centroid of the ring heater contours.
The contours from the ring heater test are shown in the first attachment, the center is roughly (+12.5, +12.5 mm) relative to the Hartmann center.
The second attachment shows the CO2 central heating, and the third shows the annular heating. NOTE: we moved the picomotor -700 counts (~4mm right (very rough) on the Hartmann camera) after taking these screenshots and didn't get a chance to take another CO2 test. The final position of the top periscope mirror is -11787,-1500 counts.
We removed the iris before these images were taken and are not sure why we don't see the full annular mask, particularly in yaw. (We also no longer seem to be limited by the confusing ghost beam which we put the iris in to remove).
The fourth attachment shows the FLIR camera image of the CO2 beam on the table with the central mask in - the beam is not quite centered on the mask in yaw which is something we might want to fix in the future.
Some more information on the ITMX RH test from this post. The trend data is attached and I've posted a couple of the contour plots showing displaying two different times when ITMX lensing reached a steady state (as suggested by the HWS spherical power).
Additional additional info: we retook the annular mask CO2 test on friday evening. It looks like we were better centered *before* the final 700 count move and should maybe consider moving back. Two screenshots from different stages of the heating-up process attached.
WP7780 Add OPO IR fast channel
Daniel, Dave:
h1sqz model was restarted to add one fast and some slow channels (see list)
DAQ was restarted to use the new H1SQZ.ini file and the H1EDCU_CDSACPWR.ini file (polarizer power status)
+: slow channel H1:SQZ-OPO_GRD_TRIGMAXSET added to the DAQ
+: slow channel H1:SQZ-OPO_GRD_TRIGMAXSCANRESET added to the DAQ
+: slow channel H1:SQZ-OPO_GRD_LOCK_IN_NLG_MODE added to the DAQ
+: slow channel H1:SQZ-OPO_GRD_VIS_OPO_TEMP added to the DAQ
+: slow channel H1:SQZ-OPO_GRD_VIS_MIN_SEED_POWER_TH added to the DAQ
+: slow channel H1:SQZ-OPO_GRD_VIS_MAX_FIBER_POWER_TH added to the DAQ
+: slow channel H1:SQZ-OPO_GRD_TRIGPERC added to the DAQ
+: slow channel H1:SQZ-OPO_GRD_TRIGMAXMWSCAN added to the DAQ
+: slow channel H1:SQZ-OPO_GRD_TRIGMAXMW added to the DAQ
+: slow channel H1:SQZ-OPO_GRD_NOBLOCK_TRIG_TH added to the DAQ
+: slow channel H1:SQZ-OPO_GRD_NLG_OPO_TEMP added to the DAQ
+: slow channel H1:SQZ-OPO_GRD_NLG_MAX_SEED_POWER_TH added to the DAQ
+: slow channel H1:SQZ-OPO_GRD_LOCK_TRIG_TH added to the DAQ
+: slow channel H1:SQZ-OPO_GRD_BLOCK_TRIG_TH added to the DAQ
+: slow channel H1:SQZ-OPO_IR_LF_OFFSET added to the DAQ
+: slow channel H1:SQZ-OPO_IR_LF_GAIN added to the DAQ
+: slow channel H1:SQZ-OPO_IR_LF_LIMIT added to the DAQ
+: slow channel H1:SQZ-OPO_IR_LF_TRAMP added to the DAQ
+: slow channel H1:SQZ-OPO_IR_LF_SWREQ added to the DAQ
+: slow channel H1:SQZ-OPO_IR_LF_SWMASK added to the DAQ
+: slow channel H1:SQZ-OPO_IR_LF_INMON added to the DAQ
+: slow channel H1:SQZ-OPO_IR_LF_EXCMON added to the DAQ
+: slow channel H1:SQZ-OPO_IR_LF_OUT16 added to the DAQ
+: slow channel H1:SQZ-OPO_IR_LF_OUTPUT added to the DAQ
+: slow channel H1:SQZ-OPO_IR_LF_SWSTAT added to the DAQ
+: fast channel H1:SQZ-OPO_IR_LF_OUT_DQ added to the DAQ
There have been some doubts about the stability of the REFL WFS DC centering loops, so I continued the work described in 43451 and optimized the loops even further. In summary
Plant measurements and fits
First of all, I measured the four plants. To do this I misaligned the ITMs and aligned the PRM, to have a single bounce beam. The beam was roughly centered on both REFL WFS. I then switched off all DC1 and DC2 loops, set their gains to 1, switched off all filter banks, including the integrator in the RM1 and RM2 suspensions. In this configuration I could inject an excitation in the DC1/2 pitch/yaw control filter banks and actually measure the plant with IN2/IN1.
I loaded the measurements in MATLAB and used vectfit to fit them. The yaw transfer functions were very well fitted with a single complex pole, while the pitch transfer functions showed two complex poles and a complex zero. Measurements and fits are shown below.
The table below gives the fit parameters
| Zeros [Hz] | Poles [Hz] | Gain at DC | |
|---|---|---|---|
| DC1 pitch |
-0.1042 + 1.3570i |
-0.1050 + 1.3117i -0.1050 - 1.3117i -0.1464 + 1.8066i -0.1464 - 1.8066i |
0.0649 |
| DC2 pitch |
-0.1118 + 1.3062i |
-0.1056 + 1.2627i |
0.0568 |
| DC1 yaw |
-0.1745 + 1.6794i |
0.0613 | |
| DC2 yaw |
-0.1540 + 1.6779i |
0.0554 |
Loop design
Using the fit models, I used MATLAB's sisotool to design simple single-input single-output control filters. The same control filter can be used for pitch and yaw, and it simply consists of two real zeros ay 0.83 Hz, one integrator, and a complex pole at 43 Hz with a Q of 1.4. The design is shown in the figures below, for both pitch and yaw. The figures from MATLAB's sisotool show the modeled open loop transfer function (upper adn lower right), the root locus (upper left), and the Nichols' plot (lower left).
The model predicts a UGF of about 10 Hz, with a nominal gain of -1 in all the DC1/2 pitch/yaw filter banks. The loop is stable for all small gains, and the gain can be increased by about a factor 3 above the nominal value. The phase margin is more than 60 degrees for all values of the gain smaller than 1. There is plenty of margin for boosts or high frequency roll-offs.
Filter implementation
The integrator and one of the two zeros at 0.83 are implemented in the RM1 and RM2 suspension filter banks (FM1 of H1:SUS-RM1_M1_LOCK_P and H1:SUS-RM1_M1_LOCK_Y).
The rest of the filter is implemented in the DC1/2 pitch/yaw filter banks (wherever I could find a free FM, or a FM which did not look like it was used or useful).
The configuration is shown below
Loop performance measurement
I could engage the four loops with the nominal -1 gain without any problem. Then I measured the open loop transfer function by injecting white noise (band-passed between 0.1 and 100 Hz, boosted at low frequency with a 1/10 Hz second order filter). The measurements confirm the model prediction, as shown below
[Hang, Gabriele]
The audio alarms were often complaining about saturation of the HSTT, which we suspected to be due to the high frequency content of the new DC1 and DC2 centering loops. Following Hang's suggestion, we added a low pass filter (Chebychev Type 1, 25 Hz, 2nd order, 3dB band pass ripple).
This reduces the phase at 10 Hz by 25 degrees.
We also reduced the overall gain by a factor of two. In this configuration the UGF is 5 Hz (at 10 Hz we could see a bit of gain peaking just below 10 Hz).
The high frequency control signal to the RM1/2 is much lower, although the total RMS is reduced by a factor 2-3 only.
Tuesday I updated the HAM1 HEPI loops, to make them more like the LLO loops. It's not a total success, but increase of high frequency gain in the Z loop was successful. However, I found the X plant was somehow significantly different from the last time I worked on this chamber in the 10-100 hz region, and I haven't had a chance to investigate and figure out why yet. Unfortunately, I wasn't able to get the X loop totally stable, it kept tripping the platform when guardian engaged the loops. I'll try to copy in the old loop and see if it's still stable, or see if I can come up with something better when time allows.
Attached plot are asds and tfs comparing the motion last night and Tuesday, before I installed the new loops. Top plot shows asds, the solid lines are the ITMY sts and HAM1 z L4Cs from Tuesday, dashed are from last night. Bottom plot are the TF from the sts to the HAM1 z l4cs. The 10-20 hz region shows that we are now actually getting some suppression, rather than amplifying.
J. Kissel
I took a few seconds to clean up the SEI drop down menu in the site map. Things I changed:
- Got rid of the link to the Newtonian Noise Area overview screen (the L4Cs have been removed and returned to original owners, the NGN front-end model is now gone.)
- Got rid of the link to the corner-station compact BRS overview (same with the NGN array, this has been removed both in hardware and software)
- Renamed "COMPACT SEISMON" to just "SEISMON"
- Renamed "ISI CONFIG" to the more descriptive "ISI SENSOCR CONFIG"
- Renamed "IFO Basis SUSPOINT Motion" to "IFO BASIS PROJECTIONS"
- Renamed "PERF OVERVIEW" to "PERFORMANCE MATRICES"
- Re-ordered the list in order of frequency of use
These changes have been committed to the userapps repo under
/opt/rtcds/userapps/release/cds/h1/medm/SITEMAP.adl
Attached are screenshots of the menu AFTER and BEFORE.
J. Kissel Similar to the HAM Auxiliary Suspensions (HAUX; see LHO aLOG 43481), we needed a measurement of the open loop gain of a HAM Tip Tilt Suspension (HTTS), so I grabbed OM2 before the commissioning vanguard needed. Templates live here: /ligo/svncommon/SusSVN/sus/trunk/HTTS/H1/OM2/SAGM1/Data/ 2018-08-17_1613_H1SUSOM2_M1_WhiteNoise_L_OLG_0p05to50Hz.xml 2018-08-17_1613_H1SUSOM2_M1_WhiteNoise_P_OLG_0p05to50Hz.xml 2018-08-17_1613_H1SUSOM2_M1_WhiteNoise_Y_OLG_0p05to50Hz.xml
After some remote work by Nikhil and MichaelC, our seismon install is sort of functioning again. The surface velocities are not at all believable (red squares on the screen shot are predicted ~40 micron R-wave surface velocities for a 6.5 in Timor near Australia, I would expected maybe 5-10 at worst) and I'm not so sure about arrival times, but the earthquake time and location showed up on MEDM 20 minutes before it showed up on the USGS page.
Needless to say: work is ongoing.
I've also made some minor changes to the screen and epics code that we're running. The R3.5 velocities are now in microns to better match the wall FOMs, so the MEDM light for that variable had to be updated as well.
Had a bit of breeze at my house last night so checking this morning shows indeed we had some breeze last evening that provided a consistent period for inspection.
Found about 20 minutes from 2210 to 2230 pdt where the direction settled down in a favorable direction around 90o; that is, from due west, normal to the fence upwind of the building. The attached 20 minutes of full data show a few things:
* The roof top PEM anemometer, Ch 1 and Ch 3, the fence direction sensor are in agreement to within ~20o. Maybe this needs correcting or possibly the building is influencing the flow direction. This could be evaluated by looking at the difference in direction as a function of direction.
* The PEM roof-top wind speed, Ch 2, seems to be consistently higher than the fence free air speed, Ch 4. This makes sense as the roof top sensor is maybe 20' higher and the building itself may be providing some velocity increase.
* Comparing Ch 4 & Ch 5, the fence free air sensor and the sensor just 10' upwind of the fence, you see a noisy maybe 10 or 15% reduction of velocity--subject to better analysis than my simple point-by-point division (shown in red on the plot with Ch 5.)
* Comparing Ch 5 & Ch 6, the upwind and downwind (of the fence) sensors, the downwind data is clearly smoother and a comfortable 50% reduced compared to the upwind channel. Again, the red trace on the plot with Ch 6 is (1-Speed_4/Speed_2)
Clearly the Tenax fabric is effective and produces about a 50% velocity reduction, at this free-air speed.
Look forward to Elyssa's more thorough and detailed analyses as nice wind events present themselves.
I thought I had noticed, when looking at the trends for this above, that the sensor downwind of the fence had narrower MAX & MINs. Looking at these again, I thought I was reaching as I could not see it clearly in the basic trends. So, I subtracted the MIN from the MAX and plotted that, here, below. Not sure if this is the best way to quantify this observation but it seems a bit informative.
In the attached you see the same span of time as the plot above with the difference between MAX & MIN for upwind (LR) and downwind (UR.) Clearly with this measure, the down wind sensor (Speed_4) shows less range in velocity of the wind compared to that upwind.
Peter K, Craig We've been thinking about the stability of our CARM loop, since we recently had to lower the gain of our IMC from 100 kHz to ~30 kHz to avoid IMC locklosses. The CARM frequency noise suppression at this level should still be fine, but we should be able to push the CARM UGF to at least 20 kHz as we acquire and the IMC should not limit us. However, cursory investigation of the IMC yielded no immediate solutions, so a deeper look into the CARM loop is required. Peter K took some TFs through the FSS while changing the fast gain. Attached is the FSS OLG, TTFSS Fast (PZT) and Ultrafast (EOM) paths. The TTFSS schematic currently in use at the LHO PSL lives here. The FSS in it's current state seems healthy and stable. We probably could stand to increase the UGF slightly. We are currently running the FSS loop with common gain of 20 dB and fast gain of 9 dB. With those settings, we have an FSS UGF of ~200 kHz (Plot 1), which is slightly lower than before. Changing the fast gain does not affect the UGF. There is a gain dip at 20 kHz that develops when the fast gain is turned too high, probably as a result of the PZT fighting the EOM. In plot 2, for gains above 9 dB, the fast gain appears to not be able to further amplify the fast signal. In plot 3 we see the 20 kHz hump develop in the ultrafast EOM path as we increase the PZT gain.
Actually the test point transfer functions were in through TEST 2 and out through either TP9 or TP10.
The stability of the FSS tends to be an issue of actuator range more than transfer function. In particular, the phase correcting Pockels cell has a very limited range. Once the Pockels cell saturates, the fast path isn't stable on its own. There was some work done in the TTFSS v4 to minimize the signal going to the Pockels cell at frequencies around and below the crossover.
In the past, we typically run both FSS and CM below the maximum bandwidth, until we were locked stably in high power and low noise. This was necessary because of excess frequency noise coupling at the very high end of the spectrum.
Terry, Nutsinee
A pick-off mirror is mounted on a manual Thorlabs flipper. The beam is then sent to a non-polarizing beam splitter then to Thorlabs PDA100A and a camera. They are there for additional/optional diagnostic so they're there for good. The PD is temporary hooked up to CH3 of the mad box (in place of CLF) for co-resonance temperature tuning.
Added channels H1:SQZ-OPO_IR_LF (DAQ) and H1:SQZ-OPO_IR_DC (EPICS) to readout the new PD monitoring the IR light at the output of the OPO, when the beam diverter is closed and the flipper is in. The PD needs to be connected to the 2nd channel of the tabletop interface box on SQZT6.