WP7713
History: HAM2 and HAM3 cannot switch the GS13s to high gain via Guardian without a trip of the chamber. All other HAM chambers, except HAM1 of course, do not have this issue. A python script that is called from the "commands" medm screen is a bit more reliable to do this switching, but still not robust. A few years back Hugh and I had a look into this and noted that Guardian would take a much longer time to do the actual switching (alog 24130). The script back then was a perl script but has since been converted and preforms the same.
Current: Today I started by getting more data to maybe get some clues at to what is going on. I started out by bringing the ISI_HAM3 Guardian to Isolated with the GS13 gain switching turned on. I recorded times and the outcome. As this would trip, it would automatically bring back the gains and then I would do the whole process again but switch the GS13 gains with the python script. Below is a table of most of the times I ran through the states and switched with Guardian or with python script (unfortunately, there are a few tests that I did not record due to having too many windows open and getting lost or distracted by other control room activities):
HAM3
| Method and direction |
UTC Time |
Length of Transition (sec) |
Outcome |
Notes |
| GRD to High gain |
16:10:20 |
1.56 |
Tripped |
|
| GRD to Low gain |
16:10:30 |
1.52 |
Trip recovery |
|
| Script to High |
16:15:52 |
0.26 |
Success |
|
| Script to Low |
16:16:44 |
0.26 |
Tripped |
|
| GRD to High |
18:28:51 |
1.53 |
Tripped |
Added wait=False kwarg, no change in time, seemed like it didn't work. |
| GRD to Low |
18:29:00 |
1.54 |
Trip recovery |
Still with wait=False, but changed back after this. |
| Script to High |
18:35:00 |
0.26 |
Success |
|
HAM4
| Method and direction |
UTC Time |
Length of Transition (sec) |
Outcome |
Notes |
| GRD to Low |
16:54:15 |
1.54 |
Success |
|
| GRD to High |
16:56:48 |
1.52 |
Success |
|
| Script to Low |
16:58:10 |
0.26 |
Success |
|
| Script to High |
16:59:00 |
0.26 |
Success |
|
So though Guardian is obviously unreliable, the script also does not work perfectly for HAM3. the times that the HAM3 and HAM4 Guardian nodes take to make the switch is the same, so I don't see the longer time being the problem.
What GRD does different
The python script uses the epics caput method to quickly loop through the 6 degrees of freedom and places the mask values in the appropriate channel to turn on or off FM 4 & 5. Guardian similarly loops through each dof, but for each one it will check that the value was actually written before moving on to the next dof. In particular it uses the LIGOFilterManager class to do the switching, which has the key word (optional) argument to not wait for a write confirmation before moving on. When I changed this kwarg to be wait=False, I did not see a change. Perhaps if I can figure out why the kwarg isn't working, then it may be a solution to the longer times, but it still doesn't solve the original issue.
Other items worth noting
- The H1ISIHAM2 and H1ISIHAM3 CPU meters are slightly higher than H1ISIHAM4 or 5 (55msec vs 50msec per loop). This is small enough that it shouldn't be an issue.
- Dave and Hugh rebooted the IO Chasis to reset the BIO card (alog42937) but no change was seen.
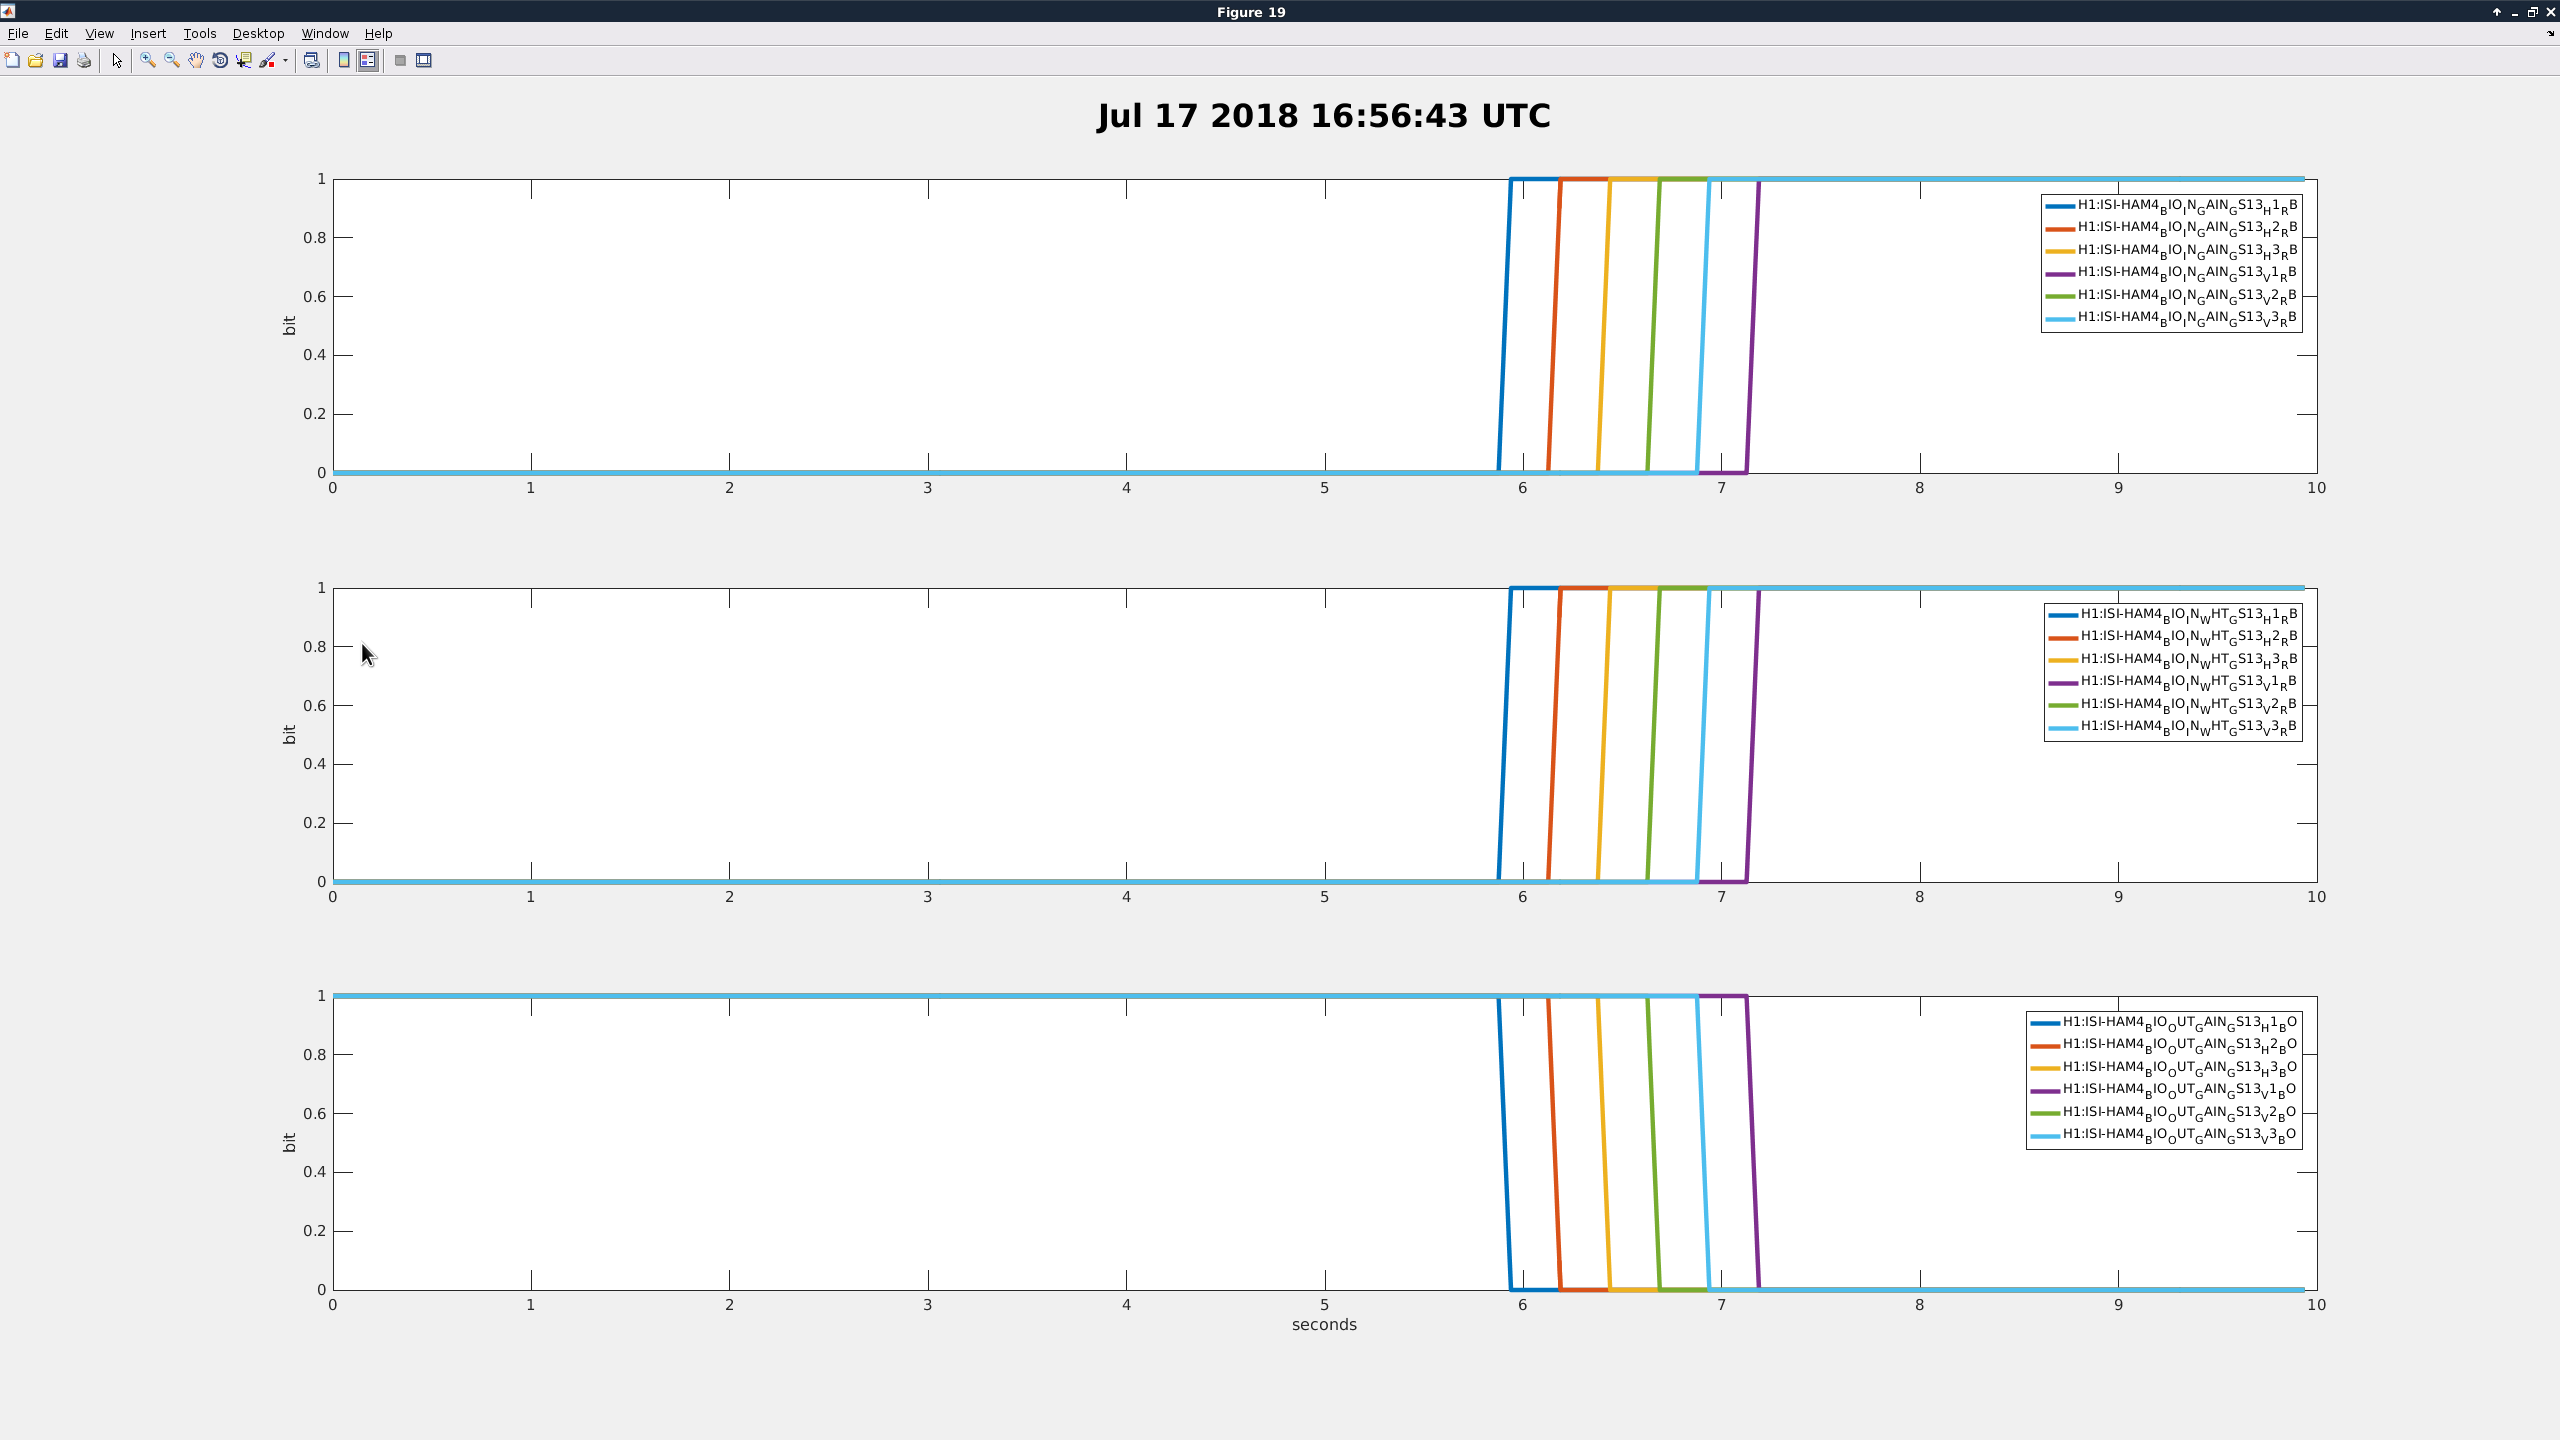
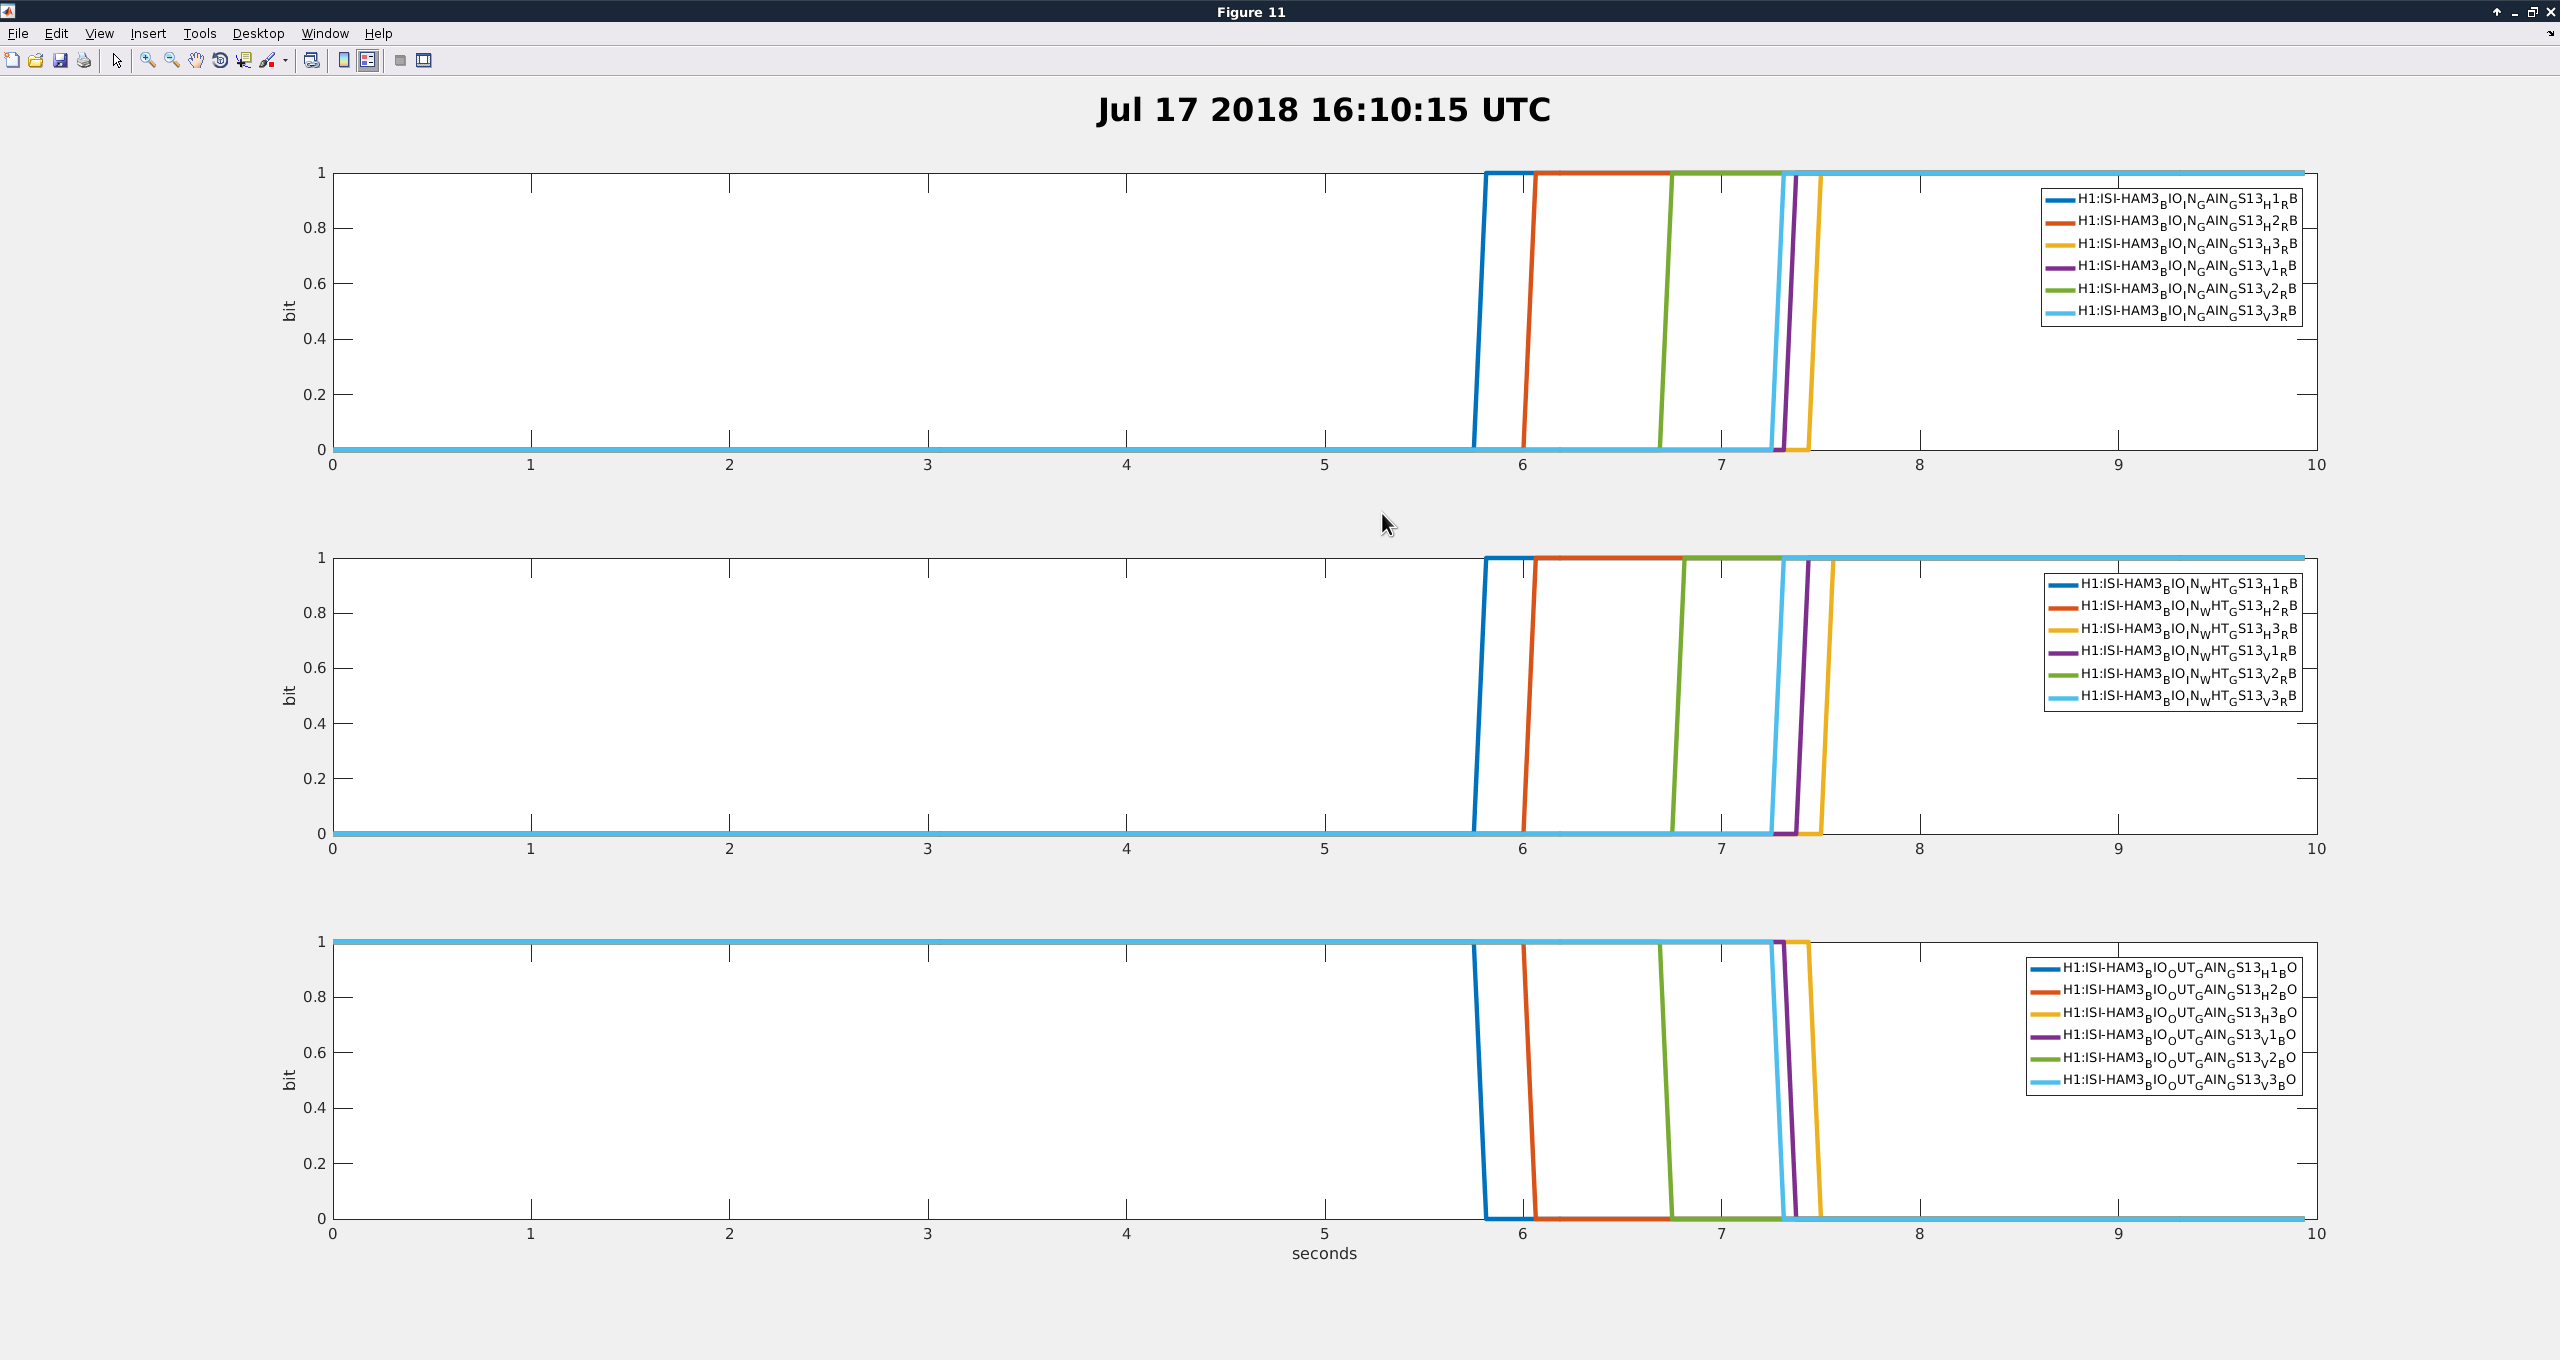
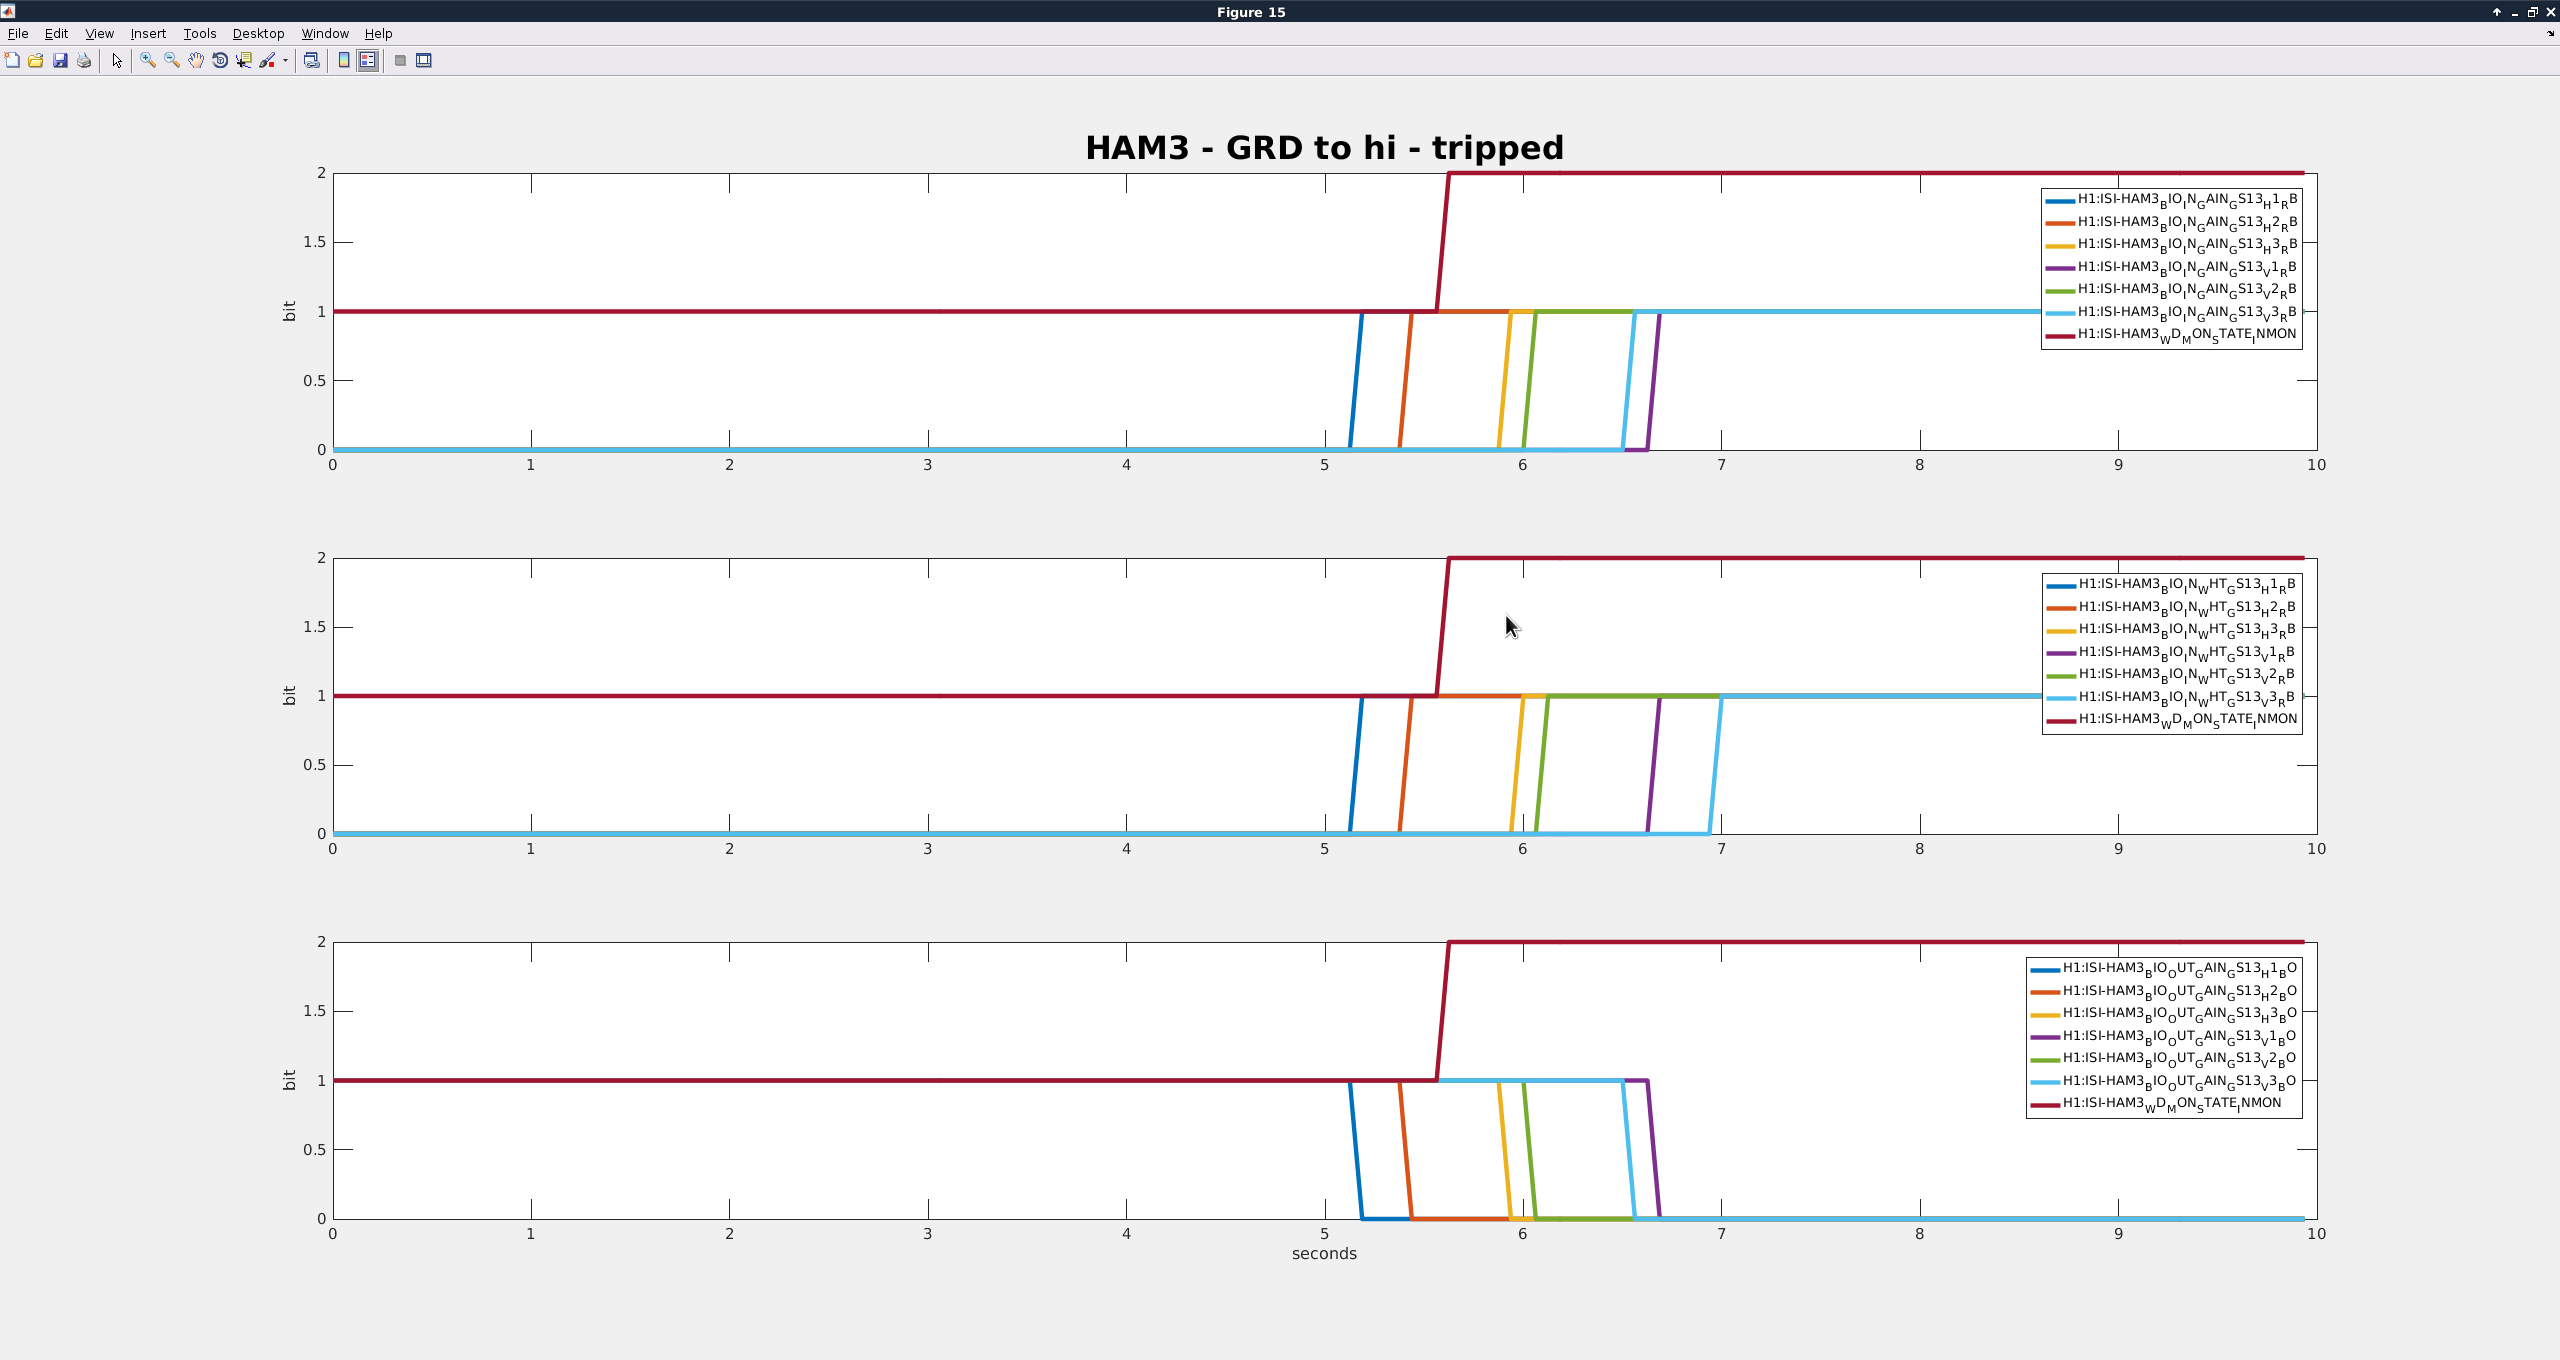
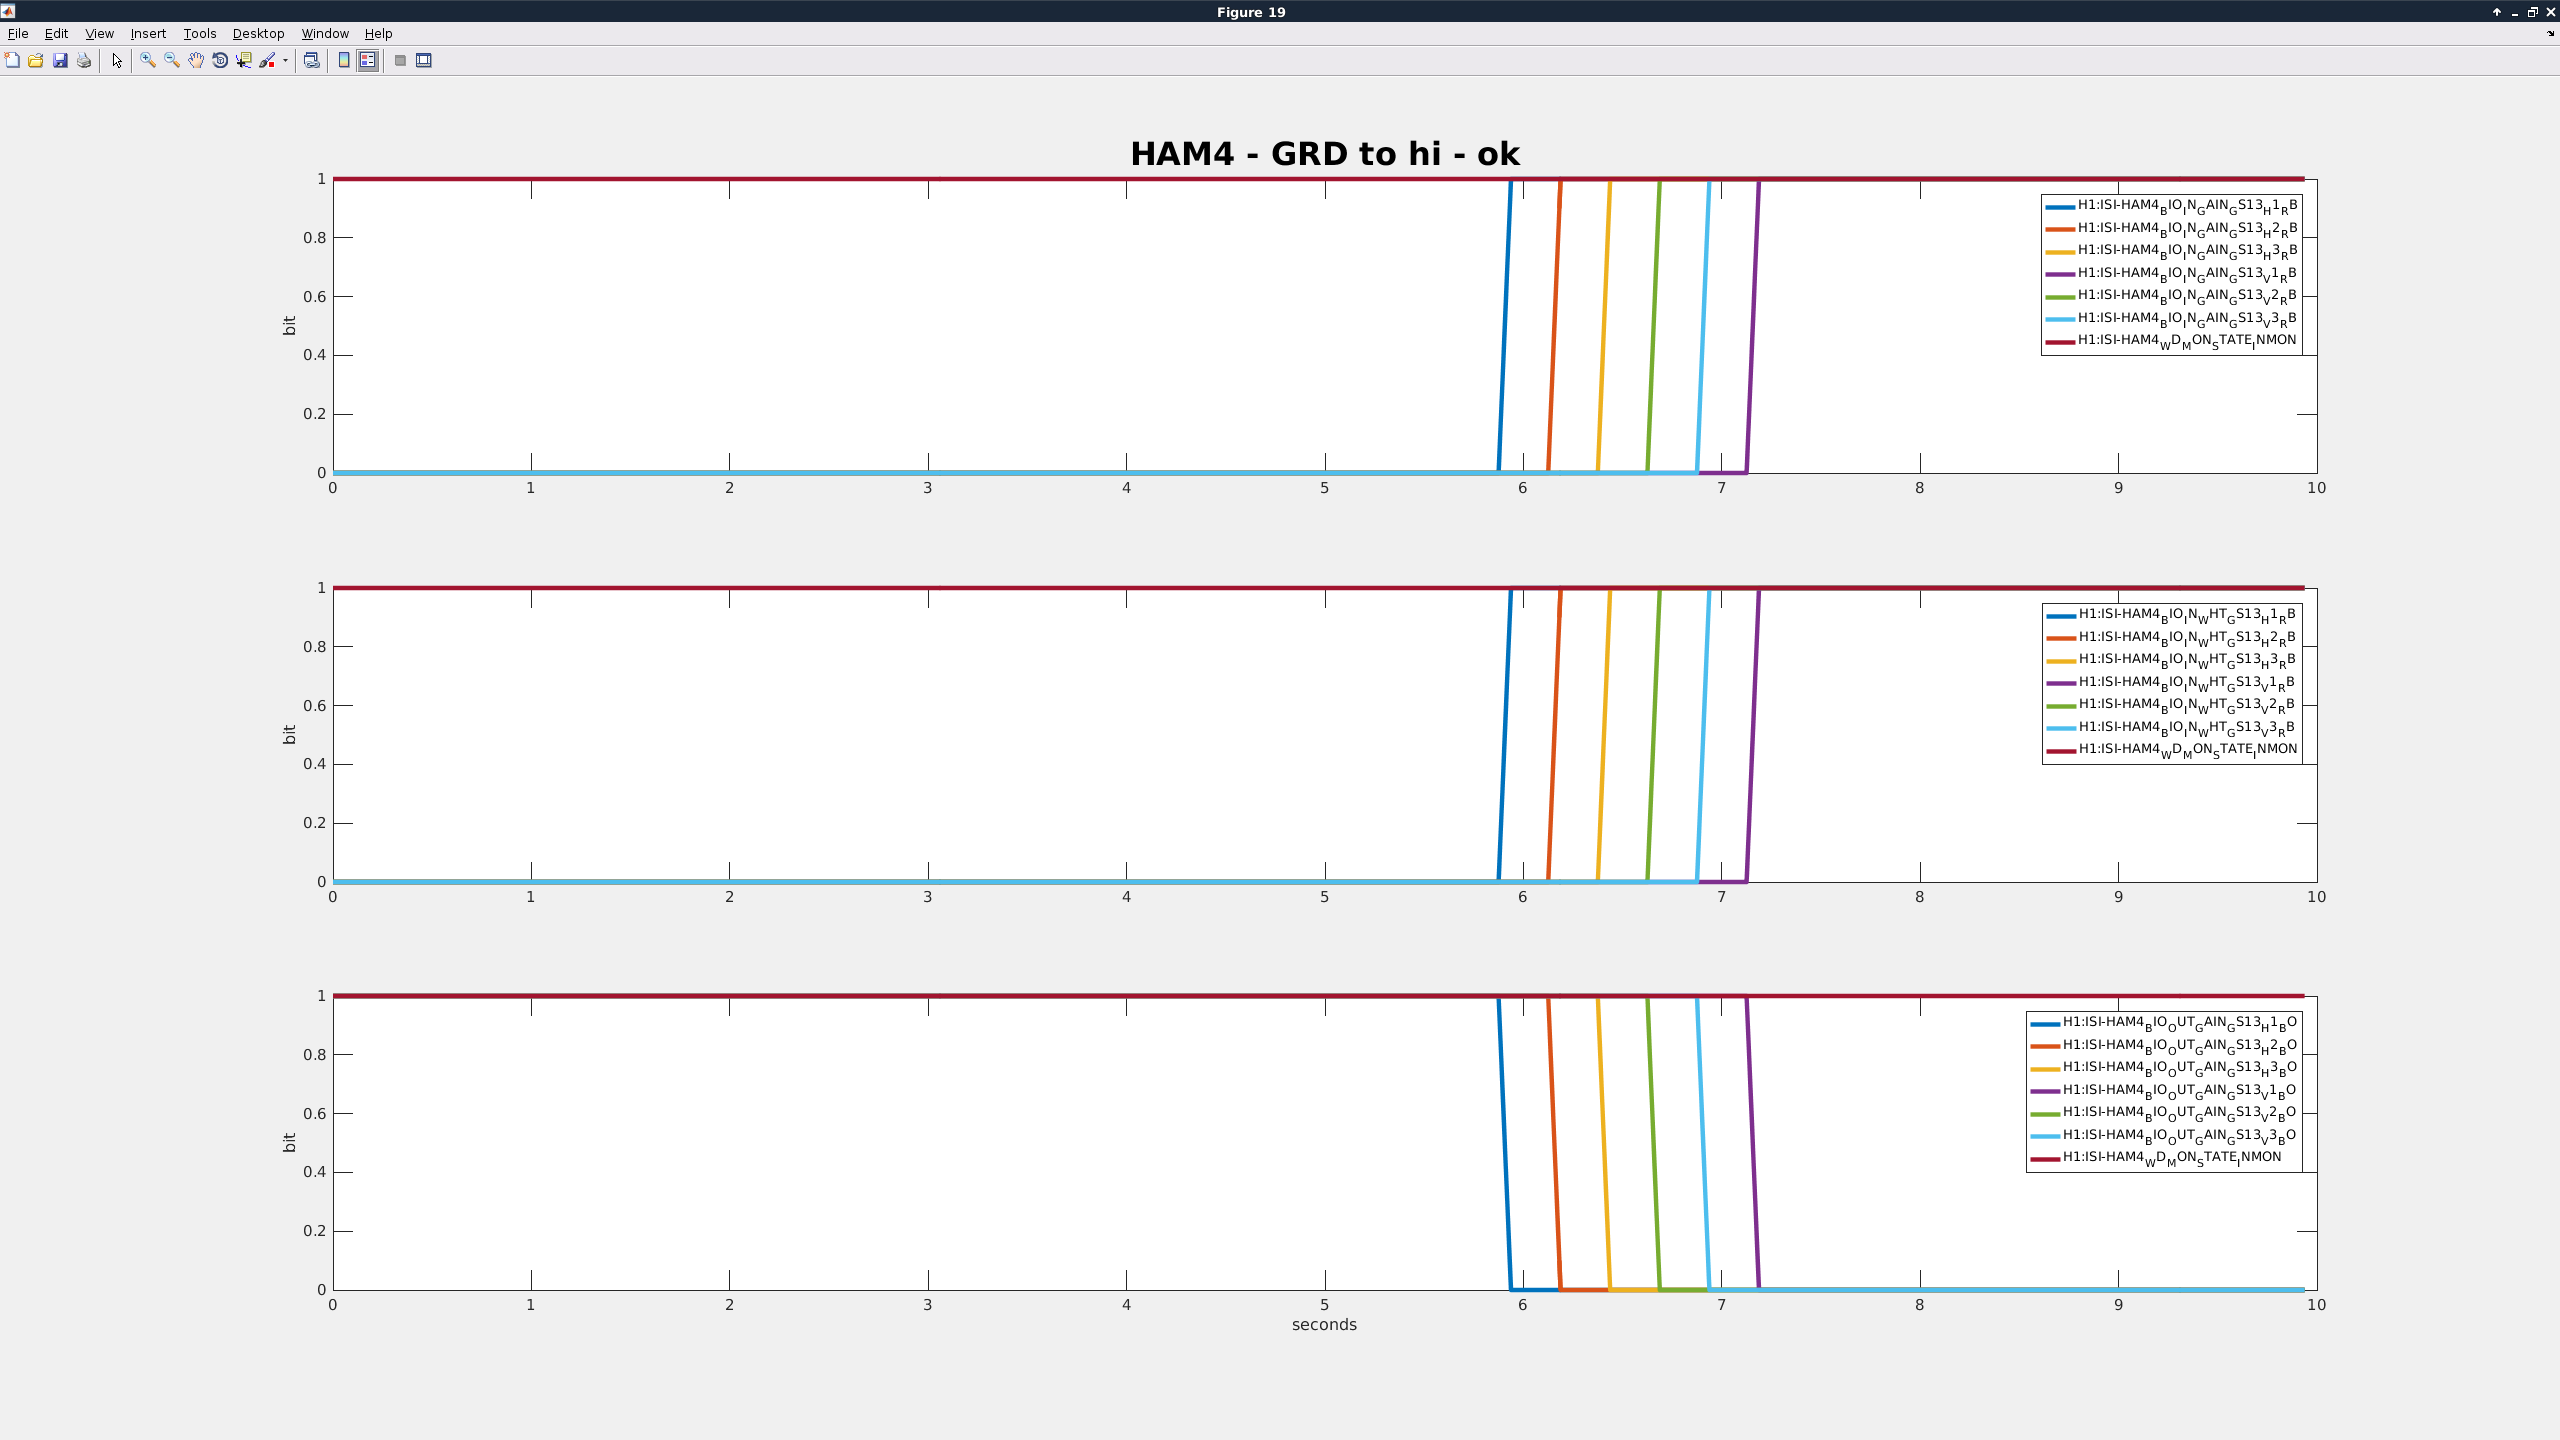
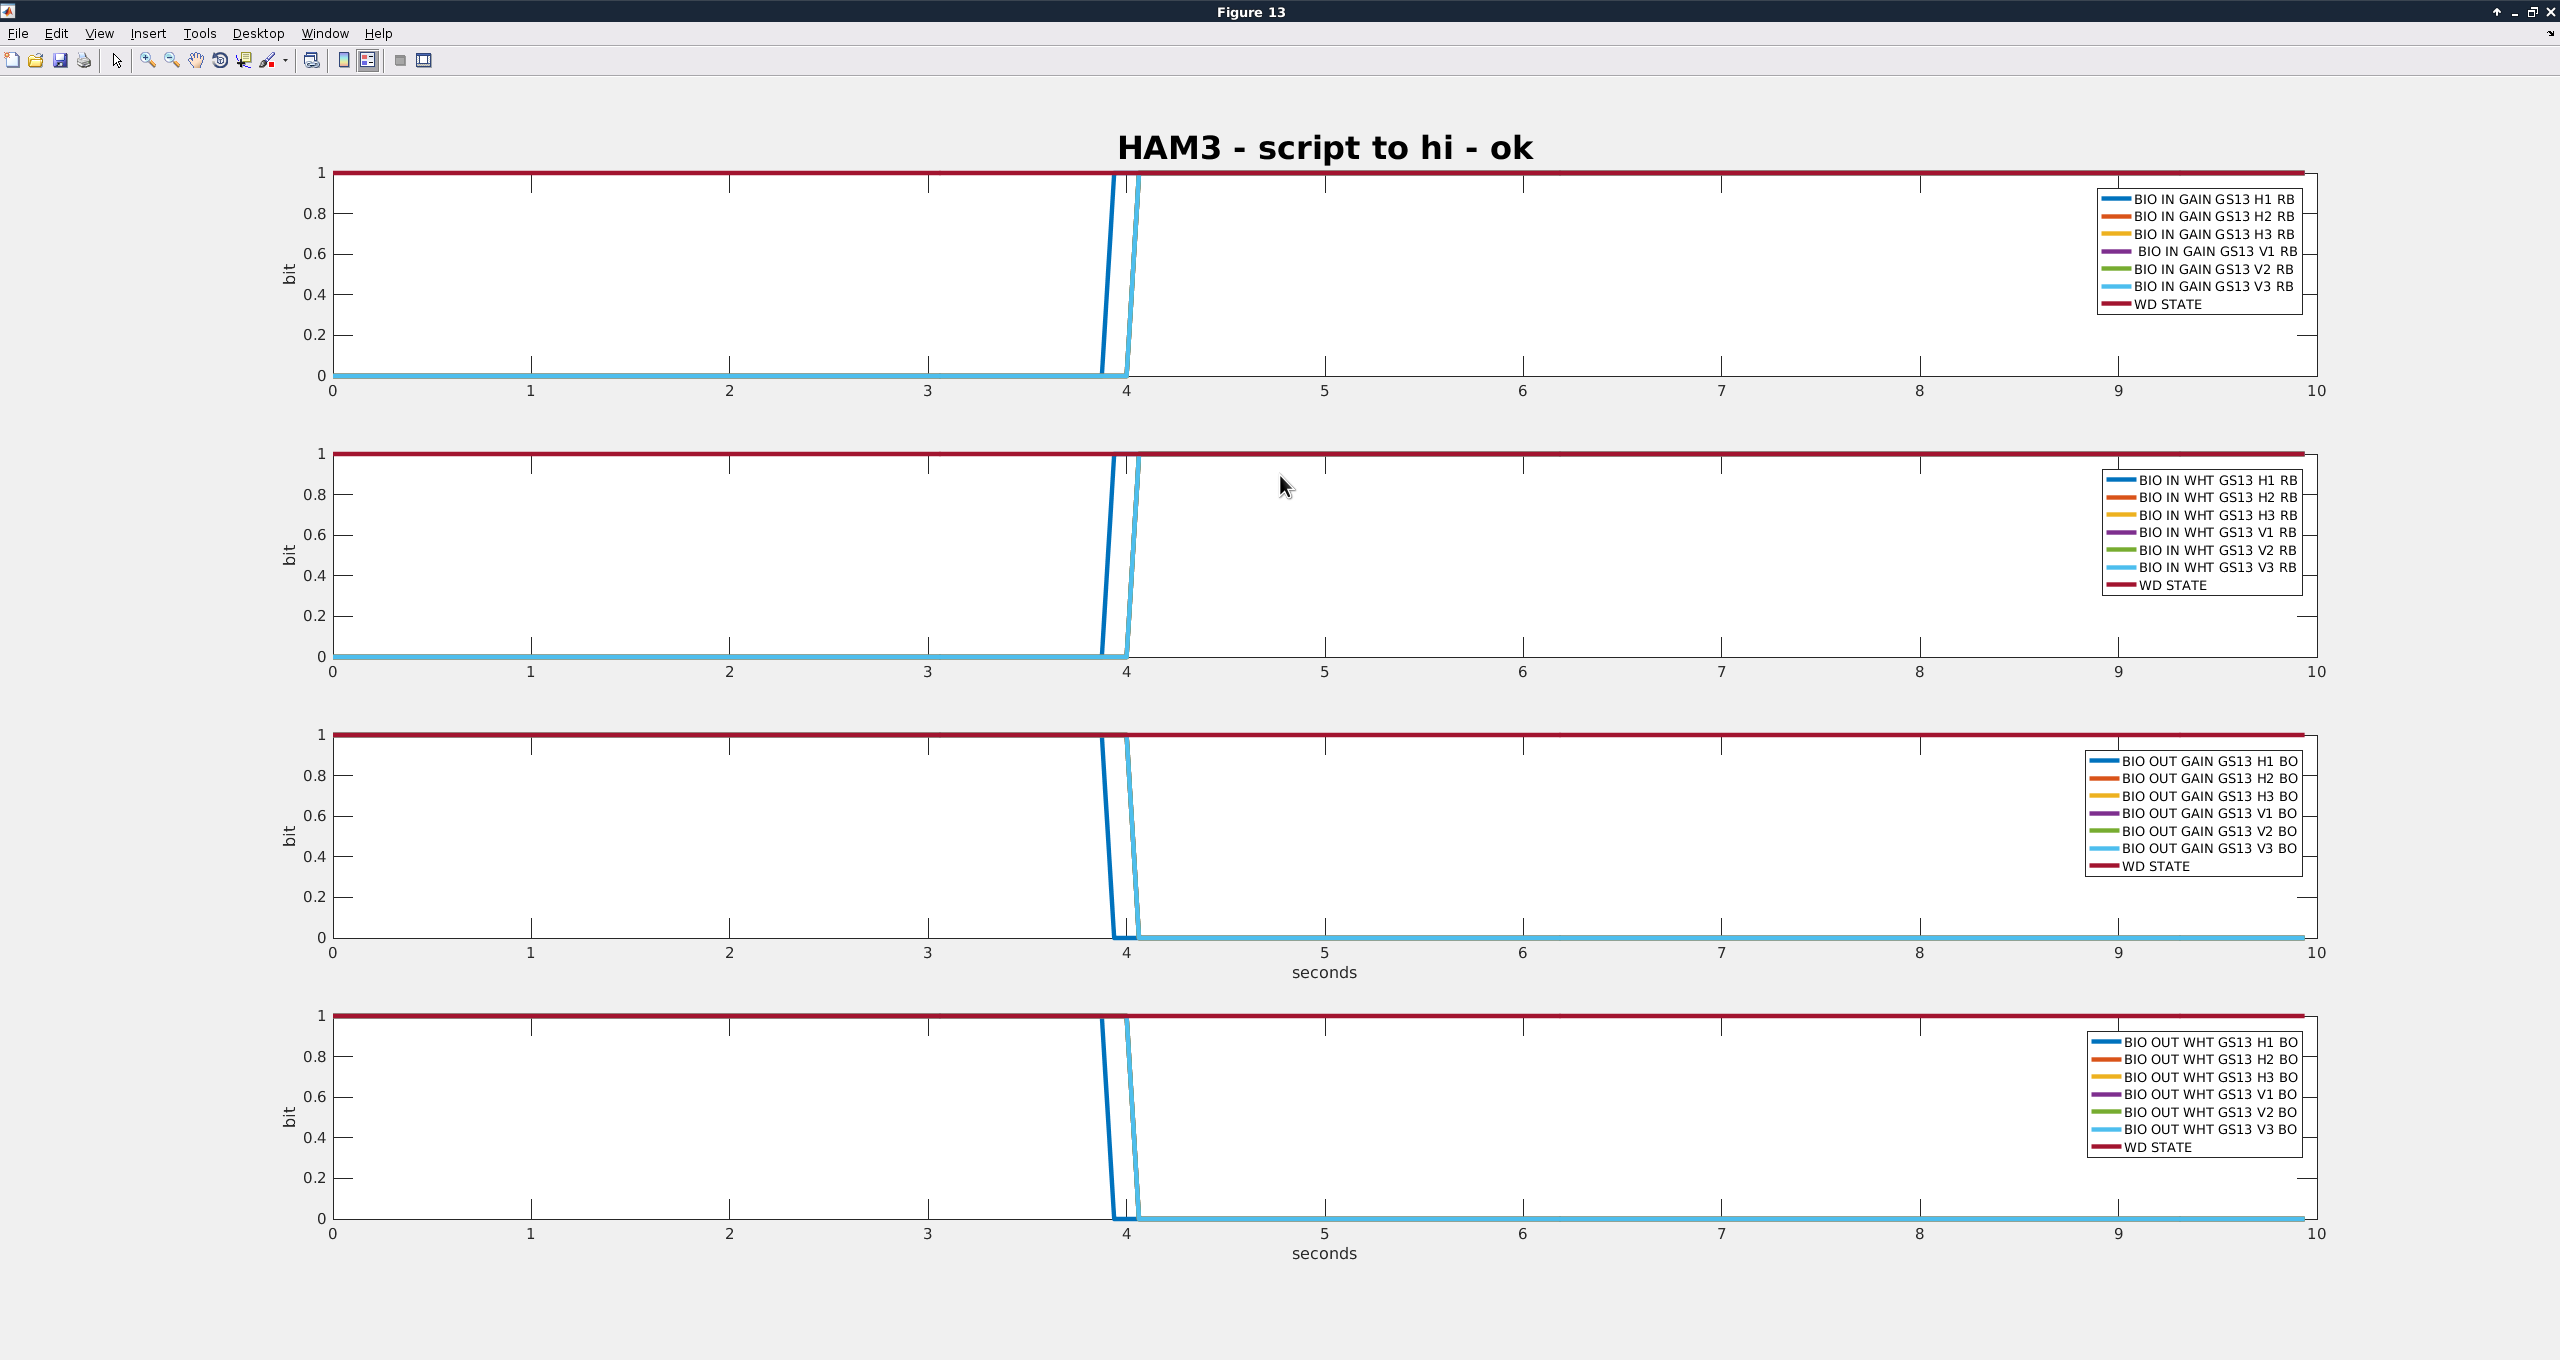
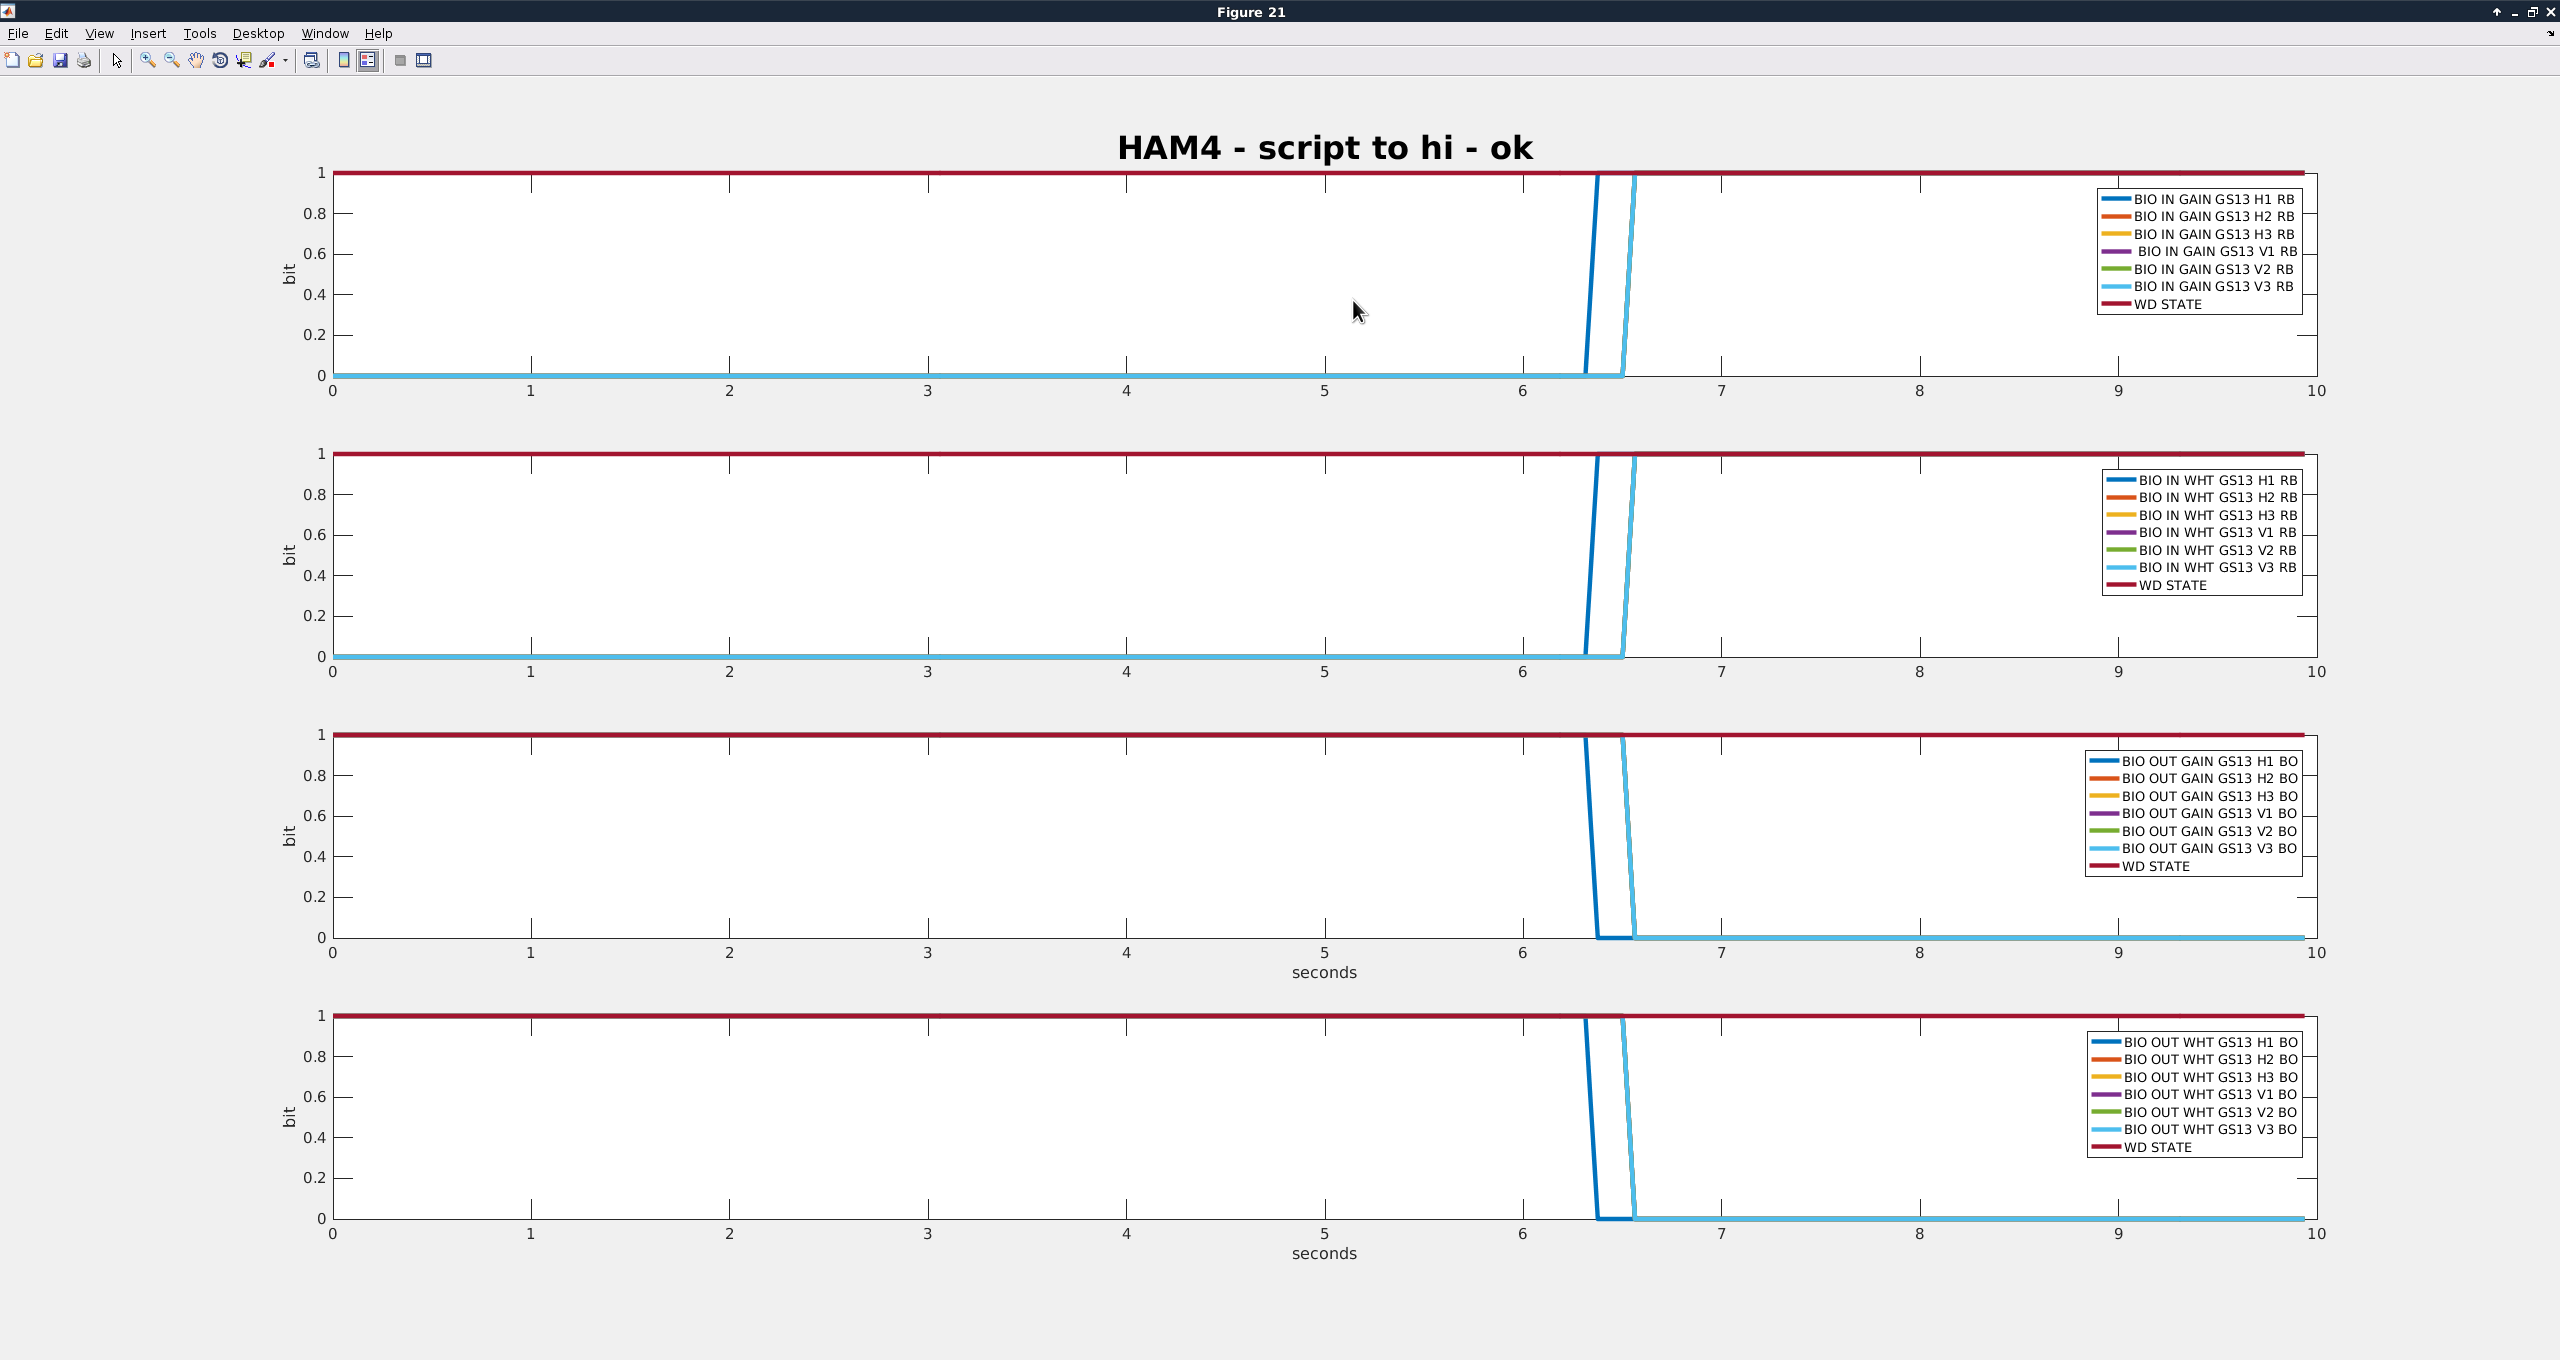
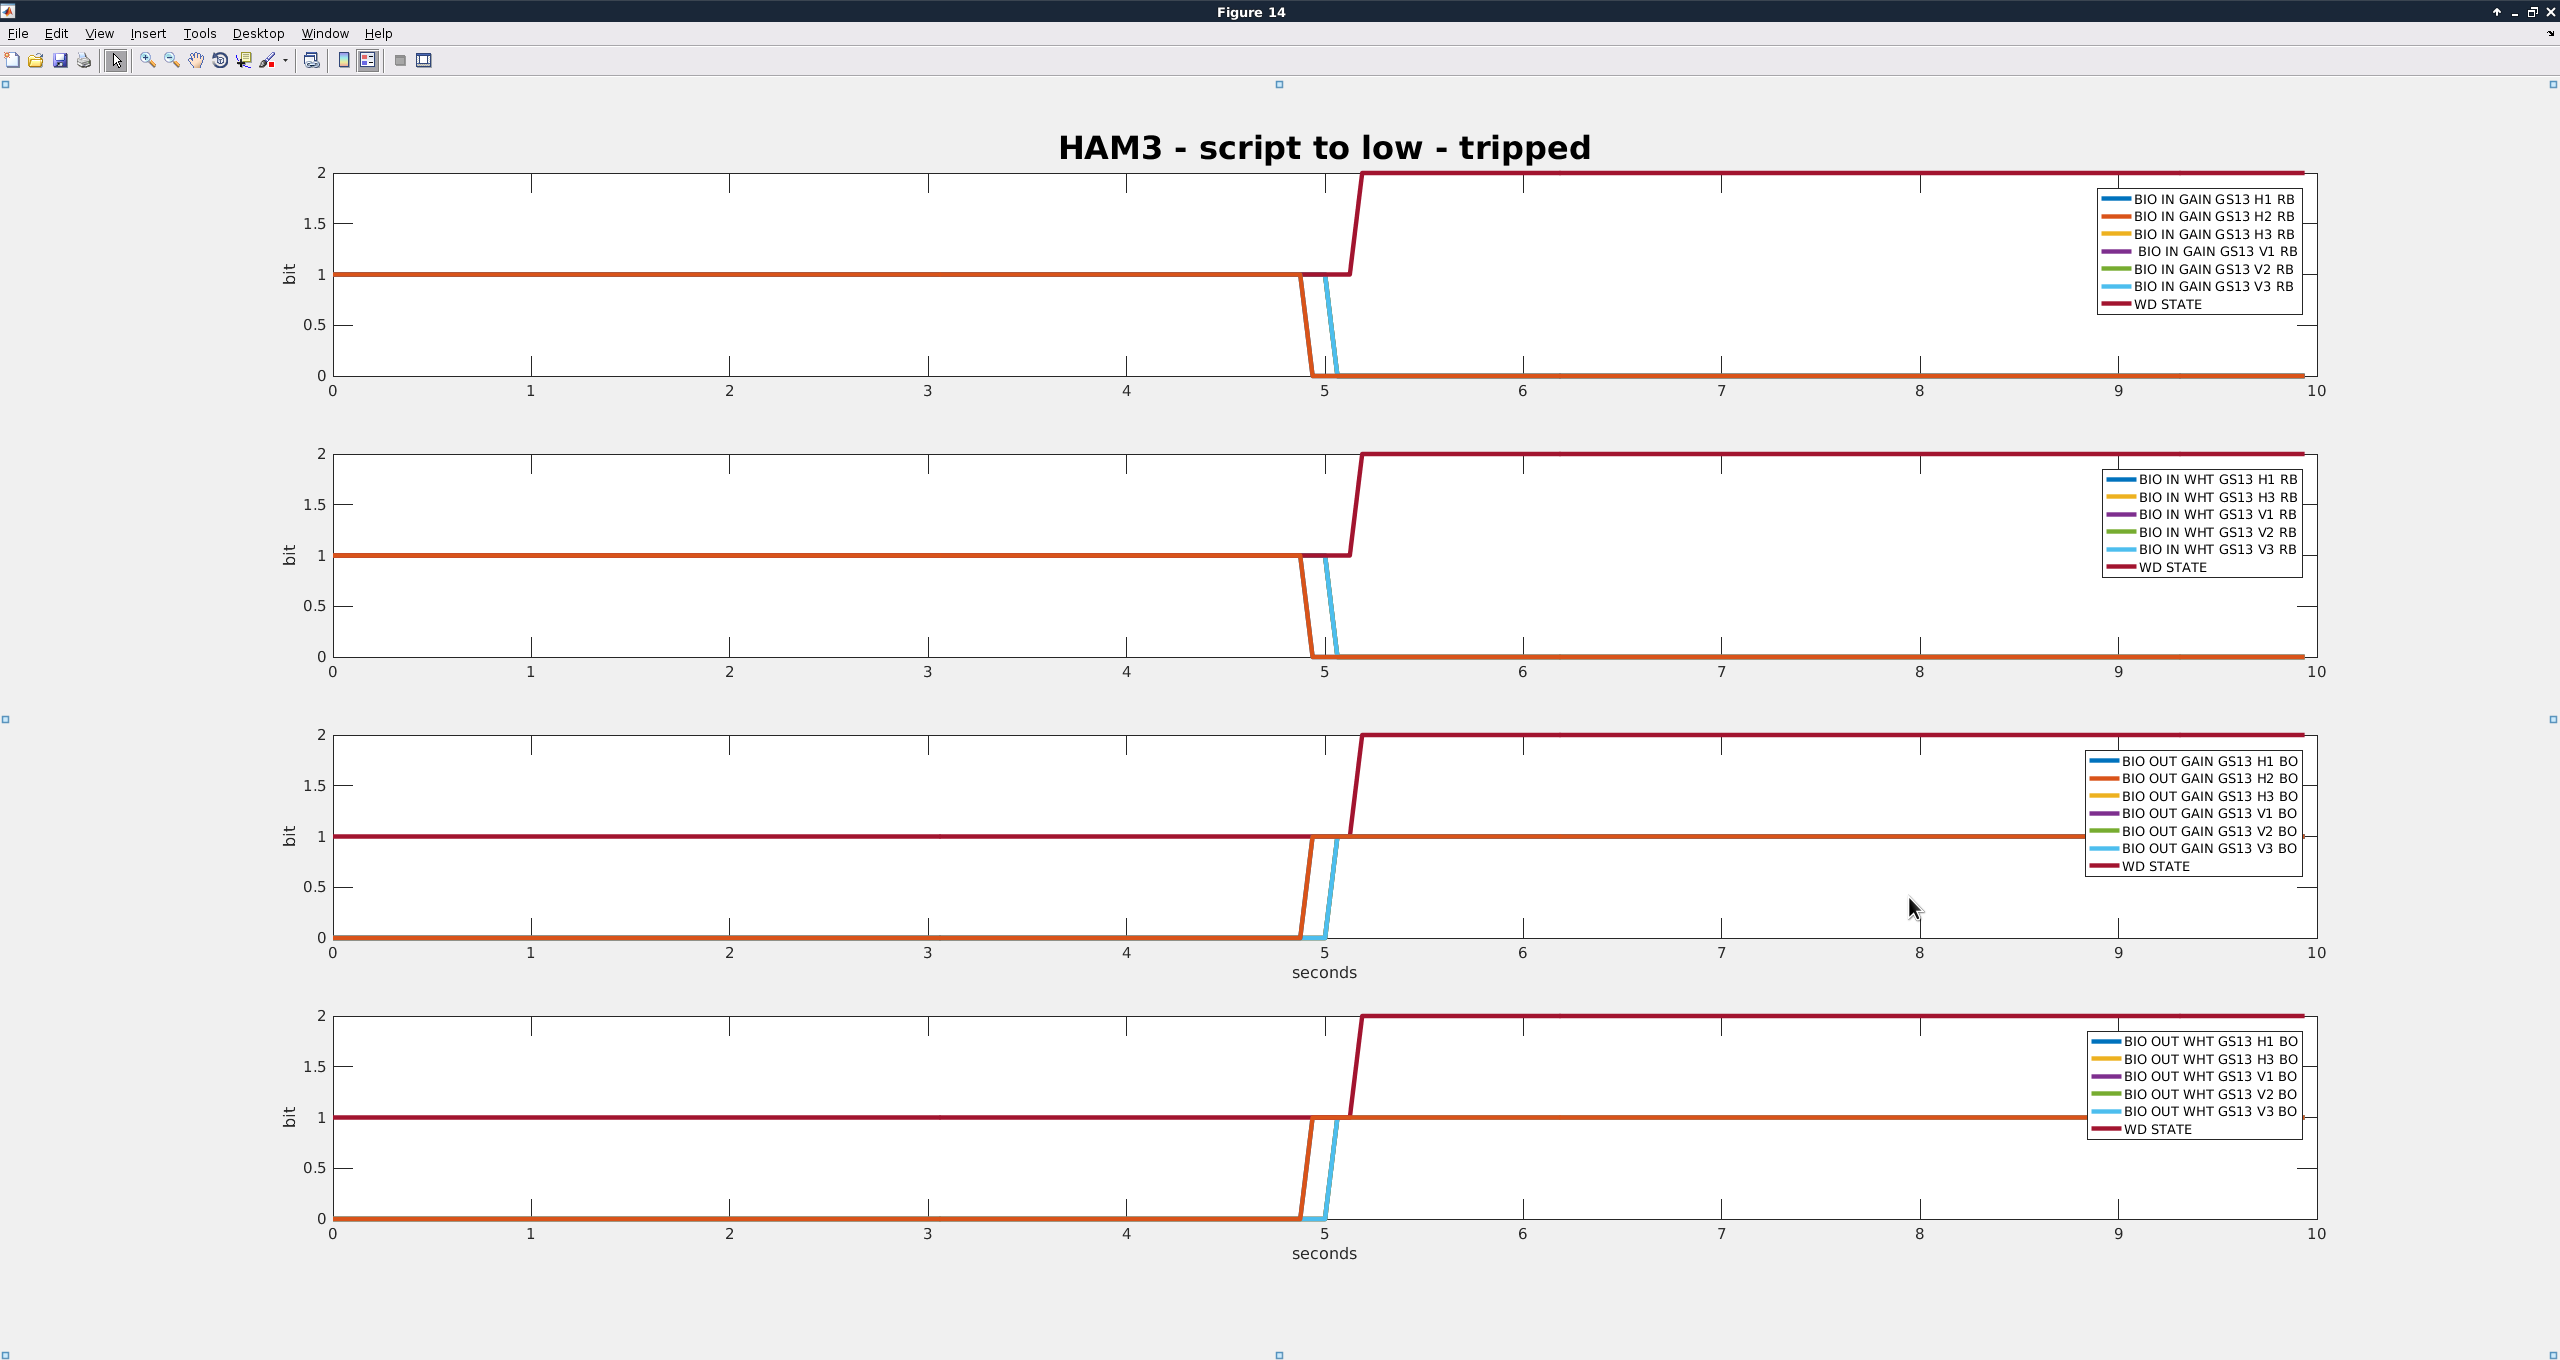
- Richard suggested that I look at the channels H1:ISI-HAM3_BIO_IN_{GAIN/WHT}_GS13_{dof}_RB and H1:ISI-HAM3_BIO_OUT_{GAIN/WHT}_GS13_{dof}_BO to make sure that the analog switches are actually being switched. I did not trend all of the grd failures, but two of them I didn't observe any switch failures in those.
Conclusion
Inconclusive so far, more investigation will be needed.