Fil, Georgia
Conclusion:
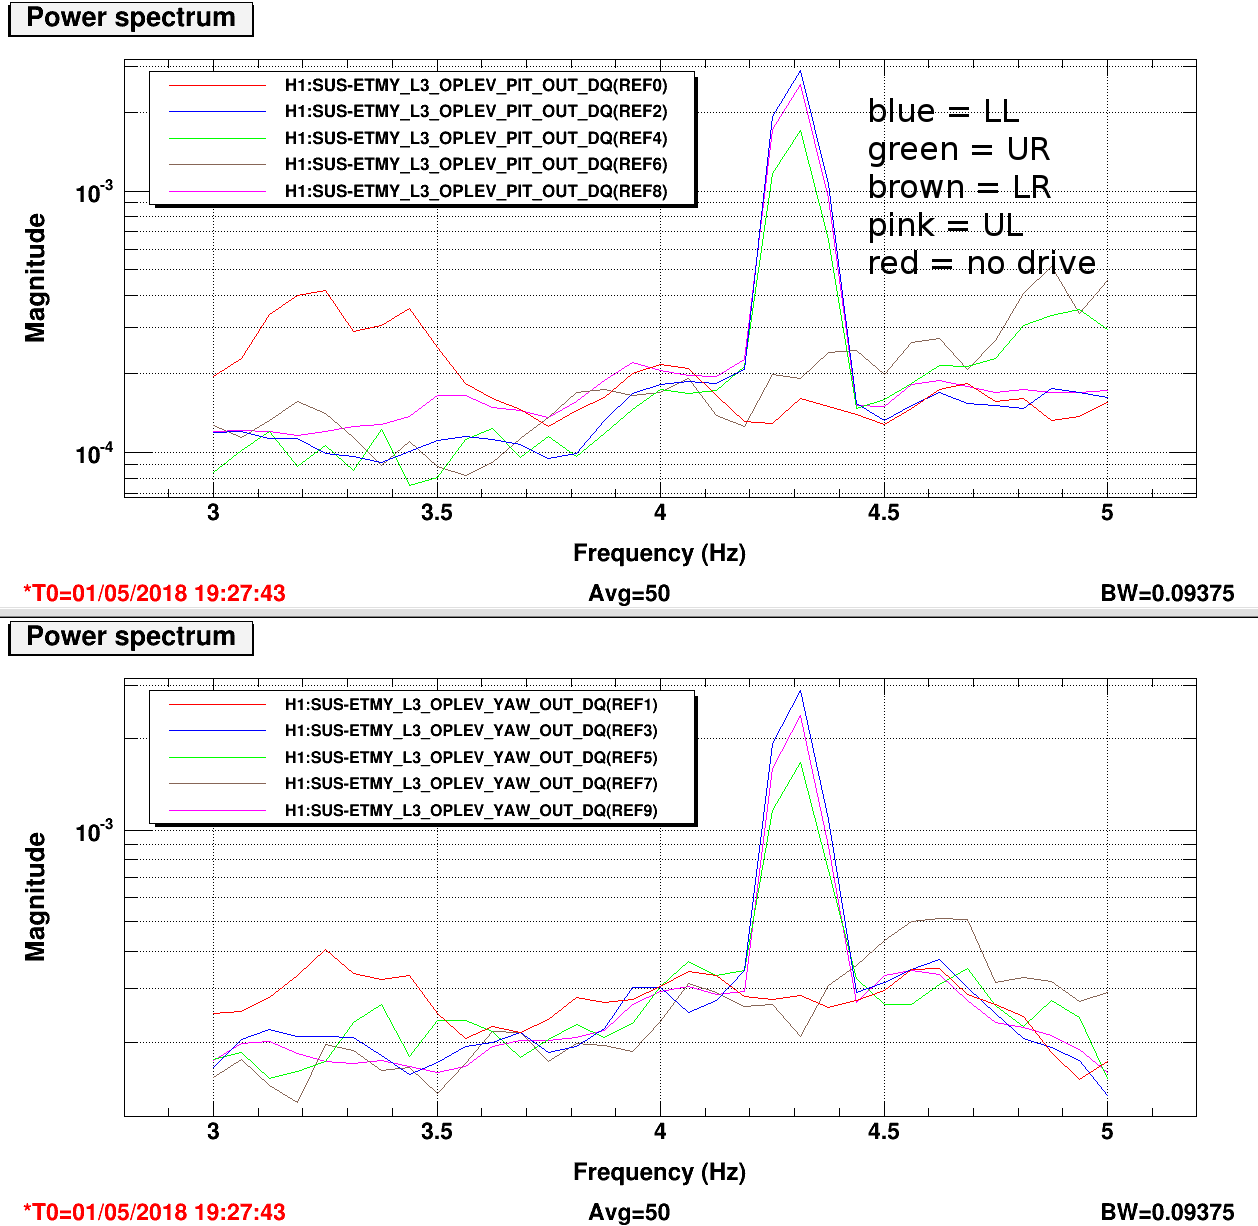
We believe that the ETMY LR ESD quadrant is disconnected somewhere in-chamber.
After problems with ESD-optical lever charge measurements, I tried to confirm that we are actually driving the LR quadrant by driving the individual ESD quadrants with a 4.3 Hz sine wave (30000 counts amplitude, with 100000 counts on the bias) and looking for the response on the optical lever pitch and yaw. A response was seen while driving the other 3 quadrants, but not the LR quadrant (see attached screenshot).
Fil and I went down to EY to check all the electrical connections outside the chamber. Between the HV chassis and the chamber feedthrough there is a resistor box and a pigtail connector. Everything outside the chamber is working as it should.
- We checked the connections in the resistor box, some connectors were loose but everything was connected. (Note the resistors in the box are actually bypassed, as their function (to limit current to the ESD electrodes) is now done inside the chassis. The box remains as an elaborate SHV-SHV connector.
- We drove the LL quadrant, with this signal hooked up to the LL, UL and LR quadrants at the resistor box, and only saw a response in LL and UL, confirming that we are driving up to the pigtail.
- We reseated the pigtail connector, repeated the above test, and saw nothing while driving the LR quadrant.
- Finally, we replaced the pigtail with a spare, and again saw nothing while driving the LR quadrant.


Excellent!
Here are a few pictures of the ITMY second set install from yesterday.