Displaying reports 47121-47140 of 83410.Go to page Start 2353 2354 2355 2356 2357 2358 2359 2360 2361 End
Reports until 23:35, Wednesday 05 July 2017
H1 PEM (PEM, SEI, SUS)
cheryl.vorvick@LIGO.ORG - posted 23:35, Wednesday 05 July 2017 - last comment - 23:39, Wednesday 05 July 2017(37344)
Earthquake - 06:31:35UTC. big and close I'd guess

Beat all of our sensors hear and looks like it's off the top of the seismic plot already.

Everything is tripped!

Comments related to this report
cheryl.vorvick@LIGO.ORG - 23:39, Wednesday 05 July 2017 (37345)

F-E Region:     Montana
Time:     2017-07-06 06:30:16.5 UTC
Magnitude:     5.8
Epicenter:     112.32°W  47.06°N
Depth:     10 km
Status:     A - automatic

H1 General
cheryl.vorvick@LIGO.ORG - posted 22:23, Wednesday 05 July 2017 (37343)
SVN Check
Non-image files attached to this report
H1 ISC
cheryl.vorvick@LIGO.ORG - posted 22:00, Wednesday 05 July 2017 (37342)
ALS_Y_QPD_A/B centering changed after todays EY issues

20 day trend attached - changes in Y_QPD_A might be OK, but are larger than other changes in the plot

Images attached to this report
H1 General
cheryl.vorvick@LIGO.ORG - posted 17:45, Wednesday 05 July 2017 (37341)
Ops Eve Transition:

TITLE: 07/06 Eve Shift: 23:00-07:00 UTC (16:00-00:00 PST), all times posted in UTC
STATE of H1: Observing at 65Mpc
OUTGOING OPERATOR: Jim
CURRENT ENVIRONMENT:
    Wind: 14mph Gusts, 12mph 5min avg
    Primary useism: 0.03 μm/s
    Secondary useism: 0.06 μm/s
QUICK SUMMARY:

Images attached to this report
H1 General
jim.warner@LIGO.ORG - posted 16:02, Wednesday 05 July 2017 (37339)
Shift Summary

TITLE: 07/05 Day Shift: 15:00-23:00 UTC (08:00-16:00 PST), all times posted in UTC
STATE of H1: Observing at 66Mpc
INCOMING OPERATOR: Cheryl
SHIFT SUMMARY: Relatively easy maintenance day. 
LOG:
15:00 Karen to EY, JeffB & ChrisS to HAM6, Robert setting up injection in the corner, JohnW and Bubba to the roof
15:45 Richard to LVEA, Marc to LVEA
16:00 Fil to EY
16:15 Robert done, Jason doing HPO measurements, we were locked until Jason requested IFO down
16:15 Christina to EX
16:30 ChrisS to MY
16:30 Marc to mids/ends
17:00 Timing glitch kills EY, Dave restarts all EY models
18:30 Rick to EX
18:30 Starting initial alignment
19:30 We find SUS IM models are dead, Dave restarts remotely

20:43 Lockloss from reverting ASC-Y TR offsets to old values

21:14 Back Observing
 

LHO VE
chandra.romel@LIGO.ORG - posted 15:02, Wednesday 05 July 2017 - last comment - 15:06, Wednesday 05 July 2017(37336)
HAM 11,12 outer o-ring leaks

After Kyle attempted to tighten HAM 11 and 12 south door bolts (they were already tight) last week, I leak checked the annulus again. Leak is still e-5 Torr-L/s of He range on HAM 11 south door. I didn't thoroughly check HAM 12 door again since background was high. Last week it measured e-7 Torr-L/s of He range. Connected aux cart and leak checker with hung turbos to HAM 11 and 12 and approached ~1e-5 Torr by noon. HAM 11 AIP still read overpressure with aux cart assistance. HAM 12 AIP read 6 mA range with assistance and 7 mA with aux carts valved out. I turned both AIPs off to preserve them, until we can vent the diagonal to remove and repair the door seals.

Comments related to this report
chandra.romel@LIGO.ORG - 15:06, Wednesday 05 July 2017 (37337)

Looks like we replaced HAM 11 AIP in May AND Nov. 2016?!

https://alog.ligo-wa.caltech.edu/aLOG/index.php?callRep=31724

LHO VE
kyle.ryan@LIGO.ORG - posted 14:41, Wednesday 05 July 2017 (37335)
Used rotohammer drill to install drop-in anchors in LVEA floor
~0900 - 1200 hrs. local 

(part of ECR see E1700073-v2) 

This completes WP #7056
H1 SEI
hugh.radkins@LIGO.ORG - posted 14:38, Wednesday 05 July 2017 (37334)
LHO LVEA Tilt Studies at Roam7--With wind from S

Moved the roaming STS2 to position 7 and here report response during wind of 3 July.  Not as windy as usual studies, only about 15 mph rather than 20.  The wind was at 45degrees, that is directly from true South, or, from +Y-X.

Similar to Roam6, the response at Roam7 indicates this position is quieter than the ITMY location, especially in the X dof.  Since this position move was parallel to the 'south' wall wrt Roam6, it makes some sense that the X dof response is nearly identical to the response to wind at positions 6 and 7.  Maybe time to jog north (away from south wall.)  Also, moving away from the 'pinning' potential of BSC4 does nothing to suggests a real pinning effect.

Images attached to this report
H1 AOS (PEM)
richard.mccarthy@LIGO.ORG - posted 13:54, Wednesday 05 July 2017 (37333)
BSC3 Y accelerometer
I tightened the connector and provided strain relief for the cable.  This should fix the glitching that was seen.
H1 CDS
david.barker@LIGO.ORG - posted 12:38, Wednesday 05 July 2017 - last comment - 13:20, Wednesday 05 July 2017(37331)
restarted all models at EY and on h1sush2b

An earlier glitch required a restart of all models at EY (h1susey, h1seiey, h1iscey and h1susauxey). The order was to stop all models on the Dolphin'ed machines, then start all the models in the order h1iscey, h1seiey and h1susey. Then the sus aux was stop-started. Finally all IPC errors and CRCs were cleared.

Later an unknown glitch caused the models on h1sush2b (sus-im system) to stop. The dmesg is just showing Dolphin-like errors. I stopped and restarted the two models on this system.

Comments related to this report
jeffrey.kissel@LIGO.ORG - 13:20, Wednesday 05 July 2017 (37332)CDS, SUS
I've opened two FRS Tickets (and marked as pending for closure) for the record on these front-end crashes:
EY Computers: 8452
h1susham2b: 8451
H1 SUS (CDS)
filiberto.clara@LIGO.ORG - posted 12:37, Wednesday 05 July 2017 (37330)
H1 SUS ETMY UIM/L1 Coil Driver Monitor

WP 7064
FRS 8013
alog 35974
alog 37169

Continued looking at the ~4300 ct offset on some of the monitor channels for ETMY L1 (UIM). SCSI cable was disconnected from both the AA and IO chassis. Visual inspection showed no bending of pins on either the cable or connectors. Cable was reconnected and all monitor signals showed reasonable values, no offset. Missing mounting hardware was placed on the ADC interface cards on the IO chassis. During this work, the front end computers at EY glitched and had to be restarted.

H1 PSL
jason.oberling@LIGO.ORG - posted 09:34, Wednesday 05 July 2017 (37328)
PSL Weekly FAMIS Tasks (FAMIS 3657 & 8429)

I performed the weekly PSL FAMIS tasks during today's maintenance window.

HPO Pump Diode Operating Current Adjustment (FAMIS 8429)

All HPO pump diode operating currents were increased by 0.2 A (this was done with the ISS OFF).  The first attachment shows the diode box decay over the last 7 days, and the second shows the PSL Beckhoff main screen after the operating current adjustment was complete (included for future reference).  The below table summarizes the operating current change:

  Operating Current (A)
Old New
DB1 48.7 48.9
DB2 51.6 51.8
DB3 51.6 51.8
DB4 51.6 51.8

I did not adjust the operating temperatures of the diode boxes.  The ISS has been turned back ON and the PSL is now outputting 157.5 W.  This completes FAMIS 8429.

Power Watchdog Reset

I reset both PSL power watchdogs at 16:22 UTC (9:22 PDT).  This completes FAMIS 3657.

Images attached to this report
LHO General
corey.gray@LIGO.ORG - posted 08:14, Wednesday 05 July 2017 (37327)
OWL Operator Summary

TITLE: 07/05 Owl Shift: 07:00-15:00 UTC (00:00-08:00 PST), all times posted in UTC
STATE of H1: Observing at 65Mpc
INCOMING OPERATOR: Jim
SHIFT SUMMARY:

Quiet shift with H1 locked for 16hrs in quiet seismic conditions & Wed Maintenance Day begins.

LHO General
corey.gray@LIGO.ORG - posted 00:12, Wednesday 05 July 2017 (37326)
Transition To OWL

TITLE: 07/05 Owl Shift: 07:00-15:00 UTC (00:00-08:00 PST), all times posted in UTC
STATE of H1: Observing at 67Mpc
OUTGOING OPERATOR: Cheryl
CURRENT ENVIRONMENT:
    Wind: 6mph Gusts, 3mph 5min avg
    Primary useism: 0.01 μm/s
    Secondary useism: 0.06 μm/s

No wind & usieism in the weeds.  Nice quiet night (knock on wood).
QUICK SUMMARY:

video0 & video4 are down, so I'll bring them back as I go through the Ops Checksheet as well.  Whoops, and L1 just went down as well.

H1 General
cheryl.vorvick@LIGO.ORG - posted 00:03, Wednesday 05 July 2017 (37324)
Ops Eve Summary:

TITLE: 07/05 Eve Shift: 23:00-07:00 UTC (16:00-00:00 PST), all times posted in UTC
STATE of H1: Observing at 67Mpc
INCOMING OPERATOR: Corey
SHIFT SUMMARY: locked most of the shift
LOG:

H1 SEI (SEI)
corey.gray@LIGO.ORG - posted 02:54, Tuesday 04 July 2017 - last comment - 09:42, Wednesday 05 July 2017(37310)
Monthly SEI Seismometer Mass Check (FAMIS#6088)

T240 Centering Check:

Averaging Mass Centering channels for 10 [sec] ...
2017-07-04 02:46:11.358502
There are 8 T240 proof masses out of range ( > 0.3 [V] )!
ETMX T240 2 DOF X/U = -1.166 [V]
ETMX T240 2 DOF Y/V = -1.116 [V]
ETMX T240 2 DOF Z/W = -0.848 [V]
ETMY T240 3 DOF X/U = -0.305 [V]
ITMX T240 1 DOF X/U = -0.774 [V]
ITMX T240 3 DOF X/U = -0.802 [V]
ITMY T240 3 DOF X/U = -0.305 [V]
ITMY T240 3 DOF Z/W = -0.386 [V]


All other proof masses are within range ( < 0.3 [V] ):
ETMX T240 1 DOF X/U = -0.08 [V]
ETMX T240 1 DOF Y/V = -0.055 [V]
ETMX T240 1 DOF Z/W = -0.034 [V]
ETMX T240 3 DOF X/U = -0.073 [V]
ETMX T240 3 DOF Y/V = -0.179 [V]
ETMX T240 3 DOF Z/W = -0.079 [V]
ETMY T240 1 DOF X/U = -0.071 [V]
ETMY T240 1 DOF Y/V = 0.239 [V]
ETMY T240 1 DOF Z/W = -0.279 [V]
ETMY T240 2 DOF X/U = 0.113 [V]
ETMY T240 2 DOF Y/V = -0.27 [V]
ETMY T240 2 DOF Z/W = -0.004 [V]
ETMY T240 3 DOF Y/V = -0.089 [V]
ETMY T240 3 DOF Z/W = 0.224 [V]
ITMX T240 1 DOF Y/V = -0.234 [V]
ITMX T240 1 DOF Z/W = -0.156 [V]
ITMX T240 2 DOF X/U = -0.186 [V]
ITMX T240 2 DOF Y/V = -0.142 [V]
ITMX T240 2 DOF Z/W = -0.199 [V]
ITMX T240 3 DOF Y/V = -0.146 [V]
ITMX T240 3 DOF Z/W = -0.096 [V]
ITMY T240 1 DOF X/U = -0.039 [V]
ITMY T240 1 DOF Y/V = -0.057 [V]
ITMY T240 1 DOF Z/W = -0.065 [V]
ITMY T240 2 DOF X/U = 0.114 [V]
ITMY T240 2 DOF Y/V = 0.135 [V]
ITMY T240 2 DOF Z/W = -0.005 [V]
ITMY T240 3 DOF Y/V = 0.041 [V]
BS T240 1 DOF X/U = -0.166 [V]
BS T240 1 DOF Y/V = -0.039 [V]
BS T240 1 DOF Z/W = 0.204 [V]
BS T240 2 DOF X/U = 0.062 [V]
BS T240 2 DOF Y/V = 0.179 [V]
BS T240 2 DOF Z/W = 0.008 [V]
BS T240 3 DOF X/U = 0.011 [V]
BS T240 3 DOF Y/V = -0.067 [V]
BS T240 3 DOF Z/W = -0.127 [V]
Assessment complete.


STS Centering Check:

Averaging Mass Centering channels for 10 [sec] ...


2017-07-04 02:52:11.355942
All STSs proof masses are within healthy range (< 2.0 [V]). Great!


Here's a list of how they're doing just in case you care:
STS A DOF X/U = -0.618 [V]
STS A DOF Y/V = 0.146 [V]
STS A DOF Z/W = -0.377 [V]
STS B DOF X/U = 0.479 [V]
STS B DOF Y/V = 0.3 [V]
STS B DOF Z/W = -0.312 [V]
STS C DOF X/U = -0.616 [V]
STS C DOF Y/V = -0.67 [V]
STS C DOF Z/W = -0.153 [V]
STS EX DOF X/U = -0.029 [V]
STS EX DOF Y/V = 0.612 [V]
STS EX DOF Z/W = -0.036 [V]
STS EY DOF X/U = -0.014 [V]
STS EY DOF Y/V = 0.147 [V]
STS EY DOF Z/W = 0.458 [V]
Assessment complete.

This closes FAMIS #6088.

Comments related to this report
jim.warner@LIGO.ORG - 09:42, Wednesday 05 July 2017 (37329)

I took the opportunity while the IFO was down for PSL stuff to recent ITMX and  ETMX. Will wait for the others to get worse before addressing them.

Averaging Mass Centering channels for 10 [sec] ...
2017-07-05 09:39:18.356265


There are 3 T240 proof masses out of range ( > 0.3 [V] )!
ETMY T240 3 DOF X/U = -0.309 [V]
ITMY T240 3 DOF X/U = -0.307 [V]
ITMY T240 3 DOF Z/W = -0.39 [V]


All other proof masses are within range ( < 0.3 [V] ):
ETMX T240 1 DOF X/U = 0.118 [V]
ETMX T240 1 DOF Y/V = 0.121 [V]
ETMX T240 1 DOF Z/W = 0.106 [V]
ETMX T240 2 DOF X/U = 0.07 [V]
ETMX T240 2 DOF Y/V = 0.062 [V]
ETMX T240 2 DOF Z/W = 0.095 [V]
ETMX T240 3 DOF X/U = 0.058 [V]
ETMX T240 3 DOF Y/V = 0.022 [V]
ETMX T240 3 DOF Z/W = 0.134 [V]
ETMY T240 1 DOF X/U = -0.078 [V]
ETMY T240 1 DOF Y/V = 0.243 [V]
ETMY T240 1 DOF Z/W = -0.283 [V]
ETMY T240 2 DOF X/U = 0.114 [V]
ETMY T240 2 DOF Y/V = -0.272 [V]
ETMY T240 2 DOF Z/W = -0.008 [V]
ETMY T240 3 DOF Y/V = -0.096 [V]
ETMY T240 3 DOF Z/W = 0.224 [V]
ITMX T240 1 DOF X/U = 0.074 [V]
ITMX T240 1 DOF Y/V = 0.196 [V]
ITMX T240 1 DOF Z/W = 0.188 [V]
ITMX T240 2 DOF X/U = 0.136 [V]
ITMX T240 2 DOF Y/V = 0.211 [V]
ITMX T240 2 DOF Z/W = 0.245 [V]
ITMX T240 3 DOF X/U = 0.193 [V]
ITMX T240 3 DOF Y/V = 0.163 [V]
ITMX T240 3 DOF Z/W = 0.166 [V]
ITMY T240 1 DOF X/U = -0.038 [V]
ITMY T240 1 DOF Y/V = -0.055 [V]
ITMY T240 1 DOF Z/W = -0.065 [V]
ITMY T240 2 DOF X/U = 0.115 [V]
ITMY T240 2 DOF Y/V = 0.135 [V]
ITMY T240 2 DOF Z/W = -0.004 [V]
ITMY T240 3 DOF Y/V = 0.043 [V]
BS T240 1 DOF X/U = -0.166 [V]
BS T240 1 DOF Y/V = -0.039 [V]
BS T240 1 DOF Z/W = 0.206 [V]
BS T240 2 DOF X/U = 0.062 [V]
BS T240 2 DOF Y/V = 0.181 [V]
BS T240 2 DOF Z/W = 0.008 [V]
BS T240 3 DOF X/U = 0.013 [V]
BS T240 3 DOF Y/V = -0.066 [V]
BS T240 3 DOF Z/W = -0.128 [V]
 

H1 CAL (CAL)
sudarshan.karki@LIGO.ORG - posted 16:28, Tuesday 20 June 2017 - last comment - 17:34, Wednesday 28 March 2018(37039)
Down Conversion of Pcal Injection

SudarshanK, RickS

To study the downconversion of Pcal excitation we used a DB9 breakout at the back of the Pcal chassis and routed the excitation channel through H1:CAL-PCALX_WS_PD for now. This will be returned to its original configuration once the investigation is complete.

Images attached to this report
Comments related to this report
sudarshan.karki@LIGO.ORG - 18:17, Tuesday 20 June 2017 (37047)

The PcalX is still fully functional and hardware injection can be carried out if needed. The WS_PD channel through which the excitation channel is routed is a spare channel that is only used during the end-station PD calibration.

sudarshan.karki@LIGO.ORG - 12:30, Tuesday 27 June 2017 (37139)

Summary:

We have established that most of these down converted lines (the one that hurts us)  reported in alog 36959 arise from the aliasing of the harmonics of the injected high frequency calibration lines. The lines that have the possibility to show up in the DARM are the ones that lie between 10 Hz to few hundred Hz. We can avoid these lines by selecting the high frequency calibration lines such that  the aliased lines are not in the given low frequency region.

Details:

We ran into issues with low frequency lines (in 100 Hz range) showing up in DARM when we were running high frequency calibration lines in the region of 5.5 - 6 kHz. This was first noticed in this LHO alog 36959 and LLO alog 34346. To understand this problem we wanted to find where these lines were being produced, photon calibrator itself or the data acquisition system. We disconnected the cable that inputs the excitation to the Pcal electronics and used a DB9 breakout box to acquire the excitation signal so that we were getting these signal before it enters the Pcal system. We rerouted this signal through the H1:CAL-PCALX_WS_PD channel which was one of the unused Pcal channel. 

The first plot shows the spectrum with a 5036 Hz excitation line (in blue) and without an excitation (in red). Some of the extra lines seen in the  blue spectra are the result of aliasing of the  higher order harmonics  of the injected as well as the imaged lines (imaging happens when going from 16khz to 64 kHz). In this particular case the 68 Hz line is the aliasing of the 13th order harmonic of 5036 Hz injected line. The second plot shows the predicted aliased lines (based on harmonics and upsampling) that would be produced for 5036 Hz injected line. Some of the predicted lines show up in the actual spectrum but not all and not all line that are present in the spectra are predicted. However, the lines that show up above few hundred Hz will be well below the DARM signal as the actuation transfer function goes as 1/f^2. Shivaraj, at LLO has taken some additional measurement to see if we can find the source of all the aliased lines. Report to follow.


Non-image files attached to this comment
jeffrey.kissel@LIGO.ORG - 15:35, Tuesday 27 June 2017 (37171)CAL, CDS, DetChar
Tagging DetChar and CDS on this, so that the CW group can follow up with them to understand how to flag the data for this known issue.
sudarshan.karki@LIGO.ORG - 17:20, Wednesday 05 July 2017 (37340)CAL, CDS, DetChar

RickS, SudarshanK,

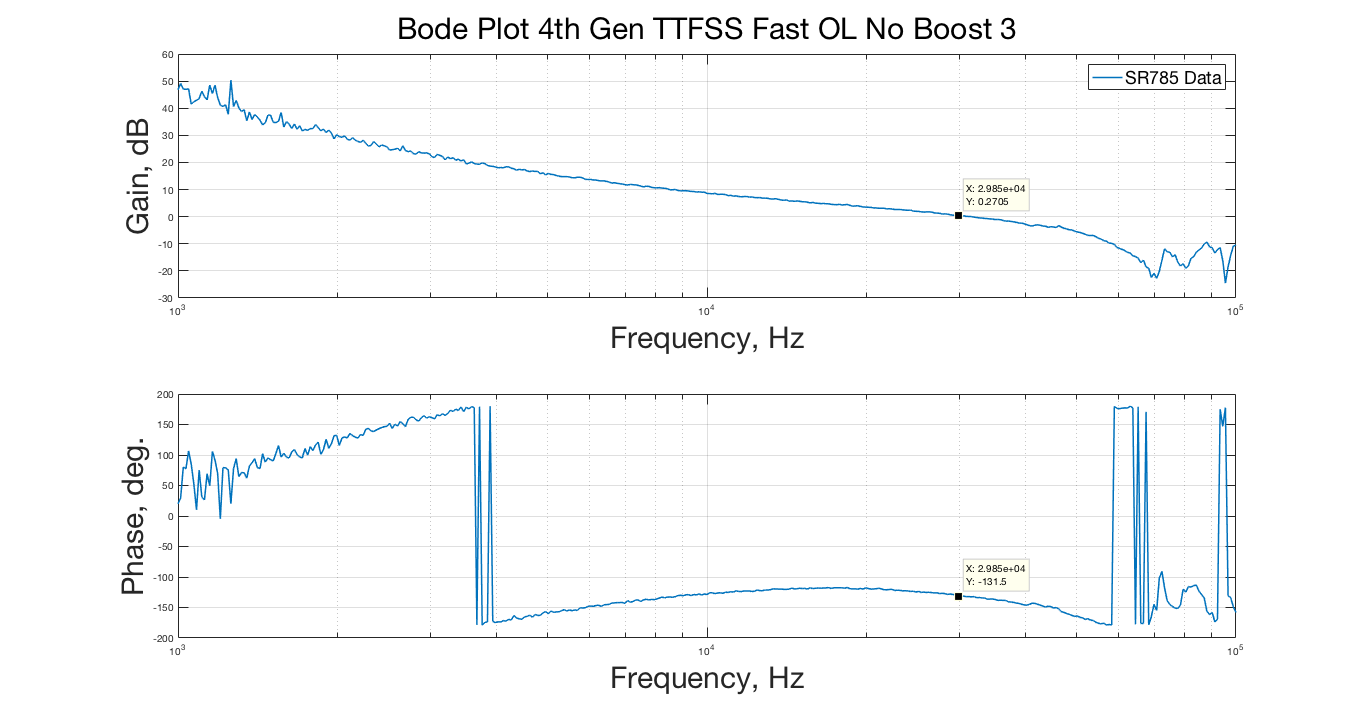
The breakout box used to acquire the analog excitation signal on X-end Pcal has been removed and the Pcal configuration is now back to normal. During the visit, Rick repeated some measurement that reproduced the 86 Hz line when a Pcal line was injected at 5950 Hz with an excitation amplitude of 25000 cts. This measurement was made at the DAC (analog) output using SR785. The 86 Hz line is about 70dB below the injected line. This still does not explain why we don't see 86 Hz line in analog output in the measurement (LLO alog 34495) that Shivaraj made using Agilent signal analyzer. :(

Images attached to this comment
sudarshan.karki@LIGO.ORG - 15:22, Tuesday 18 July 2017 (37592)

On Jeff's request, I am putting down the empirical formula that predicts the lowest frequency down-converted lines for each high frequency excitation.

DCF =  2^16 - EF * n, where DCF is the down converted frequency, EF is the excitation frequency and n is the harmonic number. For frequencies around 4-6 kHz, the harmonic number that produces the line in the bucket are between 11 and 13.

I don't have a physical intuition on why this happens. If we were looking at the resampled 16 kHz signals, the presence of these lines would not be surprising because these would be produced because of aliasing but we see these low frequency lines  on the DAC output, measured using the analog spectrum analyzer. Plots showing the same are attached.

Images attached to this comment
jeffrey.kissel@LIGO.ORG - 17:34, Wednesday 28 March 2018 (41194)CDS
Was associated with FRS Ticket 8335.
Now associated with IIET Ticket 10318.
H1 CAL (CSWG, DetChar, ISC, SUS)
jeffrey.kissel@LIGO.ORG - posted 15:11, Friday 18 November 2016 - last comment - 16:22, Wednesday 05 July 2017(31603)
H1 SUS ETMY High-Frequency Actuation UIM/L1
J. Kissel, D. Tuyenbayev

Analyzing the high-frequency data for the UIM that we took last night (LHO aLOG 31601), we find -- as previously suspected -- there is lots of dynamical resonant features in the UIM / L1 actuation stage; it definitely does NOT fall as f^6 to infinity as one might naively suspect. 

There are even more features than the (now anticipated; LHO aLOG 31432) broad impacts of the violin modes of the Sus Point-to-TOP wires (~311 Hz), and UIM-to-PUM wires (~420 Hz). We had seen hints of these features previously (LHO aLOG 24917), but here they are fully characterized out to 500 Hz with a combination of swept-sine (SS) and broad-band (BB) transfer function ratios (the calibration standard measurements of PCAL2DARM = C / (1+G) and iEXC2DARM = C A_i / (1+G)). The measurements yield the actuation strength of the UIM stage, in terms [m] of test mass displacement per [ct] of drive from the L1_TEST_L bank, which is the Euler-basis equivalent to DAC [ct]. To scale to [m/N], is a mere scale factor, measured to be 
     20/2^18 [V/ct] 0.62e-3 [A/V]* 1.7082 [N/A] = 8.08e-8 [N/ct] (see LHO aLOG 31344).


Via private communication in January this year, Norna suspects that 111 Hz feature is the first internal mode of the UIM blades, backed by a bench test of the blades at CIT which revealed a resonance at 109 Hz. No ideas on the 167 Hz mode though.

These high frequency dynamics continue to plague the estimate of the UIM actuation strength at DC using the traditional frequency-dependent sweep method, because these high frequency dynamics begin to affect the actuation strength at as low a frequency as ~30 Hz (LHO aLOG 31427), and any model fitting code gets totally distracted by these features. 

A challenge to the CSWG team: fit this transfer function above 20 Hz and create a set of zeros and poles that can be used as a "correction" filter to a model that falls off as f^6. This filter need not perfectly resolve the details of all of the high-Q features, but it must track the overall frequency dependence over the 20 - 500 Hz region well. I attach all of the measurements compressed onto one (discontinuous) frequency vector as an ascii in the standard DTT form of [freq re(TF) im(TF)]. To use: 
    >> foo = load('2016-11-17_H1SUSETMY_L1_Actuation_HighFreqChar_asciidump.txt')
    >> figure; loglog(foo(:,1), abs( foo(:,2)+1i*foo(:,3) ))
This data is also committed to the CalSVN repo here:
    /ligo/svncommon/CalSVN/aligocalibration/trunk/Runs/ER10/H1/Results/Actuation/2016-11-17_H1SUSETMY_L1_Actuation_HighFreqChar_asciidump.txt
Kiwamu has already tried to create such a filter from the previous data (LHO aLOG 28206), but was limited by  that measurement's high-frequency bound falling between the 111, 137, and 167 Hz features. 

Details:

Analysis code:
    /ligo/svncommon/CalSVN/aligocalibration/trunk/Runs/ER10/H1/Scripts/FullIFOActuatorTFs/process_H1SUSETMY_L1_HFDynamicsTest_20161117.m

Config files:
    IFOindepPars = '../../../Common/params/IFOindepParams.conf';
    IFOdepPars   = {'../../params/H1params.conf'};
    IFOmeasPars  = {'../../params/2016-11-12/H1params_2016-11-12.conf'};
    PCALPars = {'../../params/2016-11-12/measurements_2016-11-12_ETMY_L1_actuator.conf'};

Model:
    /ligo/svncommon/CalSVN/aligocalibration/trunk/Runs/O2/DARMmodel/src/computeDARM.m

Will post the data for the fitting challenge later this afternoon.
Images attached to this report
Non-image files attached to this report
Comments related to this report
brett.shapiro@LIGO.ORG - 19:42, Saturday 19 November 2016 (31656)DetChar, ISC, SUS

I made an update to the quad matlab model to account for these mystery features. See CSWG log 11197.

dennis.coyne@LIGO.ORG - 23:13, Wednesday 08 March 2017 (34688)

I describe my use of the Frequency Domain System Identification toolbox (FDIDENT) to fit this transfer function in CSWG elog #11205. FDIDENT is a third party Matlab toolbox which provides tools for identifying linear dynamic single-input/single-output (SISO) systems from time response or frequency response measurements. The toolbox is free for non-profit use.

https://www.mathworks.com/products/connections/product_detail/product_35570.html

http://home.mit.bme.hu/~kollar/fdident/

A stable, but non-minimum phase, model without delay – compatible with a Linear Time Invariant (LTI) representation -- results in a best fit for a 22 order numerator and 28 order denominator model, m2228. The model is compared to the measurement data in the attached bode plot.

Images attached to this comment
Non-image files attached to this comment
jeffrey.kissel@LIGO.ORG - 16:22, Wednesday 05 July 2017 (37338)
I attach several new parts of this high frequency characterization in order to facilitate incorporating the uncertainty in any future transfer function fitting. 

I attach three new text files:
    "..._tf.txt" -- a copy of the originally attached text file, columns are 
        [freq re(A) im(A)]
    "..._coh.txt" -- an export of the (prefiltered) coherence, columns are 
        [freq iEXCCoh PCALCoh]
    "..._relunc.txt" -- an export of the combined relative uncertainty on the transfer function, columns are 
        [freq sigma_A]

Computing the uncertainty on this actuation strength was a bit of a challenge. 
Remember, the above measure of the actuation strength of the UIM stage, A, is a combination of two transfer functions, as described in P1500248, Section V. In this aLOG they're referred to as "PCAL2DARM" where we use the photon calibrator as a reference actuator, and "iEXC2DARM" where the suspension stage under test is used as the actuator. Typically, the iEXC2DARM transfer function has the lowest coherence. 
Even worse, I've combined many data sets of both transfer functions covering different frequency regions each with a different number of averages.
Thus form the uncertainty, I've taken each frequency region's data set, and 
    - Filtered both iEXC and PCAL transfer functions for data points in which the iEXC TF has coherence greater than 0.95,
    - Created a relative uncertainty vector for each iEXC and PCAL transfer functions using the standard B&P equation,
        sigma_TF(f) / TF = sqrt( (1-C(f)) / (2 N C(f)) )
    where C(f) is the coherence, and N is the number of averages (N was 10 for swept sine TFs, 25 for broad band TFs)
    - Concatenated the data sets to form the overall transfer function, A,
    - Combined the two uncertainty vectors in the standard way,
        sigma_A / A = sqrt((sigma_iEXC / iEXC)^2 + (sigma_PCAL / PCAL)^2)
    - Sorted the collection of 
        [frequency complextf iexccoh pcalcoh sigma_A]
    by frequency.
    - Exported the uncertainty.

Note that one only needs one column of uncertainty, for the absolute uncertainty in magnitude is just
    |sigma_A| = abs(A) * (sigma_A / A)
and the absolute uncertainty in phase is
    /_ sigma  = 180/pi * (sigma_A / A)

I attach a plot of the magnitude and its uncertainty for demonstrative purposes, so that when the files are used, you can compare your plots of this against mine to be sure you're using the data right. Note that I've multiplied the uncertainty by a factor of 10 for plotting only so that it's visible.

I've updated and committed the function that's used to process this data, and it can be found here:
    /ligo/svncommon/CalSVN/aligocalibration/trunk/Runs/ER10/H1/Scripts/FullIFOActuatorTFs/
    process_H1SUSETMY_L1_HFDynamicsTest_20161117.m
Images attached to this comment
Non-image files attached to this comment
Displaying reports 47121-47140 of 83410.Go to page Start 2353 2354 2355 2356 2357 2358 2359 2360 2361 End