david.barker@LIGO.ORG - posted 12:51, Tuesday 17 April 2018 - last comment - 13:27, Tuesday 17 April 2018(41491)
cell phone alarms temporarily turned off while h0veey is being rebooted
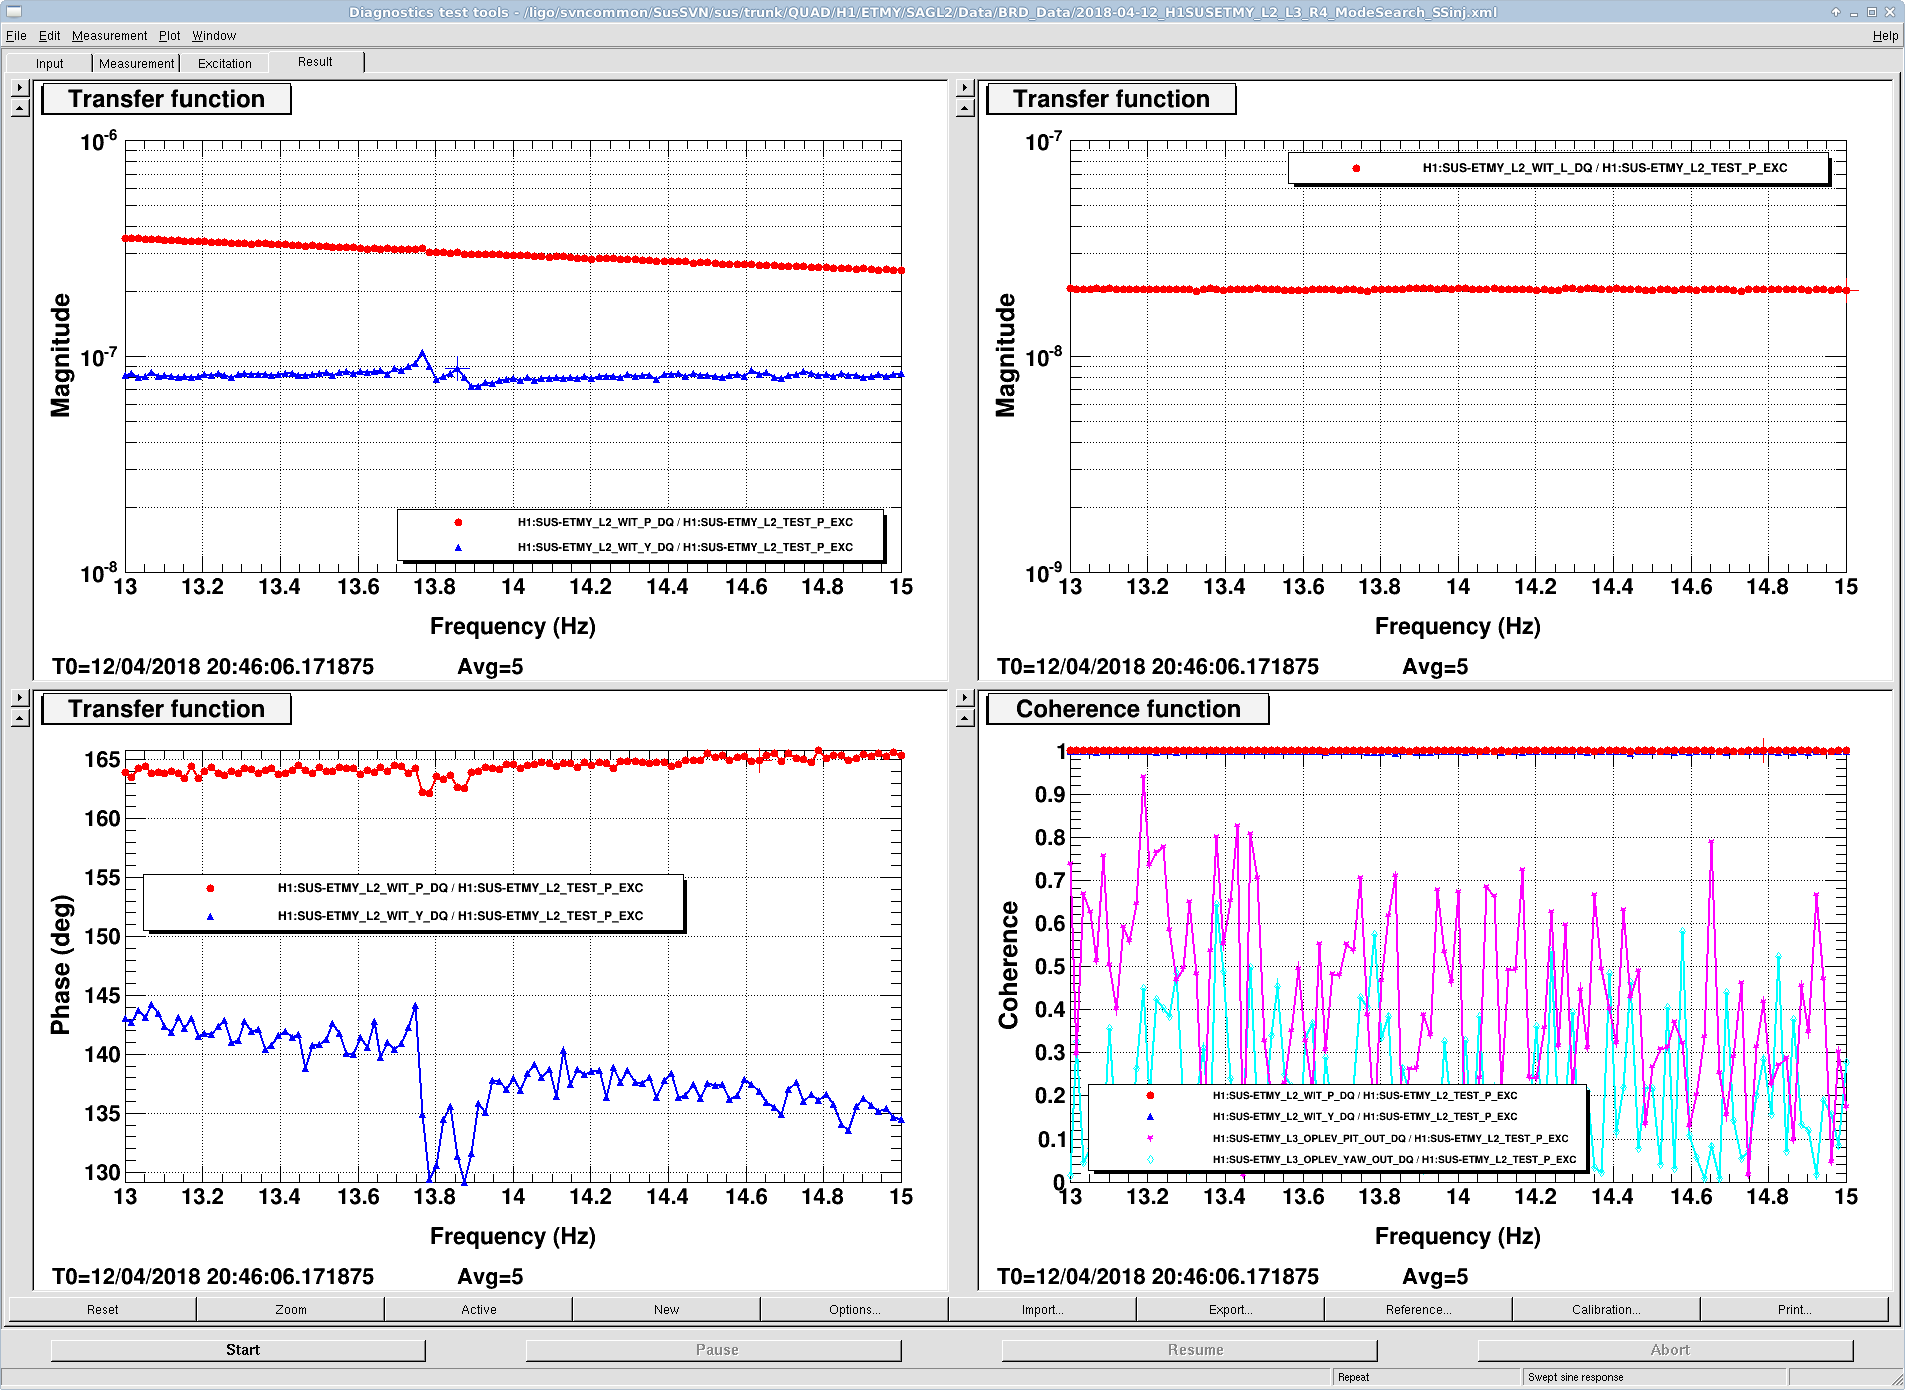
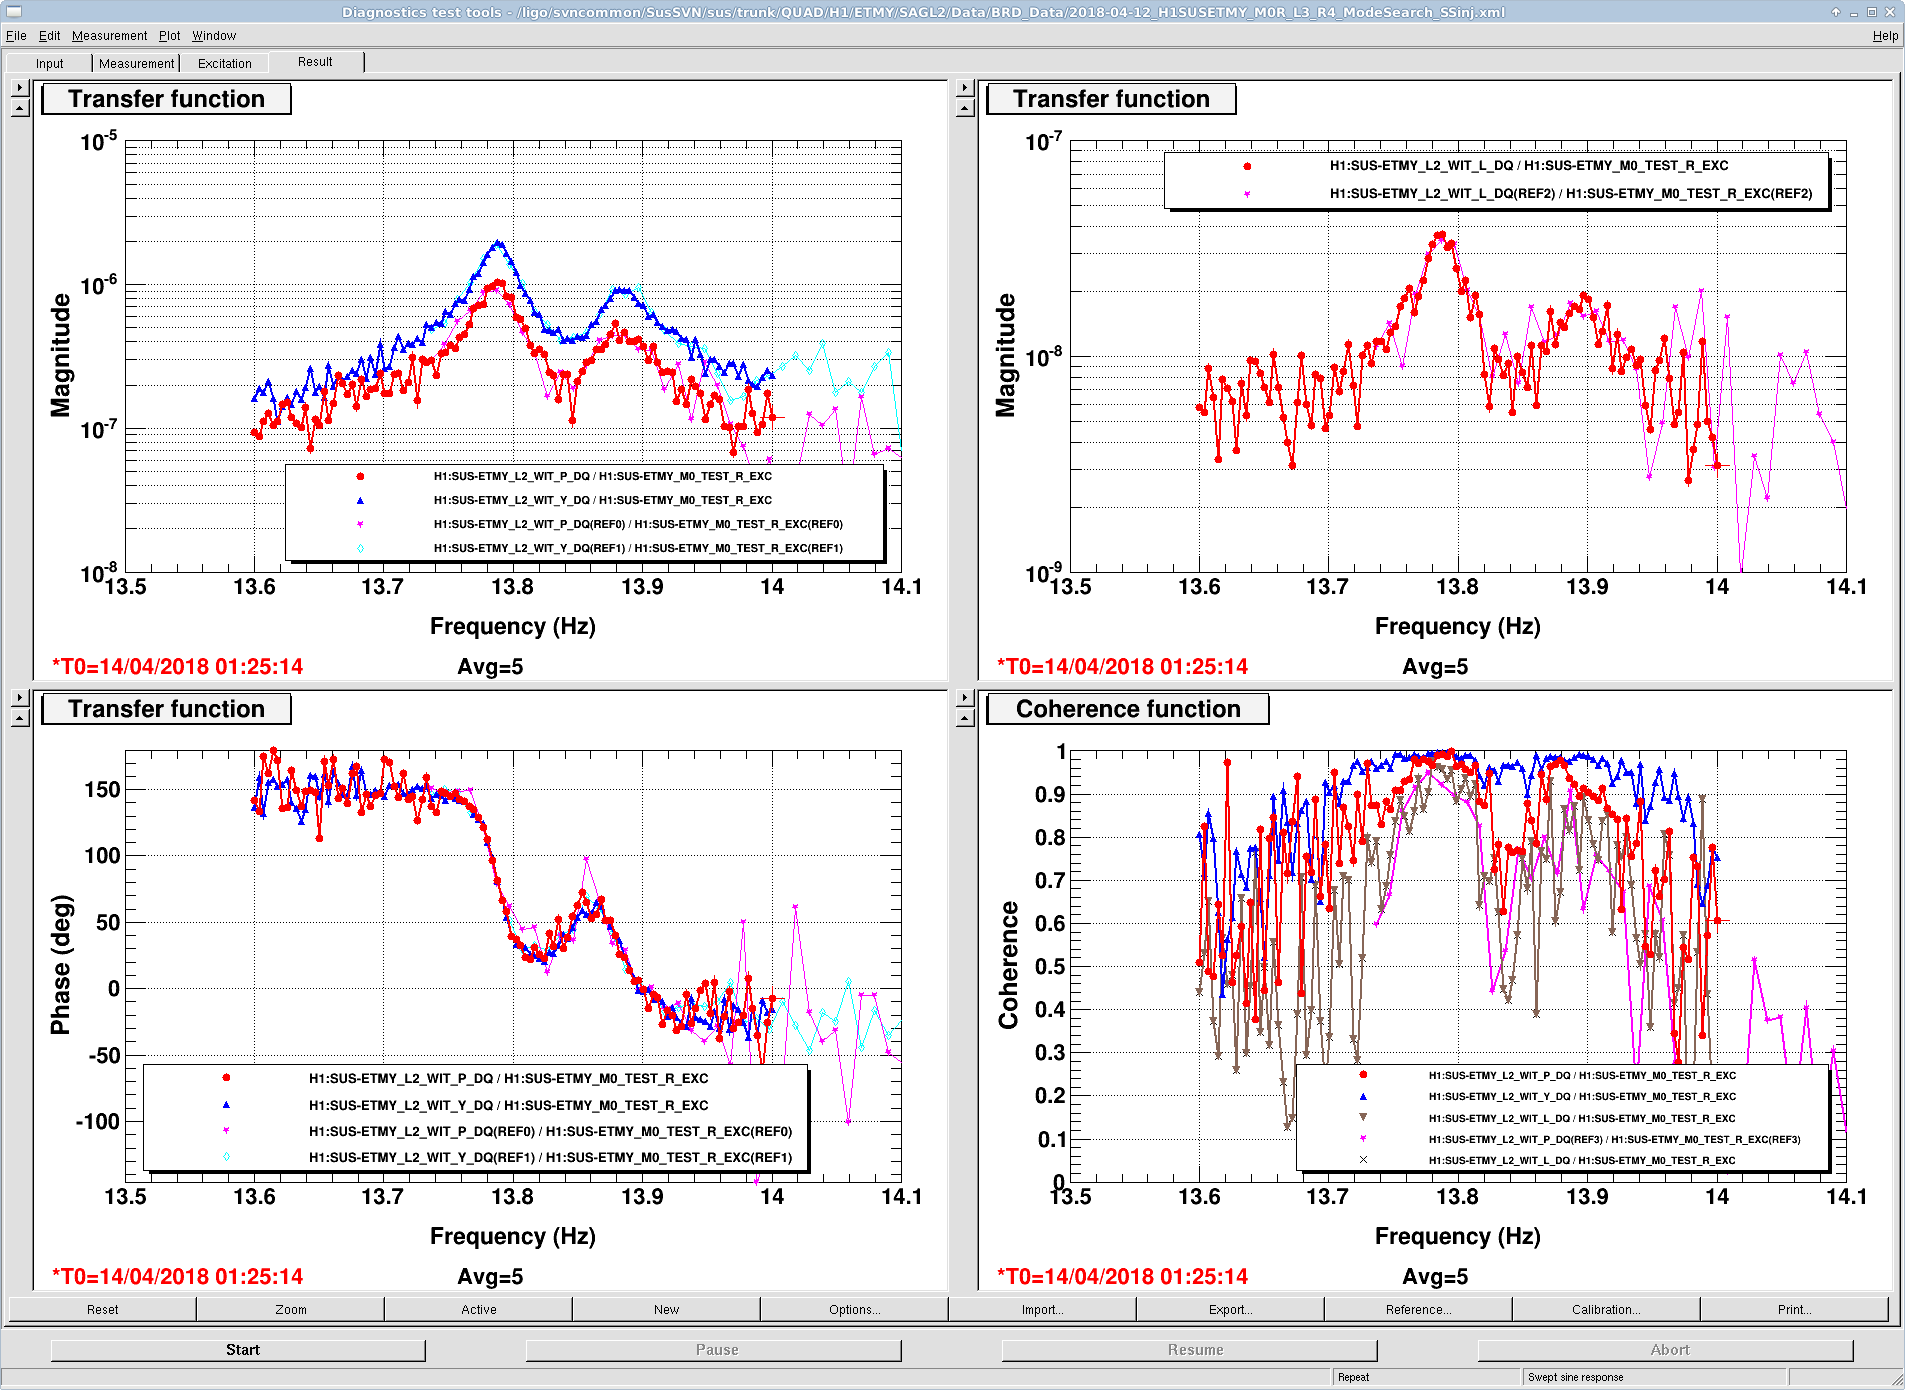
J. Kissel

Using (at first) ring-down fitting techniques described in LHO aLOG 40098 and LLO aLOG 28503, I have attempted to characterize and assess the performance of H1 SUS ETMY's recently installed "Bounce" and Roll mode Dampers (BRDs, D1500228) which aim to reduce the Q of the highest vertical and roll modes (V4 and R4).

While I was able to easily identify a single V4 mode and characterize its Q to be rather high, the roll mode was very evasive, and I believe has split into two, very low Q modes.

Remember, the goal for these BRDs was to reduce the Q of the V4 and R4 modes from ~10^6 to "one to several thousand" (see pg 6 of G1600371, and thermal noise impact discussion in T1500271).
Unclear if either BRD results are within spec: the V4 mode has a Q of 7300 (arguably higher than "several thousand"), and the R4 mode, split into two modes, have Qs of 600 and 440 (arguably lower than "one thousand," and probably undesirable to be overdamped enough to split the mode in two).

H1 SUS ETMY's BRD manual tuning results can be found in LHO aLOG 40541.

Further Details below.

%%% V4 "Bounce" Mode Characterization %%%

I was able to clearly identify and characterize the V4 mode:

                                ETMY

    V4 Frequency / Hz           9.726  (0.001)

    V4 Q / dimensionless        7302  (8)

(The uncertainties quoted for the Q are the 68% C.I., 1-sigma [sqrt of the] weighted sample variance resulting from 3 measurement trials on each mode; the value reported is the weighted mean of the three trails. See more details below. The uncertainty on the frequency is simply the requested binwidth of the ASD used after finding the mode frequency.)

Attachments Key for V4 / "Bounce" Mode:
    - 2018-04-12_H1SUSETMY_L3_V_BBEXC_awgsettings.png AWGGUI settings for broadband V4 search before I knew the frequency
    - 2018-04-12_H1SUSETMY_L3_V_SineInj_awgsettings.png AWGGUI setings once the frequency was found, and during ring-down measurements
    - H1SUSETMY_L2_Q_bounce_ASD.pdf Collection of post-processed ASDs of L2_WIT_L_DQ channel used for each ring-down trial
    - H1SUSETMY_L2_Q_bounce_Time_Series.pdf Collection of RMS time-series of L2_WIT_L_DQ channel and fit results for each ring-down trial
    - 2018-04-12_H1SUSETMY_V4R4_Characterization_PostBRDInstall.pdf (PG 1) Trial results plotted against weighted mean and variance.

%%% R4 "Roll" Mode Characterization %%%

I was *not* able find the highest roll mode frequency using the standard search method -- iterating through driving the top mass (M0) in Roll with small ~0.2 Hz band passes over a 13.5 and 14.2 Hz range. I tried searching by driving in vertical at the top mass as well, still was not able to ring anything up. I was finally able to see something ring up by driving the penultimate mass (L2) in pitch, but I was not convinced I wasn't just seeing my broadband excitation in my witness sensors (L2 OSEMs in L, P, or Y, and L3 optical levers in P or Y), because the sensor signals would die off very quickly (and it was tough to tell how quickly, because I need at least a 0.005 Hz BW running ASD to see what I'm doing).

So, finally, I took an excessively long swept sign measurement through the band, driving at L2 in P. These revealed *two* features, with quite low Q, clearly visible in optical lever Y, and barely visible in optical lever P.

Once identifying these two modes at 13.766 Hz and 13.856 Hz in the L2 P drive to L2 Y OSEM response, I then used the lower of the two frequencies to conduct the standard set of trials, hoping to identify the Q that way. I used that lower mode -- 13.766 Hz -- because while both modes were visible in optical lever Y, the lower frequency feature was *more* visible in the optical lever P transfer function so I had greater confidence it was the roll mode. The results are attached, and give a Q of ~200, but again, I couldn't find a set of FFT and RMS parameters that showed a clear ring down that had no "noise bounces." These results claim a Q of ~200.

Finally, as a last ditch effort to be really confident that these 13.766 Hz and 13.856 Hz modes were real, I went from an excessively to ridiculously long TF from M0 R to each of the lower stage sensors (again, L2 L, P, and Y OSEMs, L3 P and Y optical levers), taking it over night. This transfer function also showed these same features, so I'm now confident that the roll mode has been split into two low Q modes:

                                ETMY
                                Mode R4.1           Mode R4.2
    R4 Pole Frequencies / Hz    13.788 (0.001)      13.883 (0.001)
    R4 Zero Frequency / Hz                 13.851 (0.001)

    R4 Pole Qs / dimensionless  600  (10)           440 (10)
    R4 Zero Frequency / Hz                 240 (10)

where I've determined these frequencies and Qs from using foton to create a crude, by-hand/by-eye fit and the uncertainties are estimated from me changing the frequency and Qs by the quoted values and seeing that the fit is not good enough. The fit is
     zpk([2.5;2.5],[],1,"n")*                                    (two out-of-measurement-band zeros, to start that phase and slope off right)
     zpk([],[0.01149+i*13.788;0.01149-i*13.788],1,"n")*          (a complex pair of poles at 13.788 Hz with a Q of 600)
     zpk([0.0288562+i*13.851;0.0288562-i*13.851],[],1,"n")*      (a complex pair of zeros at 13.851 Hz with a Q of 240)
     zpk([],[0.0157761+i*13.883;0.0157761-i*13.883],1,"n")*      (a complex pair of poles at 13.883 Hz with a Q of 440)
     gain(1.5e-10)                                               (arbitrary gain to match the magnitude scale of the data)


Attachments Key for R4 / "Roll" Mode:
    - 2018-04-12_H1SUSETMY_L2P_L3_R_SineInj_awgsettings.png AWGGUI settings during the unconvincing ring-down trials
    - H1SUSETMY_L2_Q_roll_ASD.pdf ASD of L2_WIT_L_DQ (OSEMs) during unconvincing ring-down trials
    - H1SUSETMY_L2_Q_roll_Time_Series.pdf RMS time series of L2_WIT_L_DQ (OSEMs) during unconvincing ring-down trials
    - 2018-04-12_H1SUSETMY_L2_L3_R4_ModeSearch_SSinj.png  Excessively long swept sine measurement showing L2 Pitch drive to L2 P & Y OSEM response
    - 2018-04-12_H1SUSETMY_M0R_L3_R4_ModeSearch_SSinj.png Ridiculously long swept sine measurement showing M0 Roll drive to L2 P & Y OSEM response
    - 2018-04-12_H1SUSETMY_M0R_L2Y_FotonFit.png Foton Fit of ridiculously long M0 R to L2 Y swept sine measurement


Checked vacuum pumps on both end stations and at the corner station. All pumps are operating normally. Temps and pressures are in their proper ranges. Made a slight adjustment in the vacuum pressure for End-X pump. Closing FAMIS task #7524
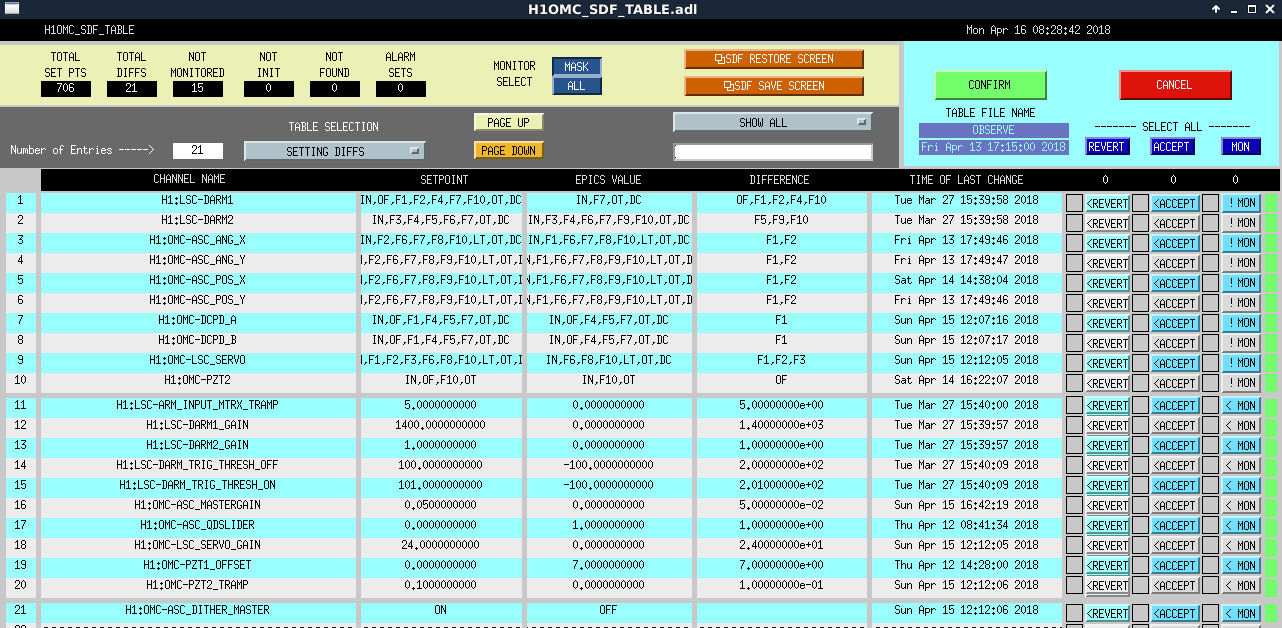
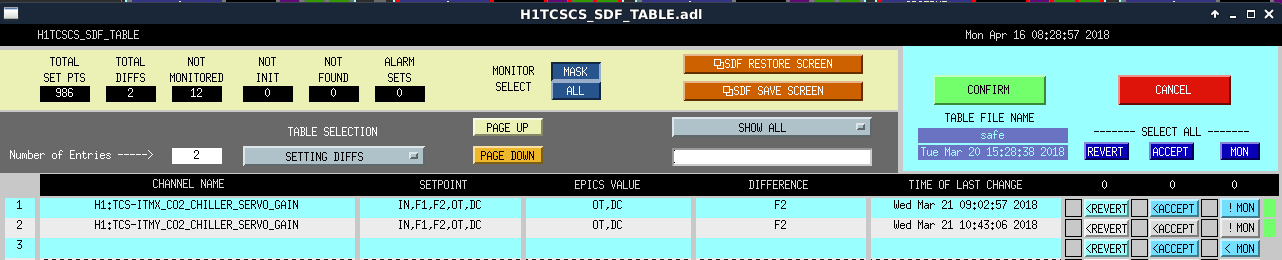
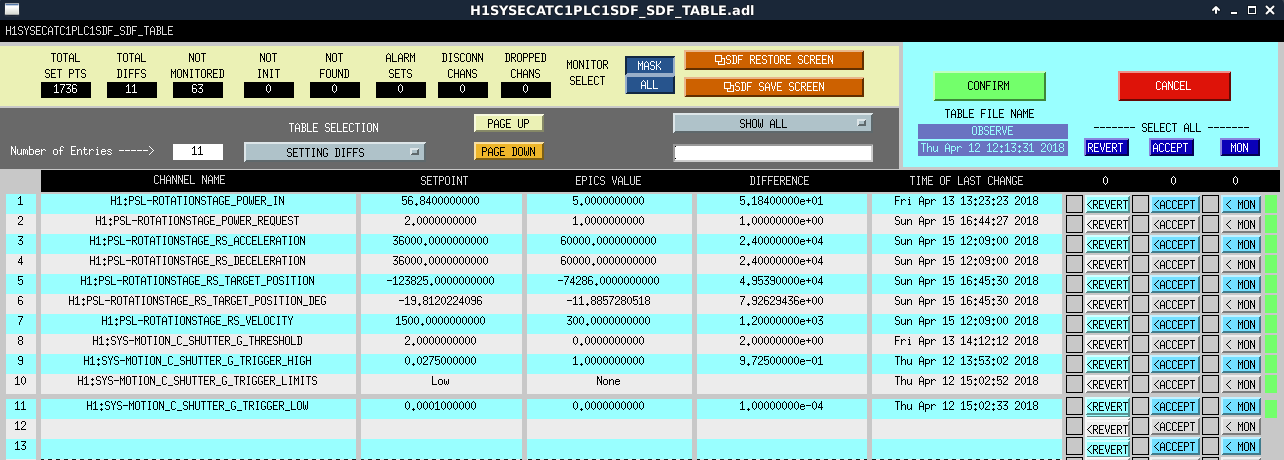
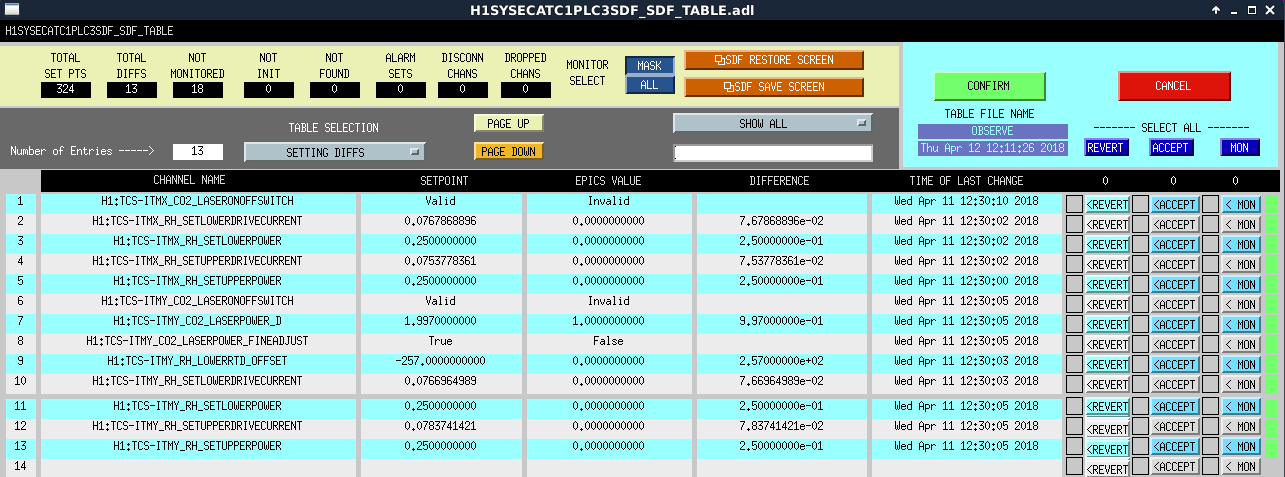
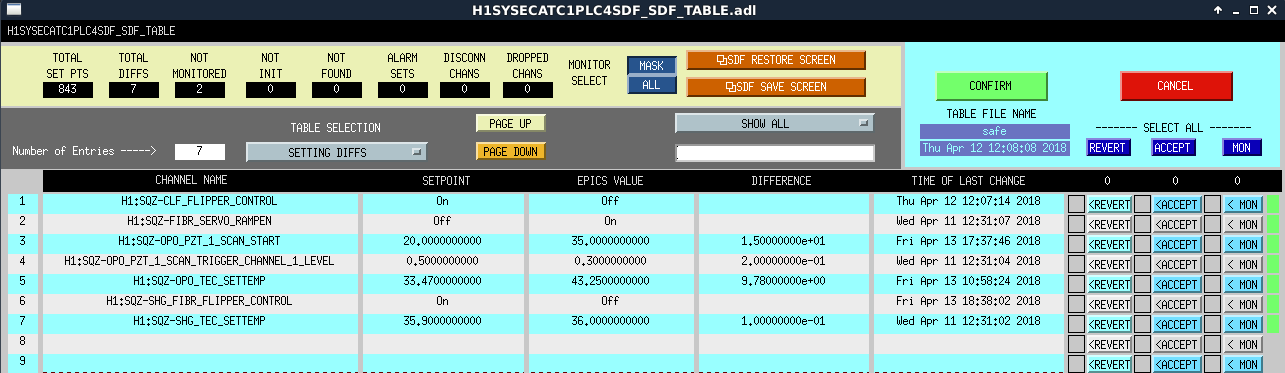
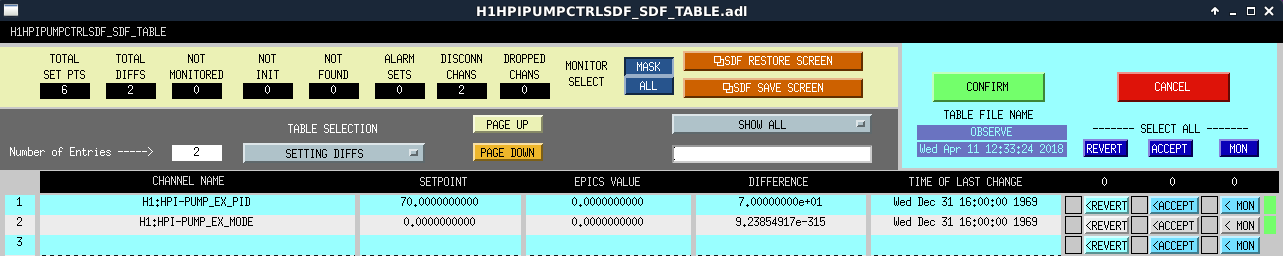
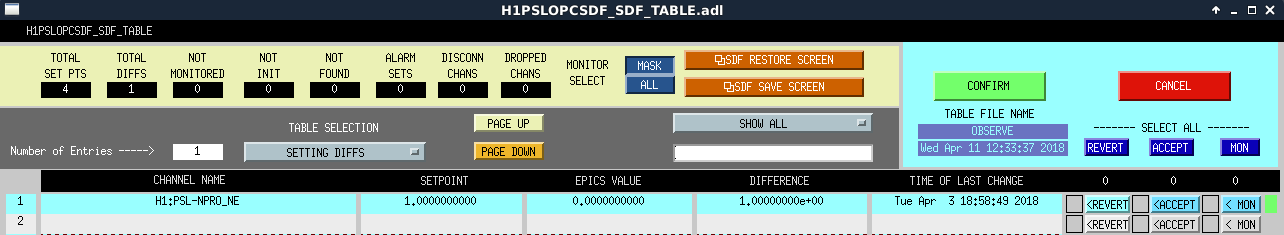
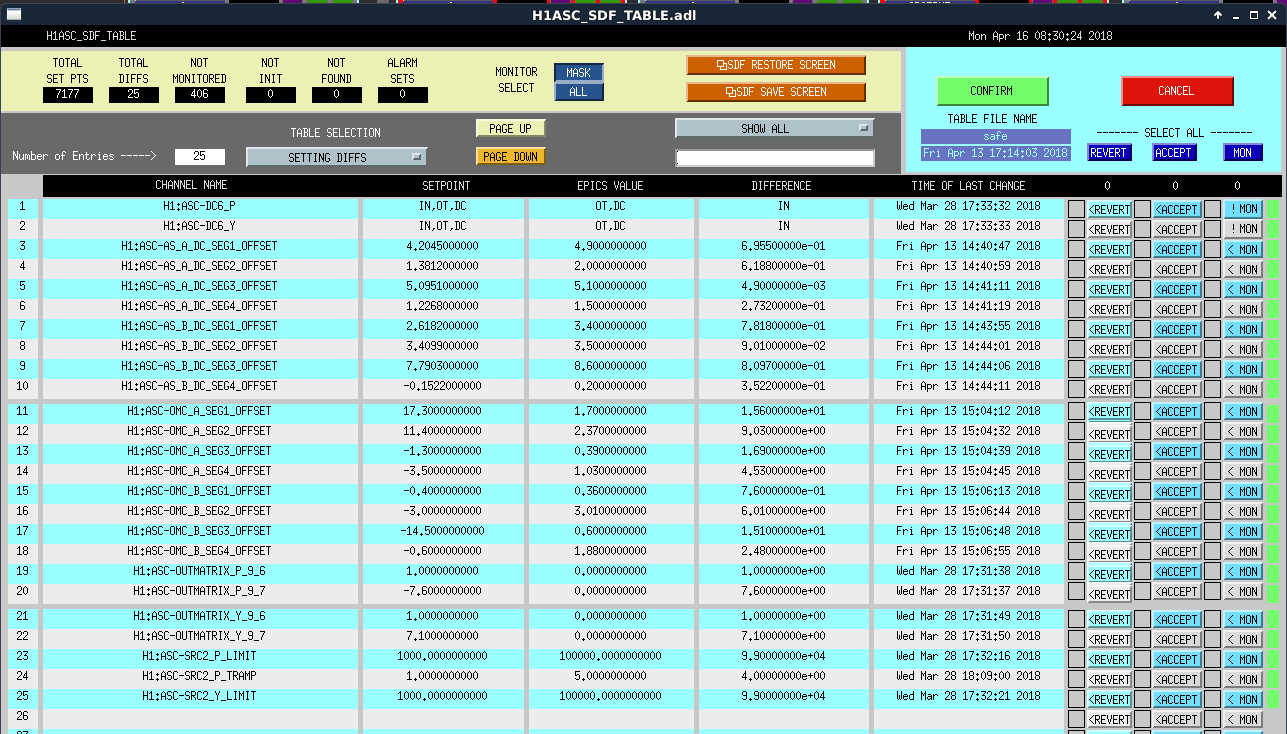
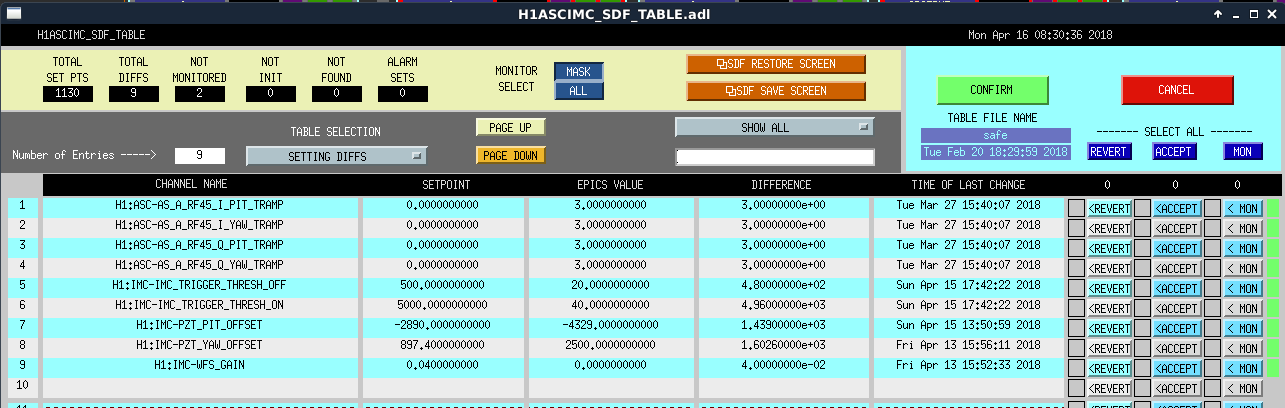
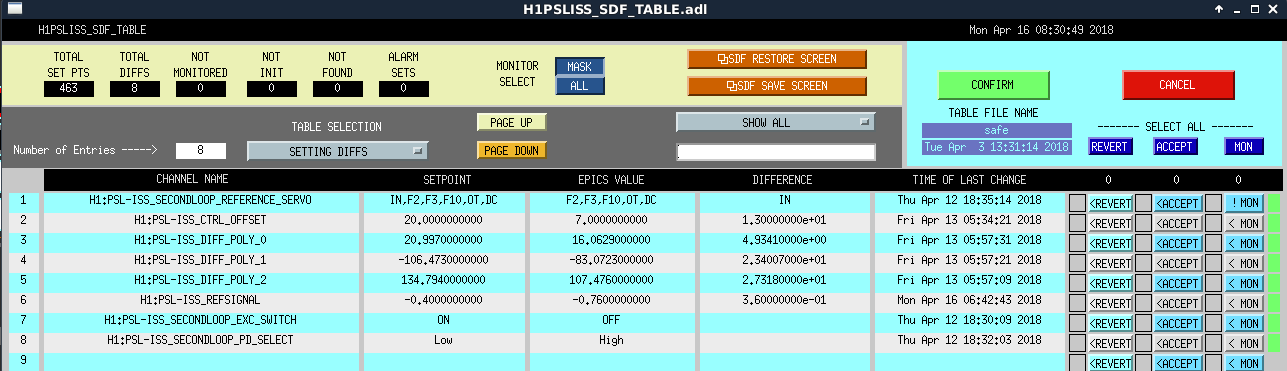
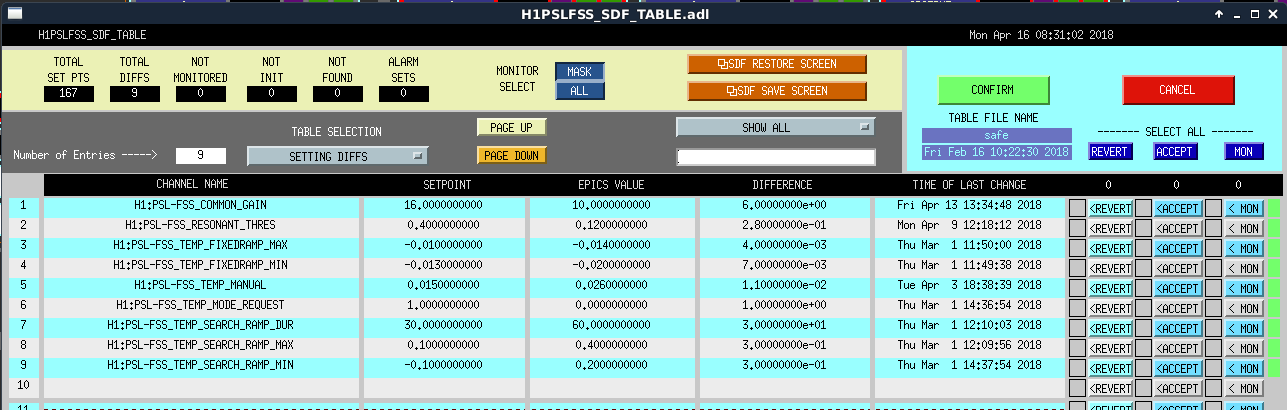
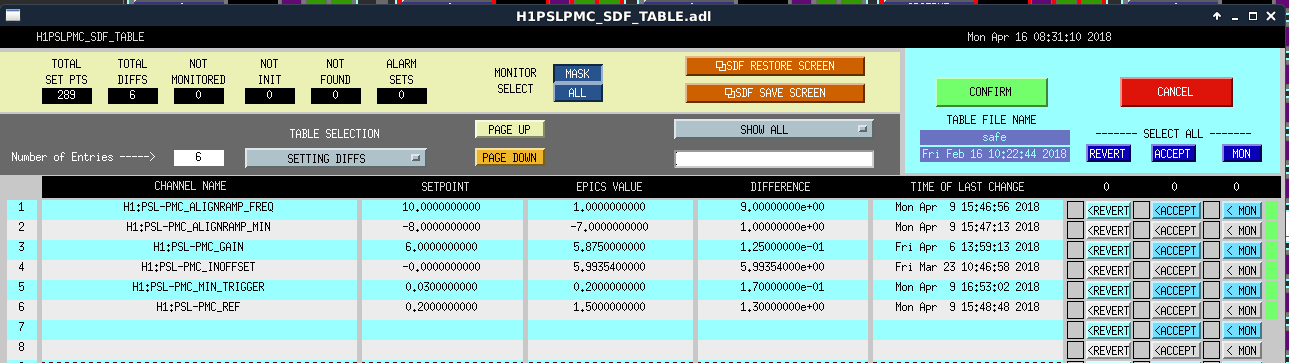
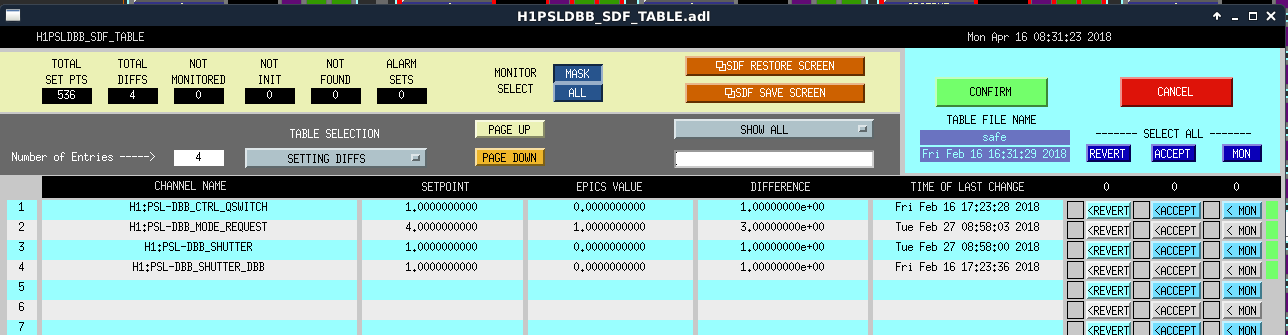
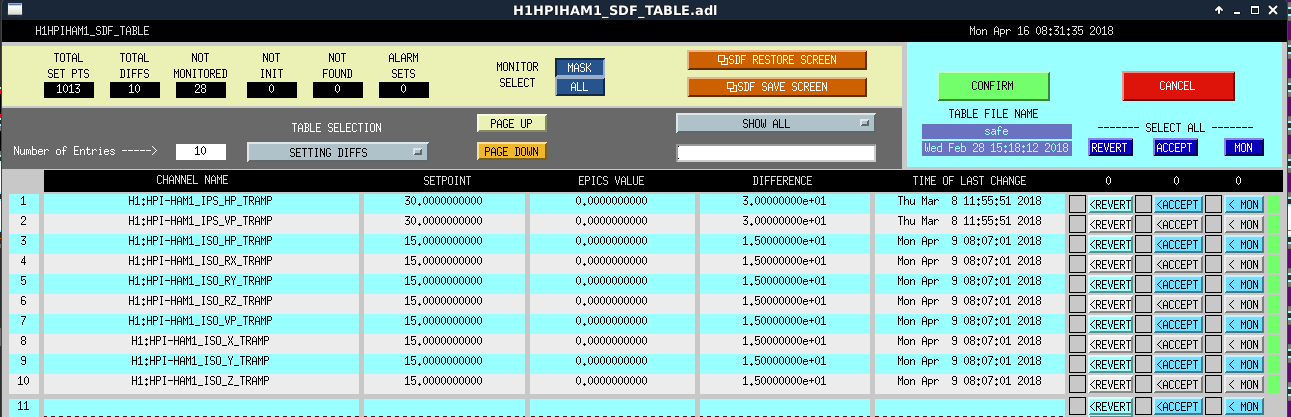
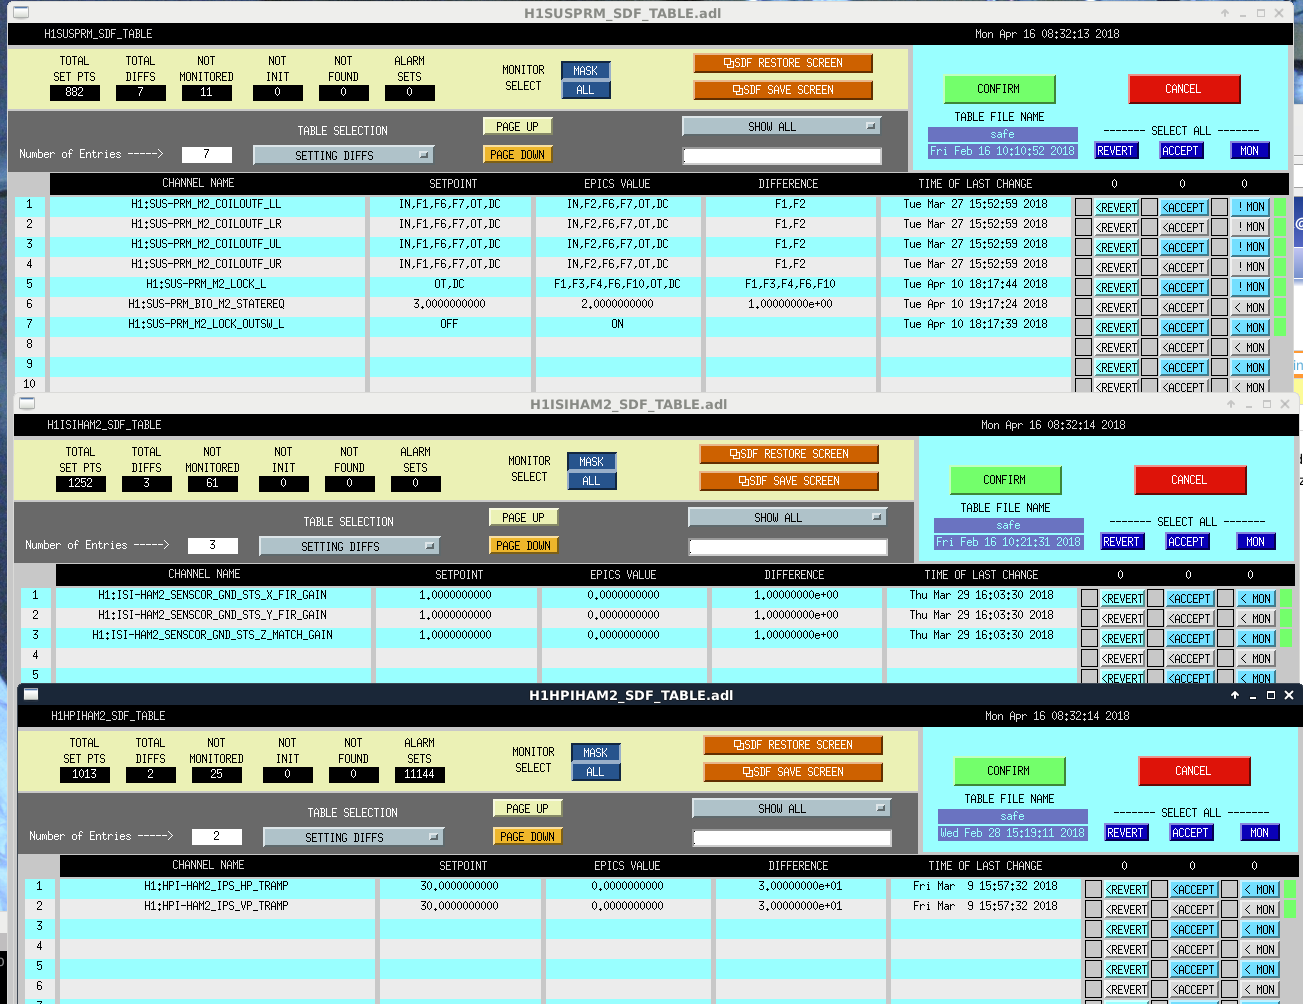
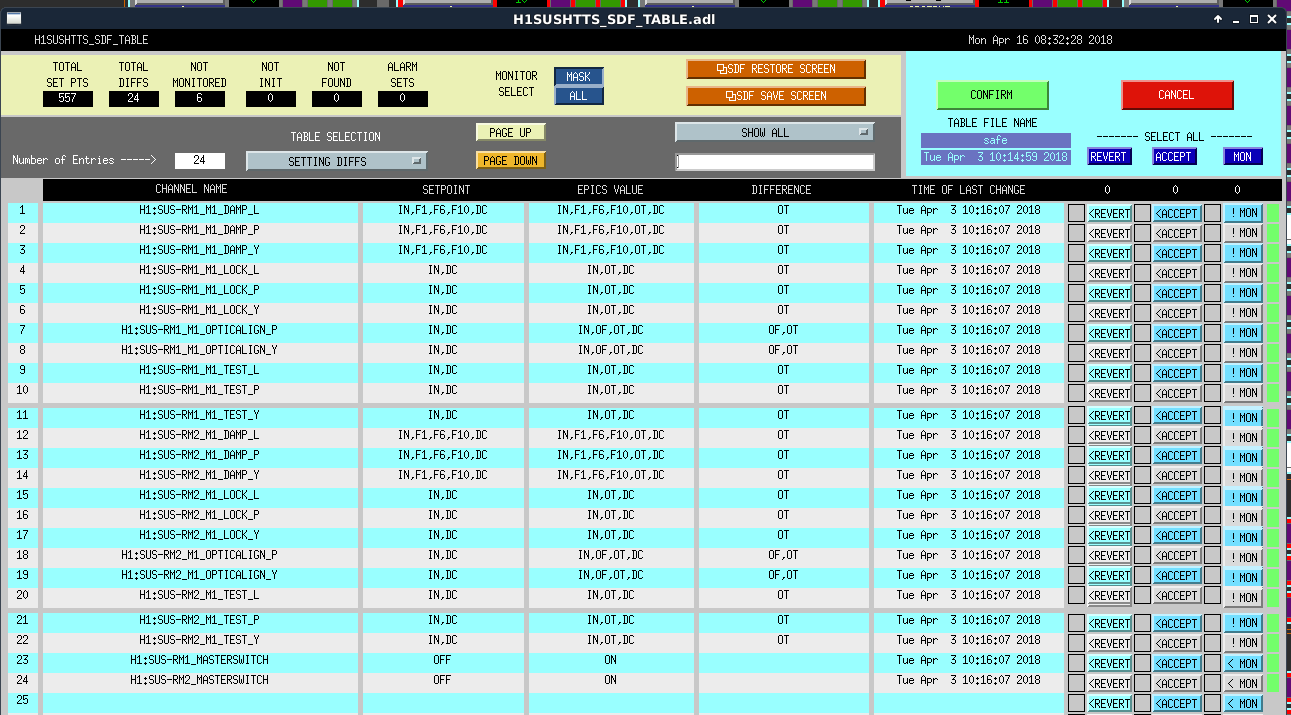
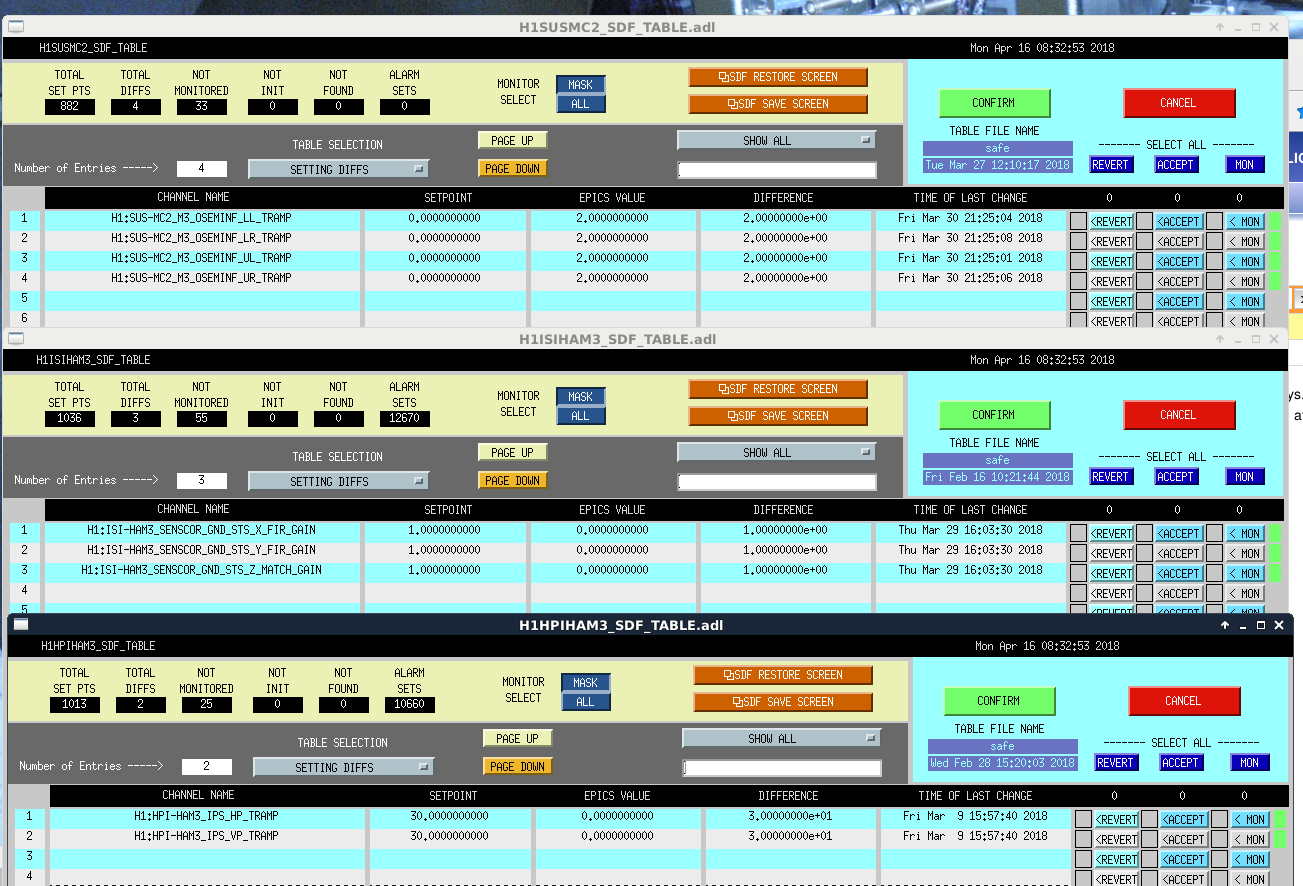
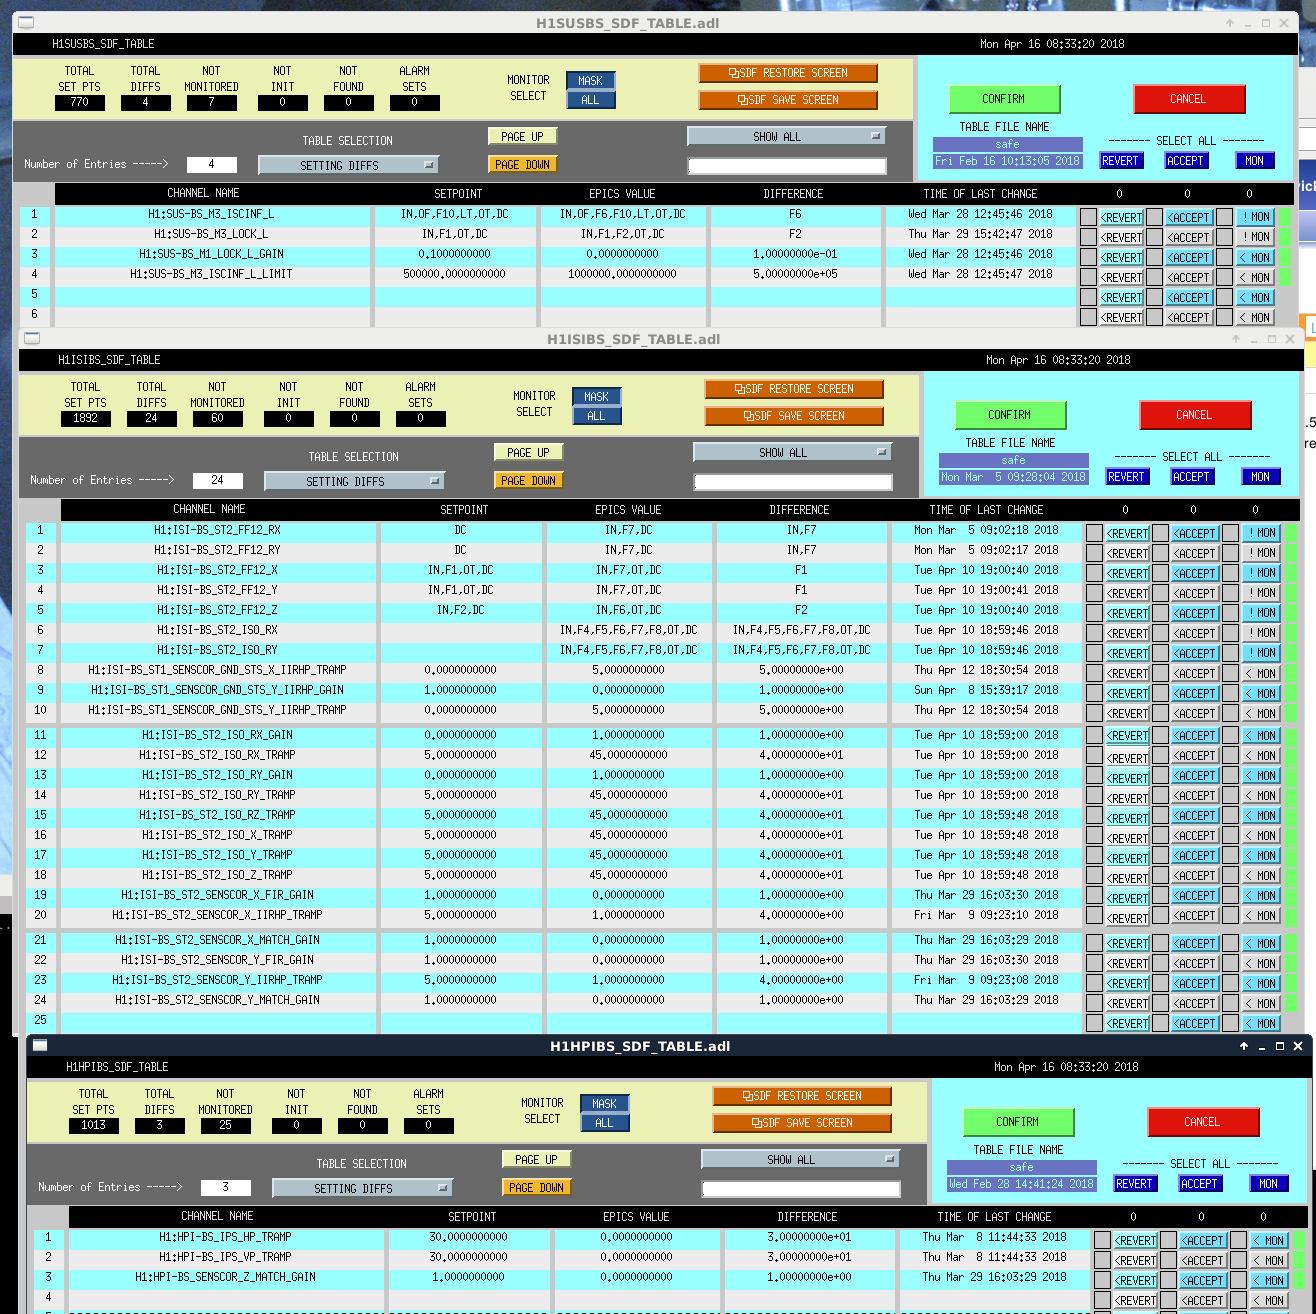
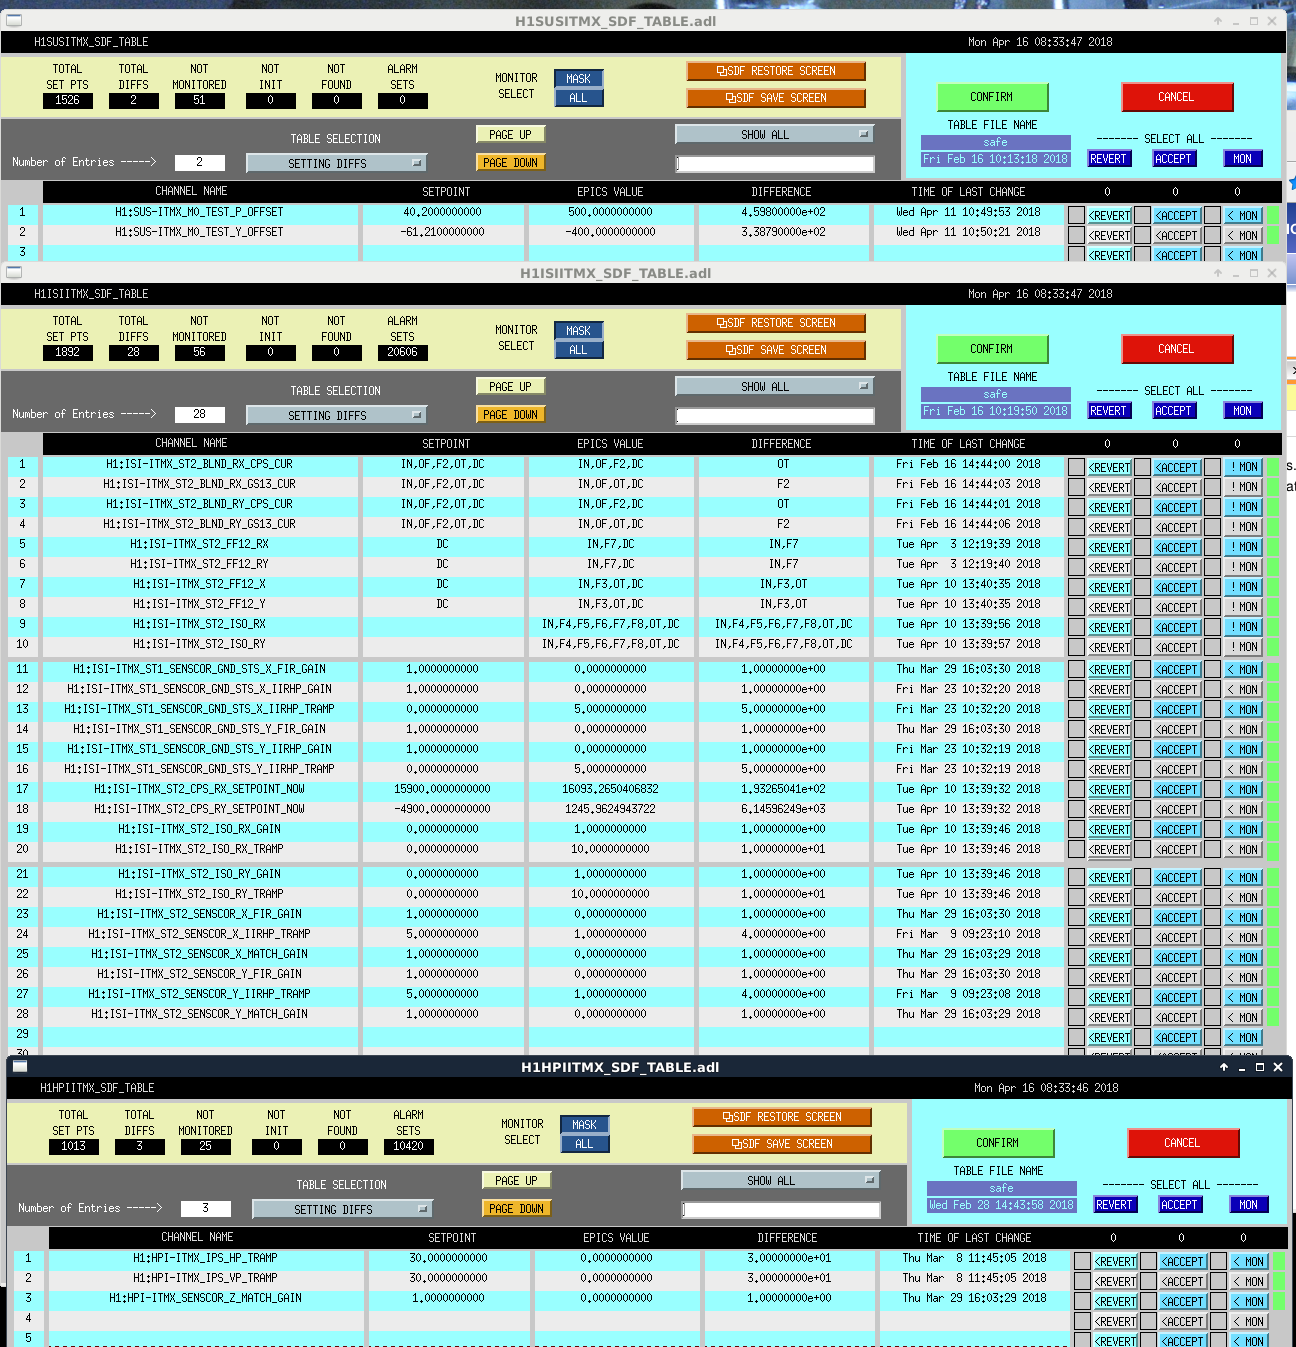
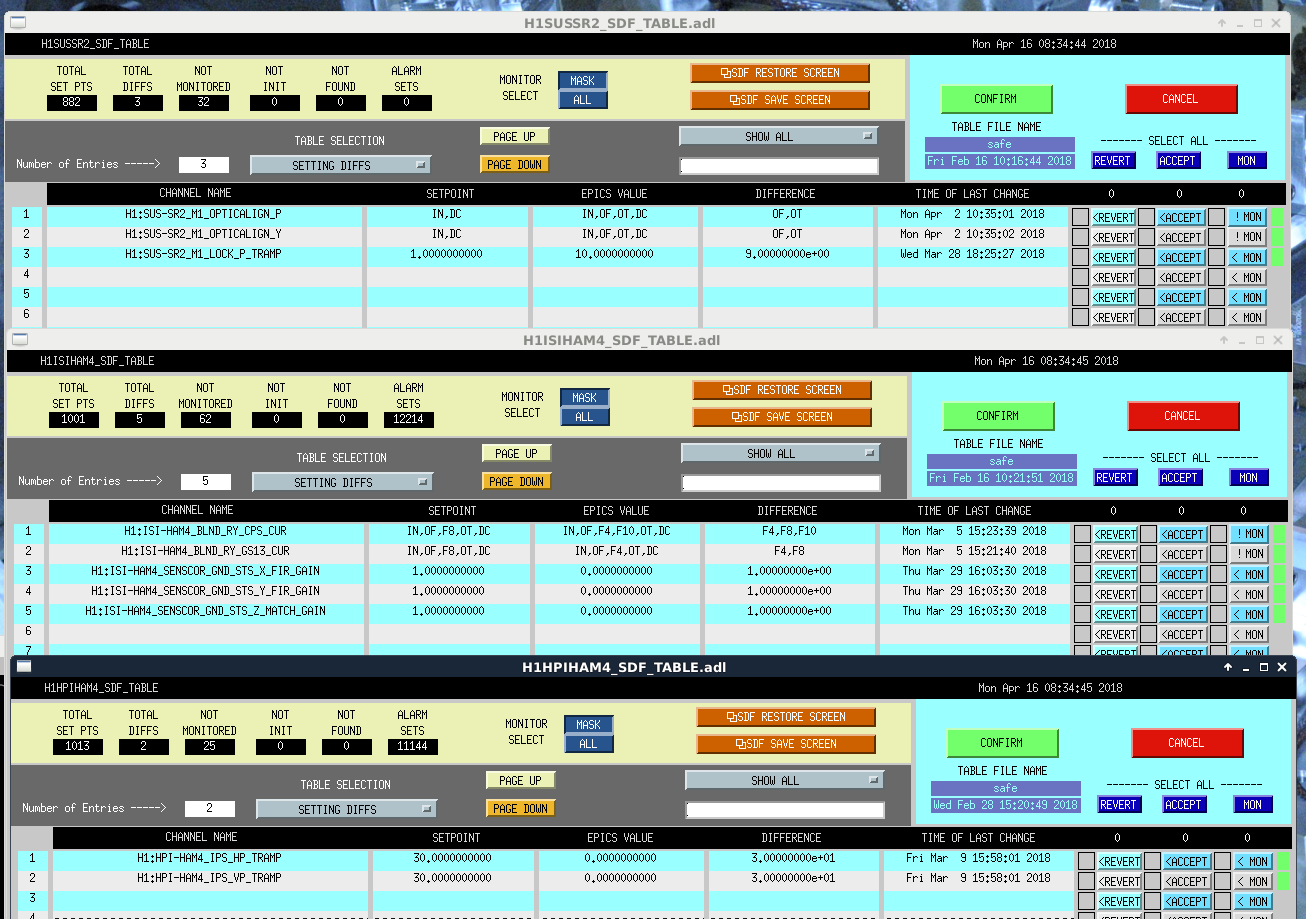
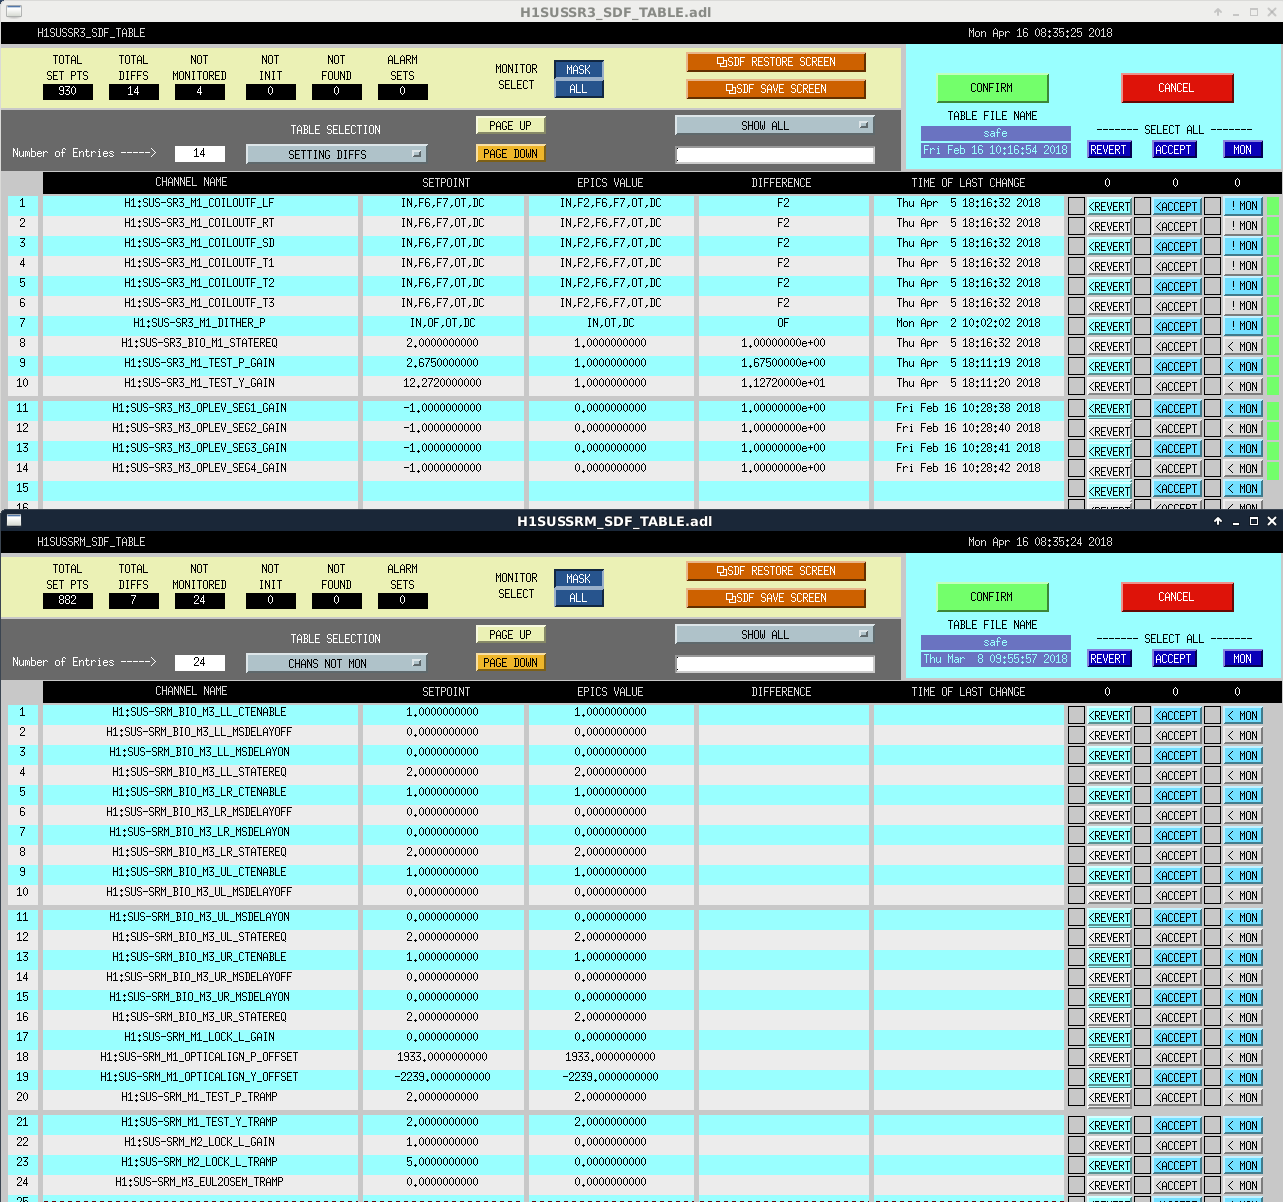
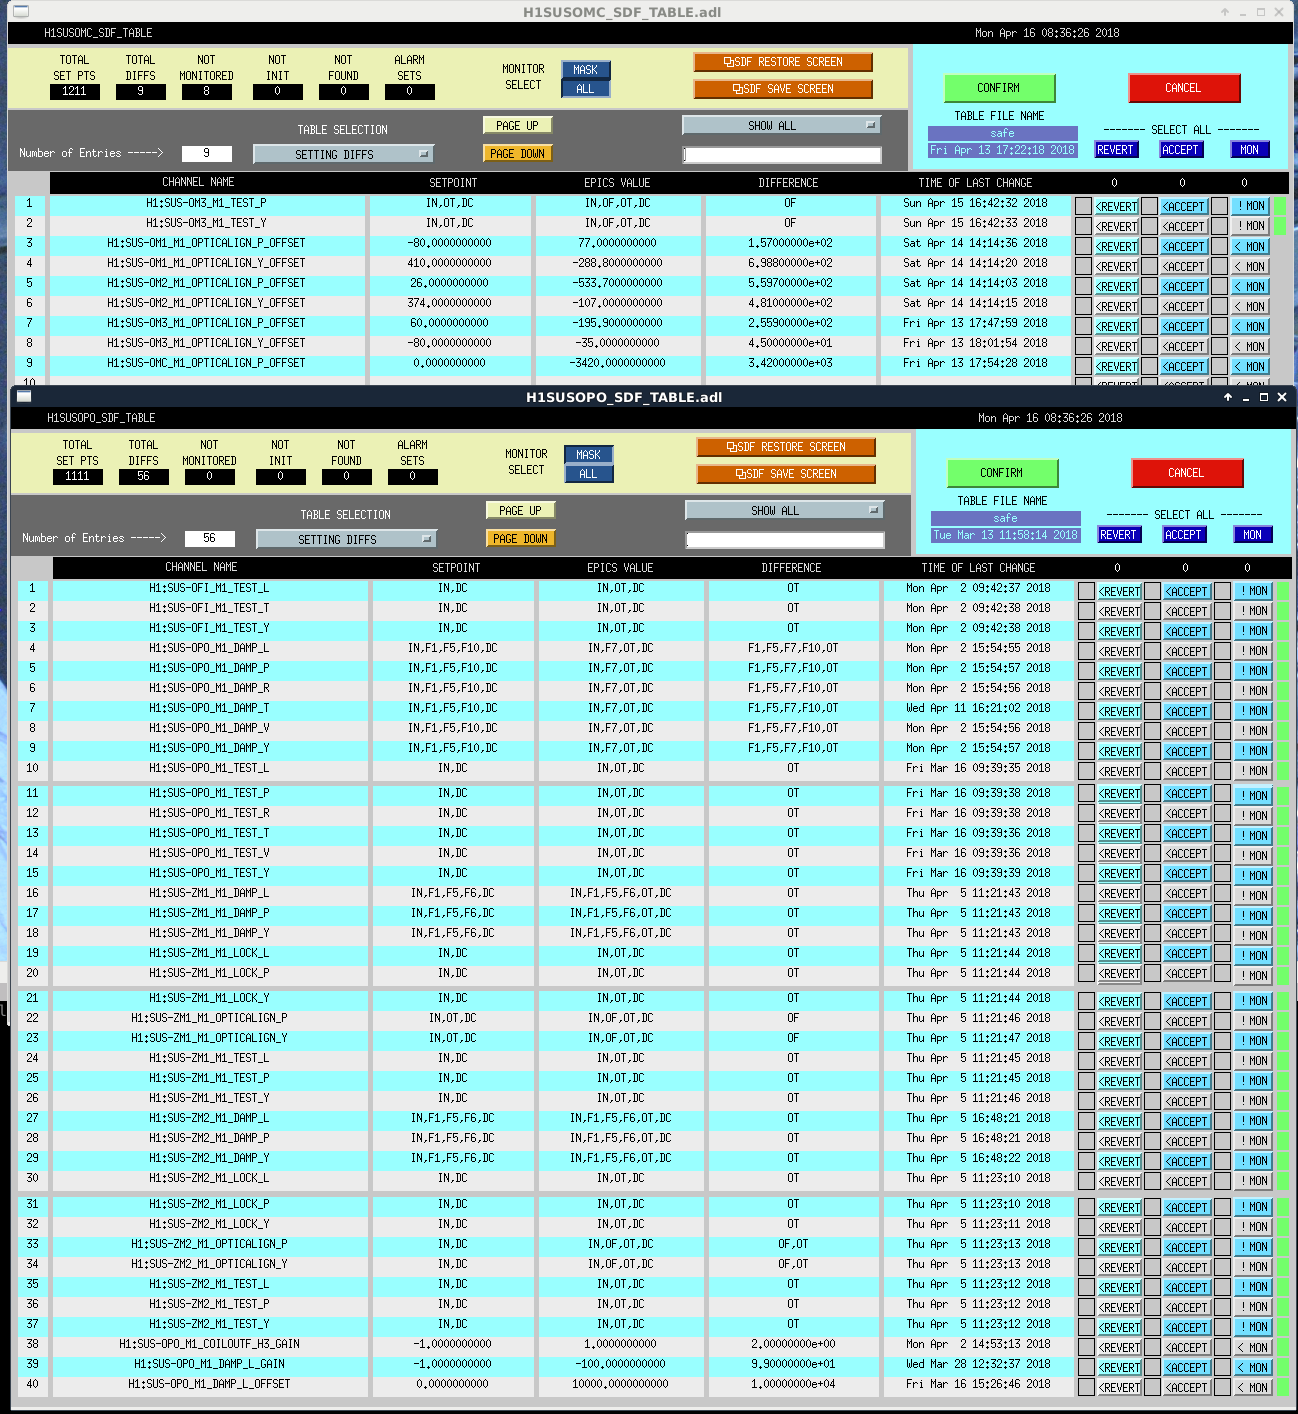
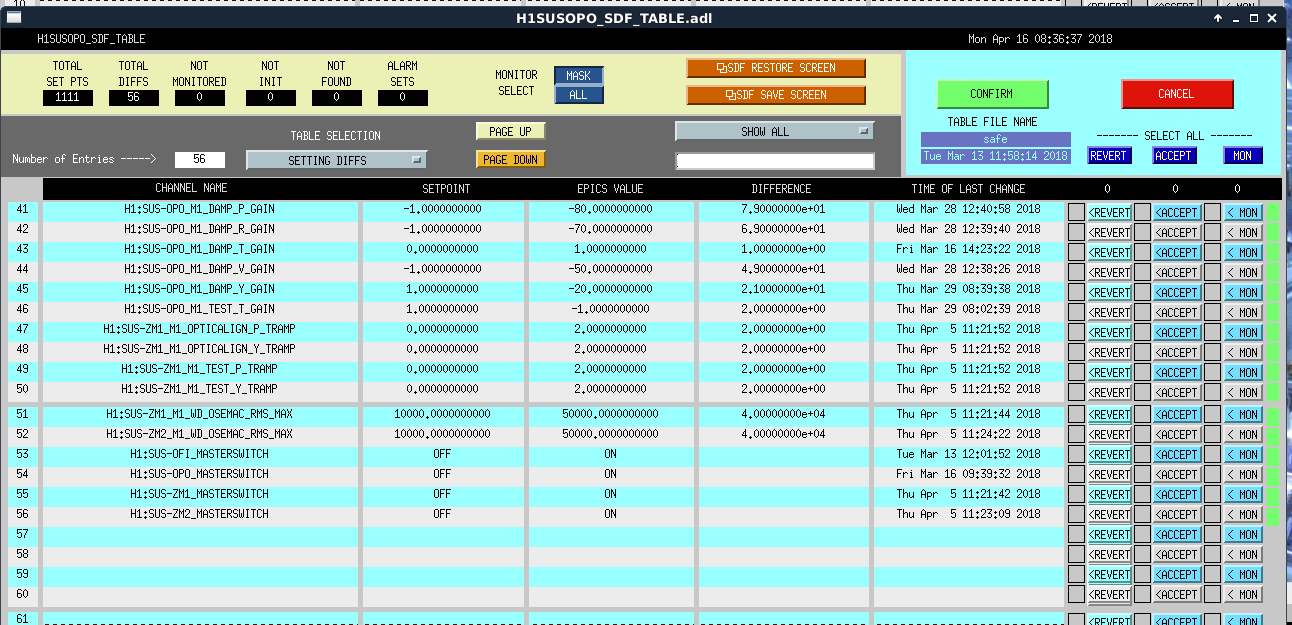
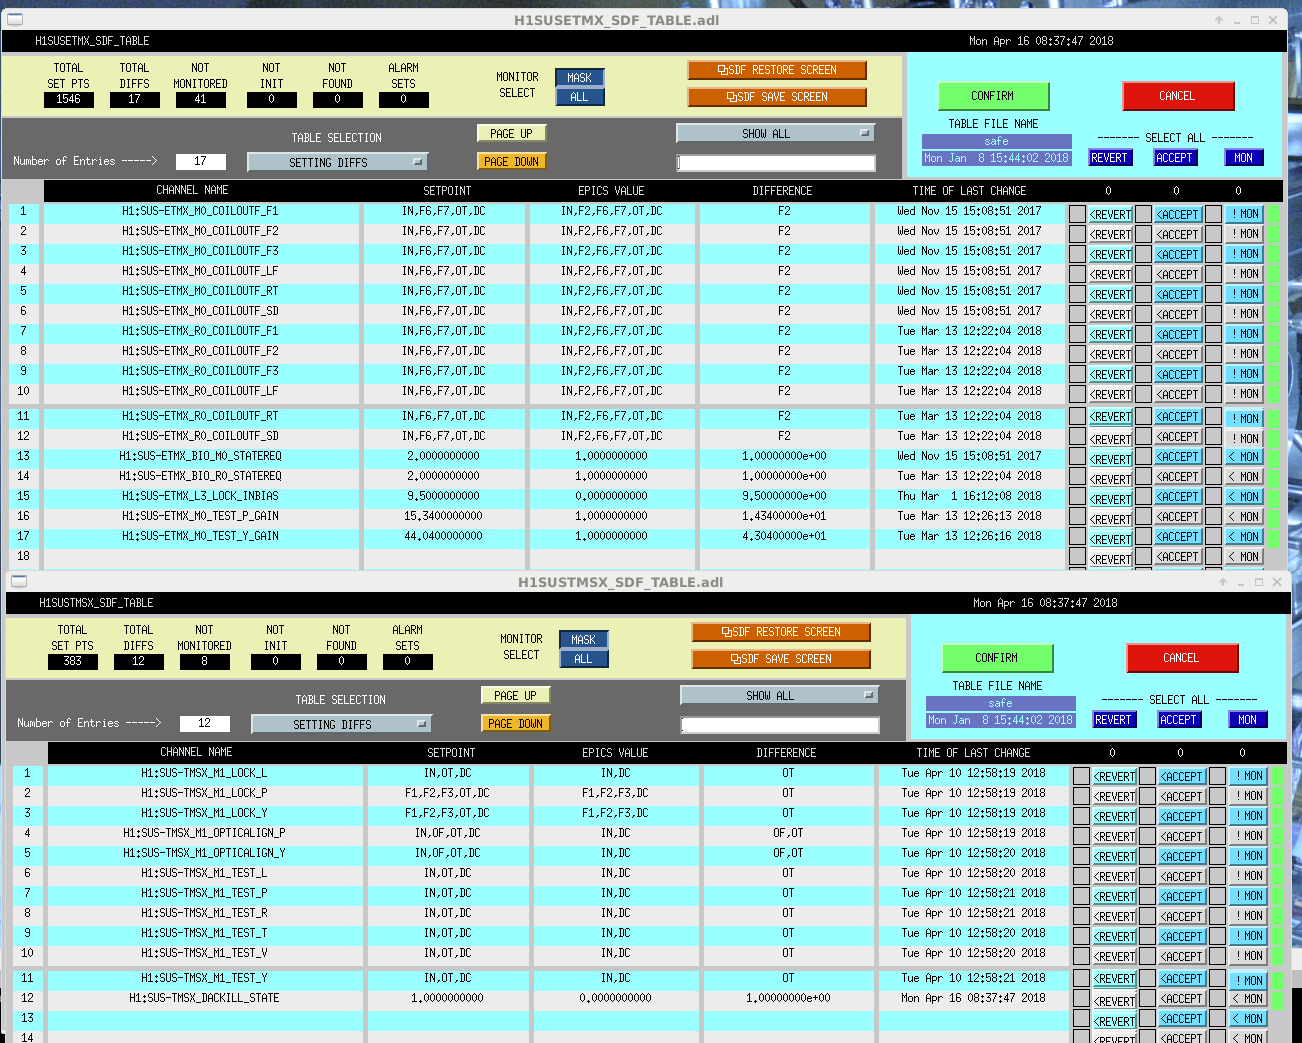
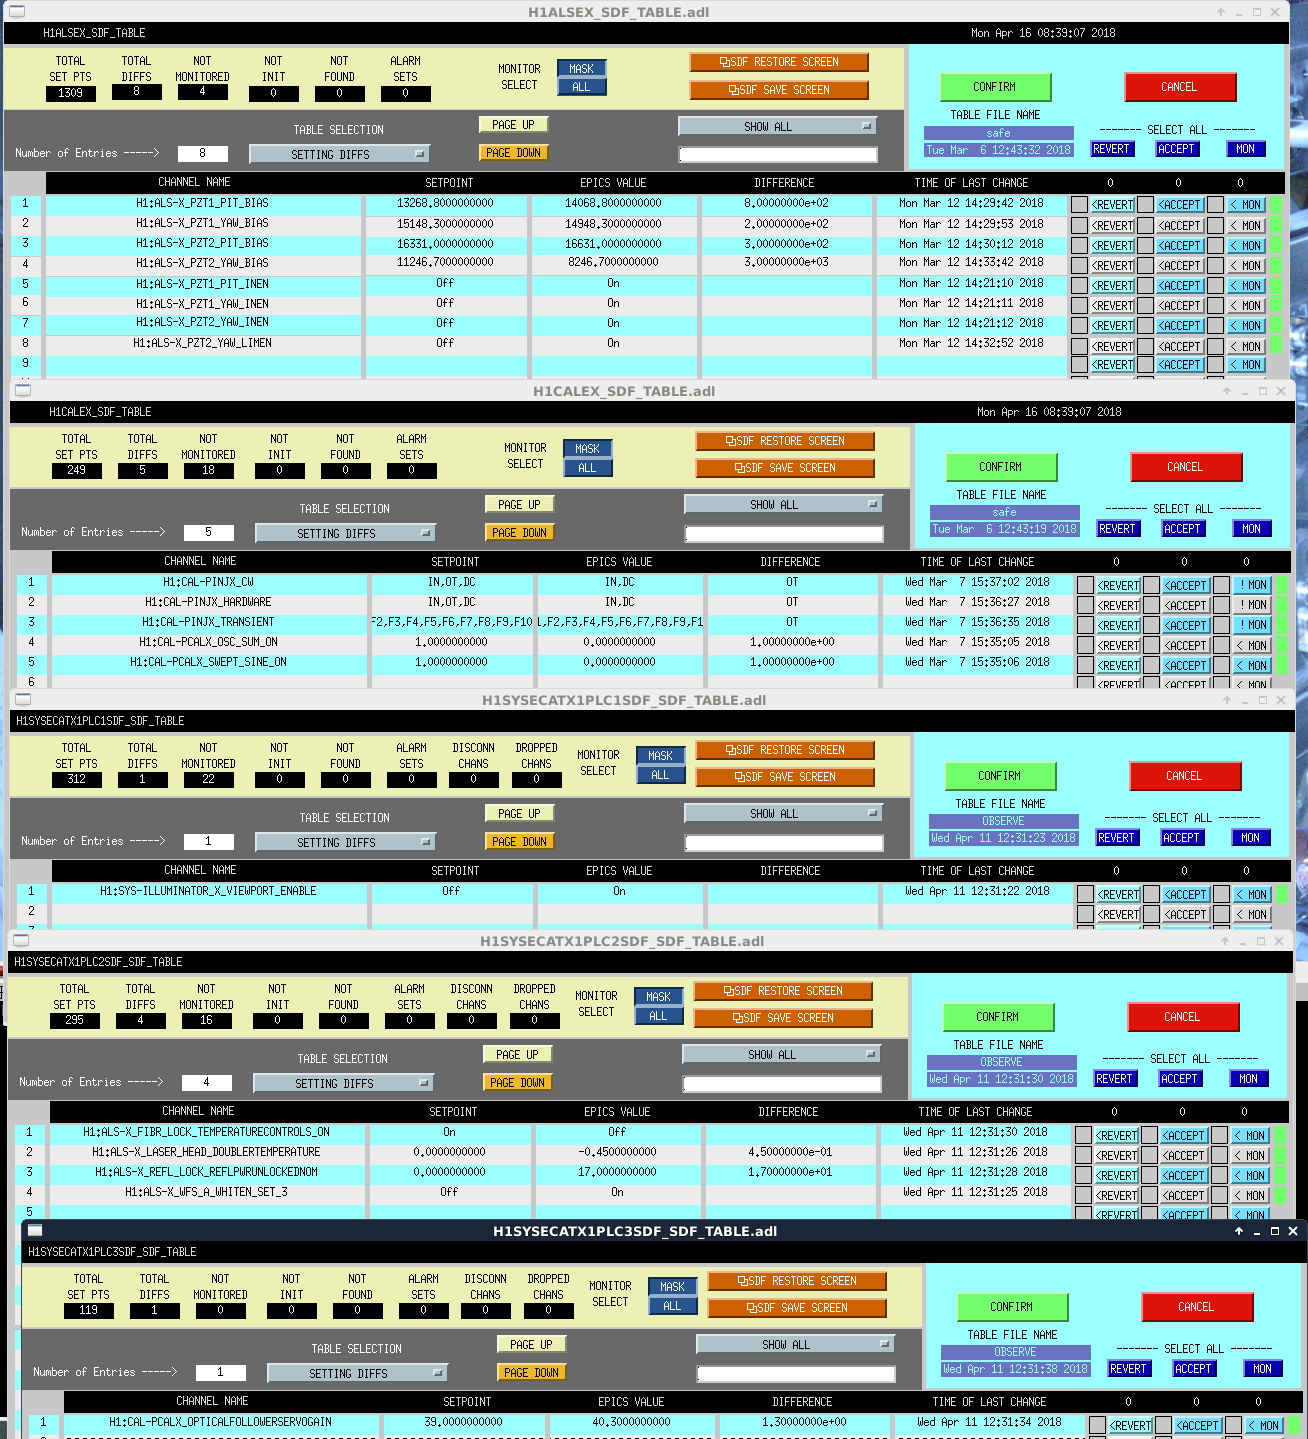
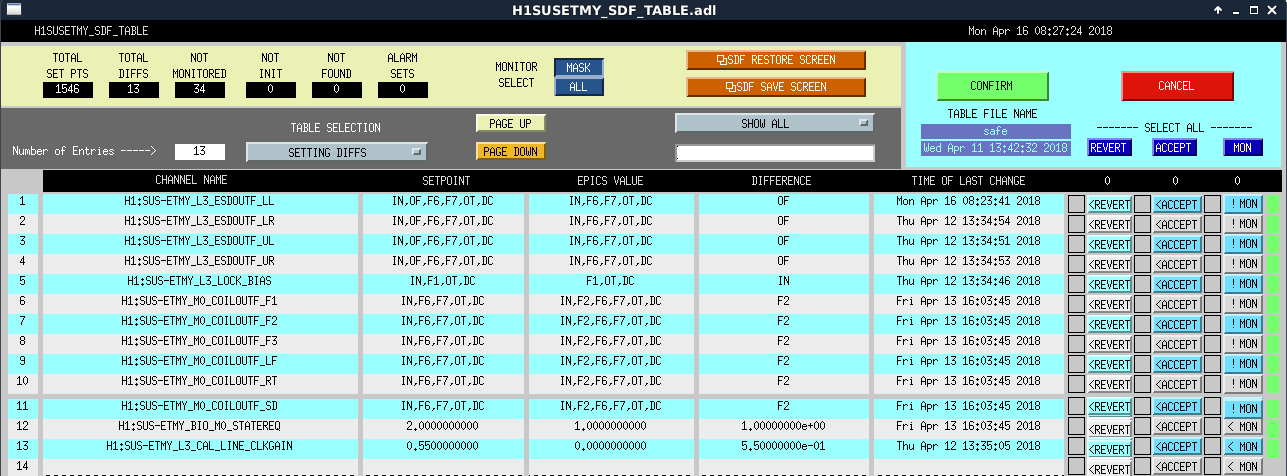
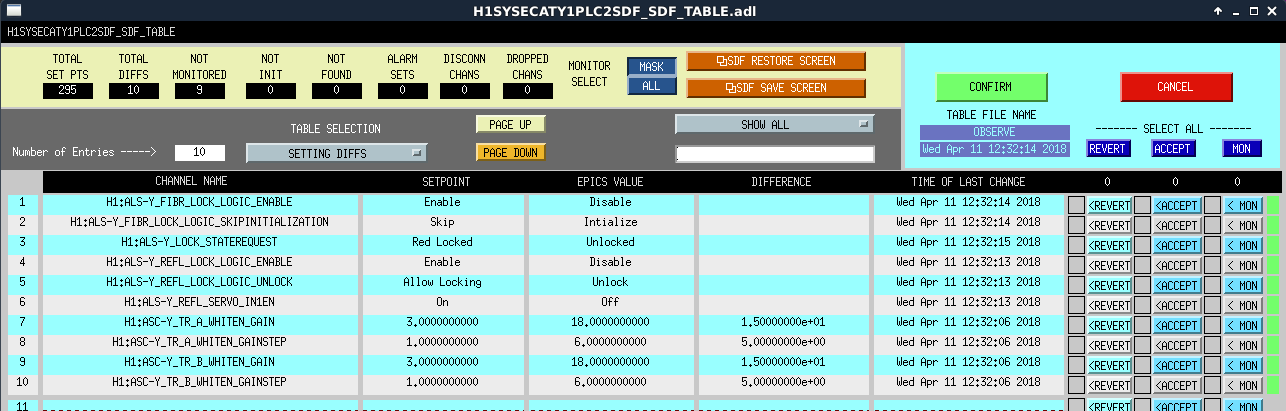
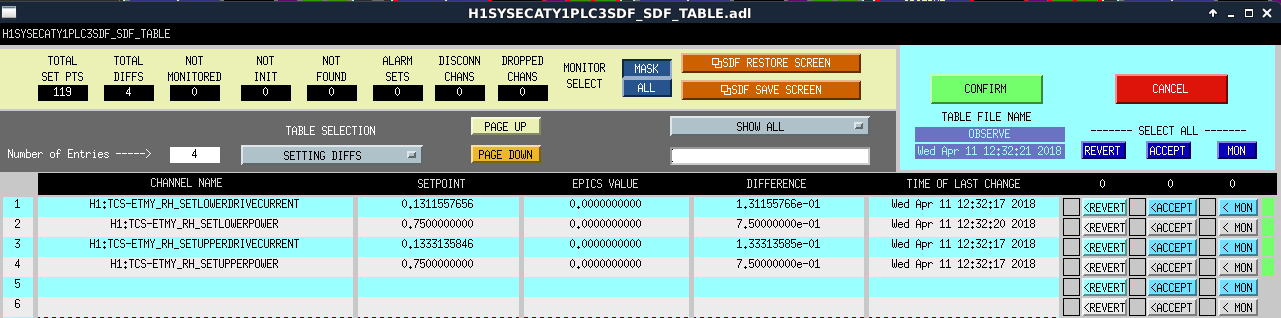
I took snapshots of every SDF screen that had diffs when I arrived Monday, in response to Dave's alog that said a number of our front end computers might freeze at any time. I've renamed the snapshots to have the format (screen/system name)_SDF, and if I included more than one screen/system in the snapshot then the name is in the format (screen/system name)_(screen/system name)_(screen/system name)_SDF. This morning, in preparation for reboots on Thursday, JeffK is accepting some values, for example TRAMP times that have changed, and TVo is looking at some SDF screens to accept changes that reflect commissioning modifications that should be kept. At this time, Tuesday at 9:20PT, we have 56 SDF screens that show diffs.


As Of 15:26UTC (8:26PT):
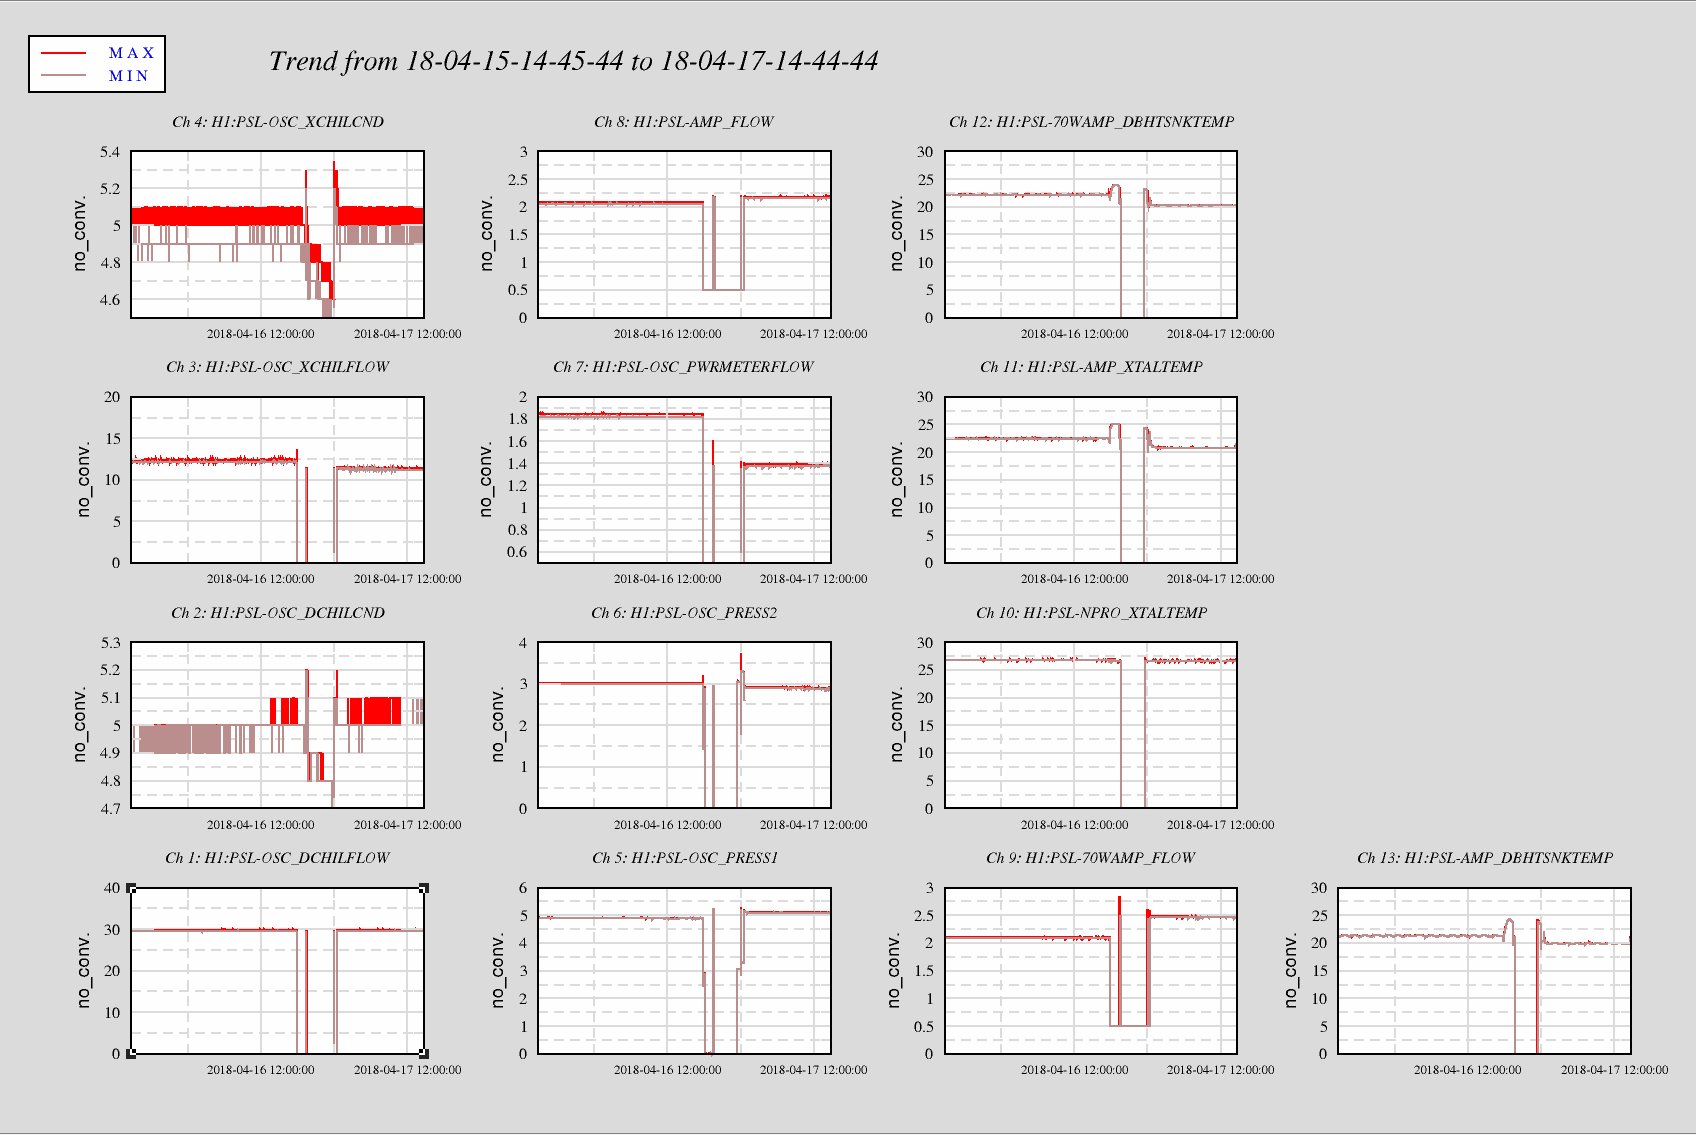
Posted below are the plots for the various PSL pressure, flow, and cooling signals post 70W and new shutter install. This should represent the final configuration of the reworked cooling system necessary to accommodate the new amp. Most changes reflected in the plots are as expected and should assist with final tuning and balancing the water flows. The goals of the tuning will be to (1) reduce pressures as much as possible while retaining enough flow to ensure proper cooling. (2) to shift pressure manipulations from within the PSL enclosure to the chiller room, and (3) to reduce water flow table noise to a minimum.
I lowered the temperature set point from 130C to 127C on the CP4 heater controller this evening.  The recent TE203 ROC alarms are the result.  The remotely displayed controller screen has been, seemingly, unchanging now for days? weeks? so I perturbed it to verify that the displayed temperatures would react/change.

I am monitoring periodically.
Kyle and I independently leak checked IP4 gate valve on the beam tube side and found a very delayed He signal (many seconds to minutes). I bagged the flange joint with party store balloon mylar and found minutes delay from a vertex background signal of 4.8e-9 Torr-L/s to a leak rate of 8.5e-9 Torr-L/s, using UL1000 leak checker. It's still unclear if this flange joint is leaking or if He is migrating to the actual leak. Need N2 to flush out the He. After the leak rate crept up to 8.5e-9 Torr-L/s very slowly, I finally removed the bag and then it crept down even slower while I blew on the flanges.
Note that the flanges were somewhat gappy after installation (top and bottom of valve) a few months back. Gerardo torqued them metal to metal and found that the pressure improved on the IP4 pump side (its GV is closed), from April 13th.
IP4 was leak checked after it was installed last year with a small leak noted from 8" CFF: https://alog.ligo-wa.caltech.edu/aLOG/index.php?callRep=40339
The background of the vertex volume is 4.8e-9 Torr-L/s of He, with UL1000 leak checker backing the main turbo and the vertex pressure at 1.9e-6 Torr (after recent vent). When leak checker+turbo are isolated from main volume, the background drops to 1.2e-9 Torr-L/s and when isolated from turbo drops to >>1e-9 Torr-L/s.
IP4 is 20-30 ft from main turbo+leak checker.
Bag the bonnet?
I can try that. I sprayed it and didn't see an immediate response.
EdM, JasonO, JeffK, PeterK, RickS
The water cooling for the output shutter for the 70-W amplifier was plumbed in this morning.
We were then unable to start the laser. The problem was traced to a blown fuse in the control box.
After lots of fault hunting, we finally got the system to the point that the laser would start at about 5:30.
Things seem to be in order now.
We plan to proceed with the PMC swap first thing tomorrow morning.
This afternoon, Cheryl helped me load the newly prepped PUM mass (PEN ITM03) from the air-bake oven and into it's cake tin for the trip to the end station.
It baked in the air bake oven at 34 degC for 12 hours starting last Fri midday.
The code that looks for guardian errors was preventing us from running VerbalAlarms. I've commented this code out of the tests file (around line 109). Will need to be reverted when guardian work is complete.
Activities:
Details:
J. Kissel, T. Shaffer

Replacing S/N 551 (bad) with S/N 553 (hopefully good).

New open light current value:
29106

OSEMINF OFFSET = -14553
OSEMINF GAIN = 1.0307
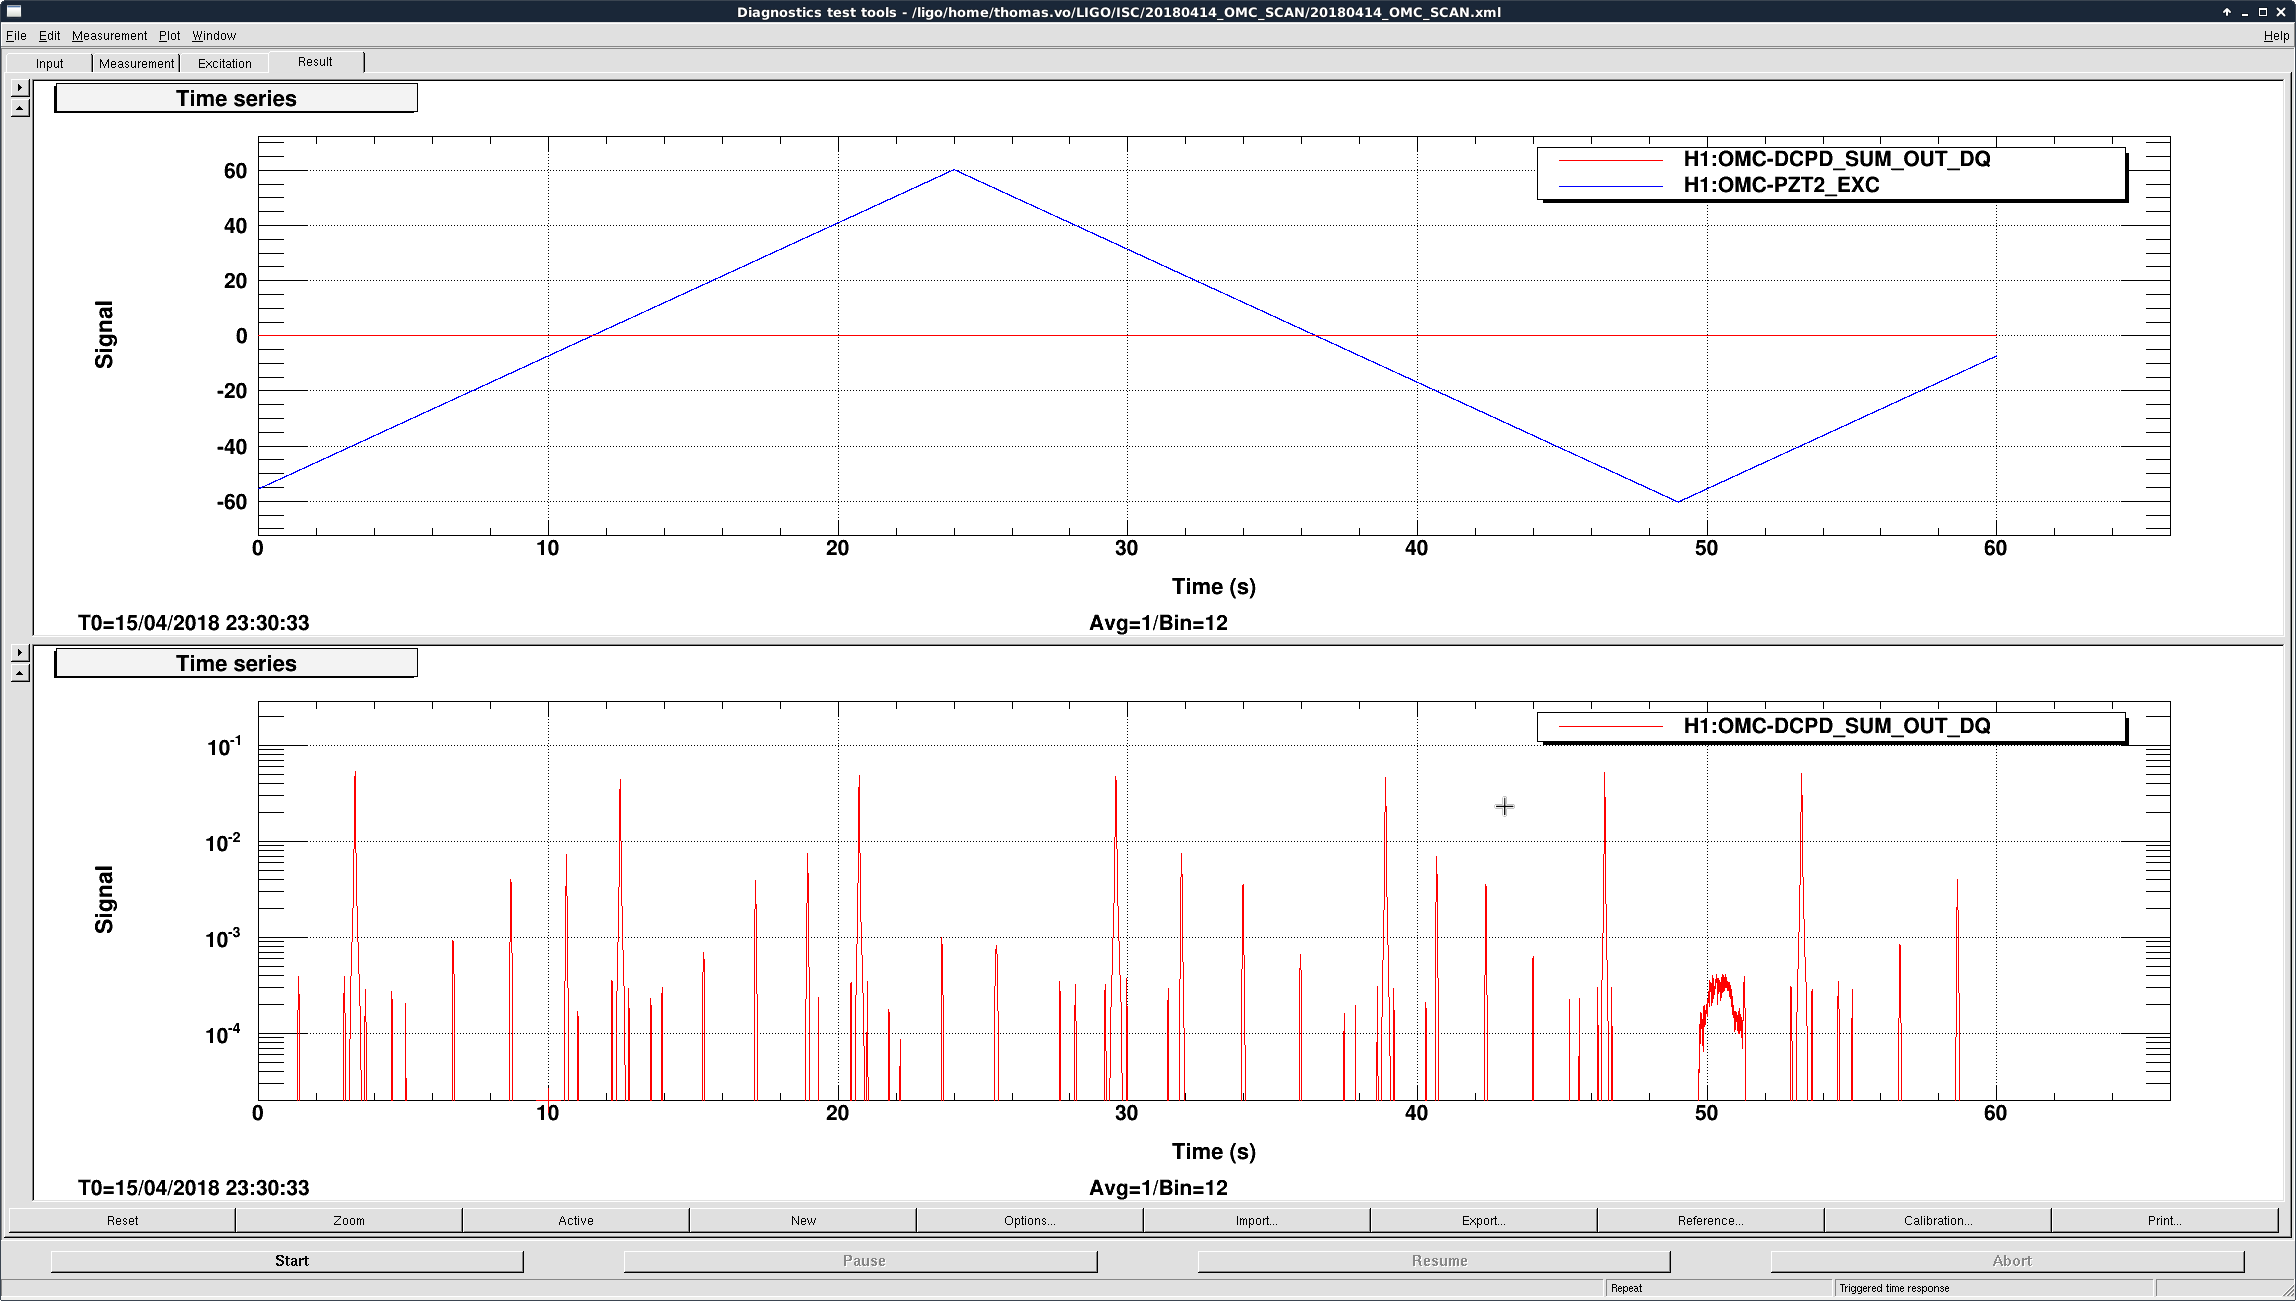
I was hoping to do an OMC scan today and it's tantalizingly close with the angular loops closed but it seems like the both OMC_DC are saturating even though I've turned off the all the gains and whitening(de-whitening). The attachment shows the scans going negative at 2 Watts into the IMC.
So I turned down the power into the IMC to about .1 watts and things got better but it was still very unclean scan data so I'm a little confused because Dan Hoak's OMC scan was able to handle about 4 miliamps on OMC_DCPD Sum.
I've misaligned SR2 so that the OMC isn't flashing and returned the DCPD whitening filters to their nominal observe state (1 whitening + 1 dewhitening). Also I've turned off the OMC ASC and the AS WFS DC loop so that if the IMC loses lock the optics don't go crazy.

I turned down the power to the IMC to .1 Watts and misaligned SRM to get rid of the SRM flashing and there's some decent, clean OMC resonances.
Attached are 3 OMC scans with SR3 at 0, 0.5, and 1.0 Watts. Before I take more data at higher SR3 heater power, I'll see if these results make sense. The columns are time in seconds, PZT offsets in Volts, and OMC_DCPD output in Amps.
Once we lock DRMI, we can try this again.
I've ran your scans through through my code. The plots are attached below.

The "mismatch" (i.e. ratio of the average of all second order peaks to the average of all zeroth order peaks) is 0.08 +/- 0.02, 0.09 +/- 0.02, 0.083 +/- 0.005 for 0W, 0.5W, and 1W respectively. The uncertainties came from the standard deviation of the height of the peaks. Most of the uncertainty came from fluctuations in the height of the zeroth order peak.

As it stands now I can't really draw any conclusion about the SR3 heater.
It could be that the pzt is scanning too quickly, or the beam/cavity could be fluctuating in time. I can't say for sure.

There's also this weird thing where the resonances on the upward pzt ramp appear in different locations to the ones on the downward ramp, even though they should correspond to the same length changes in the cavity. Could be some hysteresis in the pzt response. For the analysis I only used downward ramp on the pzt. Driving the pzt with a sawtooth waveform should get rid of hysteresis (since it would only ramp one way), but there might be some artifacts from the sudden voltage change.


started it again