filiberto.clara@LIGO.ORG - posted 14:53, Tuesday 10 April 2018 - last comment - 09:41, Wednesday 11 April 2018(41363)
ITMX CPS Satellite Box
WP 7465

Daniel, Dave, Filiberto, Patrick, Richard

I stopped the EPICS IOC that was running on h0epics and moved the DB9 serial cable from the Comtrol to Port 1 of the serial concentrator. This port connects to channel 1 of the Corner MSR L12_13 EL6002. I added the code for the readout of the weather station to PLC1 on h1ecatc1. No channel names were changed. Channels have been added to report errors. These should be added to the medm screens. The code will automatically reconnect if communication is interrupted, for example if the weather station is powercycled. The alarm levels for the wind speed have been put in the database, so a burtrestore is no longer required to set these either.

I also took the opportunity to update the TCS chiller code. It seems to be working without issue.
Kyle R., Chris S.

Today Chris S. and I took an FTIR sample from the closed gate of the 12.8" GV that isolates IP11 (VAT s/n 0002, see also https://alog.ligo-wa.caltech.edu/aLOG/index.php?callRep=41353).  Additionally, we opened a new 12.8" GV (in clean room, VAT s/n 0005) and took a comparable swab from the same side of its closed gate.  In both cases, the swiped area was ~20% of the exposed gate surface area.
Around 1am Thursday 5th April PDT h1iopsusey stopped driving the DACs due to a glitch. I restarted all the models on h1susey to clear this.
Does not go to Sampling when "On" is clicked.
Spun up vertex turbo right before lunch at ~0.6 Torr. Still need to close purge/vent isolation valves (OMC and IMC) and IP3 GV and little right angle valve.
Kyle closed the IMC & OMC purge valves and I closed the right angle metal valve on top of IP3 GV. Leak checker is connected to vertex turbo cart, valved out, and warming up for leak checking tomorrow or whenever He bottle is freed up from EY.
The DMT production computers in the MSR, h1dmt0, h1dmt1, and h1dmt2, have been patched and rebooted. WP 7466 is done.
At ~2256utc on 3 April (or precisely 1206831398gps), all the CPS sensor readouts on both stages jumped to a different value. Eight of the twelve spiked to a 33kish number before going somewhere else. A few on Stage2 are not crazy numbers but still shifted. Most on Stage1 are extreme ~positive 8k. See attached
Another item to be investigated is the Coil Driver Thermal trip hit at 1557utc on the fifth...
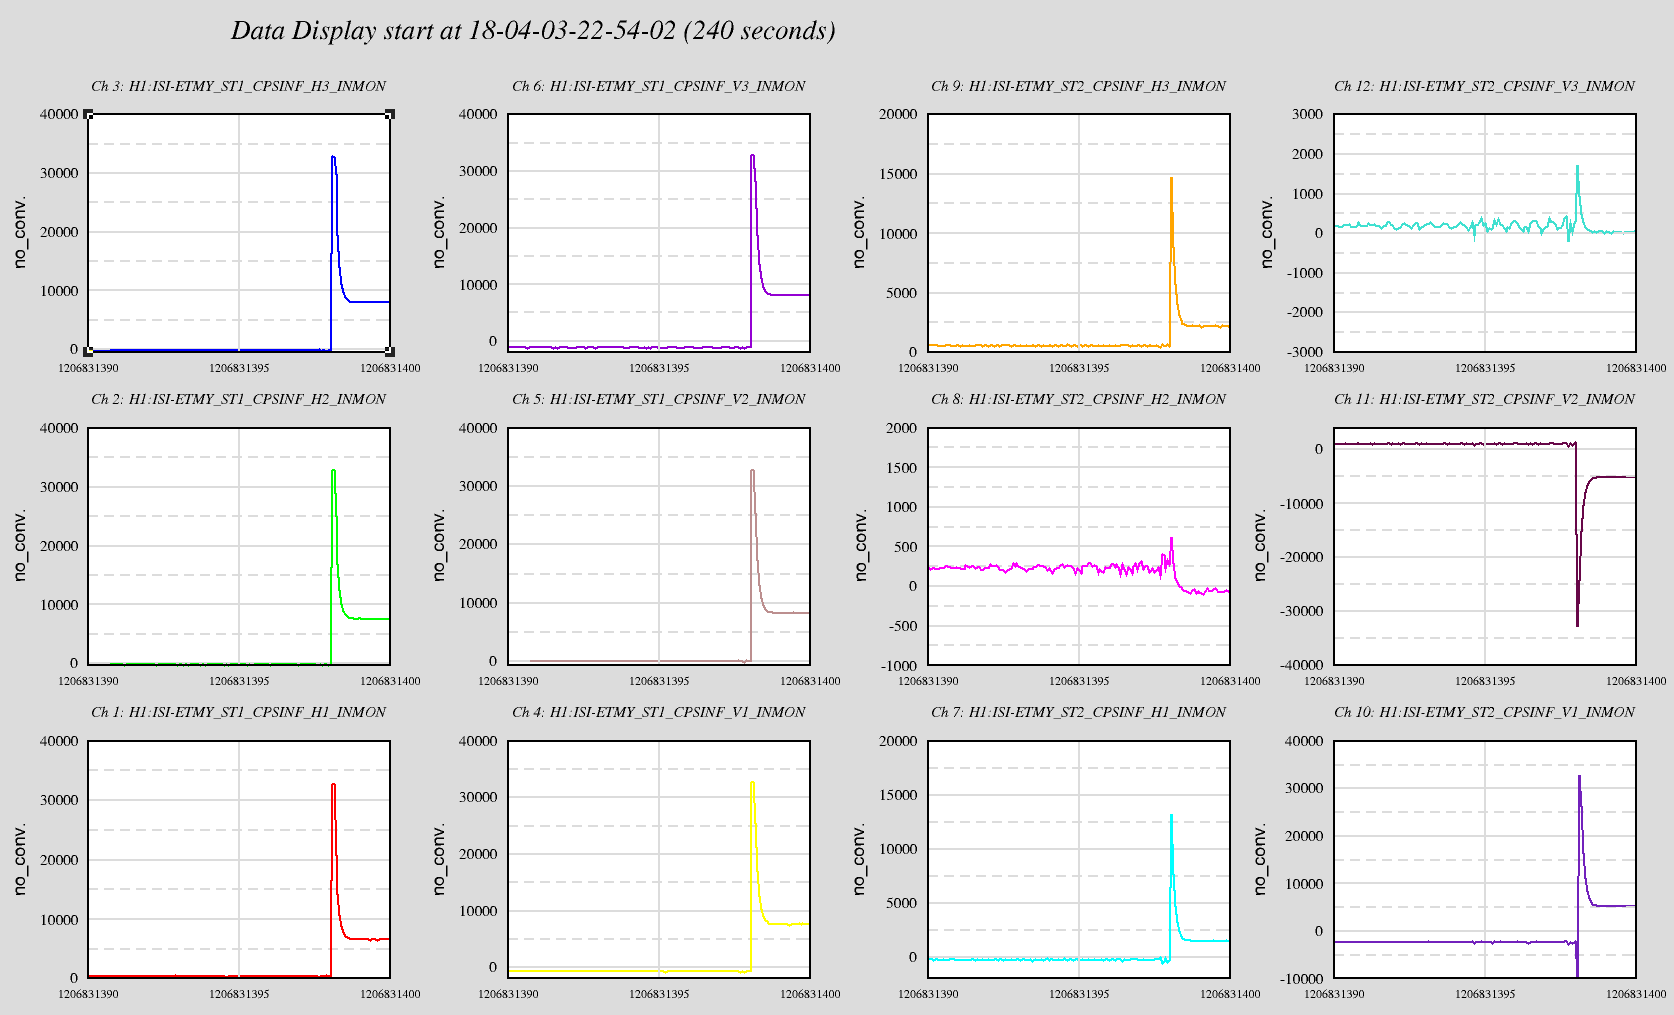
Wasted a bit of time by power cycling the CPS power and the sensors interface chassis. Found the CPS Timing Sync fanout chassis power supply unplugged. Guess it got swept up in the VE group's house cleaning that was found to be necessary. While the senors don't read exactly what they did before, they are at least much more reasonable. And, the platform will isolate.
I confirmed with Patrick yesterday that the RS232 flow rate for both chillers shows that the chillers are on, and the flow rates are around 3gpm.
The flow rates on the medm are negative, both around -2.5gmp.
Greg's most recent alog 41314 from April 5th says the chiller is running in a small closed loop, and it appears that this is for both TCSX and TCSY chillers.
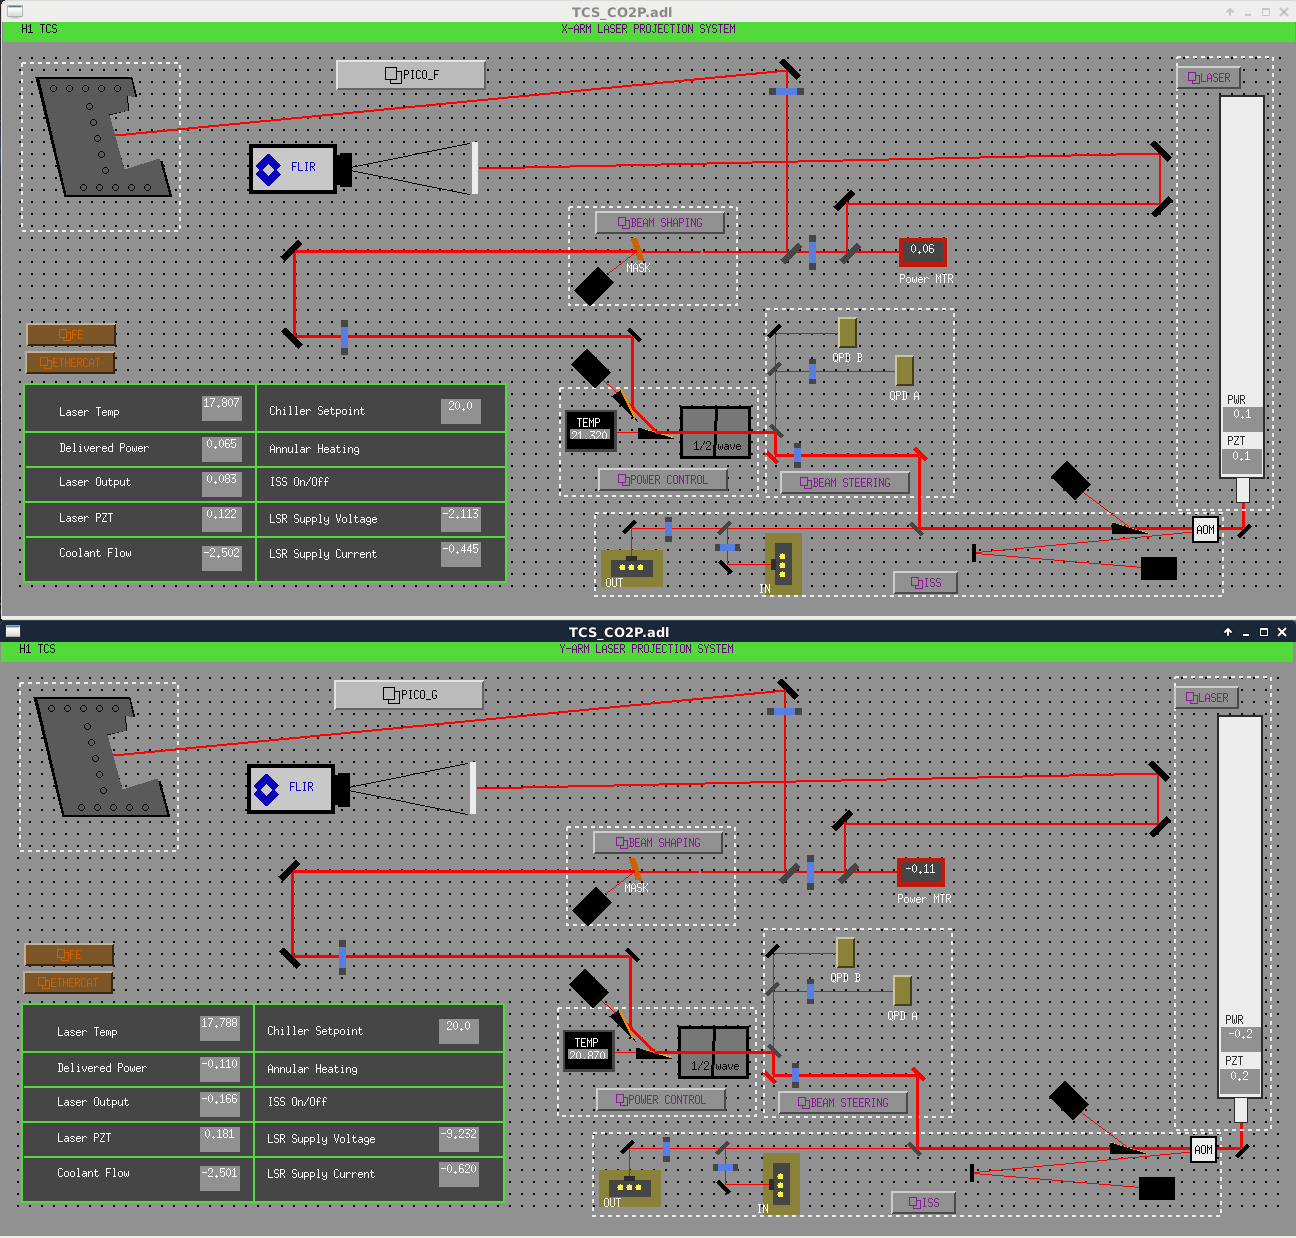
Patrick went to look, and all 3 TCS chillers are running and all read around 3gpm flow.
Kyle, Gerardo, Chandra

Today we pumped IP11 using a local turbo backed by an aux. cart.  IP11 is isolated from the Y-end via its closed GV.  As I squirted IPA around each CFF joint and vacuum welds of the Chevron Baffle nipple, Gerardo M. monitored the pressure gauge on the aux. cart to see if there was a response.  Chandra R. had already established this to be a very large leak (0.1 torr*L/sec).  We tried "listening" for the audio leak using a device intended for that purpose -> Something seems to be originating from the Chevron Baffle but difficult to eliminate background noise in the room -> We shut down the Clean Room (1417 hrs. local) and that helped a little.  Next, we modified the as-found bag such that each CFF joint was exposed but keeping the nipple's tube vacuum welds within the bagged volume.  We then purged the bag with bottled N2 while spraying helium around each CFF joint -> no significant response.  Finally, we reversed the bagging, now purging the CFF joint(s) while spraying helium around the welds of the nipple tube -> found very large leak coming from the bottom tube-to-flange vacuum weld (nipple s/n 01).

Having found one leaking Chevron Baffle, Chandra R. examined a different one stored in the VPW.  She found suspicious looking welds.

Also, we prepared IP11+chevron baffle nipple for tomorrow's removal by venting it with bottled UHP N2 and removing all but (3) ea. of the nipple-to-GV nuts and studs.  Note that with the local turbo spun down and disconnected from the aux. cart, I applied the N2 to the Tee at the inlet of the turbo letting it flow trough the turbo and into the room via the open-ended turbo exhaust line.  This setup would prevent the possibility of over-pressurizing IP11 as it remained open to the room.  I then opened the 1 1/2" vent/pump valve to vent IP11.  Gerardo M. noticed that room air was then entering through the exhaust.  Thus, for a short period, I had been back streaming through the local turbo and into IP11.  I then closed the 1 1/2" valve and removed the turbo. This is a "dirty" pump in that it is not a maglev.  I'll consult Chandra R. as to what, if any action is needed (FTIR?).
Isolated QDP80 at vertex with pressure at 1.3 Torr. Will resume tomorrow morning.
Chandra has requested that the high alarm level for H0:VAC-MY_CP3_TE202A_DISCHARGE_TEMP_DEGC be raised from 130.0 degC to 140.0 degC (this signal is currently operating at 131.1 degC). This was done and the alarm system was restarted.
day started with JeffB's alog: 41345
All Tmes UTC:
LIGO-E1800008: ECR: Timing Comparator replace 5V regulator with seperate DC Power board
LIGO-E1200034: Timing RF Counter/Comparator Software Release
LIGO-E1700246: ECR: Add frequency counter channels to timing comparator
One down, three to go!
Reinstalled proper Timing Comparator S1107952 into CER and returned spare to the rack. *Spare still requires upgrade
Pulled, Upgraded and Reinstalled MSR Timing Comparator S1201224.
No front ends were harmed in this operation.
Three Timing Comparators done, one remains unmodified at X end.
Today, Travis and I finished assembling the ETMX lower reaction chain. We assembled the PenRe mass in the structure, attaching the balance of parts to make the weight from last week including AOSEMs, cables, and cable routing brackets. We then installed the new annular AERM07 mass below the PenRe in the lower structure and adjusted it in it's 6 DOF's by eye before suspending it. We then reclamped everything and rolled the main lower chain up to it. A quick lift via the Genie duct jack and we set the main lower structure and newly fiber'ed masses into the trolley with the reaction set. We added the UIM and PUM magnets/flags (set with polarities per the QUAD controls poster), and then shoved the 2 structures together and fastened them.
We wrapped the now complete lower unit and rolled it to the chamber side. After attaching some of the LSAT lifting blocks, we staged the Genie duct jack so that we are ready to install it on the arm and into the chamber tomorrow.
Note - Travis noticed a door bolt sitting in the BSC9 flange in the unused hole at 3 o'clock. The washer from the bolt (which held nothinglooked to be rubbing funny on the o-ring so he removed it. The vacuum crew will need to inspect this after we remove the install arm. (Note, the install arm and stiffening flanges cover most of the right side of holes and o-ring on this chamber, except for a ~6" gap at 3 o'clock. There are o-ring covers everywhere else. This bolt should not have been in this hole, since it served no purpose.)
From Chandra and Kyle who inspected this o-ring portion yesterday late afternoon:
Kyle and I inspected the o-ring and deemed it ok to reuse. Kyle peeled away a
sliver of viton material that was hanging off of the o-ring. To the naked eye
the surface looks ok. We will take note of this when we install the door and
pump down the annulus volume.
And the platform isolated with no issues.